Embed Size (px)
Citation preview
British Heart Journal, I971, 33, 266-274.
3 and 12 lead electrocardiogram interpretationby computerA comparison on I093 patients
Peter W. Macfarlane, A. R. Lorimer, and T. D. V. LawrieFrom the University Department of Medical Cardiology,Royal Infirmary, Glasgow C.4
A comparative study of computer interpretations of 3 and I2 lead electrocardiograms from I093patients is reported. The conclusion reached is that 3 lead electrocardiography is clinically asacceptable as 12 lead electrocardiography with respect to computer assisted interpretation.
The use of automated methods for electro-cardiogram interpretation is not new. Pro-cedures have been developed for the analysisof I2 lead electrocardiograms (Caceres et al.,I962; Bonner and Schwetman, I968) and forthe interpretation of 3 lead electrocardio-grams (Stallmann and Pipberger, I96I;Pipberger and Stallmann, I964; Smith andHyde, I969). More recently a technique hasbeen developed (Macfarlane, I97I) for usewith either lead system, when leads arerecorded in groups of 3 simultaneously.There have, however, been few comprehen-sive comparisons of 3 and I2 lead electro-cardiogram interpretations by computer orfew studies of computer interpreted orthogo-nal lead electrocardiograms with lead systemsother than that of Frank (1956). A modifica-tion to the axial lead system of McFee andParungao (I96I) has been described (Mac-farlane, I969) which effectively equalized thelead strengths previously shown to be unequal(Brody and Arzbaecher, I964). This modifica-tion was designed to make the axial leadsystem approximate to the ideal orthogonallead system, with mutually perpendicularlead vectors of equal magnitude. While thismodified axial lead system was theoreticallyacceptable it remained to be shown whetheror not it was clinically as useful as the con-ventional I2 lead system with the assistanceof computer interpretation.
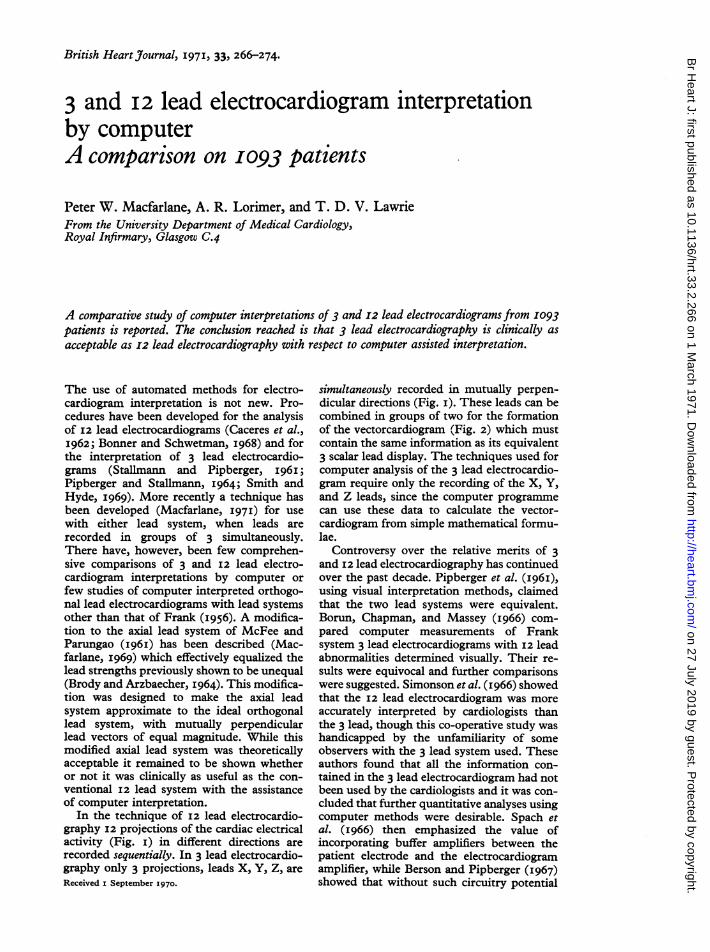
In the technique of I2 lead electrocardio-graphy I2 projections of the cardiac electricalactivity (Fig. i) in different directions arerecorded sequentially. In 3 lead electrocardio-graphy only 3 projections, leads X, Y, Z, areReceived i September I970.
simultaneously recorded in mutually perpen-dicular directions (Fig. i). These leads can becombined in groups of two for the formationof the vectorcardiogram (Fig. 2) which mustcontain the same information as its equivalent3 scalar lead display. The techniques used forcomputer analysis of the 3 lead electrocardio-gram require only the recording of the X, Y,and Z leads, since the computer programmecan use these data to calculate the vector-cardiogram from simple mathematical formu-lae.
Controversy over the relative merits of 3and 12 lead electrocardiography has continuedover the past decade. Pipberger et al. (i96i),using visual interpretation methods, claimedthat the two lead systems were equivalent.Borun, Chapman, and Massey (I966) com-pared computer measurements of Franksystem 3 lead electrocardiograms with I2 leadabnormalities determined visually. Their re-sults were equivocal and further comparisonswere suggested. Simonson et al. (I966) showedthat the 12 lead electrocardiogram was moreaccurately interpreted by cardiologists thanthe 3 lead, though this co-operative study washandicapped by the unfamiliarity of someobservers with the 3 lead system used. Theseauthors found that all the information con-tained in the 3 lead electrocardiogram had notbeen used by the cardiologists and it was con-cluded that further quantitative analyses usingcomputer methods were desirable. Spach etal. (I966) then emphasized the value ofincorporating buffer amplifiers between thepatient electrode and the electrocardiogramamplifier, while Berson and Pipberger (I967)showed that without such circuitry potential
on 27 July 2019 by guest. Protected by copyright.
http://heart.bmj.com
/B
r Heart J: first published as 10.1136/hrt.33.2.266 on 1 M
arch 1971. Dow
nloaded from
3 and I2 lead ECG interpretation by computer 267
yFIG. I An illustration of electrocardiogramlead directions. The leads I, II, III, aVR,aVL, aVF, X, Y are in the frontal plane andleads Vi-V6 are in the transverse plane.
measurements could vary by as much as 50per cent in the 3 lead electrocardiogramduring i5 minutes after the application ofelectrodes. These findings suggested thatfurther comparisons of both lead systems becarried out with more suitably designedequipment than previously used.The study reported in this paper was
undertaken to determine which of the twolead systems would be more suitable for
routine electrocardiogram interpretation bycomputer.
MethodsThere were I093 subjects in this study. Each wasassessed on the basis of physical examination, I2lead electrocardiogram, and x-ray of chest.Patients with rheumatic valvular disease hadhaemodynamic and angiographic studies carriedout at cardiac catheterization. Patients with myo-cardial infarction had serum enzyme changesmeasured routinely. The clinical classification ofthe I093 patients is shown in Table I.Each patient had a 12 lead electrocardiogram
and a modified axial system 3 lead electrocardio-gram tape recorded either in the ward or in thelaboratory. Hewlett Packard 2700 I2 lead electro-cardiogram amplifiers and a 1520A VectorProgrammer, which incorporated buffer ampli-fiers, were used. Initially each I2 lead electro-cardiogram recorded in groups of 3 leads simul-taneously, and each 3 lead cardiogram was re-played to a PDP8 computer for analogue to digitalconversion. Data were subsequently analysed ona KDF9 computer by methods to be outlinedelsewhere (Macfarlane, 197I). The result of theanalysis was a set of all P, Q, R, S, and T waveamplitude and duration measurements, selectedvector magnitudes, and orientations such as Ooi,002 sec., etc., after QRS onset and time norma-lized data, that is measurements made at i/8, 2/8,etc., of the QRS complex and the ST-T segment.Each I2 lead electrocardiogram was interpretedby a further computer programme which in-corporated data from established studies such asthose of Simonson (I96I), New York HeartAssociation (I964), Sokolow and Lyon (I949a, b),
FIG. 2 The leads X, Y, Z of a 3 lead electrocardiogram which are also combined in pairs toform the frontal (X, Y), right sagittal (Y, Z), and transverse (X, Z) loops of the vector-cardiogram. The timing dashes are marked at intervals of 2 5 msec. F=frontal. RS= rightsagittal. T= transverse.
I
on 27 July 2019 by guest. Protected by copyright.
http://heart.bmj.com
/B
r Heart J: first published as 10.1136/hrt.33.2.266 on 1 M
arch 1971. Dow
nloaded from
2z68 Macfarlane, Lorimer, and Lawrie
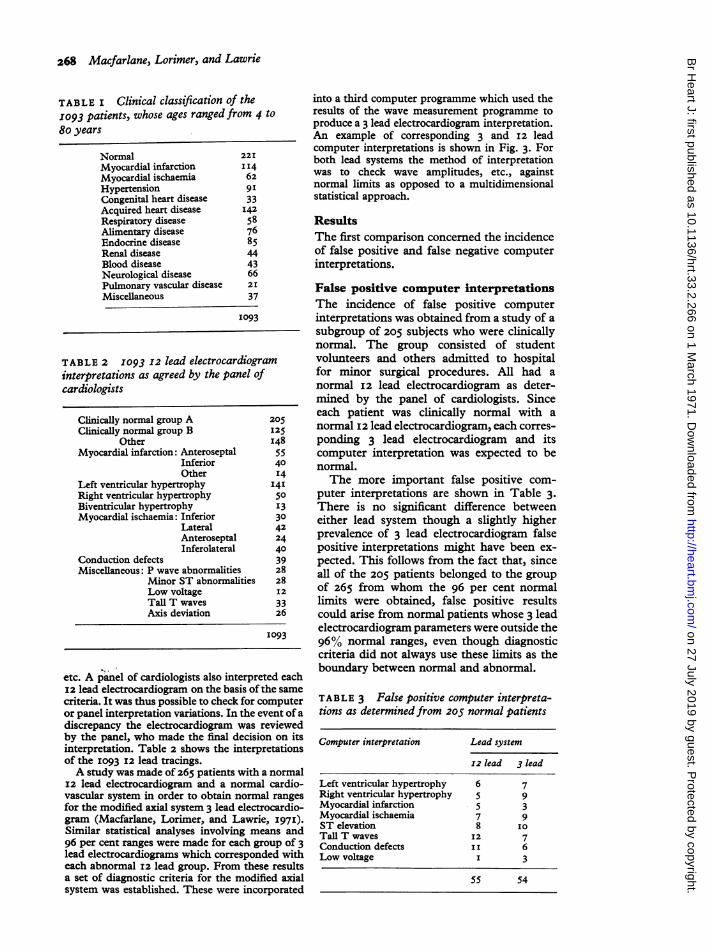
TABLE I Clinical classification of theI093 patients, whose ages ranged from 4 to8o years
Normal 221Myocardial infarction 14Myocardial ischaemia 62Hypertension 9ICongenital heart disease 33Acquired heart disease I42Respiratory disease 58Alimentary disease 76Endocrine disease 85Renal disease 44Blood disease 43Neurological disease 66Pulmonary vascular disease 21Miscellaneous 37
I093
TABLE 2 1093 I2 lead electrocardiogrointerpretations as agreed by the panel oJcardiologists
Clinically normal group AClinically normal group B
OtherMyocardial infarction: Anteroseptal
InferiorOther
Left ventricular hypertrophyRight ventricular hypertrophyBiventricular hypertrophyMyocardial ischaemia: Inferior
LateralAnteroseptalInferolateral
Conduction defectsMiscellaneous: P wave abnormalities
Minor ST abnormalitiesLow voltageTall T wavesAxis deviation
etc. A panel of cardiologists also interpre12 lead electrocardiogram on the basis ofcriteria. It was thus possible to check for cor panel interpretation variations. In the e
discrepancy the electrocardiogram was zby the panel, who made the final decisicinterpretation. Table 2 shows the interpof the I093 I2 lead tracings.A study was made of 265 patients with;
12 lead electrocardiogram and a norma]
vascular system in order to obtain norm;for the modified axial system 3 lead electrgram (Macfarlane, Lorimer, and LawriiSimilar statistical analyses involving me96 per cent ranges were made for each grlead electrocardiograms which correspon
each abnormal I2 lead group. From thesa set of diagnostic criteria for the modifsystem was established. These were inco
into a third computer programme which used theresults of the wave measurement programme to
produce a 3 lead electrocardiogram interpretation.An example of corresponding 3 and I2 leadcomputer interpretations is shown in Fig. 3. Forboth lead systems the method of interpretationwas to check wave amplitudes, etc., againstnormal limits as opposed to a multidimensionalstatistical approach.
ResultsThe first comparison concerned the incidenceof false positive and false negative computerinterpretations.
False positive computer interpretationsThe incidence of false positive computerinterpretations was obtained from a study of a
subgroup of 205 subjects who were clinicallynormal. The group consisted of studentvolunteers and others admitted to hospitalfor minor surgical procedures. All had a
normal 12 lead electrocardiogram as deter-mined by the panel of cardiologists. Sinceeach patient was clinically normal with a
I25 normal I2 lead electrocardiogram, each corres-
I48 ponding 3 lead electrocardiogram and its55 computer interpretation was expected to be40 normal.I4I4 The more important false positive com-
puter interpretations are shown in Table 3.
13 There is no significant difference between30 either lead system though a slightly higher42 prevalence of 3 lead electrocardiogram false40 positive interpretations might have been ex-39 pected. This follows from the fact that, since28 all of the 205 patients belonged to the
I28 of 265 from whom the 96 per cent normal33 limits were obtained, false positive results26 could arise from normal patients whose 3 lead
electrocardiogram parameters were outside the1093 96% normal ranges, even though diagnostic
criteria did not always use these limits as the
ted eachboundary between normal and abnormal.
the sameomputer TABLE 3 False positive computer interpreta-vent of a tions as determined froM 205 normal patientsreviewed)n on itsretations
a normalI cardio-al rangesrocardio-e, 1971).ians androup of 3ded withDe resultsRed axialorporated
Computer interpretation Lead system
12 lead 3 lead
Left ventricular hypertrophy 6 7Right ventricular hypertrophy 5 9Myocardial infarction 5 3Myocardial ischaemia 7 9ST elevation 8 IOTall T waves 12 7Conduction defects II 6Low voltage I 3
55 54
on 27 July 2019 by guest. Protected by copyright.
http://heart.bmj.com
/B
r Heart J: first published as 10.1136/hrt.33.2.266 on 1 M
arch 1971. Dow
nloaded from
3 and 12 lead ECG interpretation by computer 269
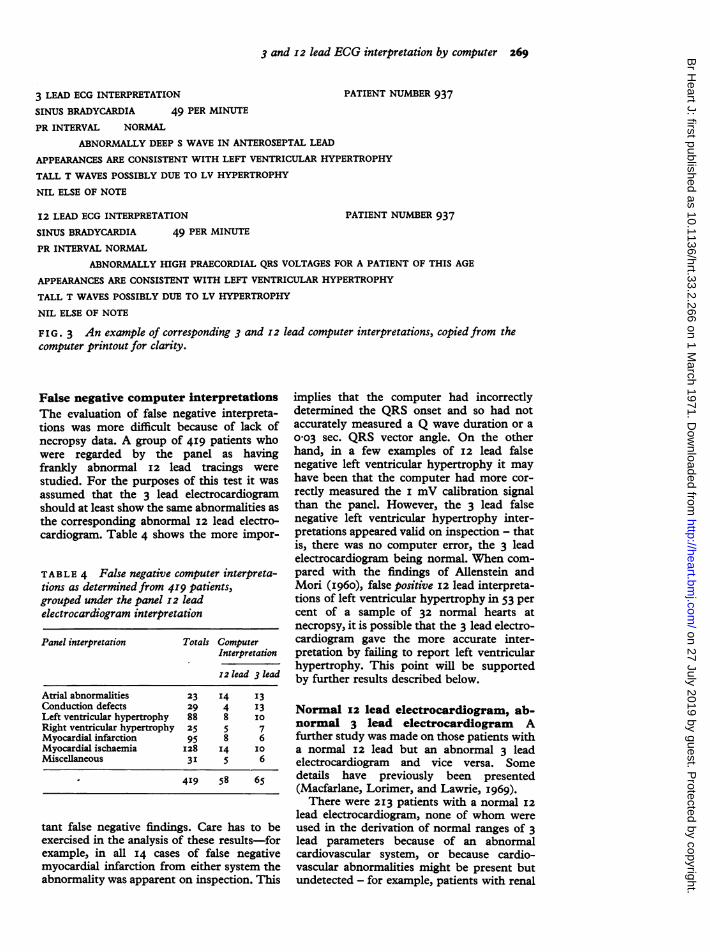
3 LEAD ECG INTERPRETATION
SINUS BRADYCARDIA 49 PER MINUTE
PATIENT NUMBER 937
PR INTERVAL NORMAL
ABNORMALLY DEEP S WAVE IN ANTEROSEPTAL LEAD
APPEARANCES ARE CONSISTENT WITH LEFT VENTRICULAR HYPERTROPHY
TALL T WAVES POSSIBLY DUE TO LV HYPERTROPHY
NIL ELSE OF NOTE
12 LEAD ECG INTERPRETATION PATIENT NUMBER 937
SINUS BRADYCARDIA 49 PER MINUTE
PR INTERVAL NORMAL
ABNORMALLY HIGH PRAECORDIAL QRS VOLTAGES FOR A PATIENT OF THIS AGE
APPEARANCES ARE CONSISTENT WITH LEFT VENTRICULAR HYPERTROPHY
TALL T WAVES POSSIBLY DUE TO LV HYPERTROPHY
NIL ELSE OF NOTE
FIG. 3 An example of corresponding 3 and 12 lead computer interpretations, copied from thecomputer printout for clarity.
False negative computer interpretationsThe evaluation of false negative interpreta-tions was more difficult because of lack ofnecropsy data. A group of 4I9 patients whowere regarded by the panel as havingfrankly abnormal I2 lead tracings werestudied. For the purposes of this test it wasassumed that the 3 lead electrocardiogramshould at least show the same abnormalities asthe corresponding abnormal I2 lead electro-cardiogram. Table 4 shows the more impor-
TABLE 4 False negative computer interpreta-tions as determinedfrom 419 patients,grouped under the panel 12 leadelectrocardiogram interpretation
Panel interpretation Totals ComputerInterpretation
12 lead 3 lead
Atrial abnormalities 23 14 I3Conduction defects 29 4 I3Left ventricular hypertrophy 88 8 IoRight ventricular hypertrophy 25 5 7Myocardial infarction 95 8 6Myocardial ischaemia I28 I4 IOMiscellaneous 3I 5 6
419 58 65
tant false negative findings. Care has to beexercised in the analysis of these results-forexample, in all I4 cases of false negativemyocardial infarction from either system theabnormality was apparent on inspection. This
implies that the computer had incorrectlydetermined the QRS onset and so had notaccurately measured a Q wave duration or ao0o3 sec. QRS vector angle. On the otherhand, in a few examples of I2 lead falsenegative left ventricular hypertrophy it mayhave been that the computer had more cor-rectly measured the i mV calibration signalthan the panel. However, the 3 lead falsenegative left ventricular hypertrophy inter-pretations appeared valid on inspection - thatis, there was no computer error, the 3 leadelectrocardiogram being normal. When com-pared with the findings of Allenstein andMori (I960), false positive I2 lead interpreta-tions of left ventricular hypertrophy in 53 percent of a sample of 32 normal hearts atnecropsy, it is possible that the 3 lead electro-cardiogram gave the more accurate inter-pretation by failing to report left ventricularhypertrophy. This point will be supportedby further results described below.
Normal 12 lead electrocardiogram, ab-normal 3 lead electrocardiogram Afurther study was made on those patients witha normal I2 lead but an abnormal 3 leadelectrocardiogram and vice versa. Somedetails have previously been presented(Macfarlane, Lorimer, and Lawrie, I969).There were 2I3 patients with a normal I2
lead electrocardiogram, none of whom wereused in the derivation of normal ranges of 3lead parameters because of an abnormalcardiovascular system, or because cardio-vascular abnormalities might be present butundetected - for example, patients with renal
on 27 July 2019 by guest. Protected by copyright.
http://heart.bmj.com
/B
r Heart J: first published as 10.1136/hrt.33.2.266 on 1 M
arch 1971. Dow
nloaded from
270 Macfarlane, Lorimer, and Lawrie
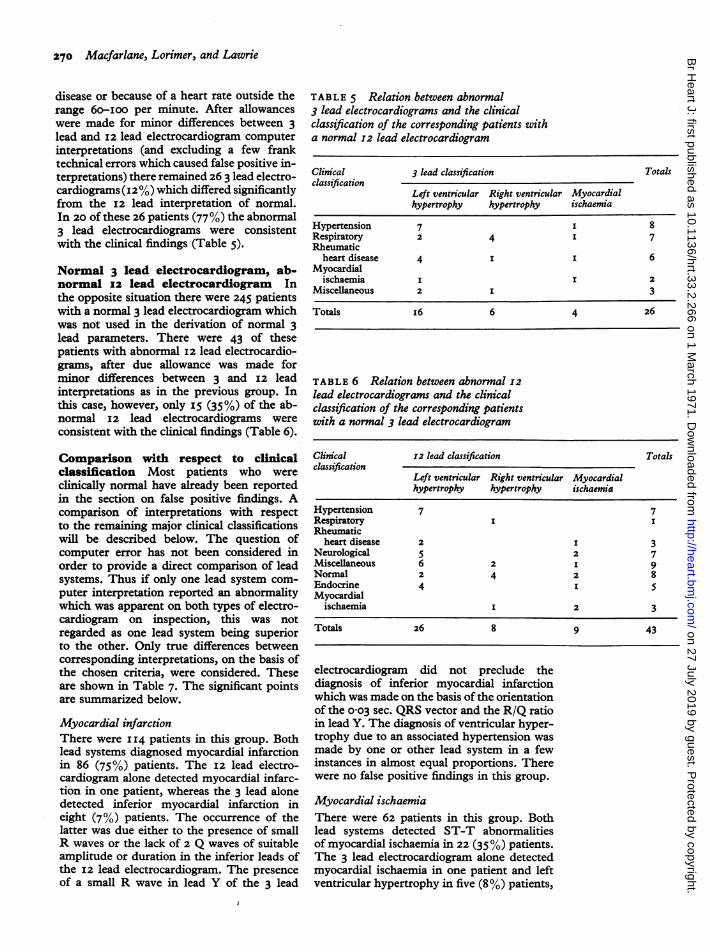
disease or because of a heart rate outside therange 6o-ioo per minute. After allowanceswere made for minor differences between 3lead and I2 lead electrocardiogram computerinterpretations (and excluding a few franktechnical errors which caused false positive in-terpretations) there remained 26 3 lead electro-cardiograms (i2%) which differed significantlyfrom the I2 lead interpretation of normal.In 20 of these 26 patients (77%) the abnormal3 lead electrocardiograms were consistentwith the clinical findings (Table 5).
Normal 3 lead electrocardiogram, ab-normal 12 lead electrocardiogram Inthe opposite situation there were 245 patientswith a normal 3 lead electrocardiogram whichwas not used in the derivation of normal 3lead parameters. There were 43 of thesepatients with abnormal I2 lead electrocardio-grams, after due allowance was made forminor differences between 3 and 12 leadinterpretations as in the previous group. Inthis case, however, only I5 (35%) of the ab-normal I2 lead electrocardiograms wereconsistent with the clinical findings (Table 6).
Comparison with respect to clinicalclassification Most patients who wereclinically normal have already been reportedin the section on false positive findings. Acomparison of interpretations with respectto the remaining major clinical classificationswill be described below. The question ofcomputer error has not been considered inorder to provide a direct comparison of leadsystems. Thus if only one lead system com-puter interpretation reported an abnormalitywhich was apparent on both types of electro-cardiogram on inspection, this was notregarded as one lead system being superiorto the other. Only true differences betweencorresponding interpretations, on the basis ofthe chosen criteria, were considered. Theseare shown in Table 7. The significant pointsare summarized below.
Myocardial infarctionThere were I14 patients in this group. Bothlead systems diagnosed myocardial infarctionin 86 (75%) patients. The i2 lead electro-cardiogram alone detected myocardial infarc-tion in one patient, whereas the 3 lead alonedetected inferior myocardial infarction ineight (7%) patients. The occurrence of thelatter was due either to the presence of smallR waves or the lack of 2 Q waves of suitableamplitude or duration in the inferior leads ofthe i2 lead electrocardiogram. The presenceof a small R wave in lead Y of the 3 lead
TABLE 5 Relation between abnormal3 lead electrocardiograms and the clinicalclassification of the corresponding patients witha normal 12 lead electrocardiogram
Clinical 3 lead classification Totalsclassification
Left ventricular Right ventricular Myocardialhypertrophy hypertrophy ischaemia
Hypertension 7 I 8Respiratory 2 4 I 7Rheumatic
heart disease 4 I I 6Myocardial
ischaemia I I 2Miscellaneous 2 I 3
Totals i6 6 4 26
TABLE 6 Relation between abnormal I2lead electrocardiograms and the clinicalclassification of the corresponding patientswith a normal 3 lead electrocardiogram
Clinical 12 lead classification Totalsclassification
Left ventricular Right ventricular Myocardialhypertrophy hypertrophy ischaemia
Hypertension 7 7Respiratory I IRheumatic
heart disease 2 I 3Neurological 5 2 7Miscellaneous 6 2 I 9Normal 2 4 2 8Endocrine 4 I 5Myocardial
ischaemia I 2 3
Totals 26 8 9 43
electrocardiogram did not preclude thediagnosis of inferior myocardial infarctionwhich was made on the basis of the orientationof the o0o3 sec. QRS vector and the R/Q ratioin lead Y. The diagnosis of ventricular hyper-trophy due to an associated hypertension wasmade by one or other lead system in a fewinstances in almost equal proportions. Therewere no false positive findings in this group.
Myocardial ischaemiaThere were 62 patients in this group. Bothlead systems detected ST-T abnormalitiesof myocardial ischaemia in 22 (35%) patients.The 3 lead electrocardiogram alone detectedmyocardial ischaemia in one patient and leftventricular hypertrophy in five (8%) patients,
on 27 July 2019 by guest. Protected by copyright.
http://heart.bmj.com
/B
r Heart J: first published as 10.1136/hrt.33.2.266 on 1 M
arch 1971. Dow
nloaded from
3 and 12 lead ECG interpretation by computer 271
TABLE 7 Differences between 3 lead (vectorcardiogram) and I2 lead (electrocardiogram)system interpretations. Each figure represents number of instances that a particular abnormalitywas detected by one lead system only. Figures do not include discrepancies due to computer error
Clinical Computer interpretationclassification
Total Myocardial ischaemia Myocardial infarction Left ventricular Right ventricular Miscellaneousstudied Vector- Electro- Vector- Electro- hypertrophy hypertrophy Vector- Electro-
cardio- cardio- cardio- cardio- Vector- Electro- Vector- Electro- cardio- cardio-gram gram gram gram cardio- cardio- cardio- cardio- gram gram
gram gram gram gram
Myocardialinfarction 114 8 I 5 3 4
Myocardialischaemia 62 3 3 7 4 3
Hypertension 9I 2 I 15 9 I 2Congenital
heart disease 33 I I 2 2 I I IRheumatic
heart disease I42 I I 14 6 IO 7 3 IRespiratory 58 I 3 I 6 I 2Neurological 66 I I 5 3 2Renal 44 I 2 I I IBlood 43 2 I IAlimentary 76 2 I 3 5 I I IEndocrine 85 I 4 3 I IPeripheral
vasculardisease 21 2 I I
Miscellaneous 37 I 3 I I I
three of whom had systemic hypertension;the other two had left ventricular enlargementradiologically. The i2 lead electrocardiogram,while consistent with myocardial ischaemia,also suggested anteroseptal myocardial infarc-tion in 3 patients, on the basis of low R waves(R<o-Io mV) or unusual small Q waves inleads V2-V4. The remaining four (6%) i2lead and seven (II %) 3 lead electrocardio-grams were regarded as false positive findings.
Systemic hypertensionThere were 9i patients in this group. A fewpatients with systemic hypertension wereincluded in other clinical categories becauseof their clinical presentation (for example,acute myocardial infarction). Left ventricularhypertrophy was detected by both leadsystems in 23 (25%) patients. In addition, 9(i i %) patients had evidence of left ventricularhypertrophy on the I2 lead electrocardiogramonly and 15 (i6%) had evidence of leftventricular hypertrophy on the 3 lead electro-cardiogram only. These findings were re-garded as clinically expected, as were theother abnormalities detected by one or otherlead system only. There were no false posi-tive findings in this group.
Congenital heart diseaseThere were 33 patients in this group, and ingeneral there was good agreement between
interpretations of each lead system. The 3lead electrocardiogram report of left ventric-ular hypertrophy was clinically expected inone patient with coarctation of the aorta, butthe remaining discrepancies between leadsystem interpretations as listed in Table 7were regarded as false positive findings.
Rheumatic heart diseaseIn this group of I42 patients there was agree-ment as regards left, right, or combined ven-tricular hypertrophy in 42 (30%) patients.There were different interpretations in43 (30%) other patients. The 3 lead electro-cardiogram alone in I3 (9%) patients and theI2 lead alone in 3 (2%) patients was reportedas left ventricular hypertrophy, an interpreta-tion which was consistent with the clinicalfindings of aortic or mitral valve disease orof both. The 3 lead electrocardiogram alonein 9 (6%) patients, and the i2 lead alone in 6(4%) detected right ventricular hypertrophywhere again the interpretation was consistentwith the clinical diagnosis of predominantmitral stenosis. The remaining two (I .4%) 3lead and four (3%) 12 lead electrocardiograminterpretations of ventricular hypertrophywere regarded as false positive. The otherdiscrepancies between lead systems wereconsistent with the clinical findings in eachinstance.
on 27 July 2019 by guest. Protected by copyright.
http://heart.bmj.com
/B
r Heart J: first published as 10.1136/hrt.33.2.266 on 1 M
arch 1971. Dow
nloaded from
272 Macfarlane, Lorimer, and Lawrie
RespiratoryThere were 58 patients in this group. Bothlead systems detected right ventricular hyper-trophy in only two (3 5%) patients. The 3lead electrocardiogram alone detected rightventricular hypertrophy in 6 (io%) patientsand the I2 lead alone did likewise in onepatient only. These interpretations were con-sistent with the clinical findings, but thethree (5%) 3 lead and one I2 lead cardiograminterpretations of left ventricular hyper-trophy were regarded as false positive. Theremaining three discrepancies were consistentwith the clinical findings.
Neurological, renal, alimentary, endocrine,peripheral vascular disease, blood, miscellaneousThere was a total of 372 subjects in theseremaining groups, into which patients wereplaced on account of their presenting clinicalfeatures. It is realized that the differentelectrocardiographic abnormalities (if any)encountered in each group are not mutuallyexclusive and the classifications were for con-venience to assist the derivation of normalranges. The 3 lead electrocardiogram alonereported left ventricular hypertrophy in eight(2%) patients, of whom seven had systemichypertension, the other having Friedreich'sataxia, while the 12 lead electrocardiogramalone reported left ventricular hypertrophy intwo patients. These interpretations were re-garded as consistent with the clinical find-ings. There were 4 (I%) patients with 3 leadevidence of ischaemic abnormalities whichwere clinically expected. In addition therewere two 3 lead electrocardiogram interpre-tations which were consistent with inferiormyocardial infarction, whereas the corre-sponding I2 lead electrocardiograms showedQ waves of doubtful diagnostic significance.The other discrepancies, 26 (7%) 3 lead andI7 (5%) I2 lead electrocardiogram, wereregarded as false positive.
DiscussionAny large study of electrocardiograms in-cluding patients of all ages suffers from thelimitation of lack of correlation betweenelectrocardiographic abnormalities detectedand the underlying pathology of the heart.Nevertheless it is necessary to define a borderbetween normal and abnormal ranges ofelectrocardiographic parameters. For a diag-nostic guide line a semi-arbitrary value has tobe chosen. In this study the values incor-porated in the newly developed 3 leaddiagnostic criteria have proved effectivethroughout the spectrum of abnormalities,even though no necropsy correlations were
used in their derivation. In our opinion theinclusion of such data would not materiallyhave altered the findings for the followingreasons. Firstly, the choice of diagnosticcriteria was weighted heavily by the findingsfrom the normal group of subjects - forexample, the 96 per cent upper limit ofnormalfor the maximum QRS vector amplitude was2-3I mV and that chosen for the diagnosis ofleft ventricular hypertrophy (in the presenceof normal T waves) was 2-50 mV; this choicewas made irrespective of the 96 per centlimits of the 3 lead parameter ranges inpatients whose I2 lead electrocardiogramshowed left ventricular hypertrophy. Thesame was true for other parameters used inthis context - for example, S,, Rx, and theangle in the transverse plane of the projectionof the maximum QRS vector. On this basis ofcriteria formulation alone the 3 lead electro-cardiogram allowed a greater differentiationof normal from abnormal patterns than didthe I2 lead. Secondly, it is certain that in anystudy comparing normal hearts with thoseshowing left ventricular hypertrophy (asdetermined at necropsy) there would be anoverlap of ranges of 3 or I2 lead parametersfrom each group. The same problem ofchoice of normal values would then still arise.
In the estimation of false positive andnegative computer interpretations the inci-dence of conduction defects has not beenpresented. For complete bundle-branchblock both false positive and negative findingsare due solely to technical or programningfaults, which occurred on a few occasions.The problem, however, was complicated bythe criterion used in the diagnosis of incom-plete right bundle-branch block on the 12lead electrocardiogram - namely, an R'vl ofany amplitude. In retrospect this was anoversimplification which presents a biasedview of the occasional failure of the 3 leadelectrocardiogram to detect incomplete rightbundle-branch block on the basis of the abovecriterion. Such data have not been presentedfor this reason.A comparison with the results of other
workers can best be made by considering theincidence of false positive and negative com-puter interpretations of myocardial infarctionwith regard to cardiologists' interpretationsof I2 lead electrocardiograms. This avoidsthe possibility (as for left ventricularhypertrophy) that for either lead system thecomputer may have given the correct interpre-tation of the electrocardiogram wave pattern,which was however regarded as false positiveor negative in view of the clinical findings.Thus the actual computing technique error
on 27 July 2019 by guest. Protected by copyright.
http://heart.bmj.com
/B
r Heart J: first published as 10.1136/hrt.33.2.266 on 1 M
arch 1971. Dow
nloaded from
3 and I2 lead ECG interpretation by computer 273
can be compared. In a study of 2060 I2 leadelectrocardiograms, Pordy et al. (I968) re-ported a false positive incidence of 28 (I35%)interpretations of myocardial infarction.These compare with I7 (I55%) 3 lead and 25(2-28%) I2 lead electrocardiograms obtainedfrom the I093 subjects used in this study.With regard to false negative interpretationsof myocardial infarction the figures are 9.7per cent for Pordy et al. and 6-3 per cent (3lead) and 8-4 per cent (I2 lead) for this study(see Table 4).While the analysis of arrhythmias was not
undertaken, this in no way detracts from thecomparison of lead systems. There is abelief that the 3 lead electrocardiogram cannotbe used for arrhythmia analysis. This is in-correct, since the 3 lead can be displayed bothin the conventional scalar form as well as avectorcardiogram (Fig. 2). Analysis ofarrhyth-mias could be made from the former but notfrom the latter.On a number of occasions only one of the 3
or I2 lead systems detected a significantabnormality. While this was slightly to theadvantage of the 3 lead system, there was noconspicuous difference between lead systems.It is clear, however, that the optimal leadsystem has not yet been devised. It seems likelythat continual revision of 3 lead diagnosticcriteria could lead to improvement in diag-nostic accuracy, whereas this does not seemprobable with the 12 lead. The reason for thisis the ability of the 3 lead system to detectabnormally orientated cardiac electromotiveforces by preserving the time relationshipbetween lead potentials. Though newtechniques such as multiple dipole electro-cardiography (Holt et al., I969) are promising,these require considerably more time both forrecording and analysis and are cumbersomefor female patients. In addition, since themultiple dipoles are constrained positive,analysis of the ST-T segment cannot be madewith present theoretical methods. There is nodoubt that 3 or I2 lead electrocardiographywill continue in use for many years hence.
ConclusionsThe results of this study show that the 3 leadelectrocardiogram is clinically as useful as the12 lead when interpretation is made by auto-mated methods. No appreciable differencewas found between lead systems with respectto false positive or negative computer interpre-tations. In patients where one or other leadsystem showed a normal pattern the 3 leadshowed greater correlation with the clinicalfindings and had fewer false positive findings.In.- the comparison by clinical classification
the 3 lead cardiogram always detected moreclinically expected abnormalities than did theI2 lead.Computer assistance enhances interpreta-
tion of the 3 lead electrocardiogram, whichrequires about one-third of the computertime for analysis as compared to the I2 lead.This has a clear advantage for routinepurposes, and adds weight to the overallconclusion that the use of 3 orthogonal leadelectrocardiography is the method of choicefor computer interpretation of electrocardio-grams.
ReferencesAllenstein, B. J., and Mori, H. (I960). Evaluation of
electrocardiographic diagnosis of ventricular hyper-trophy based on autopsy comparison. Circulation,2I, 401.
Berson, A. S., and Pipberger, H. V. (I967). Electrodeto skin impedance problems in ECG recordings. InDigest of the 7th International Conference on Medicaland Biological Engineering, Stockholm, i967, p. 415.
Bonner, R. E., and Schwetman, H. D. (I968). Com-puter diagnosis of electrocardiograms. II. Acomputer program for EKG measurements.Computers and Biomedical Research, I, 366.
Borun, E. R., Chapman, J. M., and Massey, F. J.(I966). Computer analysis of Frank lead electro-cardiographic data recorded in an epidemiologicstudy. American Journal of Cardiology, I8, 664.
Brody, D. A., and Arzbaecher, R. C. (I964). A com-parative analysis of several corrected vectorcardio-graphic leads. Circulation, 29, 533.
Caceres, C. A., Steinberg, C. A., Abraham, S.,Carbery, W. J., McBride, J. M., Tolles, W. E., andRikli, A. E. (1962). Computer extraction ofelectrocardiographic parameters. Circulation, 25,356.
Frank, E. (I956). An accurate, clinically practicalsystem for spatial vectorcardiography. Circulation,13, 737-
Holt, J. H., Barnard, A. C. L., Lynn, M. S., andSvendsen, P. (I969). A study of the heart as amultiple dipole electrical source. I. Normal adultmale subjects. Circulation, 40, 687.
Macfarlane, P. W. (I969). A modified axial lead systemfor orthogonal lead electrocardiography. Cardio-vascular Research, 3, 510.
- (I97I). ECG waveform identification by digitalcomputer. Cardiovascular Research 5, I4I.
-, Lorimer, A. R. L., and Lawrie, T. D. V. (I969).Computer interpretation of normal ECGs andcorresponding VCGs. In Proceedings of the XthInternational Colloquium on Vectorcardiography,Warsaw. In the press.
-, -, and - (I971). Normal ranges of modi-fied axial lead system electrocardiogram para-meters. British Heart Journal, 33, 258.
McFee, R., and Parungao, A. (I96I). An orthogonallead system for clinical electrocardiography.American Heart_Journal, 62, 93.
New York Heart Association (I964). Diseases of theHeart and Blood Vessels: Nomenclature and Criteriafor Diagnosis, 6th ed. J. and A. Churchill, London.
Pipberger, H. V., Bialek, S. M., Perloff, J. K., andSchnaper, H. W. (I96I). Correlation of clinicalinformation in the standard I2-lead ECG and acorrected orthogonal 3-lead ECG. American HeartJ'ournal, 6I, 34.
on 27 July 2019 by guest. Protected by copyright.
http://heart.bmj.com
/B
r Heart J: first published as 10.1136/hrt.33.2.266 on 1 M
arch 1971. Dow
nloaded from
274 Macfarlane, Lorimer, and Lawrie
- , and Stallmann, F. W. (1964). Computation ofdifferential diagnosis in electrocardiography.Annals of the New York Academy of Sciences, 115,III5.
Pordy, L., Jaffe, H., Chesky, K., Friedberg, C. K.,Fallowes, L., and Bonner, R. E. (I968). Computerdiagnosis of electrocardiograms. IV. A computerprogram for contour analysis with clinical resultsof rhythm and contour interpretation. Computersand Biomedical Research, I, 408.
Simonson, E. (I96I). Differentiation Between Normaland Abnormal in Electrocardiography. C. V. Mosby,St. Louis.
, Tuna, N., Okamoto, N., and Toshima, H. (I966).Diagnostic accuracy of the vectorcardiogram andelectrocardiogram. American journal of Cardiology,17, 829.
Smith, R. E., and Hyde, C. M. (I969). Computeranalysis of the electrocardiogram in clinical prac-
tice. In Electrical Activity of the Heart, p. 305. Ed.by G. W. Manning and S. P. Ahuja. Thomas,Springfield, Illinois.
Sokolow, M., and Lyon, T. P. (I949a). The ventricularcomplex in left ventricular hypertrophy as obtainedby unipolar precordial and limb leads. AmericanHeart Journal, 37, i6i.
- , and - (1949b). The ventricular complex inright ventricular hypertrophy as obtained by uni-polar precordial and limb leads. American HeartJournal, 38, 273.
Spach, M. S., Barr, R. C., Havstad, J. W., and Long,E. C. (I966). Skin-electrode impedance and itseffect on recording cardiac potentials. Circulation,34, 649.
Stallmann, F. W., and Pipberger, H. V. (I96I). Auto-matic recognition of electrocardiographic waves bydigital computer. Circulation Research, 9, II38.
on 27 July 2019 by guest. Protected by copyright.
http://heart.bmj.com
/B
r Heart J: first published as 10.1136/hrt.33.2.266 on 1 M
arch 1971. Dow
nloaded from


![GREGORIAN CHANT - api.ning.comapi.ning.com/.../GregorianChant4.pdf · 312 GREGORIAN CHANT virtutum [G157], andparticularly Panis quern [1043]. Acomparison of' Quoddico andPanis quern](https://img.pdfslide.us/doc/110x75/5aa974f97f8b9a9a188ceb2d/gregorian-chant-apining-gregorian-chant-virtutum-g157-andparticularly-panis.jpg)