Embed Size (px)
Citation preview
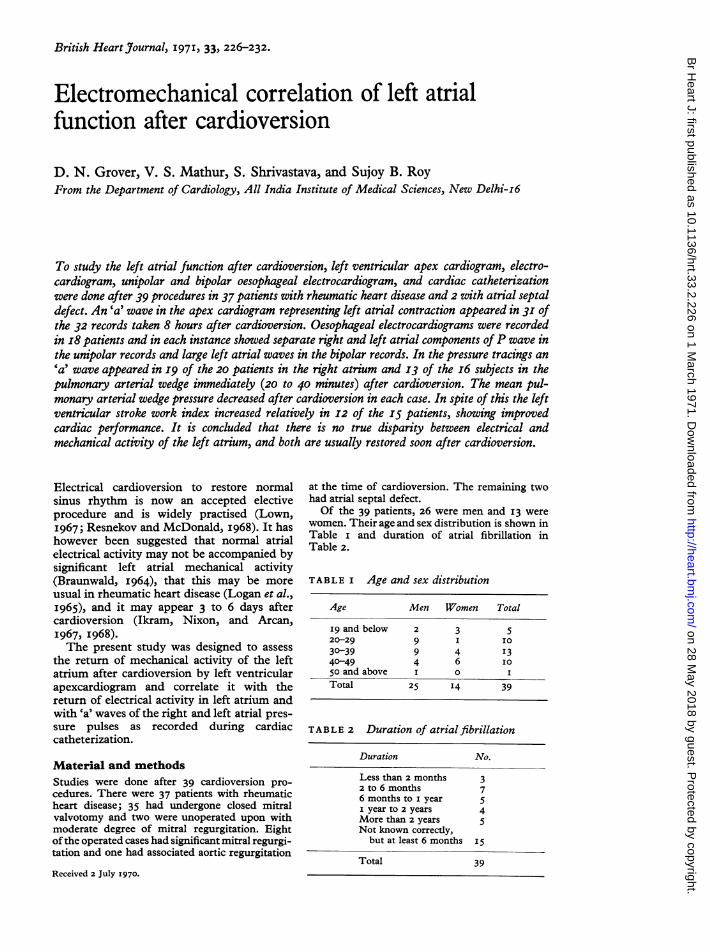
British Heart_Journal, I971, 33, 226-232.
Electromechanical correlation of left atrialfunction after cardioversion
D. N. Grover, V. S. Mathur, S. Shrivastava, and Sujoy B. RoyFrom the Department of Cardiology, All India Institute of Medical Sciences, New Delhi-i6
To study the left atrial function after cardioversion, left ventricular apex cardiogram, electro-cardiogram, unipolar and bipolar oesophageal electrocardiogram, and cardiac catheterizationwere done after 39 procedures in 37 patients with rheumatic heart disease and 2 with atrial septaldefect. An 'a' wave in the apex cardiogram representing left atrial contraction appeared in 31 ofthe 32 records taken 8 hours after cardioversion. Oesophageal electrocardiograms were recordedin I8 patients and in each instance showed separate right and left atrial components ofP wave inthe unipolar records and large left atrial waves in the bipolar records. In the pressure tracings an'a' wave appeared in I9 of the 20 patients in the right atrium and I3 of the i6 subjects in thepulmonary arterial wedge immediately (20 to 40 minutes) after cardioversion. The mean pul-monary arterial wedge pressure decreased after cardioversion in each case. In spite of this the leftventricular stroke work index increased relatively in I2 of the I5 patients, showing improvedcardiac performance. It is concluded that there is no true disparity between electrical andmechanical activity of the left atrium, and both are usually restored soon after cardioversion.
Electrical cardioversion to restore normalsinus rhythm is now an accepted electiveprocedure and is widely practised (Lown,I967; Resnekov and McDonald, I968). It hashowever been suggested that normal atrialelectrical activity may not be accompanied bysignificant left atrial mechanical activity(Braunwald, I964), that this may be more
usual in rheumatic heart disease (Logan et al.,I965), and it may appear 3 to 6 days aftercardioversion (Ikram, Nixon, and Arcan,I967, I968).The present study was designed to assess
the return of mechanical activity of the leftatrium after cardioversion by left ventricularapexcardiogram and correlate it with thereturn of electrical activity in left atrium andwith 'a' waves of the right and left atrial pres-sure pulses as recorded during cardiaccatheterization.
Material and methodsStudies were done after 39 cardioversion pro-cedures. There were 37 patients with rheumaticheart disease; 35 had undergone closed mitralvalvotomy and two were unoperated upon withmoderate degree of mitral regurgitation. Eightofthe operated cases had significant mitral regurgi-tation and one had associated aortic regurgitation
Received 2 July 1970.
at the time of cardioversion. The remaining twohad atrial septal defect.Of the 39 patients, 26 were men and I3 were
women. Their age and sex distribution is shown inTable i and duration of atrial fibrillation inTable 2.
TABLE i Age and sex distribution
Age Men Women Total
I9 and below 2 3 520-29 9 I 10
30-39 9 4 1340-49 4 6 I05o and above I 0 ITotal 25 I4 39
TABLE 2 Duration of atrial fibrillation
Duration No.
Less than 2 months 32 to 6 months 76 months to I year 5I year tO 2 years 4More than 2 years 5Not known correctly,
but at least 6 months I5
Total 39
on 28 May 2018 by guest. P
rotected by copyright.http://heart.bm
j.com/
Br H
eart J: first published as 10.1136/hrt.33.2.226 on 1 March 1971. D
ownloaded from
Electromechanical correlation of left atrial function after cardioversion 227
Standard electrocardiograms were recordedbefore and after cardioversion in each case. Abipolar electrode catheter was passed through thenose into the oesophagus, and oesophagealelectrocardiograms were recorded at distances of50, 45, 40, 35, and 30 cm. from the tip of the naresin i8 patients. Unipolar as well as bipolar tracingswere recorded. A left ventricular apex cardiogramwas recorded at the point of maximal impulsewith the patient in a left lateral position duringmid-expiration (Dimond, Duenas, and Benchimol,I966) in 37 instances. Using a funnel with adiameter of 2-0 cm. and piezoelectric crystalmicrophone (Sanborn No. 374), the tracings wererecorded at a paper speed of 75 mm. per second ona multichannel photographic recorder (Elec-tronics for Medicine, DR 8).
Right heart catheterization was done in 20patients. Pressure tracings of right atrium andpulmonary artery wedge reflecting left atrialpressure were recorded. Baseline for all pressuremeasurements was taken as half the chest thick-ness at the second costal cartilage with the patientsupine (Roy, Gadboys, and Dow, I957). Cardiacoutput was measured by dye dilution technique atrest and during the 3rd to 5th minutes of a steadyleg-raising exercise in supine position, both beforeand after cardioversion.
Cardioversion was done under transientamnesia induced by a small dose of intravenousthiopentone sodium (50 to 200 mg.) as describedearlier from this laboratory (Wasir et al., i969).
Surface electrocardiogram, oesophageal electro-cardiogram, and apex cardiogram were repeated8 hours after cardioversion when the patient hadrecovered from the effect of anaesthesia. In fiveinstances it was recorded i hour after cardio-version.
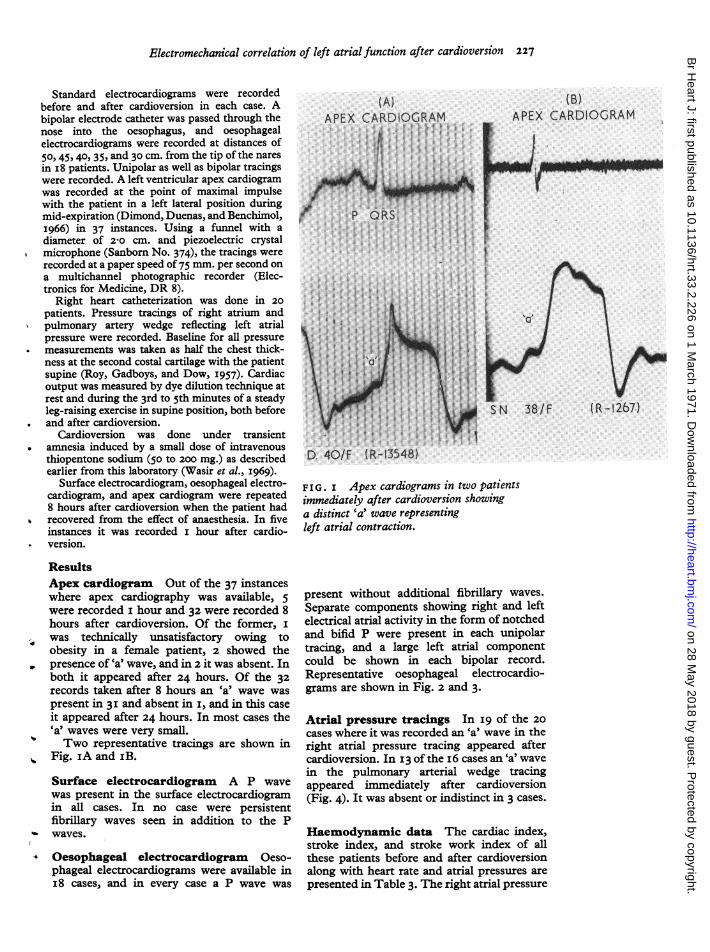
ResultsApex cardiogram Out of the 37 instanceswhere apex cardiography was available, 5were recorded i hour and 32 were recorded 8hours after cardioversion. Of the former, iwas technically unsatisfactory owing toobesity in a female patient, 2 showed thepresence of 'a' wave, and in 2 it was absent. Inboth it appeared after 24 hours. Of the 32records taken after 8 hours an 'a' wave waspresent in 3I and absent in i, and in this caseit appeared after 24 hours. In most cases the'a' waves were very small.Two representative tracings are shown in
Fig. iA and iB.
Surface electrocardiogram A P wavewas present in the surface electrocardiogramin all cases. In no case were persistentfibrillary waves seen in addition to the P
* waves.
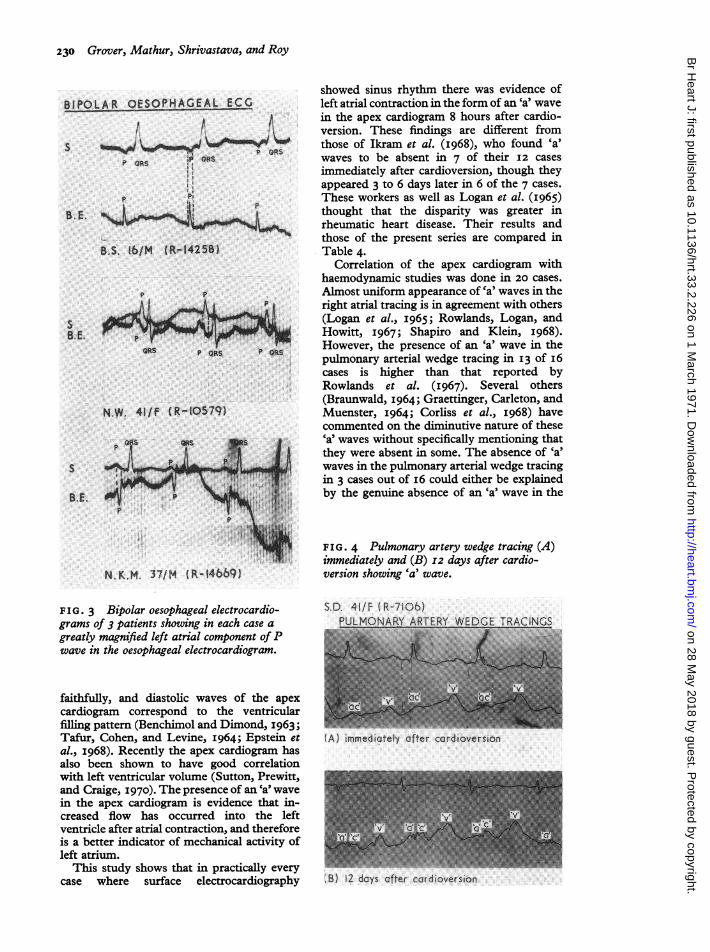
Oesophageal electrocardiogram Oeso-phageal electrocardiograms were available ini8 cases, and in every case a P wave was
(A)APEX CARDIOGRAM
QRSr . r ! ' 0 f i | t
;
.>. x .. .. .. .. s
D. 40/F (R-13548)
38/F
F I G. I Apex cardiograms in two patientsimmediately after cardioversion showinga distinct 'a' wave representingleft atrial contraction.
present without additional fibrillary waves.
Separate components showing right and left
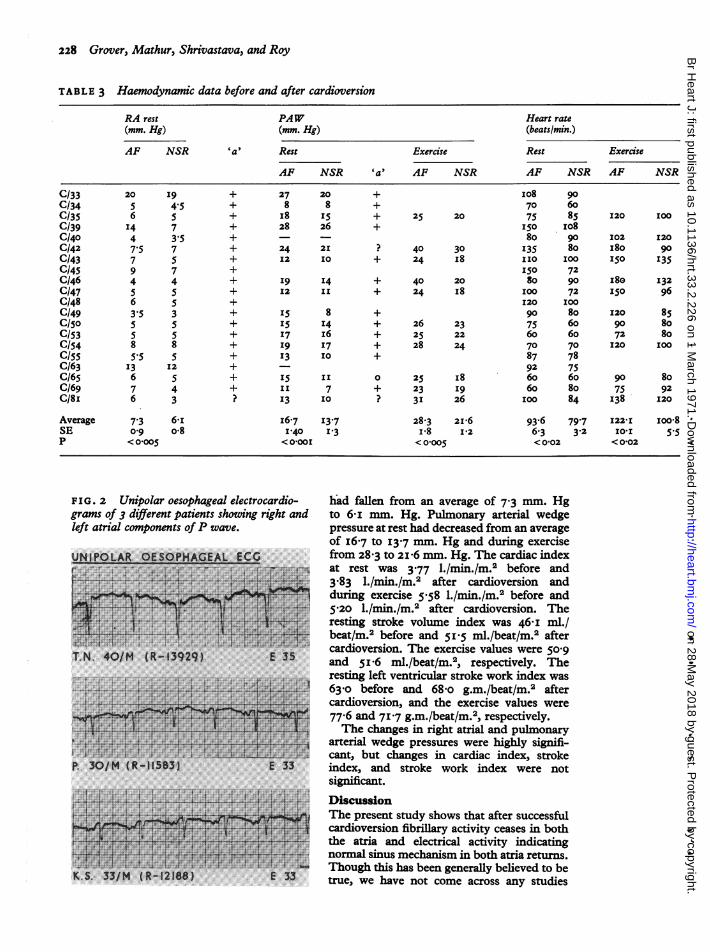
electrical atrial activity in the form of notchedand bifid P were present in each unipolartracing, and a large left atrial componentcould be shown in each bipolar record.Representative oesophageal electrocardio-grams are shown in Fig. 2 and 3.
Atrial pressure tracings In I9 of the 20
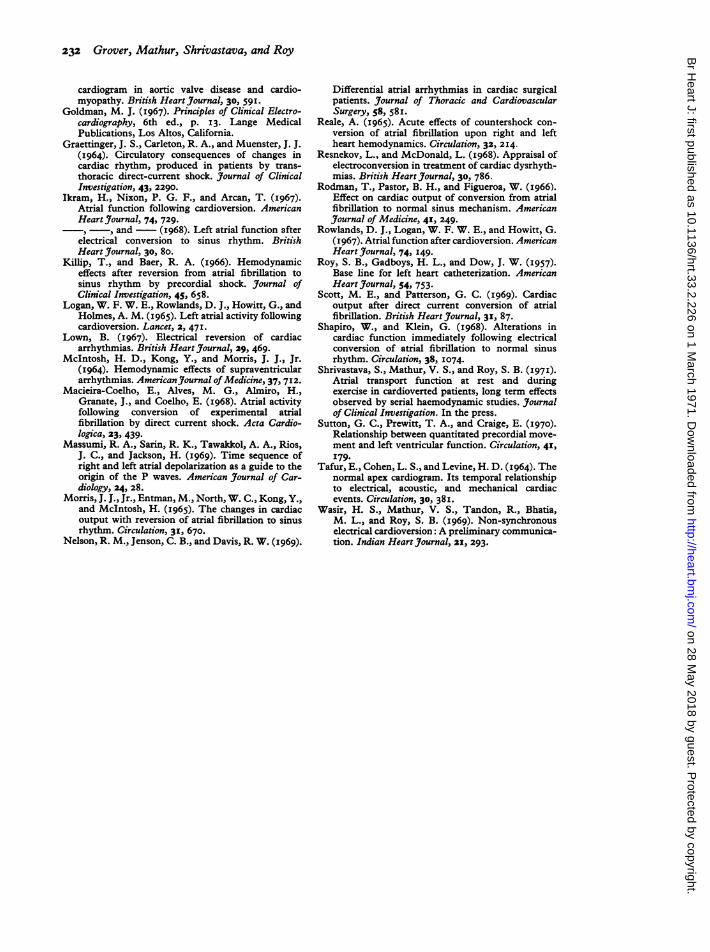
cases where it was recorded an 'a' wave in theright atrial pressure tracing appeared aftercardioversion. In I3 of the i6 cases an 'a' wavein the pulmonary arterial wedge tracingappeared immediately after cardioversion(Fig. 4). It was absent or indistinct in 3 cases.
Haemodynamic data The cardiac index,stroke index, and stroke work index of allthese patients before and after cardioversionalong with heart rate and atrial pressures are
presented in Table 3. The right atrial pressure
(B)APEX CARDIOGRAM
(R -1267)
-
IiAr---- w- ---Wvv-
on 28 May 2018 by guest. P
rotected by copyright.http://heart.bm
j.com/
Br H
eart J: first published as 10.1136/hrt.33.2.226 on 1 March 1971. D
ownloaded from
228 Grover, Mathur, Shrivastava, and Roy
TABLE 3 Haemodynamic data before and after cardioversion
RA rest PAW Heart rate(mm. Hg) (mm. Hg) (beats/min.)
AF NSR 'a' Rest Exercise Rest Exercise
AF NSR 'a' AF NSR AF NSR AF NSR
C/33 20 I9 + 27 20 + IO8 90C/34 5 4.5 + 8 8 + 70 60C/35 6 5 + I8 IS + 25 20 75 85 I20 100C/39 I4 7 + 28 26 + I5O IO8C/40 4 3.5 + 80 90 I02 120C/42 7.5 7 + 24 21 ? 40 30 135 80 I80 90C/43 7 5 + I2 10 + 24 I8 1IO IOO 150 I35C/45 9 7 + 150 72C/46 4 4 + I9 14 + 40 20 80 90 I8e 132C/47 5 5 + 12 II + 24 I8 100 72 I50 96C/48 6 5 + I20 1OOC/49 3.5 3 + SS8 + 90 8o 120 85C/50 5 5 + I5 14 + 26 23 75 60 90 80C/53 5 5 + I7 I6 + 25 22 60 60 72 8oC/54 8 8 + I9 I7 + 28 24 70 70 120 IOOC/55 5.5 5 + 13 IO + 87 78C/63 I3 I2 + 92 75C/65 6 5 + I5 II 0 25 i8 60 60 90 8oC/69 7 4 + II 7 + 23 I9 60 80 75 92C/8I 6 3 ? 13 10 ? 3I 26 100 84 138 120
Average 7'3 6-i I6.7 13.7 28.3 216 93-6 79.7 I22-I Ioo08SE 0 9 o08 I-40 13 I-8 1'2 6.3 3.2 I0XI 5.5P < 0-005 <O-OOI <0-005 <0102 <0O02
FIG. 2 Unipolar oesophageal electrocardio-grams of 3 different patients showing right andleft atrial components ofP wave.
UN,I P WAR OESOPHAGEA ECG..
§+ +. ~~~~~~~~~~~~~~~~~~~~~~~~~~~~~~~~~~~~~~..~~~~~~~~~~~~. w*w*v.......
.Fr. . ...5E.^^..A ,.,
------. E R.S s,4E .,BS 0 S t_d---t 1 n+ __ V+
P..30/ (R _glS+_-V.1153 E 0~~~~~~~~...:;, ,5-|4 .*a, w_^;;16.4f !,:
$*w~~ ~ ~ ~ ZYTL. Z.SSv'} ! < zsA tTeNb40/H{Rt3929} f Am
K.S.33/M R.18) 3
had fallen from an average of 7.3 mm. Hgto 6-i mm. Hg. Pulmonary arterial wedgepressure at rest had decreased from an averageof I6-7 tO I3.7 mm. Hg and during exercisefrom 28 3 to 2zi6 mm. Hg. The cardiac indexat rest was 3.77 l./min.fm.2 before and3-83 l./min./m.2 after cardioversion andduring exercise 558 l./min./m.2 before and
i5.20 l./nmin./m.2 after cardioversion. Theresting stroke volume index was 46-I ml./beat/m.2 before and 51i5 ml./beat/m. aftercardioversion. The exercise values were 5o09and 5i'6 ml./beat/m.2, respectively. Theresting left ventricular stroke work index was63-o before and 68-o g.m./beat/m.2 aftercardioversion, and the exercise values were77-6 and 717 g.m./beat/m.2, respectively.The changes in right atrial and puilmonary
arterial wedge pressures were highly signifi-cant, but changes in cardiac index, strokeindex, and stroke work index were notsig ncant.
DiscussionThe present study shows that after successfulcardioversion fibrillary activity ceases in boththe atria and electrical activity indicatingnormal sinus mechanism in both atria returns.Though this has been generally believed to betrue, we have not come across any studies
I
on 28 May 2018 by guest. P
rotected by copyright.http://heart.bm
j.com/
Br H
eart J: first published as 10.1136/hrt.33.2.226 on 1 March 1971. D
ownloaded from
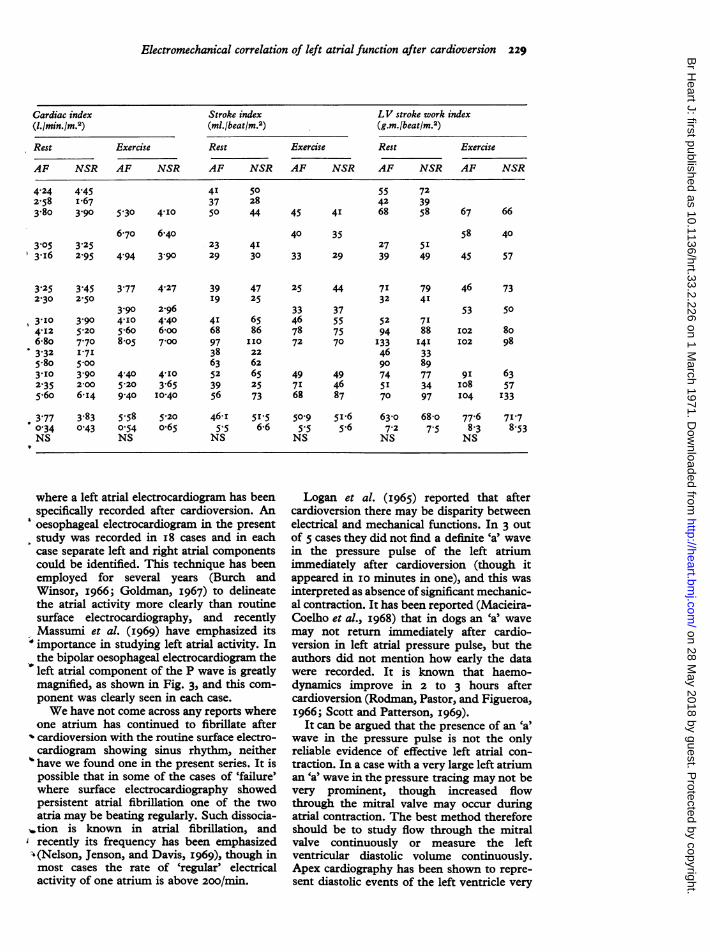
Electromechanical correlation of left atrial function after cardioversion 229
Cardiac index Stroke index LV stroke work index(1.1min./m.2) (ml./beat/m.2) (g.m.lbeat/rm.2)
Rest Exercise Rest Exercise Rest Exercise
AF NSR AF NSR AF NSR AF NSR AF NSR AF NSR
4I 5037 28
5'30 4-I0 50 44
55 7242 39
45 41 68 58
6.70 6-4o3-05 3-253.I6 2 95 4.94 3-90
40 3523 4I29 30 33 29
58 4027 5I39 49 45 57
47 25 44 71 7925 32 4I
33 3765 46 55 52 7186 78 75 94 88[I0 72 70 I33 I4122 46 3362 90 8965 49 49 74 7725 71 46 51 3473 68 87 70 97
5I5 50°9 5I.6 630- 6846-6 5.5 5.6 7-2 7.
NS NS
,O 77-65 8-3
NS
where a left atrial electrocardiogram has beenspecifically recorded after cardioversion. An
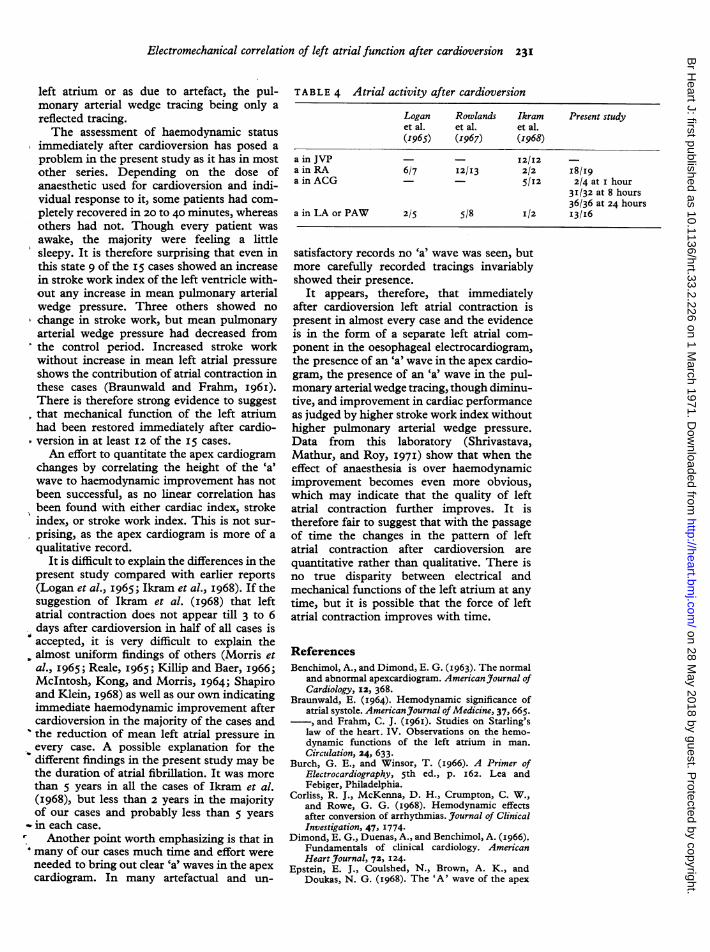
'oesophageal electrocardiogram in the presentstudy was recorded in i8 cases and in eachcase separate left and right atrial componentscould be identified. This technique has beenemployed for several years (Burch andWinsor, I966; Goldman, I967) to delineatethe atrial activity more clearly than routinesurface electrocardiography, and recentlyMassumi et al. (I969) have emphasized itsimportance in studying left atrial activity. Inthe bipolar oesophageal electrocardiogram theleft atrial component of the P wave is greatlymagnified, as shown in Fig. 3, and this com-ponent was clearly seen in each case.We have not come across any reports where
one atrium has continued to fibrillate after^ cardioversion with the routine surface electro-cardiogram showing sinus rhythm, neither
' have we found one in the present series. It ispossible that in some of the cases of 'failure'where surface electrocardiography showedpersistent atrial fibrillation one of the twoatria may be beating regularly. Such dissocia-
.tion is known in atrial fibrillation, andrecently its frequency has been emphasized(Nelson, Jenson, and Davis, I969), though inmost cases the rate of 'regular' electricalactivity of one atrium is above 200/min.
Logan et al. (i965) reported that aftercardioversion there may be disparity betweenelectrical and mechanical functions. In 3 outof 5 cases they did not find a definite 'a' wavein the pressure pulse of the left atriumimmediately after cardioversion (though itappeared in IO minutes in one), and this wasinterpreted as absence of significant mechanic-al contraction. It has been reported (Macieira-Coelho et al., I968) that in dogs an 'a' wavemay not return immediately after cardio-version in left atrial pressure pulse, but theauthors did not mention how early the datawere recorded. It is known that haemo-dynamics improve in 2 to 3 hours aftercardioversion (Rodman, Pastor, and Figueroa,1966; Scott and Patterson, i969).It can be argued that the presence of an 'a'
wave in the pressure pulse is not the onlyreliable evidence of effective left atrial con-
traction. In a case with a very large left atriuman Ca wave in the pressure tracing may not bevery prominent, though increased flowthrough the mitral valve may occur duringatrial contraction. The best method thereforeshould be to study flow through the mitralvalve continuously or measure the leftventricular diastolic volume continuously.Apex cardiography has been shown to repre-
sent diastolic events of the left ventricle very
4-24 4.452.58 I.673-80 3-90 67 66
3.773.904-I05-6o8.o5
4.27
2-964'406oo7-00
3.452-50
3.90
3'902-006.I4
3-252-30
3tI04.I26-803.325.803-I02.355*60
3.770.34NS
39I9
4I6897 I
3863523956
46.I5.5NS
4-40 4-105-20 3-659 40 I0*40
3-83 5-580-43 O-54
NS
46 73
53 50
102 8oI02 98
9I 63io8 57I04 I33
5-20o.65
7178-53
on 28 May 2018 by guest. P
rotected by copyright.http://heart.bm
j.com/
Br H
eart J: first published as 10.1136/hrt.33.2.226 on 1 March 1971. D
ownloaded from
230 Grover, Mathur, Shrivastava, and Roy
BIPOLAR OESOPHAGEAL ECG
st ts OR
P ORS
I,P P
B.E. ,
B.S. 16/M (R-1425B)
P P
SB.E.
ORs p QRs P ws.
N.W. 41/F (R-10579)
B.E.S
N,K.M. 37/M (R-14669)
F I G. 3 Bipolar oesophageal electrocardio-grams of 3 patients showing in each case agreatly magnified left atrial component ofPwave in the oesophageal electrocardiogram.
faithfully, and diastolic waves of the apexcardiogram correspond to the ventricularfilling pattern (Benchimol and Dimond, I963;Tafur, Cohen, and Levine, I964; Epstein etal., I968). Recently the apex cardiogram hasalso been shown to have good correlationwith left ventricular volume (Sutton, Prewitt,and Craige, I970). The presence of an 'a' wavein the apex cardiogram is evidence that in-creased flow has occurred into the leftventricle after atrial contraction, and thereforeis a better indicator of mechanical activity ofleft atrium.
This study shows that in practically everycase where surface electrocardiography
showed sinus rhythm there was evidence ofleft atrial contraction in the form of an 'a' wavein the apex cardiogram 8 hours after cardio-version. These findings are different fromthose of Ikram et al. (I968), who found 'a'waves to be absent in 7 of their i2 casesimmediately after cardioversion, though theyappeared 3 to 6 days later in 6 of the 7 cases.These workers as well as Logan et al. (I965)thought that the disparity was greater inrheumatic heart disease. Their results andthose of the present series are compared inTable 4.
Correlation of the apex cardiogram withhaemodynamic studies was done in 20 cases.Almost uniform appearance of 'a' waves in theright atrial tracing is in agreement with others(Logan et al., I965; Rowlands, Logan, andHowitt, I967; Shapiro and Klein, I968).However, the presence of an 'a' wave in thepulmonary arterial wedge tracing in 13 of I6cases is higher than that reported byRowlands et al. (I967). Several others(Braunwald, I964; Graettinger, Carleton, andMuenster, I964; Corliss et al., I968) havecommented on the diminutive nature of thesea waves without specifically mentioning thatthey were absent in some. The absence of 'a'waves in the pulmonary arterial wedge tracingin 3 cases out of i6 could either be explainedby the genuine absence of an 'a' wave in the
FIG. 4 Pulmonary artery wedge tracing (A)immediately and (B) I2 days after cardio-version showing 'a' wave.
S.D. 41/F (R-7106)Ptl MCNARY APT
(A) immediately ofter cordioversion
fB) 12 days after cordioversion
on 28 May 2018 by guest. P
rotected by copyright.http://heart.bm
j.com/
Br H
eart J: first published as 10.1136/hrt.33.2.226 on 1 March 1971. D
ownloaded from
Electromechanical correlation of left atrial function after cardioversion 231
left atrium or as due to artefact, the pul-monary arterial wedge tracing being only areflected tracing.The assessment of haemodynamic status
immediately after cardioversion has posed aproblem in the present study as it has in mostother series. Depending on the dose ofanaesthetic used for cardioversion and indi-vidual response to it, some patients had com-pletely recovered in 20 to 40 minutes, whereasothers had not. Though every patient wasawake, the majority were feeling a littlesleepy. It is therefore surprising that even inthis state 9 of the i5 cases showed an increasein stroke work index of the left ventricle with-out any increase in mean pulmonary arterialwedge pressure. Three others showed nochange in stroke work, but mean pulmonaryarterial wedge pressure had decreased fromthe control period. Increased stroke workwithout increase in mean left atrial pressureshows the contribution of atrial contraction inthese cases (Braunwald and Frahm, I96I).There is therefore strong evidence to suggestthat mechanical function of the left atriumhad been restored immediately after cardio-version in at least I2 of the I5 cases.An effort to quantitate the apex cardiogram
changes by correlating the height of the 'a'wave to haemodynamic improvement has notbeen successful, as no linear correlation hasbeen found with either cardiac index, strokeindex, or stroke work index. This is not sur-prising, as the apex cardiogram is more of aqualitative record.
It is difficult to explain the differences in thepresent study compared with earlier reports(Logan et al., I965; Ikram et al., I968). If thesuggestion of Ikram et al. (I968) that leftatrial contraction does not appear till 3 to 6days after cardioversion in half of all cases isaccepted, it is very difficult to explain thealmost uniform findings of others (Morris etal., I965; Reale, I965; Killip and Baer, I966;McIntosh, Kong, and Morris, I964; Shapiroand Klein, I968) as well as our own indicatingimmediate haemodynamic improvement aftercardioversion in the majority of the cases andthe reduction of mean left atrial pressure inevery case. A possible explanation for thedifferent findings in the present study may bethe duration of atrial fibrillation. It was morethan 5 years in all the cases of Ikram et al.(I968), but less than 2 years in the majorityof our cases and probably less than 5 years
-,in each case.r Another point worth emphasizing is that inmany of our cases much time and effort wereneeded to bring out clear 'a' waves in the apexcardiogram. In many artefactual and un-
TABLE 4 Atrial activity after cardioversion
Logan Rowlands Ikram Present studyet al. et al. et al.(1965) (I967) (I968)
a in JVP I2/I2a in RA 6/7 I2/13 2/2 I8/I9a in ACG - 5/12 2/4 at I hour
3I/32 at 8 hours36/36 at 24 hours
a in LA or PAW 2/5 5/8 I/2 I3/I6
satisfactory records no 'a' wave was seen, butmore carefully recorded tracings invariablyshowed their presence.
It appears, therefore, that immediatelyafter cardioversion left atrial contraction ispresent in almost every case and the evidenceis in the form of a separate left atrial com-ponent in the oesophageal electrocardiogram,the presence of an 'a' wave in the apex cardio-gram, the presence of an 'a' wave in the pul-monary arterial wedge tracing, though diminu-tive, and improvement in cardiac performanceas judged by higher stroke work index withouthigher pulmonary arterial wedge pressure.Data from this laboratory (Shrivastava,Mathur, and Roy, I97I) show that when theeffect of anaesthesia is over haemodynamicimprovement becomes even more obvious,which may indicate that the quality of leftatrial contraction further improves. It istherefore fair to suggest that with the passageof time the changes in the pattern of leftatrial contraction after cardioversion arequantitative rather than qualitative. There isno true disparity between electrical andmechanical functions of the left atrium at anytime, but it is possible that the force of leftatrial contraction improves with time.
ReferencesBenchimol, A., and Dimond, E. G. (I963). The normal
and abnormal apexcardiogram. AmericanJournal ofCardiology, I2, 368.
Braunwald, E. (I964). Hemodynamic significance ofatrial systole. American3Journal of Medicine, 37, 665.
-, and Frahm, C. J. (I96I). Studies on Starling'slaw of the heart. IV. Observations on the hemo-dynamic functions of the left atrium in man.Circiulation, 24, 633.
Burch, G. E., and Winsor, T. (I966). A Primer ofElectrocardiography, 5th ed., p. I62. Lea andFebiger, Philadelphia.
Corliss, R. J., McKenna, D. H., Crumpton, C. W.,and Rowe, G. G. (I968). Hemodynamic effectsafter conversion of arrhythmias. J'ournal of ClinicalInvestigation, 47, I774.
Dimond, E. G., Duenas, A., and Benchimol, A. (I966).Fundamentals of clinical cardiology. AmericanHeart Journal, 72, I24.
Epstein, E. J., Coulshed, N., Brown, A. K., andDoukas, N. G. (I968). The 'A' wave of the apex
on 28 May 2018 by guest. P
rotected by copyright.http://heart.bm
j.com/
Br H
eart J: first published as 10.1136/hrt.33.2.226 on 1 March 1971. D
ownloaded from
232 Grover, Mathur, Shrivastava, and Roy
cardiogram in aortic valve disease and cardio-myopathy. British Heart Journal, 30, 59I.
Goldman, M. J. (i967). Principles of Clinical Electro-cardiography, 6th ed., p. I3. Lange MedicalPublications, Los Altos, California.
Graettinger, J. S., Carleton, R. A., and Muenster, J. J.(1964). Circulatory consequences of changes incardiac rhythm, produced in patients by trans-thoracic direct-current shock. Journal of ClinicalInvestigation, 43, 2290.
Ikram, H., Nixon, P. G. F., and Arcan, T. (i967).Atrial function following cardioversion. AmericanHeart3'ournal, 74, 729.
- , - , and - (I968). Left atrial function afterelectrical conversion to sinus rhythm. BritishHeart journal, 30, 80.
Killip, T., and Baer, R. A. (I966). Hemodynamiceffects after reversion from atrial fibrillation tosinus rhythm by precordial shock. Journal ofClinical Investigation, 45, 658.
Logan, W. F. W. E., Rowlands, D. J., Howitt, G., andHolmes, A. M. (i965). Left atrial activity followingcardioversion. Lancet, 2, 47I.
Lown, B. (I967). Electrical reversion of cardiacarrhythmias. British Heartjournal, 29, 469.
McIntosh, H. D., Kong, Y., and Morris, J. J., Jr.(I964). Hemodynamic effects of supraventriculararrhythmias. AmericanJournal of Medicine, 37, 7I2.
Macieira-Coelho, E., Alves, M. G., Almiro, H.,Granate, J., and Coelho, E. (I968). Atrial activityfollowing conversion of experimental atrialfibrillation by direct current shock. Acta Cardio-logica, 23, 439.
Massumi, R. A., Sarin, R. K., Tawakkol, A. A., Rios,J. C., and Jackson, H. (I969). Time sequence ofright and left atrial depolarization as a guide to theorigin of the P waves. American J'ournal of Car-diology, 24, 28.
Morris, J. J., Jr., Entman, M., North, W. C., Kong, Y.,and McIntosh, H. (I965). The changes in cardiacoutput with reversion of atrial fibrillation to sinusrhythm. Circulation, 3I, 670.
Nelson, R. M., Jenson, C. B., and Davis, R. W. (I969).
Differential atrial arrhythmias in cardiac surgicalpatients. J7ournal of Thoracic and CardiovascularSurgery, 58, 58I.
Reale, A. (I965). Acute effects of countershock con-version of atrial fibrillation upon right and leftheart hemodynamics. Circulation, 32, 214.
Resnekov, L., and McDonald, L. (I968). Appraisal ofelectroconversion in treatment of cardiac dysrhyth-mias. British Heart Journal, 30, 786.
Rodman, T., Pastor, B. H., and Figueroa, W. (I966).Effect on cardiac output of conversion from atrialfibrillation to normal sinus mechanism. AmericanJ3ournal of Medicine, 41, 249.
Rowlands, D. J., Logan, W. F. W. E., and Howitt, G.(I967). Atrial function after cardioversion. AmericanHeart_Journal, 74, I49.
Roy, S. B., Gadboys, H. L., and Dow, J. W. (I957).Base line for left heart catheterization. AmericanHeart Journal, 54, 753.
Scott, M. E., and Patterson, G. C. (I969). Cardiacoutput after direct current conversion of atrialfibrillation. British Heart_Journal, 3I, 87.
Shapiro, W., and Klein, G. (I968). Alterations incardiac function immediately following electricalconversion of atrial fibrillation to normal sinusrhythm. Circulation, 38, I074.
Shrivastava, S., Mathur, V. S., and Roy, S. B. (I97I).Atrial transport function at rest and duringexercise in cardioverted patients, long term effectsobserved by serial haemodynamic studies. Journalof Clinical Investigation. In the press.
Sutton, G. C., Prewitt, T. A., and Craige, E. (I970).Relationship between quantitated precordial move-ment and left ventricular function. Circulation, 41,I79.
Tafur, E., Cohen, L. S., and Levine, H. D. (I964). Thenormal apex cardiogram. Its temporal relationshipto electrical, acoustic, and mechanical cardiacevents. Circulation, 30, 38I.
Wasir, H. S., Mathur, V. S., Tandon, R., Bhatia,M. L., and Roy, S. B. (I969). Non-synchronouselectrical cardioversion: A preliminary communica-tion. Indian Heart Journal, 21, 293.
on 28 May 2018 by guest. P
rotected by copyright.http://heart.bm
j.com/
Br H
eart J: first published as 10.1136/hrt.33.2.226 on 1 March 1971. D
ownloaded from