Embed Size (px)
Citation preview
BioMed CentralBMC Structural Biology
ss
Open AcceResearch articleComparison of molecular dynamics and superfamily spaces of protein domain deformationJavier A Velázquez-Muriel†1,3, Manuel Rueda†2,4,9, Isabel Cuesta1, Alberto Pascual-Montano5, Modesto Orozco*2,6,7,9 and José-María Carazo*1,8Address: 1Centro Nacional de Biotecnología-CSIC, Campus Universidad Autónoma, 28049 Madrid, Spain, 2Molecular Modeling and Bioinformatics Unit, IRB-BSC Joint Research Program in Computational Biology, Institute for Research in Biomedicine, Josep Samitier 1-5, Barcelona 08028, Spain , 3University of California, San Francisco, Department of Biopharmaceutical Sciences and Pharmaceutical Chemistry, 1700 4th St. UCSF/MC 2552, Byers Hall Room 503, San Francisco, CA 94158-2330, USA, 4The Scripps Research Institute, Department of Molecular Biology, 10550 North Torrey Pines Road, Mail TPC-28, La Jolla, California, 92037, USA, 5Departament Arquitectura de Computadores y Automática, Facultad de Ciencias Físicas, Universidad Complutense, 28040 Madrid, Spain, 6Departament de Bioquímica i Biología Molecular, Facultat de Biología, Universitat de Barcelona, Avgda Diagonal 645, Barcelona 08028, Spain, 7National Institute of Bioinformatics, Parc Científic de Barcelona, Josep Samitier 1-5, Barcelona 08028, Spain, 8National Institute of Bioinformatics, Centro Nacional de Biotecnología, CSIC, Madrid, Spain and 9Barcelona Supercomputing Center, Jordi Girona 29, Barcelona 08034, Spain
Email: Javier A Velázquez-Muriel - [email protected]; Manuel Rueda - [email protected]; Isabel Cuesta - [email protected]; Alberto Pascual-Montano - [email protected]; Modesto Orozco* - [email protected]; José-María Carazo* - [email protected]
* Corresponding authors †Equal contributors
AbstractBackground: It is well known the strong relationship between protein structure and flexibility, onone hand, and biological protein function, on the other hand. Technically, protein flexibilityexploration is an essential task in many applications, such as protein structure prediction andmodeling. In this contribution we have compared two different approaches to explore the flexibilityspace of protein domains: i) molecular dynamics (MD-space), and ii) the study of the structuralchanges within superfamily (SF-space).
Results: Our analysis indicates that the MD-space and the SF-space display a significant overlap,but are still different enough to be considered as complementary. The SF-space space is wider butless complex than the MD-space, irrespective of the number of members in the superfamily. Also,the SF-space does not sample all possibilities offered by the MD-space, but often introduces verylarge changes along just a few deformation modes, whose number tend to a plateau as the numberof related folds in the superfamily increases.
Conclusion: Theoretically, we obtained two conclusions. First, that function restricts the accessto some flexibility patterns to evolution, as we observe that when a superfamily member changesto become another, the path does not completely overlap with the physical deformability. Second,that conformational changes from variation in a superfamily are larger and much simpler than thoseallowed by physical deformability. Methodologically, the conclusion is that both spaces studied arecomplementary, and have different size and complexity. We expect this fact to have application infields as 3D-EM/X-ray hybrid models or ab initio protein folding.
Published: 17 February 2009
BMC Structural Biology 2009, 9:6 doi:10.1186/1472-6807-9-6
Received: 27 October 2008Accepted: 17 February 2009
This article is available from: http://www.biomedcentral.com/1472-6807/9/6
© 2009 Velázquez-Muriel et al; licensee BioMed Central Ltd. This is an Open Access article distributed under the terms of the Creative Commons Attribution License (http://creativecommons.org/licenses/by/2.0), which permits unrestricted use, distribution, and reproduction in any medium, provided the original work is properly cited.
Page 1 of 14(page number not for citation purposes)
BMC Structural Biology 2009, 9:6 http://www.biomedcentral.com/1472-6807/9/6
BackgroundThe central dogma of structural biology asserts that theaminoacid sequence has all the information needed for aprotein to adopt a structure, and that structure determinesfunction. The connection between sequence and structurehas centered a great amount of work and detailed theoriesof protein folding exist [1], but still predicting structure orfunction from sequence is a extremely complex taskexcept in cases of high sequence identity between the tar-get protein and a well annotated homolog [2]. There aremany cases of non-homologous proteins sharing a givenfold or function as well as proteins with reasonably simi-lar sequences having quite different structures.
Flexibility seems to play an important role in proteinfunction, as in many cases movements are key for activity.Unfortunately, still less information exists on this connec-tion between flexibility and function and, specifically,regarding the conformational changes that need to hap-pen in a protein to perform its biological function [3-5].In the very same way as structures that are able to performa specific function are conserved by evolution by not tol-erating mutations that seriously modify that structure, it isplausible to think that mutations disrupting the flexibilitypattern of a given protein are not going to be acceptedeither [3,6-9].
Inspection of structural databases such as SCOP [10],CATH [11] or FSSP [12] shows the existence of super-families of proteins which display very similar folds andare evolutionary related. Analysis of these superfamiliesallows us to determine the structural variation within acommon fold [13,14], thus defining the flexibility of thatfold. Other works, using mostly coarse-grained models[14-17], suggest that, at least for some proteins, the mostimportant deformation modes are preserved withinsuperfamilies, supporting the idea that structural flexibil-ity patterns tend to be conserved. However, these findingsimmediately raise a new question: Are flexibility patternsconserved because if disrupted, the function would belost, or instead, are they conserved because these are theones better tolerant to change? In more precise terms, thefollowing two extreme scenarios, equally reasonable a pri-ori, are possible:
i) If physical deformability is crucial to protein function,conformational changes introduced by sequence modifi-cations will happen as orthogonal as possible to the phys-ical deformation pattern.
ii) The physical deformation pattern traces movementsthat allow quite significant conformational changes with-out disruption of the function(s) associated to a fold.Mutations leading to conformational changes along thispattern of flexibility are going to be better tolerated, as
they won't affect the function. This would suggest a goodoverlap between the physical space studied by MD and theconformational space explored by the members of asuperfamily.
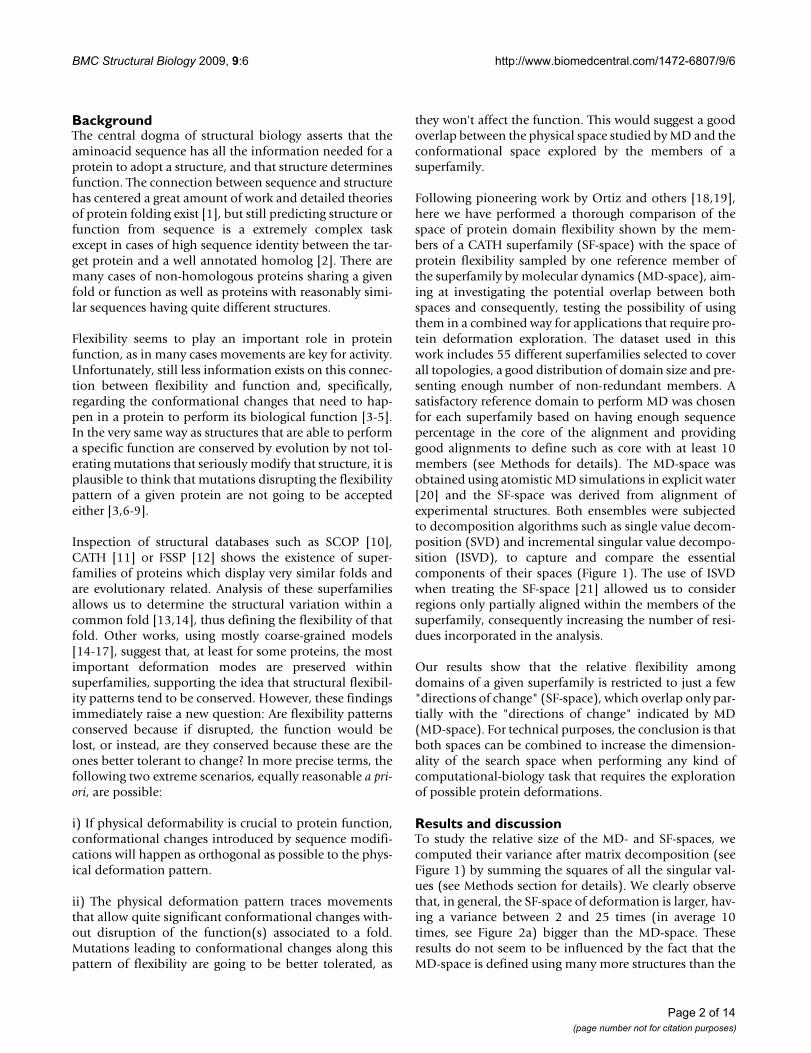
Following pioneering work by Ortiz and others [18,19],here we have performed a thorough comparison of thespace of protein domain flexibility shown by the mem-bers of a CATH superfamily (SF-space) with the space ofprotein flexibility sampled by one reference member ofthe superfamily by molecular dynamics (MD-space), aim-ing at investigating the potential overlap between bothspaces and consequently, testing the possibility of usingthem in a combined way for applications that require pro-tein deformation exploration. The dataset used in thiswork includes 55 different superfamilies selected to coverall topologies, a good distribution of domain size and pre-senting enough number of non-redundant members. Asatisfactory reference domain to perform MD was chosenfor each superfamily based on having enough sequencepercentage in the core of the alignment and providinggood alignments to define such as core with at least 10members (see Methods for details). The MD-space wasobtained using atomistic MD simulations in explicit water[20] and the SF-space was derived from alignment ofexperimental structures. Both ensembles were subjectedto decomposition algorithms such as single value decom-position (SVD) and incremental singular value decompo-sition (ISVD), to capture and compare the essentialcomponents of their spaces (Figure 1). The use of ISVDwhen treating the SF-space [21] allowed us to considerregions only partially aligned within the members of thesuperfamily, consequently increasing the number of resi-dues incorporated in the analysis.
Our results show that the relative flexibility amongdomains of a given superfamily is restricted to just a few"directions of change" (SF-space), which overlap only par-tially with the "directions of change" indicated by MD(MD-space). For technical purposes, the conclusion is thatboth spaces can be combined to increase the dimension-ality of the search space when performing any kind ofcomputational-biology task that requires the explorationof possible protein deformations.
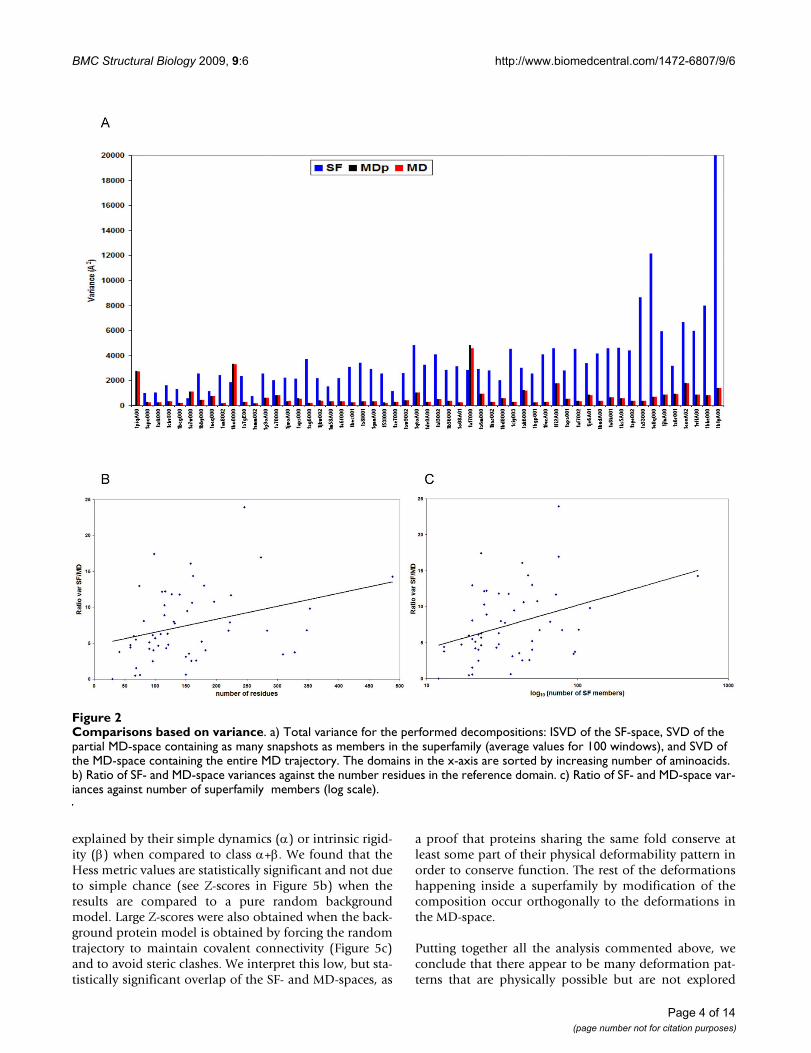
Results and discussionTo study the relative size of the MD- and SF-spaces, wecomputed their variance after matrix decomposition (seeFigure 1) by summing the squares of all the singular val-ues (see Methods section for details). We clearly observethat, in general, the SF-space of deformation is larger, hav-ing a variance between 2 and 25 times (in average 10times, see Figure 2a) bigger than the MD-space. Theseresults do not seem to be influenced by the fact that theMD-space is defined using many more structures than the
Page 2 of 14(page number not for citation purposes)
BMC Structural Biology 2009, 9:6 http://www.biomedcentral.com/1472-6807/9/6
SF-space, since the basic trend is kept when we restrict thecalculations to a partial MD-space (named MDp) with justas many snapshots as experimental structures in thesuperfamily. There are only 3 cases among the 55 super-families analyzed in which this pattern is, without anyclear reason, different (1piqA00, 1bo0000 and 1a17000).We have not found any apparent correlation betweenthese three cases, neither structurally (they are mostly α, βand α, respectively) nor functionally (binding, enzyme,signaling). Interestingly, we do not find any relationshipbetween the variance of the MD-space and the number ofaminoacids of the domain, which can be explained con-sidering that the factors producing more structural varia-bility, such as flexible loops, are not affected by the size ofa domain. On the contrary, the variance of the SF-spaceincreases with the number of aminoacids of the protein(Figure 2a), which is reasonable given the linear relation-ship between protein length and possibilities of variationin composition through mutation. As a consequence ofthis different behavior of variance versus size, a roughincrease in the ratio between SF- and MD-space varianceswith protein size is found (Figure 2b), and the same incre-mental tendency is observed for the variance ratio plottedagainst the number of superfamily members (Figure 2c).
Again, a similar reasoning explains it: a greater size of thesuperfamily implies a parallel increase in the possibilitiesof sequence variation, while it does not affect the varianceof the MD-space.
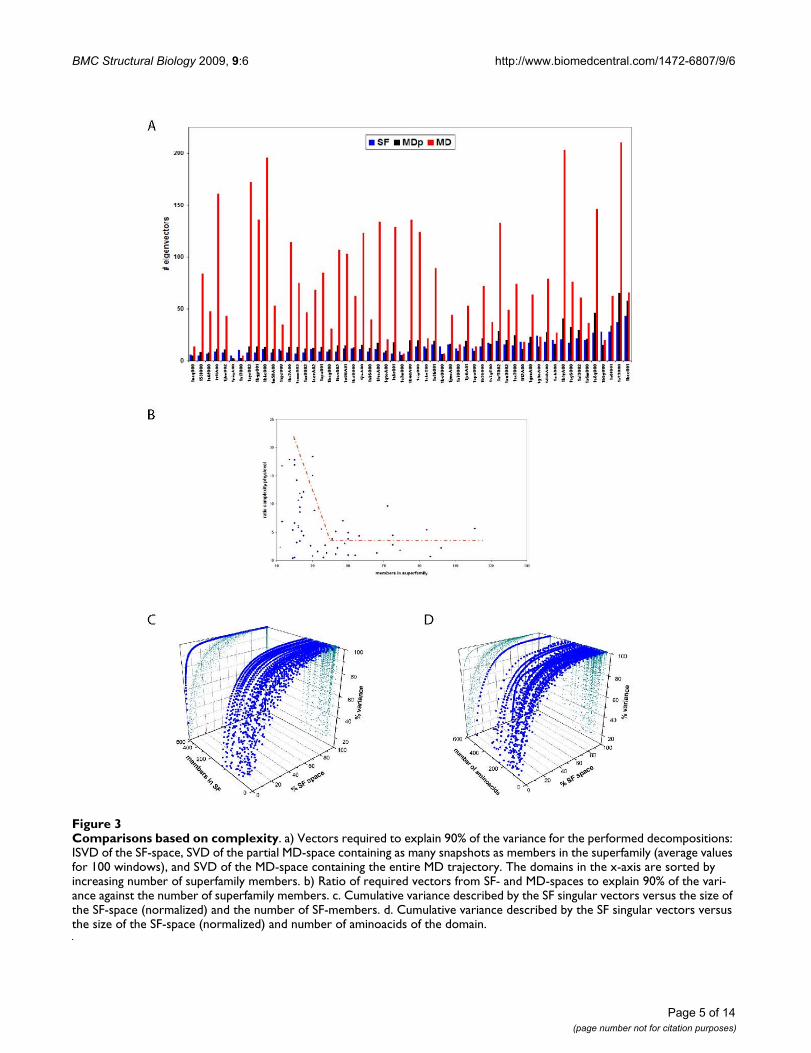
Quite surprisingly, we found that the SF-space is less com-plex (Figure 3a) than the MD one: i.e., it requires a smallernumber of singular vectors to explain a given threshold(90%) of the variance. The difference in complexity (ingeneral a factor of 6) can be partly explained as a naturalconsequence of the fact that microstates that are accessibleto MD are not present among the experimentally resolvedstructures that form a superfamily. However, when we cal-culate the complexity of MDp, we still see that it is largerthan the complexity of SF-space (30% more), indicatingthat is a defined characteristic between the two spaces. Asexpected, the unbalance in complexity between MD- andSF-spaces generally decreases when the number of mem-bers in the superfamily increases (Figure 3b3c and 3d).However, we observe the existence of a threshold around40–50 members after which the ratio of complexitiesremains approximately 3. We interpret this fact as an indi-cation that the superfamily has saturated its possibilitiesto gain complexity in the MD-space with a reasonablysmall number of structures, in other words the "evolu-tionary" deformation space of the superfamily seems to besaturated rather quickly. The other types of deformationmovements present in the MD trajectories seem physicallypossible, but they are not well populated within the exper-imental ensembles of the superfamilies, meaning thatthey have not been tolerated by evolution.
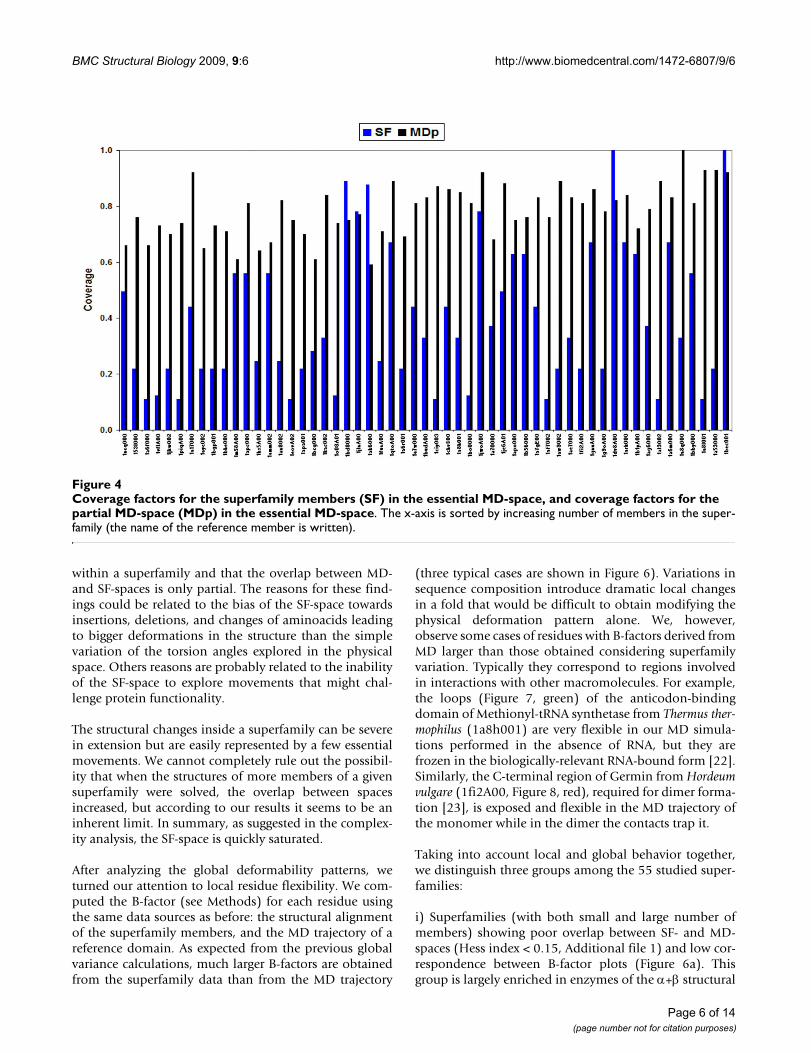
We employed a complementary way to analyze the abilityof a superfamily to cover the MD-space, determining thecoverage of its domains on the essential MD-space, thesubspace defined by the first two MD singular vectors (seeMethods). The results in Figure 4 show that the structuresin the superfamilies do not cover well the essential MD-space, with 70% of them showing 0.5 coverage or lower,and a total average value of 0.4. The limited number ofelements in the superfamilies is not responsible for thismoderate coverage, since MDp covers 80% of the essentialMD-space. Finally, it is worth noting that larger number ofelements in the superfamily does not lead to better abso-lute (versus complete MD-ensemble) or relative (versusreduced MDp-ensemble) coverage (Figure 4), confirmingthat larger superfamilies do not necessarily sample betterthan the smaller ones the physical deformation space.
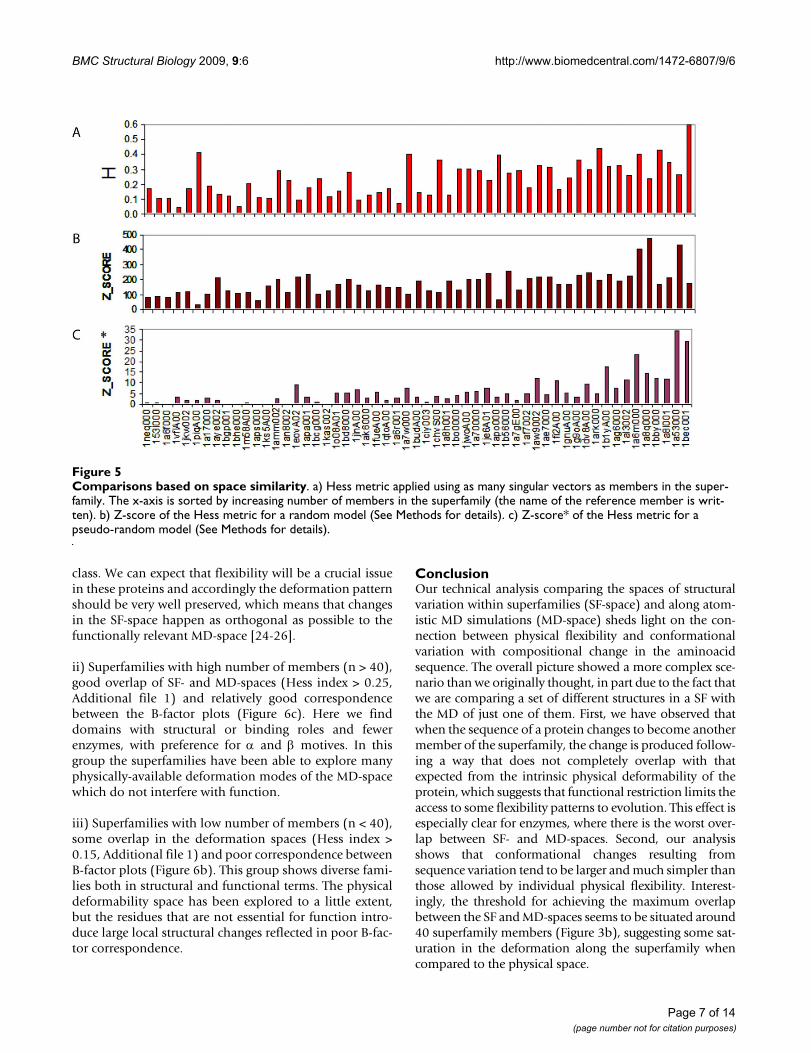
To study the overlap between the SF- and MD-spaces, wecomputed the Hess metric employing as many vectors asmembers in the superfamily (see Methods). In the super-families studied in this work, the Hess metric ranges from0.05 to 0.6, with mean equal to 0.3 (Figure 5a). The bestoverlaps are found for class α and β proteins, which are
Workflow of the comparison between SF and MD-spaces of protein domain deformability done in the studyFigure 1Workflow of the comparison between SF and MD-spaces of protein domain deformability done in the study.
Page 3 of 14(page number not for citation purposes)
BMC Structural Biology 2009, 9:6 http://www.biomedcentral.com/1472-6807/9/6
explained by their simple dynamics (α) or intrinsic rigid-ity (β) when compared to class α+β. We found that theHess metric values are statistically significant and not dueto simple chance (see Z-scores in Figure 5b) when theresults are compared to a pure random backgroundmodel. Large Z-scores were also obtained when the back-ground protein model is obtained by forcing the randomtrajectory to maintain covalent connectivity (Figure 5c)and to avoid steric clashes. We interpret this low, but sta-tistically significant overlap of the SF- and MD-spaces, as
a proof that proteins sharing the same fold conserve atleast some part of their physical deformability pattern inorder to conserve function. The rest of the deformationshappening inside a superfamily by modification of thecomposition occur orthogonally to the deformations inthe MD-space.
Putting together all the analysis commented above, weconclude that there appear to be many deformation pat-terns that are physically possible but are not explored
Comparisons based on varianceFigure 2Comparisons based on variance. a) Total variance for the performed decompositions: ISVD of the SF-space, SVD of the partial MD-space containing as many snapshots as members in the superfamily (average values for 100 windows), and SVD of the MD-space containing the entire MD trajectory. The domains in the x-axis are sorted by increasing number of aminoacids. b) Ratio of SF- and MD-space variances against the number residues in the reference domain. c) Ratio of SF- and MD-space var-iances against number of superfamily members (log scale).
Page 4 of 14(page number not for citation purposes)
BMC Structural Biology 2009, 9:6 http://www.biomedcentral.com/1472-6807/9/6
Page 5 of 14(page number not for citation purposes)
Comparisons based on complexityFigure 3Comparisons based on complexity. a) Vectors required to explain 90% of the variance for the performed decompositions: ISVD of the SF-space, SVD of the partial MD-space containing as many snapshots as members in the superfamily (average values for 100 windows), and SVD of the MD-space containing the entire MD trajectory. The domains in the x-axis are sorted by increasing number of superfamily members. b) Ratio of required vectors from SF- and MD-spaces to explain 90% of the vari-ance against the number of superfamily members. c. Cumulative variance described by the SF singular vectors versus the size of the SF-space (normalized) and the number of SF-members. d. Cumulative variance described by the SF singular vectors versus the size of the SF-space (normalized) and number of aminoacids of the domain.
BMC Structural Biology 2009, 9:6 http://www.biomedcentral.com/1472-6807/9/6
within a superfamily and that the overlap between MD-and SF-spaces is only partial. The reasons for these find-ings could be related to the bias of the SF-space towardsinsertions, deletions, and changes of aminoacids leadingto bigger deformations in the structure than the simplevariation of the torsion angles explored in the physicalspace. Others reasons are probably related to the inabilityof the SF-space to explore movements that might chal-lenge protein functionality.
The structural changes inside a superfamily can be severein extension but are easily represented by a few essentialmovements. We cannot completely rule out the possibil-ity that when the structures of more members of a givensuperfamily were solved, the overlap between spacesincreased, but according to our results it seems to be aninherent limit. In summary, as suggested in the complex-ity analysis, the SF-space is quickly saturated.
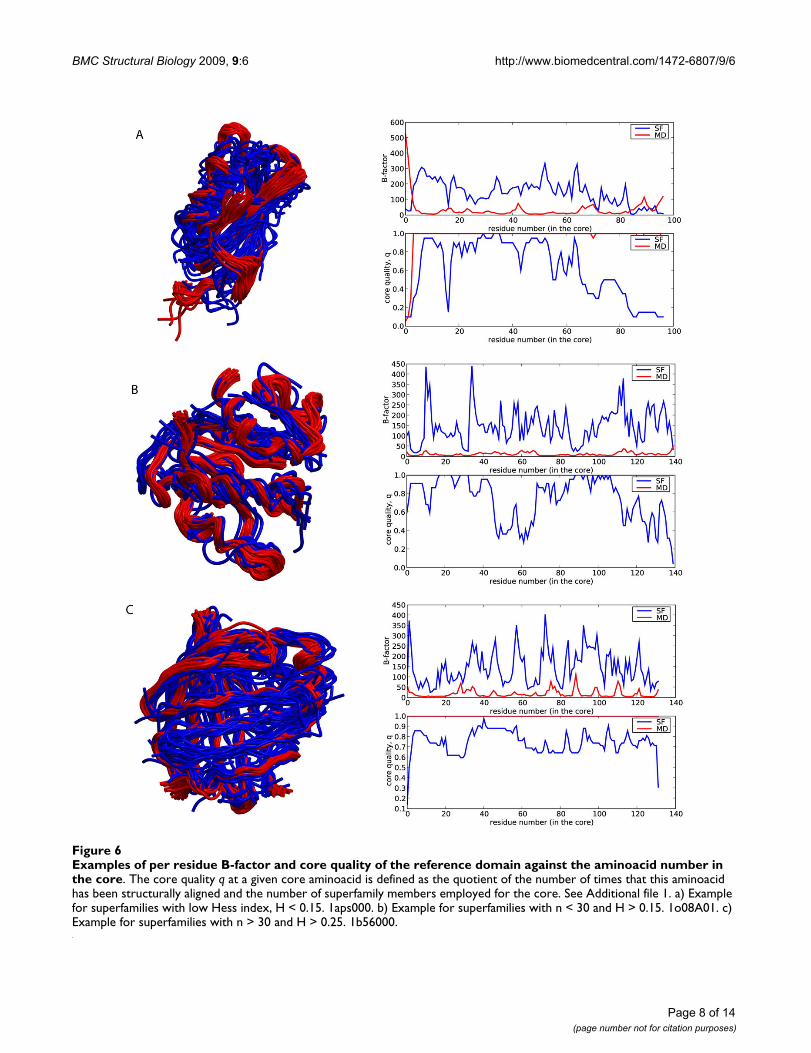
After analyzing the global deformability patterns, weturned our attention to local residue flexibility. We com-puted the B-factor (see Methods) for each residue usingthe same data sources as before: the structural alignmentof the superfamily members, and the MD trajectory of areference domain. As expected from the previous globalvariance calculations, much larger B-factors are obtainedfrom the superfamily data than from the MD trajectory
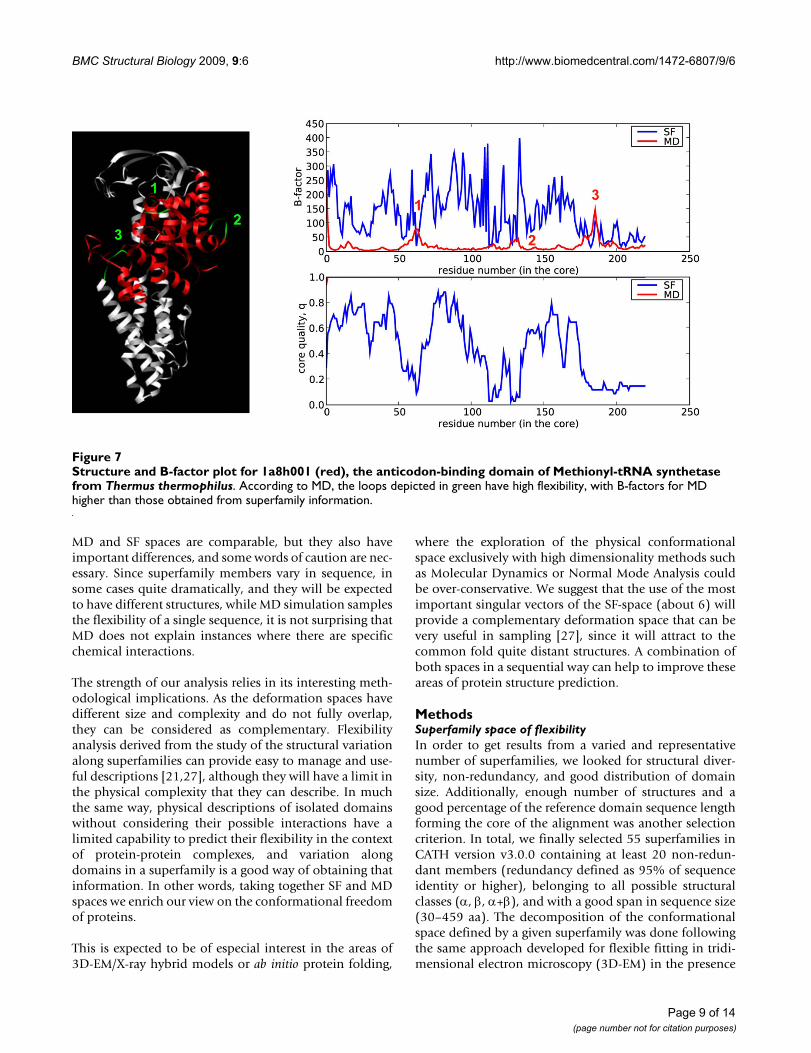
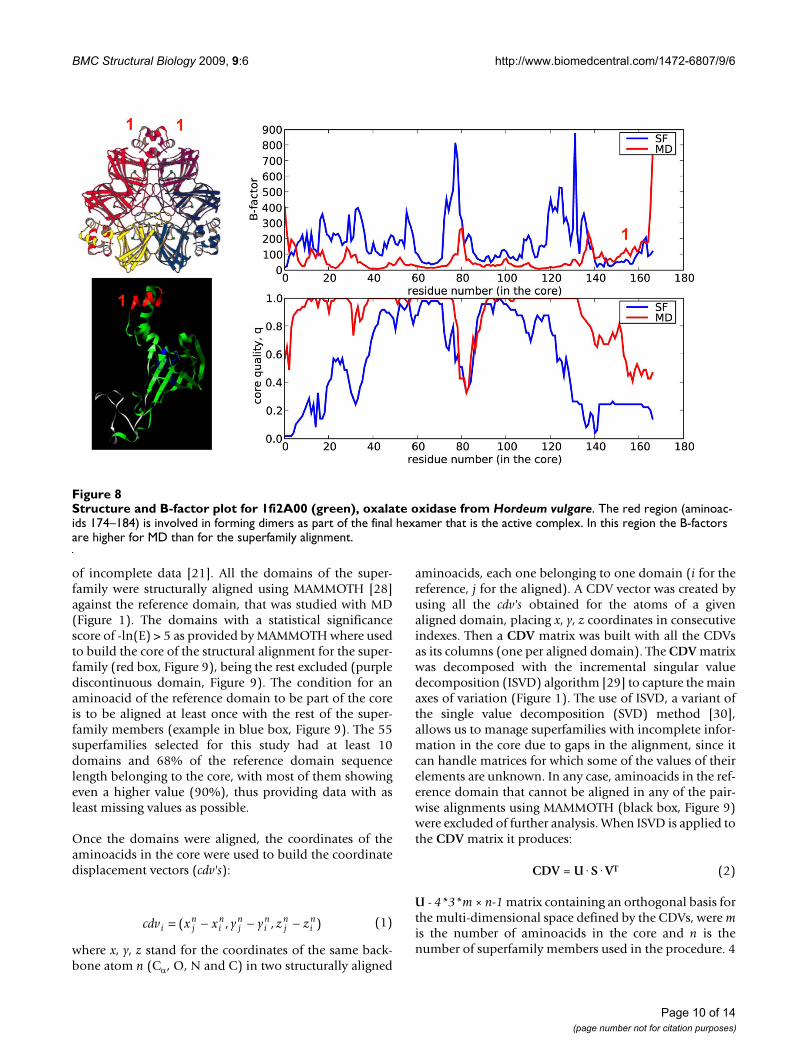
(three typical cases are shown in Figure 6). Variations insequence composition introduce dramatic local changesin a fold that would be difficult to obtain modifying thephysical deformation pattern alone. We, however,observe some cases of residues with B-factors derived fromMD larger than those obtained considering superfamilyvariation. Typically they correspond to regions involvedin interactions with other macromolecules. For example,the loops (Figure 7, green) of the anticodon-bindingdomain of Methionyl-tRNA synthetase from Thermus ther-mophilus (1a8h001) are very flexible in our MD simula-tions performed in the absence of RNA, but they arefrozen in the biologically-relevant RNA-bound form [22].Similarly, the C-terminal region of Germin from Hordeumvulgare (1fi2A00, Figure 8, red), required for dimer forma-tion [23], is exposed and flexible in the MD trajectory ofthe monomer while in the dimer the contacts trap it.
Taking into account local and global behavior together,we distinguish three groups among the 55 studied super-families:
i) Superfamilies (with both small and large number ofmembers) showing poor overlap between SF- and MD-spaces (Hess index < 0.15, Additional file 1) and low cor-respondence between B-factor plots (Figure 6a). Thisgroup is largely enriched in enzymes of the α+β structural
Coverage factors for the superfamily members (SF) in the essential MD-space, and coverage factors for the partial MD-space (MDp) in the essential MD-spaceFigure 4Coverage factors for the superfamily members (SF) in the essential MD-space, and coverage factors for the partial MD-space (MDp) in the essential MD-space. The x-axis is sorted by increasing number of members in the super-family (the name of the reference member is written).
Page 6 of 14(page number not for citation purposes)
BMC Structural Biology 2009, 9:6 http://www.biomedcentral.com/1472-6807/9/6
class. We can expect that flexibility will be a crucial issuein these proteins and accordingly the deformation patternshould be very well preserved, which means that changesin the SF-space happen as orthogonal as possible to thefunctionally relevant MD-space [24-26].
ii) Superfamilies with high number of members (n > 40),good overlap of SF- and MD-spaces (Hess index > 0.25,Additional file 1) and relatively good correspondencebetween the B-factor plots (Figure 6c). Here we finddomains with structural or binding roles and fewerenzymes, with preference for α and β motives. In thisgroup the superfamilies have been able to explore manyphysically-available deformation modes of the MD-spacewhich do not interfere with function.
iii) Superfamilies with low number of members (n < 40),some overlap in the deformation spaces (Hess index >0.15, Additional file 1) and poor correspondence betweenB-factor plots (Figure 6b). This group shows diverse fami-lies both in structural and functional terms. The physicaldeformability space has been explored to a little extent,but the residues that are not essential for function intro-duce large local structural changes reflected in poor B-fac-tor correspondence.
ConclusionOur technical analysis comparing the spaces of structuralvariation within superfamilies (SF-space) and along atom-istic MD simulations (MD-space) sheds light on the con-nection between physical flexibility and conformationalvariation with compositional change in the aminoacidsequence. The overall picture showed a more complex sce-nario than we originally thought, in part due to the fact thatwe are comparing a set of different structures in a SF withthe MD of just one of them. First, we have observed thatwhen the sequence of a protein changes to become anothermember of the superfamily, the change is produced follow-ing a way that does not completely overlap with thatexpected from the intrinsic physical deformability of theprotein, which suggests that functional restriction limits theaccess to some flexibility patterns to evolution. This effect isespecially clear for enzymes, where there is the worst over-lap between SF- and MD-spaces. Second, our analysisshows that conformational changes resulting fromsequence variation tend to be larger and much simpler thanthose allowed by individual physical flexibility. Interest-ingly, the threshold for achieving the maximum overlapbetween the SF and MD-spaces seems to be situated around40 superfamily members (Figure 3b), suggesting some sat-uration in the deformation along the superfamily whencompared to the physical space.
Comparisons based on space similarityFigure 5Comparisons based on space similarity. a) Hess metric applied using as many singular vectors as members in the super-family. The x-axis is sorted by increasing number of members in the superfamily (the name of the reference member is writ-ten). b) Z-score of the Hess metric for a random model (See Methods for details). c) Z-score* of the Hess metric for a pseudo-random model (See Methods for details).
Page 7 of 14(page number not for citation purposes)
BMC Structural Biology 2009, 9:6 http://www.biomedcentral.com/1472-6807/9/6
Page 8 of 14(page number not for citation purposes)
Examples of per residue B-factor and core quality of the reference domain against the aminoacid number in the coreFigure 6Examples of per residue B-factor and core quality of the reference domain against the aminoacid number in the core. The core quality q at a given core aminoacid is defined as the quotient of the number of times that this aminoacid has been structurally aligned and the number of superfamily members employed for the core. See Additional file 1. a) Example for superfamilies with low Hess index, H < 0.15. 1aps000. b) Example for superfamilies with n < 30 and H > 0.15. 1o08A01. c) Example for superfamilies with n > 30 and H > 0.25. 1b56000.
BMC Structural Biology 2009, 9:6 http://www.biomedcentral.com/1472-6807/9/6
MD and SF spaces are comparable, but they also haveimportant differences, and some words of caution are nec-essary. Since superfamily members vary in sequence, insome cases quite dramatically, and they will be expectedto have different structures, while MD simulation samplesthe flexibility of a single sequence, it is not surprising thatMD does not explain instances where there are specificchemical interactions.
The strength of our analysis relies in its interesting meth-odological implications. As the deformation spaces havedifferent size and complexity and do not fully overlap,they can be considered as complementary. Flexibilityanalysis derived from the study of the structural variationalong superfamilies can provide easy to manage and use-ful descriptions [21,27], although they will have a limit inthe physical complexity that they can describe. In muchthe same way, physical descriptions of isolated domainswithout considering their possible interactions have alimited capability to predict their flexibility in the contextof protein-protein complexes, and variation alongdomains in a superfamily is a good way of obtaining thatinformation. In other words, taking together SF and MDspaces we enrich our view on the conformational freedomof proteins.
This is expected to be of especial interest in the areas of3D-EM/X-ray hybrid models or ab initio protein folding,
where the exploration of the physical conformationalspace exclusively with high dimensionality methods suchas Molecular Dynamics or Normal Mode Analysis couldbe over-conservative. We suggest that the use of the mostimportant singular vectors of the SF-space (about 6) willprovide a complementary deformation space that can bevery useful in sampling [27], since it will attract to thecommon fold quite distant structures. A combination ofboth spaces in a sequential way can help to improve theseareas of protein structure prediction.
MethodsSuperfamily space of flexibilityIn order to get results from a varied and representativenumber of superfamilies, we looked for structural diver-sity, non-redundancy, and good distribution of domainsize. Additionally, enough number of structures and agood percentage of the reference domain sequence lengthforming the core of the alignment was another selectioncriterion. In total, we finally selected 55 superfamilies inCATH version v3.0.0 containing at least 20 non-redun-dant members (redundancy defined as 95% of sequenceidentity or higher), belonging to all possible structuralclasses (α, β, α+β), and with a good span in sequence size(30–459 aa). The decomposition of the conformationalspace defined by a given superfamily was done followingthe same approach developed for flexible fitting in tridi-mensional electron microscopy (3D-EM) in the presence
Structure and B-factor plot for 1a8h001 (red), the anticodon-binding domain of Methionyl-tRNA synthetase from Thermus ther-mophilusFigure 7Structure and B-factor plot for 1a8h001 (red), the anticodon-binding domain of Methionyl-tRNA synthetase from Thermus thermophilus. According to MD, the loops depicted in green have high flexibility, with B-factors for MD higher than those obtained from superfamily information.
Page 9 of 14(page number not for citation purposes)
BMC Structural Biology 2009, 9:6 http://www.biomedcentral.com/1472-6807/9/6
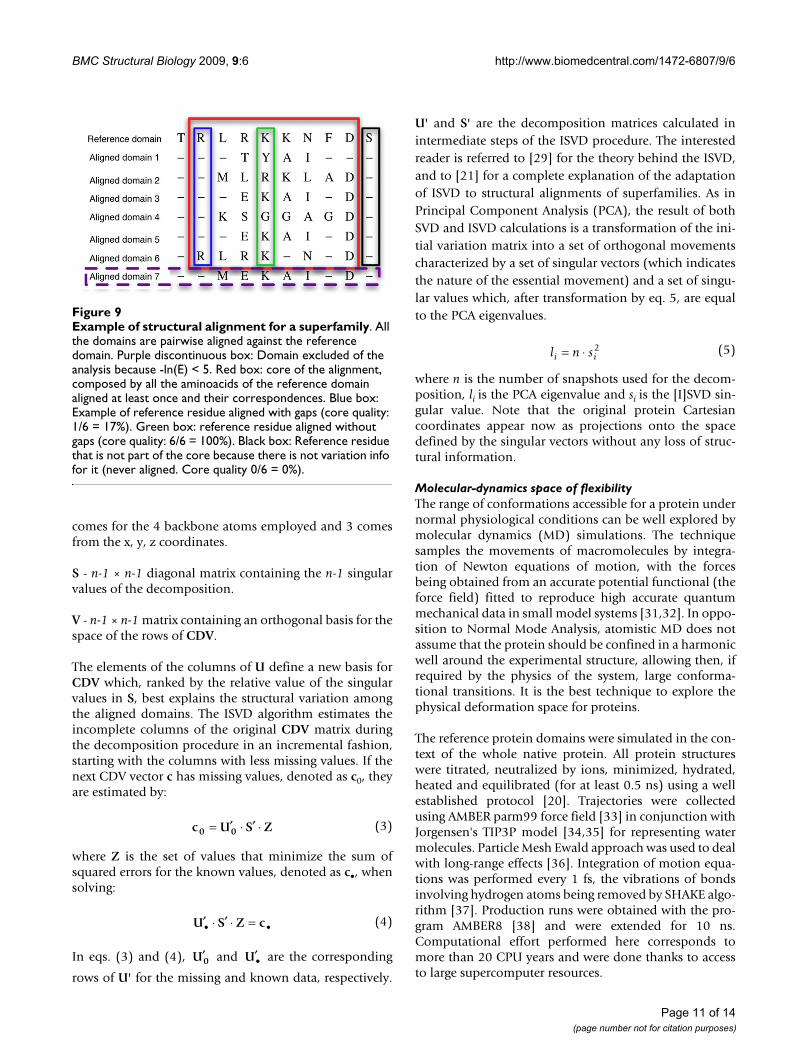
of incomplete data [21]. All the domains of the super-family were structurally aligned using MAMMOTH [28]against the reference domain, that was studied with MD(Figure 1). The domains with a statistical significancescore of -ln(E) > 5 as provided by MAMMOTH where usedto build the core of the structural alignment for the super-family (red box, Figure 9), being the rest excluded (purplediscontinuous domain, Figure 9). The condition for anaminoacid of the reference domain to be part of the coreis to be aligned at least once with the rest of the super-family members (example in blue box, Figure 9). The 55superfamilies selected for this study had at least 10domains and 68% of the reference domain sequencelength belonging to the core, with most of them showingeven a higher value (90%), thus providing data with asleast missing values as possible.
Once the domains were aligned, the coordinates of theaminoacids in the core were used to build the coordinatedisplacement vectors (cdv's):
where x, y, z stand for the coordinates of the same back-bone atom n (Cα, O, N and C) in two structurally aligned
aminoacids, each one belonging to one domain (i for thereference, j for the aligned). A CDV vector was created byusing all the cdv's obtained for the atoms of a givenaligned domain, placing x, y, z coordinates in consecutiveindexes. Then a CDV matrix was built with all the CDVsas its columns (one per aligned domain). The CDV matrixwas decomposed with the incremental singular valuedecomposition (ISVD) algorithm [29] to capture the mainaxes of variation (Figure 1). The use of ISVD, a variant ofthe single value decomposition (SVD) method [30],allows us to manage superfamilies with incomplete infor-mation in the core due to gaps in the alignment, since itcan handle matrices for which some of the values of theirelements are unknown. In any case, aminoacids in the ref-erence domain that cannot be aligned in any of the pair-wise alignments using MAMMOTH (black box, Figure 9)were excluded of further analysis. When ISVD is applied tothe CDV matrix it produces:
CDV = U·S·VT (2)
U - 4*3*m × n-1 matrix containing an orthogonal basis forthe multi-dimensional space defined by the CDVs, were mis the number of aminoacids in the core and n is thenumber of superfamily members used in the procedure. 4
cdv x x y y z zi jn
in
jn
in
jn
in= − − −( , , ) (1)
Structure and B-factor plot for 1fi2A00 (green), oxalate oxidase from Hordeum vulgareFigure 8Structure and B-factor plot for 1fi2A00 (green), oxalate oxidase from Hordeum vulgare. The red region (aminoac-ids 174–184) is involved in forming dimers as part of the final hexamer that is the active complex. In this region the B-factors are higher for MD than for the superfamily alignment.
Page 10 of 14(page number not for citation purposes)
BMC Structural Biology 2009, 9:6 http://www.biomedcentral.com/1472-6807/9/6
comes for the 4 backbone atoms employed and 3 comesfrom the x, y, z coordinates.
S - n-1 × n-1 diagonal matrix containing the n-1 singularvalues of the decomposition.
V - n-1 × n-1 matrix containing an orthogonal basis for thespace of the rows of CDV.
The elements of the columns of U define a new basis forCDV which, ranked by the relative value of the singularvalues in S, best explains the structural variation amongthe aligned domains. The ISVD algorithm estimates theincomplete columns of the original CDV matrix duringthe decomposition procedure in an incremental fashion,starting with the columns with less missing values. If thenext CDV vector c has missing values, denoted as c0, theyare estimated by:
where Z is the set of values that minimize the sum ofsquared errors for the known values, denoted as c•, whensolving:
In eqs. (3) and (4), and are the corresponding
rows of U' for the missing and known data, respectively.
U' and S' are the decomposition matrices calculated inintermediate steps of the ISVD procedure. The interestedreader is referred to [29] for the theory behind the ISVD,and to [21] for a complete explanation of the adaptationof ISVD to structural alignments of superfamilies. As inPrincipal Component Analysis (PCA), the result of bothSVD and ISVD calculations is a transformation of the ini-tial variation matrix into a set of orthogonal movementscharacterized by a set of singular vectors (which indicatesthe nature of the essential movement) and a set of singu-lar values which, after transformation by eq. 5, are equalto the PCA eigenvalues.
where n is the number of snapshots used for the decom-position, li is the PCA eigenvalue and si is the [I]SVD sin-gular value. Note that the original protein Cartesiancoordinates appear now as projections onto the spacedefined by the singular vectors without any loss of struc-tural information.
Molecular-dynamics space of flexibilityThe range of conformations accessible for a protein undernormal physiological conditions can be well explored bymolecular dynamics (MD) simulations. The techniquesamples the movements of macromolecules by integra-tion of Newton equations of motion, with the forcesbeing obtained from an accurate potential functional (theforce field) fitted to reproduce high accurate quantummechanical data in small model systems [31,32]. In oppo-sition to Normal Mode Analysis, atomistic MD does notassume that the protein should be confined in a harmonicwell around the experimental structure, allowing then, ifrequired by the physics of the system, large conforma-tional transitions. It is the best technique to explore thephysical deformation space for proteins.
The reference protein domains were simulated in the con-text of the whole native protein. All protein structureswere titrated, neutralized by ions, minimized, hydrated,heated and equilibrated (for at least 0.5 ns) using a wellestablished protocol [20]. Trajectories were collectedusing AMBER parm99 force field [33] in conjunction withJorgensen's TIP3P model [34,35] for representing watermolecules. Particle Mesh Ewald approach was used to dealwith long-range effects [36]. Integration of motion equa-tions was performed every 1 fs, the vibrations of bondsinvolving hydrogen atoms being removed by SHAKE algo-rithm [37]. Production runs were obtained with the pro-gram AMBER8 [38] and were extended for 10 ns.Computational effort performed here corresponds tomore than 20 CPU years and were done thanks to accessto large supercomputer resources.
c U S Z0 0= ′ ⋅ ′ ⋅ (3)
′ ⋅ ′ ⋅ =• •U S Z c (4)
′U0 ′•U
l n si i= ⋅ 2 (5)
Example of structural alignment for a superfamilyFigure 9Example of structural alignment for a superfamily. All the domains are pairwise aligned against the reference domain. Purple discontinuous box: Domain excluded of the analysis because -ln(E) < 5. Red box: core of the alignment, composed by all the aminoacids of the reference domain aligned at least once and their correspondences. Blue box: Example of reference residue aligned with gaps (core quality: 1/6 = 17%). Green box: reference residue aligned without gaps (core quality: 6/6 = 100%). Black box: Reference residue that is not part of the core because there is not variation info for it (never aligned. Core quality 0/6 = 0%).
Page 11 of 14(page number not for citation purposes)
BMC Structural Biology 2009, 9:6 http://www.biomedcentral.com/1472-6807/9/6
Statistical descriptors for comparisonThe MD and SF-spaces were subjected, for comparisonpurposes, to a modified version of the essential dynamicsprocedure [39] using SVD (with MD-space) and ISVD(with SF-space) decompositions. Many comparisons canbe easily made using the singular vectors and values pro-vided by the decomposition algorithms:
1) The size of deformability space was measured by the vari-ance in MD or superfamily ensembles, summing thesquare of the singular values obtained after the decompo-sition. To avoid bias related to the limited number ofstructures in most superfamilies, the analysis of MD vari-ance was repeated also using as many equally spaced MDsnapshots as superfamily members (partial-MD space;MDp). The average values for 100 windows were com-puted.
2) The complexity of the deformability space was determinedby the number of singular vectors needed to explain 90%of the variance.
3) The overlap between the SF- and MD-spaces was deter-mined using the Hess metric [40] and associated Z-score(eqs. 6 and 7; [41]).
where X and Y stand for the two methods, the indexes iand j stand for the orders of the eigenvectors (rankedaccording to their contribution to the structural variance),and n stands for the number of superfamily members.
Pure random models were obtained by decomposition ofa pseudo-covariance matrix obtained by random permu-tation of the backbone atoms for each snapshot in a tra-jectory, and the standard deviation (std) was obtained byconsidering 500 different pseudo-covariance matrices.
Additional Z-scores* (labeled with * to avoid confusionwith previous Z-scores derived from purely random mod-els) showing the relevance of the values for H in a morechemically sound environment were computed frommodels where the chemical connectivity was maintainedand steric collapses were avoided. For this purpose, weperformed several 10 ns discrete dynamics simulations foreach protein with a simplified force-field defined by cov-alent bonds plus a hard sphere potential for each atom[42]. Essential dynamics from these trajectories providedsets of singular vectors being representative from random
movements but still consistent with the basic physics ofthe protein. The standard deviations needed for Z-scorecalculations were evaluated from independent discretedynamics simulations.
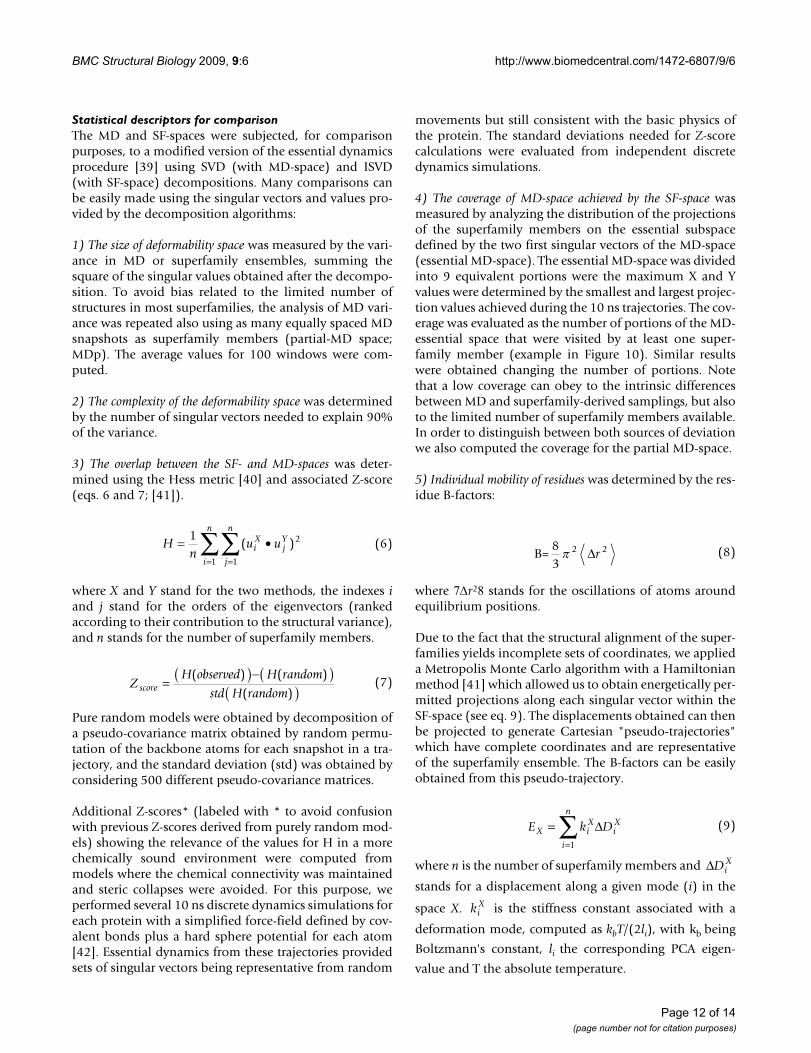
4) The coverage of MD-space achieved by the SF-space wasmeasured by analyzing the distribution of the projectionsof the superfamily members on the essential subspacedefined by the two first singular vectors of the MD-space(essential MD-space). The essential MD-space was dividedinto 9 equivalent portions were the maximum X and Yvalues were determined by the smallest and largest projec-tion values achieved during the 10 ns trajectories. The cov-erage was evaluated as the number of portions of the MD-essential space that were visited by at least one super-family member (example in Figure 10). Similar resultswere obtained changing the number of portions. Notethat a low coverage can obey to the intrinsic differencesbetween MD and superfamily-derived samplings, but alsoto the limited number of superfamily members available.In order to distinguish between both sources of deviationwe also computed the coverage for the partial MD-space.
5) Individual mobility of residues was determined by the res-idue B-factors:
where 7Δr28 stands for the oscillations of atoms aroundequilibrium positions.
Due to the fact that the structural alignment of the super-families yields incomplete sets of coordinates, we applieda Metropolis Monte Carlo algorithm with a Hamiltonianmethod [41] which allowed us to obtain energetically per-mitted projections along each singular vector within theSF-space (see eq. 9). The displacements obtained can thenbe projected to generate Cartesian "pseudo-trajectories"which have complete coordinates and are representativeof the superfamily ensemble. The B-factors can be easilyobtained from this pseudo-trajectory.
where n is the number of superfamily members and
stands for a displacement along a given mode (i) in the
space X. is the stiffness constant associated with a
deformation mode, computed as kbT/(2li), with kb being
Boltzmann's constant, li the corresponding PCA eigen-
value and T the absolute temperature.
Hn
u uiX
jY
j
n
i
n
= •==
∑∑1 2
11
( ) (6)
ZH observed H random
std H randomscore = ( )−( )( )
( ) ( )
( )(7)
B=83
2p Δr 2 (8)
E k DX iX
iX
i
n
==∑ Δ
1
(9)
ΔDiX
kiX
Page 12 of 14(page number not for citation purposes)
BMC Structural Biology 2009, 9:6 http://www.biomedcentral.com/1472-6807/9/6
Page 13 of 14
Competing interestsThe authors declare that they have no competing interests.
Authors' contributionsJAVM designed the experiments, performed the analysis ofsuperfamily and MD data with SVD/ISVD algorithms,analyzed results and wrote the manuscript. MR designedthe experiments, provided the MD simulations, comparedthe SF and MD-spaces, analyzed results and wrote themanuscript. JAVM and MR should be considered at thesame level of authorship. IC analyzed results, obtainedthe biological examples, and revised the manuscript. APManalyzed results and provided help and discussion withdecomposition algorithms. MO and JMC designed exper-iments, analyzed results and wrote the manuscript. Allauthors read and approved the final manuscript.
Additional material
AcknowledgementsThe authors thank Tim Meyer for helpful suggestions. This work was par-tially funded by the European Union (FP6-502828 and UE-512092), the USA National Institutes of Health (HL740472), the Spanish Comisión Intermin-isterial de Ciencia y Tecnología (BIO2007-67150-C03-01, BIO2007-67150-C03-03, BIO2006-01602, CONSOLIDER CSD2006-23, CONSOLIDER CSDooC-06.0892), the Spanish Ministry of Health (COMBIOMED RD07/0067/0009), the Government of Madrid (S-Gen-0166/2006), the National Institute of Bioinformatics (a project of Genoma España), and the Fundación Marcelino Botín. JAVM and MR are supported by a MEC Postdoctoral Fel-lowship, IC is supported by a Spanish Postdoctoral Fellowship (FIS-CD07/00131) and APM is supported by the Spanish Ramón y Cajal program. We acknowledge the Barcelona Supercomputing Center for providing us with computer resources.
References1. Shea JE, Brooks CL 3rd: From folding theories to folding pro-
teins: a review and assessment of simulation studies of pro-tein folding and unfolding. Annu Rev Phys Chem 2001, 52:499-535.
2. Rost B: Twilight zone of protein sequence alignments. ProteinEng 1999, 12(2):85-94.
3. Gerstein M, Krebs W: A database of macromolecular motions.Nucleic Acids Res 1998, 26(18):4280-4290.
4. Gerstein M, Lesk AM, Chothia C: Structural Mechanisms forDomain Movements in Proteins. Biochemistry 1994,33(22):6739-6749.
5. Goh C-S, Milburn D, Gerstein M: Conformational changes asso-ciated with protein-protein interactions. Curr Opin Struct Biol2004, 14:104-109.
6. Qian B, Ortiz AR, Baker D: Improvement of comparative modelaccuracy by free-energy optimization along principal com-ponents of natural structural variation. Proc Natl Acad Sci USA2004, 101(43):15346-15351.
Additional file 1Table of the domains and superfamilies employed for this study. Table of the domains and superfamilies employed for this study, with their func-tion and structural class. The domains are sorted by the similarity between the SF- and MD-spaces according to the Hess metric.Click here for file[http://www.biomedcentral.com/content/supplementary/1472-6807-9-6-S1.doc]
Example of coverage of the essential MD-space achieved by SF-spaceFigure 10Example of coverage of the essential MD-space achieved by SF-space. The limits of the essential MD-space were determined by the smallest and largest projection values achieved during 10 ns trajectories (10000 structures, red). The essen-tial MD-space was divided in 9 equivalent portions and coverage was evaluated as the number of portions of the essential MD-space visited by at least one superfamily structure (blue).
(page number not for citation purposes)
BMC Structural Biology 2009, 9:6 http://www.biomedcentral.com/1472-6807/9/6
Publish with BioMed Central and every scientist can read your work free of charge
"BioMed Central will be the most significant development for disseminating the results of biomedical research in our lifetime."
Sir Paul Nurse, Cancer Research UK
Your research papers will be:
available free of charge to the entire biomedical community
peer reviewed and published immediately upon acceptance
cited in PubMed and archived on PubMed Central
yours — you keep the copyright
Submit your manuscript here:http://www.biomedcentral.com/info/publishing_adv.asp
BioMedcentral
7. Goldstein RA: The structure of protein evolution and the evo-lution of protein structure. Curr Opin Struct Biol 2008,18(2):170-177.
8. Daniel RM, Dumm RV, Finney JL, Smith JC: The role of dynamicsin enzyme activity. Annual Review Biophysics and Biomolecular Struc-ture 2003, 32:69-92.
9. Kuhlman B, Baker D: Native protein sequences are close tooptimal for their structures. Proc Natl Acad Sci USA 2000,97(19):10383-10388.
10. Andreeva A, Howorth D, Chandonia JM, Brenner SE, Hubbard TJ,Chothia C, Murzin AG: Data growth and its impact on theSCOP database: new developments. Nucleic Acids Res2008:D419-425.
11. Pearl F, Todd A, Sillitoe I, Dibley M, Redfern O, Lewis T, Bennett C,Marsden R, Grant A, Lee D, et al.: The CATH Domain StructureDatabase and related resources Gene3D and DHS providecomprehensive domain family information for genome anal-ysis. Nucleic Acids Res 2005:D247-251.
12. Holm L, Ouzounis C, Sander C, Tuparev G, Vriend G: A databaseof protein structure families with common folding motifs.Protein Sci 1992, 1(12):1691-1698.
13. Flores TP, Orengo CA, Moss DS, Thornton JM: Comparison ofconformational characteristics in structurally similar proteinpairs. Protein Sci 1993, 2(11):1811-1826.
14. Pang A, Arinaminpathy Y, Sansom MS, Biggin PC: Comparativemolecular dynamics – similar folds and similar motions? Pro-teins 2005, 61(4):809-822.
15. Maguid S, Fernandez-Alberti S, Ferrelli L, Echave J: Exploring thecommon dynamics of homologous proteins. Application tothe globin family. Biophysical journal 2005, 89(1):3-13.
16. Maguid S, Fernandez-Alberti S, Echave J: Evolutionary conserva-tion of protein vibrational dynamics. Gene 2008.
17. Maguid S, Fernandez-Alberti S, Parisi G, Echave J: Evolutionary con-servation of protein backbone flexibility. Journal of molecularevolution 2006, 63(4):448-457.
18. Leo-Macias A, Lopez-Romero P, Lupyan D, Zerbino D, Ortiz AR: Ananalysis of core deformations in protein superfamilies. Bio-physical journal 2005, 88(2):1291-1299.
19. Leo-Macias A, Lopez-Romero P, Lupyan D, Zerbino D, Ortiz AR:Core deformations in protein families: a physical perspec-tive. Biophys Chem 2005, 115(2–3):125-128.
20. Rueda M, Ferrer-Costa C, Meyer T, Perez A, Camps J, Hospital A,Gelpi JL, Orozco M: A consensus view of protein dynamics. ProcNatl Acad Sci USA 2007, 104(3):796-801.
21. Velazquez-Muriel JA, Carazo JM: Flexible fitting in 3D-EM withincomplete data on superfamily variability. J Struct Biol 2007,158(2):165-181.
22. Sugiura I, Nureki O, Ugaji-Yoshikawa Y, Kuwabara S, Shimada A,Tateno M, Lorber B, Giege R, Moras D, Yokoyama S, et al.: The 2.0A crystal structure of Thermus thermophilus methionyl-tRNA synthetase reveals two RNA-binding modules. Struc-ture 2000, 8(2):197-208.
23. Woo EJ, Dunwell JM, Goodenough PW, Marvier AC, Pickersgill RW:Germin is a manganese containing homohexamer withoxalate oxidase and superoxide dismutase activities. NatStruct Biol 2000, 7(11):1036-1040.
24. Henzler-Wildman K, Kern D: Dynamic personalities of proteins.Nature 2007, 450(7172):964-972.
25. Henzler-Wildman KA, Lei M, Thai V, Kerns SJ, Karplus M, Kern D: Ahierarchy of timescales in protein dynamics is linked toenzyme catalysis. Nature 2007, 450(7171):913-916.
26. Henzler-Wildman KA, Thai V, Lei M, Ott M, Wolf-Watz M, Fenn T,Pozharski E, Wilson MA, Petsko GA, Karplus M, et al.: Intrinsicmotions along an enzymatic reaction trajectory. Nature 2007,450(7171):838-844.
27. Velazquez-Muriel JA, Valle M, Santamaria-Pang A, Kakadiaris IA,Carazo JM: Flexible fitting in 3D-EM guided by the structuralvariability of protein superfamilies. Structure 2006,14(7):1115-1126.
28. Ortiz AR, Strauss CE, Olmea O: MAMMOTH (matching molec-ular models obtained from theory): an automated methodfor model comparison. Protein Sci 2002, 11(11):2606-2621.
29. Brand ME: Incremental Singular Value Decomposition ofUncertain Data with Missing Values. In Lecture Notes in Compu-ter Science Volume 2350. European Conference on Computer Vision(ECCV); 2002:707-720.
30. Press WH, Flannery BP, Teukolsky SA, Vetterling WT: NumericalRecipes in C: The Art of Scientific Computing. 1st edition. UK:Cambridge University Press; 1988.
31. Karplus M, Kuriyan J: Molecular dynamics and protein function.Proc Natl Acad Sci USA 2005, 102(19):6679-6685.
32. Karplus M: Molecular dynamics of biological macromolecules:A brief history and perspective. Biopolymers 2003,68(3):350-358.
33. Cornell WD, Cieplak P, Bayly CI, Gould IR, Merz KM Jr, FergusonDM, Spellmeyer DC, Fox T, Caldwell JW, Kollman PA: A SecondGeneration Force Field for the Simulation of Proteins,Nucleic Acids, and Organic Molecules. Journal of the AmericanChemical Society 1995, 117(19):5179-5197.
34. Jorgensen WL, Chandrasekhar J, Madura JD, Impey RW, Klein ML:Comparison of simple potential functions for simulating liq-uid water. Journal of Chemical Physics 1983, 79(2):926-935.
35. Mahoney MW, Jorgensen WL: A five-site model for liquid waterand the reproduction of the density anomaly by rigid, nonpo-larizable potential functions. Journal of Chemical Physics 2000,112(20):8910-8922.
36. Darden TL, York D, Pedersen L: Particle Mesh Ewald: AN N-log(N) method for Ewald sums in large systems. Journal ofChemical Physics 1993, 98:10089-10092.
37. Andersen HC: Rattle: a velocity version of the SHAKE algo-rithm for molecular dynamics calculations. Journal of Computa-tional Physics 1983, 52:24-34.
38. Case DA, Cheatham TE 3rd, Darden T, Gohlke H, Luo R, Merz KMJr, Onufriev A, Simmerling C, Wang B, Woods RJ: The Amber bio-molecular simulation programs. J Comput Chem 2005,26(16):1668-1688.
39. Amadei A, Linssen AB, Berendsen HJ: Essential dynamics of pro-teins. Proteins 1993, 17(4):412-425.
40. Hess B: Similarities between principal components of proteindynamics and random diffusion. Phys Rev E Stat Phys Plasmas Flu-ids Relat Interdiscip Topics 2000, 62(6 Pt B):8438-8448.
41. Rueda M, Chacon P, Orozco M: Thorough Validation of ProteinNormal Mode Analysis: A Comparative Study with EssentialDynamics. Structure 2007, 15(5):565-575.
42. Emperador A, Carrillo O, Rueda M, Orozco M: Exploring the suit-ability of coarse-grained techniques for the representation ofprotein dynamics. Biophysical journal 2008, 95(5):2127-2138.
Page 14 of 14(page number not for citation purposes)