Embed Size (px)
Citation preview
THINK GLOBAL & ACT LOCALTERRE magazine for youth
March 2016, Vol 3 | Issue 1
Bird diversity & status of water quality at the Mula Mutha bird site & understanding the correlation between bird diversity & water quality
TERREYuCon
ISBN : 978-81-930643-7-5ISBN
Vol 3 Issue 1 | March 2016 |2TERRE
YuCon
Bird diversity & status of water quality at the Mula Mutha bird site & understand-ing the correlation between bird diversity & water quality
www.terrepolic ycentre.c omISBN : 978-93-85311-04- 8
INKINGINNOVATIONS
Abstract: The quality of water is an important factor that affects the quality of life. In
India, the largest source of the water pollution is the discharge of the untreat-ed sewage into the river bodies, especially in urban cities. The present study is conducted to analyze the water quality status, bird diversity and population trend at the proposed Mula Mutha Bird site. This study also includes finding the correlation between water quality and bird diversity. The study area consists of1.5 km stretch which runs from Yerwada bridge to Kalyani Nagar bridge on the Mula Mutha river which is the only patch having the highest bird diversity among the complete length of river in Pune and conducting such studies play an very important role in the assessment and conservation of such potential IBA (Important Bird Area) sites. The water samples from site were collected monthly (from June 2015 to January 2016) and were analyzed against five water quality parameters using standard methods as described in APHA and transect method were used to assess the bird diversity and population status. The Simpson diversity index were determined which shows increasing water bird diversity trend from June-15 to Jan-16 with highest diversity index of 0.9 in the month of January. Correlation coefficients were also determined be-tween water quality parameters and bird diversity using statistical tests which show insignificant positive correlation between the parameters.
Keywords:
Water quality, Physico-chemical parameters, APHA, Diversity of birds, Biodiversity indices, Correlation.
BINUMOL THOMAS, Dr. KRANTI YARDI Institute of Environment Education and Research, BharatiVidypeeth University, Pune
Dr. MILIND R GIDDEBharati Vidyapeeth University College of Engineering, Pune

Vol 3 Issue 1 | March 2016 |3TERRE
YuCon
Bird diversity & status of water quality at the Mula Mutha bird site & understand-ing the correlation between bird diversity & water quality
www.terrepolic ycentre.c omISBN : 978-93-85311-04- 8
INKINGINNOVATIONS
Introduction:
Water is a vital natural resource which is used for multiple purposes.A good quality of water de-fines the health of a living organism. A good quality can be identified at a primary level by its basic parameters like color and odour. This is then followed by the physico-chemical parameters like pH, Dissolved oxygen (DO), Biochemical oxygen demand (BOD), Chemical oxygen demand (COD), Ni-trates and Phosphates.The introduction of organic waste, decaying materials and fertilizers increases the chemical nutrients like phosphates and nitrates and promotes algal bloom in water which has an adverse impact on the aquatic vegetation which blocks the sunlight which hinders the photosynthesis process in water. Due to lack of sunlight, the reproductive ability of fish disrupts. Heavy metals in the water cause bioaccumulation of pollutants in the organisms like fishes, molluscs, water insects which leads to biomagnification of pollutants in fish which further leads to bird mortality.
Materials and Methods:
The Mula Mutha river is the confluence of the two rivers of Pune city; Mula and Mutha. Both the rivers meet at a place called Sangamwadi near the Sangambridge. This study is carried out to check the water quality, bird population and the bird diversity trend of the Proposed Mula Mutha bird site.
1. Water Quality analysis :
For the present study, two sampling stations were selected.
1. Yerwada bridge (Inlet of Mula Mutha river stretch)
2. Kalyani nagar bridge (Outlet of Mula Mutha river stretch)
Figure – 1: Google Earth image showing the study area from Yerwada bridge to Kalyani nagar bridge

Vol 3 Issue 1 | March 2016 |4TERRE
YuCon
Bird diversity & status of water quality at the Mula Mutha bird site & understand-ing the correlation between bird diversity & water quality
www.terrepolic ycentre.c omISBN : 978-93-85311-04- 8
INKINGINNOVATIONS
The water samples from these stations were collected monthly from June 2015 to January 2016 considering the pre monsoon, monsoon and the post monsoon season. The physico-chemical analysis was carried out to check the quality of the collected water samples. The samples were analyzed by using the standard methods described in APHA (American Public Health Association), 20th edition, 1998. The physico- chemical parameters are pH, Dissolved Oxygen (DO), Chemical Oxygen Demand (COD), Biochemical Oxygen Demand (BOD), Nitrates and Phosphates.
2. Bird study
Bird species was counted using distance sampling by transect method from June 2015 to January 2016. The study site for the bird species were taken on four points along the Mula Mutha stretch. Birds were counted at each station for 10 minutes.The biodiversity indices such as Shannon Weiner index, Simpson Diversity index and Simpson Reciprocal index were calculated to analyze bird dynamics.
3. Correlation of water quality parameters with the aquatic biodiversity
The feeding habits examined with the help of field guides and on-site observations.Correlation was performed against each water quality parameter with the bird diversity.For a better interpretation, correlation between Phosphates and the two groups of the water birds (ducks and waders) were per-formed. The correlation was done with the help of Open Software SOFA Statistics Open For All soft-ware. This relation is shown by the Pearson correlation analysis. The Pearson correlation coefficient is denoted by “r” or “R” and it ranges from -1 to +1. The positive value indicates significant positive linear correlation. The negative value indicates significant negative linear correlation. And the zero value indicates an insignificant correlation.Therefore, a biogas plant capable of processing 250kg is suggested. The plant can be installed in 30*20 sq. feet area behind the canteen and would cost about 6.5 lakhs which includes the installation cost, digesters and pipelines cost, and O&M costs. The total combined manure of 225 kg is expected to produce 25-40 cubic meter of biogas daily. 1 m3 of biogas is equivalent to 0.45Kg (450g) of LPG.
Results and Discussions
1. Water quality
The pH ranges from 6.8 to 7.5. The highest was recorded in the outlet sample in the post monsoon season in the month of December (7.5). The reason for the low values of pH is due to the dilution of the water in the monsoon season. The outlet sample shows an increased trend line from June to Janu-ary whereas the inlet sample shows a stable trend line. The pH determines the quality of the water in
Vol 3 Issue 1 | March 2016 |5TERRE
YuCon
Bird diversity & status of water quality at the Mula Mutha bird site & understand-ing the correlation between bird diversity & water quality
www.terrepolic ycentre.c omISBN : 978-93-85311-04- 8
INKINGINNOVATIONS
terms of acidity and alkanility. (Gadhave and Kawade, 2015) and also an important parameter as the aquatic life as it does not adapt to the sudden changes in the water (C.N Eknath , 2013).
The minimum DO was recorded in the month of June of the inlet and the outlet sample and the maximum was recorded in the post monsoon season in the month of October of the outlet sample. The DO is minimumin the pre monsoon season in month of June because of no rainfall as rains started in the month of July. The DO is high in the monsoon period because during monsoon the flow rate is more which leads to increased aeration. So the concentration of the DO content will be lesser in the rest two seasons due to the decreased flow rate and the aeration. The presence of the bunds, slope and the rocky structures creates more turbulence in the water thereby increasing the Dissolved oxygen content.C.N.Eknath (2013) and S. Karad (2015) observed the same trend in the Mula Mutha river in the summer season and they states that this is due to the industrial discharge and domestic waste which contains organic matter. The variation in the concentration of DO levels is due to the decrease in the natural recharge of water and increase in the waste.
The maximum COD was recorded in the monsoon season in the month of September for the outlet sample and the minimum COD was recorded in the pre monsoon and in the monsoon season month of June and July. The concentration of the COD is increasing in the outlet because of the organic load released into the river from the Koregaon Park and the Kalyani nagar nallahs. COD will be always greater than the BOD content because COD is a combined factor of all the organic and the inorganic waste.A similar trend was observed in the past studies in the Mula Mutha river by C. N Eknath (2013) and S. Karad et al (2015).During the summer season, the increase in the concentration of COD level is mainly due to the increased temperature, increased evaporation rate of the water, oxygen consump-tion for the degradation of the organic matter and the industrial effluents. (C.N Eknath, 2013).
The BOD levels were high in the monsoon period in the month of September and the maximum BOD was recorded for the Outlet sample and the minimum BOD was recorded in pre monsoon sea-son and early monsoon period in the month of June and July for both inlet and the outlet samples. The concentration of the BOD is increasing in the outlet because of the organic load released into the river from the Koregaon Park and the Kalyani nagar nallahs.Increase in the BOD concentration itself means that there is a large proportion of the organic matter in the water. The organic matter gets mixed in the water due to the discharge and then it affects the self-purification ability of the water (Gadhave and Kawade, 2015).
The nitrates show a fluctuating trend. The maximum concentration of nitrates was recorded in the post monsoon season in the month of January for the inlet sample due to the increased rate of the ni-trification process and the minimum concentration of nitrates was recorded in the month of June. The increased concentration of the nitrates is due to the organic water being dumped into the water.
The maximum concentration of phosphates was recorded in the month of January for the inlet
Vol 3 Issue 1 | March 2016 |6TERRE
YuCon
Bird diversity & status of water quality at the Mula Mutha bird site & understand-ing the correlation between bird diversity & water quality
www.terrepolic ycentre.c omISBN : 978-93-85311-04- 8
INKINGINNOVATIONS
sample. The lower values of the Phosphate indicate the dilution of the water. In the month of August and September the phosphate values are lowest because of the dilution then a sudden increase is seen in the month of October due to heavy discharge. Similar trend is seen in the case of the outlet. Lower values are seen till the month of September then a sudden increase in the phosphate level in the month of October and an increased trend is seen from October to January.The domestic waste and the ag-ricultural run-off contains nutrients which are discharged into the water contains phosphate content and then these nutrients contributes to eutrophication.
2. Bird population and bird diversity
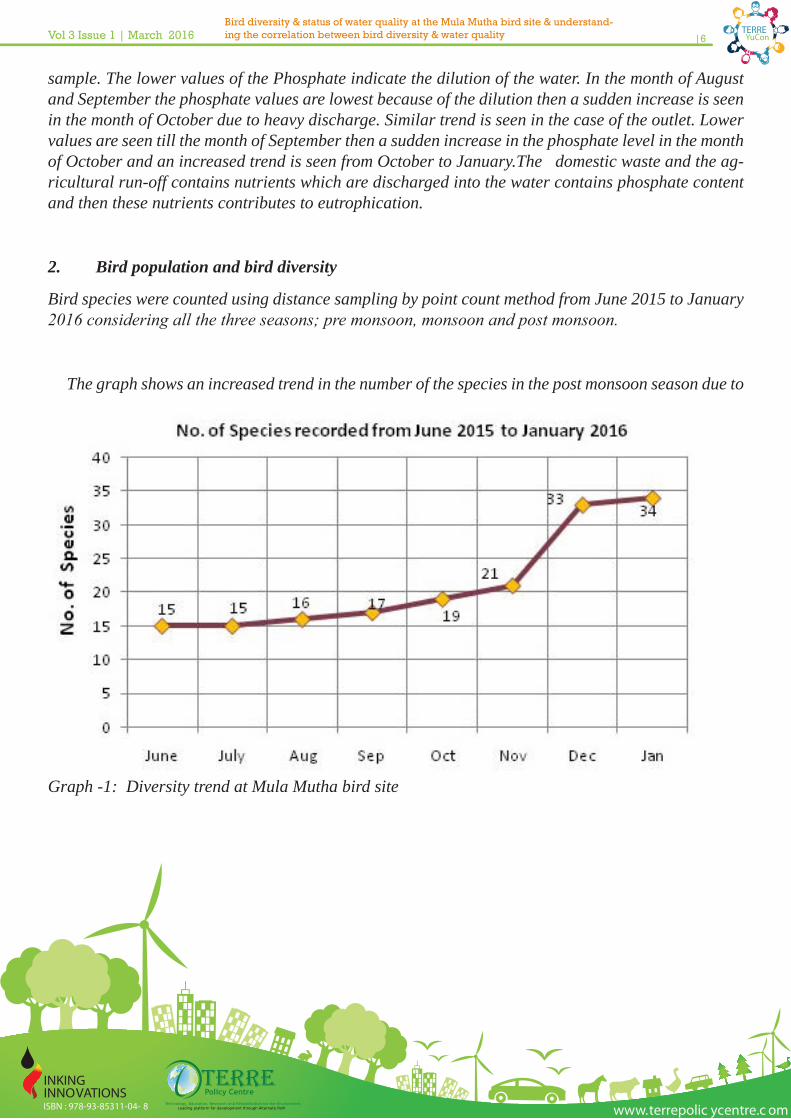
Bird species were counted using distance sampling by point count method from June 2015 to January 2016 considering all the three seasons; pre monsoon, monsoon and post monsoon.
The graph shows an increased trend in the number of the species in the post monsoon season due to
Graph -1: Diversity trend at Mula Mutha bird site
Vol 3 Issue 1 | March 2016 |7TERRE
YuCon
Bird diversity & status of water quality at the Mula Mutha bird site & understand-ing the correlation between bird diversity & water quality
www.terrepolic ycentre.c omISBN : 978-93-85311-04- 8
INKINGINNOVATIONS
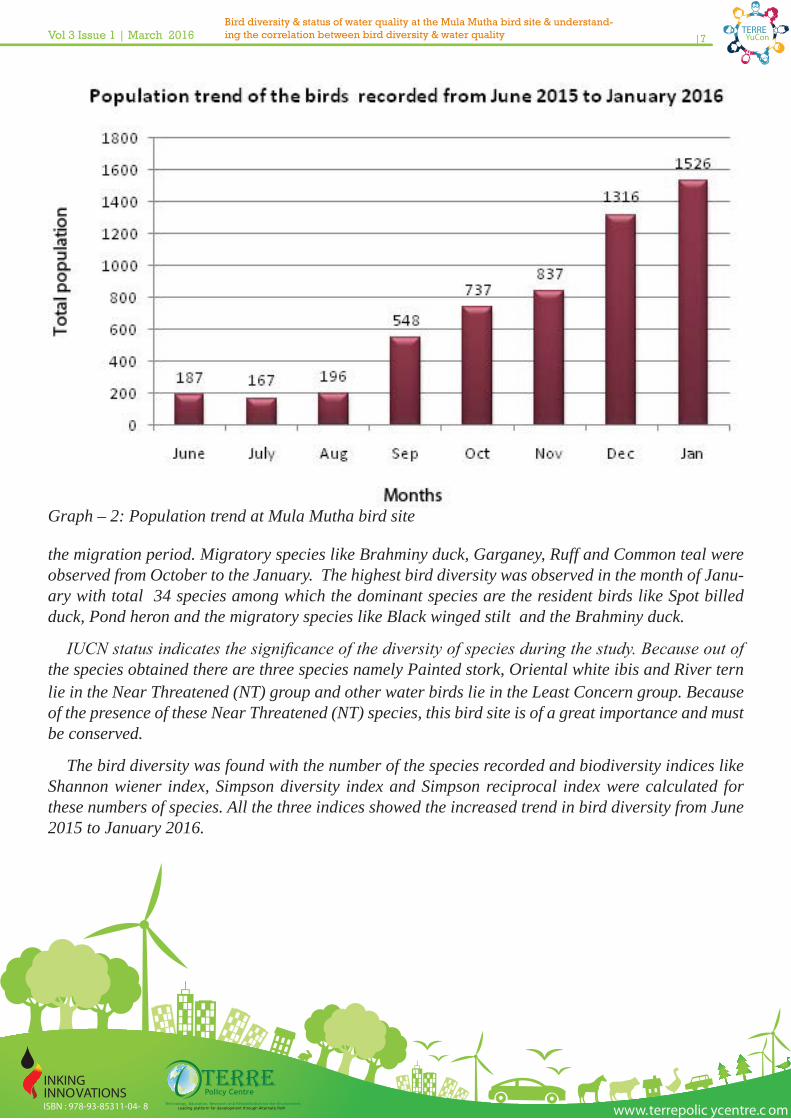
the migration period. Migratory species like Brahminy duck, Garganey, Ruff and Common teal were observed from October to the January. The highest bird diversity was observed in the month of Janu-ary with total 34 species among which the dominant species are the resident birds like Spot billed duck, Pond heron and the migratory species like Black winged stilt and the Brahminy duck.
IUCN status indicates the significance of the diversity of species during the study. Because out of the species obtained there are three species namely Painted stork, Oriental white ibis and River tern lie in the Near Threatened (NT) group and other water birds lie in the Least Concern group. Because of the presence of these Near Threatened (NT) species, this bird site is of a great importance and must be conserved.
The bird diversity was found with the number of the species recorded and biodiversity indices like Shannon wiener index, Simpson diversity index and Simpson reciprocal index were calculated for these numbers of species. All the three indices showed the increased trend in bird diversity from June 2015 to January 2016.
Graph – 2: Population trend at Mula Mutha bird site
Vol 3 Issue 1 | March 2016 |8TERRE
YuCon
Bird diversity & status of water quality at the Mula Mutha bird site & understand-ing the correlation between bird diversity & water quality
www.terrepolic ycentre.c omISBN : 978-93-85311-04- 8
INKINGINNOVATIONS
3. Correlation Results
Using statistical tests the correlation between two parameters were tested. Correlation was per-formed against each water quality parameter with the bird diversity.The correlation was done with the help of Open Software SOFA Statistics Open For All software. This relation is shown by the Pear-son correlation analysis.In case of pH, the Pearson’s correlation coefficient R is 0.82 which is near to +1 means the pH has a positive correlation with the number of species.In case of DO, the Pearson’s correlation coefficient R is 0.151 which is near to zero which means the Dissolved Oxygen has an insignificant correlation with the number of species.In case of BOD, the Pearson’s correlation coef-ficient R is 0.398 which is near to zero means the Biochemical Oxygen Demand (BOD) has an insig-nificant correlation with the number of species.In case of COD, the Pearson’s correlation coefficient R is 0.402 which is near to zero means the Chemical Oxygen Demand (COD) has an insignificant correlation with the number of species. In case of nitrates, the Pearson’s correlation coefficient R is 0.709 which is near to +1 means the Nitrate has a positive correlation with the number of species.In case of phosphates, the Pearson’s correlation coefficient R is 0.882 which is near to +1 means the Phosphate has a positive correlation with the number of species.
The food habits were analyzed with the help of onsite observations and the field guides by Dr. Salim Ali (Old volumes). Egrets and herons feed on the fishes, tadpoles, crustaceans and the aquatic insects; ducks feed on the crustaceans, molluscs, worms and vegetative matter; terns feed on the fishes and the cormorants are the fish eating and the diving birds. The highlighting factor is the food habits of the common coot and the purple moorhen because they totally rely on the roots of the aquatic plants like Water hyacinth and Pistia. The increased vegetation grown along the entire bird site is due to the presence of the nutrients in the water which comes from the organic waste such as phosphates and nitrates.
The correlation of the bird diversity with the Phosphates and Nitrates show a very strong corre-lation. Further a correlation test was performedbetween the phosphates and the two group of birds namely waders and the ducks which rely on the vegetation. Four birds were selected namely Purple moorhen and Black winged stilt for the waders and Spot billed duck and Common coot for the ducks category. A strong correlation was observed between the phosphates and the birds. The rate of the phosphorous cycle is very slow as compared to the nitrogen cycle. This means that the movement of the phosphorous from one sink/pool to another is very low. Due to this the phosphorous remains in the water for a long time and it makes available to the plants and enhances growth. This further ben-efits the water birds which totally rely on the vegetation and shows a strong correlation between the phosphates.
Vol 3 Issue 1 | March 2016 |9TERRE
YuCon
Bird diversity & status of water quality at the Mula Mutha bird site & understand-ing the correlation between bird diversity & water quality
www.terrepolic ycentre.c omISBN : 978-93-85311-04- 8
INKINGINNOVATIONS
Conclusion
The present study shows that the water quality has deteriorated due to the industrial effluents from the Mula River and domestic sewage from the Mutha River. Analysis indicates increased load of pol-lution in the Mula Mutha River. The bird diversity and population trend shows highest diversity in the post monsoon season in the Mula Mutha bird site. This is the only patch in the entire river stretch which has the highest population and diversity of birds which was proved by calculating the diversity indices. The water quality parameters were correlated with the bird diversity which shows that the water quality parameters have a very insignificant positive correlation with the bird diversity.
Acknowledgement
I would like to express my sincere thanks toDr. Milind R Gidde, Dr. Kranti Yardi, Dr. Shamita Kumar, Dr. ErachBharucha (Director, BVIEER) and Mr. Swapnil Giradefor their guidance and su-pervision in my study. I would like to show my gratitude to all my colleagues and my parents for their co-operation and support throughout the study.
References:
Alam MJ, Islam MR, Muyen Z, Mamun M, Islam S. Water quality parameters along rivers. Inter-national Journal of Environmental Science & Technology. 2007;4(1):159–167.
Ganguly S. RELATIONSHIPS OF MIGRATORY WATER BIRD COUNTS OF EASTERN INDIA WITH FOOD HABITS AND METEOROLOGICAL ASPECTS. Global Journal of Multidisciplinary Studies [Internet]. 2015 [cited 2015 Dec 7];4(8). Available from: http://www.gjms.co.in/index.php/gjms/article/view/1057
Gaurav A. Reclaim the river. Pune, Maharashtra, India. 2010 [cited 2015 Dec 7]; Available from: http://publications.lib.chalmers.se/records/fulltext/123394.pdf
Saksena DN, Garg RK, Rao RJ. Water quality and pollution status of Chambal river in National Chambal sanctuary, Madhya Pradesh. Journal of Environmental Biology. 2008;29(5):701–710.
Sonal D, Jagruti R, Geeta P. Avifaunal diversity and water quality analysis of an inland wetland.Journal of Wetlands Ecology. 2010;4:1–32.
Sahasrabuddhe K, Mahabaleshwarkar M, Joshi J, Kanade R, Goturkar S, Oswal P, et al. Changing status of urban water bodies and associated health concerns in Pune, India. In: International Confer-ence on Environment and Health Chennai [Internet]. 2003 [cited 2015 Dec 7].Availablefrom:http://www.yorku.ca/bunchmj/ICEH/proceedings/Patwardhan_A_ICEH_papers_339to345.pdf

Vol 3 Issue 1 | March 2016 |10TERRE
YuCon
Bird diversity & status of water quality at the Mula Mutha bird site & understand-ing the correlation between bird diversity & water quality
www.terrepolic ycentre.c omISBN : 978-93-85311-04- 8
INKINGINNOVATIONS
Urfi AJ, Sen M, Kalam A, Meganathan T. Counting birds in India: Methodologies and trends. Cur-rent Science. 2005;89(12):1997–2003.
Griffis-Kyle KL, Beier P. Migratory strategy and seasonal patterns of bird diversity in relation to forest habitat. The American midland naturalist. 2005;153(2):436–443.
Chattopadhyay S, Rani LA, Sangeetha PV. Water quality variations as linked to landuse pattern: a case study in Chalakudy river basin, Kerala. Current science. 2005;89(12):2163–2189.
Jafari NG, Gunale VR. Hydrobiological study of algae of an urban freshwater river.Journal of Ap-plied Sciences and Environmental Management [Internet]. 2006 [cited 2015 Dec 7];10(2). Available from: http://www.ajol.info/index.php/jasem/article/download/43697/27219
6. M. A Usman, O. O Olanipekun, O. M Kareem,2012; Biogas Generation from Domestic Solid Wastes in Mesophilic Anaerobic Digestion; International Journal of Research in Chemistry and En-vironment, Vol. 2 Issue 1 January 2012(200-205), 1SSN 2248-9649.
7. PRAKASH Jyoti, Tewari S.P, and SRIVASTAVA BIPIN KUMAR,2011; Analysis and Design of Renewable energy system for engineering college campus in small town , International Journal of Science and Advanced Technology (ISSN 2221-8386).
8. Shirsh Energy Solutions Pvt Ltd Mumbai India;http://www.shirshenergy.com.
9. Solar mango India, rooftop solar power generation ;http:// http://www.solarmango.com.

TERREYuCon
TERRE Policy Centre
Field Address :Pandit Ajgaokar Scheme,Khandobacha Mal, Bhugaon, Pune - 411042, Maharashtra (India)
O�ce Address: 22 Budhwar Peth, Pune 411002, Maharashtra (India)