Embed Size (px)
Citation preview
Basic medical image processing concepts and
continued course introduction
Einar Heiberg, [email protected]
Course homepage http://www.maths.lth.se/course/medim/2015/
Who am I?
• Master of Science in computer engineering • PhD medical image analysis and modelling • Worked in hospital environment for 15 years • Part of Lund Cardiac MR Group • Founder of Medviso AB • CTO for Imacor
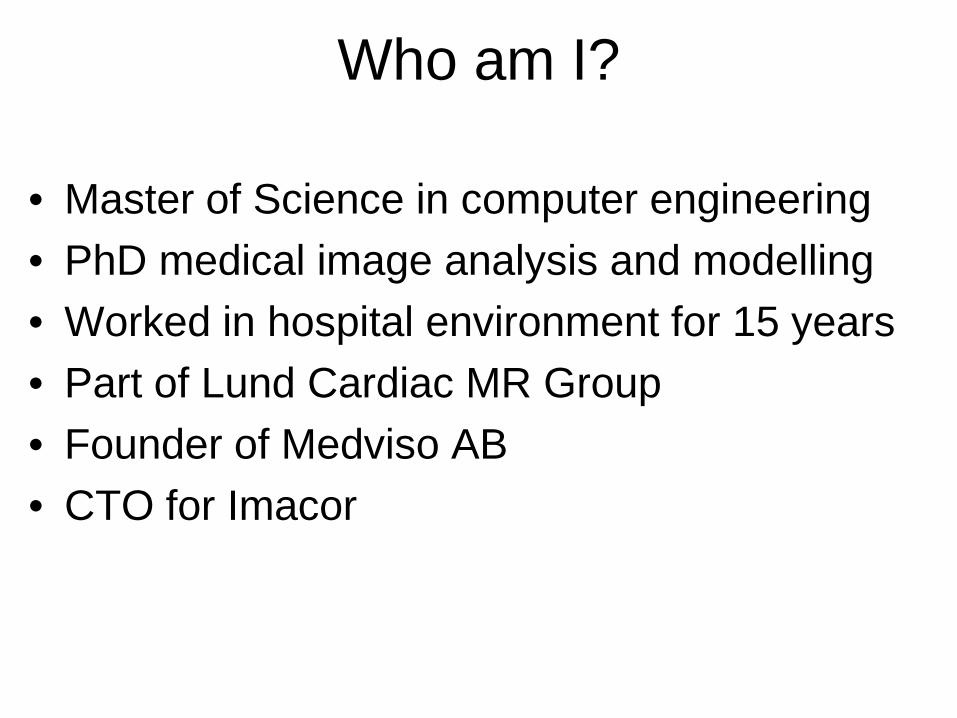
Dept Clinical Physiology

Purpose of the lecture
• Revisit basic image processing concepts in medical imaging context
• Hope to provoke you to start thinking about images and imaging in new directions
• Application examples
General notation of hand-outs
• Red texts are basic take home messages after discussions in the lecture.
What is an image?
• Generally speaking we agreed that it is a mapping from one space (typically R2) to another space (typicall R2)
• Other spaces such R3 or higher are possible
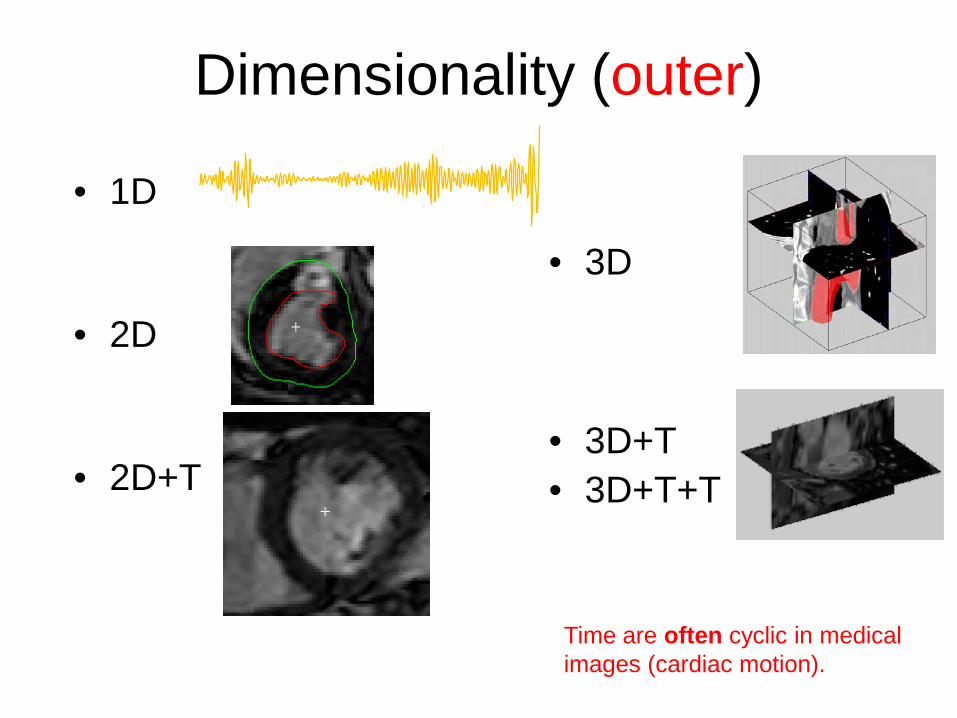
Dimensionality (outer)
• 1D
• 2D
• 2D+T
• 3D
• 3D+T • 3D+T+T
Time are often cyclic in medical images (cardiac motion).
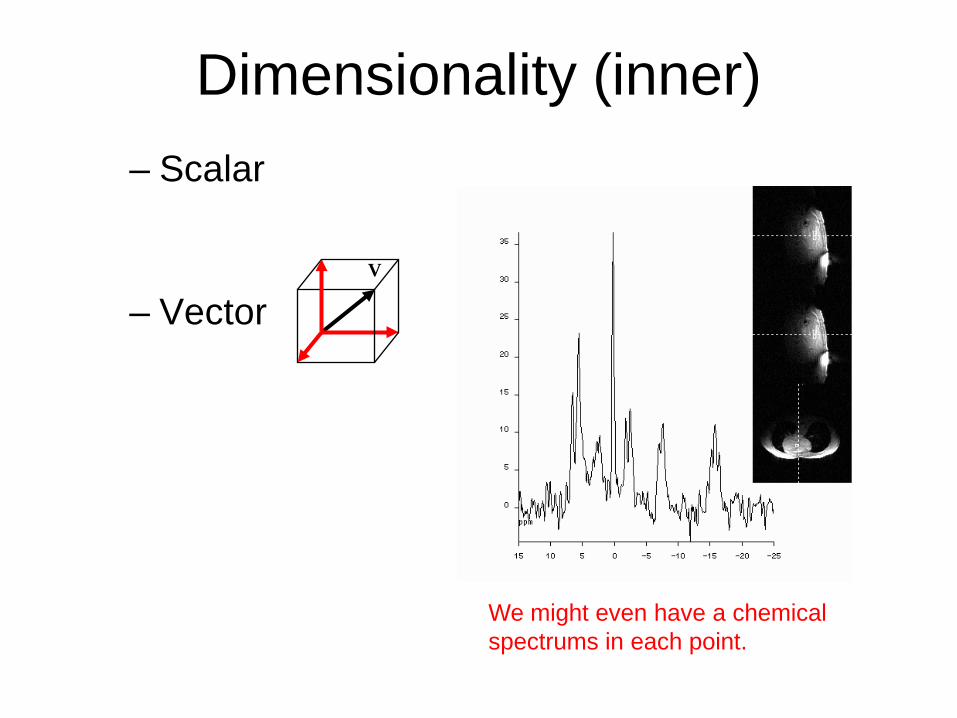
Dimensionality (inner) – Scalar
– Vector
V
We might even have a chemical spectrums in each point.
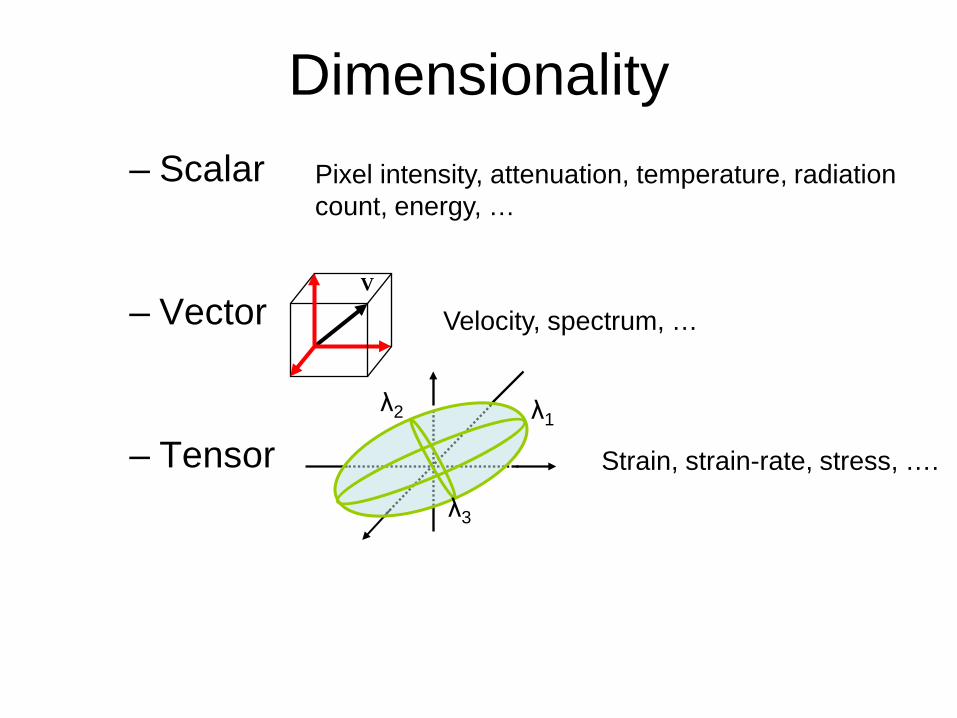
Dimensionality – Scalar
– Vector
– Tensor λ1
λ3
λ2
V
Strain, strain-rate, stress, ….
Velocity, spectrum, …
Pixel intensity, attenuation, temperature, radiation count, energy, …
What is image contrast?
• Generally we agreed that it is defined on the basis of difference in image intensity
What is contrast in medical images?
• Generally we agreed that is it defined as difference in intensity in objects we are interested in and objects we are not interested in (background)

Contrast
Orginal “Contrast enhanced”
Here I have just saturated the brightest parts and the darkest parts to enhance the border between the blood in the left ventricle compared to the heart muscle.
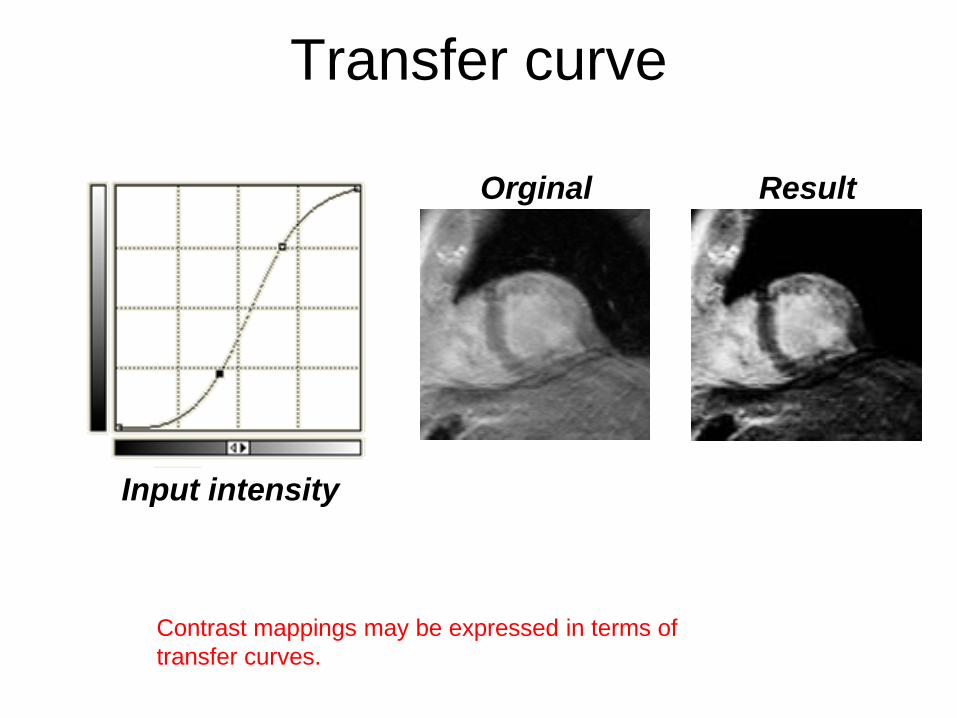
Transfer curve
Orginal Result
Input intensity
Contrast mappings may be expressed in terms of transfer curves.

Transfer curve
Orginal Result
Input intensity
Bizarre mappings cause bizarre side effects. See artificially introduced edge. On the other hand it really enhances the perception of the border.
Contrast agentsn (used in medical imaging)
• Iron particles (MRI) • Gadolinium (MRI) • Radio nuclides (SPECT, PET) • Bubbles (ultrasound) • Staining (histology)
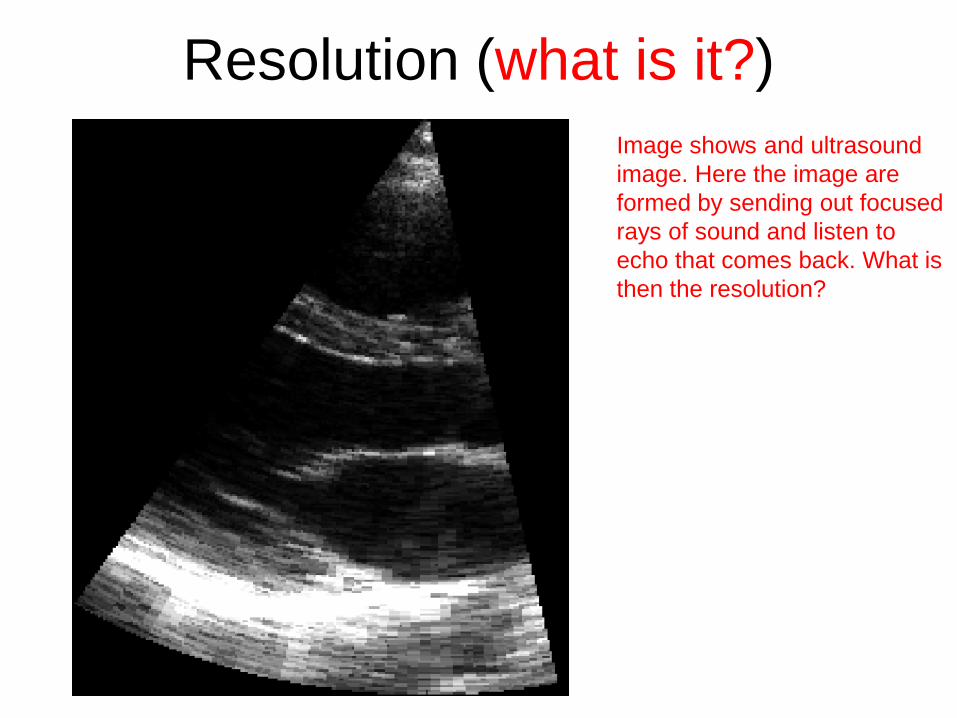
Resolution (what is it?) Image shows and ultrasound image. Here the image are formed by sending out focused rays of sound and listen to echo that comes back. What is then the resolution?
Resolution (what is it?) • Generally resolution of medical images are
defined in terms of the pixel size (in the real physical world in mm).
• Only then we can defined distances and volumes in the medical images.
• Frequently it is not easy to get information about the true resolution. That could be determined on what is the highest frequency that we can depict in the images.
Signal to Noise Ratio (SNR)
• Common definitions below:
• SNR = Psignal / Pnoise (P=power)
• SNR = μ / σ

What is noise?
HMG, Lund 0.5 x 0.5 x 0.5 mm
The tricky part with noise in medical images are how you estimate the noise. Estimating the signal is usually easier.

Accelerated imaging (and noise)
Noise may in some cases not be constant over the image!
Colour vs greyscale
• We can perceive about 100 shades of grey
• We can perceive > 100 000 colours

Why does not an MR image look like this?
• Harder to objectively understand the differences in scale (we perceive colors less linear compared to gray scale) • Traditions. Medical doctors may not be used looking at colors for the particular image type. Color monitors may not have been common when the technique was invented. • Colors are good when we can have an objective color legend.
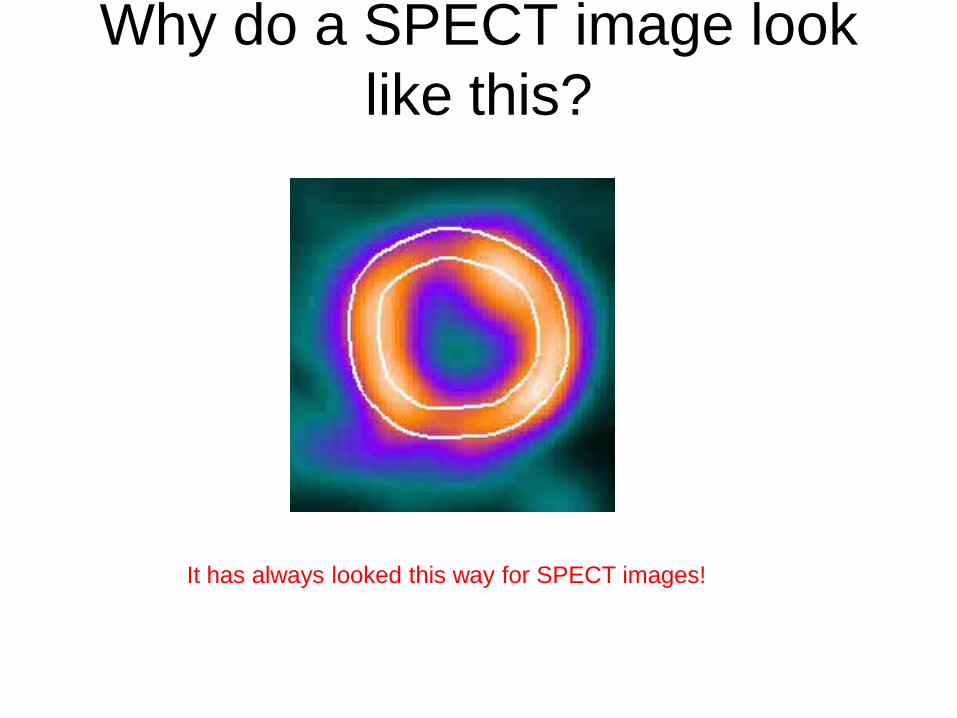
Why do a SPECT image look like this?
It has always looked this way for SPECT images!
Example of medical image processing projects from
Lund University
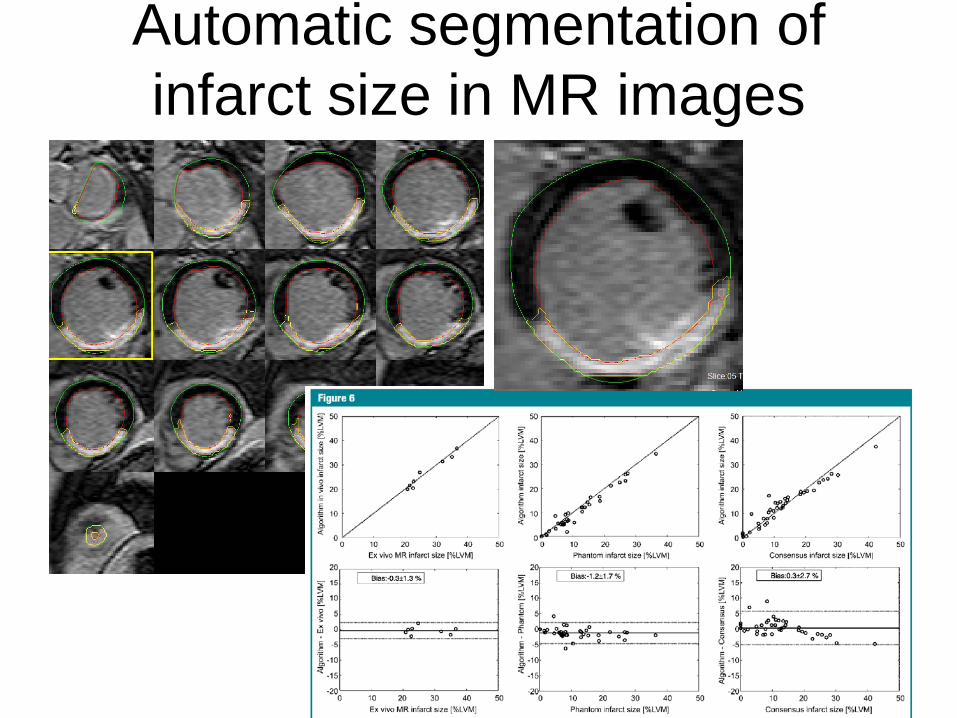
Automatic segmentation of infarct size in MR images
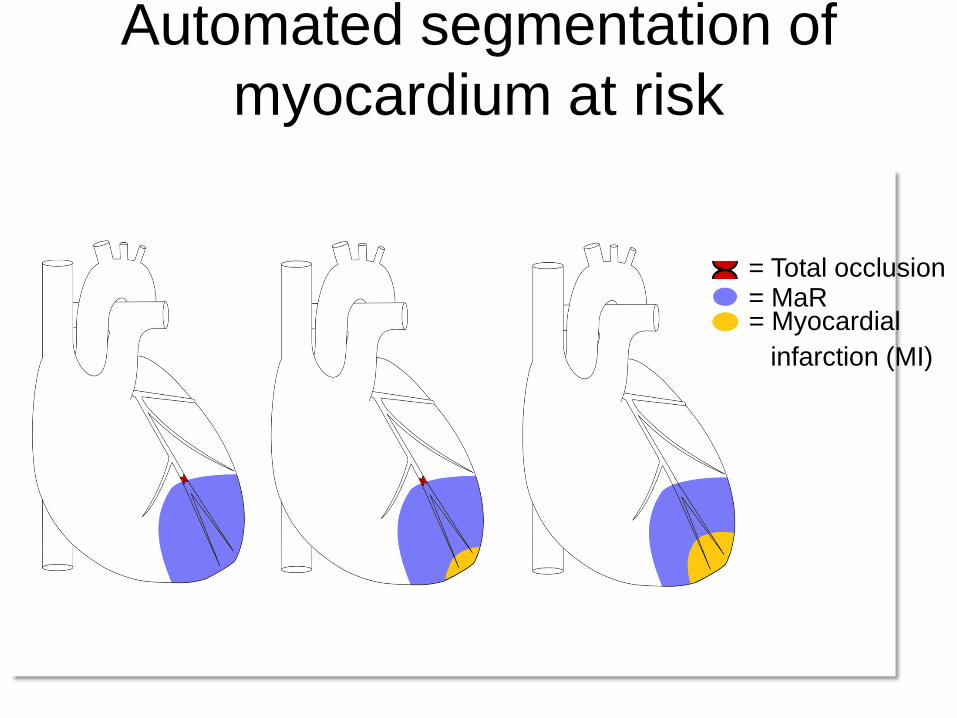
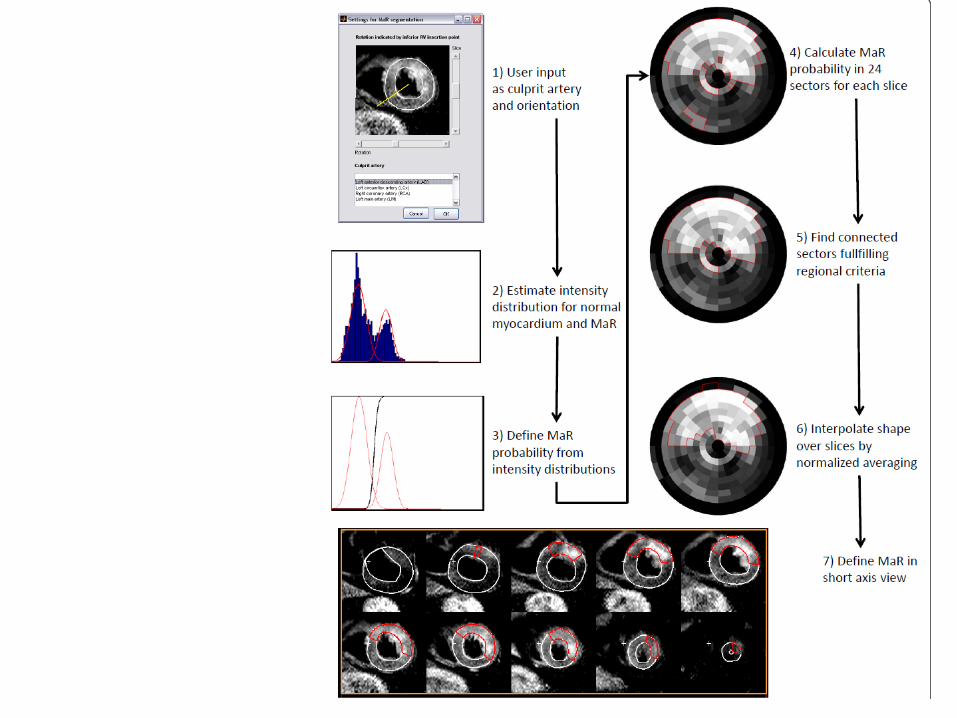
Automated segmentation of myocardium at risk
= MaR = Total occlusion
= Myocardial infarction (MI)
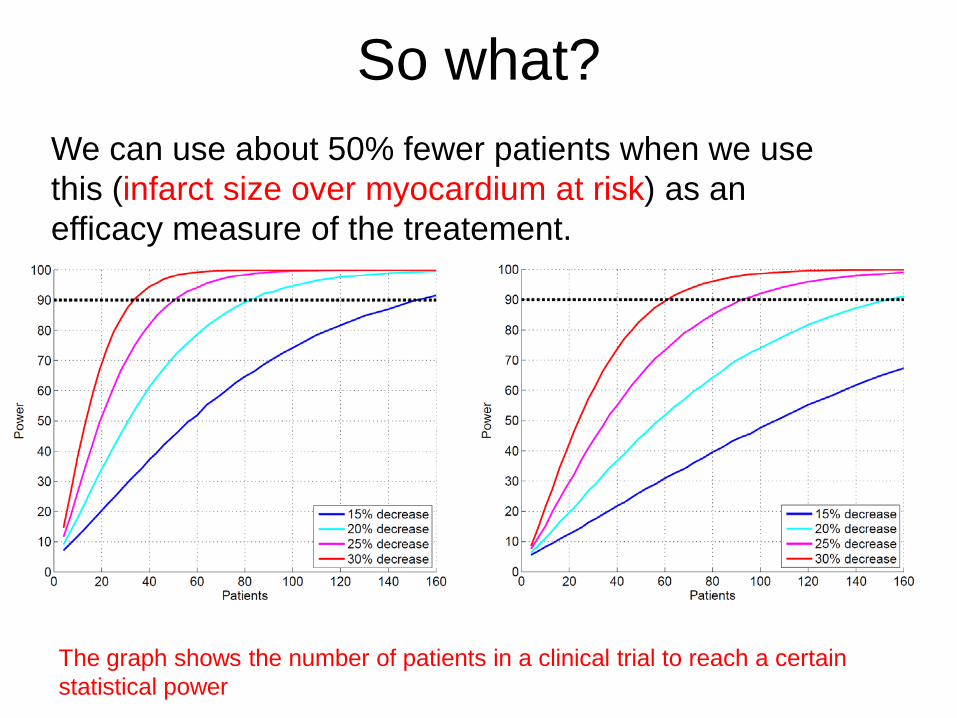
So what? We can use about 50% fewer patients when we use this (infarct size over myocardium at risk) as an efficacy measure of the treatement.
The graph shows the number of patients in a clinical trial to reach a certain statistical power
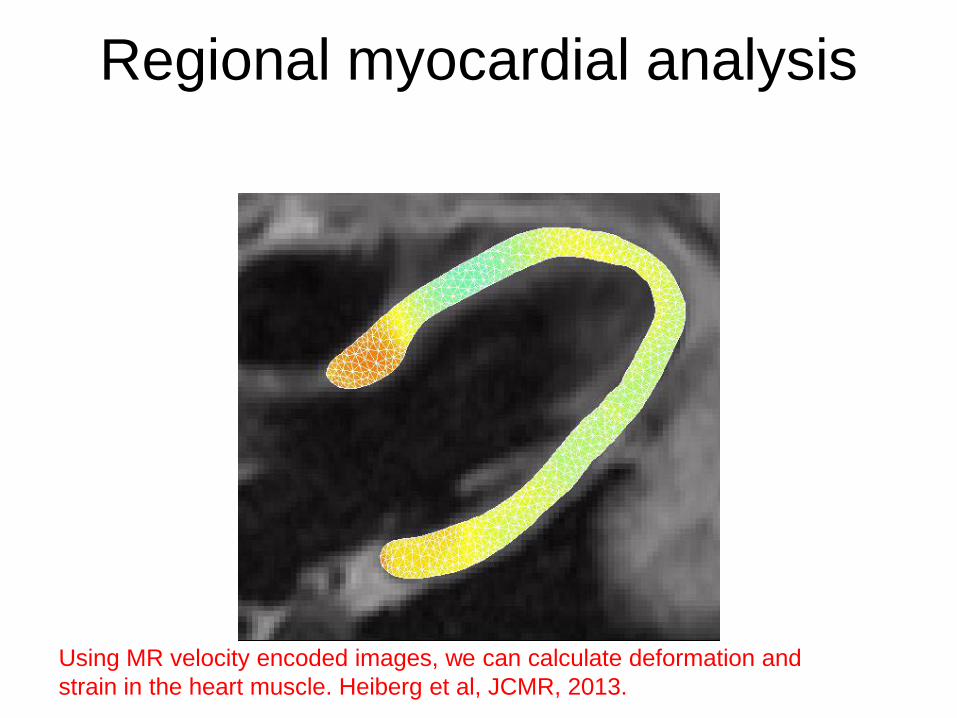
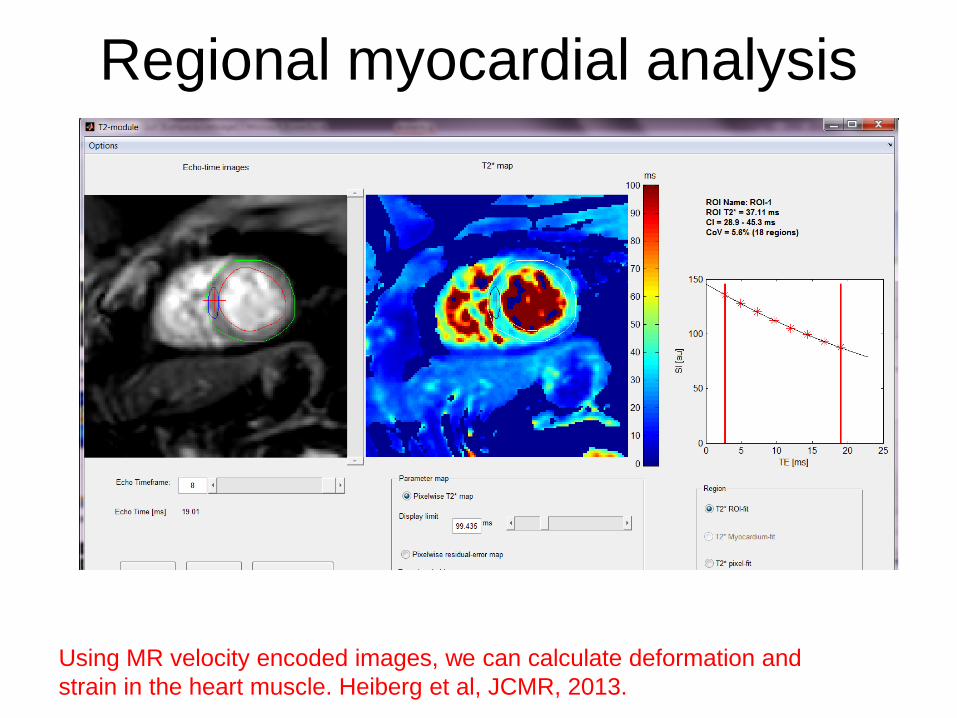
Regional myocardial analysis
Using MR velocity encoded images, we can calculate deformation and strain in the heart muscle. Heiberg et al, JCMR, 2013.
Regional myocardial analysis
Strain
Using MR velocity encoded images, we can calculate deformation and strain in the heart muscle. Heiberg et al, JCMR, 2013.
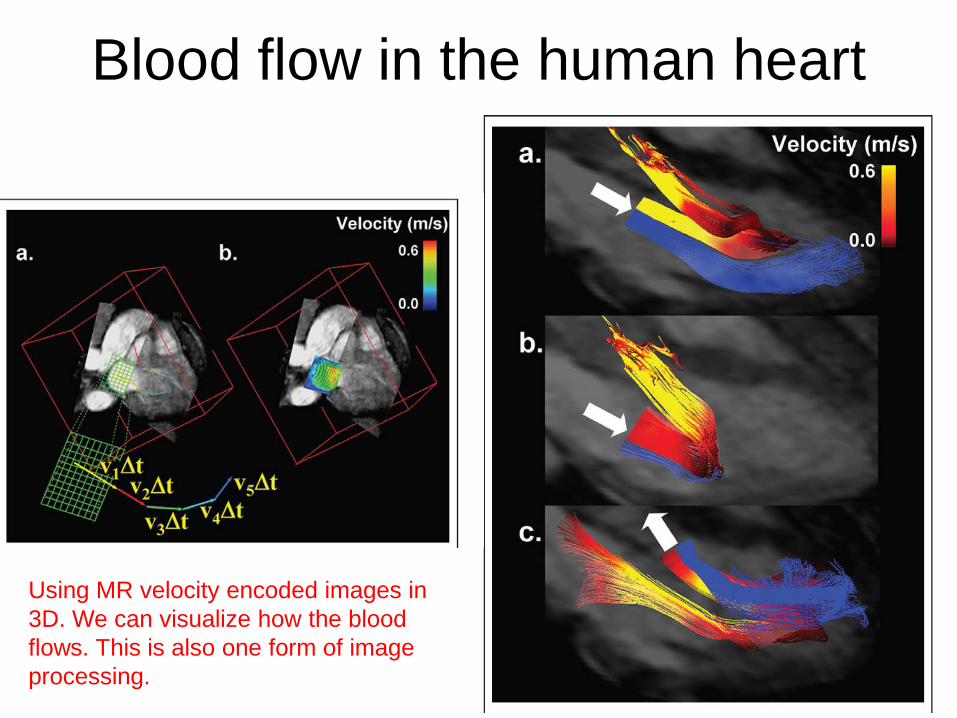
Blood flow in the human heart
Using MR velocity encoded images in 3D. We can visualize how the blood flows. This is also one form of image processing.
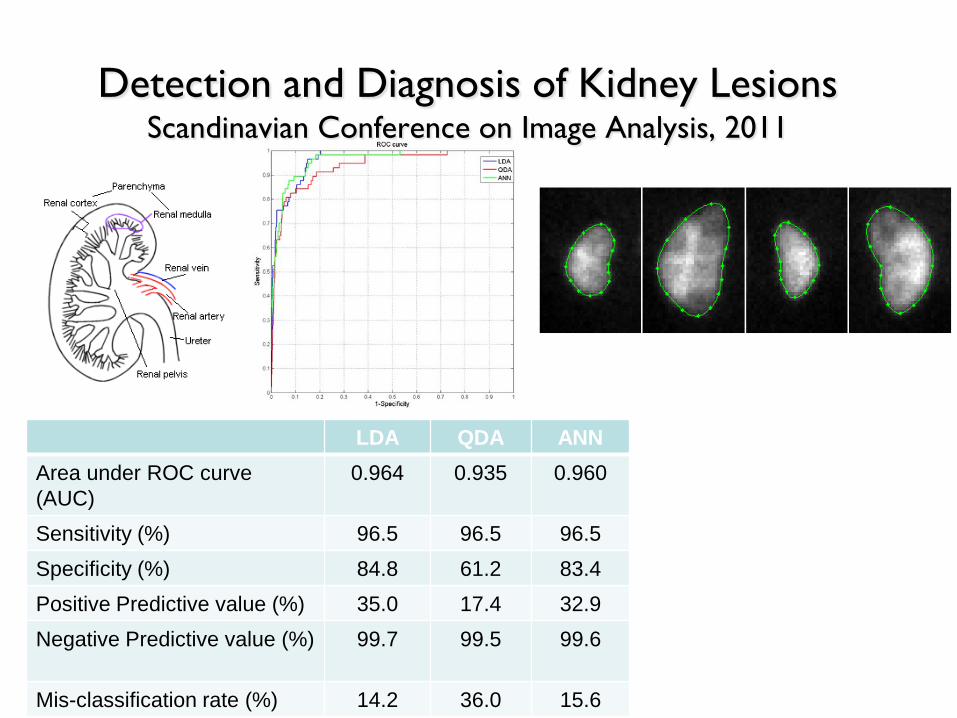
Detection and Diagnosis of Kidney Lesions Scandinavian Conference on Image Analysis, 2011
LDA QDA ANN Area under ROC curve (AUC)
0.964 0.935 0.960
Sensitivity (%) 96.5 96.5 96.5 Specificity (%) 84.8 61.2 83.4 Positive Predictive value (%) 35.0 17.4 32.9 Negative Predictive value (%) 99.7 99.5 99.6
Mis-classification rate (%) 14.2 36.0 15.6
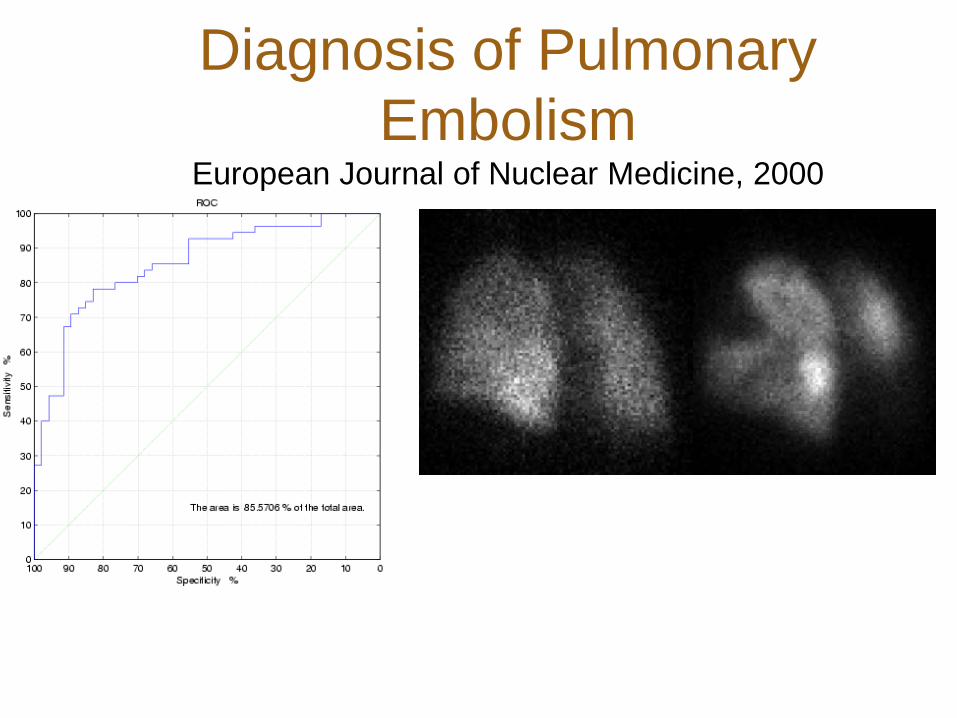
Diagnosis of Pulmonary Embolism
European Journal of Nuclear Medicine, 2000
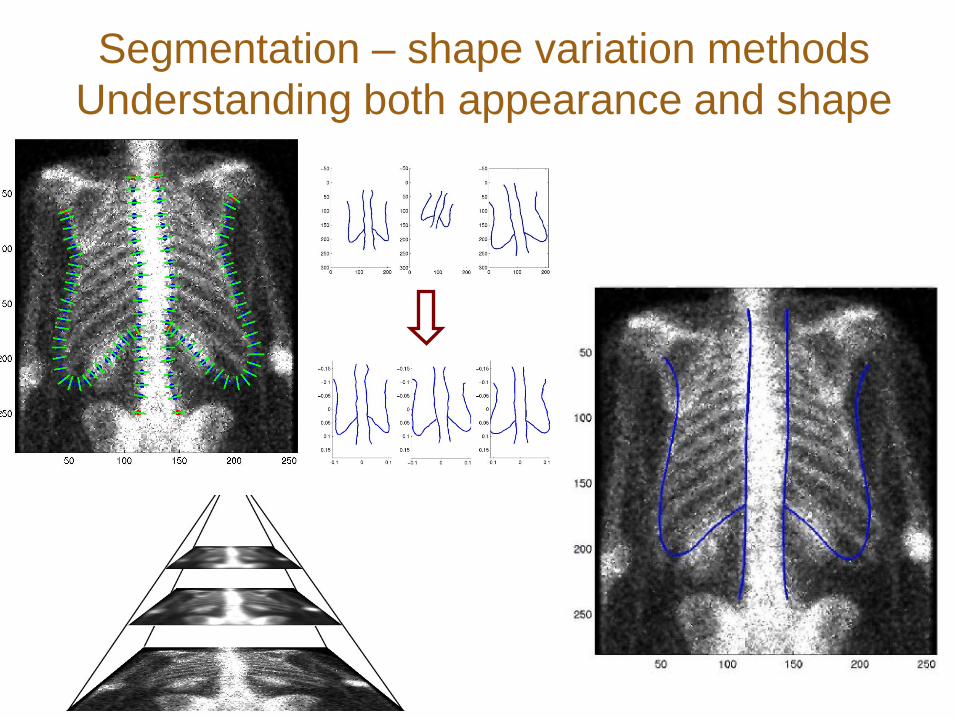
Segmentation – shape variation methods Understanding both appearance and shape
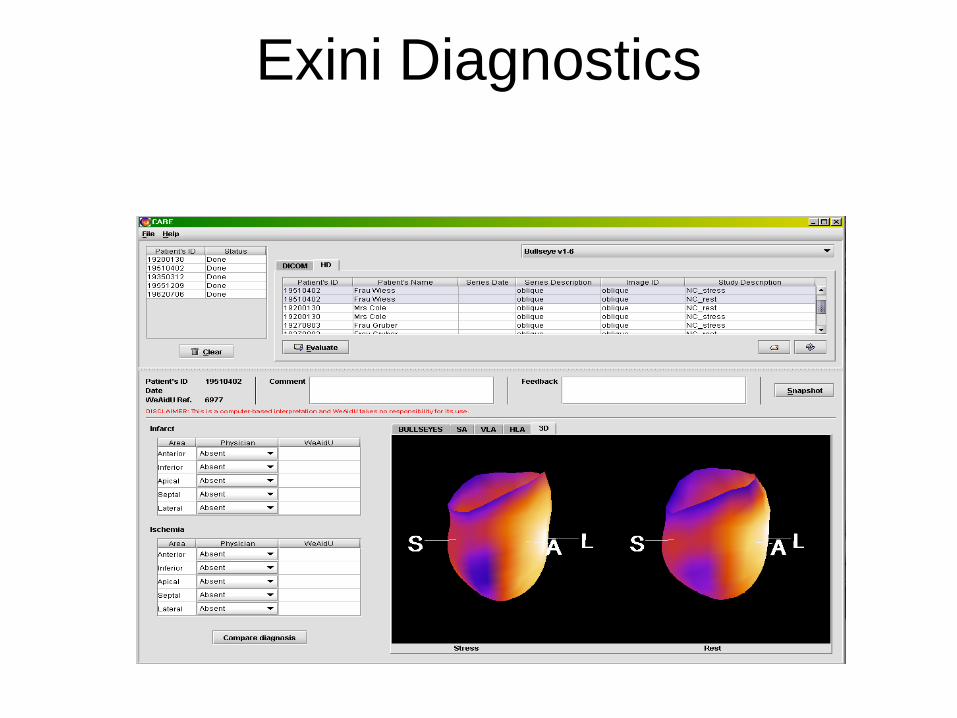
Exini Diagnostics
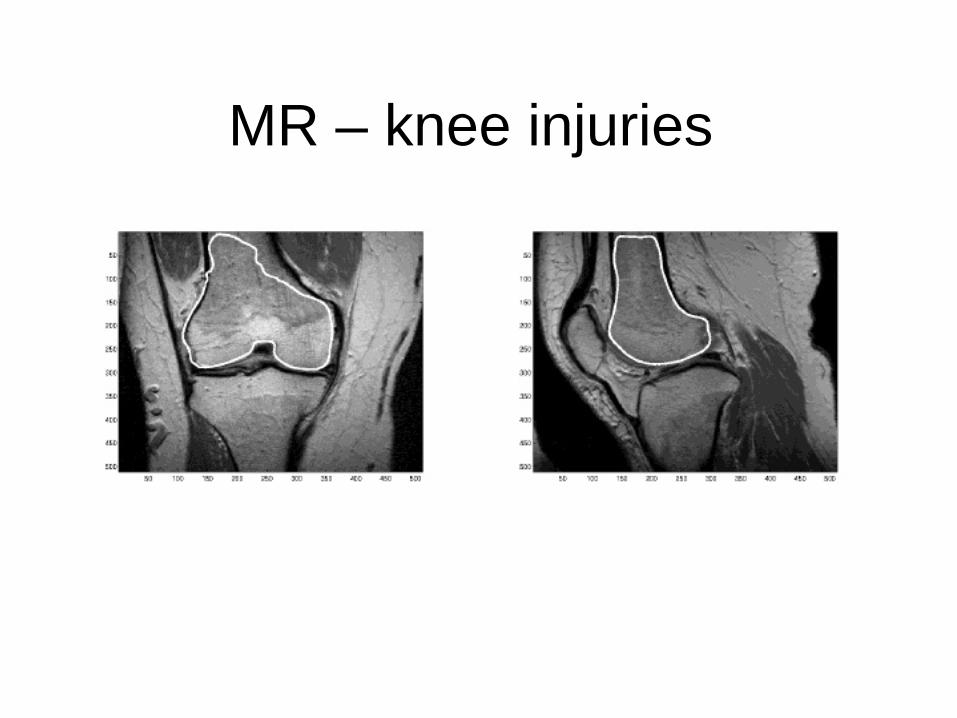
MR – knee injuries
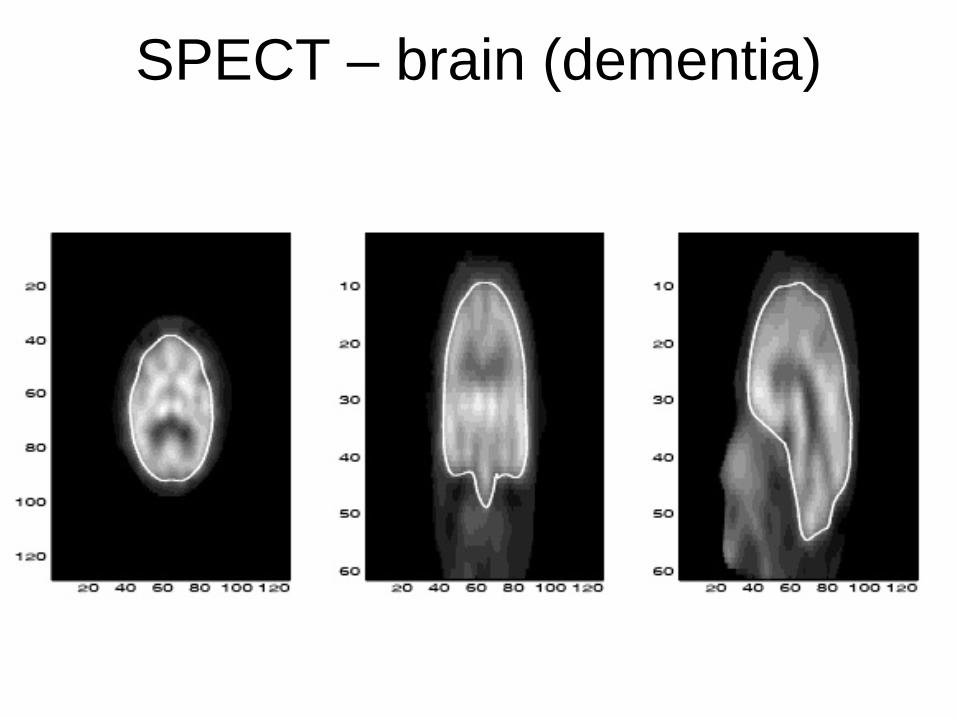
SPECT – brain (dementia)
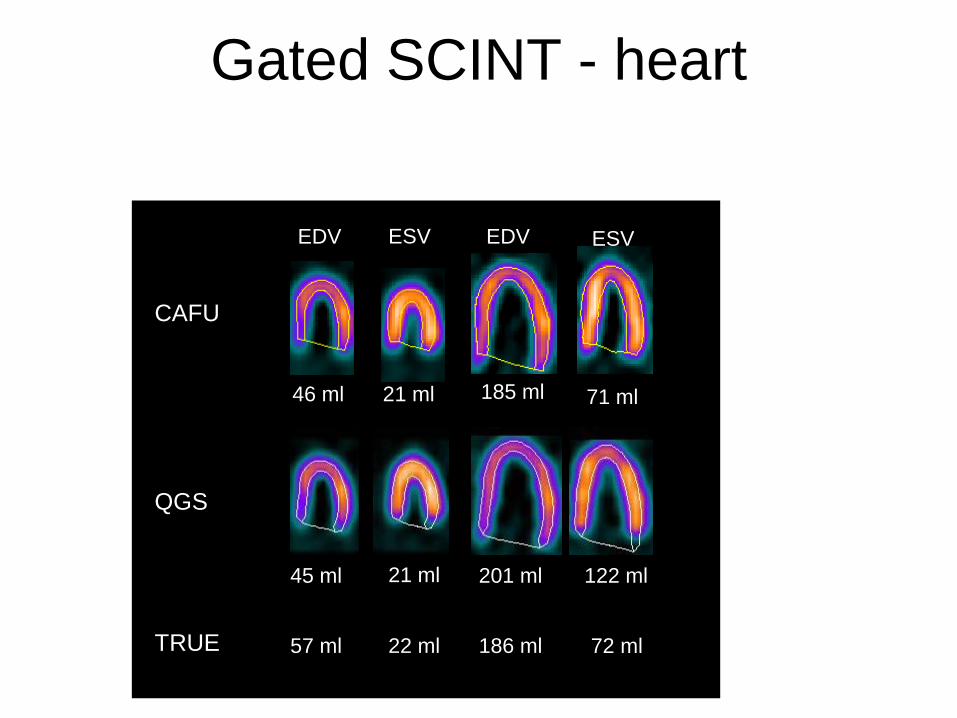
Gated SCINT - heart
CAFU
QGS
EDV ESV EDV ESV
185 ml 46 ml 21 ml 71 ml
45 ml 21 ml 201 ml 122 ml
TRUE 57 ml 22 ml 186 ml 72 ml
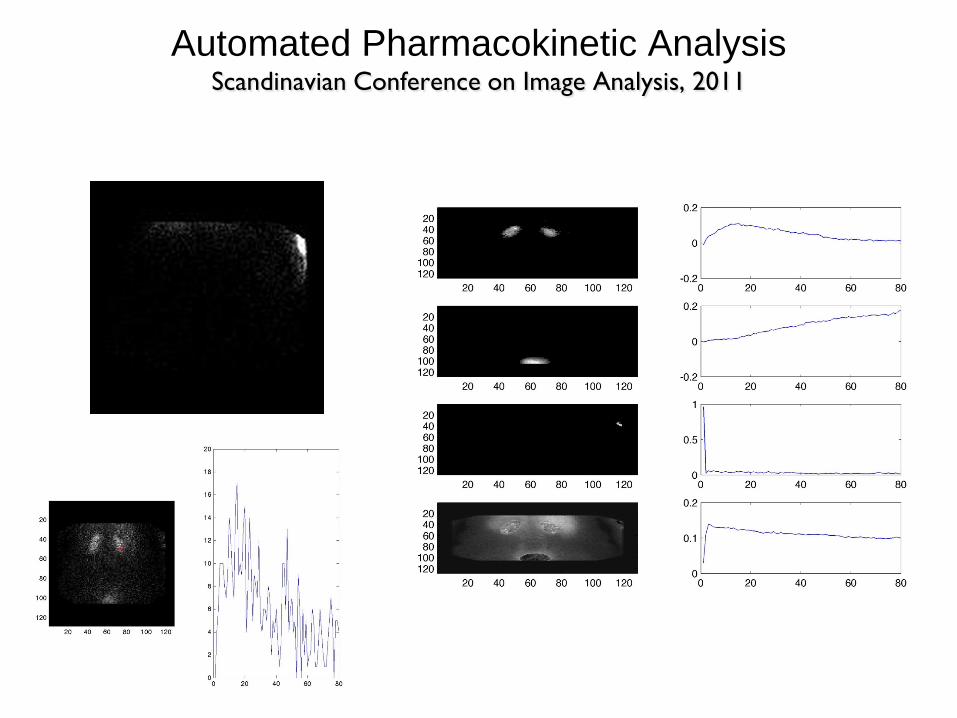
Automated Pharmacokinetic Analysis Scandinavian Conference on Image Analysis, 2011

Questionaire
http://voto.se/poll/FMNA30