Embed Size (px)
Citation preview
Icelandic cod HCR - lessons learned
Einar HjörleifssonMarine Research Institute
Reykjavík, Iceland
2 Personal background
Academic: Biological oceanographer Professional
Stock assessment within MRI NWWG and ACFM within ICES University teaching Communication & partnership with
fishermen
HCR - limited, but practical experience as being partly responsible for the numbers that the rule uses.
3 Talk structure
Icelandic cod - current state of the resource
The harvest control rule Stock assessment performance History of the responses to
overestimation “Amendments” by fishery scientist Some of the lessons learned
4
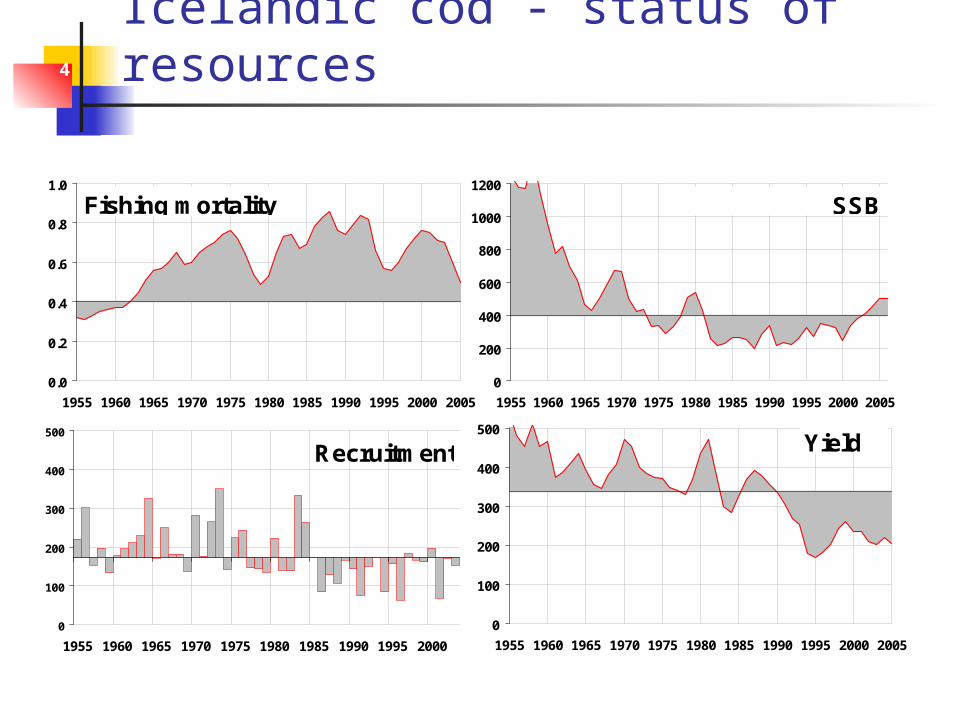
Icelandic cod - status of resources
0.0
0.2
0.4
0.6
0.8
1.0
1955 1960 1965 1970 1975 1980 1985 1990 1995 2000 2005
Fishing mortality
0
200
400
600
800
1000
1200
1955 1960 1965 1970 1975 1980 1985 1990 1995 2000 2005
SSB
0
100
200
300
400
500
1955 1960 1965 1970 1975 1980 1985 1990 1995 2000 2005
Yield
0
100
200
300
400
500
1955 1960 1965 1970 1975 1980 1985 1990 1995 2000
Recruitment
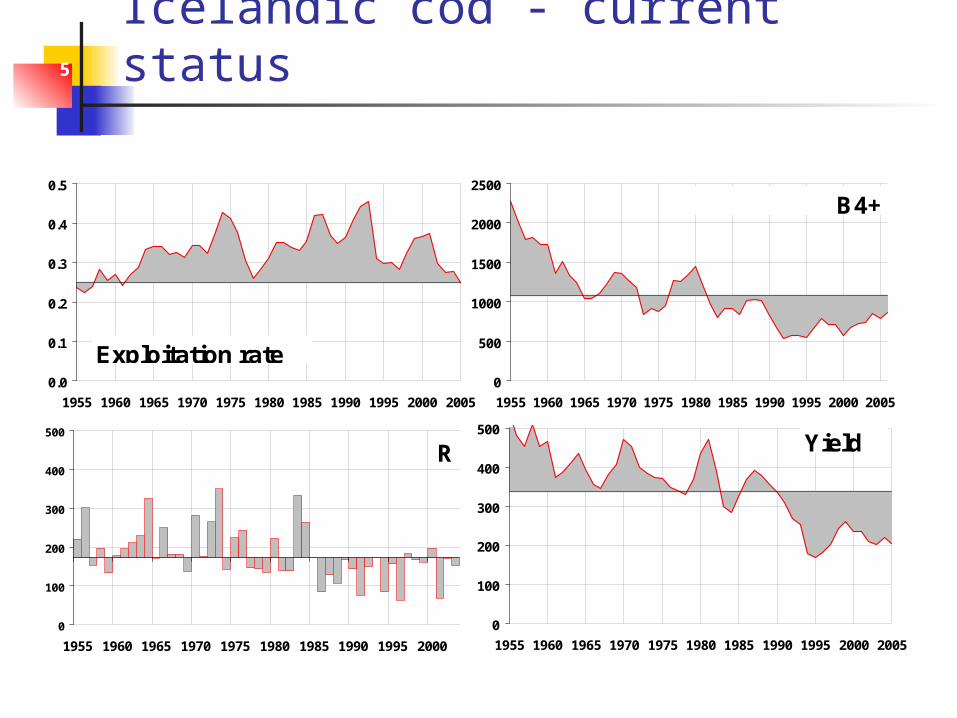
5 Icelandic cod - current status
0.0
0.1
0.2
0.3
0.4
0.5
1955 1960 1965 1970 1975 1980 1985 1990 1995 2000 2005
Exploitation rate0
500
1000
1500
2000
2500
1955 1960 1965 1970 1975 1980 1985 1990 1995 2000 2005
B4+
0
100
200
300
400
500
1955 1960 1965 1970 1975 1980 1985 1990 1995 2000 2005
Yield
0
100
200
300
400
500
1955 1960 1965 1970 1975 1980 1985 1990 1995 2000
R
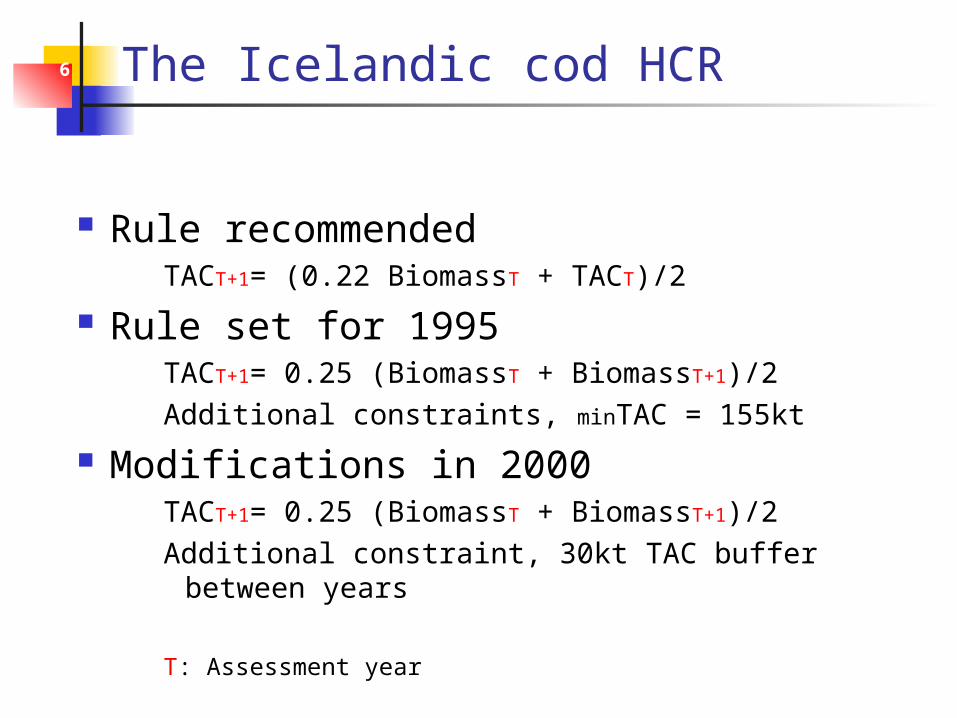
6 The Icelandic cod HCR
Rule recommendedTACT+1= (0.22 BiomassT + TACT)/2
Rule set for 1995TACT+1= 0.25 (BiomassT + BiomassT+1)/2Additional constraints, minTAC = 155kt
Modifications in 2000 TACT+1= 0.25 (BiomassT + BiomassT+1)/2Additional constraint, 30kt TAC buffer between
years
T: Assessment year
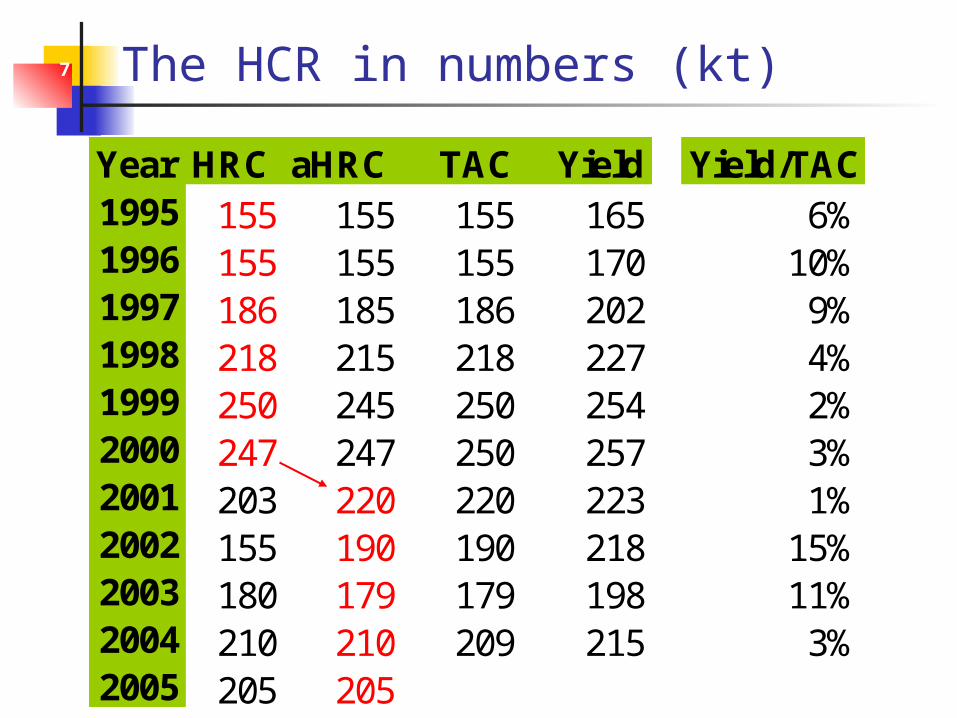
7 The HCR in numbers (kt)
Year HRC aHRC TAC Yield Yield/TAC1995 155 155 155 165 6%1996 155 155 155 170 10%1997 186 185 186 202 9%1998 218 215 218 227 4%1999 250 245 250 254 2%2000 247 247 250 257 3%2001 203 220 220 223 1%2002 155 190 190 218 15%2003 180 179 179 198 11%2004 210 210 209 215 3%2005 205 205
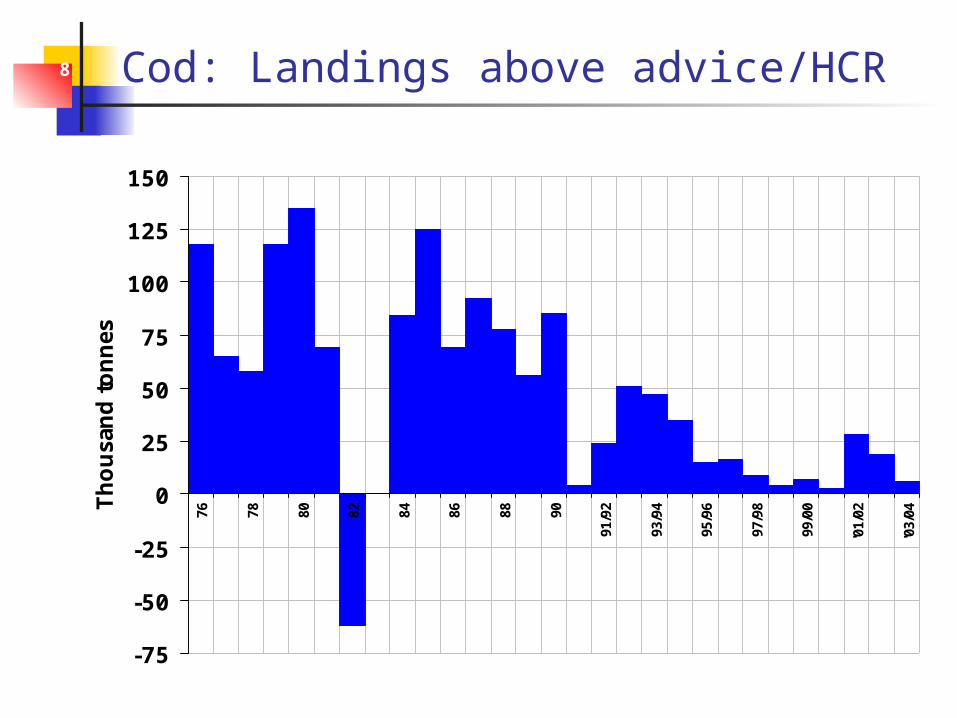
8 Cod: Landings above advice/HCR
-75
-50
-25
0
25
50
75
100
125
15076 78 80 82 84 86 88 90
91/9
2
93/9
4
95/9
6
97/9
8
99/0
0
'01/
02
'03/
04
Th
ou
san
d t
on
nes
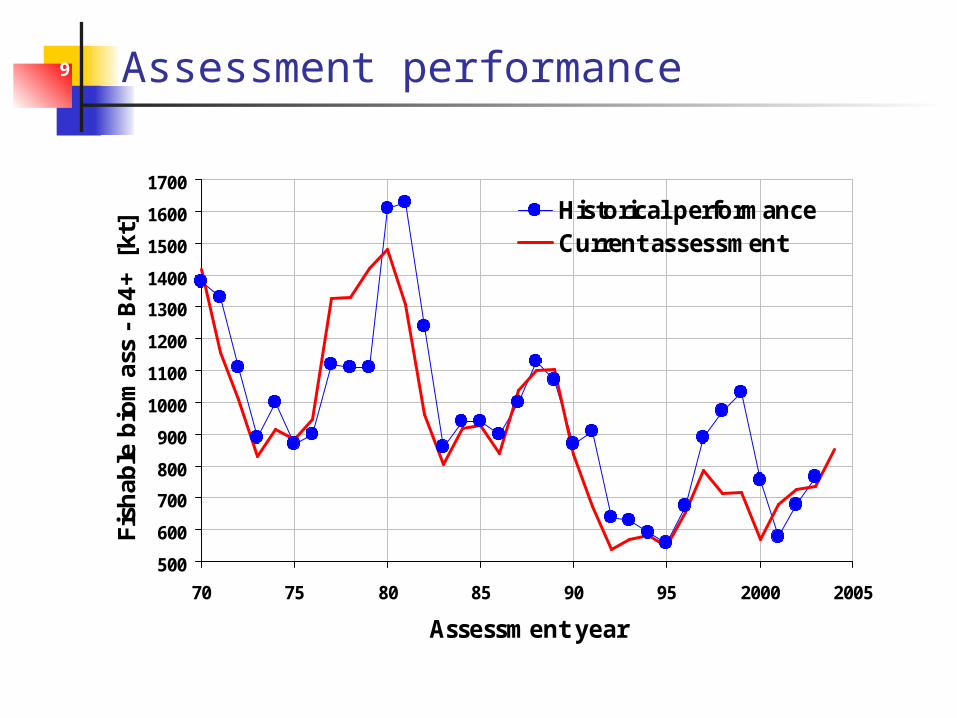
9 Assessment performance
500
600
700
800
900
1000
1100
1200
1300
1400
1500
1600
1700
70 75 80 85 90 95 2000 2005
Assessment year
Fish
able
bio
mas
s -
B4+
[kt
] Historical performanceCurrent assessment
10
0.5
0.6
0.7
0.8
0.9
1.0
1.1
1.2
1.3
1.4
1.5
70 75 80 85 90 95 2000
Conte
mpora
ry/Pre
sent
est
imate
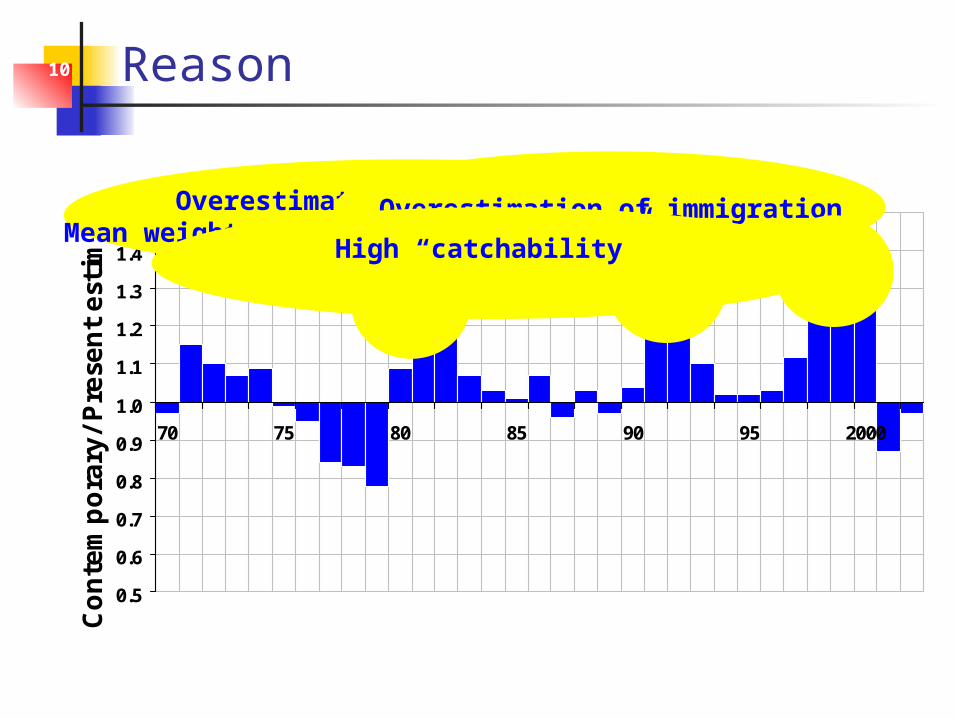
Reason
Overestimation of immigrationMean weight overestimated, capelin collapse
Overestimation of immigration
High “catchability”
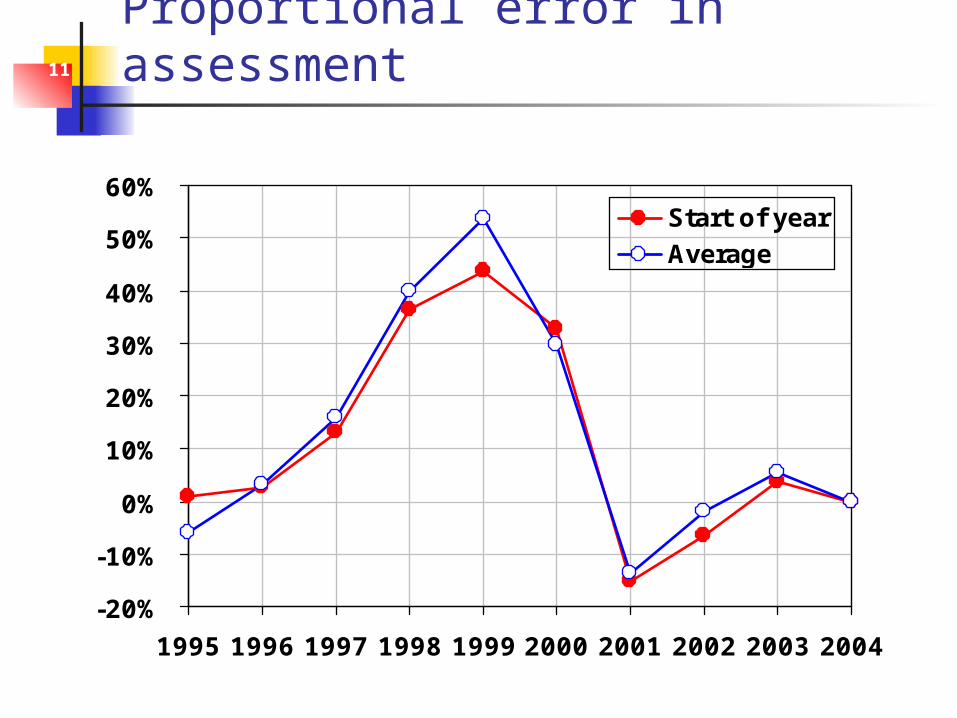
11 Proportional error in assessment
-20%
-10%
0%
10%
20%
30%
40%
50%
60%
1995 1996 1997 1998 1999 2000 2001 2002 2003 2004
Start of yearAverage
12
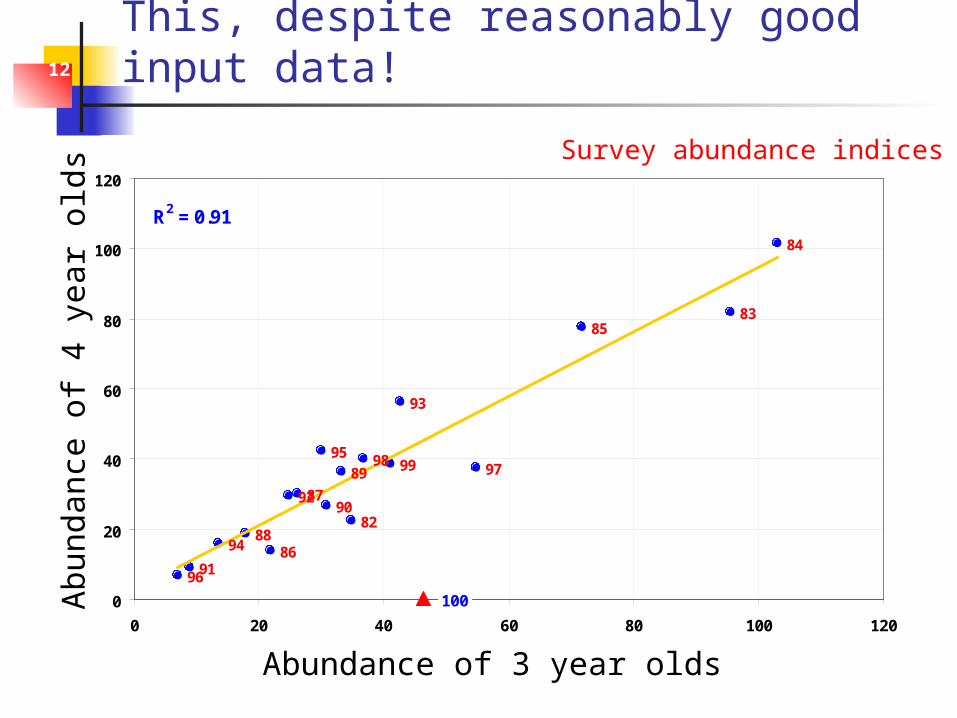
This, despite reasonably good input data!
999897
96
95
94
93
92
91
90
89
88
87
86
85
84
83
82
100
R2 = 0.91
0
20
40
60
80
100
120
0 20 40 60 80 100 120
Fjöldi 3 ára
Fjö
ldi 4
ára
Survey abundance indices
Abundance of 3 year olds
Ab
un
dan
ce o
f 4
year
old
s
13 MRI response in 2000
Because the initial HCR was so tightly knit to stock assessment performance the initial evaluations focused on the fishery science
June 2000, MRI asked John Pope to review the stock assessment for cod.
The main conclusion was that the MRI May 2000 assessment was still overly optimistic with regard to estimating stock abundance in recent years, but that the methodology applied was essentially sound. Several alternative methods gave results with lower abundance in recent years, but all of the methods showed similar patterns in estimating stock abundance.
Formally, Pope was not asked to address the HCR directly.
14 Government response in 2001
In response to further reduction in stock estimation in the 2001 assessment the government set up a group led by Rosenberg to address the following questions:
1) could the problem reasonably expect to have been foreseen on the basis of the observed patterns in the data?
2) can advice be provided that would help to avoid a repeat of such problems in the future?
The short answer to questions were: If the question is “should this situation have been foreseen and
prevented?”, then the answer is probably no. if the question is “could this situation have been foreseen and
prevented knowing what we know now?” then the answer is probably yes.
The Rosenberg report concludes with numerous additional advice both to scientists and managers -->
15 Rosenbergs general conclusion
Managers need to be aware of not just the consequences of a decision, were it to be perfectly (at least on average) implemented. They need also to understand the likelihood of alternative, unintended outcomes, and their consequences. Depending on the result of a detailed risk analysis, the catch fraction in the catch control rule (25%) may need to be adjusted to take account of the probability that the actual catch fraction will exceed the intended level.
16 Rosenbergs general conclusion
In essence, an effective and precautionary management procedure needs to respond quickly when stock status is declining and cautiously when it is increasing. Avoids imprudent increase in catch when the
assessment indicates that stock is increasing. Essentially banks stock growth for future productivity.
Avoids long-term damage to the fishery when the assessment indicates that the stock is decreasing. Reduces risk of reduction in productivity.
Will over time stabilise the catches more effectively.
17 Government response in 2002
Appointed, in 2001, the HCR committee to evaluate the experience and explore alternative rules. Preliminary report came out in 2002 A final report is now on the ministers
desk Recommend that the initially proposed
catch rule should be adopted.
18
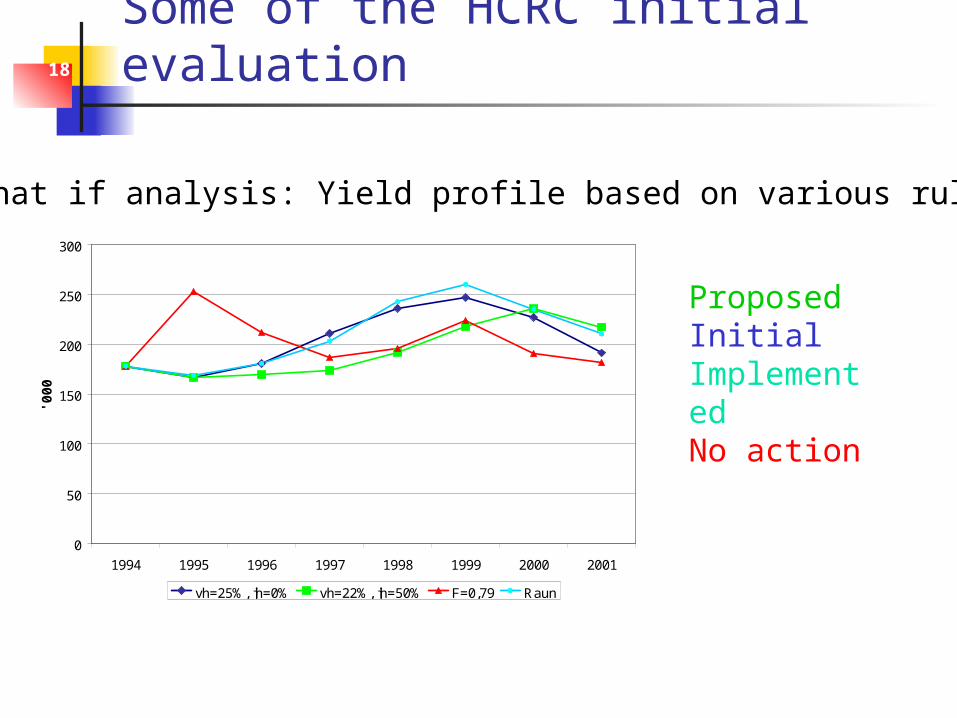
Some of the HCRC initial evaluation
0
50
100
150
200
250
300
1994 1995 1996 1997 1998 1999 2000 2001
'000
t
vh=25%, jh=0% vh=22%, jh=50% F=0,79 Raun
What if analysis: Yield profile based on various rules
ProposedInitialImplementedNo action
19
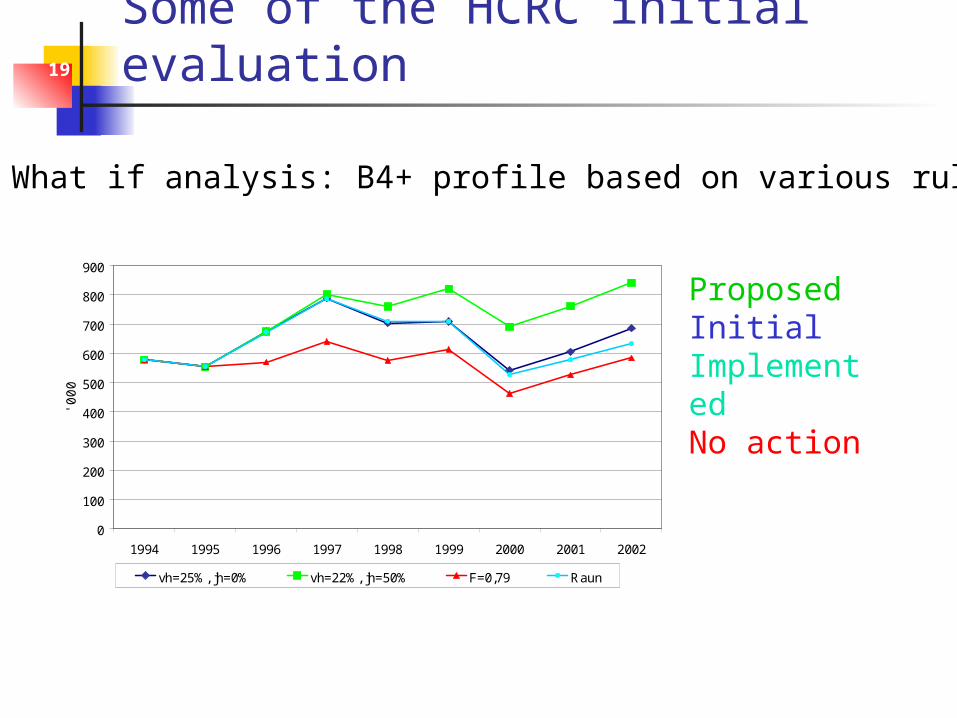
Some of the HCRC initial evaluation
What if analysis: B4+ profile based on various rules
0
100
200
300
400
500
600
700
800
900
1994 1995 1996 1997 1998 1999 2000 2001 2002
'00
0 t
vh=25%, jh=0% vh=22%, jh=50% F=0,79 Raun
ProposedInitialImplementedNo action
20
Some of the HCRC initial evaluation
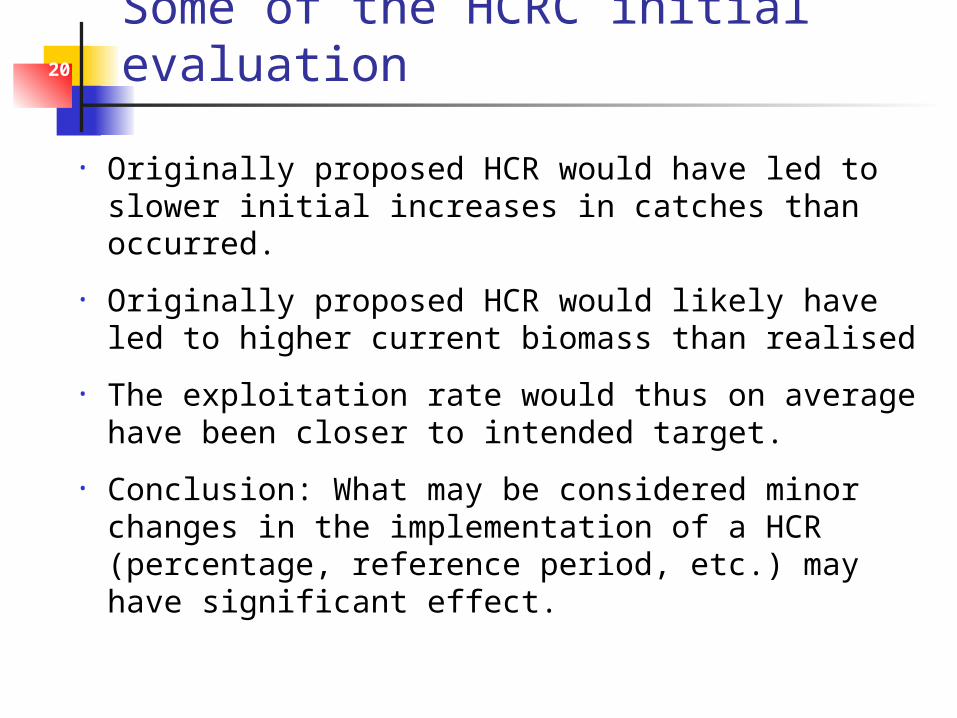
• Originally proposed HCR would have led to slower initial increases in catches than occurred.
• Originally proposed HCR would likely have led to higher current biomass than realised
• The exploitation rate would thus on average have been closer to intended target.
• Conclusion: What may be considered minor changes in the implementation of a HCR (percentage, reference period, etc.) may have significant effect.
21 The fisheries scientists response
The evaluation of the high catchability in the late 90’s Currently not satisfactorily explained Catchability is in a sense a technical
term describing deviations between different data, given model assumptions
While not accounted for, could include numerous causes, not necessarily those related to q
22 Response by MRI
Data & process used in models <2001 Tuning data: Surveys & CPUE from the fishing fleet Rely on one model, if similar as last year don’t worry
Current data & process Tuning data: Survey indices only Run a variety of models each year, with varying
assumption More than one assessor, working initially
independently Changes considered to improve estimates
hindsight analysis indicates that large overestimation might have been prevented if current approach used.
23
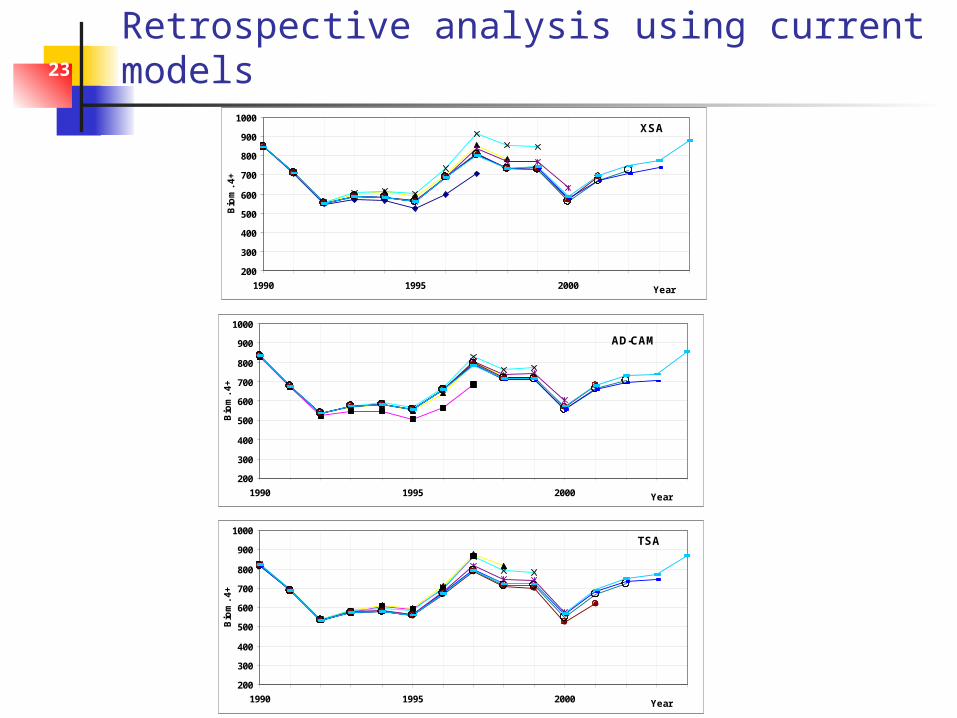
Retrospective analysis using current models
XSA
200
300
400
500
600
700
800
900
1000
1990 1995 2000 Year
Bio
m. 4
+
AD-CAM
200
300
400
500
600
700
800
900
1000
1990 1995 2000 Year
Bio
m. 4
+
TSA
200
300
400
500
600
700
800
900
1000
1990 1995 2000 Year
Bio
m. 4
+
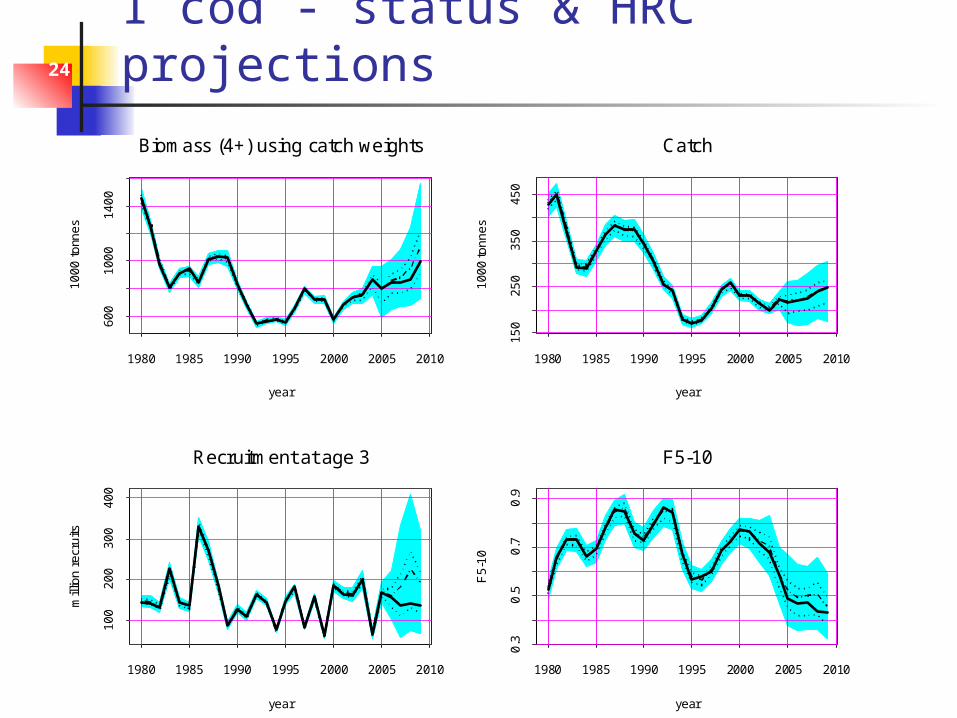
24 I cod - status & HRC projections
year
10
00
to
nne
s
1980 1985 1990 1995 2000 2005 2010
60
01
00
01
40
0
Biomass (4+) using catch weights
year
10
00
ton
ne
s
1980 1985 1990 1995 2000 2005 2010
15
02
50
35
04
50
Catch
year
mill
ion
re
cru
its
1980 1985 1990 1995 2000 2005 2010
10
02
00
30
04
00
Recruitment at age 3
year
F5
-10
1980 1985 1990 1995 2000 2005 2010
0.3
0.5
0.7
0.9
F5-10
25 Some lesson learned I
Despite poor recruitment, overestimation and implementation errors B4+ increased by 50% (1995-2004) Exploitation rates have been reduced, although
still above long term target Subtle changes in HCR can have profound
effects. Attempt has been made at improving the
assessment process Alternative assumptions explored annually, uncertainty
explored, more than one assessor But no guarantee that similar situation may not occur
again.
26 Some lessons learned II
Credibility of fishery science damaged (politicians, industry, public) Inclusion of buffer rules in HCR may for that
reason alone be justifiable. Need for better communication about what can
and cannot be achieved by current stock assessment methods
Credibility not totally ruined, government, with the support of the industry and public, adheres to advice ---->
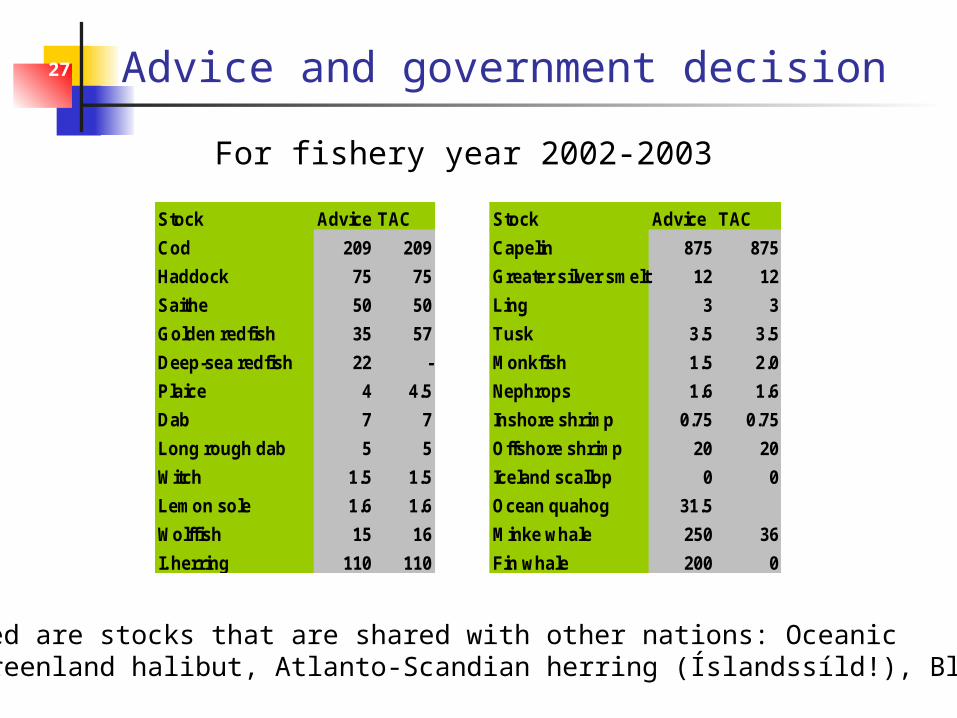
27 Advice and government decision
Stock Advice TAC Stock Advice TAC
Cod 209 209 Capelin 875 875
Haddock 75 75 Greater silver smelt 12 12
Saithe 50 50 Ling 3 3
Golden redfish 35 57 Tusk 3.5 3.5
Deep-sea redfish 22 - Monkfish 1.5 2.0
Plaice 4 4.5 Nephrops 1.6 1.6
Dab 7 7 Inshore shrimp 0.75 0.75
Long rough dab 5 5 Offshore shrimp 20 20
Witch 1.5 1.5 Iceland scallop 0 0
Lemon sole 1.6 1.6 Ocean quahog 31.5
Wolffish 15 16 Minke whale 250 36
I. herring 110 110 Fin whale 200 0
For fishery year 2002-2003
Not included are stocks that are shared with other nations: Oceanicredfish, Greenland halibut, Atlanto-Scandian herring (Íslandssíld!), Blue whiting