Embed Size (px)
Citation preview

© 2019 IHS Markit. All Rights Reserved.
Automotive Industry
Outlook:Managing Volatility and Leveraging Opportunities
in a Dynamic Market Environment
Mike Wall
Executive Director, Automotive Analysis
+1 248 728 8400 Direct
+1 616 446 6885 Mobile
February 2019
© 2019 IHS Markit. All Rights Reserved.
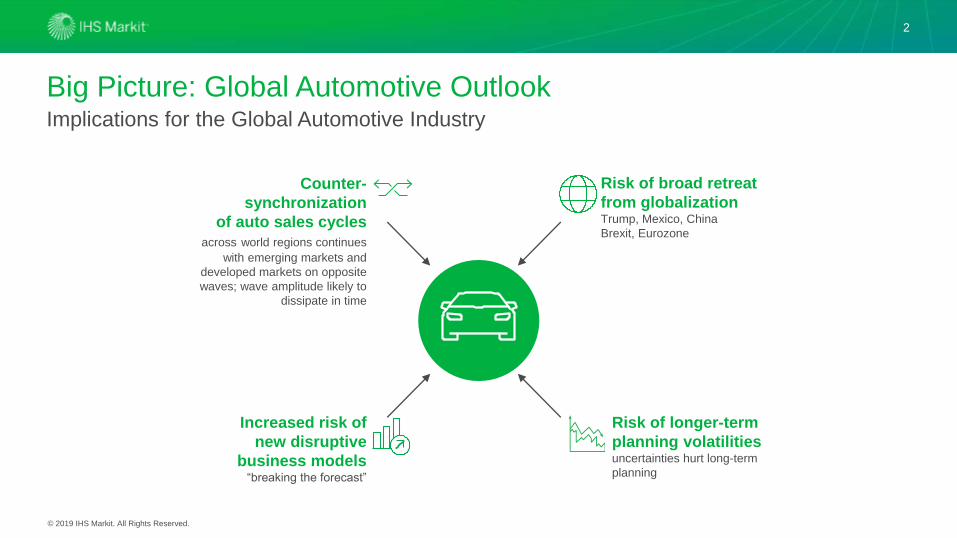
Big Picture: Global Automotive Outlook
2
Implications for the Global Automotive Industry
Counter-
synchronization
of auto sales cycles
across world regions continues
with emerging markets and
developed markets on opposite
waves; wave amplitude likely to
dissipate in time
Risk of broad retreat
from globalizationTrump, Mexico, China
Brexit, Eurozone
Increased risk of
new disruptive
business models “breaking the forecast”
Risk of longer-term
planning volatilitiesuncertainties hurt long-term
planning
© 2019 IHS Markit. All Rights Reserved.
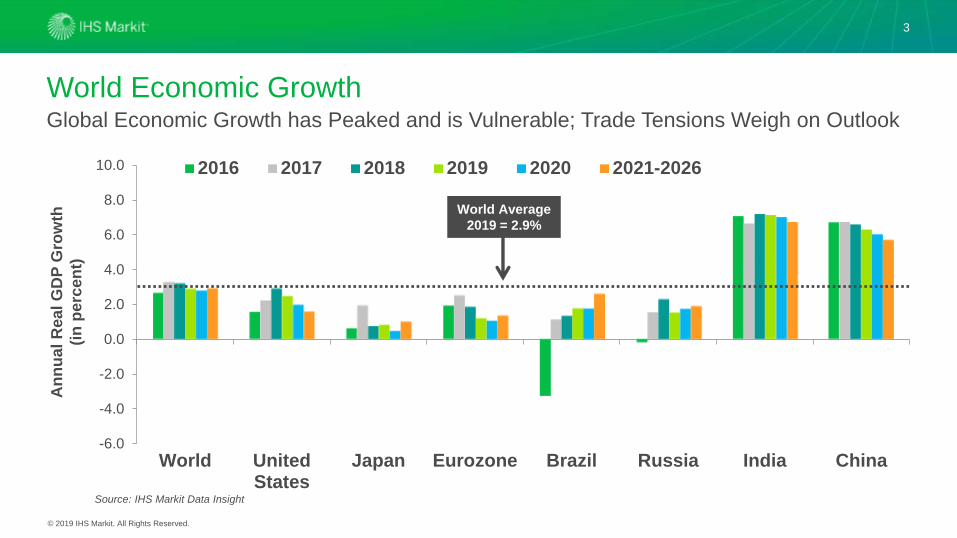
World Economic Growth
3
Global Economic Growth has Peaked and is Vulnerable; Trade Tensions Weigh on Outlook
Source: IHS Markit Data Insight
An
nu
al
Real
GD
P G
row
th
(in
perc
en
t)
-6.0
-4.0
-2.0
0.0
2.0
4.0
6.0
8.0
10.0
World UnitedStates
Japan Eurozone Brazil Russia India China
2016 2017 2018 2019 2020 2021-2026
World Average
2019 = 2.9%
© 2019 IHS Markit. All Rights Reserved.
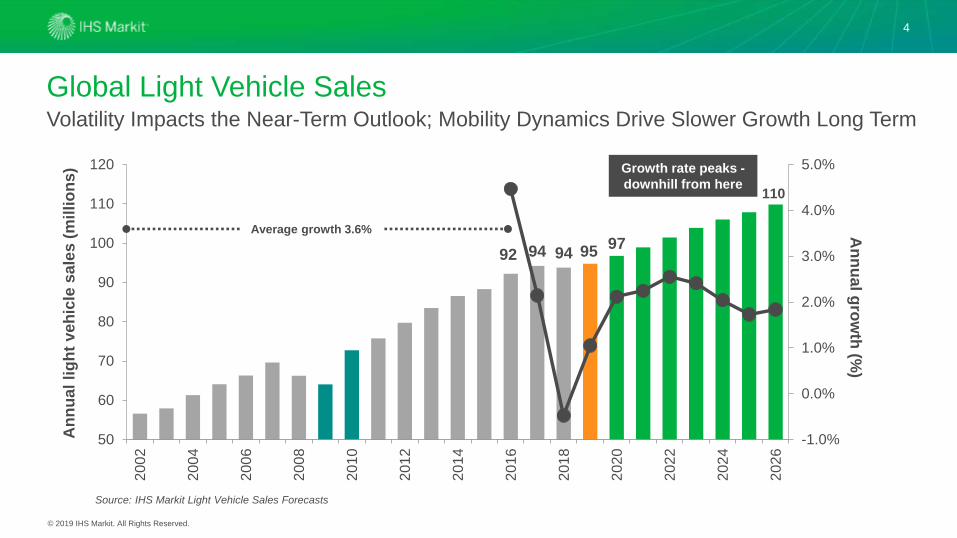
Global Light Vehicle Sales
4
Volatility Impacts the Near-Term Outlook; Mobility Dynamics Drive Slower Growth Long Term
92 94 94
-1.0%
0.0%
1.0%
2.0%
3.0%
4.0%
5.0%
50
60
70
80
90
100
110
120
20
02
20
04
20
06
20
08
20
10
20
12
20
14
20
16
20
18
20
20
20
22
20
24
20
26
Source: IHS Markit Light Vehicle Sales Forecasts
An
nu
al
lig
ht
veh
icle
sale
s (
mil
lio
ns)
An
nu
al g
row
th (%
)
Average growth 3.6%
Growth rate peaks -
downhill from here110
9597
© 2019 IHS Markit. All Rights Reserved.
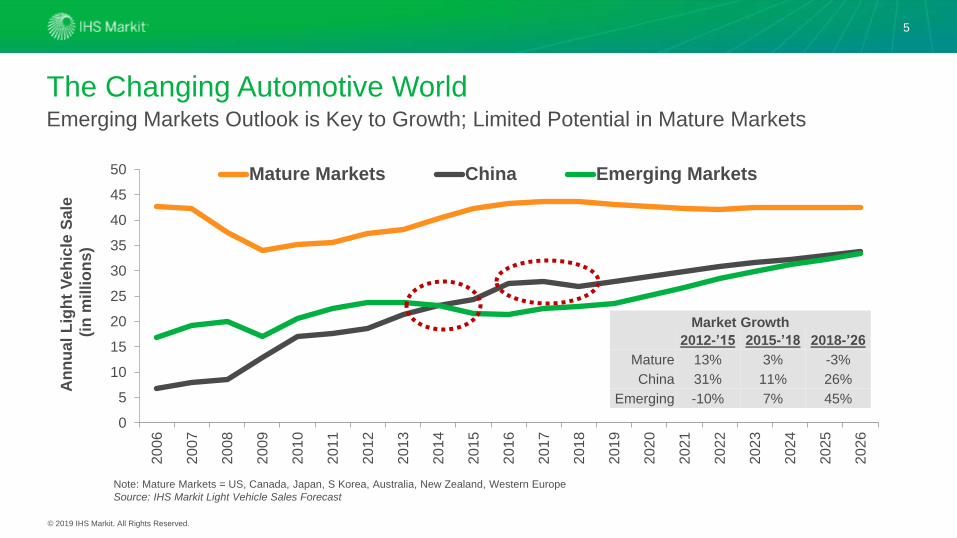
The Changing Automotive World
5
Emerging Markets Outlook is Key to Growth; Limited Potential in Mature Markets
0
5
10
15
20
25
30
35
40
45
502
00
6
20
07
20
08
20
09
20
10
20
11
20
12
20
13
20
14
20
15
20
16
20
17
20
18
20
19
20
20
20
21
20
22
20
23
20
24
20
25
20
26
Mature Markets China Emerging Markets
An
nu
al
Lig
ht
Veh
icle
Sale
(in
mil
lio
ns)
Note: Mature Markets = US, Canada, Japan, S Korea, Australia, New Zealand, Western Europe
Source: IHS Markit Light Vehicle Sales Forecast
Market Growth
2012-’15 2015-’18 2018-’26
Mature 13% 3% -3%
China 31% 11% 26%
Emerging -10% 7% 45%

© 2019 IHS Markit. All Rights Reserved.
Global Light Vehicle Production
6
Marginal Growth Driven by Asia and South America; Material Risks Remain
65
70
75
80
85
90
95
100
2017 2018 GreaterChina
SouthAsia
SouthAmerica
Japan/Korea
Europe NorthAmerica
ME/Africa
2019
95.1
million94.1
million
94.5
million
422,000 281,000 216,000 15,000 -168,000 -176,000 -205,000
Pro
du
cti
on
(m
illi
on
s)
Source: IHS Markit Light Vehicle Production Forecast
+0.4%
© 2019 IHS Markit. All Rights Reserved.
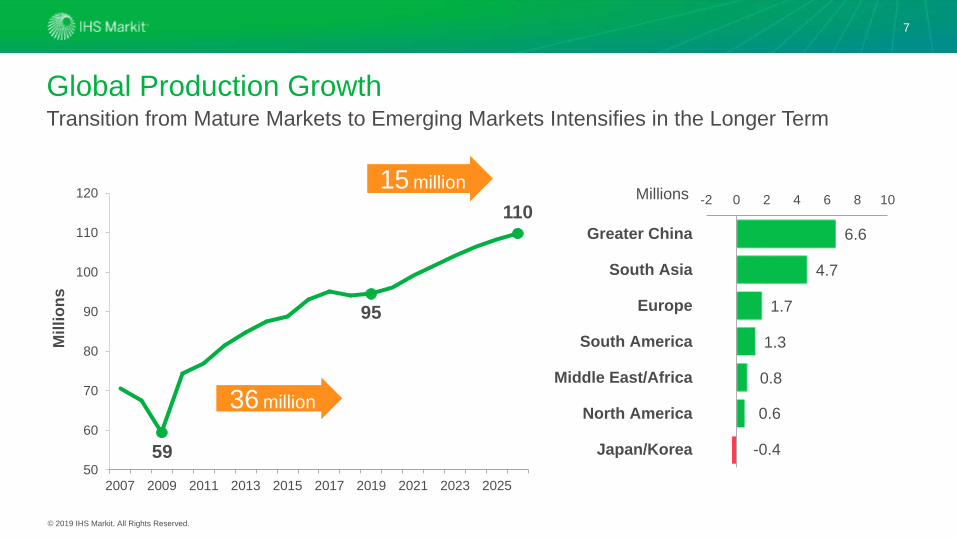
59
95
110
50
60
70
80
90
100
110
120
2007 2009 2011 2013 2015 2017 2019 2021 2023 2025
Mil
lio
ns
15 million
Global Production Growth
7
Transition from Mature Markets to Emerging Markets Intensifies in the Longer Term
6.6
4.7
1.7
1.3
0.8
0.6
-0.4
-2 0 2 4 6 8 10
Greater China
South Asia
Europe
South America
Middle East/Africa
North America
Japan/Korea
Millions
36 million
© 2019 IHS Markit. All Rights Reserved.
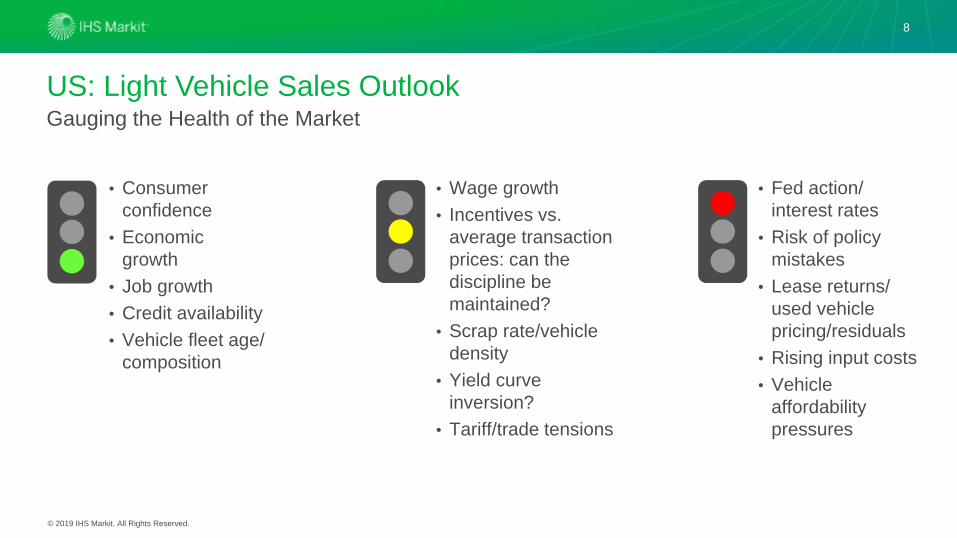
• Consumer
confidence
• Economic
growth
• Job growth
• Credit availability
• Vehicle fleet age/
composition
US: Light Vehicle Sales Outlook
8
Gauging the Health of the Market
• Fed action/
interest rates
• Risk of policy
mistakes
• Lease returns/
used vehicle
pricing/residuals
• Rising input costs
• Vehicle
affordability
pressures
• Wage growth
• Incentives vs.
average transaction
prices: can the
discipline be
maintained?
• Scrap rate/vehicle
density
• Yield curve
inversion?
• Tariff/trade tensions
© 2019 IHS Markit. All Rights Reserved.
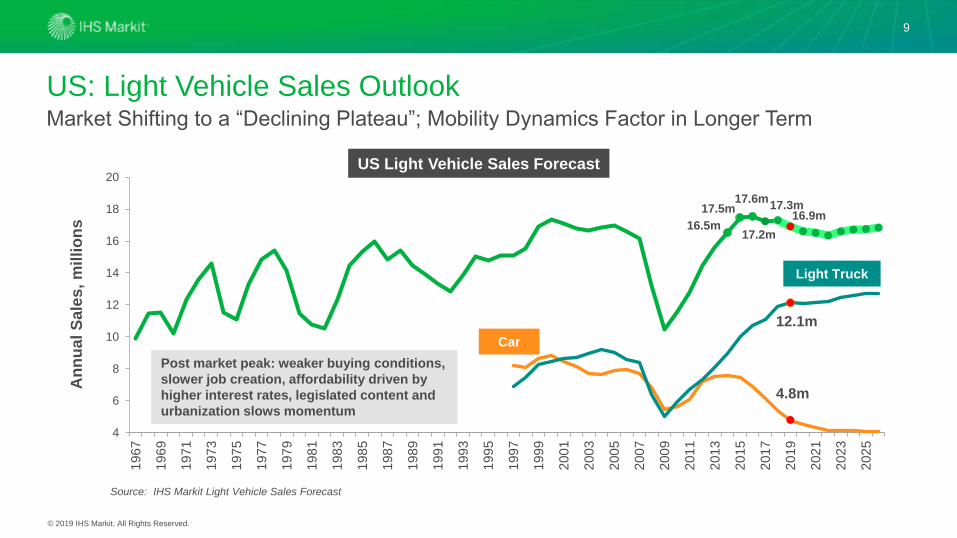
4.8m
12.1m
4
6
8
10
12
14
16
18
20
196
7
196
9
197
1
197
3
197
5
197
7
197
9
198
1
198
3
198
5
198
7
198
9
199
1
199
3
199
5
199
7
199
9
200
1
200
3
200
5
200
7
200
9
201
1
201
3
201
5
201
7
201
9
202
1
202
3
202
5
17.3m
US: Light Vehicle Sales Outlook
9
Market Shifting to a “Declining Plateau”; Mobility Dynamics Factor in Longer Term
US Light Vehicle Sales Forecast
Source: IHS Markit Light Vehicle Sales Forecast
Car
Light Truck
Post market peak: weaker buying conditions,
slower job creation, affordability driven by
higher interest rates, legislated content and
urbanization slows momentum
16.5m
17.5m17.6m
An
nu
al
Sale
s,
mil
lio
ns
17.2m
16.9m
© 2019 IHS Markit. All Rights Reserved.
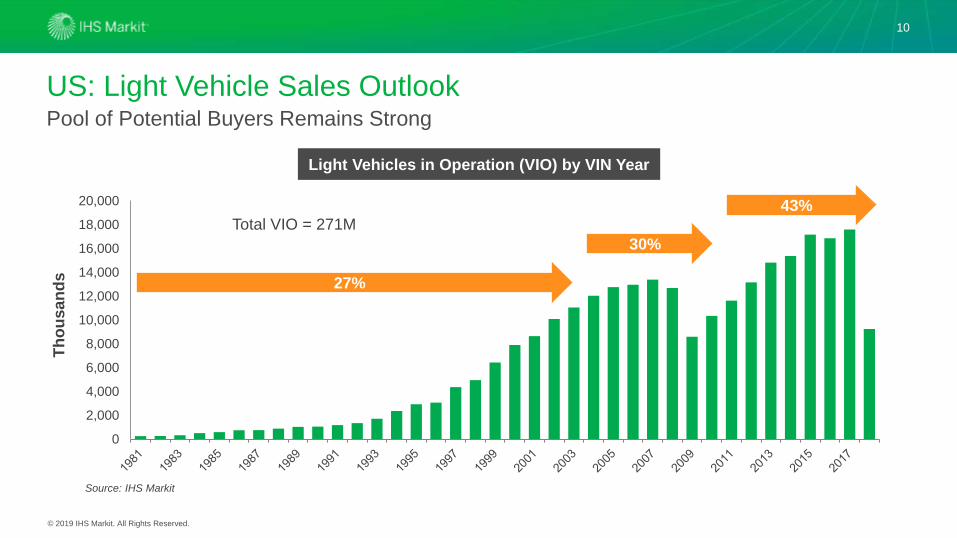
US: Light Vehicle Sales Outlook
10
Pool of Potential Buyers Remains Strong
0
2,000
4,000
6,000
8,000
10,000
12,000
14,000
16,000
18,000
20,000
Th
ou
san
ds
Light Vehicles in Operation (VIO) by VIN Year
Source: IHS Markit
Total VIO = 271M
27%
30%
43%
© 2019 IHS Markit. All Rights Reserved.
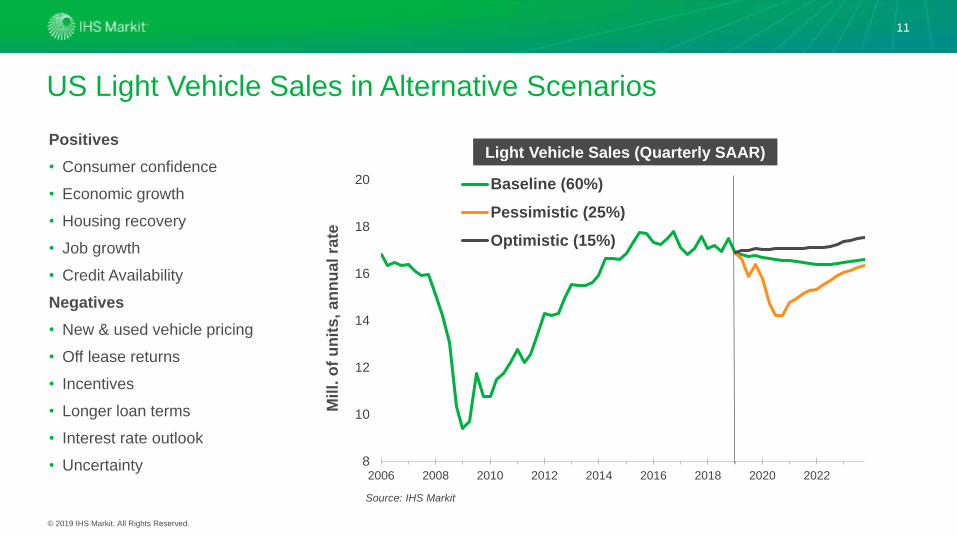
US Light Vehicle Sales in Alternative Scenarios
Positives
• Consumer confidence
• Economic growth
• Housing recovery
• Job growth
• Credit Availability
Negatives
• New & used vehicle pricing
• Off lease returns
• Incentives
• Longer loan terms
• Interest rate outlook
• Uncertainty
11
8
10
12
14
16
18
20
2006 2008 2010 2012 2014 2016 2018 2020 2022
Mil
l. o
f u
nit
s, an
nu
al
rate
Baseline (60%)
Pessimistic (25%)
Optimistic (15%)
Light Vehicle Sales (Quarterly SAAR)
Source: IHS Markit
© 2019 IHS Markit. All Rights Reserved.
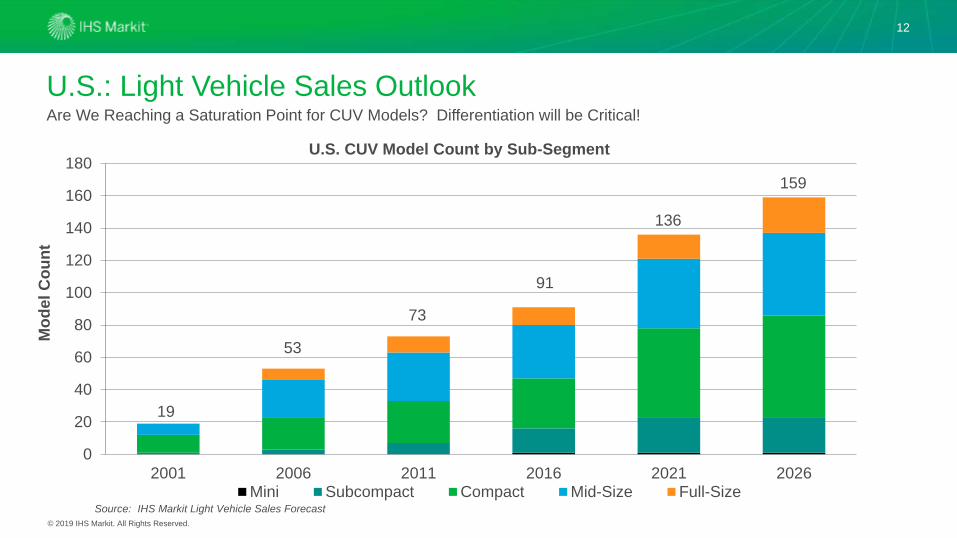
12
U.S.: Light Vehicle Sales OutlookAre We Reaching a Saturation Point for CUV Models? Differentiation will be Critical!
0
20
40
60
80
100
120
140
160
180
2001 2006 2011 2016 2021 2026Mini Subcompact Compact Mid-Size Full-Size
U.S. CUV Model Count by Sub-Segment
Mo
del
Co
un
t
Source: IHS Markit Light Vehicle Sales Forecast
19
159
73
53
91
136
© 2019 IHS Markit. All Rights Reserved.
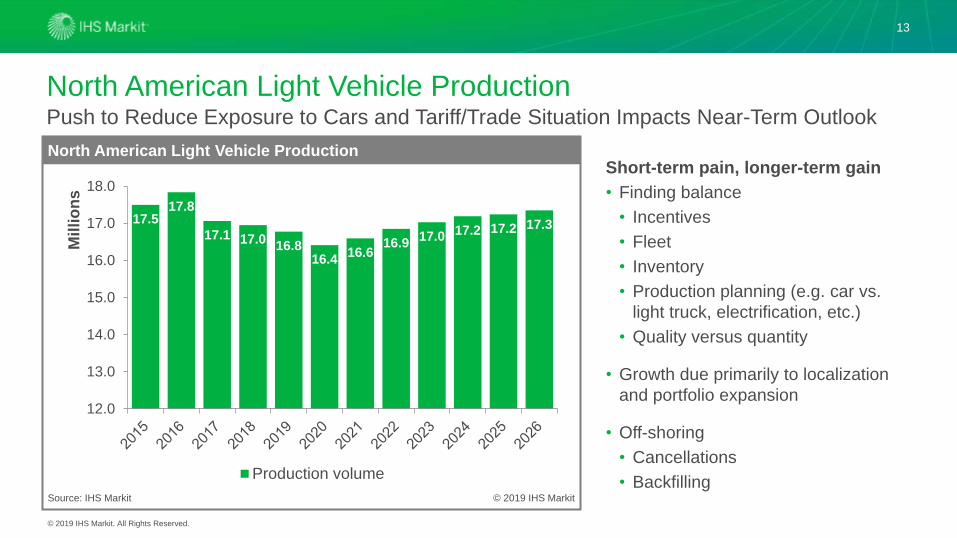
13
North American Light Vehicle Production
Short-term pain, longer-term gain
• Finding balance
• Incentives
• Fleet
• Inventory
• Production planning (e.g. car vs.
light truck, electrification, etc.)
• Quality versus quantity
• Growth due primarily to localization
and portfolio expansion
• Off-shoring
• Cancellations
• BackfillingSource: IHS Markit
North American Light Vehicle Production
© 2019 IHS Markit
17.517.8
17.1 17.016.8
16.416.6
16.917.0 17.2 17.2 17.3
12.0
13.0
14.0
15.0
16.0
17.0
18.0
Mil
lio
ns
Production volume
Push to Reduce Exposure to Cars and Tariff/Trade Situation Impacts Near-Term Outlook
© 2019 IHS Markit. All Rights Reserved.
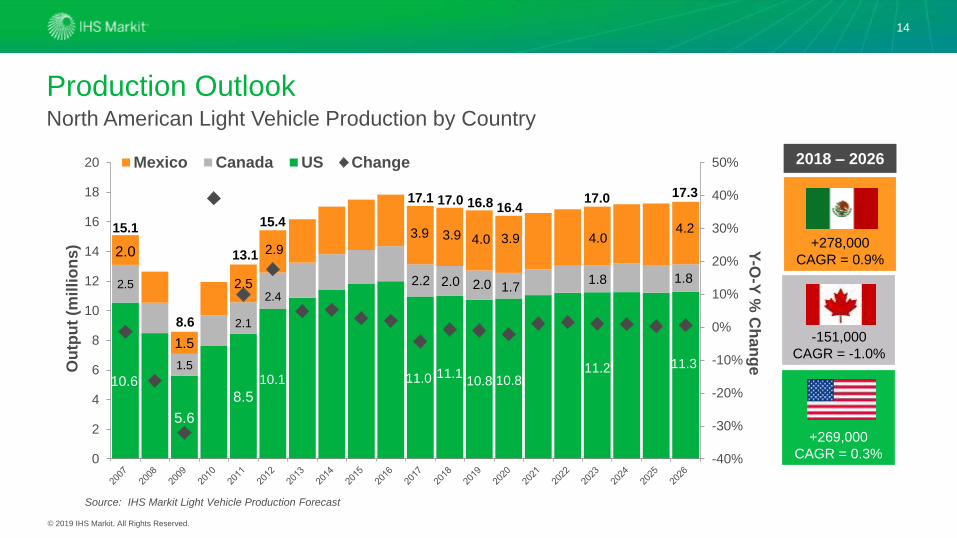
Production Outlook
14
North American Light Vehicle Production by Country
10.6
5.6
8.5
2.5
1.5
2.1
2.0
1.5
2.5
-40%
-30%
-20%
-10%
0%
10%
20%
30%
40%
50%
0
2
4
6
8
10
12
14
16
18
20
Y-O
-Y %
Ch
an
geO
utp
ut
(mil
lio
ns)
Mexico Canada US Change 2018 – 2026
-151,000
CAGR = -1.0%
+278,000
CAGR = 0.9%
15.4
16.8 17.0
15.1
8.6
13.1
10.1
2.4
2.9
17.3
11.3
1.8
4.2
Source: IHS Markit Light Vehicle Production Forecast
11.2
4.0
1.8
17.1
11.0
3.9
2.2
+269,000
CAGR = 0.3%
17.0
11.1
3.9
2.0
10.8
4.0
2.0
16.4
10.8
3.9
1.7
© 2019 IHS Markit. All Rights Reserved.
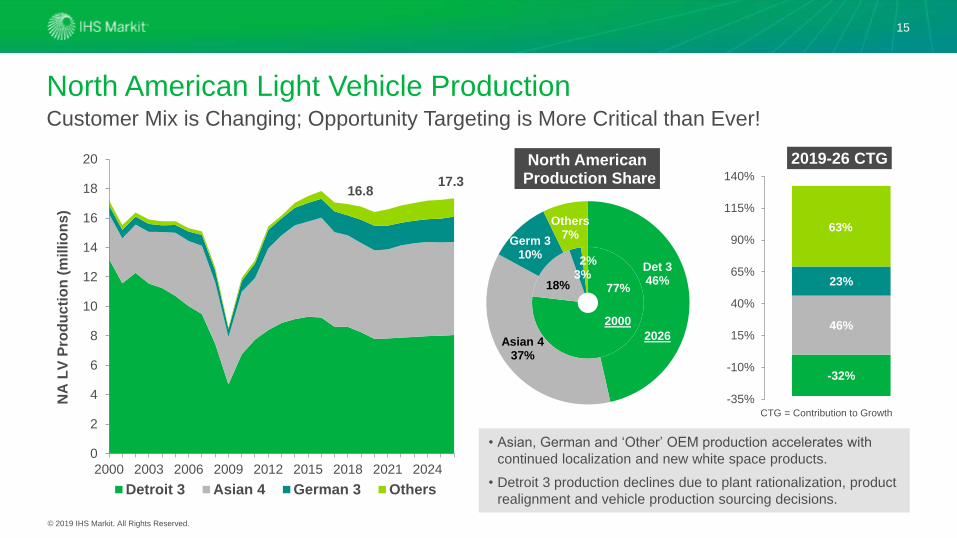
North American Light Vehicle Production
15
Customer Mix is Changing; Opportunity Targeting is More Critical than Ever!
77%18%3%2%
Det 346%
Asian 437%
Germ 310%
Others7%
North AmericanProduction Share
0
2
4
6
8
10
12
14
16
18
20
2000 2003 2006 2009 2012 2015 2018 2021 2024
NA
LV
Pro
du
cti
on
(m
illio
ns)
Detroit 3 Asian 4 German 3 Others
2000
2026
• Asian, German and ‘Other’ OEM production accelerates with
continued localization and new white space products.
• Detroit 3 production declines due to plant rationalization, product
realignment and vehicle production sourcing decisions.
-32%
46%
23%
63%
-35%
-10%
15%
40%
65%
90%
115%
140%
2019-26 CTG
CTG = Contribution to Growth
17.316.8
© 2019 IHS Markit. All Rights Reserved.
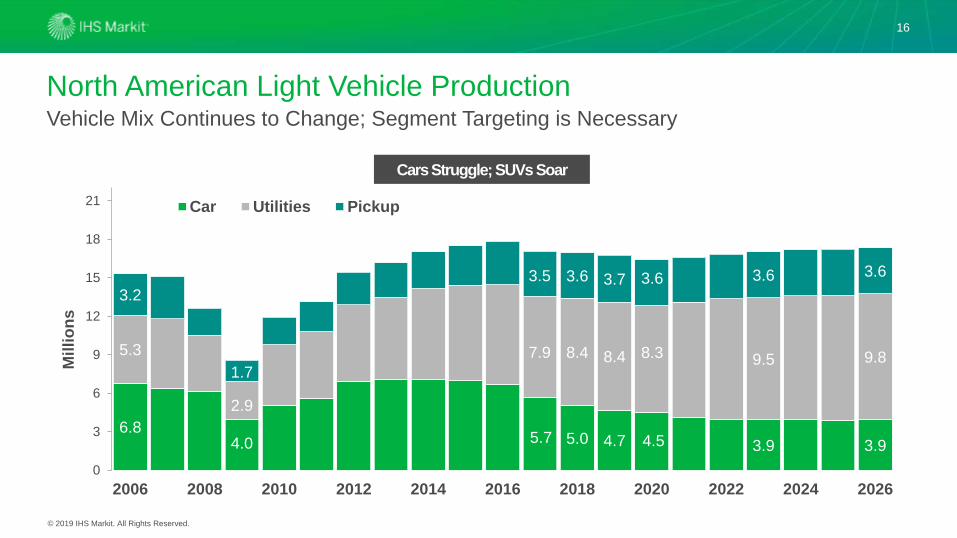
North American Light Vehicle Production
16
Vehicle Mix Continues to Change; Segment Targeting is Necessary
Cars Struggle; SUVs Soar
6.85.0 4.7 3.9 3.9
5.3 8.4 8.4 9.5 9.8
3.2
3.6 3.7 3.6 3.6
0
3
6
9
12
15
18
21
2006 2008 2010 2012 2014 2016 2018 2020 2022 2024 2026
Mil
lio
ns
Car Utilities Pickup
1.7
2.9
4.0
3.5
7.9
5.7
3.6
8.3
4.5
© 2019 IHS Markit. All Rights Reserved.
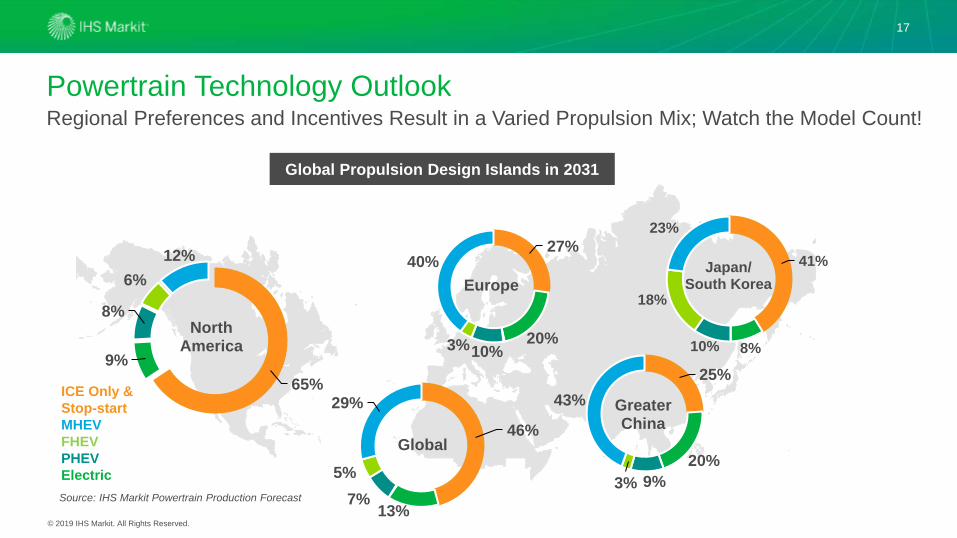
Powertrain Technology Outlook
17
Regional Preferences and Incentives Result in a Varied Propulsion Mix; Watch the Model Count!
ICE Only &
Stop-start
MHEV
FHEV
PHEV
Electric
Source: IHS Markit Powertrain Production Forecast
27%
20%10%3%
40%
Europe
41%
8%10%
18%
23%
Japan/South Korea
Global Propulsion Design Islands in 2031
65%
9%
8%
6%
12%
NorthAmerica
25%
20%
9%3%
43% GreaterChina46%
13%7%
5%
29%
Global

© 2019 IHS Markit. All Rights Reserved.
Thank You!
Mike Wall
Executive Director, Automotive Analysis
+1 248 728 8400 Direct
+1 616 446 6885 Mobile
18
IHS Markit Customer Care
Americas: +1 800 IHS CARE (+1 800 447 2273)
Europe, Middle East, and Africa: +44 (0) 1344 328 300
Asia and the Pacific Rim: +604 291 3600
Disclaimer
The information contained in this presentation is confidential. Any unauthorized use, disclosure, reproduction, or dissemination, in full or in part, in any media or by any means, without the prior written permission
of IHS Markit Ltd. or any of its affiliates ("IHS Markit") is strictly prohibited. IHS Markit owns all IHS Markit logos and trade names contained in this presentation that are subject to license. Opinions, statements,
estimates, and projections in this presentation (including other media) are solely those of the individual author(s) at the time of writing and do not necessarily reflect the opinions of IHS Markit. Neither IHS Markit
nor the author(s) has any obligation to update this presentation in the event that any content, opinion, statement, estimate, or projection (collectively, "information") changes or subsequently becomes inaccurate.
IHS Markit makes no warranty, expressed or implied, as to the accuracy, completeness, or timeliness of any information in this presentation, and shall not in any way be liable to any recipient for any
inaccuracies or omissions. Without limiting the foregoing, IHS Markit shall have no liability whatsoever to any recipient, whether in contract, in tort (including negligence), under warranty, under statute or
otherwise, in respect of any loss or damage suffered by any recipient as a result of or in connection with any information provided, or any course of action determined, by it or any third party, whether or not based
on any information provided. The inclusion of a link to an external website by IHS Markit should not be understood to be an endorsement of that website or the site's owners (or their products/services). IHS
Markit is not responsible for either the content or output of external websites. Copyright © 2018, IHS MarkitTM. All rights reserved and all intellectual property rights are retained by IHS Markit.