Embed Size (px)
Citation preview

NAFTA Automotive Outlook: Focus Mexico
UDEM
April 2013
Copyright © 2013 IHS Inc. All Rights Reserved.
Agenda
• Macroeconomic outlook
• Global sales and production outlook
• Europe outlook
• Americas outlook
• Mexico Production
• Summary

Copyright © 2013 IHS Inc. All Rights Reserved.
-8
-6
-4
-2
0
2
4
6
8
10
World UnitedStates
Japan Eurozone Brazil Russia India China
2011 2012 2013 2014 2015-20
World economic growth Modest gains expected; significant threats remain
Annu
al re
al G
DP
gro
wth
in %
Debt crisis
continues
Source: IHS DataInsight
World average
2013
Political stalemate may
cause US recession Hard landing
averted?
Copyright © 2013 IHS Inc. All Rights Reserved.
0.4
0.6
0.8
1.0
1.2
1.4
1.6
1.8
2.0
2.2
2.4
Jan'0
7
Ja
n'0
8
Jan'0
9
Jan'1
0
Jan'1
1
Jan'1
2
Jan'1
3
ASEAN C Europe E Europe
Gr China India Japan Korea
N America S America W Europe
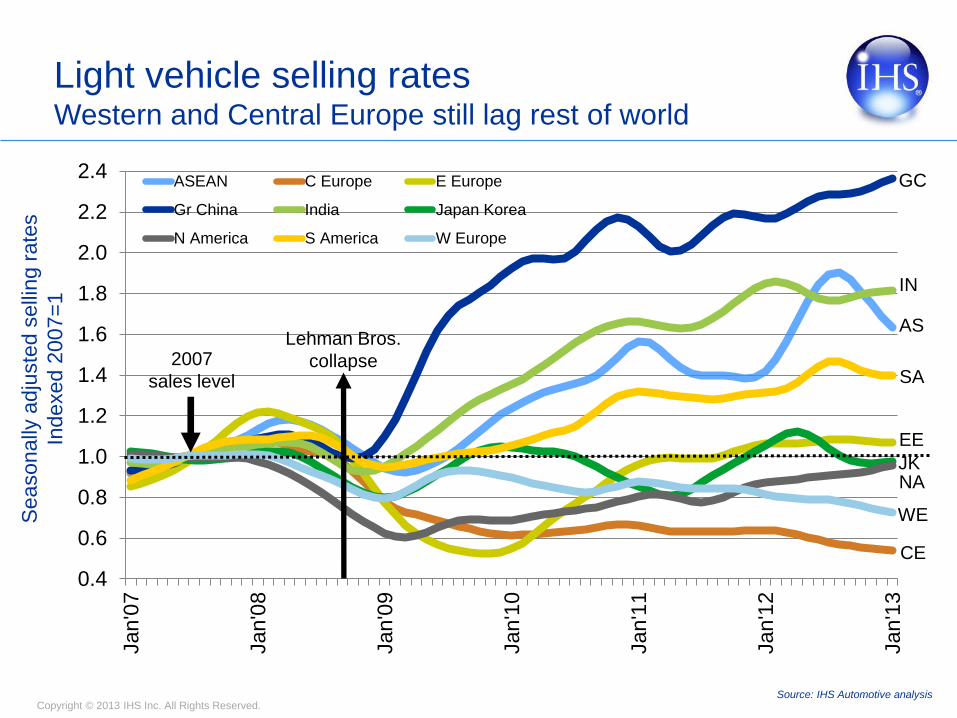
Light vehicle selling rates Western and Central Europe still lag rest of world
Seasonally
adju
ste
d s
elli
ng r
ate
s
Indexed 2
007=
1
GC
IN
AS
NA
2007
sales level
Source: IHS Automotive analysis
CE
SA
JK
WE
Lehman Bros.
collapse
EE
Copyright © 2013 IHS Inc. All Rights Reserved.
0
20
40
60
80
100
200
0
200
1
200
2
200
3
200
4
200
5
200
6
200
7
200
8
200
9
201
0
201
1
201
2
201
3
201
4
201
5
201
6
201
7
201
8
201
9
202
0
Others
BRIC
Japan/Korea
WesternEurope
US
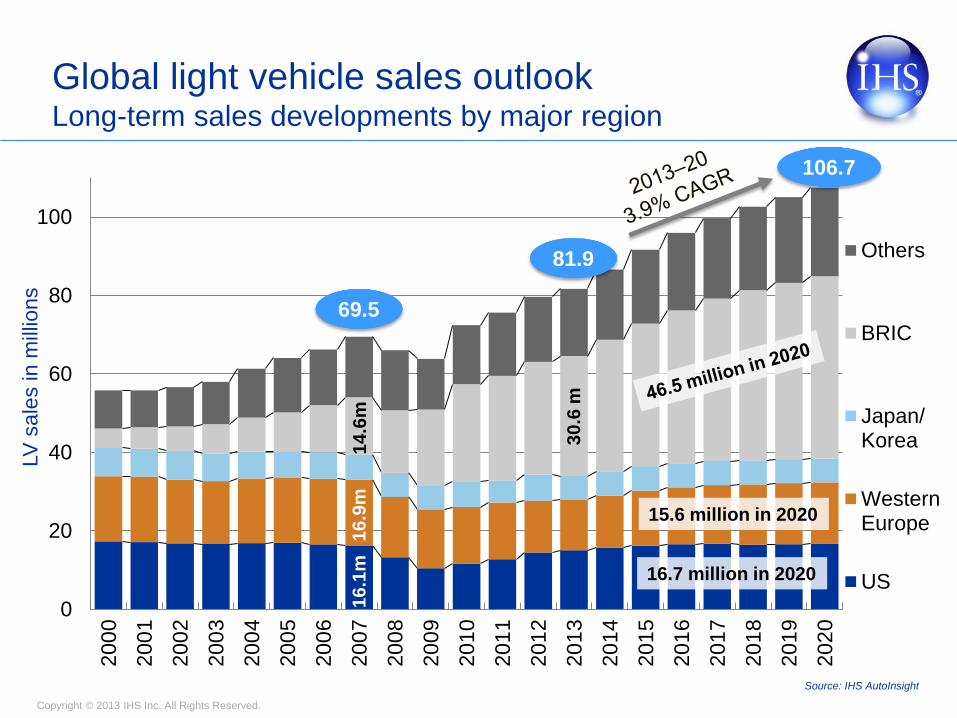
81.9
LV
sale
s in m
illio
ns
69.5
106.7
Global light vehicle sales outlook Long-term sales developments by major region
30
.6 m
16.7 million in 2020
15.6 million in 2020
16
.9m
1
6.1
m
14
.6m
Source: IHS AutoInsight

Copyright © 2013 IHS Inc. All Rights Reserved.
Contingency risk: sales regions Fast-growing regions have largest downside potential
-18%
-16%
-14%
-12%
-10%
-8%
-6%
-4%
-2%
0%
So
uth
Am
erica
Gre
ate
rC
hin
a
Ind
ian
Su
bco
ntin
en
t
AS
EA
N
Mid
dle
Ea
st/
Afr
ica
Ea
st
Eu
rop
e
No
rth
Am
erica
Ce
ntr
al
Eu
rop
e
Oce
an
ia
We
st
Eu
rop
e
Ja
pa
n/
Ko
rea
Pe
ssim
istic c
on
tin
gen
cy
Ch
an
ge
in
sa
les fro
m b
ase
fo
reca
st
World
average
Pessimistic total volume change in 2013-20
Copyright © 2013 IHS Inc. All Rights Reserved.
Agenda
• Macroeconomic outlook
• Global sales and production outlook
• Europe outlook
• Americas outlook
• Mexico
• Summary

Copyright © 2013 IHS Inc. All Rights Reserved.
Global light vehicle sales outlook 2011–13 sales volume
58
63
68
73
78
83
2011 2012 GreaterChina
NorthAmerica
Japan/Korea
SouthAsia
SouthAmerica
Central/East
Europe
MiddleEast/Africa
WestEurope
2013
75.7
million
79.5
million
1.9
million
827,000 26,000 351,000 138,000
-445,000
82.0
million
-478,000
Sa
les in
mill
ion
s
3.1%
135,000

Copyright © 2013 IHS Inc. All Rights Reserved.
-4%
-2%
0%
2%
4%
6%
8%
10%
12%
14%
16%
0
10
20
30
40
50
60
70
80
90
100
2010 2011 2012 Feb 2013
YTD 2013 2014 2015
Global sales Change
Global sales
Sa
les in
mill
ion
s
Ye
ar-o
n-y
ea
r ch
an
ge
s
• In February 2013, global demand slipped 2.9% year-over-year (y/y), but most of the decline relates to
comparative seasonality issues relating to the lunar new year in China.
• From January to February 2013, global light vehicle sales grew an estimated 3.2% y/y. Gains in North
America, South Asia, China, and Eastern Europe have helped to fend off the negativity elsewhere in the
world.
• The light vehicle demand picture continues to be mixed, although bright spots remain, and for 2013, we
have penciled in 81.97 million units, a gain of 3.1%.
Copyright © 2013 IHS Inc. All Rights Reserved.
40
50
60
70
80
90
4
6
8
10
12
14
16
18
20
22
24
26
Jan2010
Apr2010
Jul2010
Oct2010
Jan2011
Apr2011
Jul2011
Oct2011
Jan2012
Apr2012
Jul2012
Oct2012
Jan2013
Apr2013
Jul2013
Oct2013
North America Europe China Japan/Korea Global
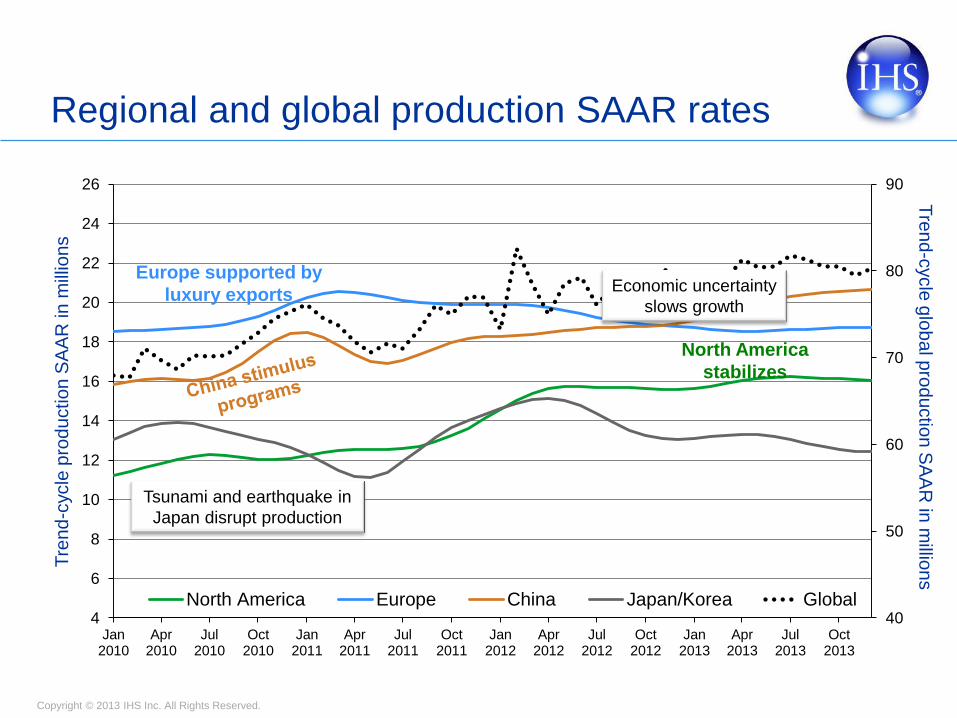
Regional and global production SAAR rates
Europe supported by
luxury exports
North America
stabilizes
Tre
nd-c
ycle
glo
ba
l pro
du
ctio
n S
AA
R in
millio
ns
T
ren
d-c
ycle
pro
du
ction
SA
AR
in
mill
ion
s
Tsunami and earthquake in
Japan disrupt production
Economic uncertainty
slows growth
Copyright © 2013 IHS Inc. All Rights Reserved.
-15%
-10%
-5%
0%
5%
10%
15%
20%
25%
30%
0
10
20
30
40
50
60
70
80
90
100
2010 2011 2012 Feb2013
YTD 2013 2014 2015
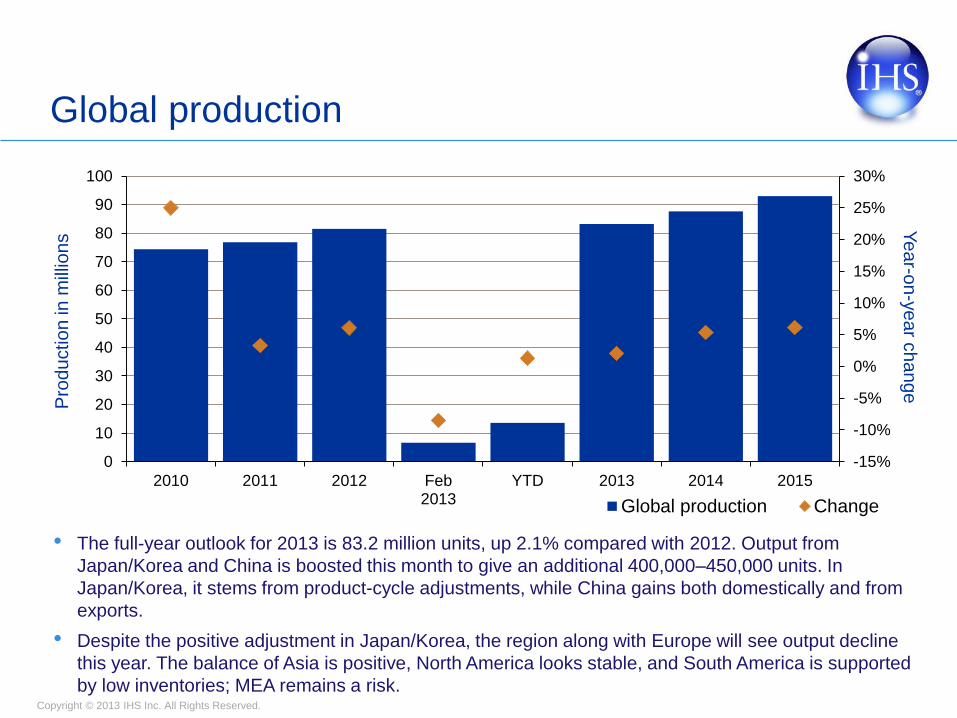
Global production Change
Global production
Pro
du
ctio
n in
mill
ion
s Y
ea
r-on-y
ea
r ch
an
ge
• The full-year outlook for 2013 is 83.2 million units, up 2.1% compared with 2012. Output from
Japan/Korea and China is boosted this month to give an additional 400,000–450,000 units. In
Japan/Korea, it stems from product-cycle adjustments, while China gains both domestically and from
exports.
• Despite the positive adjustment in Japan/Korea, the region along with Europe will see output decline
this year. The balance of Asia is positive, North America looks stable, and South America is supported
by low inventories; MEA remains a risk.

Copyright © 2013 IHS Inc. All Rights Reserved. 12
0
20
40
60
80
100
120
199
7
199
8
199
9
200
0
200
1
200
2
200
3
200
4
200
5
200
6
200
7
200
8
200
9
201
0
20
11
201
2
201
3
201
4
201
5
201
6
201
7
201
8
201
9
202
0
Millio
ns
Other ASEAN S AM India C/E EU China Japan/Kor W EU N AM
2013-20 Global Growth Rates Global Markets 3.8%
Developing Markets 5.8%
Developed Markets 1.5%
58
% D
eve
lop
ing
Re
gio
ns
Source: IHS Automotive Light Vehicle Production Forecast
Global Light Vehicle Production Near-Term Volatility, Long-Term Growth Trajectory

Copyright © 2013 IHS Inc. All Rights Reserved.
Agenda
• Macroeconomic outlook
• Global sales and production outlook
• Europe outlook
• Americas outlook
• The rest of the world
• Questions and answers

Copyright © 2013 IHS Inc. All Rights Reserved.
Euro crisis: Long-term bond yields ECB action easing fears; Cyprus may be trouble
Lo
ng
-term
bond y
ield
s
(in p
erc
ent)
Source: IHS DataInsight
0.0
1.0
2.0
3.0
4.0
5.0
6.0
7.0
8.0F
eb'0
8
May'0
8
Aug'0
8
Nov'0
8
Fe
b'0
9
May'0
9
Aug'0
9
Nov'0
9
Fe
b'1
0
May'1
0
Aug'1
0
Nov'1
0
Fe
b'1
1
May'1
1
Aug'1
1
Nov'1
1
Fe
b'1
2
May'1
2
Aug'1
2
Nov'1
2
Fe
b'1
3
ItalyFranceUnited StatesGermanySpain
The cause of the
current euro crisis Breaking point threshold
Copyright © 2013 IHS Inc. All Rights Reserved.
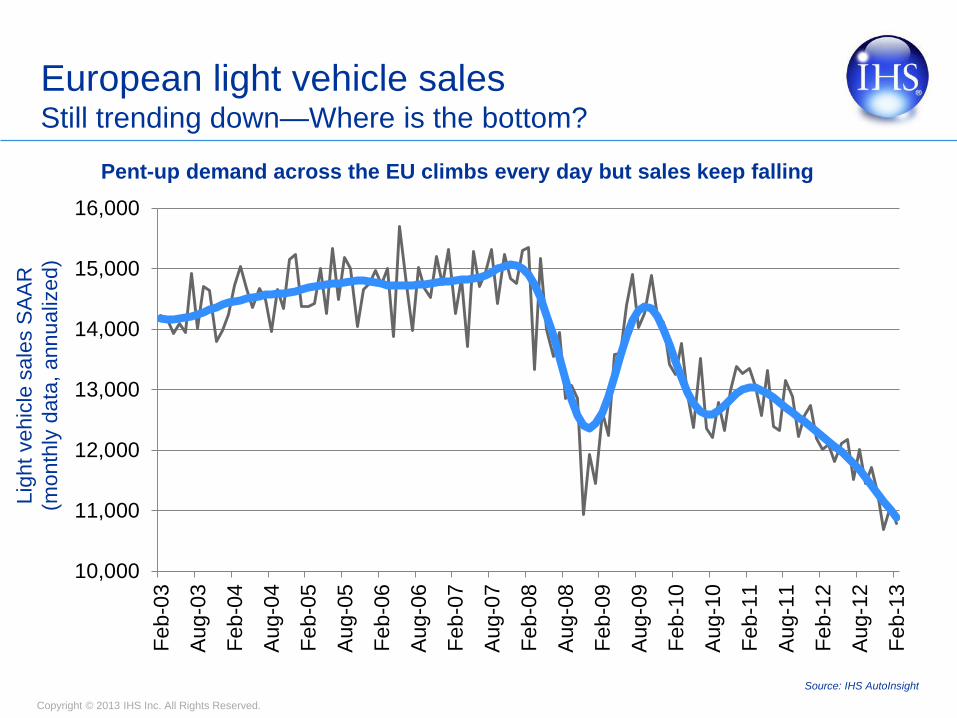
European light vehicle sales Still trending down—Where is the bottom?
Pent-up demand across the EU climbs every day but sales keep falling
10,000
11,000
12,000
13,000
14,000
15,000
16,000
Fe
b-0
3
Aug-0
3
Fe
b-0
4
Aug-0
4
Fe
b-0
5
Aug-0
5
Fe
b-0
6
Aug-0
6
Fe
b-0
7
Aug-0
7
Fe
b-0
8
Au
g-0
8
Fe
b-0
9
Aug-0
9
Fe
b-1
0
Aug-1
0
Fe
b-1
1
Aug-1
1
Fe
b-1
2
Aug-1
2
Fe
b-1
3
Lig
ht
vehic
le s
ale
s S
AA
R
(month
ly d
ata
, annualiz
ed)
Source: IHS AutoInsight

Copyright © 2013 IHS Inc. All Rights Reserved.
-8%
-6%
-4%
-2%
0%
2%
4%
6%
0
5
10
15
20
25
2010 2011 2012 Feb
2013
YTD 2013 2014 2015
Central Europe East Europe West Europe Change
Europe sales outlook S
ale
s in
mill
ion
s
Ye
ar-o
n-y
ea
r ch
an
ge
s
• In February 2013, European sales reached 1.22 million units, down 6.7% versus February 2012. This
result remains in line with the trend that was valid for most of 2012. Once again, Western Europe suffered
heavy declines (down 10.7%), whereas Central and Eastern Europe fared much better (up 4.6%).
Nevertheless, even this side of the continent has been experiencing a clear deceleration lately related to
the cooling off in the Russian market.
• For the near future, we expect the situation to remain bleak: following the 2012 decline, full-year 2013
should keep pointing down, not reaching the 18.0-million-units threshold.
Copyright © 2013 IHS Inc. All Rights Reserved.
Europe production outlook P
rod
uctio
n in
mill
ion
s Y
ea
r-on-y
ea
r ch
an
ge
s
-15%
-10%
-5%
0%
5%
10%
15%
20%
0
5
10
15
20
25
2010 2011 2012 Feb 2013 YTD 2013 2014 2015
Central Europe East Europe West Europe Change
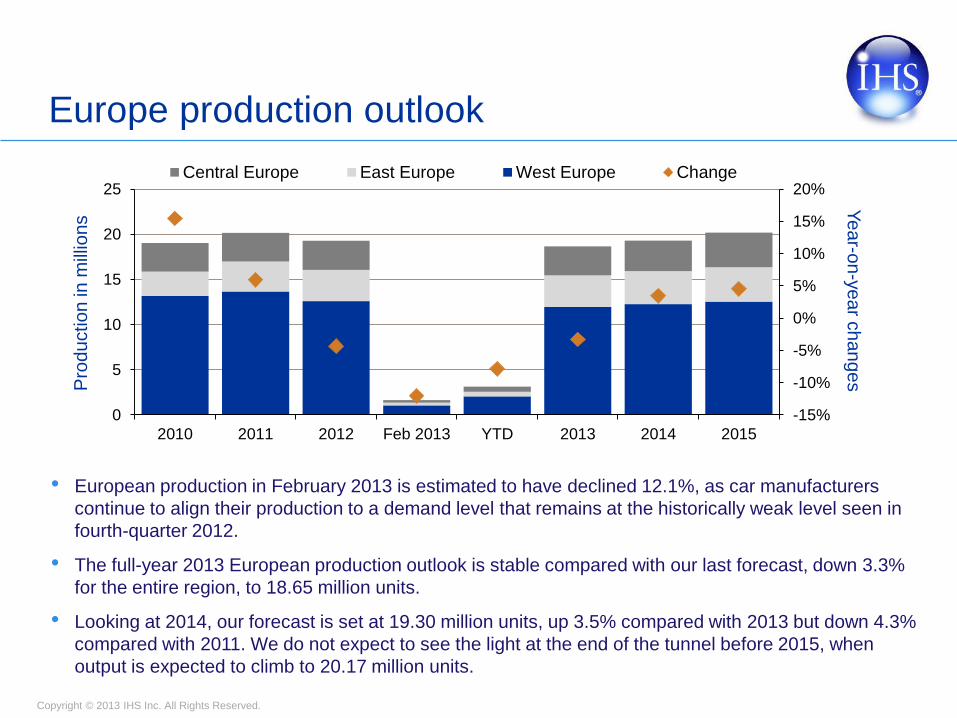
• European production in February 2013 is estimated to have declined 12.1%, as car manufacturers
continue to align their production to a demand level that remains at the historically weak level seen in
fourth-quarter 2012.
• The full-year 2013 European production outlook is stable compared with our last forecast, down 3.3%
for the entire region, to 18.65 million units.
• Looking at 2014, our forecast is set at 19.30 million units, up 3.5% compared with 2013 but down 4.3%
compared with 2011. We do not expect to see the light at the end of the tunnel before 2015, when
output is expected to climb to 20.17 million units.

Copyright © 2013 IHS Inc. All Rights Reserved.
Agenda
• Macroeconomic outlook
• Global sales and production outlook
• Europe outlook
• Americas outlook
• Mexico
• Summary
Copyright © 2013 IHS Inc. All Rights Reserved. 19
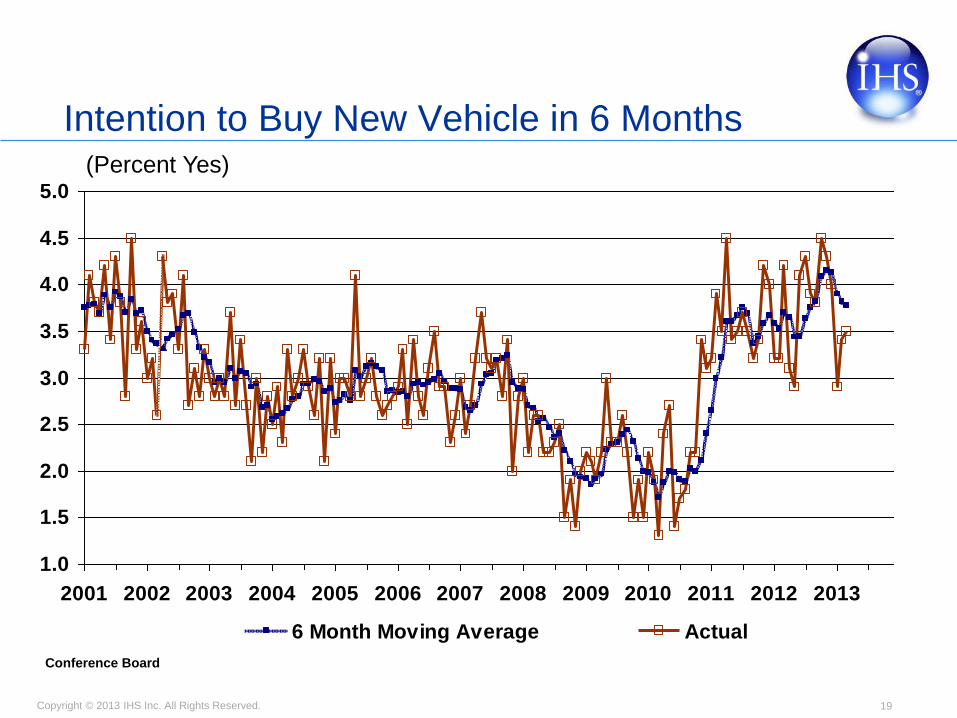
Intention to Buy New Vehicle in 6 Months
1.0
1.5
2.0
2.5
3.0
3.5
4.0
4.5
5.0
2001 2002 2003 2004 2005 2006 2007 2008 2009 2010 2011 2012 2013
6 Month Moving Average Actual
(Percent Yes)
Conference Board

Copyright © 2013 IHS Inc. All Rights Reserved. 20
0.5
1.0
1.5
2.0
2.5
3.0
3.5
4.0
1975 1978 1981 1984 1987 1990 1993 1996 1999 2002 2005 2008 2011
Direct (Bank) Loans Indirect (Dealer) Loans
(% - Accounts past due 30 days or more)
Months
Source: American Bankers Association
New Auto Loans — Delinquency Rates

Copyright © 2013 IHS Inc. All Rights Reserved. 21
New Vehicle Buyers Average Credit Score
640
650
660
670
680
690
700
710
720
730
740
750
760
770
780
Jan-05 Jan-06 Jan-07 Jan-08 Jan-09 Jan-10 Jan-11 Jan-12 Jan-13
6%7%8%9%10%11%12%13%14%15%16%17%18%19%20%21%22%
FICO SCORE % UNDER 670
Avg. Score
Source: CNW Marketing
Copyright © 2013 IHS Inc. All Rights Reserved. 22
55%
60%
65%
70%
75%
80%
85%
Jan-02 Jan-04 Jan-06 Jan-08 Jan-10 Jan-12
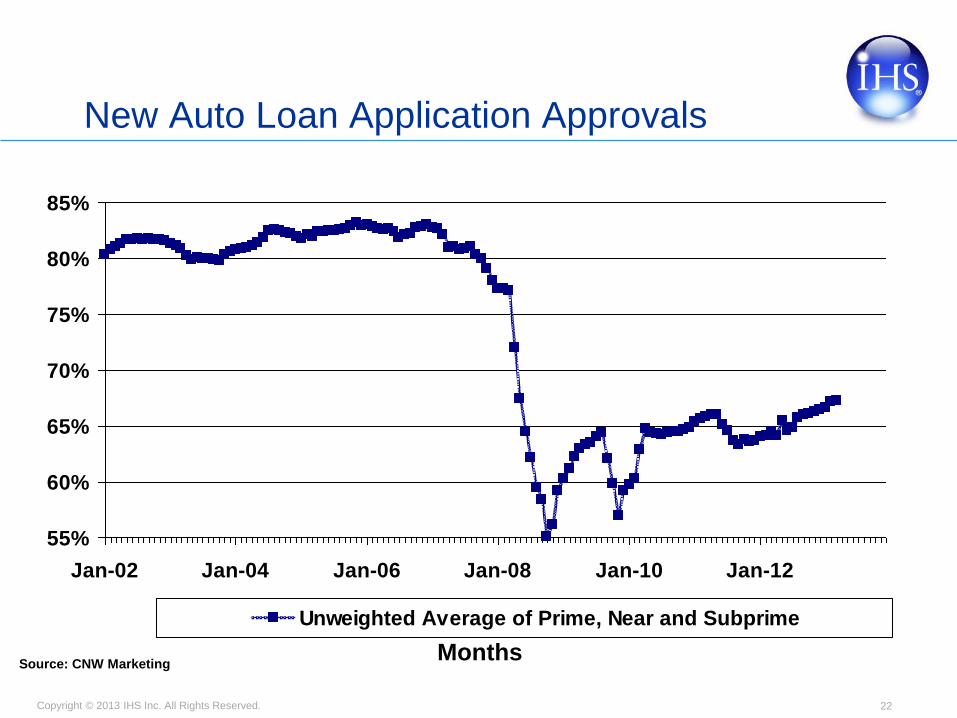
Unweighted Average of Prime, Near and Subprime
Months
New Auto Loan Application Approvals
Source: CNW Marketing
Copyright © 2013 IHS Inc. All Rights Reserved. 23
0%
20%
40%
60%
80%
100%
120%
Jan-06 Jan-07 Jan-08 Jan-09 Jan-10 Jan-11 Jan-12 Jan-13
Prime Near Prime Sub Prime
Months
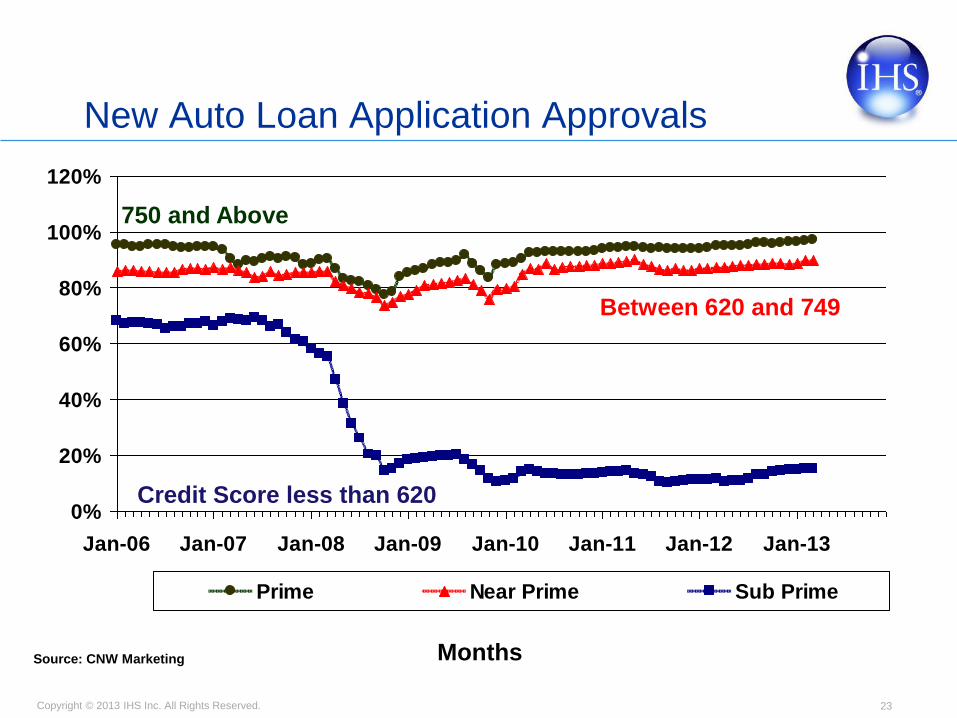
New Auto Loan Application Approvals
750 and Above
Between 620 and 749
Credit Score less than 620
Source: CNW Marketing

Copyright © 2013 IHS Inc. All Rights Reserved. 24
37
39
41
43
45
47
49
51
53
1989 1991 1993 1995 1997 1999 2001 2003 2005 2007 2009 2011 2013
Months
(Years)
Median Age – New Vehicle Buyer
CNW Marketing

Copyright © 2013 IHS Inc. All Rights Reserved. 25
4.5
5.0
5.5
6.0
6.5
7.0
7.5
8.0
8.5
9.0
9.5
10.0
1998 2000 2002 2004 2006 2008 2010 2012
Quarters
(Percent)
Federal Reserve Board
New Auto Loan Rates – Commercial Banks
Copyright © 2013 IHS Inc. All Rights Reserved.
12
14
16
18
20
22
24
26
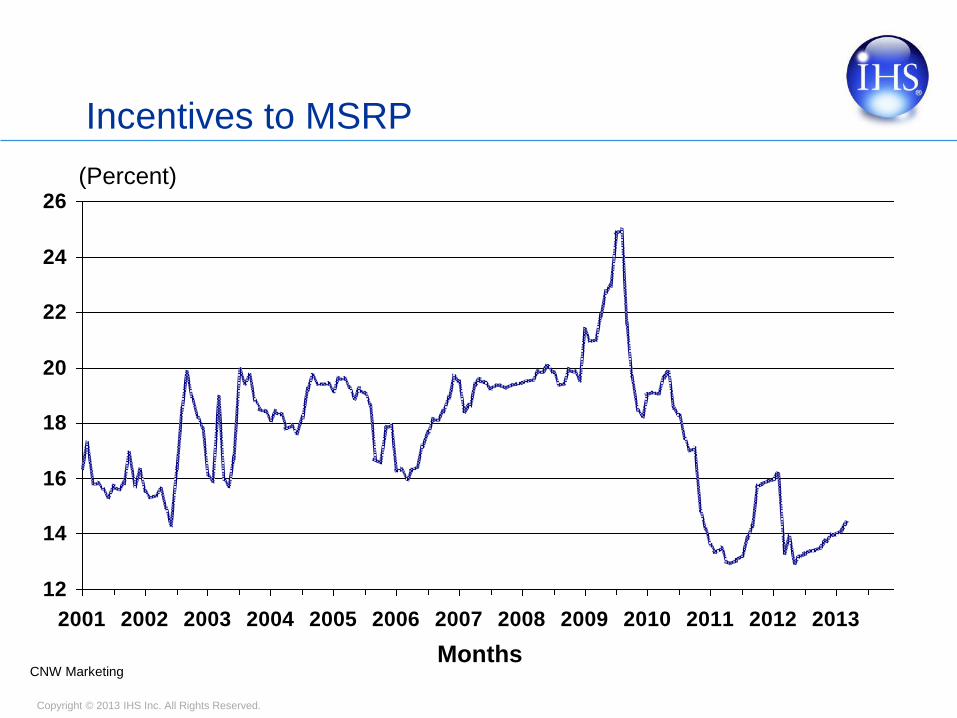
2001 2002 2003 2004 2005 2006 2007 2008 2009 2010 2011 2012 2013
(Percent)
CNW Marketing Months
Incentives to MSRP

Copyright © 2013 IHS Inc. All Rights Reserved. 27
30%
40%
50%
60%
70%
80%
90%
100%
Jan-06 Jan-07 Jan-08 Jan-09 Jan-10 Jan-11 Jan-12 Jan-13
GM Ford Chrysler IndustryToyota Honda Nissan
Source: CNW Marketing Months
Residual Value Index
(Index = Lease contract residual value versus CNW estimate of residual at end of lease term)

Copyright © 2013 IHS Inc. All Rights Reserved. 28
20%
21%
22%
23%
24%
25%
26%
27%
28%
29%
Jan-05 Jan-06 Jan-07 Jan-08 Jan-09 Jan-10 Jan-11 Jan-12 Jan-13
Leases by Month
(Share)
U.S. Light Vehicle Sales — Lease Penetration
Source: CNW Marketing

Copyright © 2013 IHS Inc. All Rights Reserved. 29
U.S. Light Vehicle Inventory — Units
Months — Seasonally Adjusted
(Units in thousands)
1,500
2,000
2,500
3,000
3,500
4,000
4,500
1990 1992 1994 1996 1998 2000 2002 2004 2006 2008 2010 2012

Copyright © 2013 IHS Inc. All Rights Reserved. 30
U.S. Light Vehicle Inventory — Days Supply
30
40
50
60
70
80
90
100
110
120
1992 1994 1996 1998 2000 2002 2004 2006 2008 2010 2012
(Days Supply)
Months — Seasonally Adjusted
Light Trucks
Cars
Copyright © 2013 IHS Inc. All Rights Reserved.
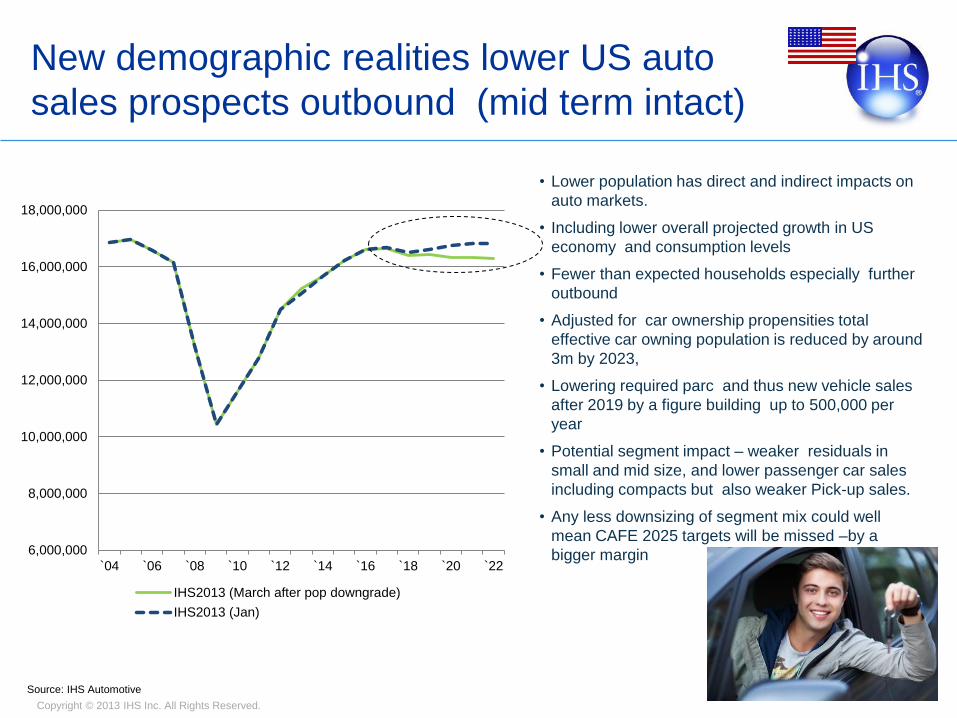
• Lower population has direct and indirect impacts on
auto markets.
• Including lower overall projected growth in US
economy and consumption levels
• Fewer than expected households especially further
outbound
• Adjusted for car ownership propensities total
effective car owning population is reduced by around
3m by 2023,
• Lowering required parc and thus new vehicle sales
after 2019 by a figure building up to 500,000 per
year
• Potential segment impact – weaker residuals in
small and mid size, and lower passenger car sales
including compacts but also weaker Pick-up sales.
• Any less downsizing of segment mix could well
mean CAFE 2025 targets will be missed –by a
bigger margin
Source: IHS Automotive
6,000,000
8,000,000
10,000,000
12,000,000
14,000,000
16,000,000
18,000,000
`04 `06 `08 `10 `12 `14 `16 `18 `20 `22
IHS2013 (March after pop downgrade)
IHS2013 (Jan)
New demographic realities lower US auto
sales prospects outbound (mid term intact)

Copyright © 2013 IHS Inc. All Rights Reserved. 32
8
9
10
11
12
13
14
15
16
17
18
19
20
21
22
Jan-01 Jan-03 Jan-05 Jan-07 Jan-09 Jan-11 Jan-13
SUVL
(Units in millions)
United States — Light Vehicle Sales, SAAR
Copyright © 2013 IHS Inc. All Rights Reserved. 33
4
5
6
7
8
9
10
11
12
13
Jan-00 Jan-02 Jan-04 Jan-06 Jan-08 Jan-10 Jan-12
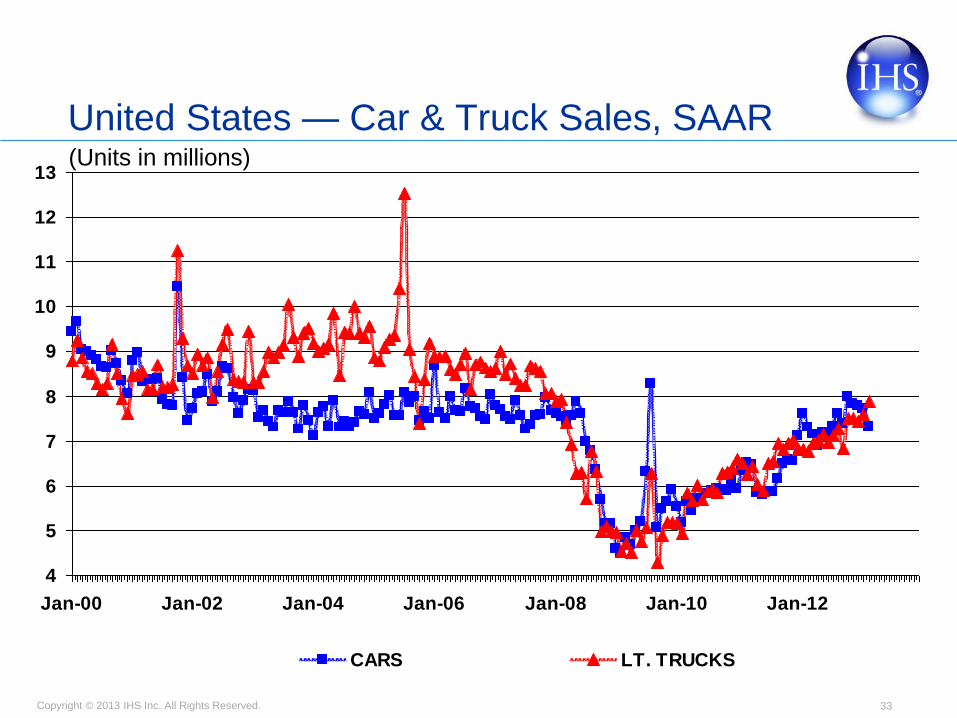
CARS LT. TRUCKS
(Units in millions)
United States — Car & Truck Sales, SAAR
Copyright © 2013 IHS Inc. All Rights Reserved. 34
4
5
6
7
8
9
10
11
12
13
Jan-00 Jan-02 Jan-04 Jan-06 Jan-08 Jan-10 Jan-12
Months
(Units in millions)
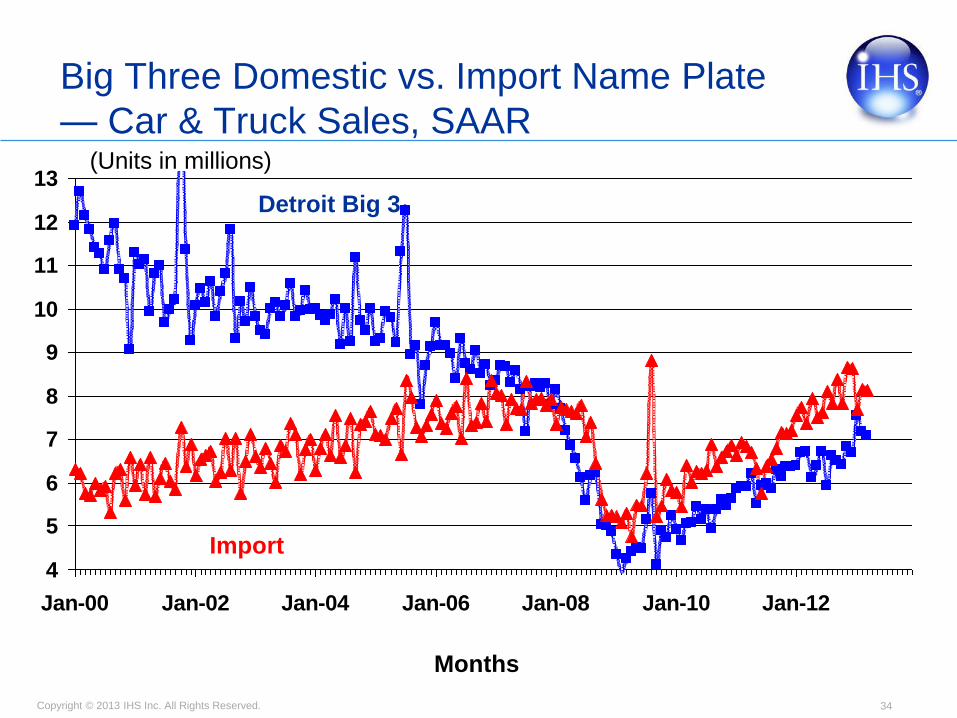
Big Three Domestic vs. Import Name Plate
— Car & Truck Sales, SAAR
Import
Detroit Big 3

Copyright © 2013 IHS Inc. All Rights Reserved.
0.5
1.0
1.5
2.0
2.5
3.0
Jan-95 Jan-97 Jan-99 Jan-01 Jan-03 Jan-05 Jan-07 Jan-09 Jan-11 Jan-13
TOYOTA HONDA NISSAN
Months
(Units in millions)
United States — Car & Truck Sales, SAAR
- Asian Manufacturers
X12A Seasonal Adjustment
Copyright © 2013 IHS Inc. All Rights Reserved.
0.00
0.20
0.40
0.60
0.80
1.00
1.20
1.40
Jan-95 Jan-97 Jan-99 Jan-01 Jan-03 Jan-05 Jan-07 Jan-09 Jan-11 Jan-13
SUBARU MITSUBISHI MAZDA VW Group HYUNDAI/KIA
5
Months
(Units in millions)
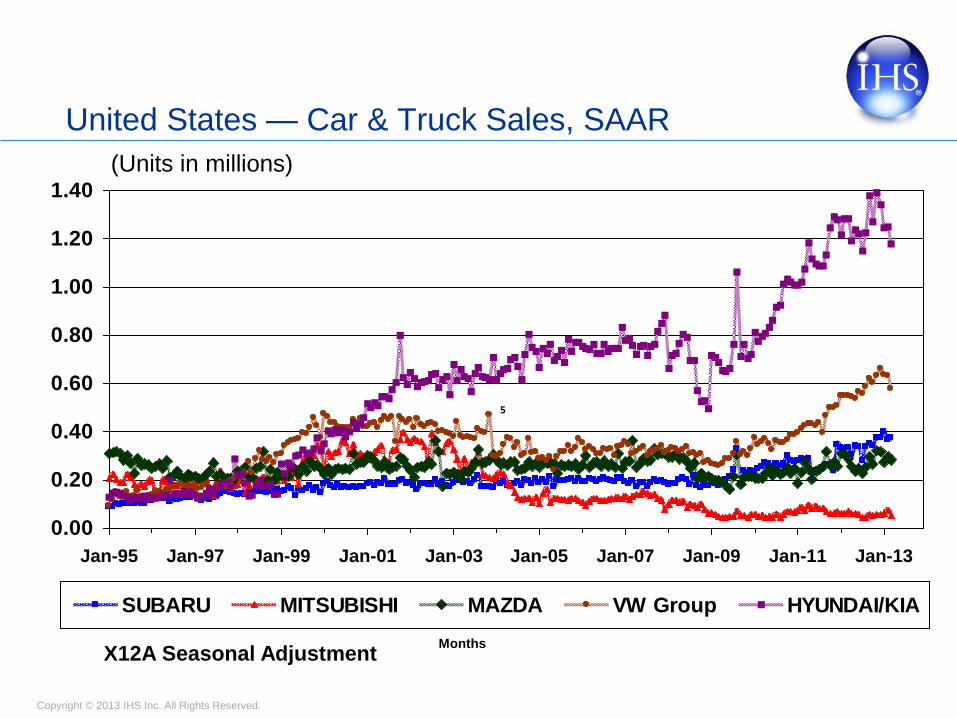
United States — Car & Truck Sales, SAAR
X12A Seasonal Adjustment
Copyright © 2013 IHS Inc. All Rights Reserved.
0%
2%
4%
6%
8%
10%
12%
14%
16%
0
2
4
6
8
10
12
14
16
18
2010 2011 2012 Feb2013
YTD 2013 2014 2015
United States Change
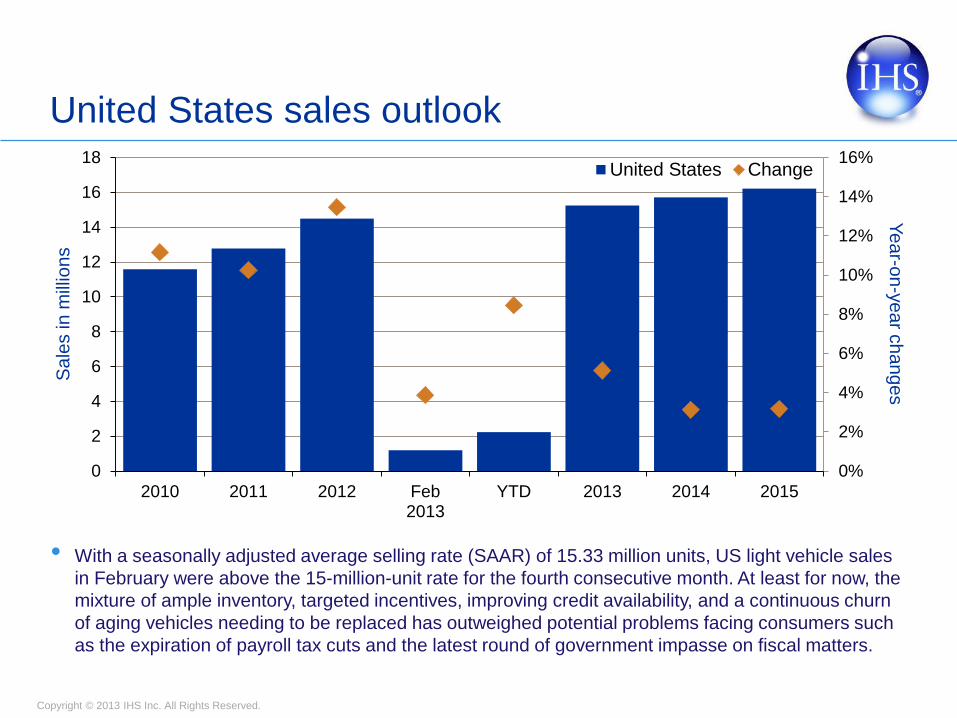
United States sales outlook
Sa
les in
mill
ion
s
Ye
ar-o
n-y
ea
r ch
an
ge
s
• With a seasonally adjusted average selling rate (SAAR) of 15.33 million units, US light vehicle sales
in February were above the 15-million-unit rate for the fourth consecutive month. At least for now, the
mixture of ample inventory, targeted incentives, improving credit availability, and a continuous churn
of aging vehicles needing to be replaced has outweighed potential problems facing consumers such
as the expiration of payroll tax cuts and the latest round of government impasse on fiscal matters.

Copyright © 2013 IHS Inc. All Rights Reserved.
-5%
0%
5%
10%
15%
20%
0
1
2
3
4
5
6
7
2010 2011 2012 Feb2013
YTD 2013 2014 2015
South America Change
-6%-4%-2%0%
2%4%6%8%10%
12%14%
0
1
2
3
4
5
6
2010 2011 2012 Feb2013
YTD 2013 2014 2015
South America Change
South America sales and production outlook
Sa
les in m
illio
ns
Ye
ar-o
n-y
ea
r ch
an
ge
s
Pro
du
ctio
n in m
illio
ns Y
ea
r-on
-ye
ar c
ha
nge
s
• Year to date, the region is
experiencing pent-up demand with a
5% uptick relative to 2012, reporting
906,000 units sold.
• IPI hike was delayed until the end of
the year.
• Venezuela is facing political
uncertainty.
• Credit limits Brazil, Argentina and
Colombia
• Full-year 2013 sales will essentially be
flat.
• South American production reached
292,660 units in February 2013, up
1.4% versus February 2012. Brazilian
output decreased 19.1% compared
with January 2013, reaching 212,945
units due to lower production days
and holidays.
• South American production volumes
of 4.45 million units in 2013 and 5.23
million units in 2015.

Copyright © 2013 IHS Inc. All Rights Reserved.
0%
5%
10%
15%
20%
25%
30%
35%
40%
45%
0
2
4
6
8
10
12
14
16
18
2010 2011 2012 Feb2013
YTD 2013 2014 2015
North America Change
North America production P
rod
uctio
n in
mill
ion
s Y
ea
r-on-y
ea
r ch
an
ge
s
• North American output in February 2013 was flat, up just 5,800 units from year-ago levels to 1,329,648
units produced. Inventory levels at the end of February 2013 (US inventory stands at 3.23 million units)
have been largely replenished since supply-chain shocks in 2011 and 2012, resulting in more limited
incremental production gains in 2013.
• In February 2013, US production rose 1.4% to 890,005 units, up 12,354 units from year-ago levels. In
2013, US production of 10.73 million units will reflect a 6% gain in production levels to support stronger
sales.
• Forecast settings will reach 15.9 million units in 2013, rising to 16.3 million units in 2014 before breaking
the 17.0-million-unit mark in 2015.

Copyright © 2013 IHS Inc. All Rights Reserved. 40
North American Light Vehicle Production 2013 vs. 2012
OEM 2013F
(000s)
2012
(000s) % ∆
∆ Units
(000s)
GM 3,237 3,233 0.1% 4
Ford 3,003 2,842 5.7% 161
Chry/Fiat 2,457 2,371 3.6% 86
Detroit 3 8,697 8,446 3.0% 251
Toyota 1,782 1,776 0.3% 6
Honda 1,721 1,676 2.7% 45
Ren/Nissan 1,454 1,316 10.5% 138
Hyundai 722 714 1.1% 8
Asian 4 5,679 5,482 3.6% 197
VW 765 766 -0.1% -1
BMW 289 302 -4.3% -13
Daimler 176 191 -7.9% -15
German 3 1,230 1,259 -2.3% -29
Others 249 227 9.7% 22
Total 15.9M 15.4M 2.9% ~450
• Production growth rate
moderates, yet recovery
progresses
• GM – Significant launch
activity, including new
K2XX Pickups
• Chrysler – Fiat-based
product ramps-up
• Nissan – Migration of
CUV production; Mexico
expansion
• Transitional year prior to
new program/plant
launches in 2014/2015
Source: IHS Automotive Light Vehicle Production Forecast

Copyright © 2013 IHS Inc. All Rights Reserved.
North American Light Vehicle Production Compelling Growth Prospects
41
4.94.2
1.93.1 3.4 3.43.2
4.4
2.9
1.9
2.73.1 3.22.8
2.9
2.5
0.9
2.0
2.4 2.42.4
2.4
4.6
3.2
4.1
6.46.7
5.5
0.50.8
0.5
1.0
1.41.6
1.3
0
3
6
9
12
15
18
19
97
19
98
19
99
20
00
20
01
20
02
20
03
20
04
20
05
20
06
20
07
20
08
20
09
20
10
20
11
20
12
20
13
20
14
20
15
20
16
20
17
20
18
20
19
20
20
Millio
ns
• Production outlook follows demand recovery with import substitution and export activity
providing additional support
• Most manufacturers are poised to post gains; favors OEMs with further capacity
expansion plans: BMW, Hyundai, VW, Nissan, Toyota & Honda
• Global product/platform strategies enable competitive sourcing shifts
15.6 15.1 German 3
Asian 4
Chrysler/
Fiat
Ford
General
Motors
Others
8.6
13.1
17.0 17.7
15.4
17.2
5.6
4.7
2.9
2.9
0.6
Source: IHS Automotive Light Vehicle Production Forecast
Copyright © 2013 IHS Inc. All Rights Reserved.
6
8
10
12
14
16
18
20
22
Mill
ions
NA Sales NA Production
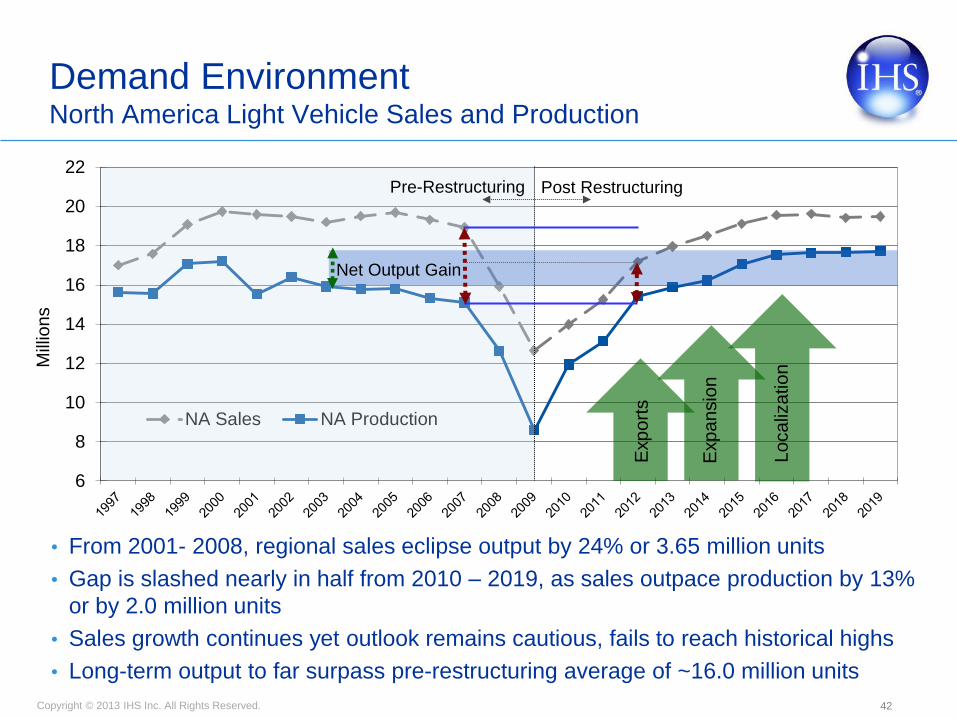
Demand Environment North America Light Vehicle Sales and Production
42
• From 2001- 2008, regional sales eclipse output by 24% or 3.65 million units
• Gap is slashed nearly in half from 2010 – 2019, as sales outpace production by 13%
or by 2.0 million units
• Sales growth continues yet outlook remains cautious, fails to reach historical highs
• Long-term output to far surpass pre-restructuring average of ~16.0 million units
Post Restructuring Pre-Restructuring
Net Output Gain
Lo
ca
liza
tio
n
Exp
an
sio
n
Exp
ort
s

Copyright © 2013 IHS Inc. All Rights Reserved. 43
Production Outlook North American Produced Vehicle Exports Bolster Prospects
0.0
0.2
0.4
0.6
0.8
1.0
1.2
1.4
1.6
1.8
2.0
2006 2007 2008 2009 2010 2011 2012 2013 2014 2015 2016
Europe
South America
Middle East/Africa
Greater China
Other
No
rth
Am
erica
n V
eh
icle
Exp
ort
s (
Mill
ion
s)
North American Vehicle Exports by Region
0.67
0.89
0.71
0.87 0.78
1.05
1.28 1.28
1.37
1.62
• Greater use of global
platforms allows for more
“export ready” product
• 40+ Free trade agreements
drive Mexican output
• Expansion of luxury
segment capability across
the region into Mexico
• EU sovereign debt crisis
tempers EU exports, yet
BRIC demand grows
• Sourcing patterns favor NA
expansion as a safe haven;
with currency hedge &
export prospects
1.78
Source: IHS Automotive Light Vehicle Forecast
Copyright © 2013 IHS Inc. All Rights Reserved. 44
30
43
24 23 20 19 19
25 24
45
34
21 26
35
39
35
0
10
20
30
40
50
60
2005 2006 2007 2008 2009 2010 2011 2012 2013 2014 2015 2016 2017 2018 2019 2020
Calendar Year
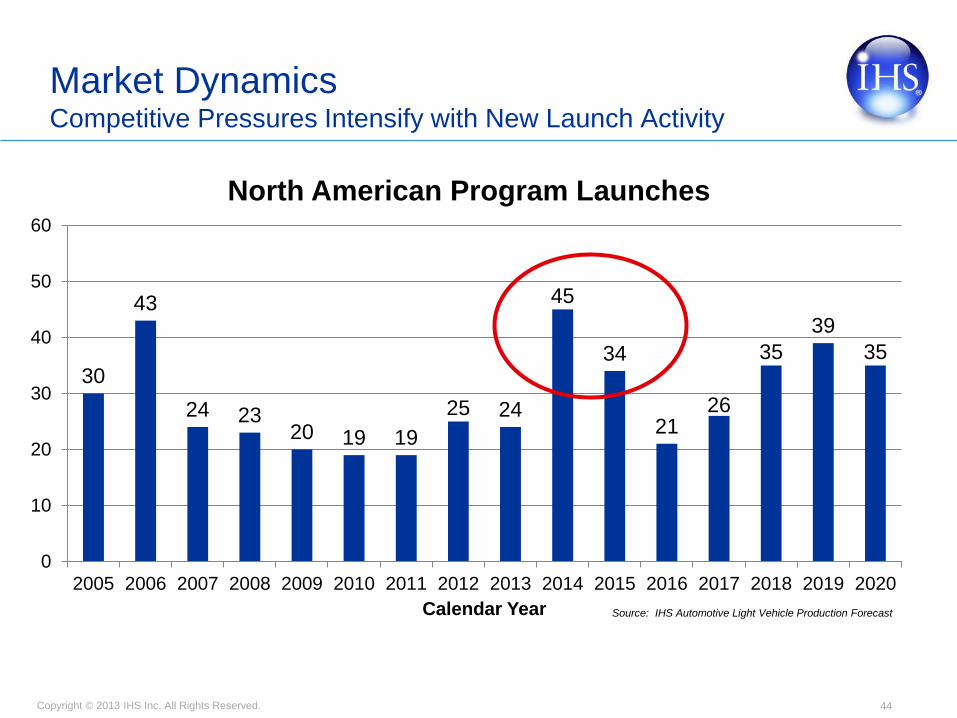
North American Program Launches
Market Dynamics Competitive Pressures Intensify with New Launch Activity
Source: IHS Automotive Light Vehicle Production Forecast

Copyright © 2013 IHS Inc. All Rights Reserved.
Production Outlook Global Output of D-/E-Segment CUVs By Region
• North America is the
leading producer of
high-margin CUVs
• Positioned evolved
from strength in SUV
category, comes full
circle via global
platform deployment
• Powertrain advances
help drive role as
global exporter: BRIC
markets, ME/Africa, S.
America, China, etc.
• Region holds global
sourcing position for
luxury & volume brands
0.0
0.5
1.0
1.5
2.0
2.5
3.0
3.5
4.0
NorthAmerica
Japan/Korea Europe GreaterChina
South Asia
Mil
lio
ns
2010
2011
2012
2013
2014
2015
2016
2017
2018
2019
Copyright © 2013 IHS Inc. All Rights Reserved. 46
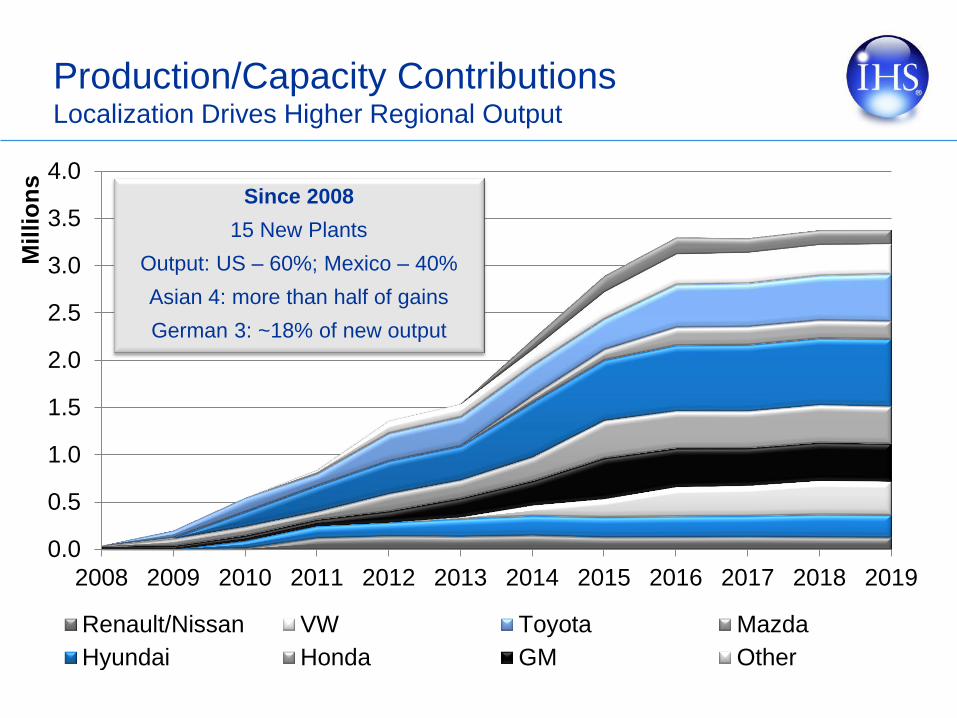
Production/Capacity Contributions Localization Drives Higher Regional Output
0.0
0.5
1.0
1.5
2.0
2.5
3.0
3.5
4.0
2008 2009 2010 2011 2012 2013 2014 2015 2016 2017 2018 2019
Mil
lio
ns
Renault/Nissan VW Toyota Mazda
Hyundai Honda GM Other
Since 2008
15 New Plants
Output: US – 60%; Mexico – 40%
Asian 4: more than half of gains
German 3: ~18% of new output
Copyright © 2013 IHS Inc. All Rights Reserved.
Agenda
• Macroeconomic outlook
• Global sales and production outlook
• Europe outlook
• Americas outlook
• Mexico
• Summary

Copyright © 2013 IHS Inc. All Rights Reserved. 50
0.3
0.4
0.5
0.6
0.7
0.8
0.9
1.0
1.1
1.2
1.3
1/1/1997 1/1/1999 1/1/2001 1/1/2003 1/1/2005 1/1/2007 1/1/2009 1/1/2011 1/1/2013
(Units in Millions)
Mexico Light Vehicle Sales —
Seasonally Adjusted Annual Selling Rate - SAAR
Monthly
Annual Average

Copyright © 2013 IHS Inc. All Rights Reserved. 51
70
80
90
100
110
120
700
800
900
1000
1100
1200
2001 2002 2003 2004 2005 2006 2007 2008 2009 2010 2011 2012 2013
LV Sales (left scale) Consumer Confidence
Monthly Sales — Moving Average vs.
Consumer Confidence
Thousand Units Index

Copyright © 2013 IHS Inc. All Rights Reserved. 52
-30%
-20%
-10%
0%
10%
20%
30%
600,000
700,000
800,000
900,000
1,000,000
1,100,000
1,200,000
1,300,000
1,400,000
1998 2000 2002 2004 2006 2008 2010 2012 2014 2016 2018 2020Light Veh -L Annual Change -R
Mexico - Light Vehicle Sales
Units
Used car imports and credit availability limit growth
Copyright © 2013 IHS Inc. All Rights Reserved.
0%
10%
20%
30%
40%
50%
60%
70%
80%
90%
100%
2005 2007 2009 2011 2013 2015 2017 2019
Others Mitsubishi Daimler Suzuki BMW
Mazda Honda Toyota Ford Fiat
Volkswagen General Motors Renault/Nissan
Percentage
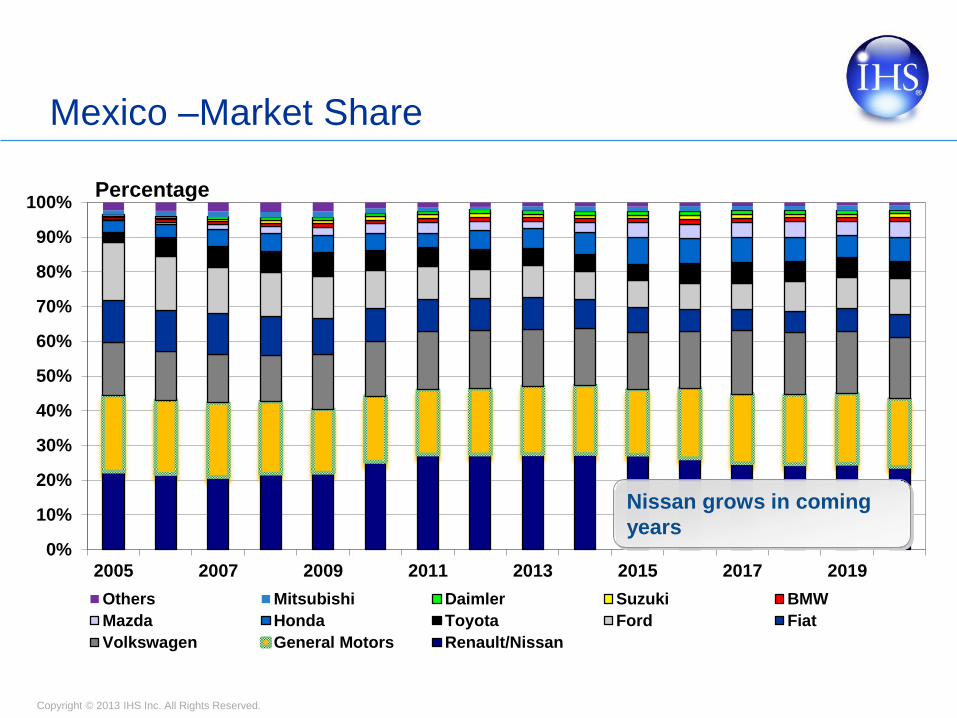
Mexico –Market Share
Nissan grows in coming
years
Copyright © 2013 IHS Inc. All Rights Reserved. 54
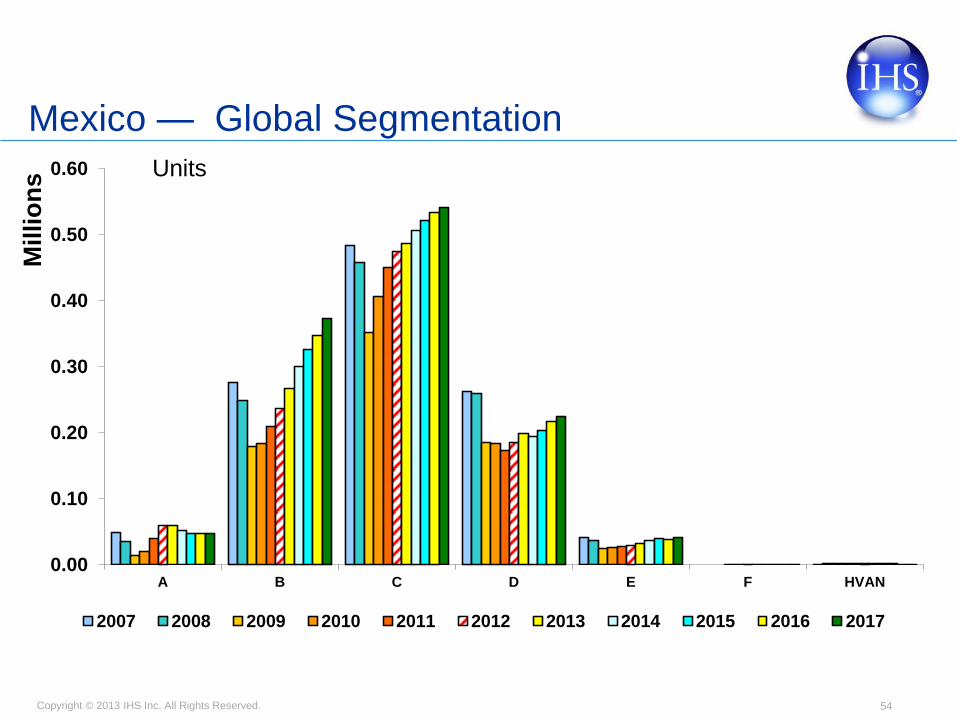
Mexico — Global Segmentation
0.00
0.10
0.20
0.30
0.40
0.50
0.60
A B C D E F HVAN
Mil
lio
ns
2007 2008 2009 2010 2011 2012 2013 2014 2015 2016 2017
Units
Copyright © 2013 IHS Inc. All Rights Reserved. 55
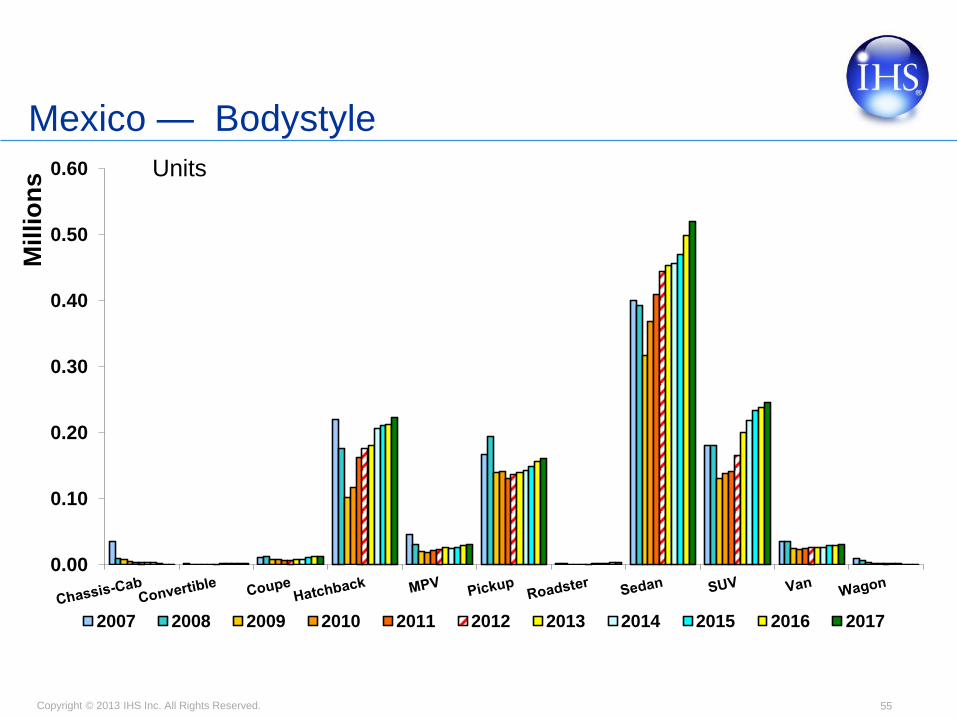
Mexico — Bodystyle
0.00
0.10
0.20
0.30
0.40
0.50
0.60
Millio
ns
2007 2008 2009 2010 2011 2012 2013 2014 2015 2016 2017
Units

Copyright © 2013 IHS Inc. All Rights Reserved. 56
0.0
0.5
1.0
1.5
2.0
2.5
3.0
3.5
4.0
4.5
2002 2004 2006 2008 2010 2012 2014 2016 2018 2020
PROD
Producing for Export
Mexico Light Vehicle Production (millions of units)
Forecast at risk due to Brazil
Copyright © 2013 IHS Inc. All Rights Reserved.
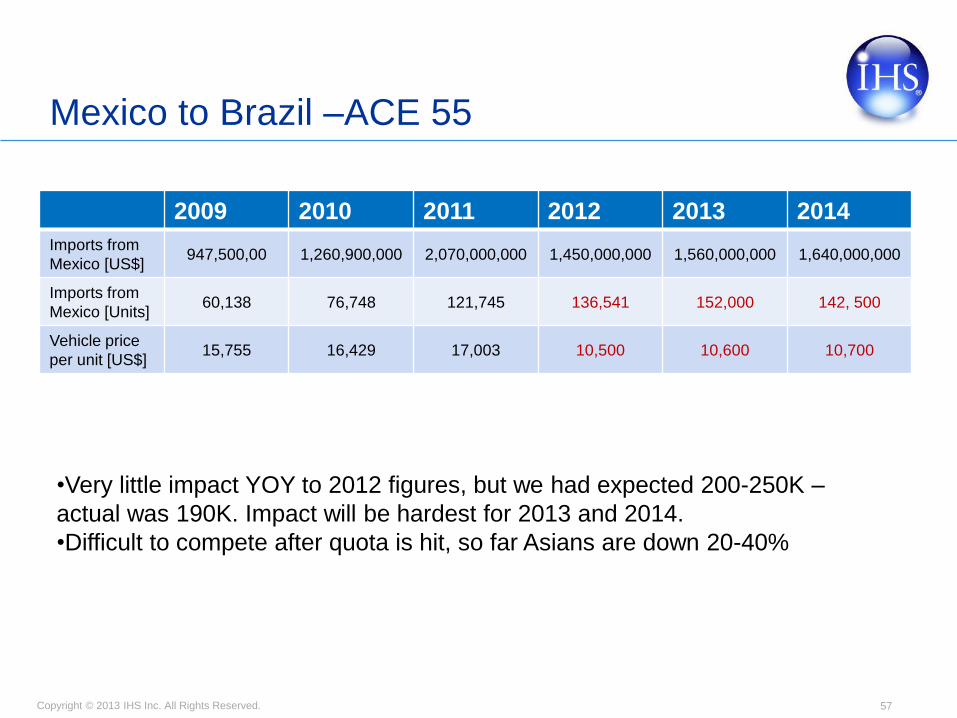
Mexico to Brazil –ACE 55
57
2009 2010 2011 2012 2013 2014
Imports from
Mexico [US$] 947,500,00 1,260,900,000 2,070,000,000 1,450,000,000 1,560,000,000 1,640,000,000
Imports from
Mexico [Units] 60,138 76,748 121,745 136,541 152,000 142, 500
Vehicle price
per unit [US$] 15,755 16,429 17,003 10,500 10,600 10,700
•Very little impact YOY to 2012 figures, but we had expected 200-250K –
actual was 190K. Impact will be hardest for 2013 and 2014.
•Difficult to compete after quota is hit, so far Asians are down 20-40%
Copyright © 2013 IHS Inc. All Rights Reserved.
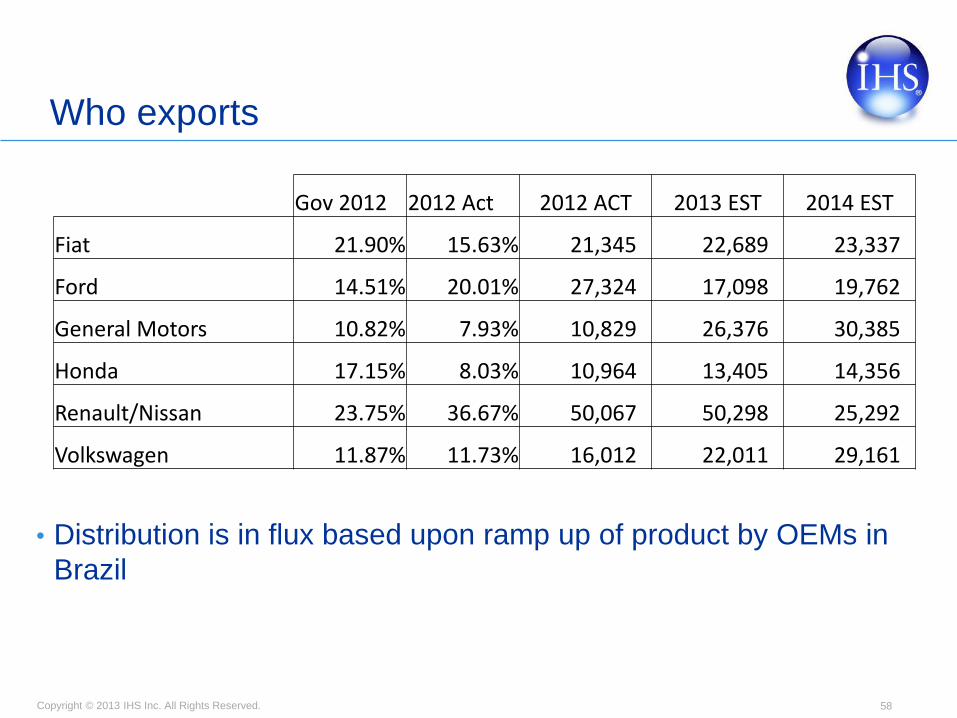
Who exports
• Distribution is in flux based upon ramp up of product by OEMs in
Brazil
58
Gov 2012 2012 Act 2012 ACT 2013 EST 2014 EST
Fiat 21.90% 15.63% 21,345 22,689 23,337
Ford 14.51% 20.01% 27,324 17,098 19,762
General Motors 10.82% 7.93% 10,829 26,376 30,385
Honda 17.15% 8.03% 10,964 13,405 14,356
Renault/Nissan 23.75% 36.67% 50,067 50,298 25,292
Volkswagen 11.87% 11.73% 16,012 22,011 29,161
Copyright © 2013 IHS Inc. All Rights Reserved. 59
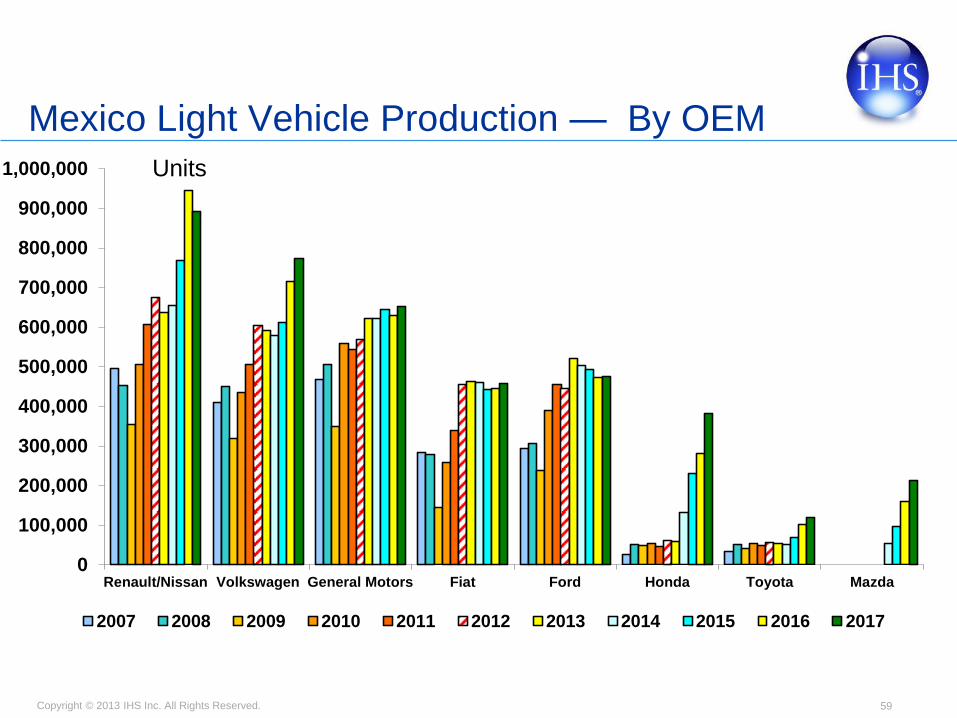
Mexico Light Vehicle Production — By OEM
0
100,000
200,000
300,000
400,000
500,000
600,000
700,000
800,000
900,000
1,000,000
Renault/Nissan Volkswagen General Motors Fiat Ford Honda Toyota Mazda
2007 2008 2009 2010 2011 2012 2013 2014 2015 2016 2017
Units

Copyright © 2013 IHS Inc. All Rights Reserved.
Agenda
• Macroeconomic outlook
• Global sales and production outlook
• Europe outlook
• Americas outlook
• Mexico
• Summary
Copyright © 2013 IHS Inc. All Rights Reserved.
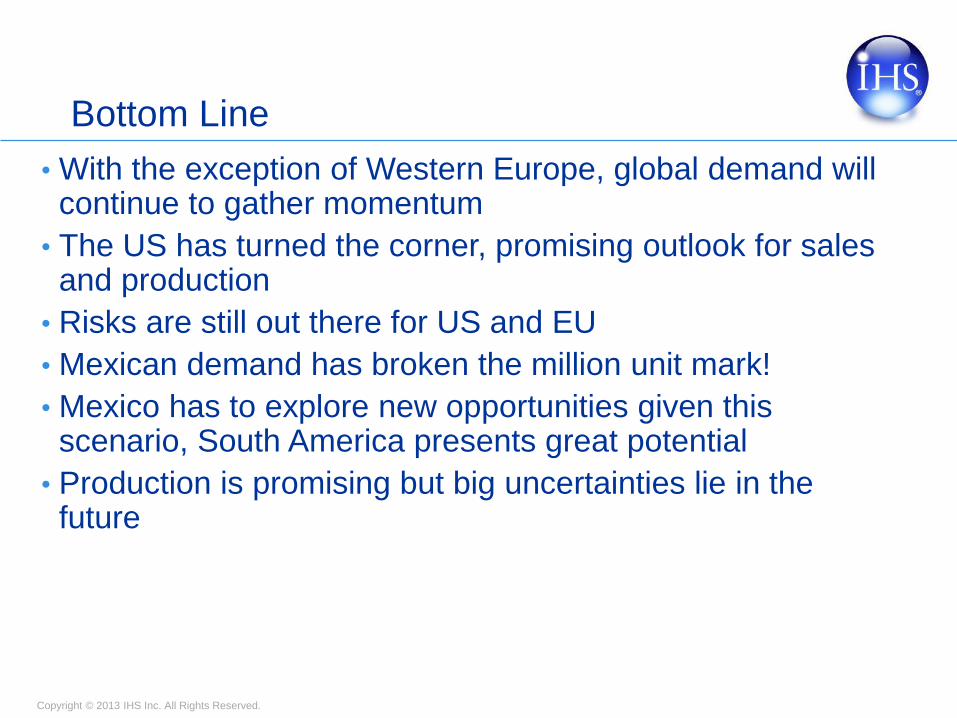
Bottom Line
• With the exception of Western Europe, global demand will continue to gather momentum
• The US has turned the corner, promising outlook for sales and production
• Risks are still out there for US and EU
• Mexican demand has broken the million unit mark!
• Mexico has to explore new opportunities given this scenario, South America presents great potential
• Production is promising but big uncertainties lie in the future

Copyright © 2013 IHS Inc. All Rights Reserved.
Thank you for your participation! April 2013
Guido Vildozo Manager, Latin America Vehicle Sales Forecasts +1 781-301-9037 [email protected]
Copyright © 2013 IHS Inc. All Rights Reserved.
Copyright © 2013 IHS inc.
IHS inc. is the copyright holder for this document. No part(s) of this document may be copied,
downloaded, stored in a retrieval system, further transmitted or otherwise reproduced, stored,
disseminated, transferred or used in any form or by any means without prior written agreement from
IHS inc. Each reproduction of any part of this document must contain notice of the IHS inc. copyright as
follows: © 2013 IHS inc. Viewing and/or using the data contained in this copyrighted document shall
constitute a contract between the viewer and/or user and IHS that the viewer and/or user will not violate
the IHS inc. above stated copyright policy. By viewing and/or using the data contained in this
copyrighted document, the viewer and/or user warrants that he/she is authorized and has the full
authority to bind any corporate entity that may benefit from said viewing and/or use to the above
referenced copyright contract and a general subscription contract for the viewing and/or use of the
document, including payment of all subscription fees.
Disclaimer
All information included in this report has been cross-verified to the greatest extent possible. Although
every attempt has been made to ensure the accuracy of the information included in this report, IHS inc.
claims no responsibility for any loss or damage resulting from any publication, error or omission in this
report.