Embed Size (px)
Citation preview
1643 Merrimac Trail, Williamsburg, VA 23185
WWW.BORRELLASSOCIATES.COM
©2020 Borrell Associates Inc. All Rights Reserved
2020AUTOMOTIVEADVERTISING OUTLOOK
FLAGGING NEW-CAR SALES, SOARING ONLINE VIDEO MARKETING
PRICE: $1,195
2020 AUTOMOTIVE ADVERTISING OUTLOOK : FLAGGING NEW-CAR SALES, SOARING ONLINE VIDEO MARKETING ©2020 Borrell Associates Inc. All Rights Reserved 02
Executive Summary ............................................................................................... 03
Chapter 1: “New” Yields to “Almost New,” Altering the Landscape ................ 04Figure 1.1 U.S. New-Vehicle Sales Vs. Licensed Drivers, 2001-2025 ................................04Figure 1.2 New and “Nearly New” Vehicle Sales, 2012-2020 ..............................................06Figure 1.3 U.S. Average Ad Spending Per Vehicle Sold, 2014-2020..................................06Figure 1.4 Forecast U.S. New-Vehicle Annual Sales: Current Forecast vs. Alternatives ...............................................................................................07
Chapter 2: 2020 Automotive Ad-Spending Forecasts ......................................... 08Figure 2.1: 2020 U.S. Automotive Advertising, By Who Spends It .....................................08Figure 2.2: Projected 2020 U.S. Ad Spending to Support New-Vehicle Sales ................ 09Figure 2.3: 2018-2020 Change in Average Per-Vehicle Ad Spending for New Cars...... 09Figure 2.4: 2020 Projected U.S. Auto Dealer Ad Spending .................................................10Figure 2.5: Number of U.S. Independent Dealerships, 2010-2024 ...................................11
Chapter 3: Digital Advertising Forecasts ............................................................. 15Figure 3.1: 2020 Digital Auto Ad Spending for Dealers, Manufacturers & Private Party ...................................................................................................15Figure 3.2: 2020 Projected U.S. Auto Digital Ad Spending ..................................................15Figure 3.3: Franchised Auto Dealer Digital Ad Spending, 2018-2025...............................16Figure 3.4: Independent Auto Dealer Digital Ad Spending, 2018-2025 ...........................17Figure 3.5: Dealer Association Digital Ad Spending, 2018-2025 ........................................18Figure 3.6: Auto Manufacturer Digital Ad Spending, 2018-2025 .......................................19
Conclusions ............................................................................................................. 20
Appendix A: Other Scenarios ................................................................................ 21
Appendix B: Automotive LA$R ............................................................................. 23
About Borrell Associates ....................................................................................... 32
PRINCIPAL AUTHOR OF THIS REPORT
KIP CASSINOAuthor and Research Analyst
BORRELL ASSOCIATES LEADERSHIP TEAM:
COLBY ATWOOD Executive Director and Senior Advisor
GORDON BORRELL CEO
JIM BROWN Executive Vice President of Sales and Marketing
COREY ELLIOTT Executive Vice President of Local
Market Intelligence
WWW.BORRELLASSOCIATES.COM
CONTENTS

2020 AUTOMOTIVE ADVERTISING OUTLOOK : FLAGGING NEW-CAR SALES, SOARING ONLINE VIDEO MARKETING ©2020 Borrell Associates Inc. All Rights Reserved 03
EXECUTIVE SUMMARY
The gears continue to turn in one of the largest and most important advertising verticals, automotive. But the gears are turning slowly, shifting from mass messaging and toward targeted messages. The biggest driver isn’t so much the appeal of targeting offered by digital channels as it is a change in consumer buying patterns. Car buyers have become far more interested in “almost new” vehicles. The problem is, more than three-fourths of automotive advertising is driven by the marketing of “new” vehicles.
This report details the massive U.S. Automotive Advertising category, which we’re forecasting to be $33.3 billion this year. New-vehicle advertising, at $26 billion, is declining at an average annual rate of 3.1%.
The new-car advertising decline is due in part to price compression, as the industry shifts to lower-priced targeted advertising, but also to depressed new-vehicle sales. For 2020, we’re forecasting new-car sales at 16.48 million – more than half a million less than 2019’s 17.04 million. The trend is more vivid framed in a 20-year perspective: There’s been a 21.3% increase in the number of licensed drivers in the past two decades, but a 3.7% decline in the number of new vehicles sold annually. It’s why so much advertising has shifted from top-of-the-funnel branding to lower-level “information” based advertising keyed more to availability, pricing, and financing.
Targeting has hit broadcasters particularly hard. Local dealerships now favor digital media and direct mail – both very targeted forms of marketing – to the point at which broadcast TV now gets less than 4% of dealer ad budgets. Meanwhile, direct mail now gets four times the share of TV, and digital media 15 times the share.
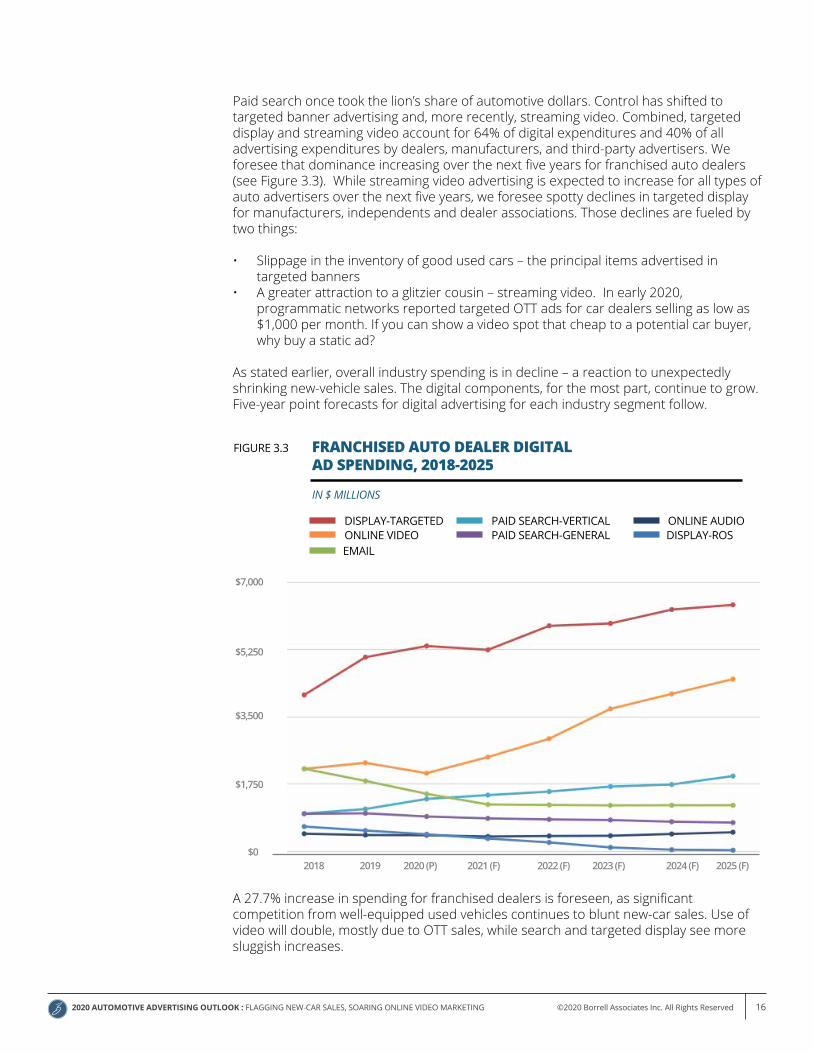
Paid search once took the lion’s share of automotive dollars. Control has shifted to targeted banner advertising and, more recently, streaming video. The video portion is now being driven by OTT sales, which has become a cheaper and more targeted alternative to broadcast TV. Combined, targeted display and streaming video account for 64% of digital expenditures and 40% of all advertising expenditures by dealers, manufacturers, and third-party advertisers. We foresee that dominance increasing over the next five years for franchised auto dealers.
In this report, we detail the underlying factors driving the gears of U.S. automotive advertising and examine each of the five buying segments: manufacturers, franchise dealers, dealer associations, independent dealers, and private-party advertising. Forecasts for 2020 and 2025 for each are included. We also lay out several scenarios of how forecasts might change due to potential shifts in economic and regulatory matters.
2020 AUTOMOTIVE ADVERTISING OUTLOOK : FLAGGING NEW-CAR SALES, SOARING ONLINE VIDEO MARKETING ©2020 Borrell Associates Inc. All Rights Reserved 04
C H A P T E R 1 : “NEW” YIELDS TO “ALMOST NEW,” ALTERING THE LANDSCAPE
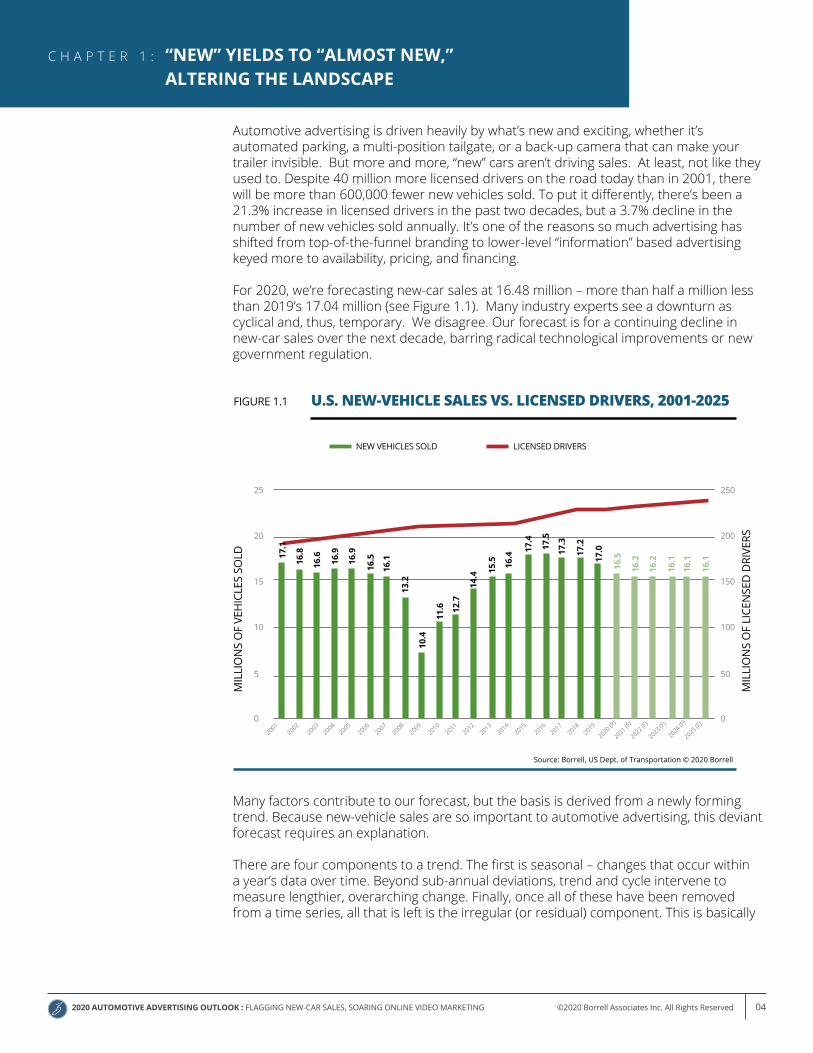
Automotive advertising is driven heavily by what’s new and exciting, whether it’s automated parking, a multi-position tailgate, or a back-up camera that can make your trailer invisible. But more and more, “new” cars aren’t driving sales. At least, not like they used to. Despite 40 million more licensed drivers on the road today than in 2001, there will be more than 600,000 fewer new vehicles sold. To put it differently, there’s been a 21.3% increase in licensed drivers in the past two decades, but a 3.7% decline in the number of new vehicles sold annually. It’s one of the reasons so much advertising has shifted from top-of-the-funnel branding to lower-level “information” based advertising keyed more to availability, pricing, and financing.
For 2020, we’re forecasting new-car sales at 16.48 million – more than half a million less than 2019’s 17.04 million (see Figure 1.1). Many industry experts see a downturn as cyclical and, thus, temporary. We disagree. Our forecast is for a continuing decline in new-car sales over the next decade, barring radical technological improvements or new government regulation.
Many factors contribute to our forecast, but the basis is derived from a newly forming trend. Because new-vehicle sales are so important to automotive advertising, this deviant forecast requires an explanation.
There are four components to a trend. The first is seasonal – changes that occur within a year’s data over time. Beyond sub-annual deviations, trend and cycle intervene to measure lengthier, overarching change. Finally, once all of these have been removed from a time series, all that is left is the irregular (or residual) component. This is basically
Source: Borrell, US Dept. of Transportation © 2020 Borrell
U.S. NEW-VEHICLE SALES VS. LICENSED DRIVERS, 2001-2025FIGURE 1.1
MIL
LIO
NS
OF
VEH
ICLE
S SO
LD
MIL
LIO
NS
OF
LICE
NSE
D D
RIVE
RS
25
20
15
10
5
02001
20062011
20162002
20072012
2017
2021 (F)
20032008
20132018
2022 (F)
20042009
20142019
2023 (F)
20052010
2015
2020 (P)
2024 (F)
2025 (F)
250
200
150
100
50
0
16.5
16.1
11.6
13.2
12.7
14.4 15
.5
10.4
16.4
17.4
17.5
17.3
17.2
17.0
16.5
16.2
16.2
16.1
16.1
16.117
.1
16.8
16.9
16.9
16.6
NEW VEHICLES SOLD LICENSED DRIVERS
2020 AUTOMOTIVE ADVERTISING OUTLOOK : FLAGGING NEW-CAR SALES, SOARING ONLINE VIDEO MARKETING ©2020 Borrell Associates Inc. All Rights Reserved 05
“noise” – the random leftovers once all explainable trend components have been removed. Typically of small value, irregulars are generally ignored when trend analysis is performed.
Irregulars can serve an important purpose. When their values climb from small to more noticeable, they signal failure of the computed trend to accurately explain what has happened to the measured event over time – and invalidate the established relationships as clear forecasters of future activity. Irregulars now become a “tripwire” that can warn analysts of changes which have ended the utility of the time series they have come to depend upon.
U.S. new car sales trends crossed this tripwire in 2007, when the first warnings of the Great Recession were sounded. Indicators are calling new-car sales forecasts into question once again. The solid trend-cycle relationship which asserted itself as the nation climbed out of recession is no longer valid. A new trend is beginning.Four factors have contributed heavily to this realignment:
1. The rise in the price of used cars, which now stands at almost 65% of new-carprices. As auto auction house Manheim has observed, once the pricing of usedcars approaches this level, the clear distinction between the value of new and usedvehicles for buyers erodes. Buyers become as likely to purchase used vehicles withthe features they desire as they are to purchase new vehicles with fewer of thosefeatures.
2. The decline of advertising effectiveness in driving vehicle buyers to new carshowrooms. Twenty years ago, newspapers and broadcast TV were the primeadvertising channels used to bring buyers to their new cars and trucks. Newspaperreadership and broadcast viewing has aged and declined. Digital advertising hasbecome the solution of choice, but ad blocking and the enormous variation in usagepatterns has limited its impact. At the same time, individual dealers have been unableto effectively utilize digital ad platforms, which operate 24/7 and demand immediateresponse.
3. The attenuation of the car purchase cycle – which has shortened from a six-month purchase funnel of the ‘90’s to the six-week “shot-glass” extant today. Youngerbuyers check with friends and peers for the validity of a purchase choice almostinstantly via social media and arrive at a dealership with more knowledge of featuresand prices than many of the salespeople they deal with.
4. The decreasing requirement for car ownership. Younger consumers, besetwith enormous college debt, have found alternatives to new car ownership. Besidessimply purchasing used, many find Uber, carsharing or similar services sufficient fortheir social transportation needs.
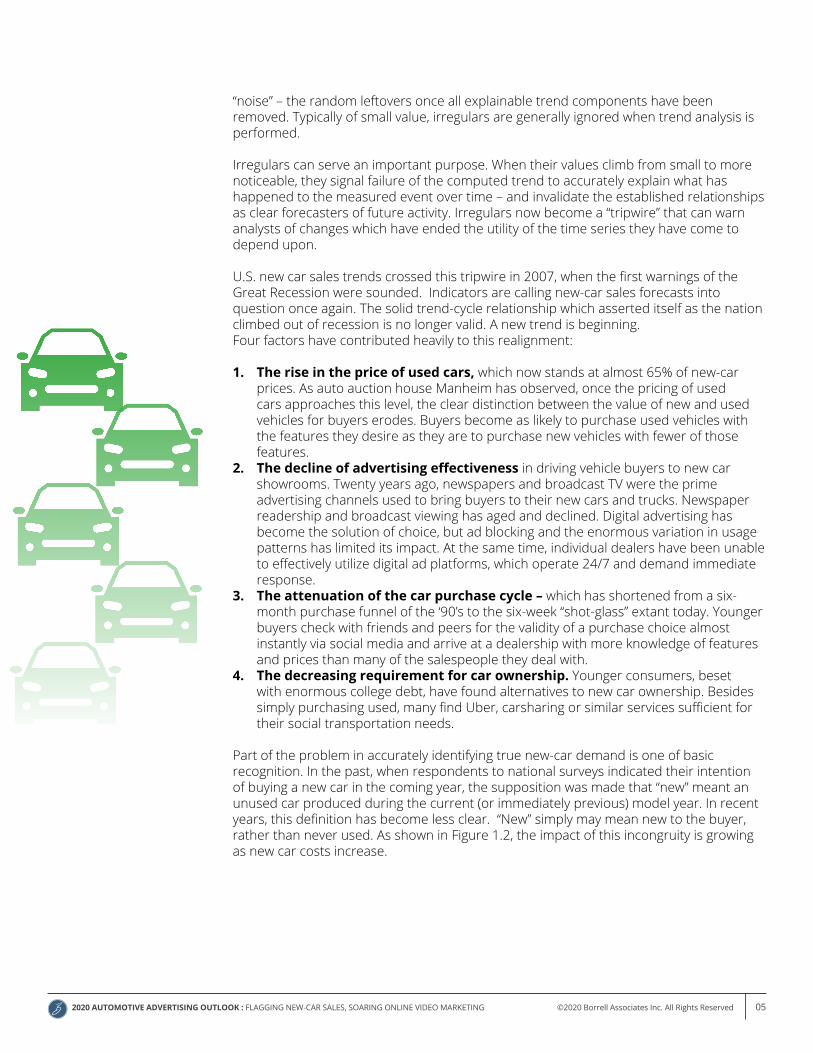
Part of the problem in accurately identifying true new-car demand is one of basic recognition. In the past, when respondents to national surveys indicated their intention of buying a new car in the coming year, the supposition was made that “new” meant an unused car produced during the current (or immediately previous) model year. In recent years, this definition has become less clear. “New” simply may mean new to the buyer, rather than never used. As shown in Figure 1.2, the impact of this incongruity is growing as new car costs increase.
2020 AUTOMOTIVE ADVERTISING OUTLOOK : FLAGGING NEW-CAR SALES, SOARING ONLINE VIDEO MARKETING ©2020 Borrell Associates Inc. All Rights Reserved 06
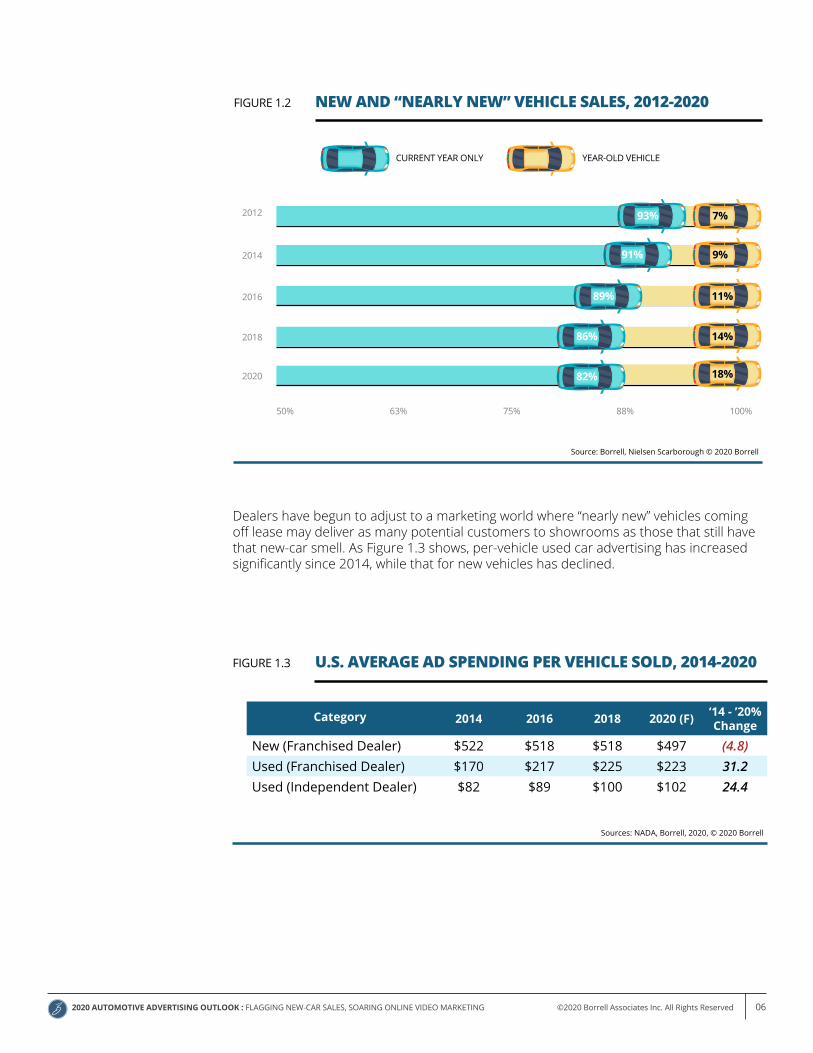
Dealers have begun to adjust to a marketing world where “nearly new” vehicles coming off lease may deliver as many potential customers to showrooms as those that still have that new-car smell. As Figure 1.3 shows, per-vehicle used car advertising has increased significantly since 2014, while that for new vehicles has declined.
Category 2014 2016 2018 2020 (F) ‘14 - ’20%Change
New (Franchised Dealer) $522 $518 $518 $497 (4.8)Used (Franchised Dealer) $170 $217 $225 $223 31.2Used (Independent Dealer) $82 $89 $100 $102 24.4
U.S. AVERAGE AD SPENDING PER VEHICLE SOLD, 2014-2020FIGURE 1.3
Sources: NADA, Borrell, 2020, © 2020 Borrell
NEW AND “NEARLY NEW” VEHICLE SALES, 2012-2020FIGURE 1.2
CURRENT YEAR ONLY YEAR-OLD VEHICLE
2012
2014
2016
2018
2020
50% 63% 75% 88% 100%
93%
91%
86%
7%
9%
14%
82% 18%
89% 11%
Source: Borrell, Nielsen Scarborough © 2020 Borrell
2020 AUTOMOTIVE ADVERTISING OUTLOOK : FLAGGING NEW-CAR SALES, SOARING ONLINE VIDEO MARKETING ©2020 Borrell Associates Inc. All Rights Reserved 07
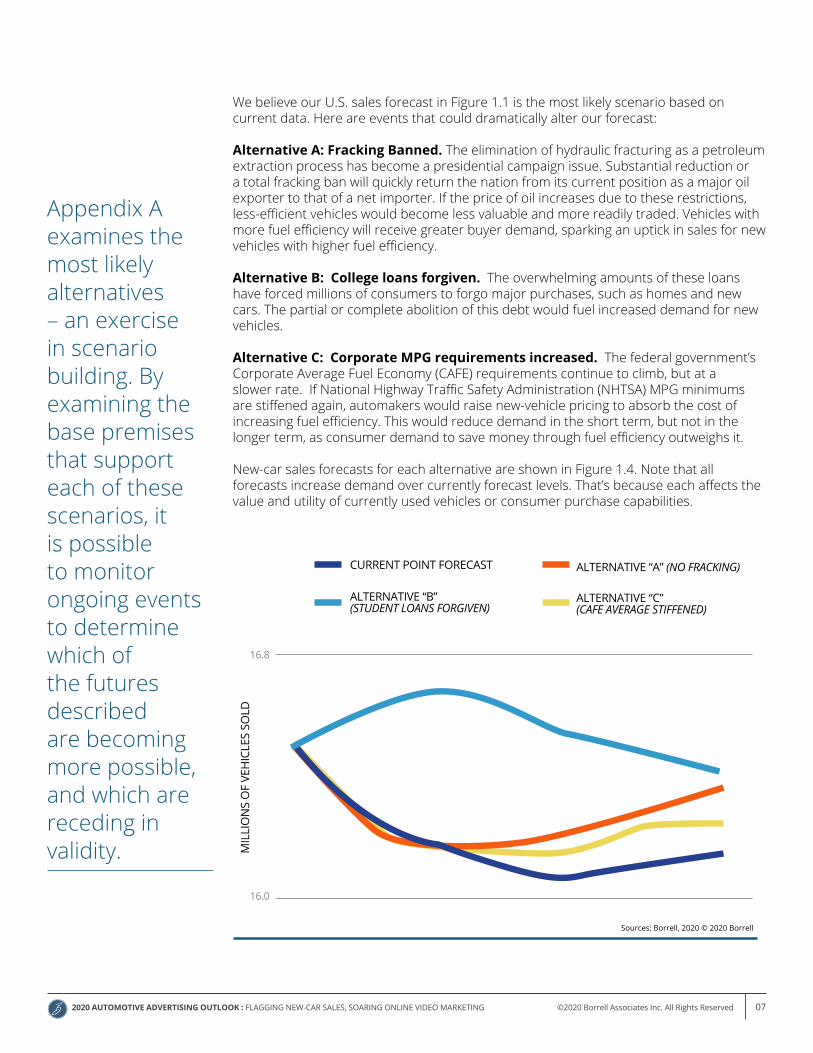
We believe our U.S. sales forecast in Figure 1.1 is the most likely scenario based on current data. Here are events that could dramatically alter our forecast:
Alternative A: Fracking Banned. The elimination of hydraulic fracturing as a petroleum extraction process has become a presidential campaign issue. Substantial reduction or a total fracking ban will quickly return the nation from its current position as a major oil exporter to that of a net importer. If the price of oil increases due to these restrictions, less-efficient vehicles would become less valuable and more readily traded. Vehicles with more fuel efficiency will receive greater buyer demand, sparking an uptick in sales for new vehicles with higher fuel efficiency.
Alternative B: College loans forgiven. The overwhelming amounts of these loans have forced millions of consumers to forgo major purchases, such as homes and new cars. The partial or complete abolition of this debt would fuel increased demand for new vehicles.
Alternative C: Corporate MPG requirements increased. The federal government’s Corporate Average Fuel Economy (CAFE) requirements continue to climb, but at a slower rate. If National Highway Traffic Safety Administration (NHTSA) MPG minimums are stiffened again, automakers would raise new-vehicle pricing to absorb the cost of increasing fuel efficiency. This would reduce demand in the short term, but not in the longer term, as consumer demand to save money through fuel efficiency outweighs it.
New-car sales forecasts for each alternative are shown in Figure 1.4. Note that all forecasts increase demand over currently forecast levels. That’s because each affects the value and utility of currently used vehicles or consumer purchase capabilities.FORECAST U.S. NEW-VEHICLE ANNUAL SALES:
CURRENT FORECAST VS. ALTERNATIVESFIGURE 1.4
Sources: Borrell, 2020 © 2020 Borrell
MIL
LIO
NS
OF
VEH
ICLE
S SO
LD
16.0
16.8
CURRENT POINT FORECAST
ALTERNATIVE “B” (STUDENT LOANS FORGIVEN)
ALTERNATIVE “A” (NO FRACKING)
ALTERNATIVE “C” (CAFE AVERAGE STIFFENED)
Appendix A examines the most likely alternatives – an exercisein scenariobuilding. Byexamining thebase premisesthat supporteach of thesescenarios, itis possibleto monitorongoing eventsto determinewhich ofthe futuresdescribedare becomingmore possible,and which arereceding invalidity.
2020 AUTOMOTIVE ADVERTISING OUTLOOK : FLAGGING NEW-CAR SALES, SOARING ONLINE VIDEO MARKETING ©2020 Borrell Associates Inc. All Rights Reserved 08
C H A P T E R 2 : 2020 AUTOMOTIVE AD-SPENDING FORECASTS
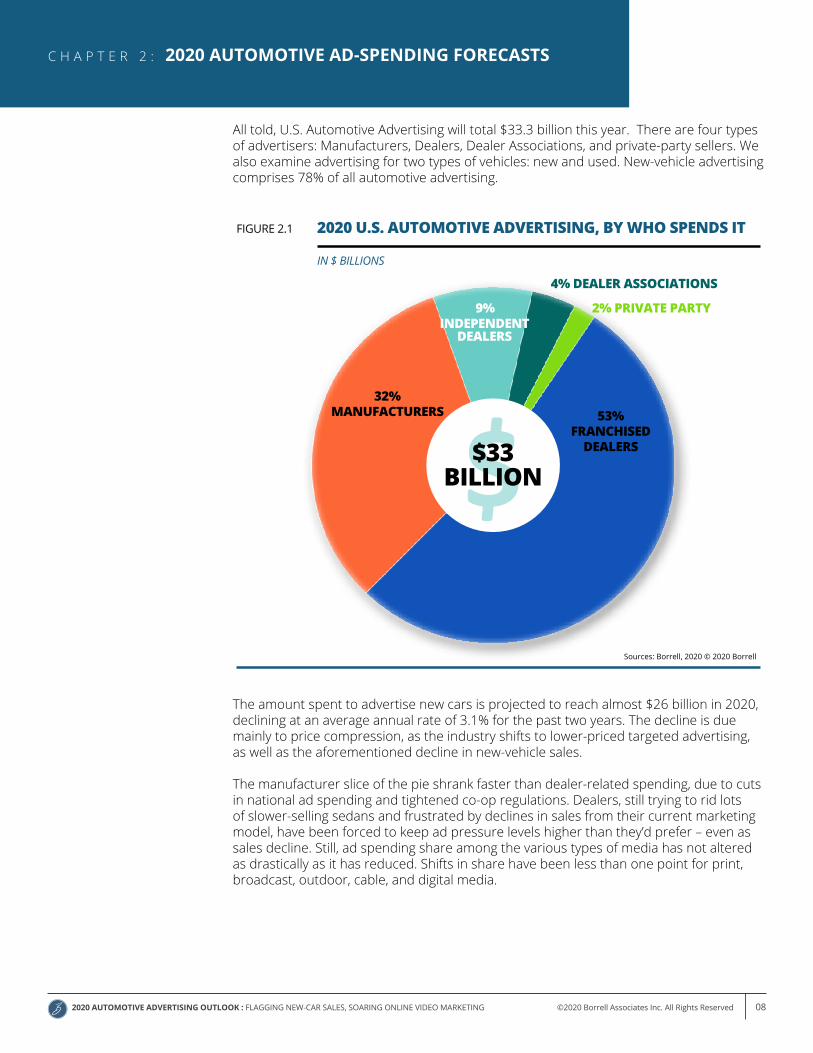
All told, U.S. Automotive Advertising will total $33.3 billion this year. There are four types of advertisers: Manufacturers, Dealers, Dealer Associations, and private-party sellers. We also examine advertising for two types of vehicles: new and used. New-vehicle advertising comprises 78% of all automotive advertising.
The amount spent to advertise new cars is projected to reach almost $26 billion in 2020, declining at an average annual rate of 3.1% for the past two years. The decline is due mainly to price compression, as the industry shifts to lower-priced targeted advertising, as well as the aforementioned decline in new-vehicle sales.
The manufacturer slice of the pie shrank faster than dealer-related spending, due to cuts in national ad spending and tightened co-op regulations. Dealers, still trying to rid lots of slower-selling sedans and frustrated by declines in sales from their current marketing model, have been forced to keep ad pressure levels higher than they’d prefer – even as sales decline. Still, ad spending share among the various types of media has not altered as drastically as it has reduced. Shifts in share have been less than one point for print, broadcast, outdoor, cable, and digital media.
2020 U.S. AUTOMOTIVE ADVERTISING, BY WHO SPENDS ITFIGURE 2.1
Sources: Borrell, 2020 © 2020 Borrell
IN $ BILLIONS
53%FRANCHISED
DEALERS
32%MANUFACTURERS
4% DEALER ASSOCIATIONS
9% INDEPENDENT
DEALERS
2% PRIVATE PARTY
$33 BILLION
2020 AUTOMOTIVE ADVERTISING OUTLOOK : FLAGGING NEW-CAR SALES, SOARING ONLINE VIDEO MARKETING ©2020 Borrell Associates Inc. All Rights Reserved 09
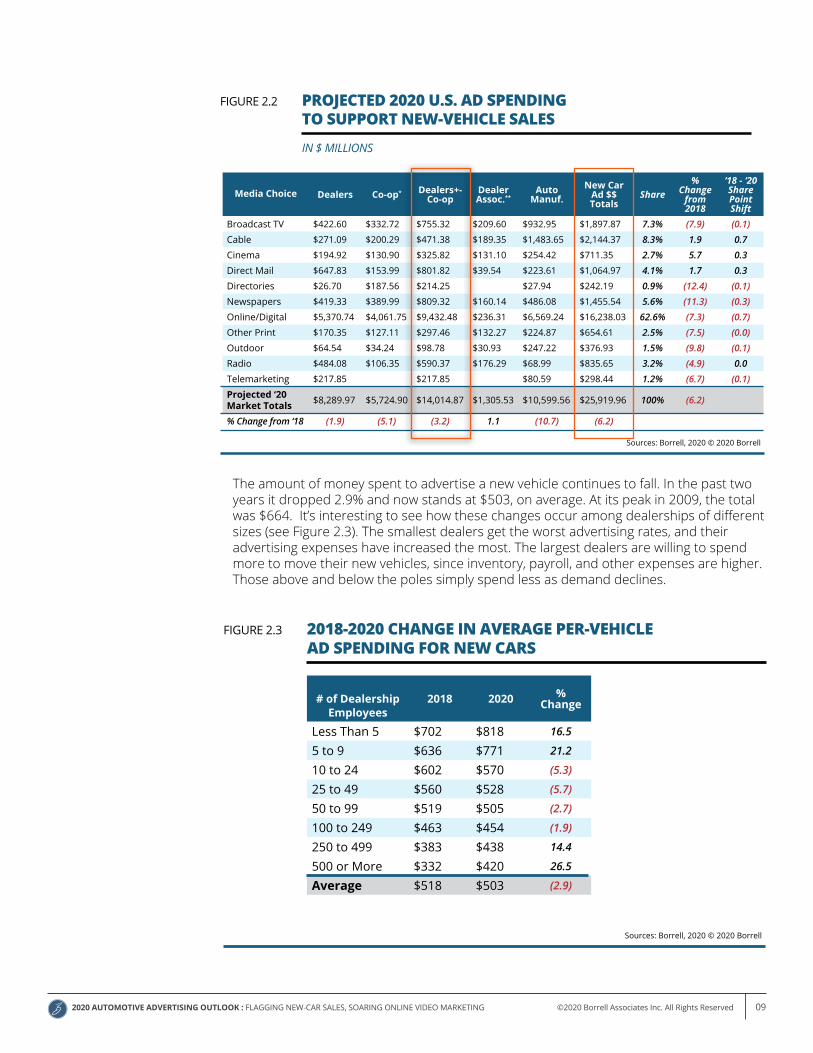
The amount of money spent to advertise a new vehicle continues to fall. In the past two years it dropped 2.9% and now stands at $503, on average. At its peak in 2009, the total was $664. It’s interesting to see how these changes occur among dealerships of different sizes (see Figure 2.3). The smallest dealers get the worst advertising rates, and their advertising expenses have increased the most. The largest dealers are willing to spend more to move their new vehicles, since inventory, payroll, and other expenses are higher. Those above and below the poles simply spend less as demand declines.
PROJECTED 2020 U.S. AD SPENDING TO SUPPORT NEW-VEHICLE SALES
FIGURE 2.2
IN $ MILLIONS
Media Choice Dealers Co-op* Dealers+-Co-op
Dealer Assoc.**
AutoManuf.
New Car Ad $$ Totals
Share%
Change from 2018
‘18 - ‘20 Share Point Shift
Broadcast TV $422.60 $332.72 $755.32 $209.60 $932.95 $1,897.87 7.3% (7.9) (0.1)Cable $271.09 $200.29 $471.38 $189.35 $1,483.65 $2,144.37 8.3% 1.9 0.7Cinema $194.92 $130.90 $325.82 $131.10 $254.42 $711.35 2.7% 5.7 0.3Direct Mail $647.83 $153.99 $801.82 $39.54 $223.61 $1,064.97 4.1% 1.7 0.3Directories $26.70 $187.56 $214.25 $27.94 $242.19 0.9% (12.4) (0.1)Newspapers $419.33 $389.99 $809.32 $160.14 $486.08 $1,455.54 5.6% (11.3) (0.3)Online/Digital $5,370.74 $4,061.75 $9,432.48 $236.31 $6,569.24 $16,238.03 62.6% (7.3) (0.7)Other Print $170.35 $127.11 $297.46 $132.27 $224.87 $654.61 2.5% (7.5) (0.0)Outdoor $64.54 $34.24 $98.78 $30.93 $247.22 $376.93 1.5% (9.8) (0.1)Radio $484.08 $106.35 $590.37 $176.29 $68.99 $835.65 3.2% (4.9) 0.0Telemarketing $217.85 $217.85 $80.59 $298.44 1.2% (6.7) (0.1)Projected ‘20 Market Totals $8,289.97 $5,724.90 $14,014.87 $1,305.53 $10,599.56 $25,919.96 100% (6.2)
% Change from ‘18 (1.9) (5.1) (3.2) 1.1 (10.7) (6.2)
Sources: Borrell, 2020 © 2020 Borrell
2018-2020 CHANGE IN AVERAGE PER-VEHICLE AD SPENDING FOR NEW CARS
FIGURE 2.3
Sources: Borrell, 2020 © 2020 Borrell
# of Dealership Employees
2018 2020 % Change
Less Than 5 $702 $818 16.5
5 to 9 $636 $771 21.2
10 to 24 $602 $570 (5.3)
25 to 49 $560 $528 (5.7)
50 to 99 $519 $505 (2.7)
100 to 249 $463 $454 (1.9)
250 to 499 $383 $438 14.4
500 or More $332 $420 26.5
Average $518 $503 (2.9)
2020 AUTOMOTIVE ADVERTISING OUTLOOK : FLAGGING NEW-CAR SALES, SOARING ONLINE VIDEO MARKETING ©2020 Borrell Associates Inc. All Rights Reserved 10
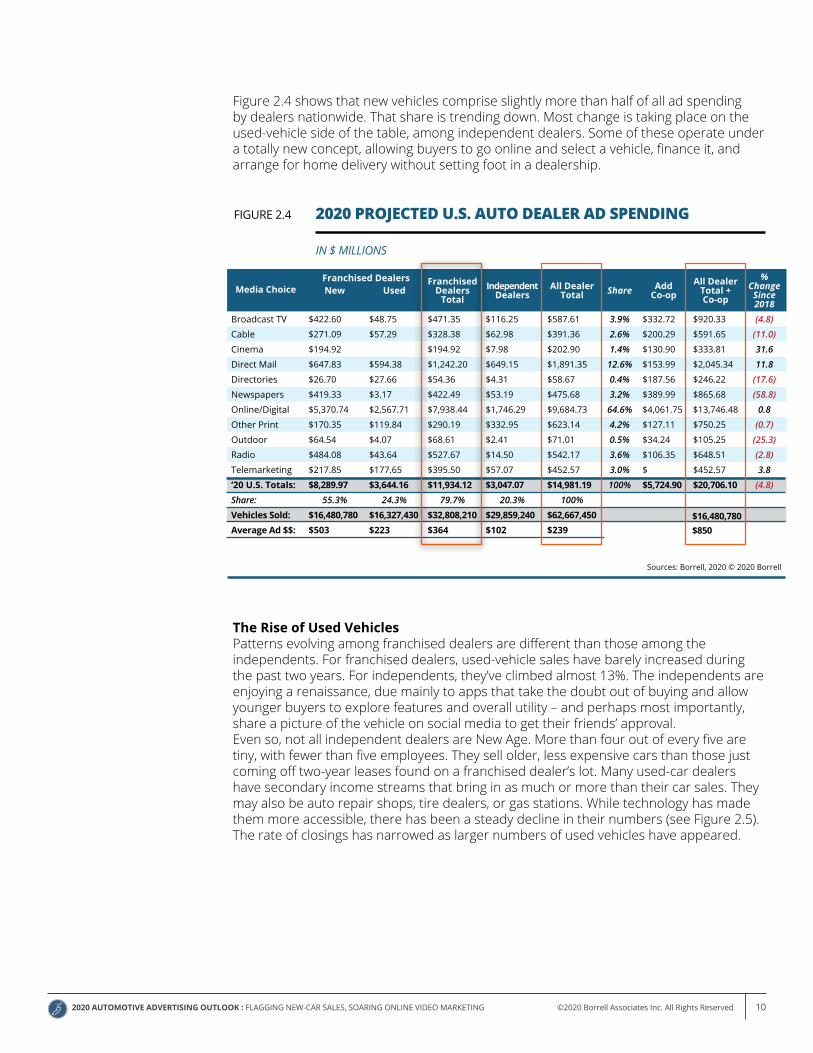
Figure 2.4 shows that new vehicles comprise slightly more than half of all ad spending by dealers nationwide. That share is trending down. Most change is taking place on the used-vehicle side of the table, among independent dealers. Some of these operate under a totally new concept, allowing buyers to go online and select a vehicle, finance it, and arrange for home delivery without setting foot in a dealership.
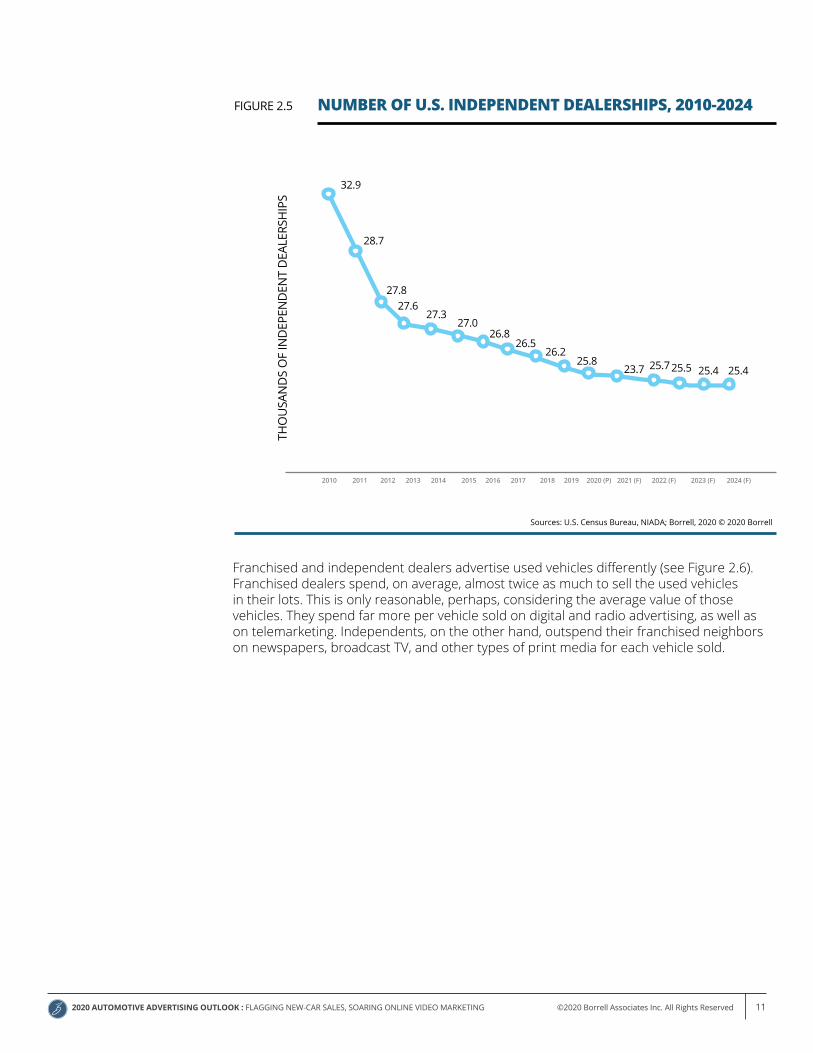
The Rise of Used VehiclesPatterns evolving among franchised dealers are different than those among the independents. For franchised dealers, used-vehicle sales have barely increased during the past two years. For independents, they’ve climbed almost 13%. The independents are enjoying a renaissance, due mainly to apps that take the doubt out of buying and allow younger buyers to explore features and overall utility – and perhaps most importantly, share a picture of the vehicle on social media to get their friends’ approval.Even so, not all independent dealers are New Age. More than four out of every five are tiny, with fewer than five employees. They sell older, less expensive cars than those just coming off two-year leases found on a franchised dealer’s lot. Many used-car dealers have secondary income streams that bring in as much or more than their car sales. They may also be auto repair shops, tire dealers, or gas stations. While technology has made them more accessible, there has been a steady decline in their numbers (see Figure 2.5). The rate of closings has narrowed as larger numbers of used vehicles have appeared.
Media Choice New UsedFranchised
Dealers Total
Independent Dealers
All Dealer Total Share Add
Co-opAll Dealer
Total + Co-op
% Change
Since 2018
Broadcast TV $422.60 $48.75 $471.35 $116.25 $587.61 3.9% $332.72 $920.33 (4.8)Cable $271.09 $57.29 $328.38 $62.98 $391.36 2.6% $200.29 $591.65 (11.0)Cinema $194.92 $194.92 $7.98 $202.90 1.4% $130.90 $333.81 31.6Direct Mail $647.83 $594.38 $1,242.20 $649.15 $1,891.35 12.6% $153.99 $2,045.34 11.8Directories $26.70 $27.66 $54.36 $4.31 $58.67 0.4% $187.56 $246.22 (17.6)Newspapers $419.33 $3.17 $422.49 $53.19 $475.68 3.2% $389.99 $865.68 (58.8)Online/Digital $5,370.74 $2,567.71 $7,938.44 $1,746.29 $9,684.73 64.6% $4,061.75 $13,746.48 0.8Other Print $170.35 $119.84 $290.19 $332.95 $623.14 4.2% $127.11 $750.25 (0.7)Outdoor $64.54 $4.07 $68.61 $2.41 $71.01 0.5% $34.24 $105.25 (25.3)Radio $484.08 $43.64 $527.67 $14.50 $542.17 3.6% $106.35 $648.51 (2.8)Telemarketing $217.85 $177.65 $395.50 $57.07 $452.57 3.0% $ $452.57 3.8‘20 U.S. Totals: $8,289.97 $3,644.16 $11,934.12 $3,047.07 $14,981.19 100% $5,724.90 $20,706.10 (4.8)Share: 55.3% 24.3% 79.7% 20.3% 100%Vehicles Sold: $16,480,780 $16,327,430 $32,808,210 $29,859,240 $62,667,450Average Ad $$: $503 $223 $364 $102 $239
2020 PROJECTED U.S. AUTO DEALER AD SPENDINGFIGURE 2.4
IN $ MILLIONS
Sources: Borrell, 2020 © 2020 Borrell
Franchised Dealers
$16,480,780$850
2020 AUTOMOTIVE ADVERTISING OUTLOOK : FLAGGING NEW-CAR SALES, SOARING ONLINE VIDEO MARKETING ©2020 Borrell Associates Inc. All Rights Reserved 11
Franchised and independent dealers advertise used vehicles differently (see Figure 2.6). Franchised dealers spend, on average, almost twice as much to sell the used vehicles in their lots. This is only reasonable, perhaps, considering the average value of those vehicles. They spend far more per vehicle sold on digital and radio advertising, as well as on telemarketing. Independents, on the other hand, outspend their franchised neighbors on newspapers, broadcast TV, and other types of print media for each vehicle sold.
NUMBER OF U.S. INDEPENDENT DEALERSHIPS, 2010-2024FIGURE 2.5
Sources: U.S. Census Bureau, NIADA; Borrell, 2020 © 2020 Borrell
2010 2011 2012 2013 2014 2015 2016 2017 2018 2019 2020 (P) 2021 (F) 2022 (F) 2023 (F) 2024 (F)
THO
USA
ND
S O
F IN
DEP
END
ENT
DEA
LERS
HIP
S
32.9
28.7
27.827.6
27.327.0
26.826.5
26.225.8
23.7 25.725.5 25.4 25.4
2020 AUTOMOTIVE ADVERTISING OUTLOOK : FLAGGING NEW-CAR SALES, SOARING ONLINE VIDEO MARKETING ©2020 Borrell Associates Inc. All Rights Reserved 12
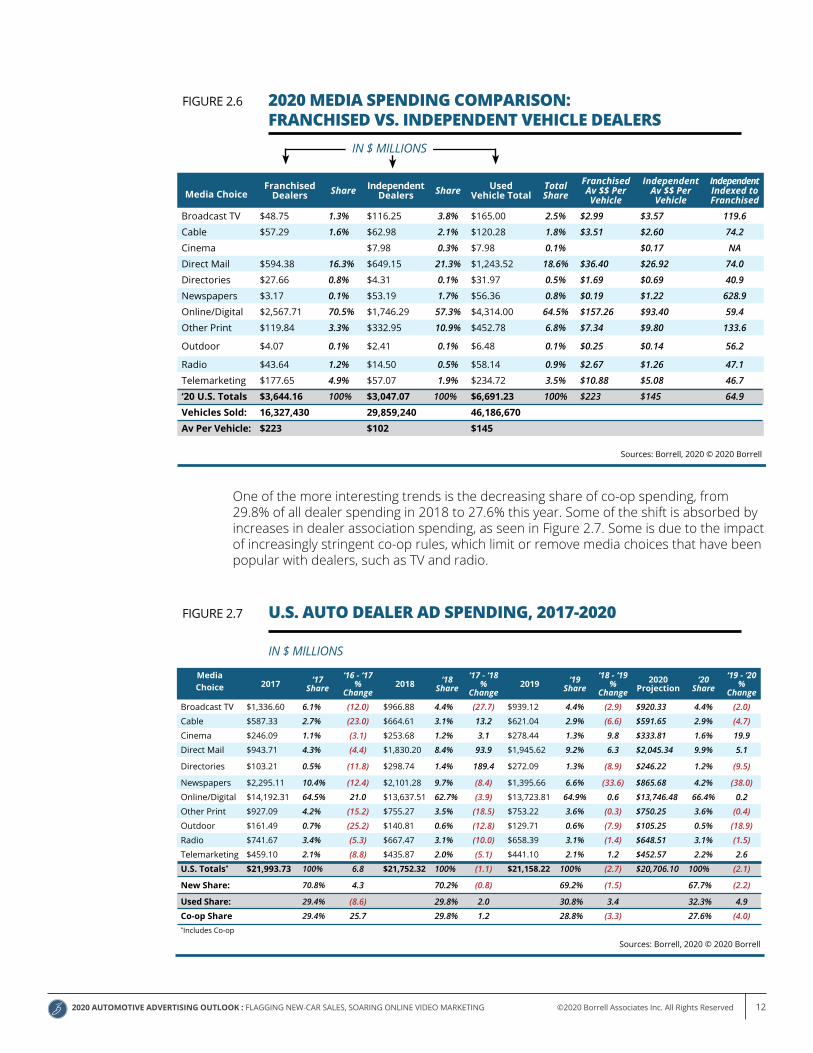
One of the more interesting trends is the decreasing share of co-op spending, from 29.8% of all dealer spending in 2018 to 27.6% this year. Some of the shift is absorbed by increases in dealer association spending, as seen in Figure 2.7. Some is due to the impact of increasingly stringent co-op rules, which limit or remove media choices that have been popular with dealers, such as TV and radio.
Media Choice 2017 ‘17
Share‘16 - ‘17
%Change
2018 ‘18 Share
‘17 - ‘18%
Change2019 ‘19
Share‘18 - ‘19
%Change
2020 Projection
‘20 Share
‘19 - ‘20%
ChangeBroadcast TV $1,336.60 6.1% (12.0) $966.88 4.4% (27.7) $939.12 4.4% (2.9) $920.33 4.4% (2.0)
Cable $587.33 2.7% (23.0) $664.61 3.1% 13.2 $621.04 2.9% (6.6) $591.65 2.9% (4.7)
Cinema $246.09 1.1% (3.1) $253.68 1.2% 3.1 $278.44 1.3% 9.8 $333.81 1.6% 19.9
Direct Mail $943.71 4.3% (4.4) $1,830.20 8.4% 93.9 $1,945.62 9.2% 6.3 $2,045.34 9.9% 5.1
Directories $103.21 0.5% (11.8) $298.74 1.4% 189.4 $272.09 1.3% (8.9) $246.22 1.2% (9.5)
Newspapers $2,295.11 10.4% (12.4) $2,101.28 9.7% (8.4) $1,395.66 6.6% (33.6) $865.68 4.2% (38.0)
Online/Digital $14,192.31 64.5% 21.0 $13,637.51 62.7% (3.9) $13,723.81 64.9% 0.6 $13,746.48 66.4% 0.2
Other Print $927.09 4.2% (15.2) $755.27 3.5% (18.5) $753.22 3.6% (0.3) $750.25 3.6% (0.4)
Outdoor $161.49 0.7% (25.2) $140.81 0.6% (12.8) $129.71 0.6% (7.9) $105.25 0.5% (18.9)
Radio $741.67 3.4% (5.3) $667.47 3.1% (10.0) $658.39 3.1% (1.4) $648.51 3.1% (1.5)
Telemarketing $459.10 2.1% (8.8) $435.87 2.0% (5.1) $441.10 2.1% 1.2 $452.57 2.2% 2.6
U.S. Totals* $21,993.73 100% 6.8 $21,752.32 100% (1.1) $21,158.22 100% (2.7) $20,706.10 100% (2.1)
New Share: 70.8% 4.3 70.2% (0.8) 69.2% (1.5) 67.7% (2.2)
Used Share: 29.4% (8.6) 29.8% 2.0 30.8% 3.4 32.3% 4.9
Co-op Share 29.4% 25.7 29.8% 1.2 28.8% (3.3) 27.6% (4.0)*Includes Co-op
U.S. AUTO DEALER AD SPENDING, 2017-2020FIGURE 2.7
IN $ MILLIONS
Sources: Borrell, 2020 © 2020 Borrell
Sources: Borrell, 2020 © 2020 Borrell
2020 MEDIA SPENDING COMPARISON: FRANCHISED VS. INDEPENDENT VEHICLE DEALERS
FIGURE 2.6
Media ChoiceFranchised
Dealers Share IndependentDealers Share Used
Vehicle TotalTotal Share
Franchised Av $$ Per Vehicle
Independent Av $$ Per Vehicle
Independent Indexed to Franchised
Broadcast TV $48.75 1.3% $116.25 3.8% $165.00 2.5% $2.99 $3.57 119.6
Cable $57.29 1.6% $62.98 2.1% $120.28 1.8% $3.51 $2.60 74.2
Cinema $7.98 0.3% $7.98 0.1% $0.17 NA
Direct Mail $594.38 16.3% $649.15 21.3% $1,243.52 18.6% $36.40 $26.92 74.0
Directories $27.66 0.8% $4.31 0.1% $31.97 0.5% $1.69 $0.69 40.9
Newspapers $3.17 0.1% $53.19 1.7% $56.36 0.8% $0.19 $1.22 628.9
Online/Digital $2,567.71 70.5% $1,746.29 57.3% $4,314.00 64.5% $157.26 $93.40 59.4
Other Print $119.84 3.3% $332.95 10.9% $452.78 6.8% $7.34 $9.80 133.6
Outdoor $4.07 0.1% $2.41 0.1% $6.48 0.1% $0.25 $0.14 56.2
Radio $43.64 1.2% $14.50 0.5% $58.14 0.9% $2.67 $1.26 47.1
Telemarketing $177.65 4.9% $57.07 1.9% $234.72 3.5% $10.88 $5.08 46.7
‘20 U.S. Totals $3,644.16 100% $3,047.07 100% $6,691.23 100% $223 $145 64.9Vehicles Sold: 16,327,430 29,859,240 46,186,670Av Per Vehicle: $223 $102 $145
IN $ MILLIONS
2020 AUTOMOTIVE ADVERTISING OUTLOOK : FLAGGING NEW-CAR SALES, SOARING ONLINE VIDEO MARKETING ©2020 Borrell Associates Inc. All Rights Reserved 13
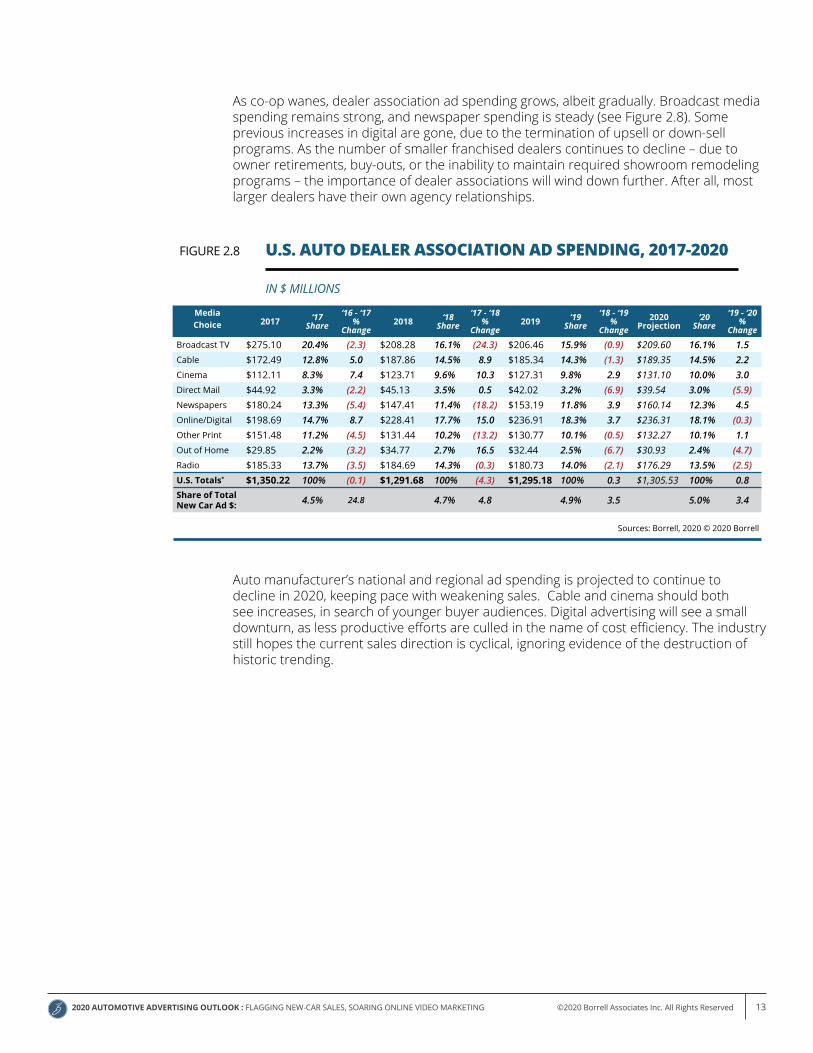
As co-op wanes, dealer association ad spending grows, albeit gradually. Broadcast media spending remains strong, and newspaper spending is steady (see Figure 2.8). Some previous increases in digital are gone, due to the termination of upsell or down-sell programs. As the number of smaller franchised dealers continues to decline – due to owner retirements, buy-outs, or the inability to maintain required showroom remodeling programs – the importance of dealer associations will wind down further. After all, most larger dealers have their own agency relationships.
U.S. AUTO DEALER ASSOCIATION AD SPENDING, 2017-2020FIGURE 2.8
IN $ MILLIONS
Media Choice 2017 ‘17
Share‘16 - ‘17
%Change
2018 ‘18 Share
‘17 - ‘18%
Change2019 ‘19
Share‘18 - ‘19
%Change
2020Projection
‘20 Share
‘19 - ‘20%
Change
Broadcast TV $275.10 20.4% (2.3) $208.28 16.1% (24.3) $206.46 15.9% (0.9) $209.60 16.1% 1.5 Cable $172.49 12.8% 5.0 $187.86 14.5% 8.9 $185.34 14.3% (1.3) $189.35 14.5% 2.2 Cinema $112.11 8.3% 7.4 $123.71 9.6% 10.3 $127.31 9.8% 2.9 $131.10 10.0% 3.0 Direct Mail $44.92 3.3% (2.2) $45.13 3.5% 0.5 $42.02 3.2% (6.9) $39.54 3.0% (5.9)Newspapers $180.24 13.3% (5.4) $147.41 11.4% (18.2) $153.19 11.8% 3.9 $160.14 12.3% 4.5 Online/Digital $198.69 14.7% 8.7 $228.41 17.7% 15.0 $236.91 18.3% 3.7 $236.31 18.1% (0.3)Other Print $151.48 11.2% (4.5) $131.44 10.2% (13.2) $130.77 10.1% (0.5) $132.27 10.1% 1.1 Out of Home $29.85 2.2% (3.2) $34.77 2.7% 16.5 $32.44 2.5% (6.7) $30.93 2.4% (4.7)Radio $185.33 13.7% (3.5) $184.69 14.3% (0.3) $180.73 14.0% (2.1) $176.29 13.5% (2.5)U.S. Totals* $1,350.22 100% (0.1) $1,291.68 100% (4.3) $1,295.18 100% 0.3 $1,305.53 100% 0.8 Share of Total New Car Ad $: 4.5% 24.8 4.7% 4.8 4.9% 3.5 5.0% 3.4
Sources: Borrell, 2020 © 2020 Borrell
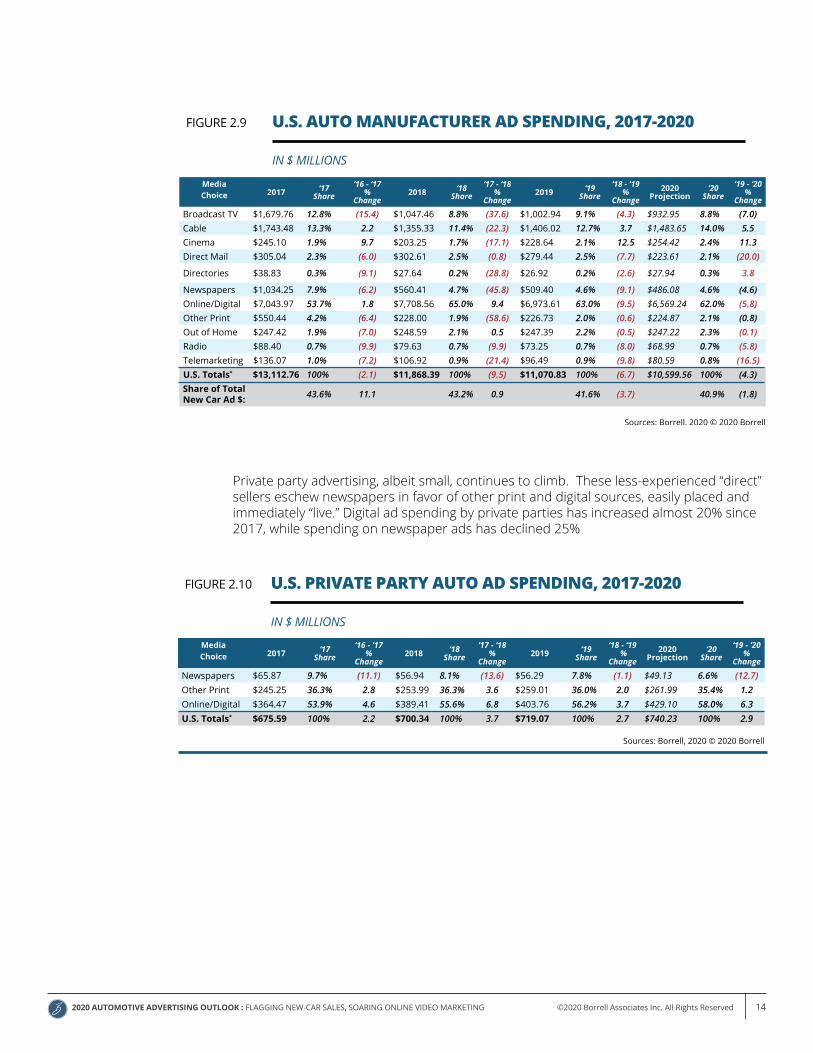
Auto manufacturer’s national and regional ad spending is projected to continue to decline in 2020, keeping pace with weakening sales. Cable and cinema should both see increases, in search of younger buyer audiences. Digital advertising will see a small downturn, as less productive efforts are culled in the name of cost efficiency. The industry still hopes the current sales direction is cyclical, ignoring evidence of the destruction of historic trending.
2020 AUTOMOTIVE ADVERTISING OUTLOOK : FLAGGING NEW-CAR SALES, SOARING ONLINE VIDEO MARKETING ©2020 Borrell Associates Inc. All Rights Reserved 14
U.S. AUTO MANUFACTURER AD SPENDING, 2017-2020FIGURE 2.9
IN $ MILLIONS
Media Choice 2017 ‘17
Share‘16 - ‘17
% Change
2018 ‘18 Share
‘17 - ‘18 %
Change2019 ‘19
Share‘18 - ‘19
% Change
2020Projection
‘20 Share
‘19 - ‘20%
Change
Broadcast TV $1,679.76 12.8% (15.4) $1,047.46 8.8% (37.6) $1,002.94 9.1% (4.3) $932.95 8.8% (7.0)Cable $1,743.48 13.3% 2.2 $1,355.33 11.4% (22.3) $1,406.02 12.7% 3.7 $1,483.65 14.0% 5.5 Cinema $245.10 1.9% 9.7 $203.25 1.7% (17.1) $228.64 2.1% 12.5 $254.42 2.4% 11.3 Direct Mail $305.04 2.3% (6.0) $302.61 2.5% (0.8) $279.44 2.5% (7.7) $223.61 2.1% (20.0)
Directories $38.83 0.3% (9.1) $27.64 0.2% (28.8) $26.92 0.2% (2.6) $27.94 0.3% 3.8
Newspapers $1,034.25 7.9% (6.2) $560.41 4.7% (45.8) $509.40 4.6% (9.1) $486.08 4.6% (4.6)Online/Digital $7,043.97 53.7% 1.8 $7,708.56 65.0% 9.4 $6,973.61 63.0% (9.5) $6,569.24 62.0% (5.8)Other Print $550.44 4.2% (6.4) $228.00 1.9% (58.6) $226.73 2.0% (0.6) $224.87 2.1% (0.8)Out of Home $247.42 1.9% (7.0) $248.59 2.1% 0.5 $247.39 2.2% (0.5) $247.22 2.3% (0.1)Radio $88.40 0.7% (9.9) $79.63 0.7% (9.9) $73.25 0.7% (8.0) $68.99 0.7% (5.8)Telemarketing $136.07 1.0% (7.2) $106.92 0.9% (21.4) $96.49 0.9% (9.8) $80.59 0.8% (16.5)U.S. Totals* $13,112.76 100% (2.1) $11,868.39 100% (9.5) $11,070.83 100% (6.7) $10,599.56 100% (4.3)Share of Total New Car Ad $: 43.6% 11.1 43.2% 0.9 41.6% (3.7) 40.9% (1.8)
Sources: Borrell, 2020 © 2020 Borrell
U.S. PRIVATE PARTY AUTO AD SPENDING, 2017-2020FIGURE 2.10
IN $ MILLIONS
Media Choice 2017 ‘17
Share‘16 - ‘17
% Change
2018 ‘18Share
‘17 - ‘18 %
Change2019 ‘19
Share‘18 - ‘19
% Change
2020 Projection
‘20 Share
‘19 - ‘20 %
Change
Newspapers $65.87 9.7% (11.1) $56.94 8.1% (13.6) $56.29 7.8% (1.1) $49.13 6.6% (12.7)Other Print $245.25 36.3% 2.8 $253.99 36.3% 3.6 $259.01 36.0% 2.0 $261.99 35.4% 1.2 Online/Digital $364.47 53.9% 4.6 $389.41 55.6% 6.8 $403.76 56.2% 3.7 $429.10 58.0% 6.3 U.S. Totals* $675.59 100% 2.2 $700.34 100% 3.7 $719.07 100% 2.7 $740.23 100% 2.9
Sources: Borrell, 2020 © 2020 Borrell
Private party advertising, albeit small, continues to climb. These less-experienced “direct” sellers eschew newspapers in favor of other print and digital sources, easily placed and immediately “live.” Digital ad spending by private parties has increased almost 20% since 2017, while spending on newspaper ads has declined 25%
2020 AUTOMOTIVE ADVERTISING OUTLOOK : FLAGGING NEW-CAR SALES, SOARING ONLINE VIDEO MARKETING ©2020 Borrell Associates Inc. All Rights Reserved 15
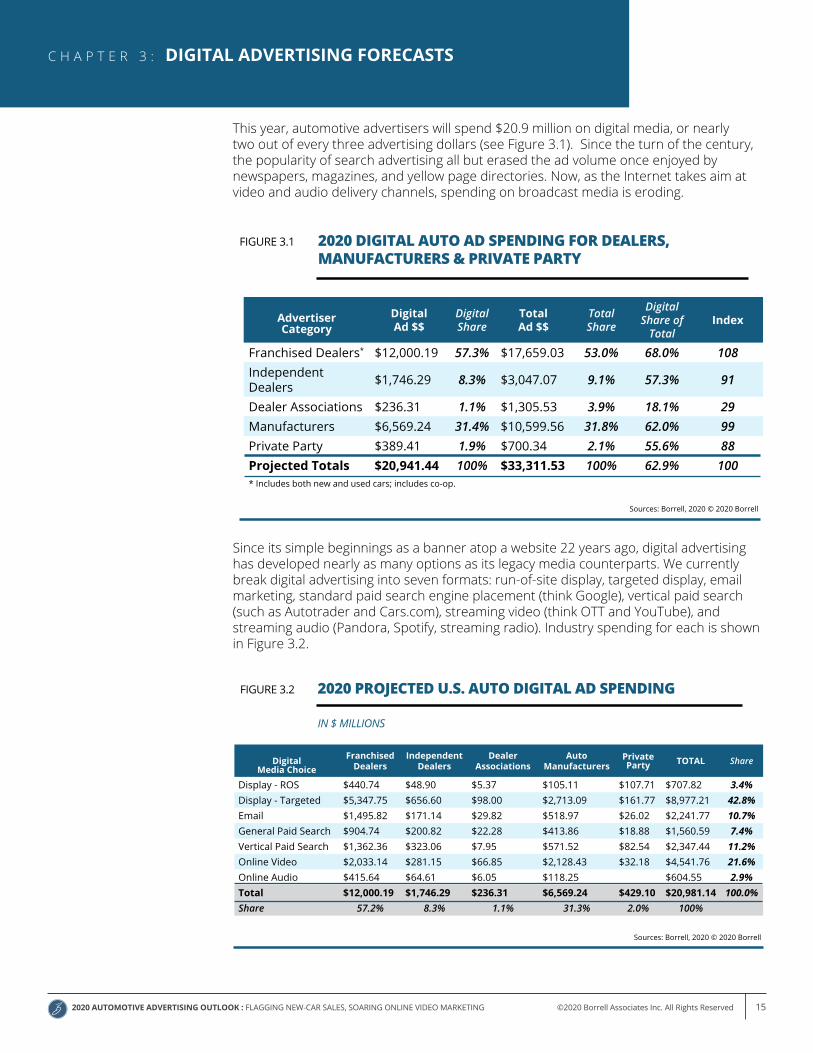
This year, automotive advertisers will spend $20.9 million on digital media, or nearly two out of every three advertising dollars (see Figure 3.1). Since the turn of the century, the popularity of search advertising all but erased the ad volume once enjoyed by newspapers, magazines, and yellow page directories. Now, as the Internet takes aim at video and audio delivery channels, spending on broadcast media is eroding.
C H A P T E R 3 : DIGITAL ADVERTISING FORECASTS
Since its simple beginnings as a banner atop a website 22 years ago, digital advertising has developed nearly as many options as its legacy media counterparts. We currently break digital advertising into seven formats: run-of-site display, targeted display, email marketing, standard paid search engine placement (think Google), vertical paid search (such as Autotrader and Cars.com), streaming video (think OTT and YouTube), and streaming audio (Pandora, Spotify, streaming radio). Industry spending for each is shown in Figure 3.2.
2020 DIGITAL AUTO AD SPENDING FOR DEALERS, MANUFACTURERS & PRIVATE PARTY
FIGURE 3.1
Sources: Borrell, 2020 © 2020 Borrell
Advertiser Category
Digital Ad $$
Digital Share
Total Ad $$
Total Share
Digital Share of
TotalIndex
Franchised Dealers* $12,000.19 57.3% $17,659.03 53.0% 68.0% 108Independent Dealers $1,746.29 8.3% $3,047.07 9.1% 57.3% 91
Dealer Associations $236.31 1.1% $1,305.53 3.9% 18.1% 29Manufacturers $6,569.24 31.4% $10,599.56 31.8% 62.0% 99Private Party $389.41 1.9% $700.34 2.1% 55.6% 88Projected Totals $20,941.44 100% $33,311.53 100% 62.9% 100* Includes both new and used cars; includes co-op.
Digital Media Choice
Franchised Dealers
IndependentDealers
Dealer Associations
AutoManufacturers
Private Party TOTAL Share
Display - ROS $440.74 $48.90 $5.37 $105.11 $107.71 $707.82 3.4%Display - Targeted $5,347.75 $656.60 $98.00 $2,713.09 $161.77 $8,977.21 42.8%Email $1,495.82 $171.14 $29.82 $518.97 $26.02 $2,241.77 10.7%General Paid Search $904.74 $200.82 $22.28 $413.86 $18.88 $1,560.59 7.4%Vertical Paid Search $1,362.36 $323.06 $7.95 $571.52 $82.54 $2,347.44 11.2%Online Video $2,033.14 $281.15 $66.85 $2,128.43 $32.18 $4,541.76 21.6%Online Audio $415.64 $64.61 $6.05 $118.25 $604.55 2.9%Total $12,000.19 $1,746.29 $236.31 $6,569.24 $429.10 $20,981.14 100.0%Share 57.2% 8.3% 1.1% 31.3% 2.0% 100%
2020 PROJECTED U.S. AUTO DIGITAL AD SPENDINGFIGURE 3.2
Sources: Borrell, 2020 © 2020 Borrell
IN $ MILLIONS
2020 AUTOMOTIVE ADVERTISING OUTLOOK : FLAGGING NEW-CAR SALES, SOARING ONLINE VIDEO MARKETING ©2020 Borrell Associates Inc. All Rights Reserved 16
Paid search once took the lion’s share of automotive dollars. Control has shifted to targeted banner advertising and, more recently, streaming video. Combined, targeted display and streaming video account for 64% of digital expenditures and 40% of all advertising expenditures by dealers, manufacturers, and third-party advertisers. We foresee that dominance increasing over the next five years for franchised auto dealers (see Figure 3.3). While streaming video advertising is expected to increase for all types of auto advertisers over the next five years, we foresee spotty declines in targeted display for manufacturers, independents and dealer associations. Those declines are fueled by two things:
• Slippage in the inventory of good used cars – the principal items advertised in targeted banners
• A greater attraction to a glitzier cousin – streaming video. In early 2020, programmatic networks reported targeted OTT ads for car dealers selling as low as $1,000 per month. If you can show a video spot that cheap to a potential car buyer, why buy a static ad?
As stated earlier, overall industry spending is in decline – a reaction to unexpectedly shrinking new-vehicle sales. The digital components, for the most part, continue to grow. Five-year point forecasts for digital advertising for each industry segment follow.
FRANCHISED AUTO DEALER DIGITAL AD SPENDING, 2018-2025
FIGURE 3.3
Sources: Borrell, 2020 © 2020 Borrell
IN $ MILLIONS
2018 2019 2020 (P) 2021 (F) 2022 (F) 2023 (F) 2024 (F) 2025 (F)
$7,000
$5,250
$3,500
$1,750
$0
DISPLAY-TARGETED PAID SEARCH-VERTICALPAID SEARCH-GENERALONLINE VIDEO
ONLINE AUDIO
EMAILDISPLAY-ROS
A 27.7% increase in spending for franchised dealers is foreseen, as significant competition from well-equipped used vehicles continues to blunt new-car sales. Use of video will double, mostly due to OTT sales, while search and targeted display see more sluggish increases.
2020 AUTOMOTIVE ADVERTISING OUTLOOK : FLAGGING NEW-CAR SALES, SOARING ONLINE VIDEO MARKETING ©2020 Borrell Associates Inc. All Rights Reserved 17
INDEPENDENT AUTO DEALER DIGITAL AD SPENDING, 2018-2025
FIGURE 3.4
2018 2019 2020 (P) 2021 (F) 2022 (F) 2023 (F) 2024 (F) 2025 (F)
$1,000
$750
$500
$250
$0
Sources: Borrell, 2020 © 2020 Borrell
IN $ MILLIONS
DISPLAY-TARGETED PAID SEARCH-VERTICALPAID SEARCH-GENERALONLINE VIDEO
ONLINE AUDIO
EMAILDISPLAY-ROS
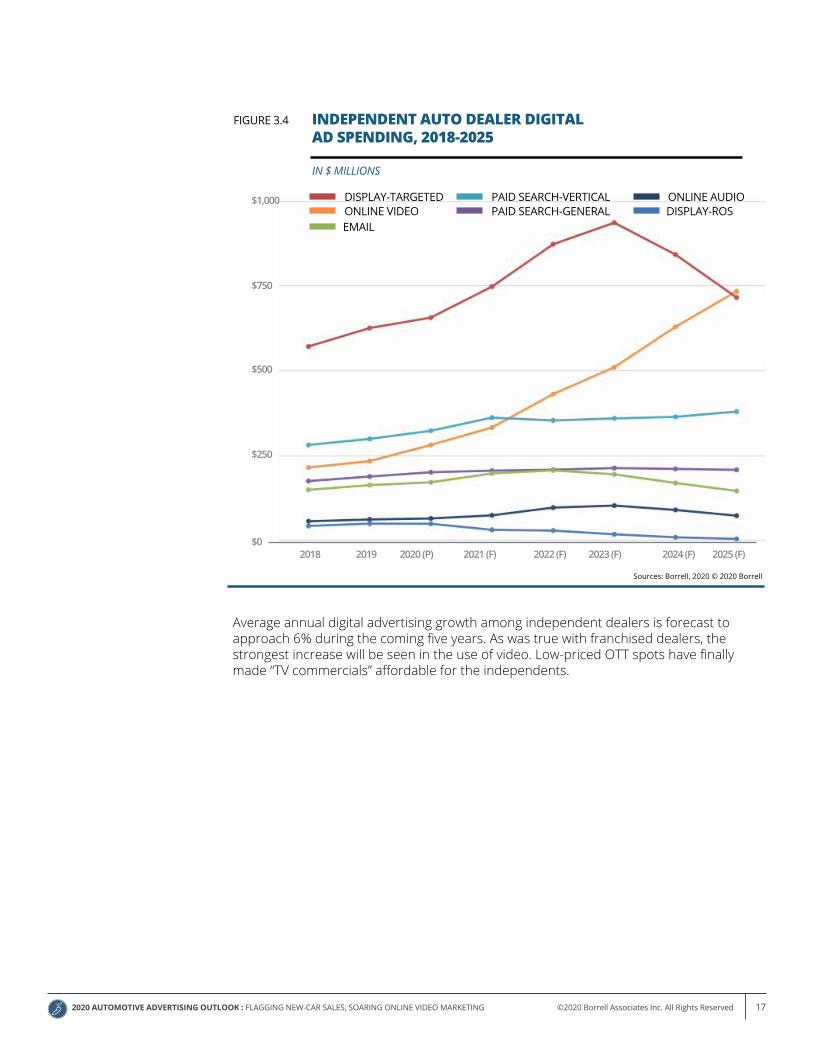
Average annual digital advertising growth among independent dealers is forecast to approach 6% during the coming five years. As was true with franchised dealers, the strongest increase will be seen in the use of video. Low-priced OTT spots have finally made “TV commercials” affordable for the independents.
2020 AUTOMOTIVE ADVERTISING OUTLOOK : FLAGGING NEW-CAR SALES, SOARING ONLINE VIDEO MARKETING ©2020 Borrell Associates Inc. All Rights Reserved 18
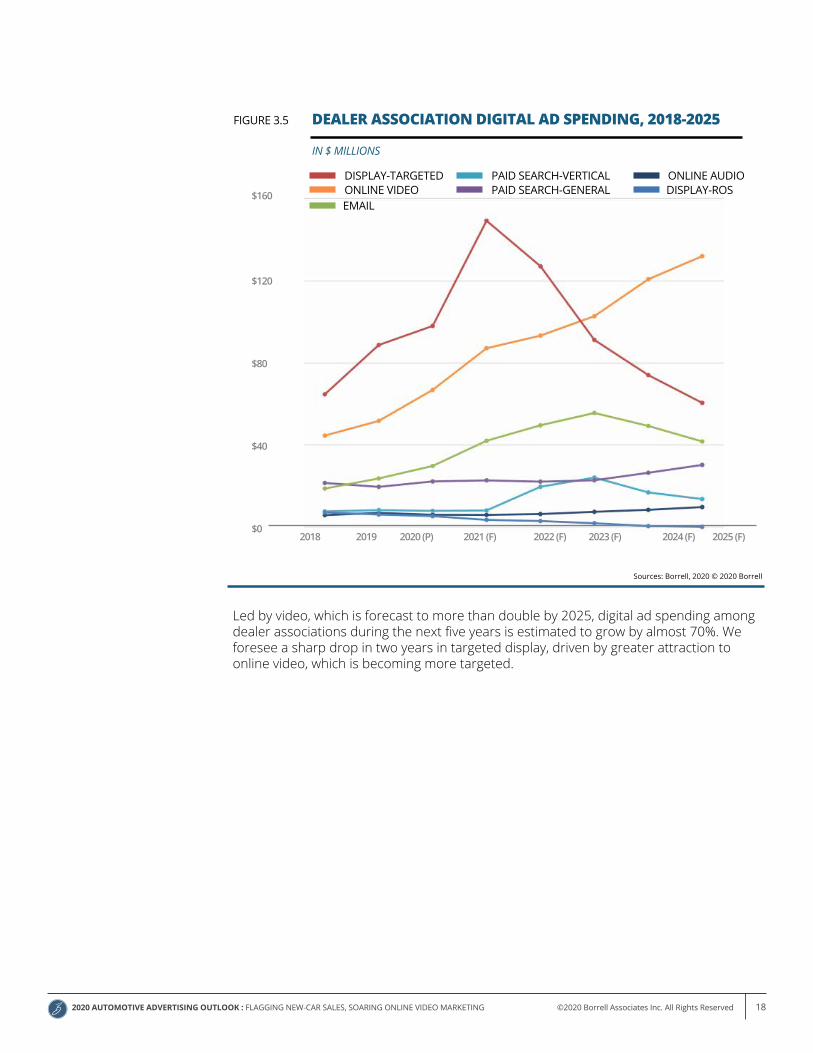
Led by video, which is forecast to more than double by 2025, digital ad spending among dealer associations during the next five years is estimated to grow by almost 70%. We foresee a sharp drop in two years in targeted display, driven by greater attraction to online video, which is becoming more targeted.
DEALER ASSOCIATION DIGITAL AD SPENDING, 2018-2025FIGURE 3.5
IN $ MILLIONS
2018 2019 2020 (P) 2021 (F) 2022 (F) 2023 (F) 2024 (F) 2025 (F)
$160
$120
$80
$40
$0
Sources: Borrell, 2020 © 2020 Borrell
DISPLAY-TARGETED PAID SEARCH-VERTICALPAID SEARCH-GENERALONLINE VIDEO
ONLINE AUDIO
EMAILDISPLAY-ROS
2020 AUTOMOTIVE ADVERTISING OUTLOOK : FLAGGING NEW-CAR SALES, SOARING ONLINE VIDEO MARKETING ©2020 Borrell Associates Inc. All Rights Reserved 19
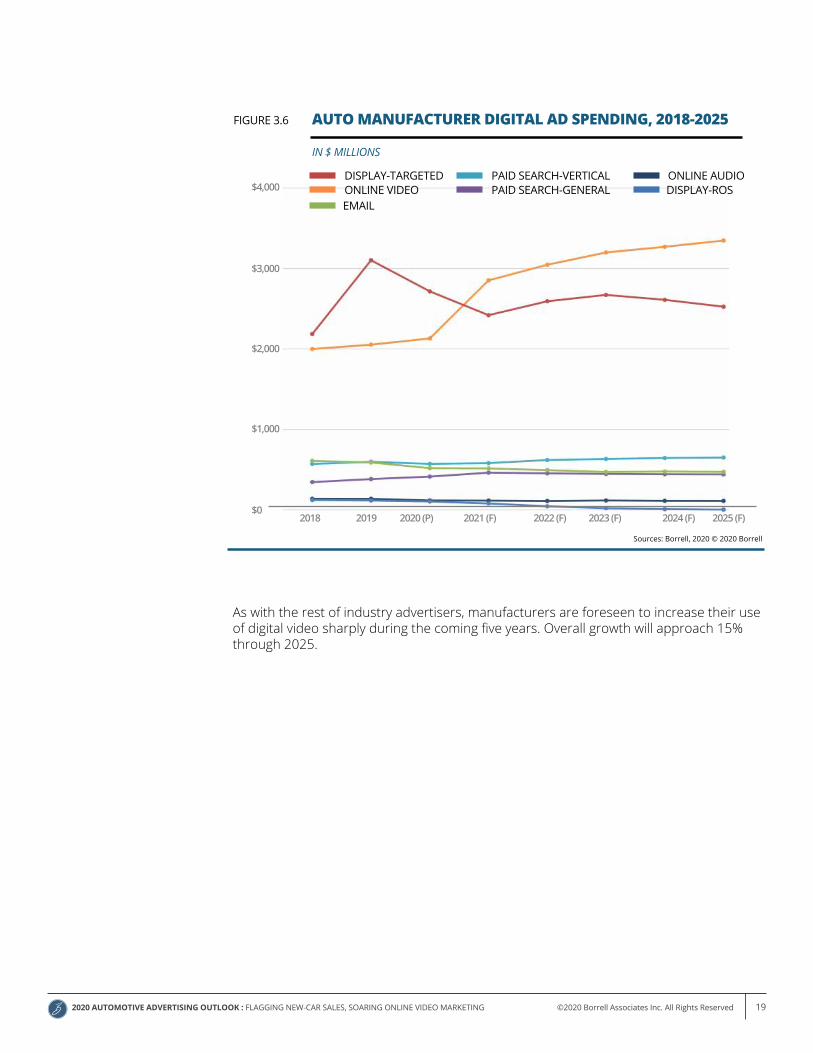
As with the rest of industry advertisers, manufacturers are foreseen to increase their use of digital video sharply during the coming five years. Overall growth will approach 15% through 2025.
AUTO MANUFACTURER DIGITAL AD SPENDING, 2018-2025FIGURE 3.6
IN $ MILLIONS
Sources: Borrell, 2020 © 2020 Borrell
2018 2019 2020 (P) 2021 (F) 2022 (F) 2023 (F) 2024 (F) 2025 (F)
$4,000
$3,000
$2,000
$1,000
$0
DISPLAY-TARGETED PAID SEARCH-VERTICALPAID SEARCH-GENERALONLINE VIDEO
ONLINE AUDIO
EMAILDISPLAY-ROS
2020 AUTOMOTIVE ADVERTISING OUTLOOK : FLAGGING NEW-CAR SALES, SOARING ONLINE VIDEO MARKETING ©2020 Borrell Associates Inc. All Rights Reserved 20
This analysis has shown readers a massive set of data and forecasts, all presented to provide the best look possible on what is likely to happen during the coming five years. Stripped of the tables, charts, and graphs, these are the most important take-aways:
• The auto industry is undergoing a slow evolution. Old trends and forecasts no longerapply. We expect two to three years of uncertainty on the lynchpin of an uncertaineconomy and government regulation that could go either way.
• If currently predicted outcomes persist, the auto industry will experience severalmore years – perhaps a decade – of slow decline in new car demand, principally dueto competition from “slightly used” vehicles and student loan debt delaying entryfrom younger buyers.
• Despite hopes fueled by stories of car dealers coming back to print and broadcastmedia, there’s no evidence and thus, no chance. However, there is strong evidencethat local auto marketers don’t handle the digital space well and still favor seeing theirfaces on broadcast TV spots. Longstanding business practices hold them back frombeing able to respond to leads 24/7, thus losing to pureplay Internet competitors.CarGurus, TrueCar, Carvana and others thrive by shunning something that traditionaldealerships continue to take pride in: Personal contact and high touch.
• Traditional media companies that have their own online audiences might do besttaking a page from the likes of Google, Amazon, Facebook, and others who make ascience of understanding their users’ behavior. Knowledge of a media company’suser base (including and especially its digital component) will be important to gain orretain Tier 2 and Tier 3 advertisers. Combining this user data with dealerships’ owncustomer data and with location data is growing into a marketing holy grail.
• Many auto dealerships still operate as though a substantial number of those comingto their showrooms are merely browsers. As “auto intender” studies have shown,that is no longer true. Many prospects – especially younger people – have alreadystudied the brand and model they’re interested in. They are highly likely to purchasethe moment they walk onto the lot. This has broadly increased the attractiveness ofgeofencing, or the practice of serving a dealership ad or offer to someone’s cellphoneas they walk onto a competitor’s lot.
Appendix A contains scenarios built from alternative futures that could affect the point forecasts portrayed in this report. Appendix B shows a national compilation of our Auto LA$R report.
CONCLUSIONS
2020 AUTOMOTIVE ADVERTISING OUTLOOK : FLAGGING NEW-CAR SALES, SOARING ONLINE VIDEO MARKETING ©2020 Borrell Associates Inc. All Rights Reserved 21
To quote Yogi Berra, the future ain’t what it used to be. That is, forecasts change as more information is gleaned, making the future a dynamic vision. Unforeseen events may occur that change the picture. Even when events are expected, they may have unforeseen consequences.
One way to attempt to take future events and their impact into account is scenario building. Part art, part science, this process considers events that might happen and weaves them into narratives. Included here are descriptions of three very different alternative futures, each fueled by events that could take place.
Alternative 1: Status Quo Current Probability: 65%The new U.S. president took the oath of office just three months ago. Both houses of Congress have opposing majorities, but do not control enough votes to overcome the veto pen the President has already vowed to use. Little groundbreaking legislation is expected out of Washington any time soon.
The nation’s economic growth continues to glide along between 2% and 3% annually. The price of oil has remained relatively steady, and the continued use of hydraulic fracturing as an extraction technique ensures that no change is on the horizon. The price of a gallon of gas remains steady at around $2.30.
Unemployment remains low, at just over 3%. However, 40% of college graduates find themselves working in jobs that do not require advanced education. The average college loan debt among new graduates is $45,000.
About 50 new car dealers shut down every year – mostly smaller stores. New-car demand continues to erode. Current estimates are for 16.2 million sales or leases this year.
General Motors has spun off its Buick Division to Chinese buyers. Ford has ended the Lincoln brand – its place to be taken by a newly redesigned Thunderbird. Chrysler’s best-selling car this year is a Peugeot SUV. India’s TATA has shown models for the U.S. market at the last Detroit Auto Show, but franchise interest is low. Tesla sales remain steady, but the brand does not gain U.S. share.
Alternative 2: Unintended Consequences Current Probability: 22%Progressives sweep the 2024 election. The new president immediately signs three executive orders. The first bans fracking as an oil or gas extraction technique on federal land. The second directs the NHTSA to elevate the CAFE (corporate average fuel economy) levels to 30 mpg next year, rising to 40 mpg in five years. The third directs the new Secretary of State to start immediate negotiations for the nation to join the Paris Accord.
Within three months, legislation cancelling all collegiate student debt is on the president’s desk. He (or she) signs immediately, unleashing pent-up demand among millions of younger consumers. Marriage rates climb, as does home buying. Many buy their first new cars as well.
The impact of the new CAFE regulations staggers domestic auto manufacturers, forcing them to reevaluate their production designs. Within a year, the first truly high-mileage
A P P E N D I X A : OTHER SCENARIOS
2020 AUTOMOTIVE ADVERTISING OUTLOOK : FLAGGING NEW-CAR SALES, SOARING ONLINE VIDEO MARKETING ©2020 Borrell Associates Inc. All Rights Reserved 22
models begin to appear in showrooms, along with electric and hybrid alternatives. In the meantime, the price of gasoline at U.S. pumps climbs to an average of $4.10 a gallon. India’s TATA and some Chinese micro compacts find franchisees to bring their brands to the U.S. market.
New car demand climbs to more than 17 million units as car owners who can hurry to trade their inefficient gas guzzlers in for transportation they can afford to use. However, U.S. brands are late to market with their answers to current market conditions. For nearly a year, only imports can meet their needs.
Alternative 3: The New Battery Current Probability: 13%Elon Musk announces the availability of a new battery, now in production at his enormous Las Vegas facility. The battery is three times as efficient as current auto batteries. It will allow electric cars to have ranges of more than 1,000 miles. His newest designs, soon to be available, will have double that range.
Other manufacturers hurry to adapt the new battery to their own products. Within three years, electric vehicles outsell those powered by gasoline, and the price of gas at the pumps begins to tumble. New-car demand soars, reaching more than 19 million units by 2029.
2020 AUTOMOTIVE ADVERTISING OUTLOOK : FLAGGING NEW-CAR SALES, SOARING ONLINE VIDEO MARKETING ©2020 Borrell Associates Inc. All Rights Reserved 23
A P P E N D I X B : AUTOMOTIVE LA$R REPORT
2020 AUTOMOTIVE ADVERTISING OUTLOOK : FLAGGING NEW-CAR SALES, SOARING ONLINE VIDEO MARKETING ©2020 Borrell Associates Inc. All Rights Reserved 24
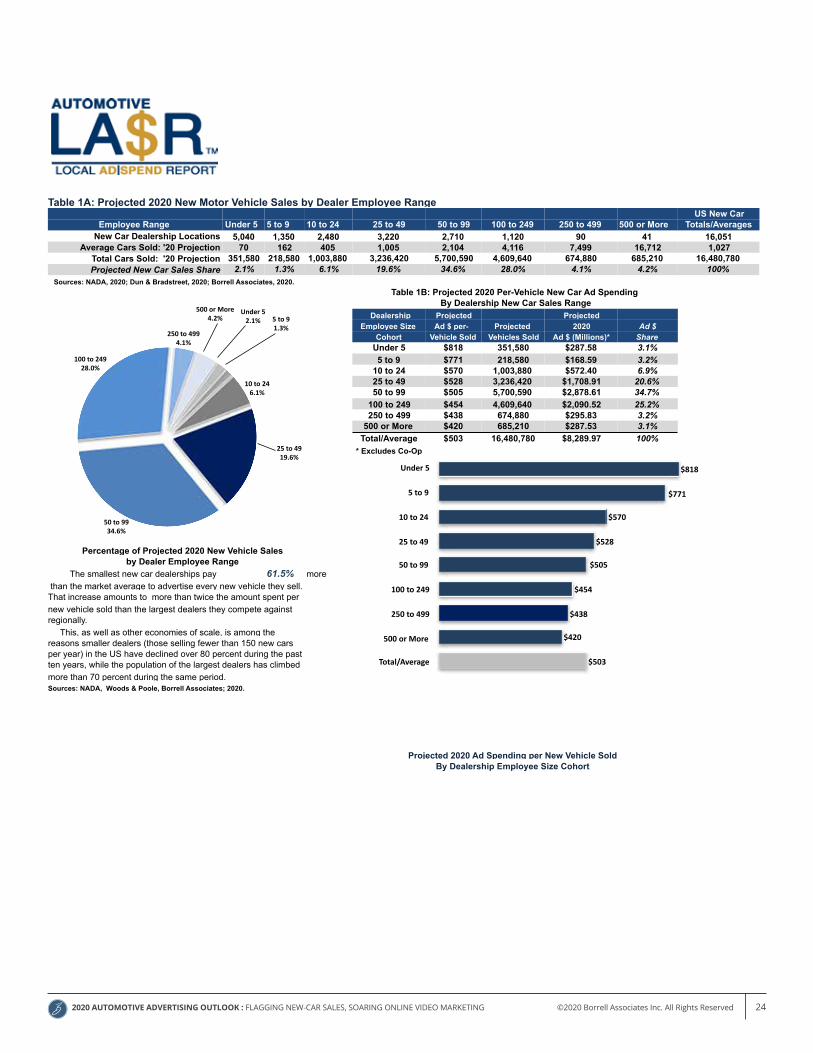
Table 1A: Projected 2020 New Motor Vehicle Sales by Dealer Employee RangeUS New Car
Employee Range Under 5 5 to 9 10 to 24 25 to 49 50 to 99 100 to 249 250 to 499 500 or More Totals/AveragesNew Car Dealership Locations 5,040 1,350 2,480 3,220 2,710 1,120 90 41 16,051
Average Cars Sold: '20 Projection 70 162 405 1,005 2,104 4,116 7,499 16,712 1,027Total Cars Sold: '20 Projection 351,580 218,580 1,003,880 3,236,420 5,700,590 4,609,640 674,880 685,210 16,480,780Projected New Car Sales Share 2.1% 1.3% 6.1% 19.6% 34.6% 28.0% 4.1% 4.2% 100%
Sources: NADA, 2020; Dun & Bradstreet, 2020; Borrell Associates, 2020.Table 1B: Projected 2020 Per-Vehicle New Car Ad Spending
By Dealership New Car Sales Range Dealership Projected Projected
Employee Size Ad $ per- Projected 2020 Ad $Cohort Vehicle Sold Vehicles Sold Ad $ (Millions)* Share
Under 5 $818 351,580 $287.58 3.1%5 to 9 $771 218,580 $168.59 3.2%
10 to 24 $570 1,003,880 $572.40 6.9%25 to 49 $528 3,236,420 $1,708.91 20.6%50 to 99 $505 5,700,590 $2,878.61 34.7%
100 to 249 $454 4,609,640 $2,090.52 25.2%250 to 499 $438 674,880 $295.83 3.2%
500 or More $420 685,210 $287.53 3.1%Total/Average $503 16,480,780 $8,289.97 100%
* Excludes Co-Op
Percentage of Projected 2020 New Vehicle Sales by Dealer Employee Range
The smallest new car dealerships pay 61.5% more than the market average to advertise every new vehicle they sell.That increase amounts to more than twice the amount spent per new vehicle sold than the largest dealers they compete againstregionally. 0.614914425427873 This, as well as other economies of scale, is among thereasons smaller dealers (those selling fewer than 150 new carsper year) in the US have declined over 80 percent during the pastten years, while the population of the largest dealers has climbedmore than 70 percent during the same period.Sources: NADA, Woods & Poole, Borrell Associates; 2020.
Projected 2020 Ad Spending per New Vehicle SoldBy Dealership Employee Size Cohort
© 2020, Borrell Associates Inc. All rights reserved.
Under5
5to9
10to24
25to49
50to99
100to249
250to499
500orMore
Total/Average $503
$420
$438
$454
$505
$528
$570
$771
$818
Page of 1 1
Market-level Auto Ad Spending Estimates
Market: Total US
Drawn From 2020 Data
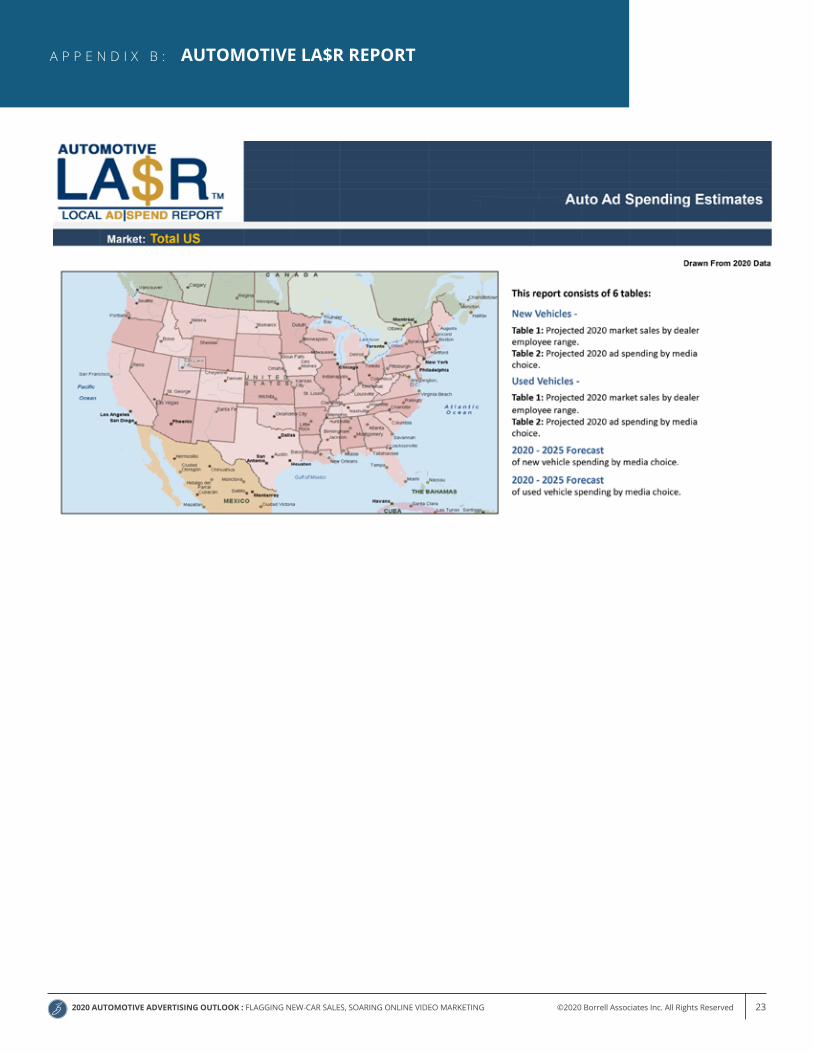
Thisreportconsistsof6tables:
NewVehicles-Table1:Projected2020marketsalesbydealeremployeerange.Table2:Projected2020adspendingbymediachoice.
UsedVehicles-Table1:Projected2020marketsalesbydealeremployeerange.Table2:Projected2020adspendingbymediachoice.
2020-2025Forecastofnewvehiclespendingbymediachoice.
2020-2025Forecastofusedvehiclespendingbymediachoice.
Borrell'stableareportusesdatafromNADA,Scarborough,Woods&Poole,NIADA,MannheimAuctions,Dun&Bradstreet,andtheU.S.BureauofTransportationStatisticstocreateanassessmentofnewandusedvehiclepurchasingandassociatedadspendingatthemarketlevel.Forbestresults,printthisreportusingacolorprinter.Forfurtherinformationabouttheestimates,projections,andforecastsinthisreport,contactBorrellAssociatesat757/221-6641,[email protected].
1
100 to 24928.0%
250 to 4994.1%
500 or More4.2%
Under 52.1% 5 to 9
1.3%
10 to 246.1%
25 to 4919.6%
50 to 9934.6%
2020 AUTOMOTIVE ADVERTISING OUTLOOK : FLAGGING NEW-CAR SALES, SOARING ONLINE VIDEO MARKETING ©2020 Borrell Associates Inc. All Rights Reserved 25
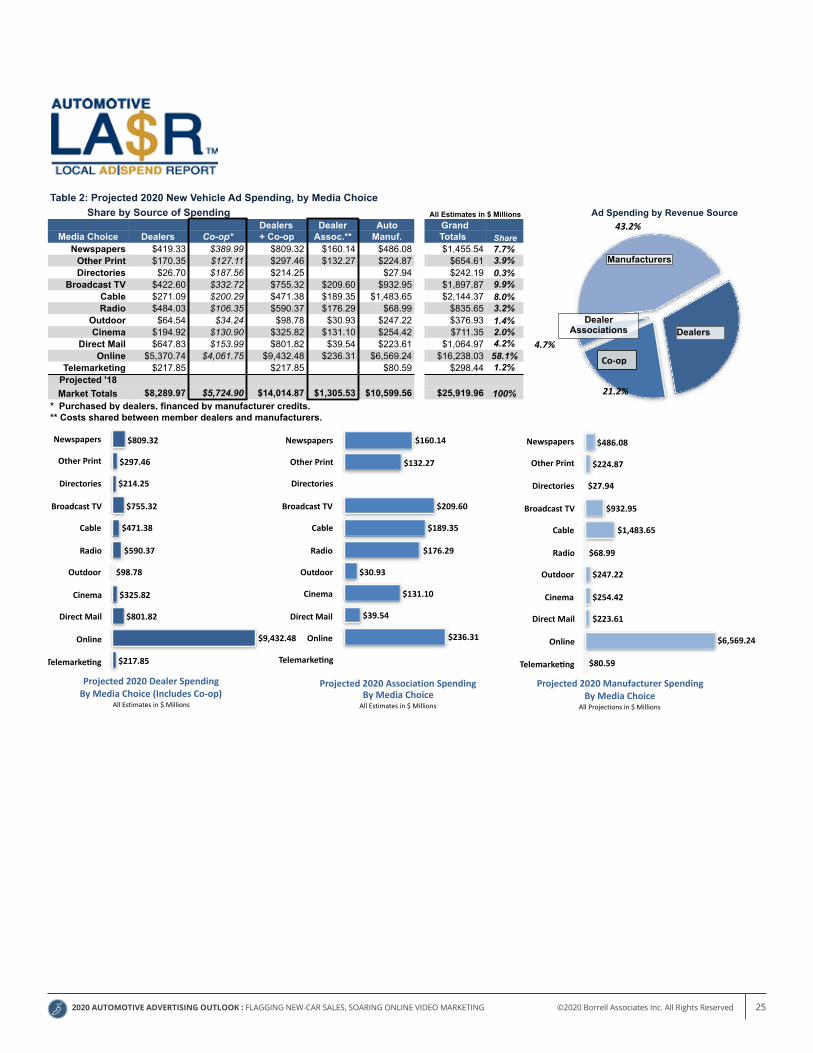
Table 2: Projected 2020 New Vehicle Ad Spending, by Media Choice Share by Source of Spending All Estimates in $ Millions Ad Spending by Revenue Source
Dealers Dealer Auto Grand $8,454.78Media Choice Dealers Co-op* + Co-op Assoc.** Manuf. Totals Share $5,829.40
Newspapers $419.33 $389.99 $809.32 $160.14 $486.08 $1,455.54 7.7% $1,291.68Other Print $170.35 $127.11 $297.46 $132.27 $224.87 $654.61 3.9% $11,868.39Directories $26.70 $187.56 $214.25 $27.94 $242.19 0.3%
Broadcast TV $422.60 $332.72 $755.32 $209.60 $932.95 $1,897.87 9.9%Cable $271.09 $200.29 $471.38 $189.35 $1,483.65 $2,144.37 8.0%Radio $484.03 $106.35 $590.37 $176.29 $68.99 $835.65 3.2%
Outdoor $64.54 $34.24 $98.78 $30.93 $247.22 $376.93 1.4%Cinema $194.92 $130.90 $325.82 $131.10 $254.42 $711.35 2.0%
Direct Mail $647.83 $153.99 $801.82 $39.54 $223.61 $1,064.97 4.2%Online $5,370.74 $4,061.75 $9,432.48 $236.31 $6,569.24 $16,238.03 58.1%
Telemarketing $217.85 $217.85 $80.59 $298.44 1.2%Projected '18Market Totals $8,289.97 $5,724.90 $14,014.87 $1,305.53 $10,599.56 $25,919.96 100%
* Purchased by dealers, financed by manufacturer credits.** Costs shared between member dealers and manufacturers.
© 2020, Borrell Associates Inc. All rights reserved.
43.2%
4.7%
21.2%30.8%
Dealer Associations
Manufacturers
Dealers
Newspapers
OtherPrint
Directories
BroadcastTV
Cable
Radio
Outdoor
Cinema
DirectMail
Online
Telemarke>ng $217.85
$9,432.48
$801.82
$325.82
$98.78
$590.37
$471.38
$755.32
$214.25
$297.46
$809.32 Newspapers
OtherPrint
Directories
BroadcastTV
Cable
Radio
Outdoor
Cinema
DirectMail
Online
Telemarke>ng
$236.31
$39.54
$131.10
$30.93
$176.29
$189.35
$209.60
$132.27
$160.14 Newspapers
OtherPrint
Directories
BroadcastTV
Cable
Radio
Outdoor
Cinema
DirectMail
Online
Telemarke>ng $80.59
$6,569.24
$223.61
$254.42
$247.22
$68.99
$1,483.65
$932.95
$27.94
$224.87
$486.08
Projected2020DealerSpendingByMediaChoice(IncludesCo-op)
AllEstimatesin$Millions
Projected2020AssociationSpendingByMediaChoiceAllEstimatesin$Millions
Projected2020ManufacturerSpendingByMediaChoice
AllProjectionsin$Millions
Co-op
Page of 1 1
Market-level Auto Ad Spending Estimates
Market: Total US
Drawn From 2020 Data
Thisreportconsistsof6tables:
NewVehicles-Table1:Projected2020marketsalesbydealeremployeerange.Table2:Projected2020adspendingbymediachoice.
UsedVehicles-Table1:Projected2020marketsalesbydealeremployeerange.Table2:Projected2020adspendingbymediachoice.
2020-2025Forecastofnewvehiclespendingbymediachoice.
2020-2025Forecastofusedvehiclespendingbymediachoice.
Borrell'stableareportusesdatafromNADA,Scarborough,Woods&Poole,NIADA,MannheimAuctions,Dun&Bradstreet,andtheU.S.BureauofTransportationStatisticstocreateanassessmentofnewandusedvehiclepurchasingandassociatedadspendingatthemarketlevel.Forbestresults,printthisreportusingacolorprinter.Forfurtherinformationabouttheestimates,projections,andforecastsinthisreport,contactBorrellAssociatesat757/221-6641,[email protected].
1
2020 AUTOMOTIVE ADVERTISING OUTLOOK : FLAGGING NEW-CAR SALES, SOARING ONLINE VIDEO MARKETING ©2020 Borrell Associates Inc. All Rights Reserved 26
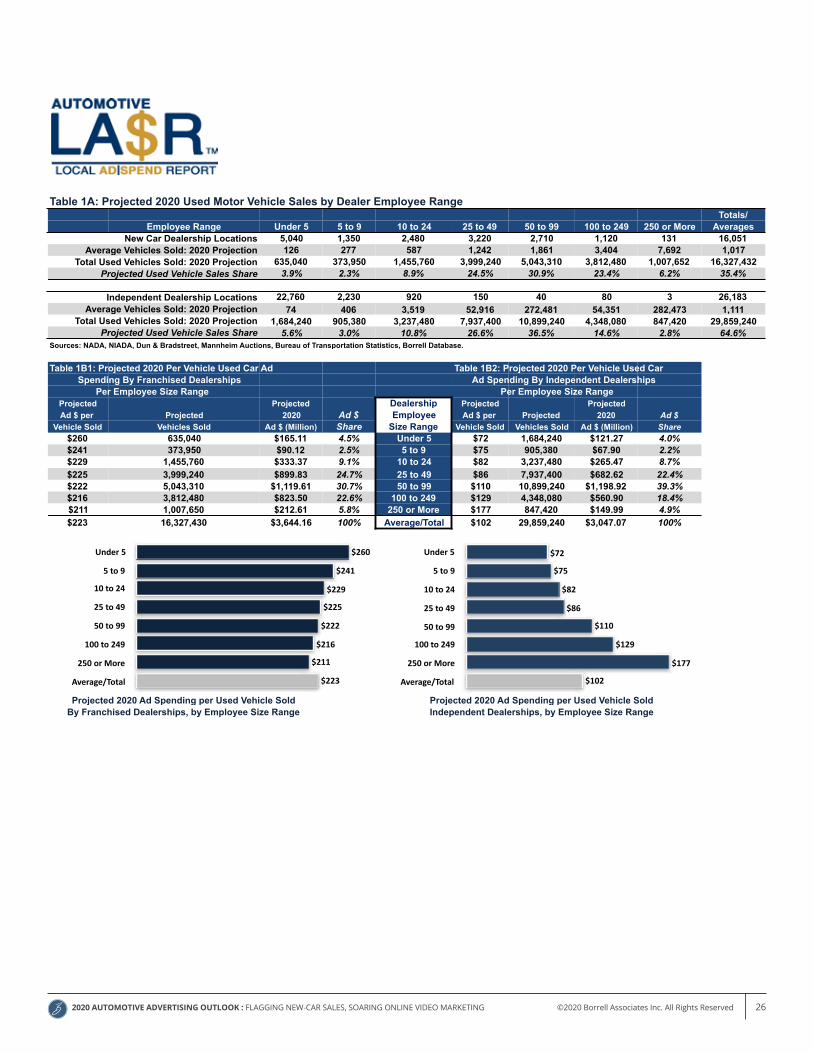
Table 1A: Projected 2020 Used Motor Vehicle Sales by Dealer Employee RangeTotals/
Employee Range Under 5 5 to 9 10 to 24 25 to 49 50 to 99 100 to 249 250 or More AveragesNew Car Dealership Locations 5,040 1,350 2,480 3,220 2,710 1,120 131 16,051
Average Vehicles Sold: 2020 Projection 126 277 587 1,242 1,861 3,404 7,692 1,017Total Used Vehicles Sold: 2020 Projection 635,040 373,950 1,455,760 3,999,240 5,043,310 3,812,480 1,007,652 16,327,432
Projected Used Vehicle Sales Share 3.9% 2.3% 8.9% 24.5% 30.9% 23.4% 6.2% 35.4%
Independent Dealership Locations 22,760 2,230 920 150 40 80 3 26,183Average Vehicles Sold: 2020 Projection 74 406 3,519 52,916 272,481 54,351 282,473 1,111
Total Used Vehicles Sold: 2020 Projection 1,684,240 905,380 3,237,480 7,937,400 10,899,240 4,348,080 847,420 29,859,240Projected Used Vehicle Sales Share 5.6% 3.0% 10.8% 26.6% 36.5% 14.6% 2.8% 64.6%
Sources: NADA, NIADA, Dun & Bradstreet, Mannheim Auctions, Bureau of Transportation Statistics, Borrell Database.
Table 1B1: Projected 2020 Per Vehicle Used Car Ad Table 1B2: Projected 2020 Per Vehicle Used Car Spending By Franchised Dealerships Ad Spending By Independent Dealerships
Per Employee Size Range Per Employee Size RangeProjected Projected Dealership Projected ProjectedAd $ per Projected 2020 Ad $ Employee Ad $ per Projected 2020 Ad $
Vehicle Sold Vehicles Sold Ad $ (Million) Share Size Range Vehicle Sold Vehicles Sold Ad $ (Million) Share$260 635,040 $165.11 4.5% Under 5 $72 1,684,240 $121.27 4.0%$241 373,950 $90.12 2.5% 5 to 9 $75 905,380 $67.90 2.2%$229 1,455,760 $333.37 9.1% 10 to 24 $82 3,237,480 $265.47 8.7%$225 3,999,240 $899.83 24.7% 25 to 49 $86 7,937,400 $682.62 22.4%$222 5,043,310 $1,119.61 30.7% 50 to 99 $110 10,899,240 $1,198.92 39.3%$216 3,812,480 $823.50 22.6% 100 to 249 $129 4,348,080 $560.90 18.4%$211 1,007,650 $212.61 5.8% 250 or More $177 847,420 $149.99 4.9%$223 16,327,430 $3,644.16 100% Average/Total $102 29,859,240 $3,047.07 100%
Projected 2020 Ad Spending per Used Vehicle Sold Projected 2020 Ad Spending per Used Vehicle SoldBy Franchised Dealerships, by Employee Size Range Independent Dealerships, by Employee Size Range
© 2020, Borrell Associates Inc. All rights reserved.
Under5
5to9
10to24
25to49
50to99
100to249
250orMore
Average/Total $102
$177
$129
$110
$86
$82
$75
$72Under5
5to9
10to24
25to49
50to99
100to249
250orMore
Average/Total $223
$211
$216
$222
$225
$229
$241
$260
Page of 1 1
Market-level Auto Ad Spending Estimates
Market: Total US
Drawn From 2020 Data
Thisreportconsistsof6tables:
NewVehicles-Table1:Projected2020marketsalesbydealeremployeerange.Table2:Projected2020adspendingbymediachoice.
UsedVehicles-Table1:Projected2020marketsalesbydealeremployeerange.Table2:Projected2020adspendingbymediachoice.
2020-2025Forecastofnewvehiclespendingbymediachoice.
2020-2025Forecastofusedvehiclespendingbymediachoice.
Borrell'stableareportusesdatafromNADA,Scarborough,Woods&Poole,NIADA,MannheimAuctions,Dun&Bradstreet,andtheU.S.BureauofTransportationStatisticstocreateanassessmentofnewandusedvehiclepurchasingandassociatedadspendingatthemarketlevel.Forbestresults,printthisreportusingacolorprinter.Forfurtherinformationabouttheestimates,projections,andforecastsinthisreport,contactBorrellAssociatesat757/221-6641,[email protected].
1
2020 AUTOMOTIVE ADVERTISING OUTLOOK : FLAGGING NEW-CAR SALES, SOARING ONLINE VIDEO MARKETING ©2020 Borrell Associates Inc. All Rights Reserved 27
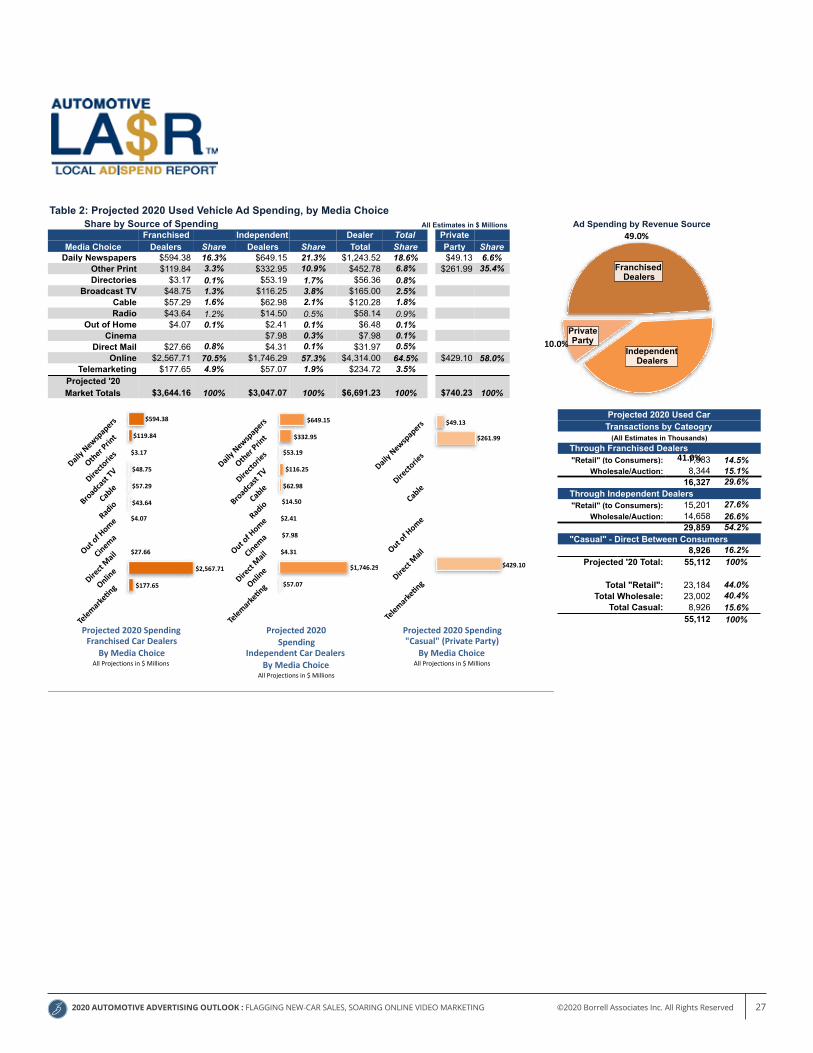
Table 2: Projected 2020 Used Vehicle Ad Spending, by Media Choice Share by Source of Spending All Estimates in $ Millions Ad Spending by Revenue Source
Franchised Independent Dealer Total Private$3,644.16
Media Choice Dealers Share Dealers Share Total Share Party Share$3,047.07
Daily Newspapers $594.38 16.3% $649.15 21.3% $1,243.52 18.6% $49.13 6.6%$740.23
Other Print $119.84 3.3% $332.95 10.9% $452.78 6.8% $261.99 35.4%Directories $3.17 0.1% $53.19 1.7% $56.36 0.8%
Broadcast TV $48.75 1.3% $116.25 3.8% $165.00 2.5%Cable $57.29 1.6% $62.98 2.1% $120.28 1.8%Radio $43.64 1.2% $14.50 0.5% $58.14 0.9%
Out of Home $4.07 0.1% $2.41 0.1% $6.48 0.1%Cinema $7.98 0.3% $7.98 0.1%
Direct Mail $27.66 0.8% $4.31 0.1% $31.97 0.5%Online $2,567.71 70.5% $1,746.29 57.3% $4,314.00 64.5% $429.10 58.0%
Telemarketing $177.65 4.9% $57.07 1.9% $234.72 3.5%Projected '20Market Totals $3,644.16 100% $3,047.07 100% $6,691.23 100% $740.23 100%
Projected 2020 Used CarTransactions by Cateogry
(All Estimates in Thousands) Through Franchised Dealers
"Retail" (to Consumers): 7,983 14.5%Wholesale/Auction: 8,344 15.1%
16,327 29.6% Through Independent Dealers
"Retail" (to Consumers): 15,201 27.6%Wholesale/Auction: 14,658 26.6%
29,859 54.2% "Casual" - Direct Between Consumers
8,926 16.2%Projected '20 Total: 55,112 100%
Total "Retail": 23,184 44.0%Total Wholesale: 23,002 40.4%
Total Casual: 8,926 15.6%55,112 100%
© 2020, Borrell Associates Inc. All rights reserved.
10.0%
41.0%
49.0%
Franchised Dealers
Private Party
DailyNe
wspa
pers
Othe
rPrin
t
Director
ies
Broa
dcast
TV
Cable
Radio
Outo
fHom
e
Cinem
a
DirectM
ail
Onlin
e
Telem
arkeA
ng$177.65
$2,567.71
$27.66
$4.07
$43.64
$57.29
$48.75
$3.17
$119.84
$594.38
DailyNe
wspa
pers
Othe
rPrin
t
Director
ies
Broa
dcast
TV
Cable
Radio
Outo
fHom
e
Cinem
a
DirectM
ail
Onlin
e
Telem
arkeA
ng$57.07
$1,746.29
$4.31
$7.98
$2.41
$14.50
$62.98
$116.25
$53.19
$332.95
$649.15
Independent Dealers
DailyNe
wspa
pers
Director
ies
Cable
Outo
fHom
e
DirectM
ail
Telem
arkeA
ng
$429.10
$261.99
$49.13
Projected2020SpendingFranchisedCarDealers
ByMediaChoiceAllProjectionsin$Millions
Projected2020Spending"Casual"(PrivateParty)
ByMediaChoiceAllProjectionsin$Millions
Projected2020Spending
IndependentCarDealersByMediaChoice
AllProjectionsin$Millions
Page of 1 1
Market-level Auto Ad Spending Estimates
Market: Total US
Drawn From 2020 Data
Thisreportconsistsof6tables:
NewVehicles-Table1:Projected2020marketsalesbydealeremployeerange.Table2:Projected2020adspendingbymediachoice.
UsedVehicles-Table1:Projected2020marketsalesbydealeremployeerange.Table2:Projected2020adspendingbymediachoice.
2020-2025Forecastofnewvehiclespendingbymediachoice.
2020-2025Forecastofusedvehiclespendingbymediachoice.
Borrell'stableareportusesdatafromNADA,Scarborough,Woods&Poole,NIADA,MannheimAuctions,Dun&Bradstreet,andtheU.S.BureauofTransportationStatisticstocreateanassessmentofnewandusedvehiclepurchasingandassociatedadspendingatthemarketlevel.Forbestresults,printthisreportusingacolorprinter.Forfurtherinformationabouttheestimates,projections,andforecastsinthisreport,contactBorrellAssociatesat757/221-6641,[email protected].
1
2020 AUTOMOTIVE ADVERTISING OUTLOOK : FLAGGING NEW-CAR SALES, SOARING ONLINE VIDEO MARKETING ©2020 Borrell Associates Inc. All Rights Reserved 28
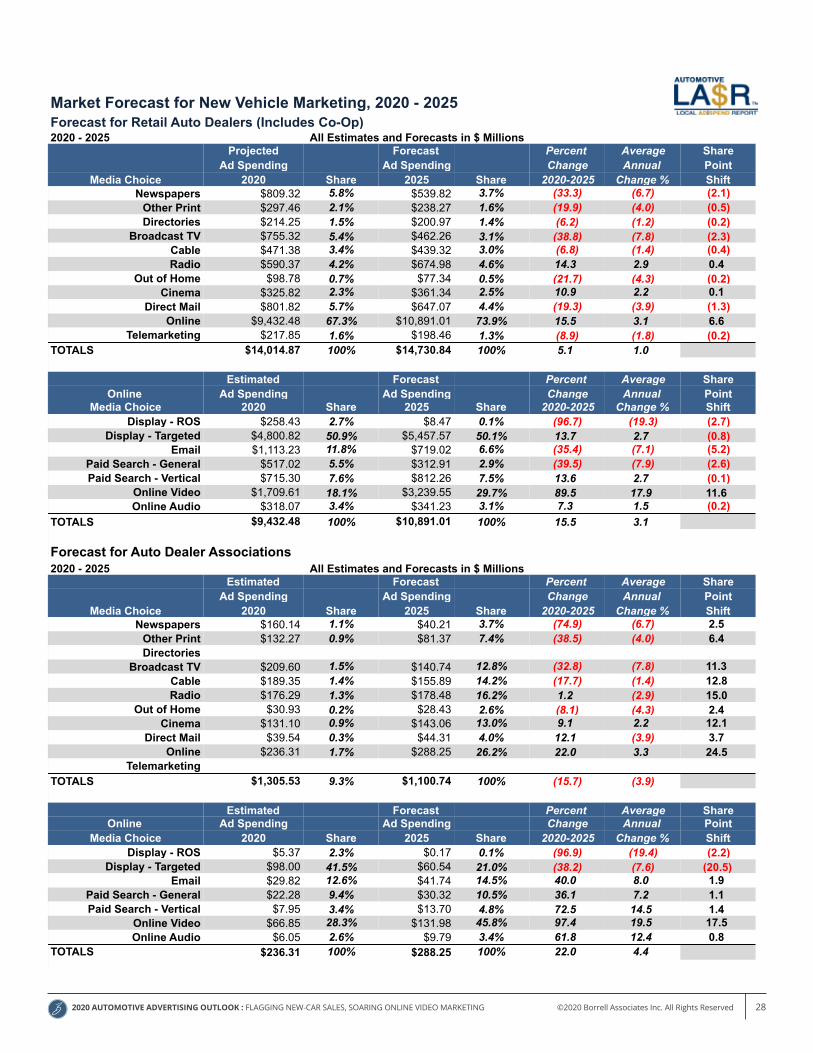
Market Forecast for New Vehicle Marketing, 2020 - 2025Forecast for Retail Auto Dealers (Includes Co-Op)2020 - 2025 All Estimates and Forecasts in $ Millions
Projected Forecast Percent Average ShareAd Spending Ad Spending Change Annual Point
Media Choice 2020 Share 2025 Share 2020-2025 Change % ShiftNewspapers $809.32 5.8% $539.82 3.7% (33.3) (6.7) (2.1)
Other Print $297.46 2.1% $238.27 1.6% (19.9) (4.0) (0.5)Directories $214.25 1.5% $200.97 1.4% (6.2) (1.2) (0.2)
Broadcast TV $755.32 5.4% $462.26 3.1% (38.8) (7.8) (2.3)Cable $471.38 3.4% $439.32 3.0% (6.8) (1.4) (0.4)Radio $590.37 4.2% $674.98 4.6% 14.3 2.9 0.4
Out of Home $98.78 0.7% $77.34 0.5% (21.7) (4.3) (0.2)Cinema $325.82 2.3% $361.34 2.5% 10.9 2.2 0.1
Direct Mail $801.82 5.7% $647.07 4.4% (19.3) (3.9) (1.3)Online $9,432.48 67.3% $10,891.01 73.9% 15.5 3.1 6.6
Telemarketing $217.85 1.6% $198.46 1.3% (8.9) (1.8) (0.2)TOTALS $14,014.87 100% $14,730.84 100% 5.1 1.0
Estimated Forecast Percent Average ShareOnline Ad Spending Ad Spending Change Annual Point
Media Choice 2020 Share 2025 Share 2020-2025 Change % ShiftDisplay - ROS $258.43 2.7% $8.47 0.1% (96.7) (19.3) (2.7)
Display - Targeted $4,800.82 50.9% $5,457.57 50.1% 13.7 2.7 (0.8)Email $1,113.23 11.8% $719.02 6.6% (35.4) (7.1) (5.2)
Paid Search - General $517.02 5.5% $312.91 2.9% (39.5) (7.9) (2.6)Paid Search - Vertical $715.30 7.6% $812.26 7.5% 13.6 2.7 (0.1)
Online Video $1,709.61 18.1% $3,239.55 29.7% 89.5 17.9 11.6 Online Audio $318.07 3.4% $341.23 3.1% 7.3 1.5 (0.2)
TOTALS $9,432.48 100% $10,891.01 100% 15.5 3.1
Forecast for Auto Dealer Associations2020 - 2025 All Estimates and Forecasts in $ Millions
Estimated Forecast Percent Average ShareAd Spending Ad Spending Change Annual Point
Media Choice 2020 Share 2025 Share 2020-2025 Change % ShiftNewspapers $160.14 1.1% $40.21 3.7% (74.9) (6.7) 2.5
Other Print $132.27 0.9% $81.37 7.4% (38.5) (4.0) 6.4 Directories
Broadcast TV $209.60 1.5% $140.74 12.8% (32.8) (7.8) 11.3 Cable $189.35 1.4% $155.89 14.2% (17.7) (1.4) 12.8 Radio $176.29 1.3% $178.48 16.2% 1.2 (2.9) 15.0
Out of Home $30.93 0.2% $28.43 2.6% (8.1) (4.3) 2.4 Cinema $131.10 0.9% $143.06 13.0% 9.1 2.2 12.1
Direct Mail $39.54 0.3% $44.31 4.0% 12.1 (3.9) 3.7 Online $236.31 1.7% $288.25 26.2% 22.0 3.3 24.5
TelemarketingTOTALS $1,305.53 9.3% $1,100.74 100% (15.7) (3.9)
Estimated Forecast Percent Average ShareOnline Ad Spending Ad Spending Change Annual Point
Media Choice 2020 Share 2025 Share 2020-2025 Change % ShiftDisplay - ROS $5.37 2.3% $0.17 0.1% (96.9) (19.4) (2.2)
Display - Targeted $98.00 41.5% $60.54 21.0% (38.2) (7.6) (20.5)Email $29.82 12.6% $41.74 14.5% 40.0 8.0 1.9
Paid Search - General $22.28 9.4% $30.32 10.5% 36.1 7.2 1.1 Paid Search - Vertical $7.95 3.4% $13.70 4.8% 72.5 14.5 1.4
Online Video $66.85 28.3% $131.98 45.8% 97.4 19.5 17.5 Online Audio $6.05 2.6% $9.79 3.4% 61.8 12.4 0.8
TOTALS $236.31 100% $288.25 100% 22.0 4.4
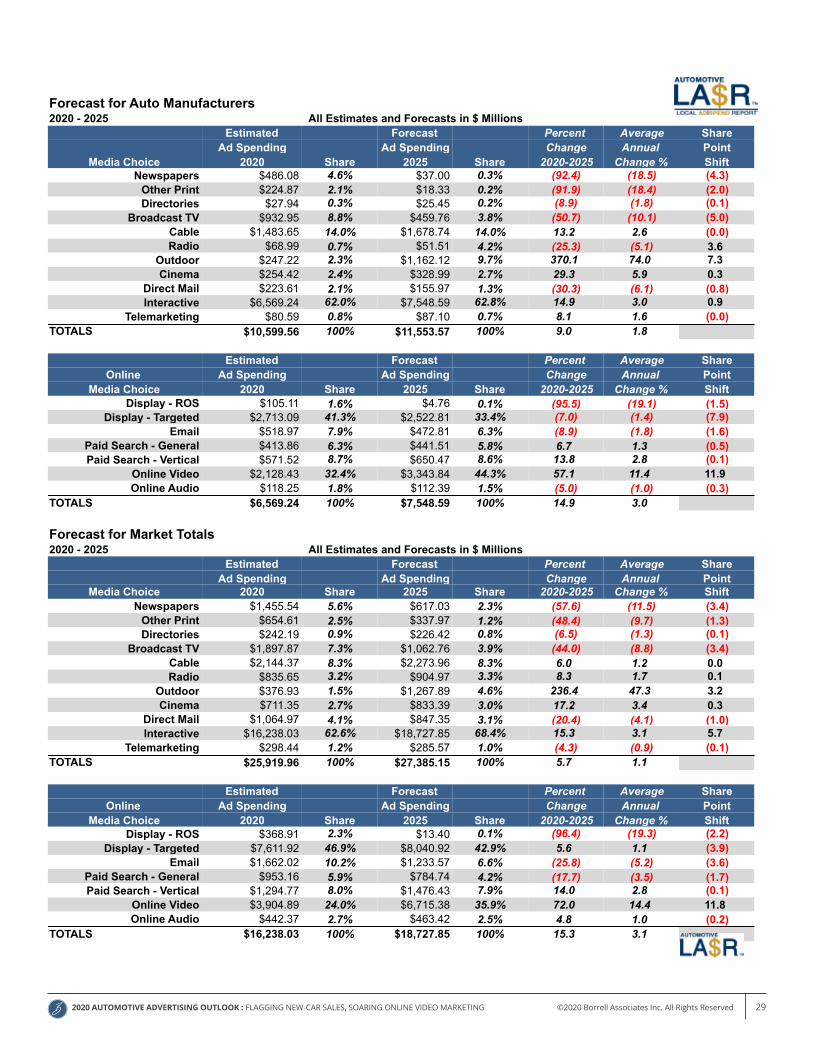
Forecast for Auto Manufacturers2020 - 2025 All Estimates and Forecasts in $ Millions
Estimated Forecast Percent Average ShareAd Spending Ad Spending Change Annual Point
Media Choice 2020 Share 2025 Share 2020-2025 Change % ShiftNewspapers $486.08 4.6% $37.00 0.3% (92.4) (18.5) (4.3)
Other Print $224.87 2.1% $18.33 0.2% (91.9) (18.4) (2.0)
Page of 1 4
Market-level Auto Ad Spending Estimates
Market: Total US
Drawn From 2020 Data
Thisreportconsistsof6tables:
NewVehicles-Table1:Projected2020marketsalesbydealeremployeerange.Table2:Projected2020adspendingbymediachoice.
UsedVehicles-Table1:Projected2020marketsalesbydealeremployeerange.Table2:Projected2020adspendingbymediachoice.
2020-2025Forecastofnewvehiclespendingbymediachoice.
2020-2025Forecastofusedvehiclespendingbymediachoice.
Borrell'stableareportusesdatafromNADA,Scarborough,Woods&Poole,NIADA,MannheimAuctions,Dun&Bradstreet,andtheU.S.BureauofTransportationStatisticstocreateanassessmentofnewandusedvehiclepurchasingandassociatedadspendingatthemarketlevel.Forbestresults,printthisreportusingacolorprinter.Forfurtherinformationabouttheestimates,projections,andforecastsinthisreport,contactBorrellAssociatesat757/221-6641,[email protected].
1
2020 AUTOMOTIVE ADVERTISING OUTLOOK : FLAGGING NEW-CAR SALES, SOARING ONLINE VIDEO MARKETING ©2020 Borrell Associates Inc. All Rights Reserved 29
Market Forecast for New Vehicle Marketing, 2020 - 2025Forecast for Retail Auto Dealers (Includes Co-Op)2020 - 2025 All Estimates and Forecasts in $ Millions
Projected Forecast Percent Average ShareAd Spending Ad Spending Change Annual Point
Media Choice 2020 Share 2025 Share 2020-2025 Change % ShiftNewspapers $809.32 5.8% $539.82 3.7% (33.3) (6.7) (2.1)
Other Print $297.46 2.1% $238.27 1.6% (19.9) (4.0) (0.5)Directories $214.25 1.5% $200.97 1.4% (6.2) (1.2) (0.2)
Broadcast TV $755.32 5.4% $462.26 3.1% (38.8) (7.8) (2.3)Cable $471.38 3.4% $439.32 3.0% (6.8) (1.4) (0.4)Radio $590.37 4.2% $674.98 4.6% 14.3 2.9 0.4
Out of Home $98.78 0.7% $77.34 0.5% (21.7) (4.3) (0.2)Cinema $325.82 2.3% $361.34 2.5% 10.9 2.2 0.1
Direct Mail $801.82 5.7% $647.07 4.4% (19.3) (3.9) (1.3)Online $9,432.48 67.3% $10,891.01 73.9% 15.5 3.1 6.6
Telemarketing $217.85 1.6% $198.46 1.3% (8.9) (1.8) (0.2)TOTALS $14,014.87 100% $14,730.84 100% 5.1 1.0
Estimated Forecast Percent Average ShareOnline Ad Spending Ad Spending Change Annual Point
Media Choice 2020 Share 2025 Share 2020-2025 Change % ShiftDisplay - ROS $258.43 2.7% $8.47 0.1% (96.7) (19.3) (2.7)
Display - Targeted $4,800.82 50.9% $5,457.57 50.1% 13.7 2.7 (0.8)Email $1,113.23 11.8% $719.02 6.6% (35.4) (7.1) (5.2)
Paid Search - General $517.02 5.5% $312.91 2.9% (39.5) (7.9) (2.6)Paid Search - Vertical $715.30 7.6% $812.26 7.5% 13.6 2.7 (0.1)
Online Video $1,709.61 18.1% $3,239.55 29.7% 89.5 17.9 11.6 Online Audio $318.07 3.4% $341.23 3.1% 7.3 1.5 (0.2)
TOTALS $9,432.48 100% $10,891.01 100% 15.5 3.1
Forecast for Auto Dealer Associations2020 - 2025 All Estimates and Forecasts in $ Millions
Estimated Forecast Percent Average ShareAd Spending Ad Spending Change Annual Point
Media Choice 2020 Share 2025 Share 2020-2025 Change % ShiftNewspapers $160.14 1.1% $40.21 3.7% (74.9) (6.7) 2.5
Other Print $132.27 0.9% $81.37 7.4% (38.5) (4.0) 6.4 Directories
Broadcast TV $209.60 1.5% $140.74 12.8% (32.8) (7.8) 11.3 Cable $189.35 1.4% $155.89 14.2% (17.7) (1.4) 12.8 Radio $176.29 1.3% $178.48 16.2% 1.2 (2.9) 15.0
Out of Home $30.93 0.2% $28.43 2.6% (8.1) (4.3) 2.4 Cinema $131.10 0.9% $143.06 13.0% 9.1 2.2 12.1
Direct Mail $39.54 0.3% $44.31 4.0% 12.1 (3.9) 3.7 Online $236.31 1.7% $288.25 26.2% 22.0 3.3 24.5
TelemarketingTOTALS $1,305.53 9.3% $1,100.74 100% (15.7) (3.9)
Estimated Forecast Percent Average ShareOnline Ad Spending Ad Spending Change Annual Point
Media Choice 2020 Share 2025 Share 2020-2025 Change % ShiftDisplay - ROS $5.37 2.3% $0.17 0.1% (96.9) (19.4) (2.2)
Display - Targeted $98.00 41.5% $60.54 21.0% (38.2) (7.6) (20.5)Email $29.82 12.6% $41.74 14.5% 40.0 8.0 1.9
Paid Search - General $22.28 9.4% $30.32 10.5% 36.1 7.2 1.1 Paid Search - Vertical $7.95 3.4% $13.70 4.8% 72.5 14.5 1.4
Online Video $66.85 28.3% $131.98 45.8% 97.4 19.5 17.5 Online Audio $6.05 2.6% $9.79 3.4% 61.8 12.4 0.8
TOTALS $236.31 100% $288.25 100% 22.0 4.4
Forecast for Auto Manufacturers2020 - 2025 All Estimates and Forecasts in $ Millions
Estimated Forecast Percent Average ShareAd Spending Ad Spending Change Annual Point
Media Choice 2020 Share 2025 Share 2020-2025 Change % ShiftNewspapers $486.08 4.6% $37.00 0.3% (92.4) (18.5) (4.3)
Other Print $224.87 2.1% $18.33 0.2% (91.9) (18.4) (2.0)
Page of 1 4Directories $27.94 0.3% $25.45 0.2% (8.9) (1.8) (0.1)
Broadcast TV $932.95 8.8% $459.76 3.8% (50.7) (10.1) (5.0)Cable $1,483.65 14.0% $1,678.74 14.0% 13.2 2.6 (0.0)Radio $68.99 0.7% $51.51 4.2% (25.3) (5.1) 3.6
Outdoor $247.22 2.3% $1,162.12 9.7% 370.1 74.0 7.3 Cinema $254.42 2.4% $328.99 2.7% 29.3 5.9 0.3
Direct Mail $223.61 2.1% $155.97 1.3% (30.3) (6.1) (0.8)Interactive $6,569.24 62.0% $7,548.59 62.8% 14.9 3.0 0.9
Telemarketing $80.59 0.8% $87.10 0.7% 8.1 1.6 (0.0)TOTALS $10,599.56 100% $11,553.57 100% 9.0 1.8
Estimated Forecast Percent Average ShareOnline Ad Spending Ad Spending Change Annual Point
Media Choice 2020 Share 2025 Share 2020-2025 Change % ShiftDisplay - ROS $105.11 1.6% $4.76 0.1% (95.5) (19.1) (1.5)
Display - Targeted $2,713.09 41.3% $2,522.81 33.4% (7.0) (1.4) (7.9)Email $518.97 7.9% $472.81 6.3% (8.9) (1.8) (1.6)
Paid Search - General $413.86 6.3% $441.51 5.8% 6.7 1.3 (0.5)Paid Search - Vertical $571.52 8.7% $650.47 8.6% 13.8 2.8 (0.1)
Online Video $2,128.43 32.4% $3,343.84 44.3% 57.1 11.4 11.9 Online Audio $118.25 1.8% $112.39 1.5% (5.0) (1.0) (0.3)
TOTALS $6,569.24 100% $7,548.59 100% 14.9 3.0
Forecast for Market Totals2020 - 2025 All Estimates and Forecasts in $ Millions
Estimated Forecast Percent Average ShareAd Spending Ad Spending Change Annual Point
Media Choice 2020 Share 2025 Share 2020-2025 Change % ShiftNewspapers $1,455.54 5.6% $617.03 2.3% (57.6) (11.5) (3.4)
Other Print $654.61 2.5% $337.97 1.2% (48.4) (9.7) (1.3)Directories $242.19 0.9% $226.42 0.8% (6.5) (1.3) (0.1)
Broadcast TV $1,897.87 7.3% $1,062.76 3.9% (44.0) (8.8) (3.4)Cable $2,144.37 8.3% $2,273.96 8.3% 6.0 1.2 0.0 Radio $835.65 3.2% $904.97 3.3% 8.3 1.7 0.1
Outdoor $376.93 1.5% $1,267.89 4.6% 236.4 47.3 3.2 Cinema $711.35 2.7% $833.39 3.0% 17.2 3.4 0.3
Direct Mail $1,064.97 4.1% $847.35 3.1% (20.4) (4.1) (1.0)Interactive $16,238.03 62.6% $18,727.85 68.4% 15.3 3.1 5.7
Telemarketing $298.44 1.2% $285.57 1.0% (4.3) (0.9) (0.1)TOTALS $25,919.96 100% $27,385.15 100% 5.7 1.1
Estimated Forecast Percent Average ShareOnline Ad Spending Ad Spending Change Annual Point
Media Choice 2020 Share 2025 Share 2020-2025 Change % ShiftDisplay - ROS $368.91 2.3% $13.40 0.1% (96.4) (19.3) (2.2)
Display - Targeted $7,611.92 46.9% $8,040.92 42.9% 5.6 1.1 (3.9)Email $1,662.02 10.2% $1,233.57 6.6% (25.8) (5.2) (3.6)
Paid Search - General $953.16 5.9% $784.74 4.2% (17.7) (3.5) (1.7)Paid Search - Vertical $1,294.77 8.0% $1,476.43 7.9% 14.0 2.8 (0.1)
Online Video $3,904.89 24.0% $6,715.38 35.9% 72.0 14.4 11.8 Online Audio $442.37 2.7% $463.42 2.5% 4.8 1.0 (0.2)
TOTALS $16,238.03 100% $18,727.85 100% 15.3 3.1
© 2020, Borrell Associates Inc. All rights reserved.
Page of 2 4
Market-level Auto Ad Spending Estimates
Market: Total US
Drawn From 2020 Data
Thisreportconsistsof6tables:
NewVehicles-Table1:Projected2020marketsalesbydealeremployeerange.Table2:Projected2020adspendingbymediachoice.
UsedVehicles-Table1:Projected2020marketsalesbydealeremployeerange.Table2:Projected2020adspendingbymediachoice.
2020-2025Forecastofnewvehiclespendingbymediachoice.
2020-2025Forecastofusedvehiclespendingbymediachoice.
Borrell'stableareportusesdatafromNADA,Scarborough,Woods&Poole,NIADA,MannheimAuctions,Dun&Bradstreet,andtheU.S.BureauofTransportationStatisticstocreateanassessmentofnewandusedvehiclepurchasingandassociatedadspendingatthemarketlevel.Forbestresults,printthisreportusingacolorprinter.Forfurtherinformationabouttheestimates,projections,andforecastsinthisreport,contactBorrellAssociatesat757/221-6641,[email protected].
1
2020 AUTOMOTIVE ADVERTISING OUTLOOK : FLAGGING NEW-CAR SALES, SOARING ONLINE VIDEO MARKETING ©2020 Borrell Associates Inc. All Rights Reserved 30
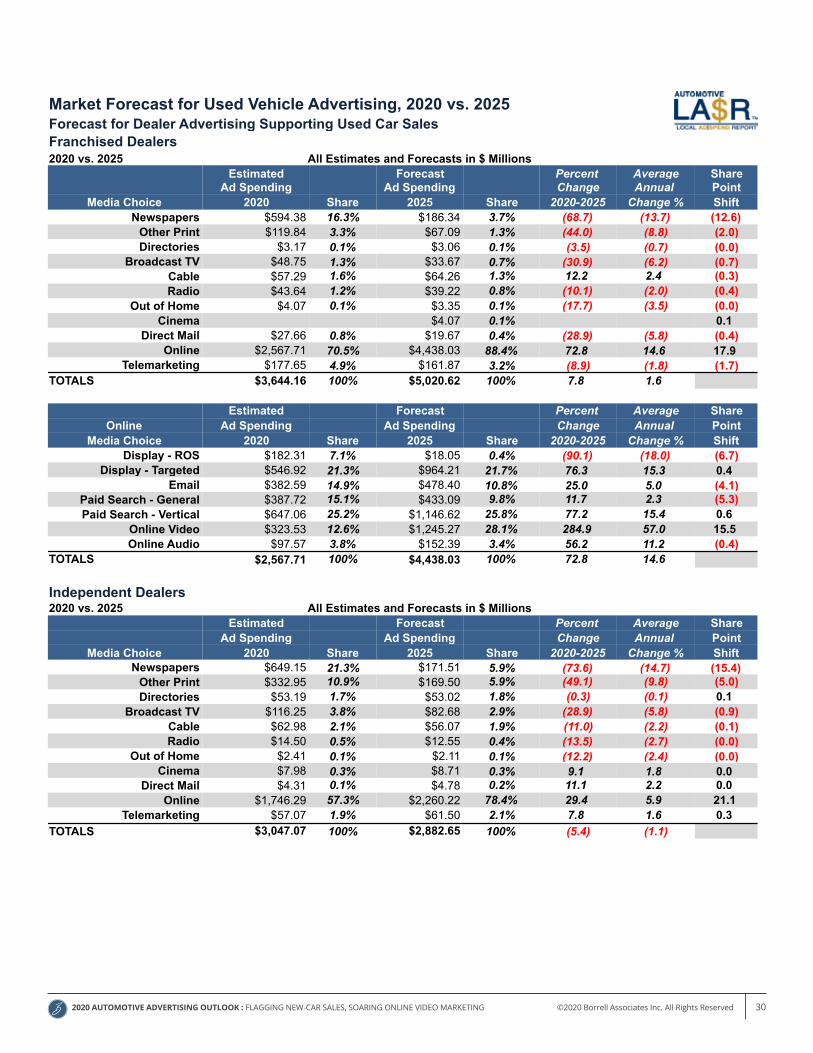
Market Forecast for Used Vehicle Advertising, 2020 vs. 2025Forecast for Dealer Advertising Supporting Used Car SalesFranchised Dealers2020 vs. 2025 All Estimates and Forecasts in $ Millions
Estimated Forecast Percent Average ShareAd Spending Ad Spending Change Annual Point
Media Choice 2020 Share 2025 Share 2020-2025 Change % ShiftNewspapers $594.38 16.3% $186.34 3.7% (68.7) (13.7) (12.6)
Other Print $119.84 3.3% $67.09 1.3% (44.0) (8.8) (2.0)Directories $3.17 0.1% $3.06 0.1% (3.5) (0.7) (0.0)
Broadcast TV $48.75 1.3% $33.67 0.7% (30.9) (6.2) (0.7)Cable $57.29 1.6% $64.26 1.3% 12.2 2.4 (0.3)Radio $43.64 1.2% $39.22 0.8% (10.1) (2.0) (0.4)
Out of Home $4.07 0.1% $3.35 0.1% (17.7) (3.5) (0.0)Cinema $4.07 0.1% 0.1
Direct Mail $27.66 0.8% $19.67 0.4% (28.9) (5.8) (0.4)Online $2,567.71 70.5% $4,438.03 88.4% 72.8 14.6 17.9
Telemarketing $177.65 4.9% $161.87 3.2% (8.9) (1.8) (1.7)TOTALS $3,644.16 100% $5,020.62 100% 7.8 1.6
Estimated Forecast Percent Average ShareOnline Ad Spending Ad Spending Change Annual Point
Media Choice 2020 Share 2025 Share 2020-2025 Change % ShiftDisplay - ROS $182.31 7.1% $18.05 0.4% (90.1) (18.0) (6.7)
Display - Targeted $546.92 21.3% $964.21 21.7% 76.3 15.3 0.4 Email $382.59 14.9% $478.40 10.8% 25.0 5.0 (4.1)
Paid Search - General $387.72 15.1% $433.09 9.8% 11.7 2.3 (5.3)Paid Search - Vertical $647.06 25.2% $1,146.62 25.8% 77.2 15.4 0.6
Online Video $323.53 12.6% $1,245.27 28.1% 284.9 57.0 15.5 Online Audio $97.57 3.8% $152.39 3.4% 56.2 11.2 (0.4)
TOTALS $2,567.71 100% $4,438.03 100% 72.8 14.6
Independent Dealers2020 vs. 2025 All Estimates and Forecasts in $ Millions
Estimated Forecast Percent Average ShareAd Spending Ad Spending Change Annual Point
Media Choice 2020 Share 2025 Share 2020-2025 Change % ShiftNewspapers $649.15 21.3% $171.51 5.9% (73.6) (14.7) (15.4)
Other Print $332.95 10.9% $169.50 5.9% (49.1) (9.8) (5.0)Directories $53.19 1.7% $53.02 1.8% (0.3) (0.1) 0.1
Broadcast TV $116.25 3.8% $82.68 2.9% (28.9) (5.8) (0.9)Cable $62.98 2.1% $56.07 1.9% (11.0) (2.2) (0.1)Radio $14.50 0.5% $12.55 0.4% (13.5) (2.7) (0.0)
Out of Home $2.41 0.1% $2.11 0.1% (12.2) (2.4) (0.0)Cinema $7.98 0.3% $8.71 0.3% 9.1 1.8 0.0
Direct Mail $4.31 0.1% $4.78 0.2% 11.1 2.2 0.0 Online $1,746.29 57.3% $2,260.22 78.4% 29.4 5.9 21.1
Telemarketing $57.07 1.9% $61.50 2.1% 7.8 1.6 0.3 TOTALS $3,047.07 100% $2,882.65 100% (5.4) (1.1)
Estimated Forecast Percent Average ShareOnline Ad Spending Ad Spending Change Annual Point
Media Choice 2020 Share 2025 Share 2020-2025 Change % ShiftDisplay - ROS $48.90 2.8% $4.35 0.2% (91.1) (18.2) (2.6)
Display - Targeted $656.60 37.6% $715.92 31.7% 9.0 1.8 (5.9)Email $171.14 9.8% $145.73 6.4% (14.8) (3.0) (3.4)
Paid Search - General $200.82 11.5% $207.80 9.2% 3.5 0.7 (2.3)Paid Search - Vertical $323.06 18.5% $379.55 16.8% 17.5 3.5 (1.7)
Online Video $281.15 16.1% $734.06 32.5% 161.1 32.2 16.4 Online Audio $64.61 3.7% $72.82 3.2% 12.7 2.5 (0.5)
TOTALS $1,746.29 100% $2,260.22 100% 29.4 5.9
Page of 1 4
Market-level Auto Ad Spending Estimates
Market: Total US
Drawn From 2020 Data
Thisreportconsistsof6tables:
NewVehicles-Table1:Projected2020marketsalesbydealeremployeerange.Table2:Projected2020adspendingbymediachoice.
UsedVehicles-Table1:Projected2020marketsalesbydealeremployeerange.Table2:Projected2020adspendingbymediachoice.
2020-2025Forecastofnewvehiclespendingbymediachoice.
2020-2025Forecastofusedvehiclespendingbymediachoice.
Borrell'stableareportusesdatafromNADA,Scarborough,Woods&Poole,NIADA,MannheimAuctions,Dun&Bradstreet,andtheU.S.BureauofTransportationStatisticstocreateanassessmentofnewandusedvehiclepurchasingandassociatedadspendingatthemarketlevel.Forbestresults,printthisreportusingacolorprinter.Forfurtherinformationabouttheestimates,projections,andforecastsinthisreport,contactBorrellAssociatesat757/221-6641,[email protected].
1
2020 AUTOMOTIVE ADVERTISING OUTLOOK : FLAGGING NEW-CAR SALES, SOARING ONLINE VIDEO MARKETING ©2020 Borrell Associates Inc. All Rights Reserved 31
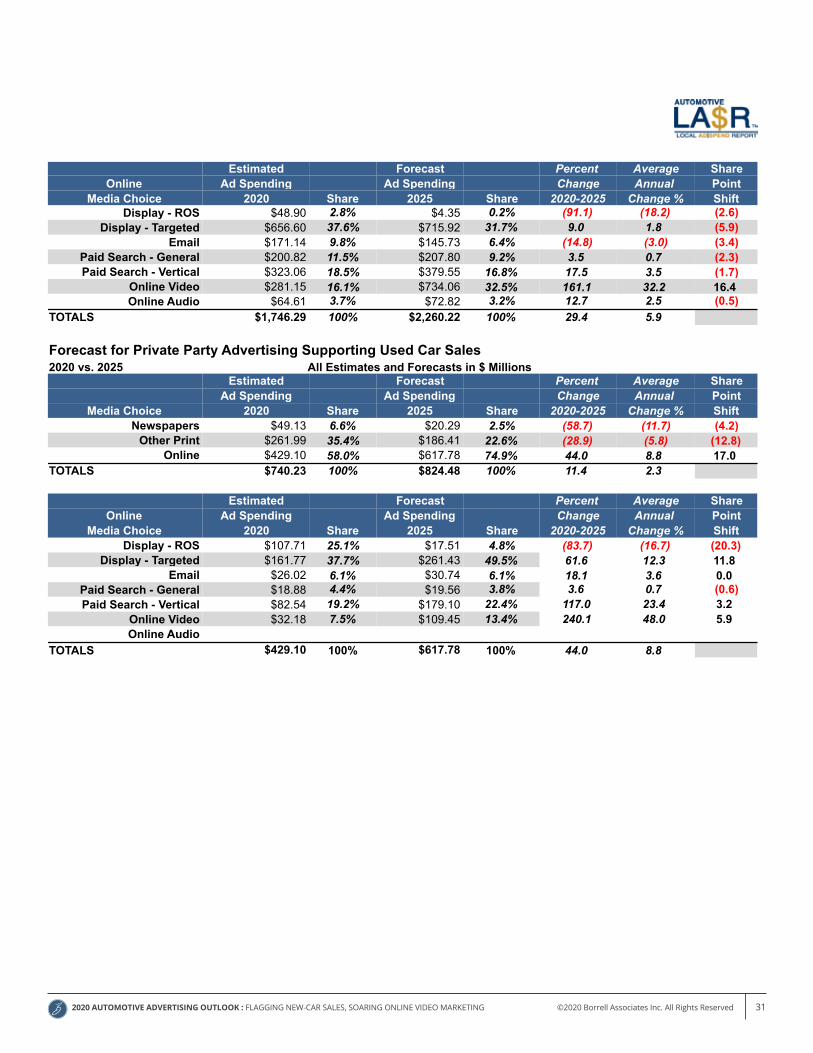
Market Forecast for Used Vehicle Advertising, 2020 vs. 2025Forecast for Dealer Advertising Supporting Used Car SalesFranchised Dealers2020 vs. 2025 All Estimates and Forecasts in $ Millions
Estimated Forecast Percent Average ShareAd Spending Ad Spending Change Annual Point
Media Choice 2020 Share 2025 Share 2020-2025 Change % ShiftNewspapers $594.38 16.3% $186.34 3.7% (68.7) (13.7) (12.6)
Other Print $119.84 3.3% $67.09 1.3% (44.0) (8.8) (2.0)Directories $3.17 0.1% $3.06 0.1% (3.5) (0.7) (0.0)
Broadcast TV $48.75 1.3% $33.67 0.7% (30.9) (6.2) (0.7)Cable $57.29 1.6% $64.26 1.3% 12.2 2.4 (0.3)Radio $43.64 1.2% $39.22 0.8% (10.1) (2.0) (0.4)
Out of Home $4.07 0.1% $3.35 0.1% (17.7) (3.5) (0.0)Cinema $4.07 0.1% 0.1
Direct Mail $27.66 0.8% $19.67 0.4% (28.9) (5.8) (0.4)Online $2,567.71 70.5% $4,438.03 88.4% 72.8 14.6 17.9
Telemarketing $177.65 4.9% $161.87 3.2% (8.9) (1.8) (1.7)TOTALS $3,644.16 100% $5,020.62 100% 7.8 1.6
Estimated Forecast Percent Average ShareOnline Ad Spending Ad Spending Change Annual Point
Media Choice 2020 Share 2025 Share 2020-2025 Change % ShiftDisplay - ROS $182.31 7.1% $18.05 0.4% (90.1) (18.0) (6.7)
Display - Targeted $546.92 21.3% $964.21 21.7% 76.3 15.3 0.4 Email $382.59 14.9% $478.40 10.8% 25.0 5.0 (4.1)
Paid Search - General $387.72 15.1% $433.09 9.8% 11.7 2.3 (5.3)Paid Search - Vertical $647.06 25.2% $1,146.62 25.8% 77.2 15.4 0.6
Online Video $323.53 12.6% $1,245.27 28.1% 284.9 57.0 15.5 Online Audio $97.57 3.8% $152.39 3.4% 56.2 11.2 (0.4)
TOTALS $2,567.71 100% $4,438.03 100% 72.8 14.6
Independent Dealers2020 vs. 2025 All Estimates and Forecasts in $ Millions
Estimated Forecast Percent Average ShareAd Spending Ad Spending Change Annual Point
Media Choice 2020 Share 2025 Share 2020-2025 Change % ShiftNewspapers $649.15 21.3% $171.51 5.9% (73.6) (14.7) (15.4)
Other Print $332.95 10.9% $169.50 5.9% (49.1) (9.8) (5.0)Directories $53.19 1.7% $53.02 1.8% (0.3) (0.1) 0.1
Broadcast TV $116.25 3.8% $82.68 2.9% (28.9) (5.8) (0.9)Cable $62.98 2.1% $56.07 1.9% (11.0) (2.2) (0.1)Radio $14.50 0.5% $12.55 0.4% (13.5) (2.7) (0.0)
Out of Home $2.41 0.1% $2.11 0.1% (12.2) (2.4) (0.0)Cinema $7.98 0.3% $8.71 0.3% 9.1 1.8 0.0
Direct Mail $4.31 0.1% $4.78 0.2% 11.1 2.2 0.0 Online $1,746.29 57.3% $2,260.22 78.4% 29.4 5.9 21.1
Telemarketing $57.07 1.9% $61.50 2.1% 7.8 1.6 0.3 TOTALS $3,047.07 100% $2,882.65 100% (5.4) (1.1)
Estimated Forecast Percent Average ShareOnline Ad Spending Ad Spending Change Annual Point
Media Choice 2020 Share 2025 Share 2020-2025 Change % ShiftDisplay - ROS $48.90 2.8% $4.35 0.2% (91.1) (18.2) (2.6)
Display - Targeted $656.60 37.6% $715.92 31.7% 9.0 1.8 (5.9)Email $171.14 9.8% $145.73 6.4% (14.8) (3.0) (3.4)
Paid Search - General $200.82 11.5% $207.80 9.2% 3.5 0.7 (2.3)Paid Search - Vertical $323.06 18.5% $379.55 16.8% 17.5 3.5 (1.7)
Online Video $281.15 16.1% $734.06 32.5% 161.1 32.2 16.4 Online Audio $64.61 3.7% $72.82 3.2% 12.7 2.5 (0.5)
TOTALS $1,746.29 100% $2,260.22 100% 29.4 5.9
Page of 1 4Forecast for Private Party Advertising Supporting Used Car Sales2020 vs. 2025 All Estimates and Forecasts in $ Millions
Estimated Forecast Percent Average ShareAd Spending Ad Spending Change Annual Point
Media Choice 2020 Share 2025 Share 2020-2025 Change % ShiftNewspapers $49.13 6.6% $20.29 2.5% (58.7) (11.7) (4.2)
Other Print $261.99 35.4% $186.41 22.6% (28.9) (5.8) (12.8)Online $429.10 58.0% $617.78 74.9% 44.0 8.8 17.0
TOTALS $740.23 100% $824.48 100% 11.4 2.3
Estimated Forecast Percent Average ShareOnline Ad Spending Ad Spending Change Annual Point
Media Choice 2020 Share 2025 Share 2020-2025 Change % ShiftDisplay - ROS $107.71 25.1% $17.51 4.8% (83.7) (16.7) (20.3)
Display - Targeted $161.77 37.7% $261.43 49.5% 61.6 12.3 11.8 Email $26.02 6.1% $30.74 6.1% 18.1 3.6 0.0
Paid Search - General $18.88 4.4% $19.56 3.8% 3.6 0.7 (0.6)Paid Search - Vertical $82.54 19.2% $179.10 22.4% 117.0 23.4 3.2
Online Video $32.18 7.5% $109.45 13.4% 240.1 48.0 5.9 Online Audio
TOTALS $429.10 100% $617.78 100% 44.0 8.8
© 2020, Borrell Associates Inc. All rights reserved.
Page of 2 4
Market-level Auto Ad Spending Estimates
Market: Total US
Drawn From 2020 Data
Thisreportconsistsof6tables:
NewVehicles-Table1:Projected2020marketsalesbydealeremployeerange.Table2:Projected2020adspendingbymediachoice.
UsedVehicles-Table1:Projected2020marketsalesbydealeremployeerange.Table2:Projected2020adspendingbymediachoice.
2020-2025Forecastofnewvehiclespendingbymediachoice.
2020-2025Forecastofusedvehiclespendingbymediachoice.
Borrell'stableareportusesdatafromNADA,Scarborough,Woods&Poole,NIADA,MannheimAuctions,Dun&Bradstreet,andtheU.S.BureauofTransportationStatisticstocreateanassessmentofnewandusedvehiclepurchasingandassociatedadspendingatthemarketlevel.Forbestresults,printthisreportusingacolorprinter.Forfurtherinformationabouttheestimates,projections,andforecastsinthisreport,contactBorrellAssociatesat757/221-6641,[email protected].
1
2020 AUTOMOTIVE ADVERTISING OUTLOOK : FLAGGING NEW-CAR SALES, SOARING ONLINE VIDEO MARKETING ©2020 Borrell Associates Inc. All Rights Reserved 32
2020 OUTLOOK: DIGITAL SERVICES CONTINUE TO DOMINATE MARKETING BUDGETS ©2019 Borrell Associates Inc. All Rights Reserved 31
As a data-driven company, we are experts in local advertising.
We are the leaders in tracking and forecasting local ad spending across any market in the U.S. and Canada, down to the county level.
We help clients gauge the levels of advertising, promotion, and marketing expenditures in their markets by any type of business.
We help media companies increase their market share and marketers adjust their budgets by providing detailed ad-spending data, fact-based consultation and training.
ABOUT BORRELLMethodology & ModelOur unique and disruptive methodology of tracking advertising was fi rst developed in 1990 as a holistic way to gauge spending in traditional media. Since the late 1990s it has continuously progressed to include deep levels of data that monitor online advertising. Now used by more than 1,000 companies, our ad-spending estimates are derived from a blend of bottom-up and top-down data, as well as a continuous fl ow of our own market surveying.
Unlike most other companies, our approach starts at the bottom with local business expenditures, instead of at the top — media companies’ receipts. This is based on our belief that the media world has become so complex and fragmented that it’s impossible to deliver an accurate assessment via only the traditional top-down approach of tallying receipts of the largest media companies.
Our model is designed with a powerful and unwavering local focus. This model of collecting expenditure and receipt data enables us to measure ad spending that is generated and spent in any given market, directed to a market from elsewhere, and generated in a market but spent elsewhere. For more detail on our methodology, visit www.adspending.com.
Market DataOur market data is remarkably deep, off ering ad-spending assessments across each of the 12 media types (newspapers, online, TV, radio, direct mail, etc.) and for any of 100 business categories (furniture stores, car dealers, hospitals, telecommunications, etc.). It now includes promotions data and off ers backcasts and forecasts up to fi ve years. Our data subscription product — the Compass — off ers an interactive tool that media managers, analysts and sales professionals use to manipulate the data to uncover enlightening facts.
The richest data surrounds the levels of spending on digital media. For instance, the Compass off ers guidance on how much a mid-size auto dealer in Albuquerque might spend on search engine advertising, targeted display, or online video ads. We are continuously improving the off erings to meet our clients’ needs and off er monthly user group webinars with Compass subscribers.
2020 AUTOMOTIVE ADVERTISING OUTLOOK : FLAGGING NEW-CAR SALES, SOARING ONLINE VIDEO MARKETING ©2020 Borrell Associates Inc. All Rights Reserved 332020 OUTLOOK: DIGITAL SERVICES CONTINUE TO DOMINATE MARKETING BUDGETS ©2019 Borrell Associates Inc. All Rights Reserved 32
Local Advertiser SurveysEach year, Borrell Associates conducts the largest survey of local advertisers in the U.S. This is done with the help of local media organizations throughout the country. Last year, more than 3,000 local advertisers completed the survey.
The survey consists of 25-45 questions (depending on how the recipient answers) about advertising, marketing, and digital services. It takes 20 minutes to complete. In addition to general questions regarding business size and type, the survey covers:
• What % of budget spent on each medium (newspapers, TV, radio, etc.). More than 30categories are measured.
• Plans to change (increase, keep the same, or decrease) spending this year on thefollowing media (newspapers, broadcast TV, radio, online, direct mail, etc.)
• Social media use and eff ectiveness.• Details on video advertising• Separate thread for ad agencies to take
Industry Papers and SubscriptionsWe release a variety of analysis-rich industry papers and memoranda throughout the year. These papers are published several times a year and include dozens of charts and tables, as well as appendices packed with market-level data. They cover topical issues in both online and mobile advertising, often in the framework of how those trends aff ect traditional media. Examples of reports include:
• SMB Spending on Digital Marketing• Real Estate Advertising Outlook• Automotive Advertising Outlook• Local Advertising Forecasts• Benchmarking Local Online Media• Digital Marketing Services Outlook• Political Ad Spending Forecast
An Annual Subscription is the best way to stay informed on the most important industry trends. Subscribers receive:
• At least 10 industry papers per year• Access to all archived papers• Access to interactive webinars with lead analysts discussing report fi ndings• Downloadable PowerPoint with all report charts and tables• Client memoranda as issued on pertinent topics
Revenue SurveySince 2001, we’ve been collecting data on interactive revenues and expenses from local media companies. The data encompasses more than 10,000 companies, giving us an accurate picture of online advertising sales across the U.S. and Canada. We conduct private benchmarking reports for local media companies and compile an annual summary of the data in our “Benchmarking Local Online Media” report each spring. The data allows us to study the best-practice companies and how they’re able to achive as much as 10 times the average market share.
Conference & Company PresentationsOur annual Local Online Advertising Conference is a fi rst-class event. Held each spring, the event brings together the largest group of local interactive media executives of any conference. The speaker list represents a Who’s Who among local media. Eighty percent of the attendees are company executives, most of whom are in charge of interactive strategies. In addition, we speak at nearly 100 company meetings and conferences each year. Excellent presentation skills are a core competency at Borrell.
WebinarsWe host or participate in dozens of webinars throughout the year. Our topic list is extensive. We develop custom presentations specifi cally for companies, trade associations or other groups. We do not conduct sponsored webinars.