Embed Size (px)
Citation preview
Record profits versus increasing volatility
December 2014
Global Automotive Supplier Study
SUMMARY VERSION
2
Contents Page
The current status – Supplier profitability at an all-time high
A. The short-term challenge – Uncertainty rises as record profitability is expected to come to an end
B. The long-term challenge – An industry structure fundamentally changing
C. The conclusion – Key actions for automotive suppliers
D.
3 Source: Roland Berger/Lazard
The current status – Supplier profitability at an all-time high
Executive Summary
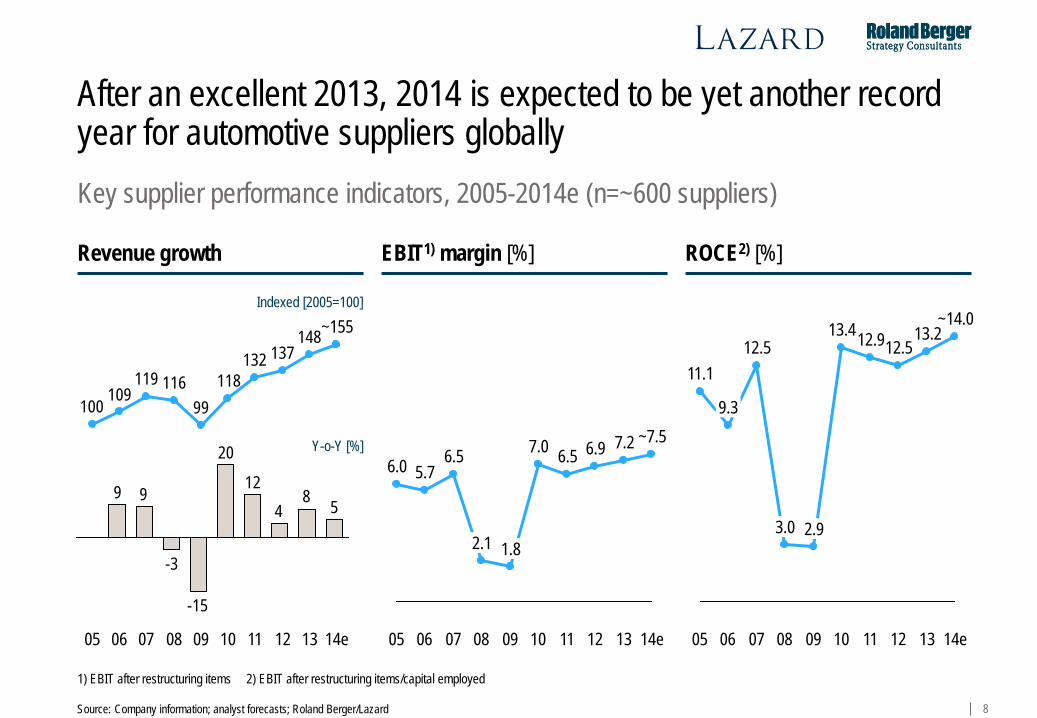
> After an excellent 2013, 2014 is expected to become yet another record year for automotive suppliers with a global EBIT margin of ~7.5 percent
> Key drivers of these results are nicely growing vehicle production volumes and positive trends in the segment mix along with high capacity utilization after a 5-year period of strong growth
> Automotive suppliers have – on average – outperformed their OEM customers in terms of profitability – compared to other industries there is still room for improvement though
> Performance varies greatly depending on region, company size, product focus and business model − NAFTA-based suppliers are currently more profitable than their European peers − Large globally operating suppliers are top of the class − Powertrain and tire focused suppliers currently achieve the highest profitability − Product innovators are outpacing process specialists
> At the individual supplier level, revenue growth does not naturally correlate with profitability – but one group of top-performing suppliers is managing to grow their business at high margins
> Along with operational performance, many suppliers have substantially improved their liquidity and financing situation and find themselves in a more stable position than in 2007
A
4 Source: Roland Berger/Lazard
The short-term challenge – Uncertainty rises as record profitability is set to come to an end Executive Summary
> The 2015 outlook for the global automotive industry is marked by increasing volatility and uncertainty > Global light vehicle production is expected to continue its growth over the next two years – but at a
much slower pace than before − Europe stable at a low level, Japan even declining – and NAFTA will see only moderate growth,
having rallied in previous years − BRI markets have the potential for growth following difficult years in 2013/2014 – but a risk of
further stagnation clearly exists − China remains the only major growth driver
> OEMs are facing increasing margin pressure – both from end customer price pressure in most markets and from rising costs for product/production complexity and warranties
> OEMs have kicked off additional cost reduction programs in 2014 – growing friction in OEM-supplier relations (reinforced "pay-to-play"; "pay-to-quote")
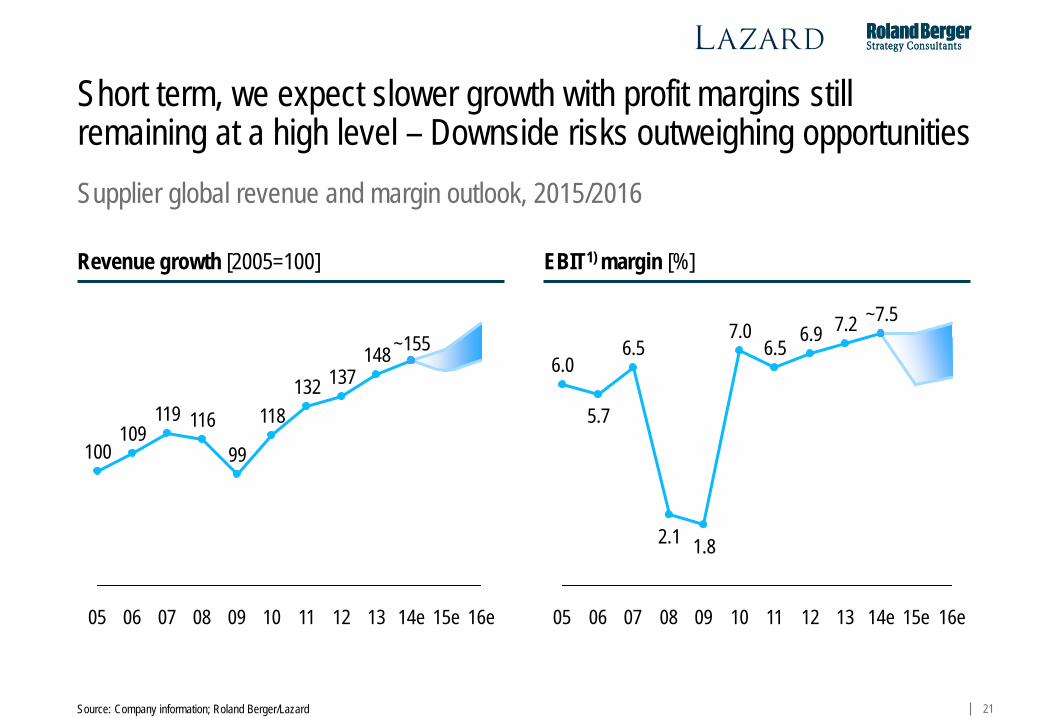
> In the short-term, we therefore expect slower growth for the automotive supplier industry – the record profitability of the past five years is expected to come to an end; still, profit margins are expected to remain at a high level
B
5 Source: Roland Berger/Lazard
The long-term challenge – An industry structure fundamentally changing Executive Summary
> The automotive supplier industry is facing a period of constant change – most of the following factors are not fundamentally new; however, the magnitude with which they will have an impact on automotive suppliers is expected to increase significantly
− Continued shift of end customer demand to Asia − Ongoing relocation of engineering (China, CEE) and production (new markets beyond BRIC) − Market access and technology-driven M&A – with emerging market investors at the forefront − Downstream expansion of raw materials providers − Technology (r)evolution of the powertrain, driver assistance and connectivity − Volatility of currency and capital markets
> Those changes come with a higher of uncertainty – some technology roadmaps are far from being clear, and long-trusted OEM relationships may end up being sacrificed in the battle for new global programs
> As a consequence, the global vehicle component market is still expected to grow – but the structural changes to the industry will redistribute revenue pools across products/domains
> This environment yields an ever higher number of both opportunities and risks for automotive suppliers – those players that focus on the winning product, customer and regional mix could hugely benefit
C
6 Source: Roland Berger/Lazard
The conclusion – Key actions for automotive suppliers
Executive Summary
> Short term, the risk to the individual supplier of a significant drop in margins is clearly increasing – despite the fact that the overall industry profitability is expected to remain at a high level
> Suppliers therefore need to ride the next wave of efficiency gains – but without limiting their flexibility to quickly adjust to an ever more uncertain and volatile market development
− Cautiously monitor market developments and signals for a possible downturn − Drive smart efficiency improvements (indirect production, overheads,…) − Increase/maintain flexibility across the entire value chain (production, R&D, purchasing,…) − Closely manage investment decisions and one-time costs
> At the same time, suppliers need to prepare themselves to benefit from the industry shift and mitigate the associated risks in the mid to long term
− Regularly review and adapt defined strategy − Maintain/sharpen unique selling proposition with clear technological or process differentiation − Focus on product segments with above-average growth rates and margin potential − Actively leverage M&A opportunities − Balance regional structures (revenue creation, production, R&D, sourcing,…)
D
7
A. The current status – Supplier profitability at an all-time high
8 Source: Company information; analyst forecasts; Roland Berger/Lazard
After an excellent 2013, 2014 is expected to be yet another record year for automotive suppliers globally
1) EBIT after restructuring items 2) EBIT after restructuring items/capital employed
Key supplier performance indicators, 2005-2014e (n=~600 suppliers)
148137132
11899
116119109
100
14e
~155
13 12 11 10 09 08 07 06 05 14e
~7.5
13
7.2
12
6.9
11
6.5
10
7.0
09
1.8
08
2.1
07
6.5
06
5.7
05
6.0
14e
~14.0
13
13.2
12
12.5
11
12.9
10
13.4
09
2.9
08
3.0
07
12.5
06
9.3
05
11.1
Revenue growth EBIT1) margin [%] ROCE2) [%]
Indexed [2005=100]
Y-o-Y [%]
584
12
20
-15
-3
99
9
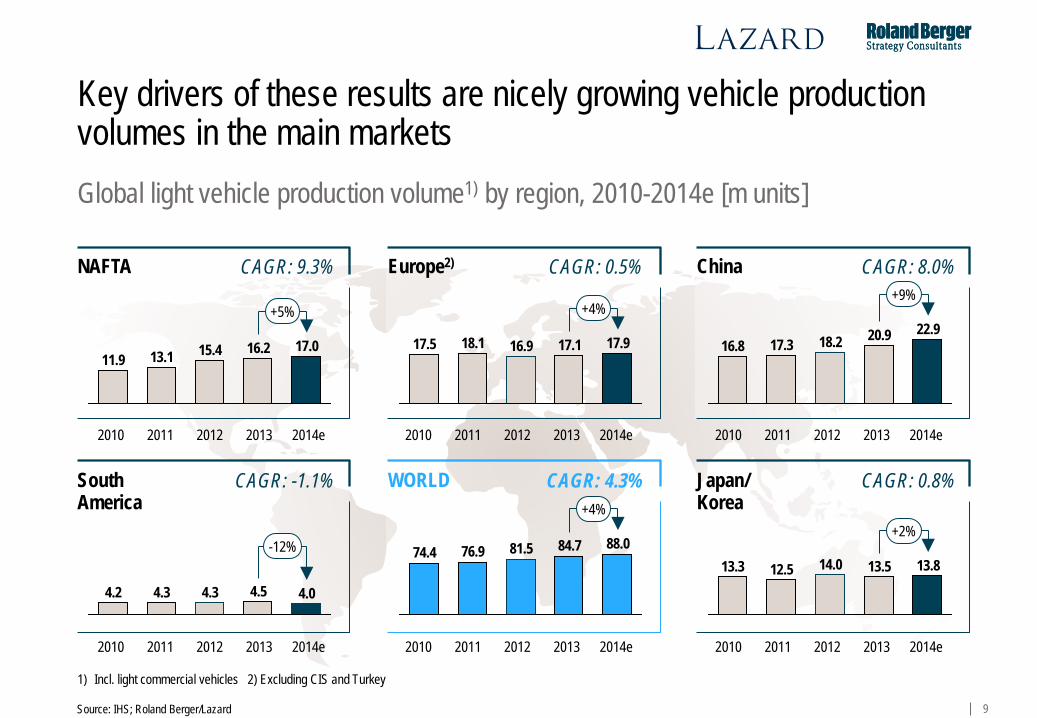
Key drivers of these results are nicely growing vehicle production volumes in the main markets
1) Incl. light commercial vehicles 2) Excluding CIS and Turkey
11.9
+5%
17.0 16.2 15.4 13.1
WORLD
NAFTA Europe2) China
South America
Japan/ Korea
+4%
17.9 17.1 16.9 18.1 17.5
+9%
16.8 22.9 20.9 18.2 17.3
4.0 4.5 4.3 4.3
-12%
4.2
84.7 81.5 88.0
+4%
74.4 76.9 13.8 14.0 13.5 12.5 13.3
+2%
Source: IHS; Roland Berger/Lazard
2010 2011 2012 2013 2014e
Global light vehicle production volume1) by region, 2010-2014e [m units]
2010 2011 2012 2013 2014e 2010 2011 2012 2013 2014e 2010 2011 2012 2013 2014e
2010 2011 2012 2013 2014e 2010 2011 2012 2013 2014e
CAGR: 9.3% CAGR: 0.5% CAGR: 8.0%
CAGR: -1.1% CAGR: 4.3% CAGR: 0.8%
10
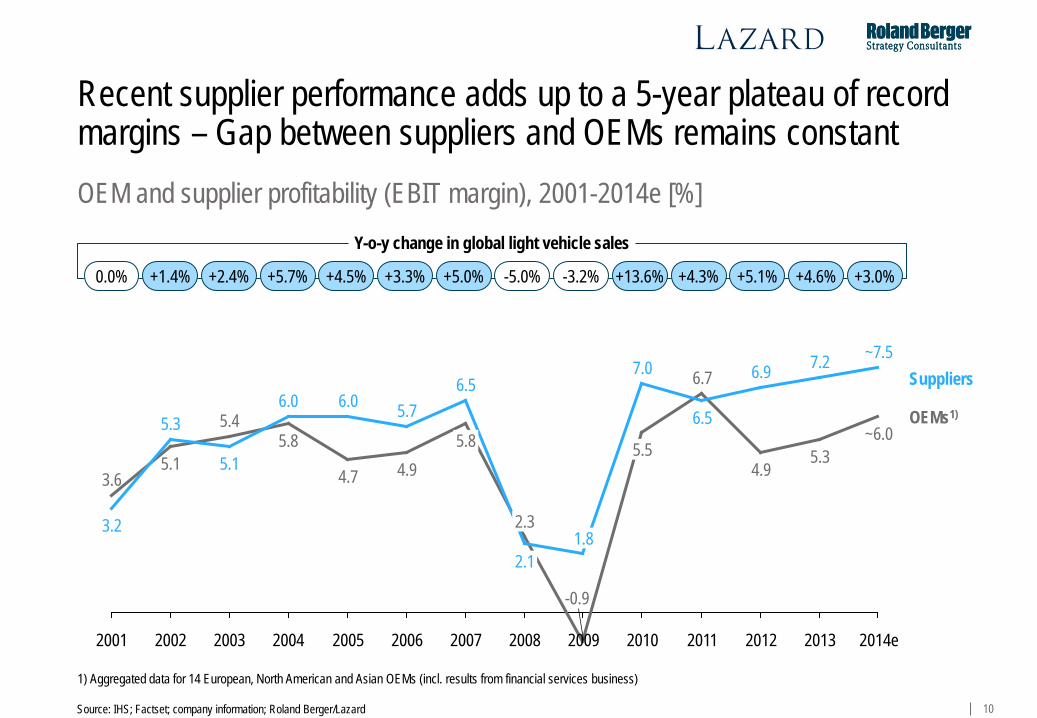
OEM and supplier profitability (EBIT margin), 2001-2014e [%]
Source: IHS; Factset; company information; Roland Berger/Lazard
2014e 2013 2012 2011 2010 2009 2008 2007 2006 2005 2004 2003 2002 2001
~7.5
1.8
~6.0 5.3
7.0
4.9
5.7
6.7
2.1
5.5
6.5
-0.9
2.3
6.5
5.8
7.2
4.9
6.0
4.7
6.0
5.8 5.1
5.4 5.3
5.1
Suppliers
OEMs1)
6.9
3.6
3.2
+1.4% +2.4% +5.7% +4.5% +3.3% +5.0% -5.0% -3.2% +13.6% +4.3% +5.1% +4.6%
1) Aggregated data for 14 European, North American and Asian OEMs (incl. results from financial services business)
0.0% +3.0%
Y-o-y change in global light vehicle sales
Recent supplier performance adds up to a 5-year plateau of record margins – Gap between suppliers and OEMs remains constant
11
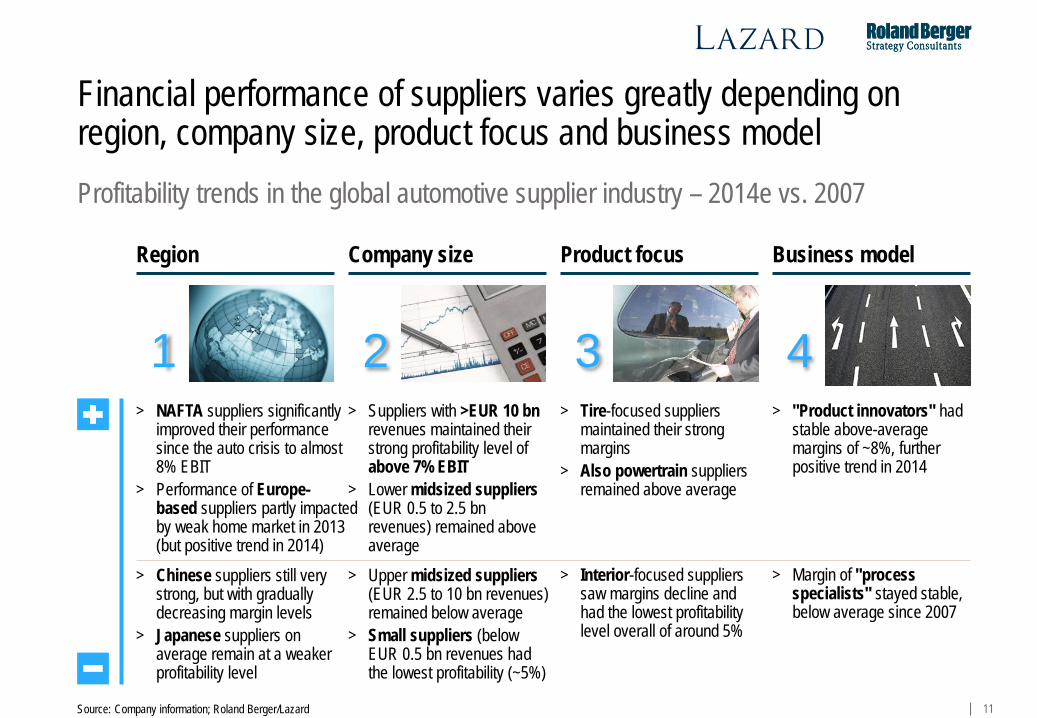
1
Region
> NAFTA suppliers significantly improved their performance since the auto crisis to almost 8% EBIT
> Performance of Europe- based suppliers partly impacted by weak home market in 2013 (but positive trend in 2014)
> Chinese suppliers still very strong, but with gradually decreasing margin levels
> Japanese suppliers on average remain at a weaker profitability level
2
Company size
> Suppliers with >EUR 10 bn revenues maintained their strong profitability level of above 7% EBIT
> Lower midsized suppliers (EUR 0.5 to 2.5 bn revenues) remained above average > Upper midsized suppliers (EUR 2.5 to 10 bn revenues) remained below average
> Small suppliers (below EUR 0.5 bn revenues had the lowest profitability (~5%)
3
Product focus
> Tire-focused suppliers maintained their strong margins
> Also powertrain suppliers remained above average
> Interior-focused suppliers saw margins decline and had the lowest profitability level overall of around 5%
4
Business model
> "Product innovators" had stable above-average margins of ~8%, further positive trend in 2014
> Margin of "process specialists" stayed stable, below average since 2007
Financial performance of suppliers varies greatly depending on region, company size, product focus and business model Profitability trends in the global automotive supplier industry – 2014e vs. 2007
Source: Company information; Roland Berger/Lazard
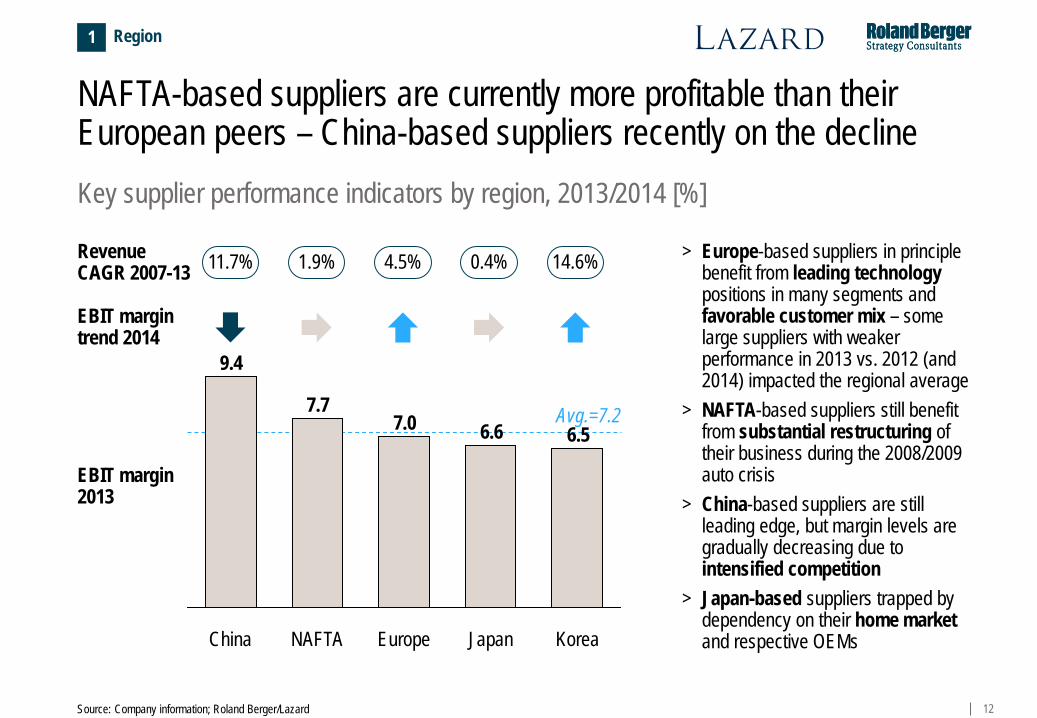
12
NAFTA-based suppliers are currently more profitable than their European peers – China-based suppliers recently on the decline
> Europe-based suppliers in principle benefit from leading technology positions in many segments and favorable customer mix – some large suppliers with weaker performance in 2013 vs. 2012 (and 2014) impacted the regional average
> NAFTA-based suppliers still benefit from substantial restructuring of their business during the 2008/2009 auto crisis
> China-based suppliers are still leading edge, but margin levels are gradually decreasing due to intensified competition
> Japan-based suppliers trapped by dependency on their home market and respective OEMs
Key supplier performance indicators by region, 2013/2014 [%]
EBIT margin trend 2014
EBIT margin 2013
NAFTA
7.7
Korea
6.5
Japan
6.6
Europe
7.0
China
9.4
Revenue CAGR 2007-13 11.7% 1.9% 4.5% 0.4% 14.6%
Avg.=7.2
1 Region
Source: Company information; Roland Berger/Lazard
13
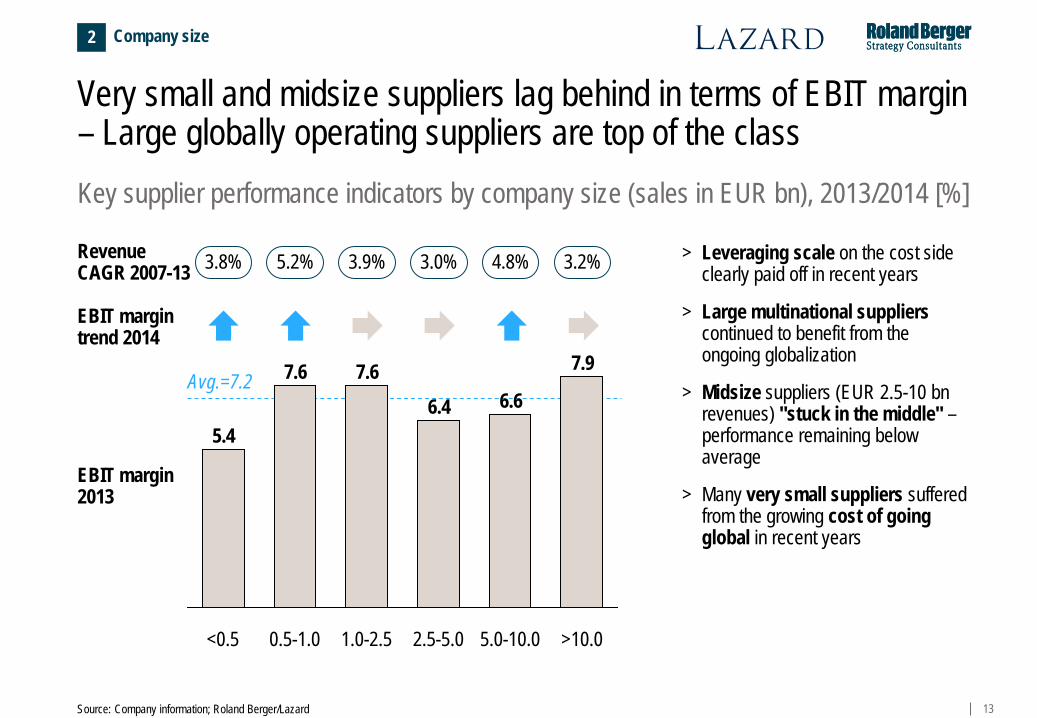
Very small and midsize suppliers lag behind in terms of EBIT margin – Large globally operating suppliers are top of the class
> Leveraging scale on the cost side clearly paid off in recent years
> Large multinational suppliers continued to benefit from the ongoing globalization
> Midsize suppliers (EUR 2.5-10 bn revenues) "stuck in the middle" – performance remaining below average
> Many very small suppliers suffered from the growing cost of going global in recent years
Key supplier performance indicators by company size (sales in EUR bn), 2013/2014 [%]
EBIT margin 2013
1.0-2.5 2.5-5.0
7.9
>10.0
6.6
0.5-1.0
6.4
5.0-10.0
7.6 7.6
<0.5
5.4
Avg.=7.2
EBIT margin trend 2014
Revenue CAGR 2007-13 3.8% 5.2% 3.9% 3.0% 4.8% 3.2%
2 Company size
Source: Company information; Roland Berger/Lazard
14
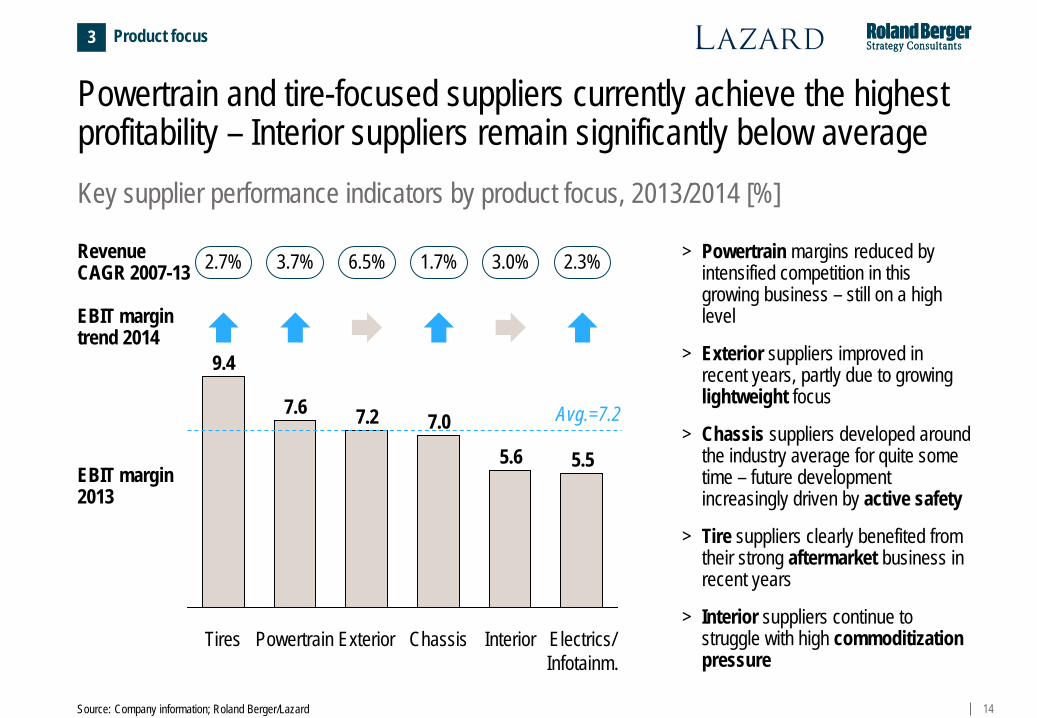
Powertrain and tire-focused suppliers currently achieve the highest profitability – Interior suppliers remain significantly below average Key supplier performance indicators by product focus, 2013/2014 [%]
Electrics/ Infotainm.
5.5
Interior
5.6
Exterior
7.2
Powertrain
7.6
Tires
9.4
Chassis
7.0
> Powertrain margins reduced by intensified competition in this growing business – still on a high level
> Exterior suppliers improved in recent years, partly due to growing lightweight focus
> Chassis suppliers developed around the industry average for quite some time – future development increasingly driven by active safety
> Tire suppliers clearly benefited from their strong aftermarket business in recent years
> Interior suppliers continue to struggle with high commoditization pressure
EBIT margin trend 2014
EBIT margin 2013
Revenue CAGR 2007-13
Avg.=7.2
2.7% 3.7% 6.5% 1.7% 3.0% 2.3%
3 Product focus
Source: Company information; Roland Berger/Lazard
15
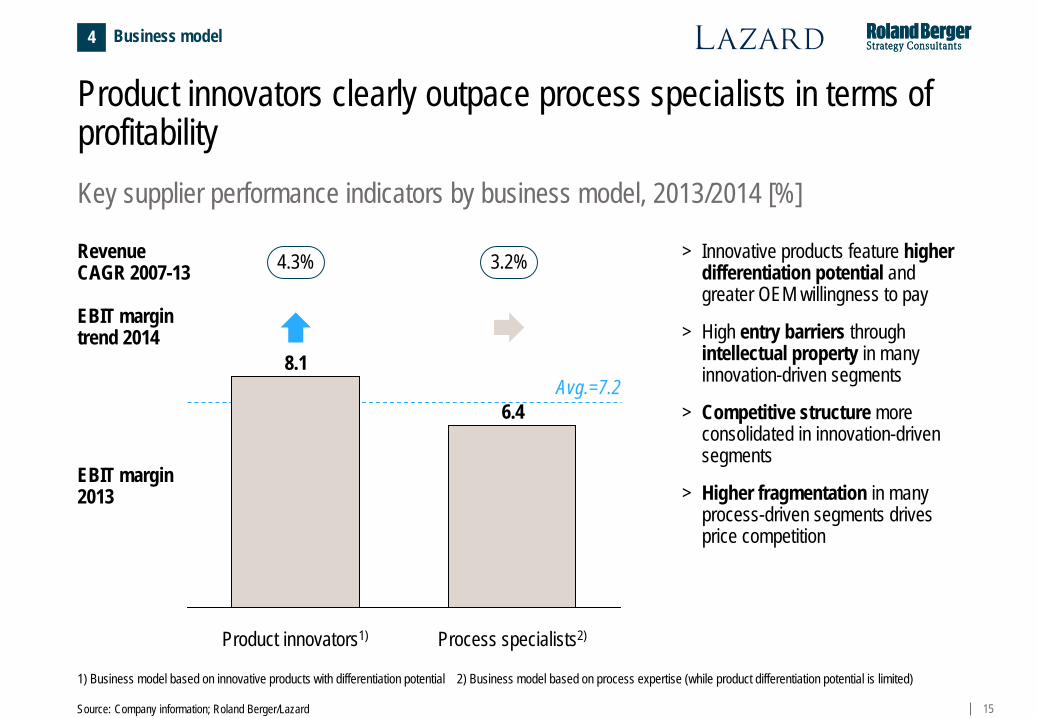
Product innovators clearly outpace process specialists in terms of profitability
> Innovative products feature higher differentiation potential and greater OEM willingness to pay
> High entry barriers through intellectual property in many innovation-driven segments
> Competitive structure more consolidated in innovation-driven segments
> Higher fragmentation in many process-driven segments drives price competition
Key supplier performance indicators by business model, 2013/2014 [%]
Process specialists2)
6.4
Product innovators1)
8.1
EBIT margin trend 2014
EBIT margin 2013
Revenue CAGR 2007-13 4.3% 3.2%
4 Business model
Avg.=7.2
1) Business model based on innovative products with differentiation potential 2) Business model based on process expertise (while product differentiation potential is limited)
Source: Company information; Roland Berger/Lazard
16
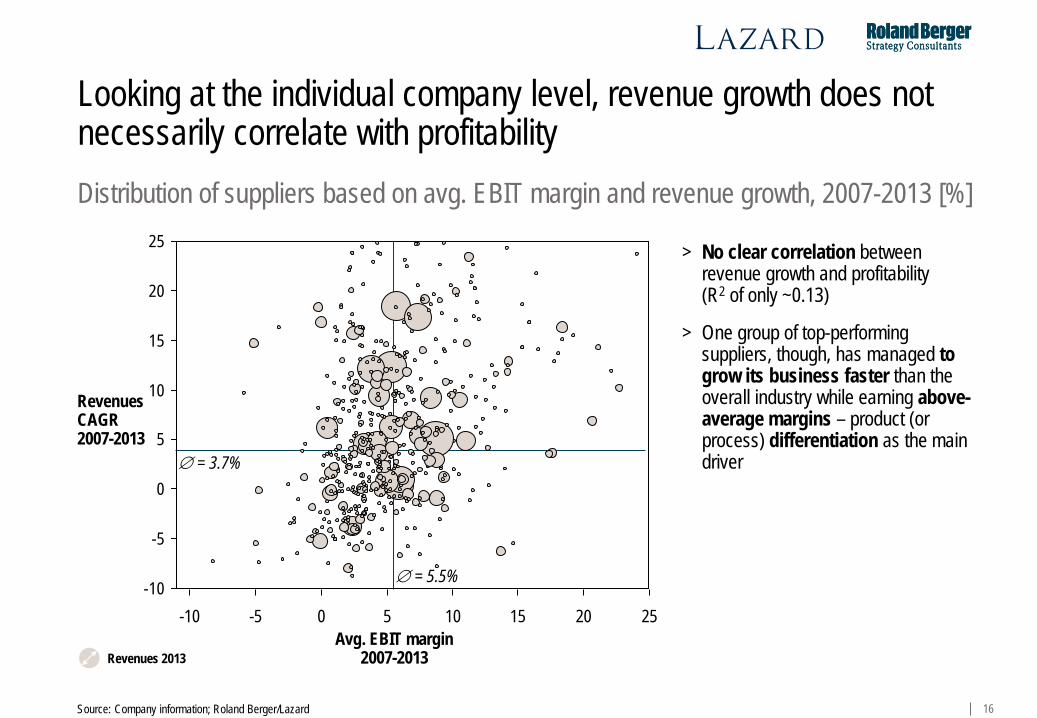
Looking at the individual company level, revenue growth does not necessarily correlate with profitability
> No clear correlation between revenue growth and profitability (R2 of only ~0.13)
> One group of top-performing suppliers, though, has managed to grow its business faster than the overall industry while earning above-average margins – product (or process) differentiation as the main driver
Distribution of suppliers based on avg. EBIT margin and revenue growth, 2007-2013 [%]
Revenues CAGR 2007-2013
∅ = 3.7%
∅ = 5.5% -10
-5
0
5
10
15
20
25
25 20 15 10 5 0 -5 -10
Revenues 2013 Avg. EBIT margin
2007-2013
Source: Company information; Roland Berger/Lazard
17
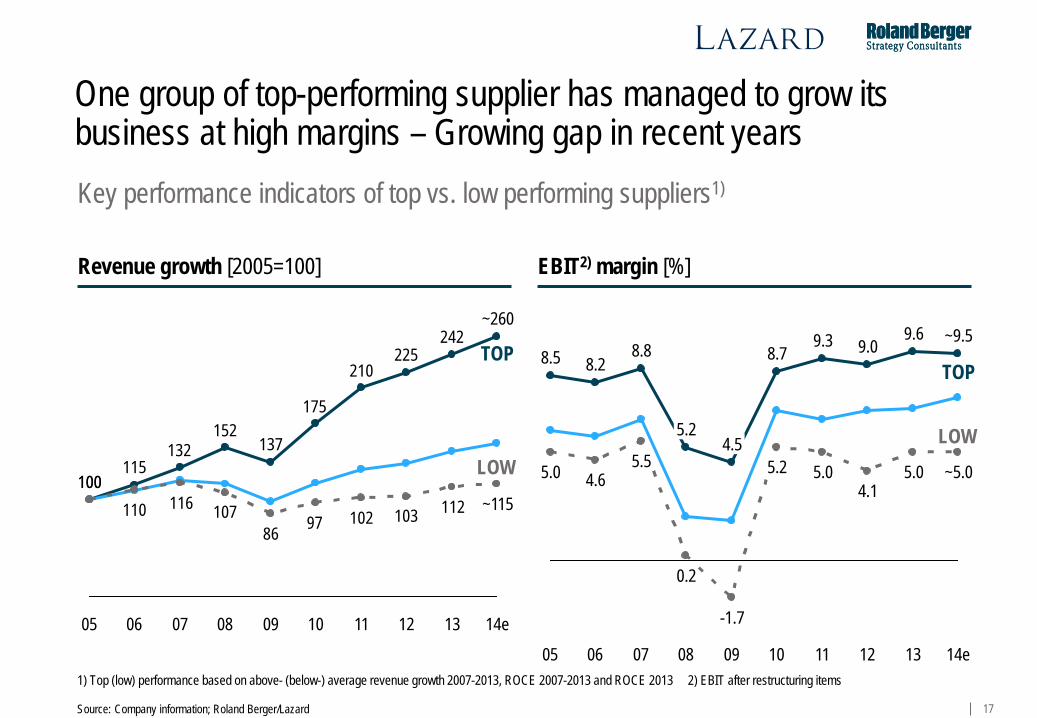
One group of top-performing supplier has managed to grow its business at high margins – Growing gap in recent years Key performance indicators of top vs. low performing suppliers1)
1) Top (low) performance based on above- (below-) average revenue growth 2007-2013, ROCE 2007-2013 and ROCE 2013 2) EBIT after restructuring items
242225
210
175
137152
132115
1001121031029786
107116110100
14e
~115
13 12 11 10 09 08 07 06 05
~260
13 12 11 10 09 08 07 06 05
9.6 9.0 9.3
8.7
4.5 5.2
8.8 8.2 8.5
5.5
~9.5
4.6
-1.7
0.2
5.0 5.2 5.0 4.1
5.0
14e
~5.0
Revenue growth [2005=100] EBIT2) margin [%]
LOW
TOP
Source: Company information; Roland Berger/Lazard
LOW
TOP
18
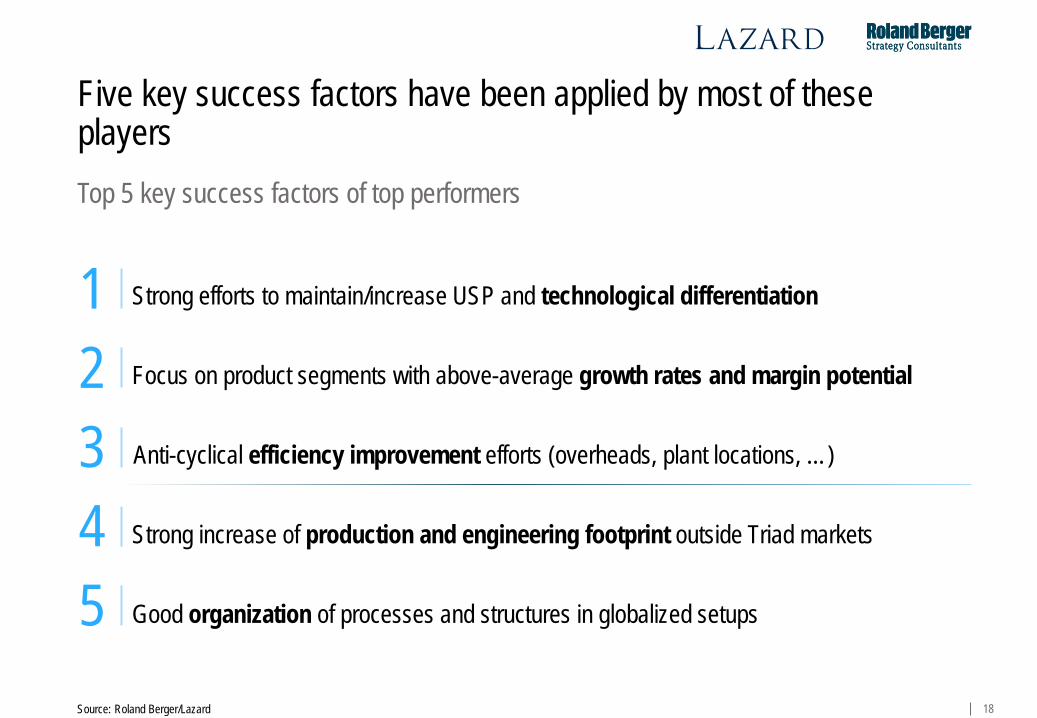
Five key success factors have been applied by most of these players
Strong efforts to maintain/increase USP and technological differentiation 1 Focus on product segments with above-average growth rates and margin potential 2 Anti-cyclical efficiency improvement efforts (overheads, plant locations, …) 3 Strong increase of production and engineering footprint outside Triad markets 4 Good organization of processes and structures in globalized setups
5
Top 5 key success factors of top performers
Source: Roland Berger/Lazard
19 Source: Roland Berger/Lazard
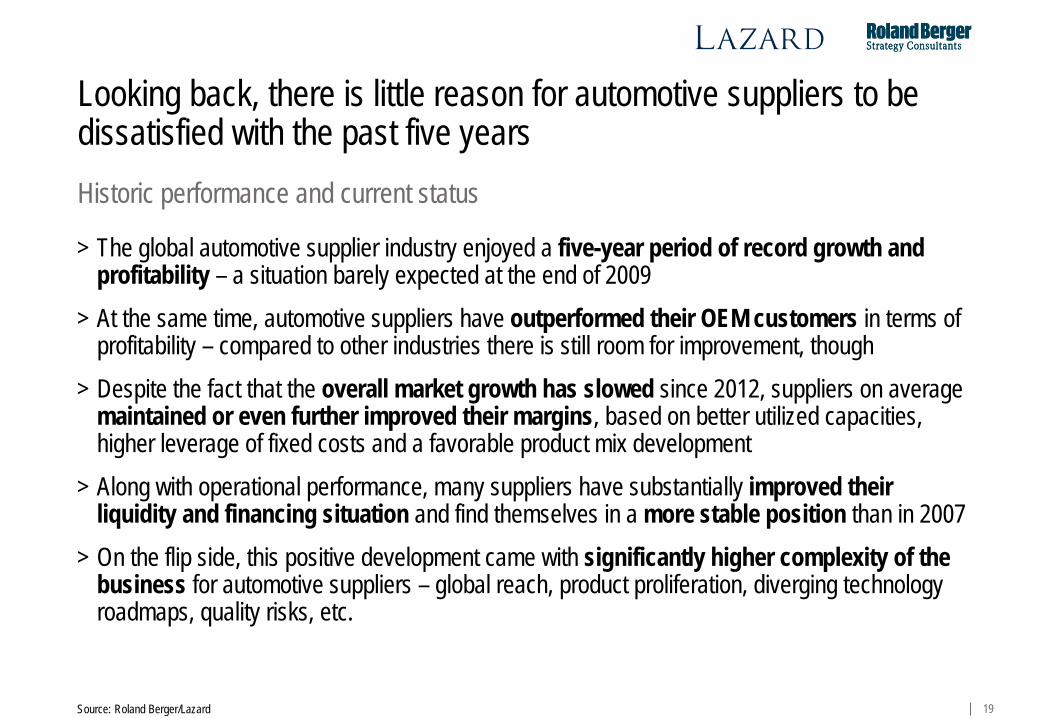
Historic performance and current status
> The global automotive supplier industry enjoyed a five-year period of record growth and profitability – a situation barely expected at the end of 2009
> At the same time, automotive suppliers have outperformed their OEM customers in terms of profitability – compared to other industries there is still room for improvement, though
> Despite the fact that the overall market growth has slowed since 2012, suppliers on average maintained or even further improved their margins, based on better utilized capacities, higher leverage of fixed costs and a favorable product mix development
> Along with operational performance, many suppliers have substantially improved their liquidity and financing situation and find themselves in a more stable position than in 2007
> On the flip side, this positive development came with significantly higher complexity of the business for automotive suppliers – global reach, product proliferation, diverging technology roadmaps, quality risks, etc.
Looking back, there is little reason for automotive suppliers to be dissatisfied with the past five years
20
B. The short-term challenge – Uncertainty rises as record profitability is expected to come to an end
21
15e 16e 14e
~7.5
13
7.2
12
6.9
11
6.5
10
7.0
09
1.8
08
2.1
07
6.5
06
5.7
05
6.0
Source: Company information; Roland Berger/Lazard
Supplier global revenue and margin outlook, 2015/2016
Short term, we expect slower growth with profit margins still remaining at a high level – Downside risks outweighing opportunities
15e
~155
99
08 12
116
16e 09
118
10 11
132 137
13
148
14e
119
05 07
109 100
06
Revenue growth [2005=100] EBIT1) margin [%]
22
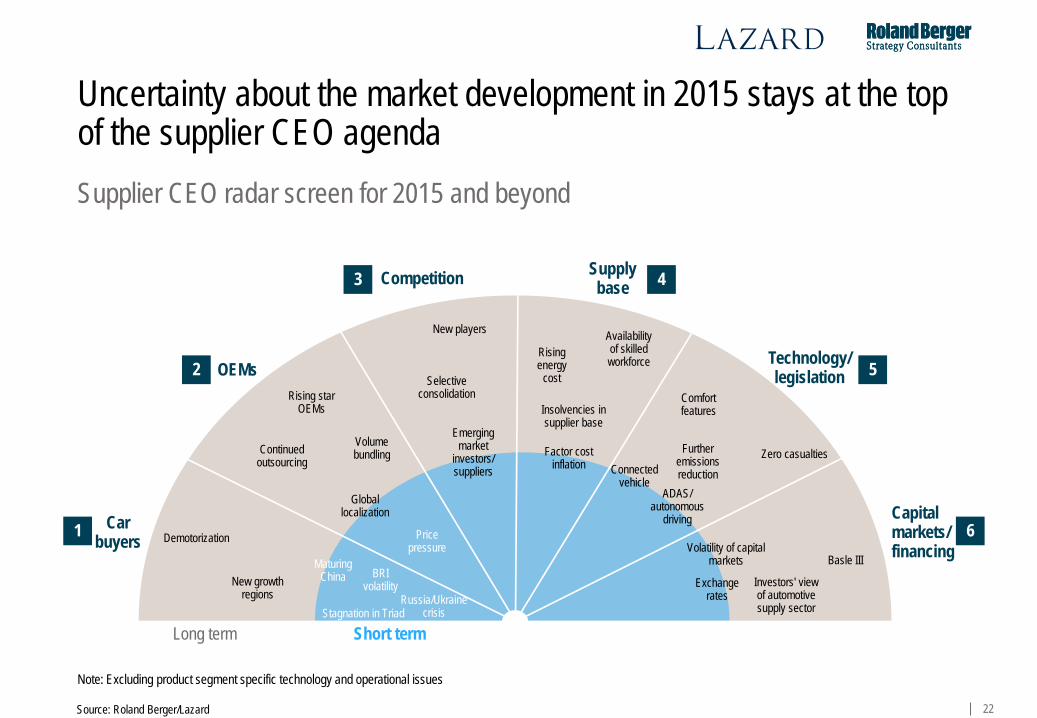
Uncertainty about the market development in 2015 stays at the top of the supplier CEO agenda
Source: Roland Berger/Lazard
Note: Excluding product segment specific technology and operational issues
Supplier CEO radar screen for 2015 and beyond
Car buyers
OEMs
Competition Supply base
Capital markets/ financing
Technology/ legislation
Long term Short term
1
2
3 4
5
6
Investors' view of automotive supply sector
Volatility of capital markets Basle III
Zero casualties
Rising energy
cost
Availability of skilled workforce
Insolvencies in supplier base
Factor cost inflation
Selective consolidation
BRI volatility
Rising star OEMs
Maturing China
Global localization
Price pressure
Volume bundling
Emerging market
investors/ suppliers
New growth regions
Continued outsourcing
ADAS/ autonomous
driving
Further emissions reduction
Comfort features
New players
Exchange rates
Demotorization
Connected vehicle
Stagnation in Triad Russia/Ukraine
crisis
23
2016e
94.3
91.2
3.1
2014e
88.0
2011
76.9 0.4
87.6
2011 ➔ 2014 2014 ➔ 2016
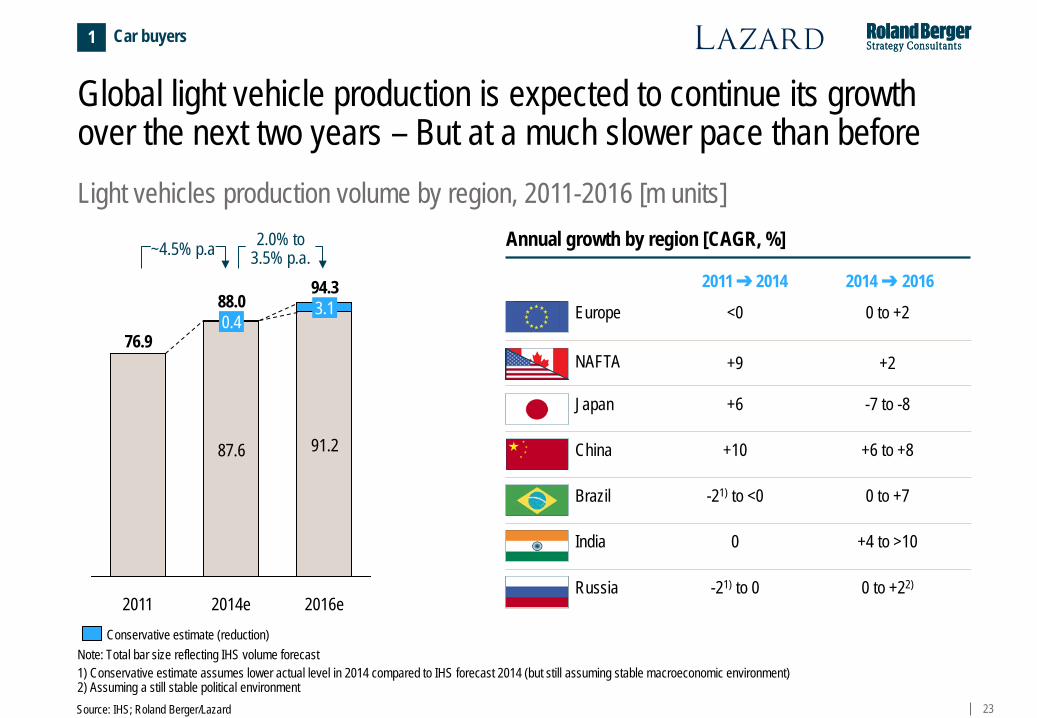
Global light vehicle production is expected to continue its growth over the next two years – But at a much slower pace than before
Source: IHS; Roland Berger/Lazard
Light vehicles production volume by region, 2011-2016 [m units]
1) Conservative estimate assumes lower actual level in 2014 compared to IHS forecast 2014 (but still assuming stable macroeconomic environment) 2) Assuming a still stable political environment
Annual growth by region [CAGR, %]
Europe
NAFTA
Japan
China
Russia
<0
+9
+6
+10
-21) to 0
0 to +2
+2
-7 to -8
+6 to +8
India 0 +4 to >10
Brazil -21) to <0 0 to +7
0 to +22)
Note: Total bar size reflecting IHS volume forecast
Car buyers
Conservative estimate (reduction)
1
~4.5% p.a 2.0% to 3.5% p.a.
24
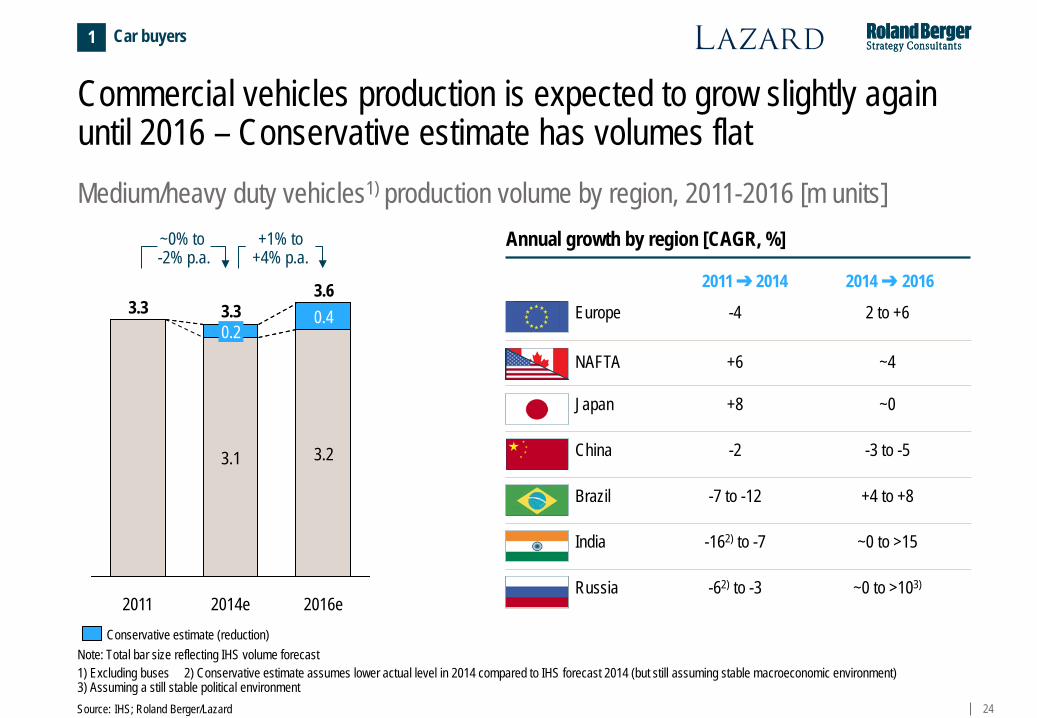
Commercial vehicles production is expected to grow slightly again until 2016 – Conservative estimate has volumes flat Medium/heavy duty vehicles1) production volume by region, 2011-2016 [m units]
1) Excluding buses 2) Conservative estimate assumes lower actual level in 2014 compared to IHS forecast 2014 (but still assuming stable macroeconomic environment) 3) Assuming a still stable political environment
Annual growth by region [CAGR, %]
Europe
NAFTA
Japan
China
Russia
-4
+6
+8
-2
-62) to -3
2 to +6
~4
~0
-3 to -5
India -162) to -7 ~0 to >15
Brazil -7 to -12 +4 to +8
~0 to >103)
2011 ➔ 2014 2014 ➔ 2016
2016e
3.6
2014e
3.3
2011
3.3 0.4
3.1
0.2
3.2
Car buyers 1
Conservative estimate (reduction) Note: Total bar size reflecting IHS volume forecast
~0% to -2% p.a.
+1% to +4% p.a.
Source: IHS; Roland Berger/Lazard
25 Source: Press; Roland Berger/Lazard
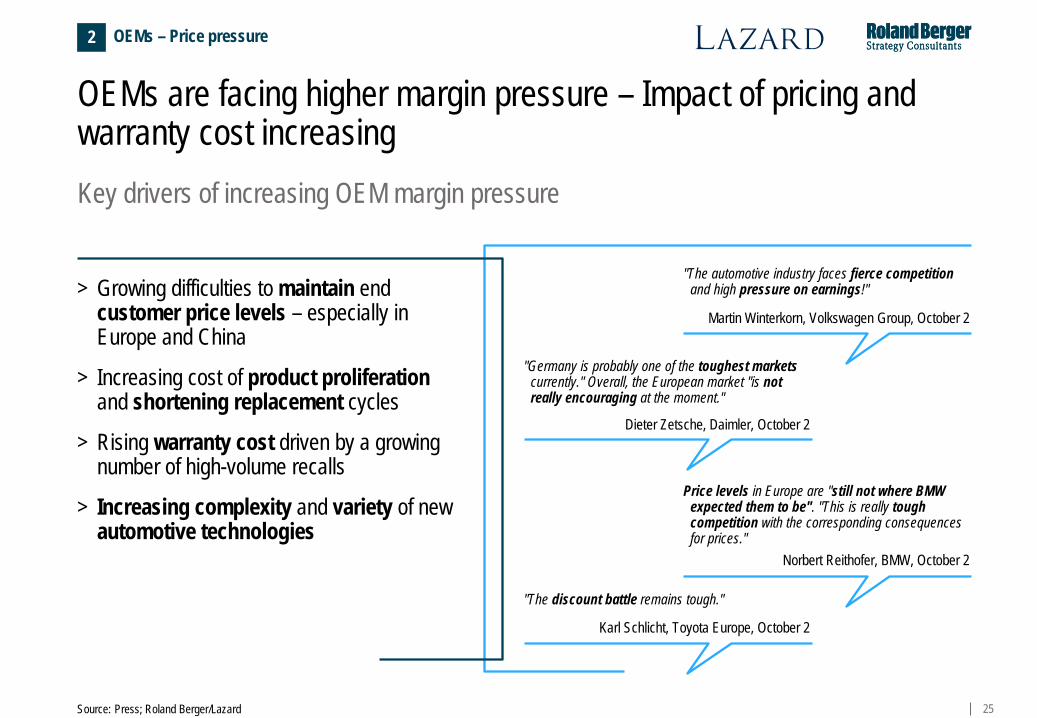
Key drivers of increasing OEM margin pressure
OEMs are facing higher margin pressure – Impact of pricing and warranty cost increasing
> Growing difficulties to maintain end customer price levels – especially in Europe and China
> Increasing cost of product proliferation and shortening replacement cycles
> Rising warranty cost driven by a growing number of high-volume recalls
> Increasing complexity and variety of new automotive technologies
"The automotive industry faces fierce competition and high pressure on earnings!"
Martin Winterkorn, Volkswagen Group, October 2
Price levels in Europe are "still not where BMW expected them to be". "This is really tough competition with the corresponding consequences for prices."
Norbert Reithofer, BMW, October 2
"The discount battle remains tough." Karl Schlicht, Toyota Europe, October 2
"Germany is probably one of the toughest markets currently." Overall, the European market "is not really encouraging at the moment."
Dieter Zetsche, Daimler, October 2
OEMs – Price pressure 2
26
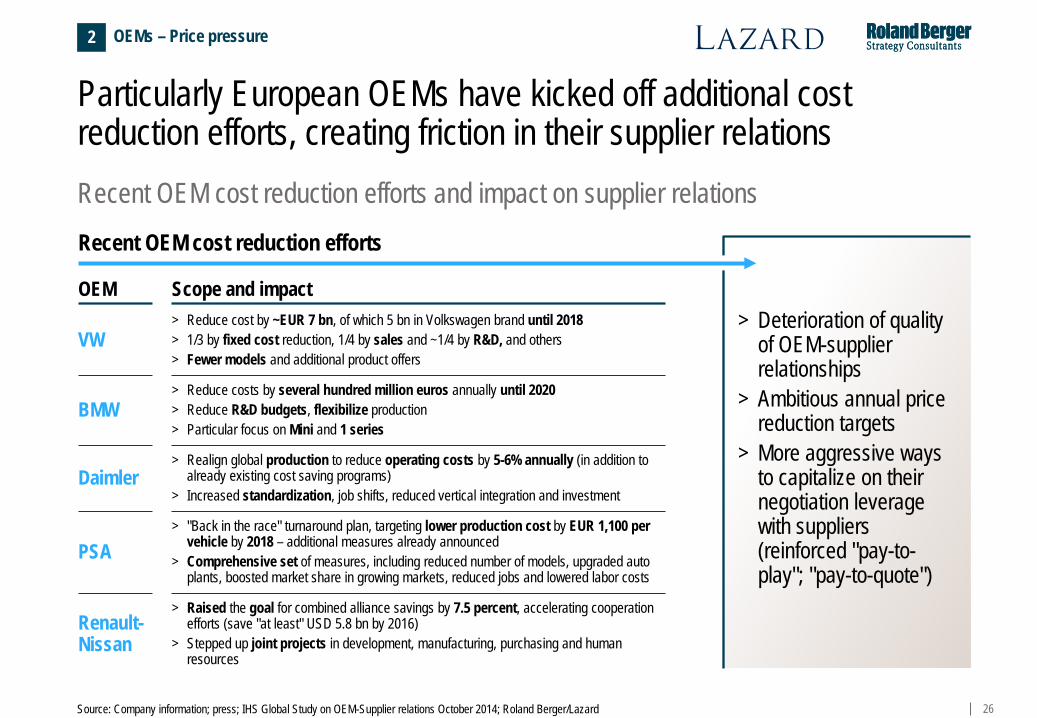
Recent OEM cost reduction efforts and impact on supplier relations
Particularly European OEMs have kicked off additional cost reduction efforts, creating friction in their supplier relations
Source: Company information; press; IHS Global Study on OEM-Supplier relations October 2014; Roland Berger/Lazard
OEM
Recent OEM cost reduction efforts
> Reduce cost by ~EUR 7 bn, of which 5 bn in Volkswagen brand until 2018 > 1/3 by fixed cost reduction, 1/4 by sales and ~1/4 by R&D, and others > Fewer models and additional product offers
> Deterioration of quality
of OEM-supplier relationships
> Ambitious annual price reduction targets
> More aggressive ways to capitalize on their negotiation leverage with suppliers (reinforced "pay-to-play"; "pay-to-quote")
Scope and impact
> Reduce costs by several hundred million euros annually until 2020 > Reduce R&D budgets, flexibilize production > Particular focus on Mini and 1 series
> Realign global production to reduce operating costs by 5-6% annually (in addition to already existing cost saving programs)
> Increased standardization, job shifts, reduced vertical integration and investment
> "Back in the race" turnaround plan, targeting lower production cost by EUR 1,100 per vehicle by 2018 – additional measures already announced
> Comprehensive set of measures, including reduced number of models, upgraded auto plants, boosted market share in growing markets, reduced jobs and lowered labor costs
> Raised the goal for combined alliance savings by 7.5 percent, accelerating cooperation efforts (save "at least" USD 5.8 bn by 2016)
> Stepped up joint projects in development, manufacturing, purchasing and human resources
OEMs – Price pressure 2
VW
BMW
Daimler
PSA
Renault-Nissan
27
C. The long-term challenge – An industry structure fundamentally changing
28
The strategic long-term challenge: Both opportunities and risks for auto suppliers have never been so high
Source: Roland Berger/Lazard
Summary of opportunities and risks from changing industry structure
> The automotive supplier industry is facing a period of constant change – Customer demand, OEMs production and sourcing strategies, technological (r)evolution, enforced legislation, new competitors all contribute to that change
> Most of those developments are not fundamentally new – But the magnitude with which they are going to impact automotive suppliers at the same time over the coming years is unprecedented
> Those changes come with a higher degree of uncertainty – Technological roadmaps are far from being clear for certain components/systems, and long-trusted relationships with OEM customers might end up being sacrificed in the battle for new global program awards
> For automotive suppliers, this environment yields an ever higher number of both opportunities and risks – Those players that focus on the winning product, customer and regional mix (and are prepared to undertake the required upfront efforts) can hugely benefit from overall volume growth, a higher value add and incremental margin potentials from innovative technologies
> By contrast, even a single wrong decision can have a deteriorating impact – Those suppliers that are unable to keep pace (due to strategic, managerial or financial reasons) will be left behind
29
Technology/ legislation
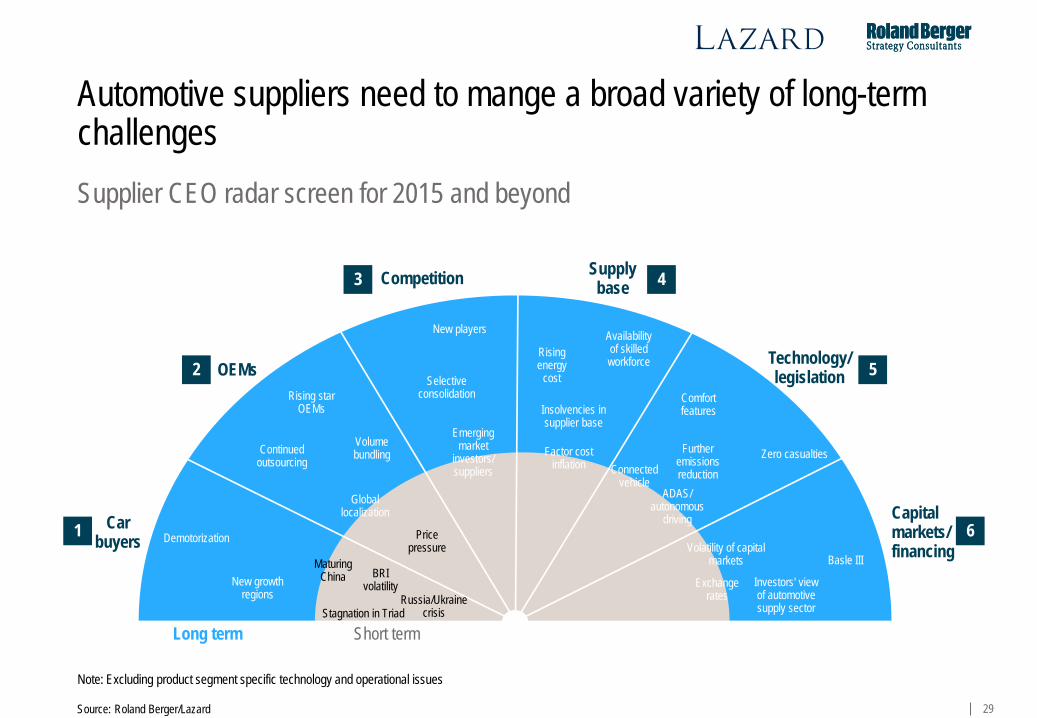
Automotive suppliers need to mange a broad variety of long-term challenges
Note: Excluding product segment specific technology and operational issues
Supplier CEO radar screen for 2015 and beyond
Car buyers
OEMs
Competition Supply base
Capital markets/ financing
Long term Short term
1
2
3 4
5
6
Investors' view of automotive supply sector
Basle III
Zero casualties
Rising energy
cost
Availability of skilled workforce
Insolvencies in supplier base
Factor cost inflation
Selective consolidation
BRI volatility
Rising star OEMs
Maturing China
Stagnation in Triad
Global localization
Price pressure
Volume bundling
Emerging market
investors/ suppliers
New growth regions
Continued outsourcing
ADAS/ autonomous
driving
Further emissions reduction
Comfort features
New players
Demotorization
Russia/Ukraine crisis
Connected vehicle
Source: Roland Berger/Lazard
Volatility of capital markets
Exchange rates
30 Source: Roland Berger/Lazard
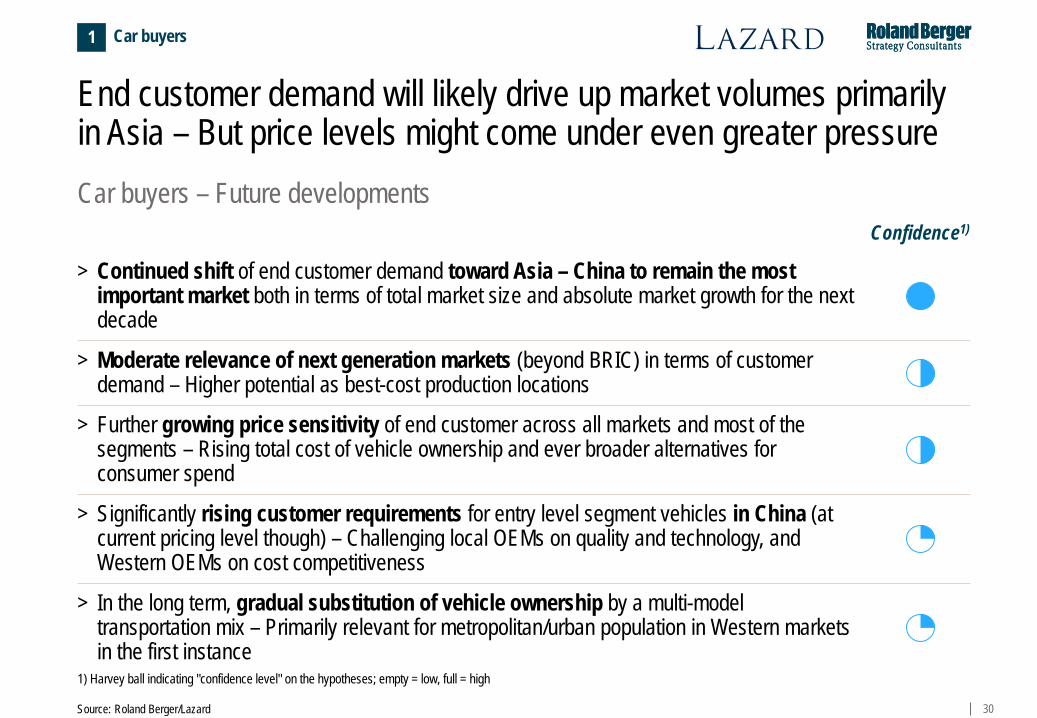
Car buyers – Future developments
End customer demand will likely drive up market volumes primarily in Asia – But price levels might come under even greater pressure
1) Harvey ball indicating "confidence level" on the hypotheses; empty = low, full = high
> Continued shift of end customer demand toward Asia – China to remain the most important market both in terms of total market size and absolute market growth for the next decade
> Significantly rising customer requirements for entry level segment vehicles in China (at current pricing level though) – Challenging local OEMs on quality and technology, and Western OEMs on cost competitiveness
> Further growing price sensitivity of end customer across all markets and most of the segments – Rising total cost of vehicle ownership and ever broader alternatives for consumer spend
> Moderate relevance of next generation markets (beyond BRIC) in terms of customer demand – Higher potential as best-cost production locations
> In the long term, gradual substitution of vehicle ownership by a multi-model transportation mix – Primarily relevant for metropolitan/urban population in Western markets in the first instance
Confidence1)
Car buyers 1
31 Source: Roland Berger/Lazard
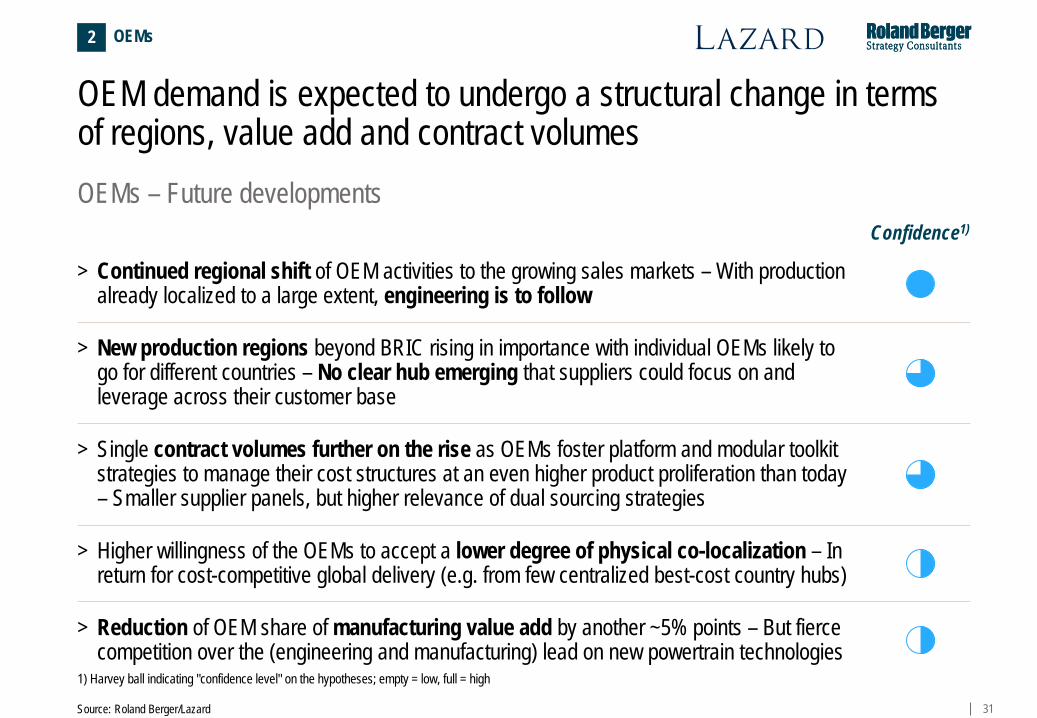
OEMs – Future developments
OEM demand is expected to undergo a structural change in terms of regions, value add and contract volumes
1) Harvey ball indicating "confidence level" on the hypotheses; empty = low, full = high
> Continued regional shift of OEM activities to the growing sales markets – With production already localized to a large extent, engineering is to follow
> New production regions beyond BRIC rising in importance with individual OEMs likely to go for different countries – No clear hub emerging that suppliers could focus on and leverage across their customer base
> Single contract volumes further on the rise as OEMs foster platform and modular toolkit strategies to manage their cost structures at an even higher product proliferation than today – Smaller supplier panels, but higher relevance of dual sourcing strategies
> Higher willingness of the OEMs to accept a lower degree of physical co-localization – In return for cost-competitive global delivery (e.g. from few centralized best-cost country hubs)
> Reduction of OEM share of manufacturing value add by another ~5% points – But fierce competition over the (engineering and manufacturing) lead on new powertrain technologies
Confidence1)
OEMs 2
32 Source: Roland Berger/Lazard
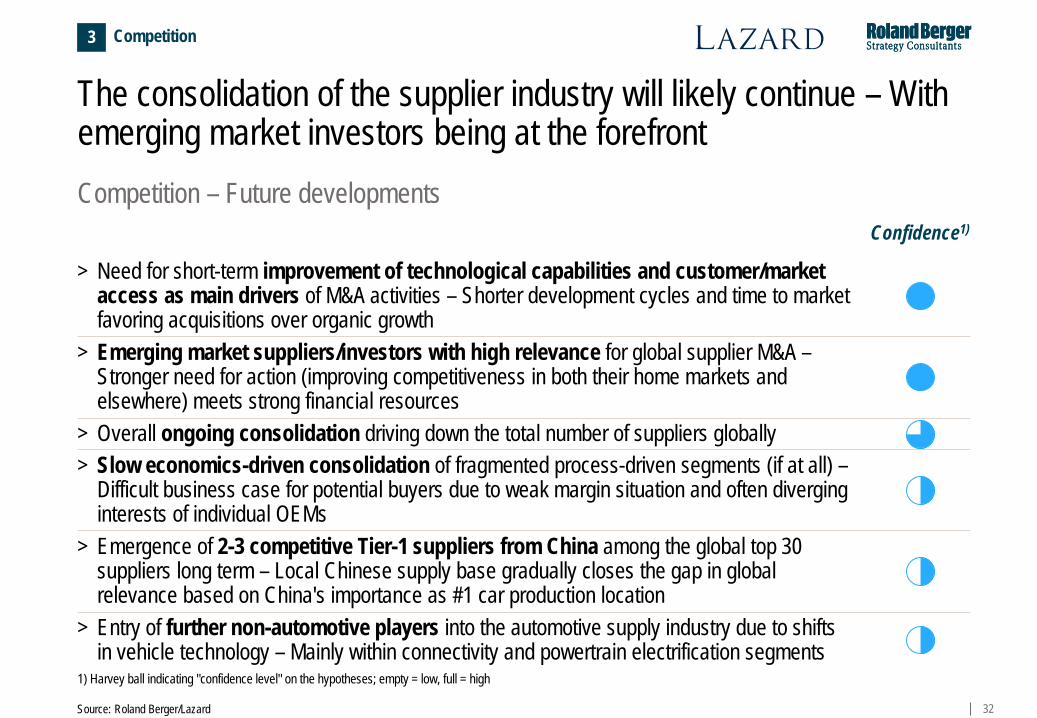
Competition – Future developments
The consolidation of the supplier industry will likely continue – With emerging market investors being at the forefront
1) Harvey ball indicating "confidence level" on the hypotheses; empty = low, full = high
> Overall ongoing consolidation driving down the total number of suppliers globally
> Need for short-term improvement of technological capabilities and customer/market access as main drivers of M&A activities – Shorter development cycles and time to market favoring acquisitions over organic growth
> Entry of further non-automotive players into the automotive supply industry due to shifts in vehicle technology – Mainly within connectivity and powertrain electrification segments
> Emerging market suppliers/investors with high relevance for global supplier M&A – Stronger need for action (improving competitiveness in both their home markets and elsewhere) meets strong financial resources
> Slow economics-driven consolidation of fragmented process-driven segments (if at all) – Difficult business case for potential buyers due to weak margin situation and often diverging interests of individual OEMs
> Emergence of 2-3 competitive Tier-1 suppliers from China among the global top 30 suppliers long term – Local Chinese supply base gradually closes the gap in global relevance based on China's importance as #1 car production location
Confidence1)
Competition 3
33 Source: Roland Berger/Lazard
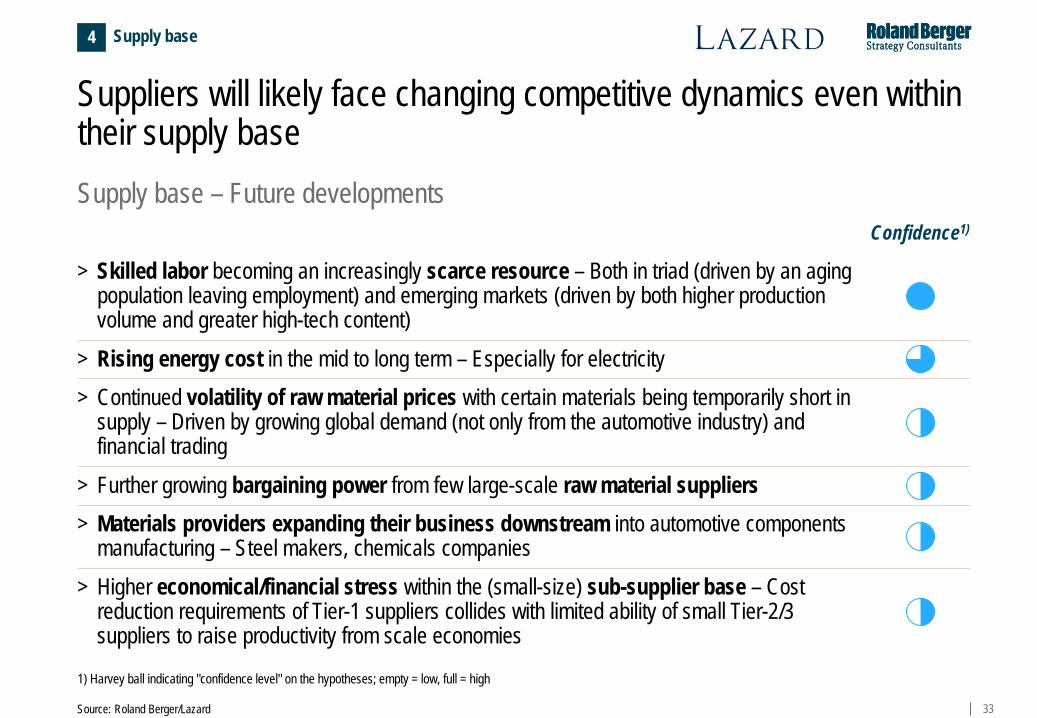
Supply base – Future developments
Suppliers will likely face changing competitive dynamics even within their supply base
1) Harvey ball indicating "confidence level" on the hypotheses; empty = low, full = high
Supply base 4
> Continued volatility of raw material prices with certain materials being temporarily short in supply – Driven by growing global demand (not only from the automotive industry) and financial trading
> Further growing bargaining power from few large-scale raw material suppliers > Materials providers expanding their business downstream into automotive components
manufacturing – Steel makers, chemicals companies > Higher economical/financial stress within the (small-size) sub-supplier base – Cost
reduction requirements of Tier-1 suppliers collides with limited ability of small Tier-2/3 suppliers to raise productivity from scale economies
> Rising energy cost in the mid to long term – Especially for electricity
Confidence1)
> Skilled labor becoming an increasingly scarce resource – Both in triad (driven by an aging population leaving employment) and emerging markets (driven by both higher production volume and greater high-tech content)
34 Source: Roland Berger/Lazard
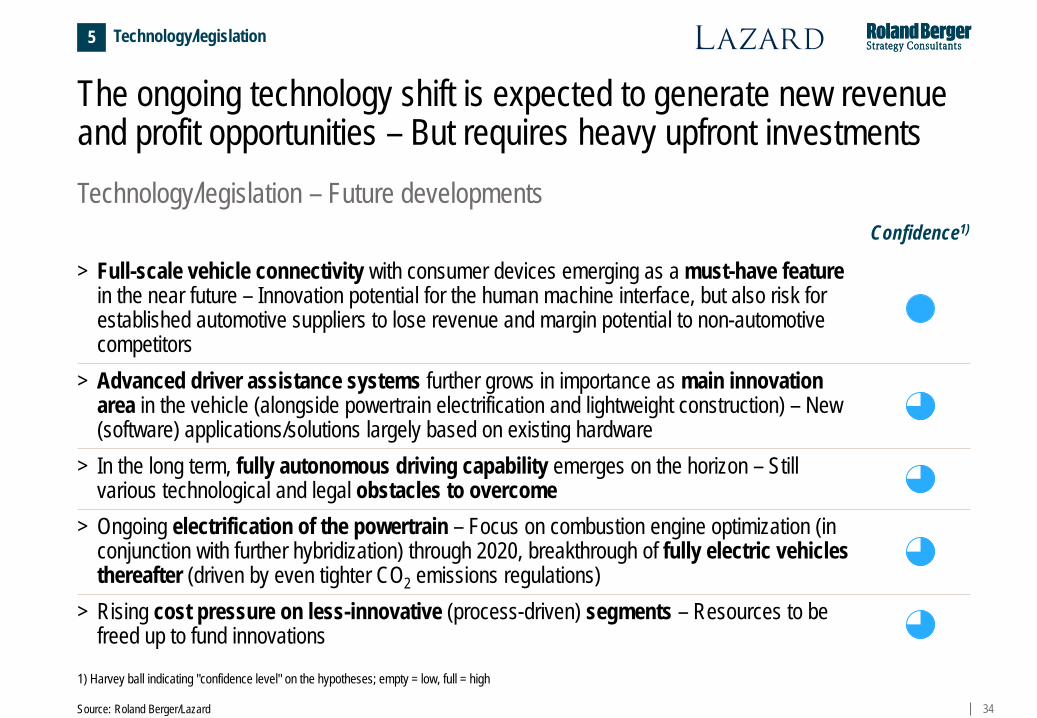
Technology/legislation – Future developments
The ongoing technology shift is expected to generate new revenue and profit opportunities – But requires heavy upfront investments
1) Harvey ball indicating "confidence level" on the hypotheses; empty = low, full = high
> Full-scale vehicle connectivity with consumer devices emerging as a must-have feature in the near future – Innovation potential for the human machine interface, but also risk for established automotive suppliers to lose revenue and margin potential to non-automotive competitors
> Advanced driver assistance systems further grows in importance as main innovation area in the vehicle (alongside powertrain electrification and lightweight construction) – New (software) applications/solutions largely based on existing hardware
> In the long term, fully autonomous driving capability emerges on the horizon – Still various technological and legal obstacles to overcome
> Ongoing electrification of the powertrain – Focus on combustion engine optimization (in conjunction with further hybridization) through 2020, breakthrough of fully electric vehicles thereafter (driven by even tighter CO2 emissions regulations)
> Rising cost pressure on less-innovative (process-driven) segments – Resources to be freed up to fund innovations
Confidence1)
Technology/legislation 5
35 Source: Roland Berger/Lazard
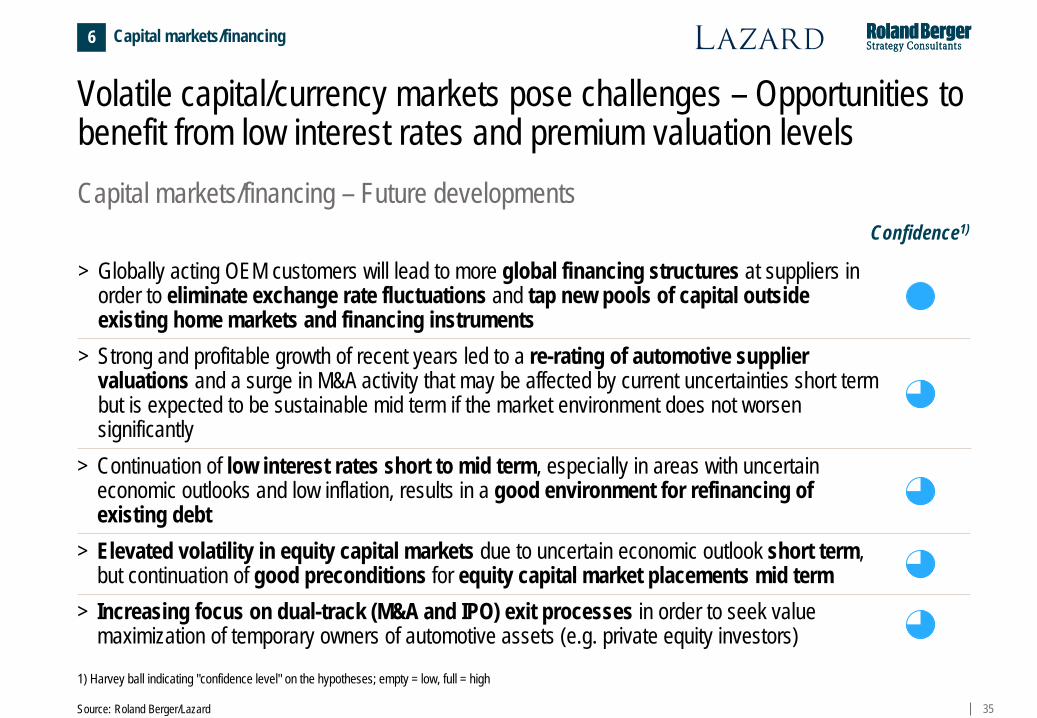
Volatile capital/currency markets pose challenges – Opportunities to benefit from low interest rates and premium valuation levels
1) Harvey ball indicating "confidence level" on the hypotheses; empty = low, full = high
> Continuation of low interest rates short to mid term, especially in areas with uncertain economic outlooks and low inflation, results in a good environment for refinancing of existing debt
> Elevated volatility in equity capital markets due to uncertain economic outlook short term, but continuation of good preconditions for equity capital market placements mid term
> Increasing focus on dual-track (M&A and IPO) exit processes in order to seek value maximization of temporary owners of automotive assets (e.g. private equity investors)
> Globally acting OEM customers will lead to more global financing structures at suppliers in order to eliminate exchange rate fluctuations and tap new pools of capital outside existing home markets and financing instruments
Confidence1)
Capital markets/financing 6
Capital markets/financing – Future developments
> Strong and profitable growth of recent years led to a re-rating of automotive supplier valuations and a surge in M&A activity that may be affected by current uncertainties short term but is expected to be sustainable mid term if the market environment does not worsen significantly
36
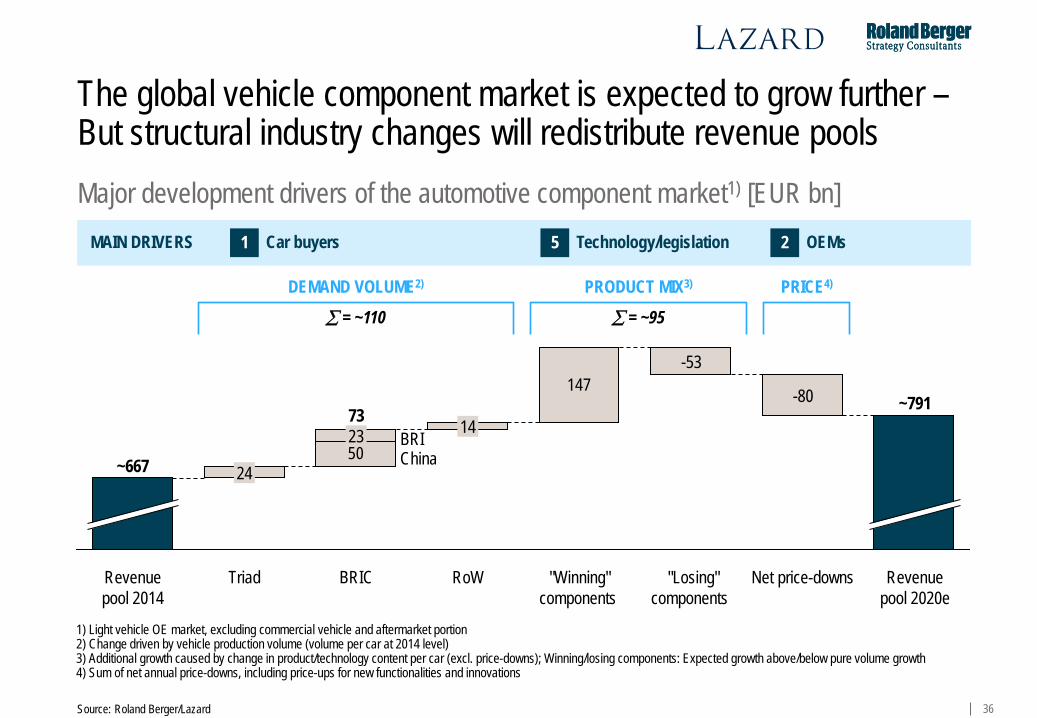
The global vehicle component market is expected to grow further – But structural industry changes will redistribute revenue pools
147
50
Triad BRIC
73
"Winning" components
Net price-downs
~791 -80
-53
"Losing" components
Revenue pool 2020e
14
RoW
23
24
Revenue pool 2014
~667
DEMAND VOLUME2) PRODUCT MIX3) PRICE4)
∑ = ~110 ∑ = ~95
1) Light vehicle OE market, excluding commercial vehicle and aftermarket portion 2) Change driven by vehicle production volume (volume per car at 2014 level) 3) Additional growth caused by change in product/technology content per car (excl. price-downs); Winning/losing components: Expected growth above/below pure volume growth 4) Sum of net annual price-downs, including price-ups for new functionalities and innovations
Major development drivers of the automotive component market1) [EUR bn] MAIN DRIVERS Car buyers 1 Technology/legislation 5 OEMs 2
Source: Roland Berger/Lazard
BRI China
37
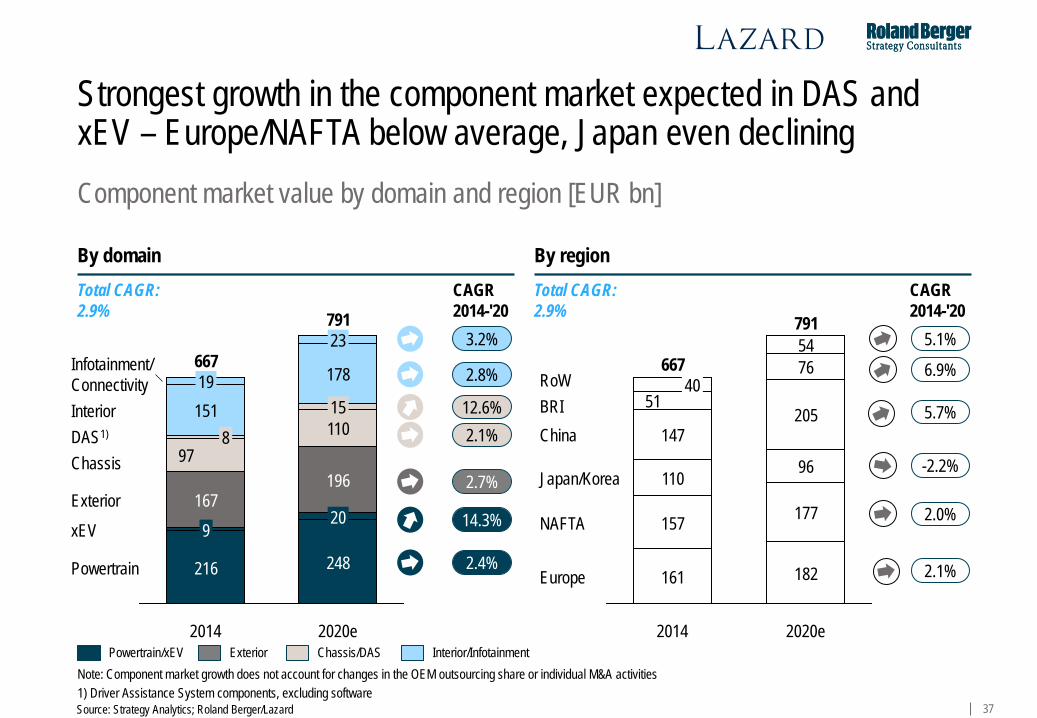
Strongest growth in the component market expected in DAS and xEV – Europe/NAFTA below average, Japan even declining Component market value by domain and region [EUR bn]
Source: Strategy Analytics; Roland Berger/Lazard
Note: Component market growth does not account for changes in the OEM outsourcing share or individual M&A activities
667
216
9 167
97 110 15
178
23
2014
8 151 19
Powertrain
xEV
2020e
791
248
20
196 Exterior
Chassis DAS1) Interior
Infotainment/ Connectivity
12.6%
2.7%
3.2%
14.3%
CAGR
2014-'20
2.8%
2.1%
2.4%
Powertrain/xEV Exterior Chassis/DAS Interior/Infotainment
By domain By region
177
205
76 54
BRI RoW
2020e
791
182
China
Europe
NAFTA
Japan/Korea 110
2014
667
161
157
147
51 40
96
CAGR
2014-'20
2.1%
-2.2%
6.9%
2.0%
5.7%
5.1%
Total CAGR: 2.9%
Total CAGR: 2.9%
1) Driver Assistance System components, excluding software
38
D. The conclusion – Key actions for automotive suppliers
39
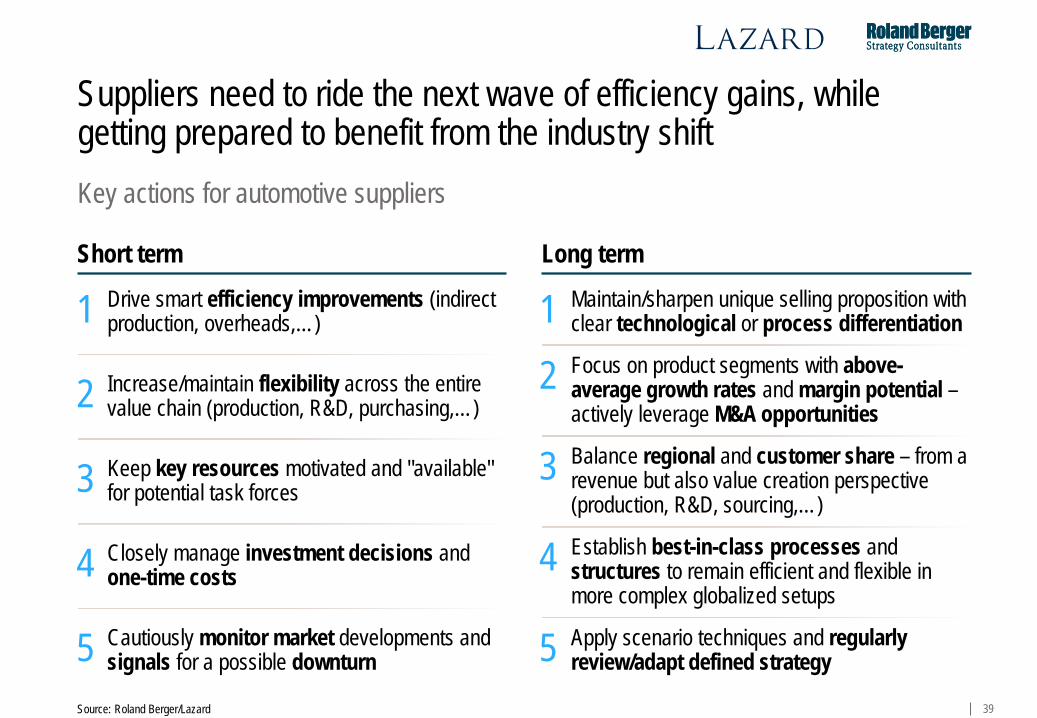
Key actions for automotive suppliers
Source: Roland Berger/Lazard
Drive smart efficiency improvements (indirect production, overheads,…) 1
Increase/maintain flexibility across the entire value chain (production, R&D, purchasing,…) 2
Keep key resources motivated and "available" for potential task forces 3
Closely manage investment decisions and one-time costs 4
Cautiously monitor market developments and signals for a possible downturn 5
Short term Long term Maintain/sharpen unique selling proposition with clear technological or process differentiation 1 Focus on product segments with above-average growth rates and margin potential – actively leverage M&A opportunities
2
Balance regional and customer share – from a revenue but also value creation perspective (production, R&D, sourcing,…)
3
Establish best-in-class processes and structures to remain efficient and flexible in more complex globalized setups
4
Apply scenario techniques and regularly review/adapt defined strategy 5
Suppliers need to ride the next wave of efficiency gains, while getting prepared to benefit from the industry shift
40
This presentation was prepared by Lazard & Co. GmbH ("Lazard") and Roland Berger Strategy Consultants ("RBSC") exclusively for the benefit and internal use of our clients and solely as a basis for discussion of certain topics related to the automotive supplier industry described herein. This presentation is strictly confidential and may not be reproduced, summarized or disclosed, in whole or in part, without the prior written authorization both of Lazard and RBSC, and by accepting this presentation you hereby agree to be bound by the restrictions contained herein.
This presentation is based on publicly available information that has not been independently verified by Lazard or RBSC. Any estimates and projections contained herein involve significant elements of subjective judgment and analysis, which may or may not be correct. Neither Lazard, nor any of its affiliates, nor any of its direct or indirect shareholders, nor any of its or their respective members, employees or agents nor RBSC provides any guarantee or warranty (express or implied) or assumes any responsibility with respect to the authenticity, origin, validity, accuracy or completeness of the information and data contained herein or assumes any obligation for damages, losses or costs (including, without limitation, any direct or consequential losses) resulting from any errors or omissions in this presentation.
The economic estimates, projections and valuations contained in this presentation are necessarily based on current market conditions, which may change significantly over a short period of time. In addition, this presentation contains certain forward-looking statements regarding, among other things, the future financial performance of automotive suppliers which may include projections based on growth strategies, business plans and trends in the automotive sector and global markets. These forward-looking statements are only predictions based on current expectations; the actual future results, levels of activity and/or financial performance of automotive suppliers may differ materially from the predictions contained in this presentation. Changes and events occurring after the date hereof may, therefore, affect the validity of the statements contained in this presentation and neither Lazard nor RBSC assumes any obligation to update and/or revise this presentation or the information and data upon which it has been based.