Embed Size (px)
Citation preview
Volume 20 No. 7 • July 11, 2016 ALL FIGURES IN METRIC TONS
MARKET PULP MONTHLY
& ASSOCIATES INC.Brian McClay
July 2016
INSIDE: Pulp Markets, Economic Notes, Exchange Rates
Bleached Hardwood Kra (BHK)
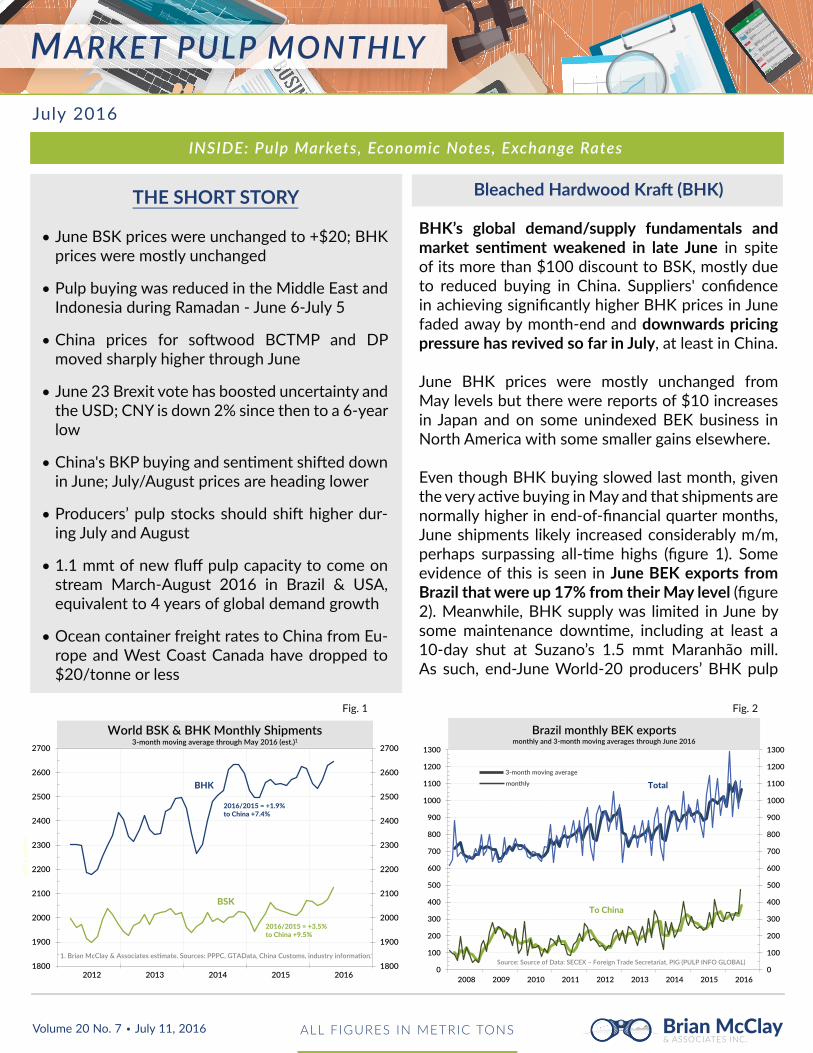
BHK’s global demand/supply fundamentals and market sen ment weakened in late June in spite of its more than $100 discount to BSK, mostly due to reduced buying in China. Suppliers' confi dence in achieving signifi cantly higher BHK prices in June faded away by month-end and downwards pricing pressure has revived so far in July, at least in China.
June BHK prices were mostly unchanged from May levels but there were reports of $10 increases in Japan and on some unindexed BEK business in North America with some smaller gains elsewhere.
Even though BHK buying slowed last month, given the very ac ve buying in May and that shipments are normally higher in end-of-fi nancial quarter months, June shipments likely increased considerably m/m, perhaps surpassing all- me highs (fi gure 1). Some evidence of this is seen in June BEK exports from Brazil that were up 17% from their May level (fi gure 2). Meanwhile, BHK supply was limited in June by some maintenance down me, including at least a 10-day shut at Suzano’s 1.5 mmt Maranhão mill. As such, end-June World-20 producers’ BHK pulp
THE SHORT STORY
June BSK prices were unchanged to +$20; BHK prices were mostly unchanged
Pulp buying was reduced in the Middle East and Indonesia during Ramadan - June 6-July 5
China prices for so wood BCTMP and DP moved sharply higher through June
June 23 Brexit vote has boosted uncertainty and the USD; CNY is down 2% since then to a 6-year low
China's BKP buying and sen ment shi ed down in June; July/August prices are heading lower
Producers’ pulp stocks should shi higher dur-ing July and August
1.1 mmt of new fl uff pulp capacity to come on stream March-August 2016 in Brazil & USA, equivalent to 4 years of global demand growth
Ocean container freight rates to China from Eu-rope and West Coast Canada have dropped to $20/tonne or less
1800
1900
2000
2100
2200
2300
2400
2500
2600
2700
1800
1900
2000
2100
2200
2300
2400
2500
2600
2700
2012 2013 2014 2015 2016
000'
s to
nnes
BHK
BSK
1. Brian McClay & Associates es mate. Sources: PPPC, GTAData, China Customs, industry informa on.
2016/2015 = +3.5%to China +9.5%
2016/2015 = +1.9%to China +7.4%
World BSK & BHK Monthly Shipments3-month moving average through May 2016 (est.)1
Fig. 1
0
100
200
300
400
500
600
700
800
900
1000
1100
1200
1300
0
100
200
300
400
500
600
700
800
900
1000
1100
1200
1300
2008 2009 2010 2011 2012 2013 2014 2015 2016
Source: Source of Data: SECEX – Foreign Trade Secretariat, PIG (PULP INFO GLOBAL)
Total
To China
3-month moving average
monthly
Brazil monthly BEK exportsmonthly and 3-month moving averages through June 2016
Fig. 2
MARKET PULP MONTHLY | JULY 2016
Page 2ALL FIGURES IN METRIC TONS
& ASSOCIATES INC.Brian McClay
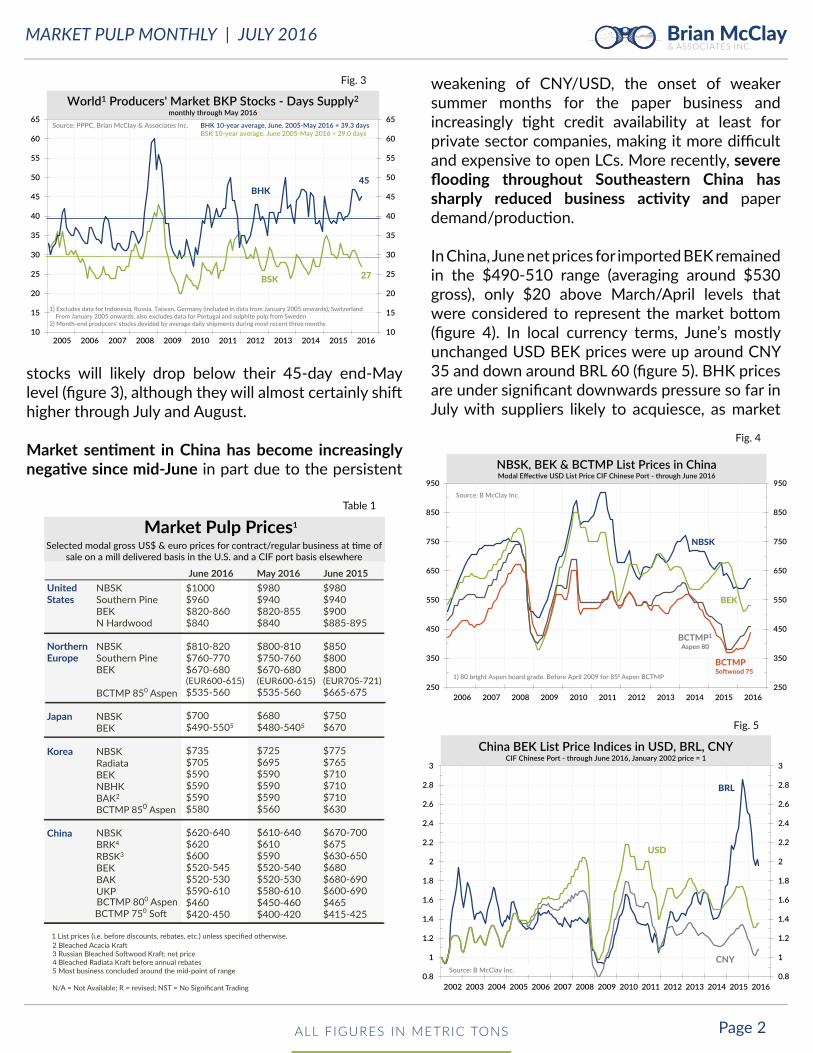
stocks will likely drop below their 45-day end-May level (fi gure 3), although they will almost certainly shi higher through July and August.
Market sen ment in China has become increasingly nega ve since mid-June in part due to the persistent
weakening of CNY/USD, the onset of weaker summer months for the paper business and increasingly ght credit availability at least for private sector companies, making it more diffi cult and expensive to open LCs. More recently, severe fl ooding throughout Southeastern China has sharply reduced business ac vity and paper demand/produc on.
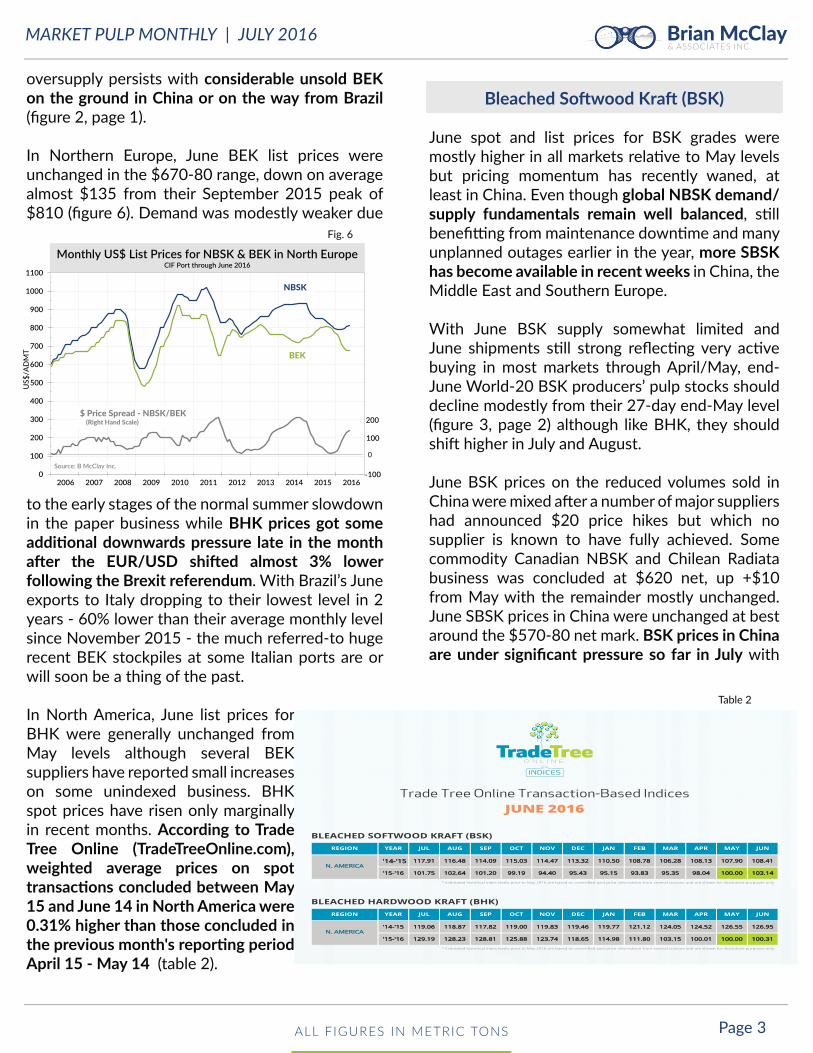
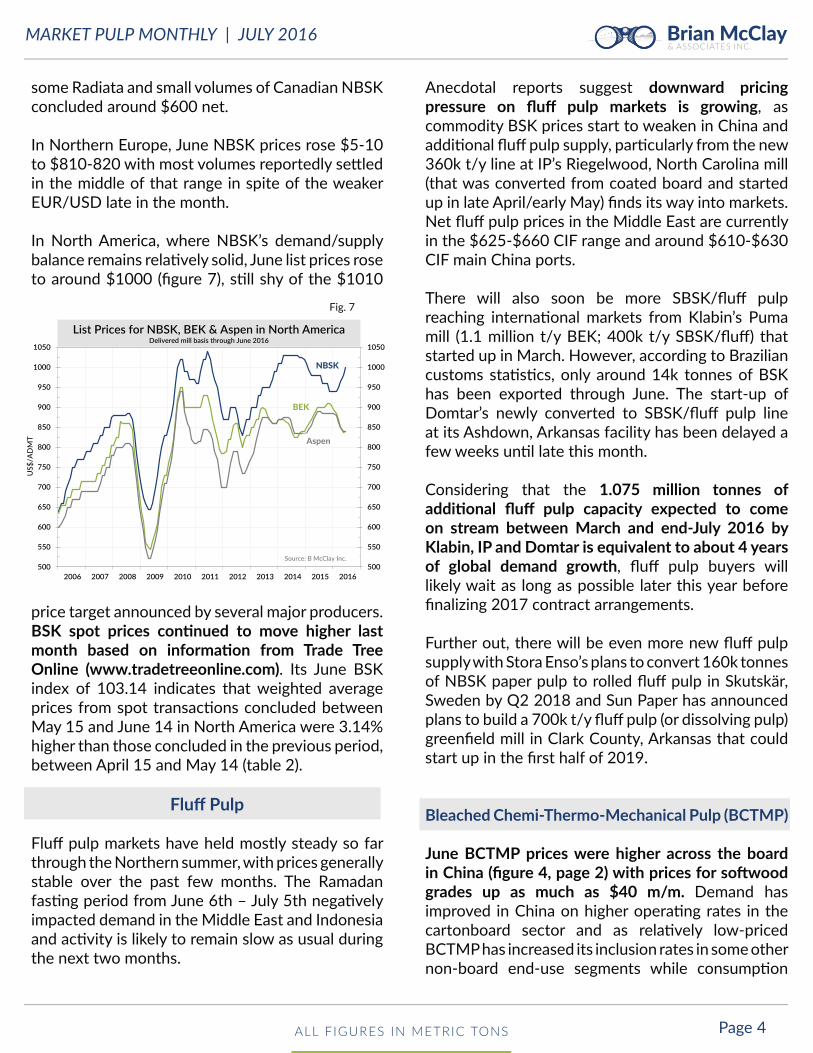
In China, June net prices for imported BEK remained in the $490-510 range (averaging around $530 gross), only $20 above March/April levels that were considered to represent the market bo om (fi gure 4). In local currency terms, June’s mostly unchanged USD BEK prices were up around CNY 35 and down around BRL 60 (fi gure 5). BHK prices are under signifi cant downwards pressure so far in July with suppliers likely to acquiesce, as market
250
350
450
550
650
750
850
950
250
350
450
550
650
750
850
950
2006 2007 2008 2009 2010 2011 2012 2013 2014 2015 2016
NBSK
BEK
BCTMP1
Aspen 80
1) 80 bright Aspen board grade. Before April 2009 for 850 Aspen BCTMP
BCTMPSo wood 75
Source: B McClay Inc.
NBSK, BEK & BCTMP List Prices in ChinaModal E ec ve USD List Price CIF Chinese Port - through June 2016
Fig. 4
10
15
20
25
30
35
40
45
50
55
60
65
10
15
20
25
30
35
40
45
50
55
60
65
2005 2006 2007 2008 2009 2010 2011 2012 2013 2014 2015 2016
BSK
BHK
1) Excludes data for Indonesia, Russia, Taiwan, Germany (included in data from January 2005 onwards), SwitzerlandFrom January 2005 onwards, also excludes data for Portugal and sulphite pulp from Sweden
2) Month-end producers' stocks devided by average daily shipments during most recent three months
BHK 10-year average, June. 2005-May 2016 = 39.3 days BSK 10-year average, June 2005-May 2016 = 29.0 days
Source: PPPC, Brian McClay & Associates Inc.
45
27
World1 Producers' Market BKP Stocks - Days Supply2monthly through May 2016
Fig. 3
United States
Northern Europe
Japan
Korea
China
NBSKSouthern PineBEKN Hardwood
NBSKSouthern PineBEK BCTMP 850 Aspen
NBSKBEK
NBSKRadiataBEKNBHKBAK2
BCTMP 850 Aspen
NBSK BRK4 RBSK3 BEK BAK UKP
June 2016 May 2016 June 2015$1000$960$820-860$840
$810-820$760-770$670-680(EUR600-615)$535-560
$700$490-5505
$735$705$590$590$590$580
$620-640$620$600$520-545$520-530$590-610$460$420-450
$980$940$820-855$840
$800-810$750-760$670-680(EUR600-615)$535-560
$680$480-5405
$725$695$590$590$590$560
$610-640$610$590$520-540$520-530$580-610$450-460$400-420
$980$940$900$885-895
$850$800$800(EUR705-721)$665-675
$750$670
$775$765$710$710$710$630
$670-700$675$630-650 $680$680-690$600-690$465$415-425
Market Pulp Prices1
sale on a mill delivered basis in the U.S. and a CIF port basis elsewhere
5 Most business concluded around the mid-point of range
BCTMP 800 Aspen BCTMP 750
Table 1
Fig. 5
0.8
1
1.2
1.4
1.6
1.8
2
2.2
2.4
2.6
2.8
3
0.8
1
1.2
1.4
1.6
1.8
2
2.2
2.4
2.6
2.8
3
2002 2003 2004 2005 2006 2007 2008 2009 2010 2011 2012 2013 2014 2015 2016
CNY
BRL
Source: B McClay Inc.
USD
China BEK List Price Indices in USD, BRL, CNYCIF Chinese Port - through June 2016, January 2002 price = 1
MARKET PULP MONTHLY | JULY 2016
Page 3ALL FIGURES IN METRIC TONS
& ASSOCIATES INC.Brian McClay
oversupply persists with considerable unsold BEK on the ground in China or on the way from Brazil(fi gure 2, page 1).
In Northern Europe, June BEK list prices were unchanged in the $670-80 range, down on average almost $135 from their September 2015 peak of $810 (fi gure 6). Demand was modestly weaker due
to the early stages of the normal summer slowdown in the paper business while BHK prices got some addi onal downwards pressure late in the month a er the EUR/USD shi ed almost 3% lower following the Brexit referendum. With Brazil’s June exports to Italy dropping to their lowest level in 2 years - 60% lower than their average monthly level since November 2015 - the much referred-to huge recent BEK stockpiles at some Italian ports are or will soon be a thing of the past.
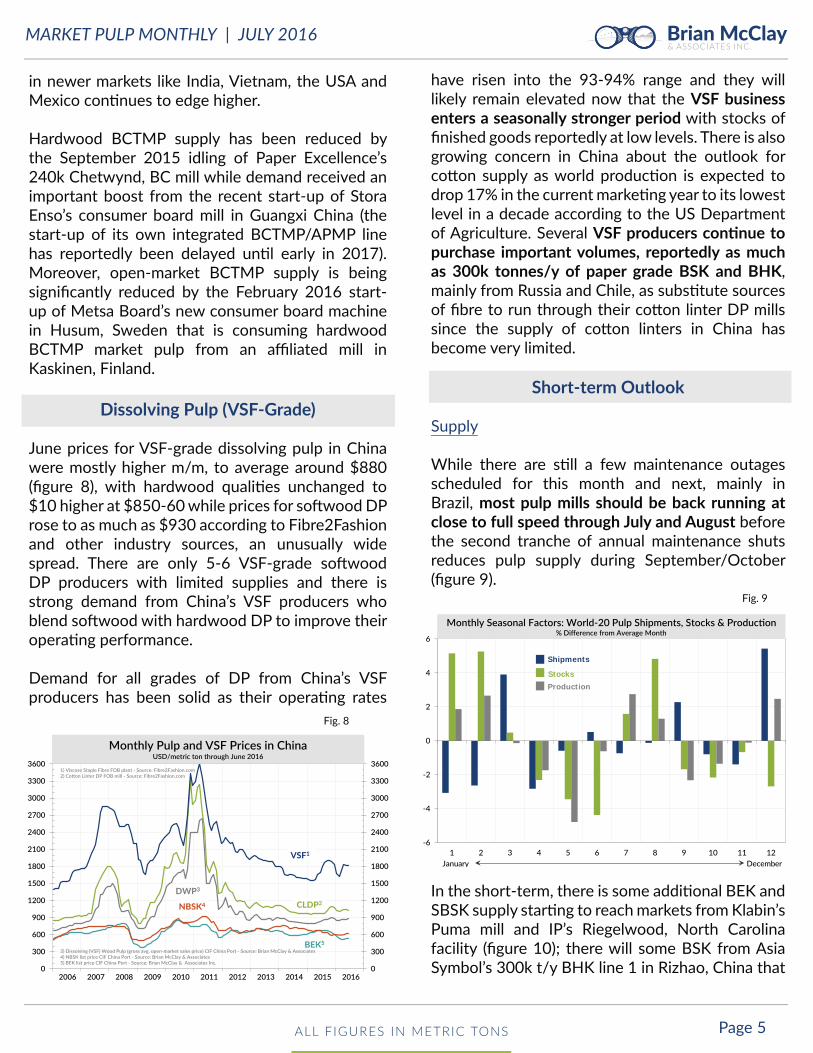
In North America, June list prices for BHK were generally unchanged from May levels although several BEK suppliers have reported small increases on some unindexed business. BHK spot prices have risen only marginally in recent months. According to Trade Tree Online (TradeTreeOnline.com), weighted average prices on spot transac ons concluded between May 15 and June 14 in North America were 0.31% higher than those concluded in the previous month's repor ng period April 15 - May 14 (table 2).
Bleached So wood Kra (BSK)
June spot and list prices for BSK grades were mostly higher in all markets rela ve to May levels but pricing momentum has recently waned, at least in China. Even though global NBSK demand/supply fundamentals remain well balanced, s ll benefi ng from maintenance down me and many unplanned outages earlier in the year, more SBSK has become available in recent weeks in China, the Middle East and Southern Europe.
With June BSK supply somewhat limited and June shipments s ll strong refl ec ng very ac ve buying in most markets through April/May, end-June World-20 BSK producers’ pulp stocks should decline modestly from their 27-day end-May level (fi gure 3, page 2) although like BHK, they should shi higher in July and August.
June BSK prices on the reduced volumes sold in China were mixed a er a number of major suppliers had announced $20 price hikes but which no supplier is known to have fully achieved. Some commodity Canadian NBSK and Chilean Radiata business was concluded at $620 net, up +$10 from May with the remainder mostly unchanged. June SBSK prices in China were unchanged at best around the $570-80 net mark. BSK prices in China are under signifi cant pressure so far in July with
0
100
200
300
400
500
600
700
800
900
1000
1100
2006 2007 2008 2009 2010 2011 2012 2013 2014 2015 2016
US$
/ADMT
NBSK
BEK
0
100
-100
$ Price Spread - NBSK/BEK(Right Hand Scale) 200
Source: B McClay Inc.
Monthly US$ List Prices for NBSK & BEK in North EuropeCIF Port through June 2016
Fig. 6
* Estimated historical index levels prior to May 2016 are based on unverified spot price information from several sources and are shown for illustrative purposes only.
1100.01 100.00103.15111.80114.98118.65123.74125.88128.81128.23129.19 100.31'15-'16
124.52 126.55124.05121.12119.77119.46119.83119.00117.82118.87119.06 126.95'14-'15N. AMERICA
APR MAYMARFEBJANDECNOVOCTSEPAUGJUL JUNYEARREGION
BLEACHED HARDWOOD KRAFT (BHK)
* Estimated historical index levels prior to May 2016 are based on unverified spot price information from several sources and are shown for illustrative purposes only.
98.04 100.0095.3593.8395.1595.4394.4099.19101.20102.64101.75 103.14'15-'16
108.13 107.90106.28108.78110.50113.32114.47115.03114.09116.48117.91 108.41'14-'15N. AMERICA
APR MAYMARFEBJANDECNOVOCTSEPAUGJUL JUNYEARREGION
BLEACHED SOFTWOOD KRAFT (BSK)
JUNE 2016Trade Tree Online Transaction-Based Indices
Table 2
MARKET PULP MONTHLY | JULY 2016
Page 4ALL FIGURES IN METRIC TONS
& ASSOCIATES INC.Brian McClay
some Radiata and small volumes of Canadian NBSK concluded around $600 net.
In Northern Europe, June NBSK prices rose $5-10 to $810-820 with most volumes reportedly se led in the middle of that range in spite of the weaker EUR/USD late in the month.
In North America, where NBSK’s demand/supply balance remains rela vely solid, June list prices rose to around $1000 (fi gure 7), s ll shy of the $1010
price target announced by several major producers. BSK spot prices con nued to move higher last month based on informa on from Trade Tree Online (www.tradetreeonline.com). Its June BSK index of 103.14 indicates that weighted average prices from spot transac ons concluded between May 15 and June 14 in North America were 3.14% higher than those concluded in the previous period, between April 15 and May 14 (table 2).
Fluff Pulp
Fluff pulp markets have held mostly steady so far through the Northern summer, with prices generally stable over the past few months. The Ramadan fas ng period from June 6th – July 5th nega vely impacted demand in the Middle East and Indonesia and ac vity is likely to remain slow as usual during the next two months.
Anecdotal reports suggest downward pricing pressure on fl uff pulp markets is growing, as commodity BSK prices start to weaken in China and addi onal fl uff pulp supply, par cularly from the new 360k t/y line at IP’s Riegelwood, North Carolina mill (that was converted from coated board and started up in late April/early May) fi nds its way into markets. Net fl uff pulp prices in the Middle East are currently in the $625-$660 CIF range and around $610-$630 CIF main China ports.
There will also soon be more SBSK/fl uff pulp reaching interna onal markets from Klabin’s Puma mill (1.1 million t/y BEK; 400k t/y SBSK/fl uff ) that started up in March. However, according to Brazilian customs sta s cs, only around 14k tonnes of BSK has been exported through June. The start-up of Domtar’s newly converted to SBSK/fl uff pulp line at its Ashdown, Arkansas facility has been delayed a few weeks un l late this month.
Considering that the 1.075 million tonnes of addi onal fl uff pulp capacity expected to come on stream between March and end-July 2016 by Klabin, IP and Domtar is equivalent to about 4 years of global demand growth, fl uff pulp buyers will likely wait as long as possible later this year before fi nalizing 2017 contract arrangements.
Further out, there will be even more new fl uff pulp supply with Stora Enso’s plans to convert 160k tonnes of NBSK paper pulp to rolled fl uff pulp in Skutskär, Sweden by Q2 2018 and Sun Paper has announced plans to build a 700k t/y fl uff pulp (or dissolving pulp) greenfi eld mill in Clark County, Arkansas that could start up in the fi rst half of 2019.
Bleached Chemi-Thermo-Mechanical Pulp (BCTMP) June BCTMP prices were higher across the board in China (fi gure 4, page 2) with prices for so wood grades up as much as $40 m/m. Demand has improved in China on higher opera ng rates in the cartonboard sector and as rela vely low-priced BCTMP has increased its inclusion rates in some other non-board end-use segments while consump on
500
550
600
650
700
750
800
850
900
950
1000
1050
500
550
600
650
700
750
800
850
900
950
1000
1050
2006 2007 2008 2009 2010 2011 2012 2013 2014 2015 2016
US$
/ADMT
NBSK
BEK
Aspen
Source: B McClay Inc.
List Prices for NBSK, BEK & Aspen in North AmericaDelivered mill basis through June 2016
Fig. 7
MARKET PULP MONTHLY | JULY 2016
Page 5ALL FIGURES IN METRIC TONS
& ASSOCIATES INC.Brian McClay
in newer markets like India, Vietnam, the USA and Mexico con nues to edge higher.
Hardwood BCTMP supply has been reduced by the September 2015 idling of Paper Excellence’s 240k Chetwynd, BC mill while demand received an important boost from the recent start-up of Stora Enso’s consumer board mill in Guangxi China (the start-up of its own integrated BCTMP/APMP line has reportedly been delayed un l early in 2017). Moreover, open-market BCTMP supply is being signifi cantly reduced by the February 2016 start-up of Metsa Board’s new consumer board machine in Husum, Sweden that is consuming hardwood BCTMP market pulp from an affi liated mill in Kaskinen, Finland.
Dissolving Pulp (VSF-Grade)
June prices for VSF-grade dissolving pulp in China were mostly higher m/m, to average around $880 (fi gure 8), with hardwood quali es unchanged to $10 higher at $850-60 while prices for so wood DP rose to as much as $930 according to Fibre2Fashion and other industry sources, an unusually wide spread. There are only 5-6 VSF-grade so wood DP producers with limited supplies and there is strong demand from China’s VSF producers who blend so wood with hardwood DP to improve their opera ng performance.
Demand for all grades of DP from China’s VSF producers has been solid as their opera ng rates
have risen into the 93-94% range and they will likely remain elevated now that the VSF business enters a seasonally stronger period with stocks of fi nished goods reportedly at low levels. There is also growing concern in China about the outlook for co on supply as world produc on is expected to drop 17% in the current marke ng year to its lowest level in a decade according to the US Department of Agriculture. Several VSF producers con nue to purchase important volumes, reportedly as much as 300k tonnes/y of paper grade BSK and BHK, mainly from Russia and Chile, as subs tute sources of fi bre to run through their co on linter DP mills since the supply of co on linters in China has become very limited.
Short-term Outlook
Supply
While there are s ll a few maintenance outages scheduled for this month and next, mainly in Brazil, most pulp mills should be back running at close to full speed through July and August before the second tranche of annual maintenance shuts reduces pulp supply during September/October (fi gure 9).
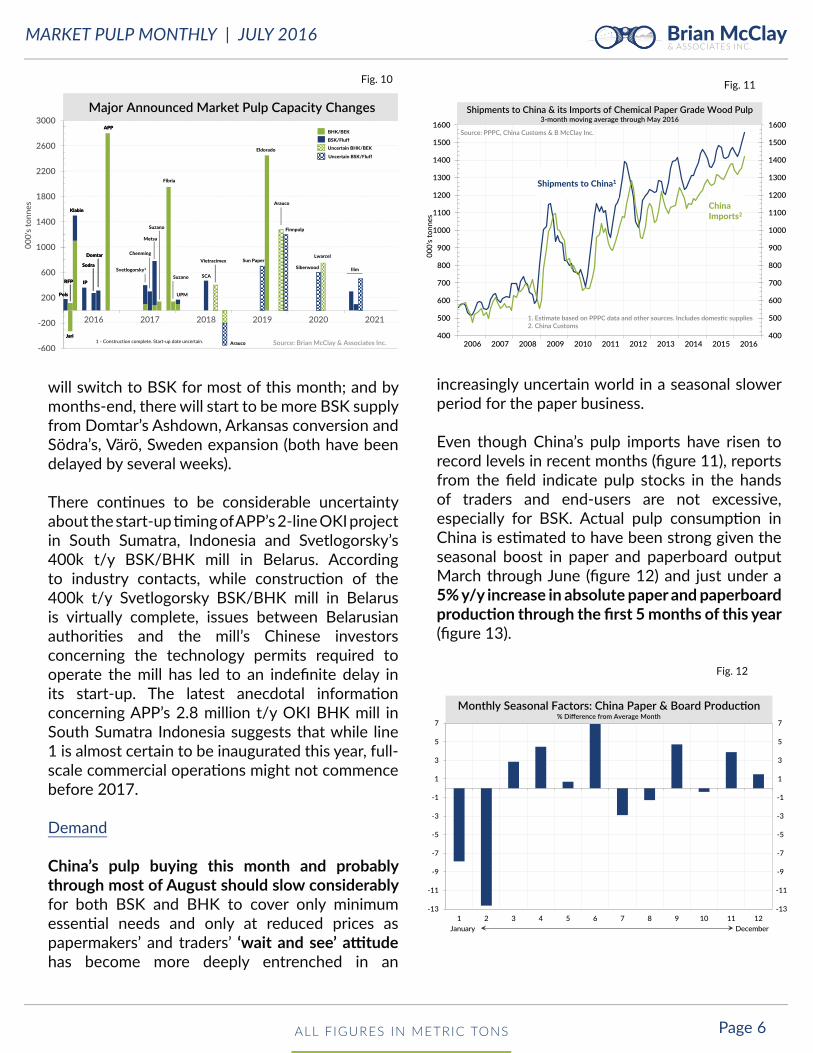
In the short-term, there is some addi onal BEK and SBSK supply star ng to reach markets from Klabin’s Puma mill and IP’s Riegelwood, North Carolina facility (fi gure 10); there will some BSK from Asia Symbol’s 300k t/y BHK line 1 in Rizhao, China that
Fig. 9
-6
-4
-2
0
2
4
6
1 2 3 4 5 6 7 8 9 10 11 12
Shipments
Stocks
January December
Production
Monthly Seasonal Factors: World-20 Pulp Shipments, Stocks & Produc on% Di erence from Average Month
0
300
600
900
1200
1500
1800
2100
2400
2700
3000
3300
3600
0
300
600
900
1200
1500
1800
2100
2400
2700
3000
3300
3600
2006 2007 2008 2009 2010 2011 2012 2013 2014 2015 2016
NBSK4
DWP3
VSF1
CLDP2
1) Viscose Staple Fibre FOB plant - Source: Fibre2Fashion.com 2) Co on Linter DP FOB mill - Source: Fibre2Fashion.com
3) Dissolving (VSF) Wood Pulp (gross avg. open-market sales price) CIF China Port - Source: Brian McClay & Associates4) NBSK list price CIF China Port - Source: Brian McClay & Associates5) BEK list price CIF China Port - Source: Brian McClay & Associates Inc.
BEK5
Monthly Pulp and VSF Prices in ChinaUSD/metric ton through June 2016
Fig. 8
MARKET PULP MONTHLY | JULY 2016
Page 6ALL FIGURES IN METRIC TONS
& ASSOCIATES INC.Brian McClay
will switch to BSK for most of this month; and by months-end, there will start to be more BSK supply from Domtar’s Ashdown, Arkansas conversion and Södra’s, Värö, Sweden expansion (both have been delayed by several weeks).
There con nues to be considerable uncertainty about the start-up ming of APP’s 2-line OKI project in South Sumatra, Indonesia and Svetlogorsky’s 400k t/y BSK/BHK mill in Belarus. According to industry contacts, while construc on of the 400k t/y Svetlogorsky BSK/BHK mill in Belarus is virtually complete, issues between Belarusian authori es and the mill’s Chinese investors concerning the technology permits required to operate the mill has led to an indefi nite delay in its start-up. The latest anecdotal informa on concerning APP’s 2.8 million t/y OKI BHK mill in South Sumatra Indonesia suggests that while line 1 is almost certain to be inaugurated this year, full-scale commercial opera ons might not commence before 2017.
Demand
China’s pulp buying this month and probably through most of August should slow considerably for both BSK and BHK to cover only minimum essen al needs and only at reduced prices as papermakers’ and traders’ ‘wait and see’ a tude has become more deeply entrenched in an
increasingly uncertain world in a seasonal slower period for the paper business.
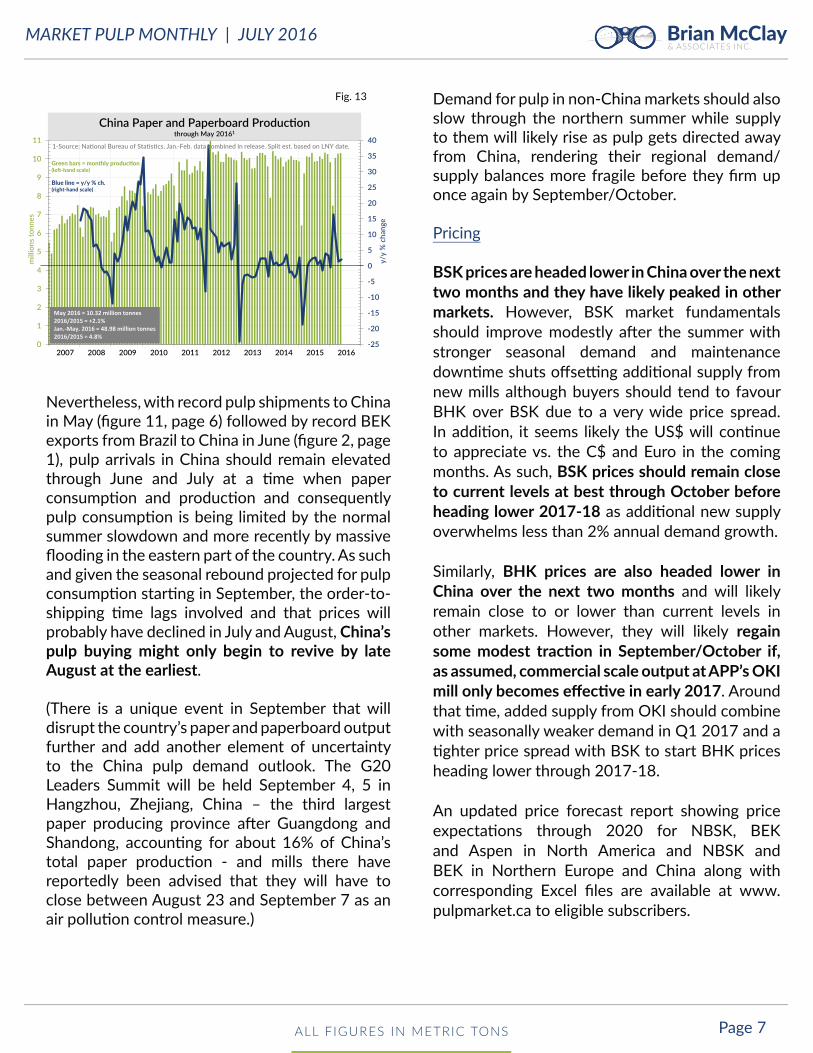
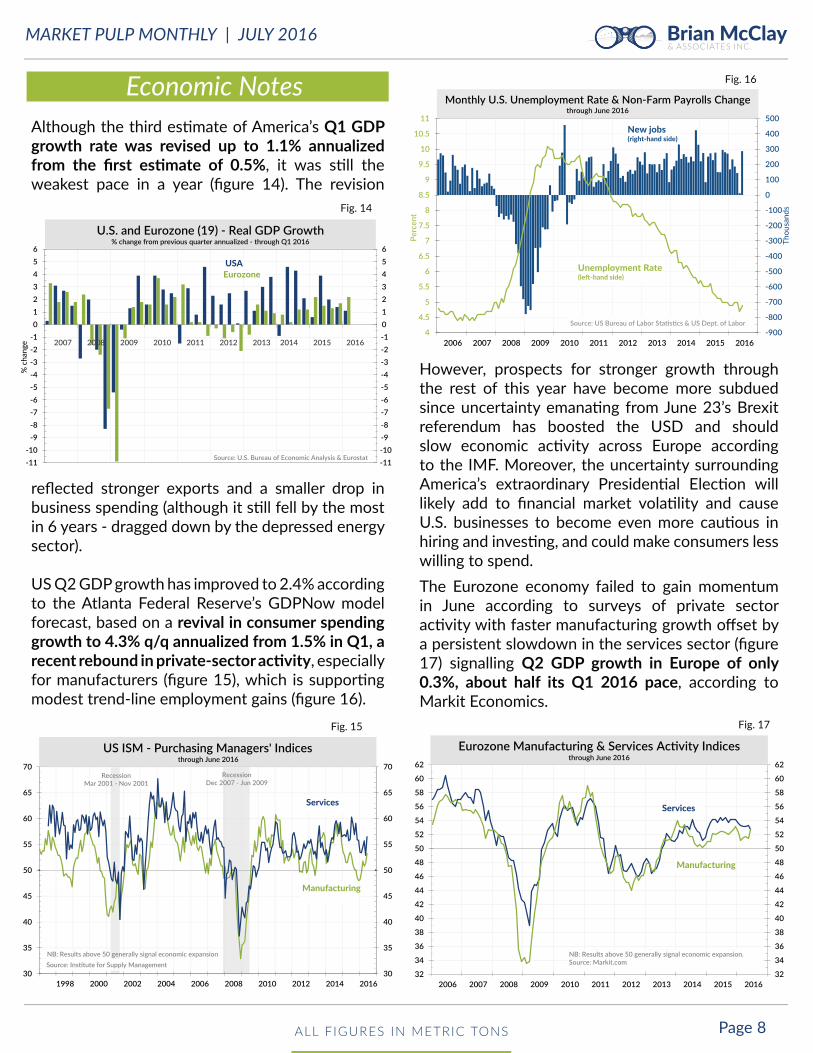
Even though China’s pulp imports have risen to record levels in recent months (fi gure 11), reports from the fi eld indicate pulp stocks in the hands of traders and end-users are not excessive, especially for BSK. Actual pulp consump on in China is es mated to have been strong given the seasonal boost in paper and paperboard output March through June (fi gure 12) and just under a 5% y/y increase in absolute paper and paperboard produc on through the fi rst 5 months of this year (fi gure 13).
Fig. 12
-13
-11
-9
-7
-5
-3
-1
1
3
5
7
-13
-11
-9
-7
-5
-3
-1
1
3
5
7
1 2 3 4 5 6 7 8 9 10 11 12January December
Monthly Seasonal Factors: China Paper & Board Produc on% Di erence from Average Month
Fig. 10
600
200
200
600
1000
1400
1800
2200
2600
3000
2016 2017 2018 2019 2020 2021
000'ston
nes
Pols
Jari
RFP
Klabin
IP
Sodra
Domtar
APP
Metsa
Source: Brian McClay & Associates Inc.
Pols
Jari
RFP
Klabin
IP
Sodra
Domtar
APP
Svetlogorsky1
Chenming
Fibria
Suzano
Suzano SCA
Eldorado
BSK/FluffBHK/BEK
Uncertain BHK/BEK
Uncertain BSK/Fluff
Vietracimex
Arauco
Arauco
Sun Paper
Finnpulp
Siberwood
Lwarcel
Ilim
1 Construction complete. Start up date uncertain.
UPM
Major Announced Market Pulp Capacity Changes
400
500
600
700
800
900
1000
1100
1200
1300
1400
1500
1600
400
500
600
700
800
900
1000
1100
1200
1300
1400
1500
1600
2006 2007 2008 2009 2010 2011 2012 2013 2014 2015 2016
000'
s ton
nes
Shipments to China1
China Imports2
1. Es mate based on PPPC data and other sources. Includes domes c supplies2. China Customs
Source: PPPC, China Customs & B McClay Inc.
Shipments to China & its Imports of Chemical Paper Grade Wood Pulp3-month moving average through May 2016
Fig. 11
MARKET PULP MONTHLY | JULY 2016
Page 7ALL FIGURES IN METRIC TONS
& ASSOCIATES INC.Brian McClay
Nevertheless, with record pulp shipments to China in May (fi gure 11, page 6) followed by record BEK exports from Brazil to China in June (fi gure 2, page 1), pulp arrivals in China should remain elevated through June and July at a me when paper consump on and produc on and consequently pulp consump on is being limited by the normal summer slowdown and more recently by massive fl ooding in the eastern part of the country. As such and given the seasonal rebound projected for pulp consump on star ng in September, the order-to-shipping me lags involved and that prices will probably have declined in July and August, China’s pulp buying might only begin to revive by late August at the earliest.
(There is a unique event in September that will disrupt the country’s paper and paperboard output further and add another element of uncertainty to the China pulp demand outlook. The G20 Leaders Summit will be held September 4, 5 in Hangzhou, Zhejiang, China – the third largest paper producing province a er Guangdong and Shandong, accoun ng for about 16% of China’s total paper produc on - and mills there have reportedly been advised that they will have to close between August 23 and September 7 as an air pollu on control measure.)
Demand for pulp in non-China markets should also slow through the northern summer while supply to them will likely rise as pulp gets directed away from China, rendering their regional demand/supply balances more fragile before they fi rm up once again by September/October.
Pricing
BSK prices are headed lower in China over the next two months and they have likely peaked in other markets. However, BSK market fundamentals should improve modestly a er the summer with stronger seasonal demand and maintenance down me shuts off se ng addi onal supply from new mills although buyers should tend to favour BHK over BSK due to a very wide price spread. In addi on, it seems likely the US$ will con nue to appreciate vs. the C$ and Euro in the coming months. As such, BSK prices should remain close to current levels at best through October before heading lower 2017-18 as addi onal new supply overwhelms less than 2% annual demand growth.
Similarly, BHK prices are also headed lower in China over the next two months and will likely remain close to or lower than current levels in other markets. However, they will likely regain some modest trac on in September/October if, as assumed, commercial scale output at APP’s OKI mill only becomes eff ec ve in early 2017. Around that me, added supply from OKI should combine with seasonally weaker demand in Q1 2017 and a ghter price spread with BSK to start BHK prices
heading lower through 2017-18.
An updated price forecast report showing price expecta ons through 2020 for NBSK, BEK and Aspen in North America and NBSK and BEK in Northern Europe and China along with corresponding Excel fi les are available at www.pulpmarket.ca to eligible subscribers.
-25
-20
-15
-10
-5
0
5
10
15
20
25
30
35
40
0
1
2
3
4
5
6
7
8
9
10
11
2007 2008 2009 2010 2011 2012 2013 2014 2015 2016
y/y
% c
hang
e
mill
ions
tonn
es
Green bars = monthly produc on(le -hand scale)
Blue line = y/y % ch.(right-hand scale)
May 2016 = 10.32 million tonnes2016/2015 = +2.1%Jan.-May. 2016 = 48.98 million tonnes2016/2015 = 4.8%
1-Source: Na onal Bureau of Sta s cs. Jan.-Feb. data combined in release. Split est. based on LNY date.
China Paper and Paperboard Produc onthrough May 20161
Fig. 13
MARKET PULP MONTHLY | JULY 2016
Page 8ALL FIGURES IN METRIC TONS
& ASSOCIATES INC.Brian McClay
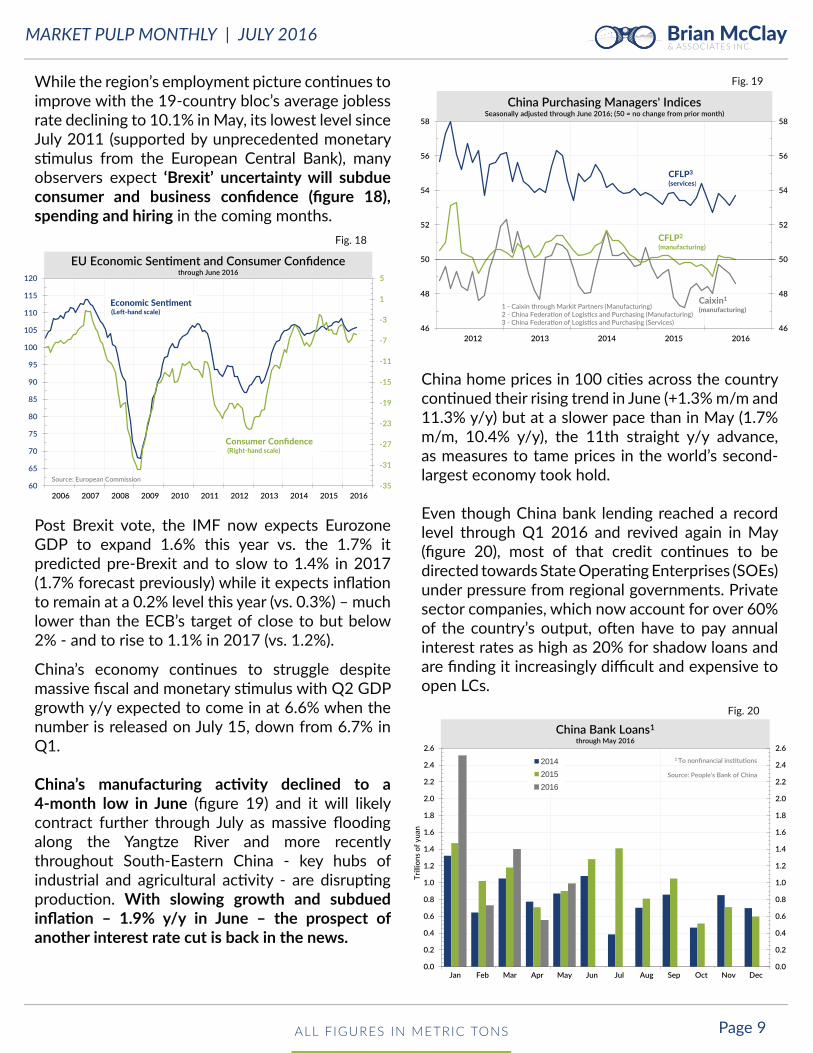
Economic NotesAlthough the third es mate of America’s Q1 GDP growth rate was revised up to 1.1% annualized from the fi rst es mate of 0.5%, it was s ll the weakest pace in a year (fi gure 14). The revision
refl ected stronger exports and a smaller drop in business spending (although it s ll fell by the most in 6 years - dragged down by the depressed energy sector). US Q2 GDP growth has improved to 2.4% according to the Atlanta Federal Reserve’s GDPNow model forecast, based on a revival in consumer spending growth to 4.3% q/q annualized from 1.5% in Q1, a recent rebound in private-sector ac vity, especially for manufacturers (fi gure 15), which is suppor ng modest trend-line employment gains (fi gure 16).
However, prospects for stronger growth through the rest of this year have become more subdued since uncertainty emana ng from June 23’s Brexit referendum has boosted the USD and should slow economic ac vity across Europe according to the IMF. Moreover, the uncertainty surrounding America’s extraordinary Presiden al Elec on will likely add to fi nancial market vola lity and cause U.S. businesses to become even more cau ous in hiring and inves ng, and could make consumers less willing to spend. The Eurozone economy failed to gain momentum in June according to surveys of private sector ac vity with faster manufacturing growth off set by a persistent slowdown in the services sector (fi gure 17) signalling Q2 GDP growth in Europe of only 0.3%, about half its Q1 2016 pace, according to Markit Economics.
-11-10
-9-8-7-6-5-4-3-2-10123456
-11-10-9-8-7-6-5-4-3-2-10123456
2007 2008 2009 2010 2011 2012 2013 2014 2015 2016
% c
hang
e
USAEurozone
Source: U.S. Bureau of Economic Analysis & Eurostat
U.S. and Eurozone (19) - Real GDP Growth% change from previous quarter annualized - through Q1 2016
Fig. 14
-900
-800
-700
-600
-500
-400
-300
-200
-100
0
100
200
300
400
500
4
4.5
5
5.5
6
6.5
7
7.5
8
8.5
9
9.5
10
10.5
11
2006 2007 2008 2009 2010 2011 2012 2013 2014 2015 2016
Thou
sand
s
Percen
t
Source: US Bureau of Labor Sta s cs & US Dept. of Labor
Unemployment Rate(le -hand side)
New jobs(right-hand side)
Monthly U.S. Unemployment Rate & Non-Farm Payrolls Changethrough June 2016
Fig. 16
32
34
36
38
40
42
44
46
48
50
52
54
56
58
60
62
32
34
36
38
40
42
44
46
48
50
52
54
56
58
60
62
2006 2007 2008 2009 2010 2011 2012 2013 2014 2015 2016
NB: Results above 50 generally signal economic expansion.Source: Markit.com
Manufacturing
Services
Eurozone Manufacturing & Services Ac vity Indicesthrough June 2016
Fig. 17
30
35
40
45
50
55
60
65
70
30
35
40
45
50
55
60
65
70
1998 2000 2002 2004 2006 2008 2010 2012 2014 2016
Manufacturing
Services
RecessionMar 2001 - Nov 2001
RecessionDec 2007 - Jun 2009
NB: Results above 50 generally signal economic expansionSource: Ins tute for Supply Management
US ISM - Purchasing Managers' Indicesthrough June 2016
Fig. 15
MARKET PULP MONTHLY | JULY 2016
Page 9ALL FIGURES IN METRIC TONS
& ASSOCIATES INC.Brian McClay
While the region’s employment picture con nues to improve with the 19-country bloc’s average jobless rate declining to 10.1% in May, its lowest level since July 2011 (supported by unprecedented monetary s mulus from the European Central Bank), many observers expect ‘Brexit’ uncertainty will subdue consumer and business confi dence (fi gure 18), spending and hiring in the coming months.
Post Brexit vote, the IMF now expects Eurozone GDP to expand 1.6% this year vs. the 1.7% it predicted pre-Brexit and to slow to 1.4% in 2017 (1.7% forecast previously) while it expects infl a on to remain at a 0.2% level this year (vs. 0.3%) – much lower than the ECB’s target of close to but below 2% - and to rise to 1.1% in 2017 (vs. 1.2%).
China’s economy con nues to struggle despite massive fi scal and monetary s mulus with Q2 GDP growth y/y expected to come in at 6.6% when the number is released on July 15, down from 6.7% in Q1.
China’s manufacturing ac vity declined to a 4-month low in June (fi gure 19) and it will likely contract further through July as massive fl ooding along the Yangtze River and more recently throughout South-Eastern China - key hubs of industrial and agricultural ac vity - are disrup ng produc on. With slowing growth and subdued infl a on – 1.9% y/y in June – the prospect of another interest rate cut is back in the news.
China home prices in 100 ci es across the country con nued their rising trend in June (+1.3% m/m and 11.3% y/y) but at a slower pace than in May (1.7% m/m, 10.4% y/y), the 11th straight y/y advance, as measures to tame prices in the world’s second-largest economy took hold.
Even though China bank lending reached a record level through Q1 2016 and revived again in May (fi gure 20), most of that credit con nues to be directed towards State Opera ng Enterprises (SOEs) under pressure from regional governments. Private sector companies, which now account for over 60% of the country’s output, o en have to pay annual interest rates as high as 20% for shadow loans and are fi nding it increasingly diffi cult and expensive to open LCs.
0.0
0.2
0.4
0.6
0.8
1.0
1.2
1.4
1.6
1.8
2.0
2.2
2.4
2.6
0.0
0.2
0.4
0.6
0.8
1.0
1.2
1.4
1.6
1.8
2.0
2.2
2.4
2.6
Jan Feb Mar Apr May Jun Jul Aug Sep Oct Nov Dec
Trill
ions
of y
uan
2014
2015
2016
1 To non nancial ins tu ons
Source: People's Bank of China
China Bank Loans1through May 2016
Fig. 20
Fig. 19
46
48
50
52
54
56
58
46
48
50
52
54
56
58
2012 2013 2014 2015 2016
Caixin1(manufacturing)
CFLP2
(manufacturing)
1 - Caixin through Markit Partners (Manufacturing)2 - China Federa on of Logis cs and Purchasing (Manufacturing)3 - China Federa on of Logis cs and Purchasing (Services)
CFLP3
(services)
China Purchasing Managers' IndicesSeasonally adjusted through June 2016; (50 = no change from prior month)
Fig. 18
-35
-31
-27
-23
-19
-15
-11
-7
-3
1
5
60
65
70
75
80
85
90
95
100
105
110
115
120
2006 2007 2008 2009 2010 2011 2012 2013 2014 2015 2016
Consumer Con dence(Right-hand scale)
Economic Sen ment(Le -hand scale)
Source: European Commission
EU Economic Sen ment and Consumer Con dencethrough June 2016
MARKET PULP MONTHLY | JULY 2016
Page 10ALL FIGURES IN METRIC TONS
& ASSOCIATES INC.Brian McClay
Currency Monthly Avg. June 2016
Canadian $
Swedish Krona
Euro
Yen
Brazil Real
Chilean Peso
Korean Won
Indo. Rupiah
Russian Ruble
New Zealand $
S. African Rand
Chinese Yuan (RMB)
Exchange Rates : local currency in USD% change from
May 2016 June 2015
Exchange Rates
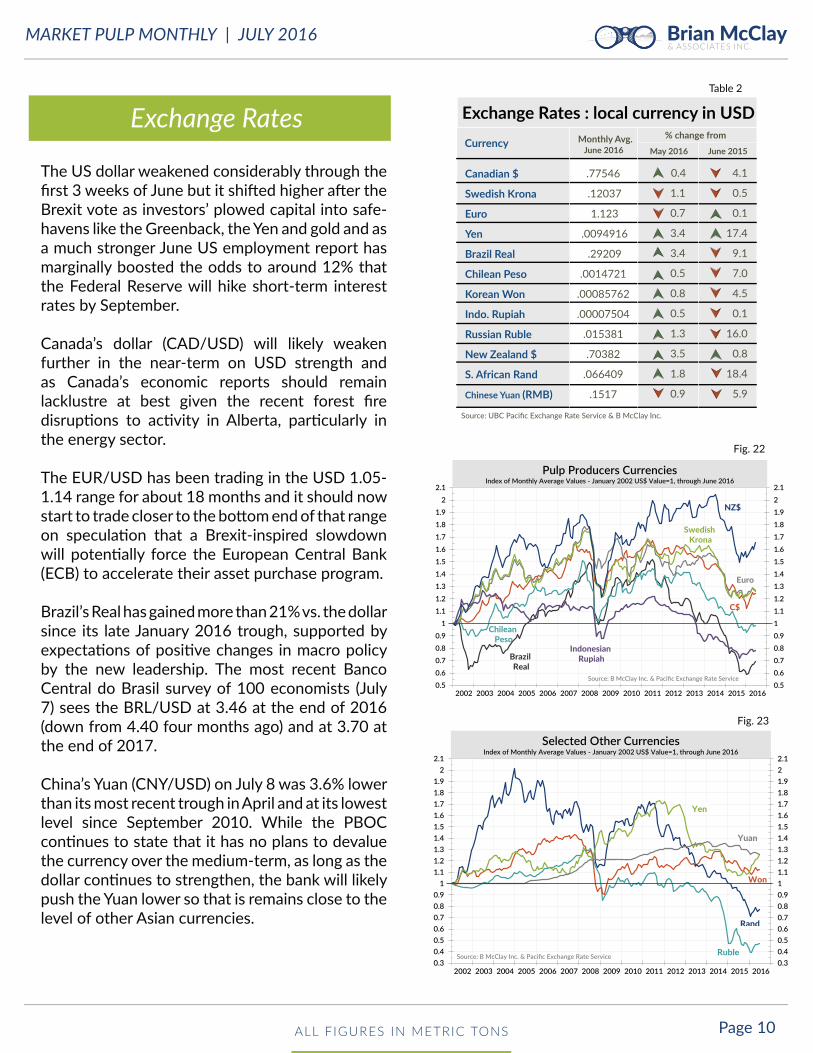
The US dollar weakened considerably through the fi rst 3 weeks of June but it shi ed higher a er the Brexit vote as investors’ plowed capital into safe-havens like the Greenback, the Yen and gold and as a much stronger June US employment report has marginally boosted the odds to around 12% that the Federal Reserve will hike short-term interest rates by September.
Canada’s dollar (CAD/USD) will likely weaken further in the near-term on USD strength and as Canada’s economic reports should remain lacklustre at best given the recent forest fi re disrup ons to ac vity in Alberta, par cularly in the energy sector.
The EUR/USD has been trading in the USD 1.05-1.14 range for about 18 months and it should now start to trade closer to the bo om end of that range on specula on that a Brexit-inspired slowdown will poten ally force the European Central Bank (ECB) to accelerate their asset purchase program. Brazil’s Real has gained more than 21% vs. the dollar since its late January 2016 trough, supported by expecta ons of posi ve changes in macro policy by the new leadership. The most recent Banco Central do Brasil survey of 100 economists (July 7) sees the BRL/USD at 3.46 at the end of 2016 (down from 4.40 four months ago) and at 3.70 at the end of 2017.
China’s Yuan (CNY/USD) on July 8 was 3.6% lower than its most recent trough in April and at its lowest level since September 2010. While the PBOC con nues to state that it has no plans to devalue the currency over the medium-term, as long as the dollar con nues to strengthen, the bank will likely push the Yuan lower so that is remains close to the level of other Asian currencies.
Fig. 23
0.30.40.50.60.70.80.911.11.21.31.41.51.61.71.81.922.1
0.30.40.50.60.70.80.9
11.11.21.31.41.51.61.71.81.9
22.1
2002 2003 2004 2005 2006 2007 2008 2009 2010 2011 2012 2013 2014 2015 2016
Ruble
Won
Rand
Yen
Yuan
Source: B McClay Inc. & Paci c Exchange Rate Service
Selected Other CurrenciesIndex of Monthly Average Values - January 2002 US$ Value=1, through June 2016
0.50.60.70.80.911.11.21.31.41.51.61.71.81.922.1
0.50.60.70.80.9
11.11.21.31.41.51.61.71.81.9
22.1
2002 2003 2004 2005 2006 2007 2008 2009 2010 2011 2012 2013 2014 2015 2016
BrazilReal
ChileanPeso
C$
Swedish Krona
Euro
IndonesianRupiah
Source: B McClay Inc. & Paci c Exchange Rate Service
NZ$
Pulp Producers CurrenciesIndex of Monthly Average Values - January 2002 US$ Value=1, through June 2016
Fig. 22
Table 2