Embed Size (px)
Citation preview
Arc Hydro groundwater data model:
a data model for groundwater systems
within ArcGIS
ESRI user conference
May 2004
Gil Strassberg and David Maidment, University of Texas at Austin
Norman Jones, Brigham Young University
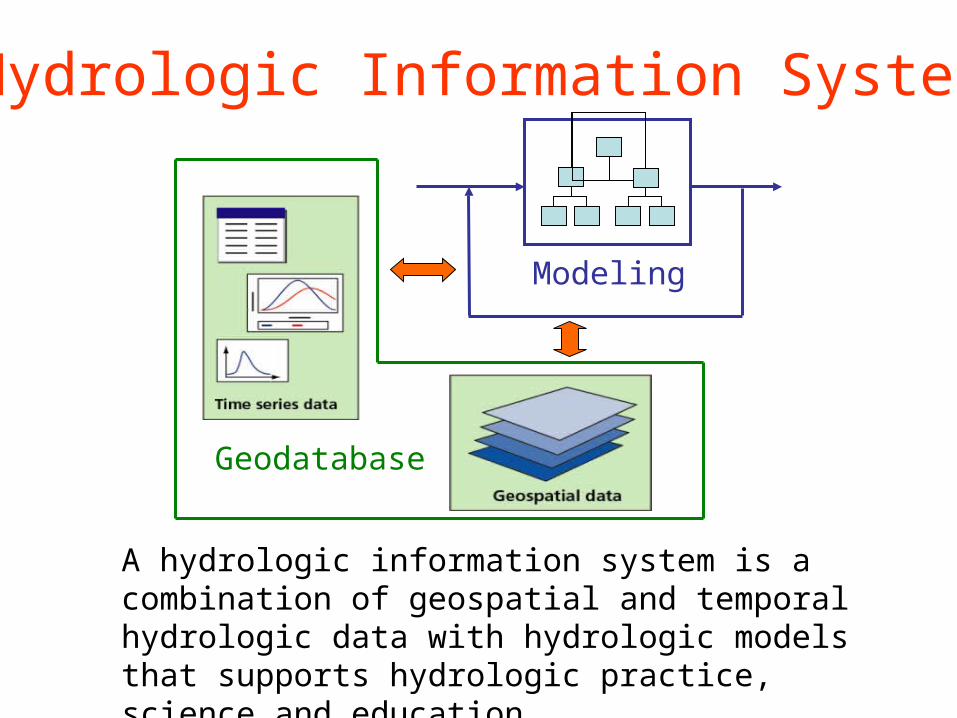
Hydrologic Information Systems
Modeling
Geodatabase
A hydrologic information system is a combination of geospatial and temporal hydrologic data with hydrologic models that supports hydrologic practice, science and education
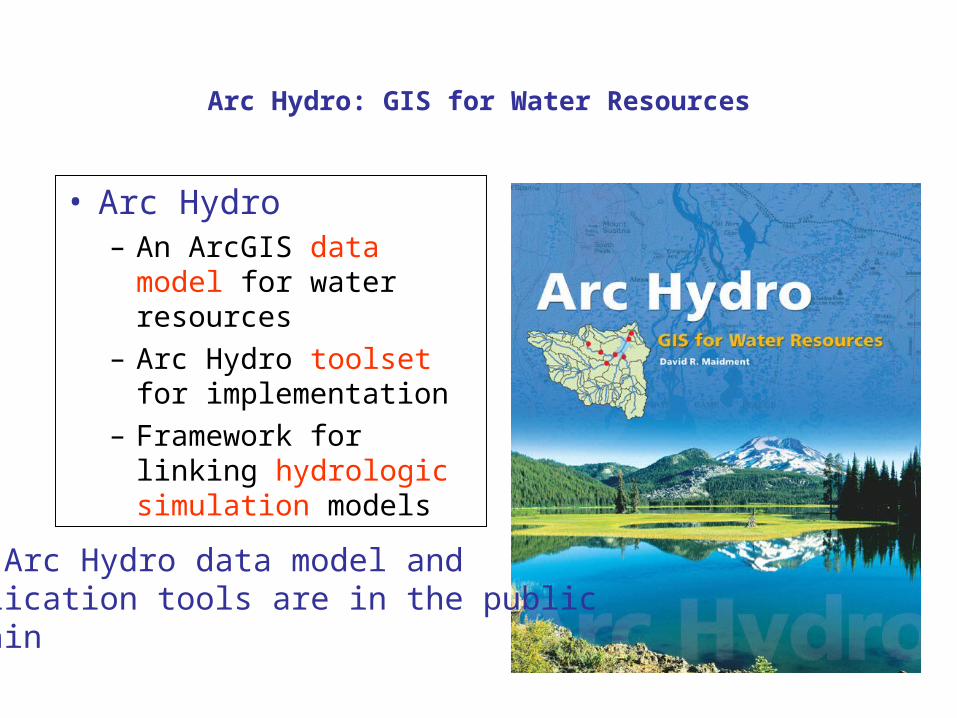
Arc Hydro: GIS for Water Resources
• Arc Hydro– An ArcGIS data model
for water resources– Arc Hydro toolset for
implementation– Framework for linking
hydrologic simulation models
The Arc Hydro data model andapplication tools are in the publicdomain
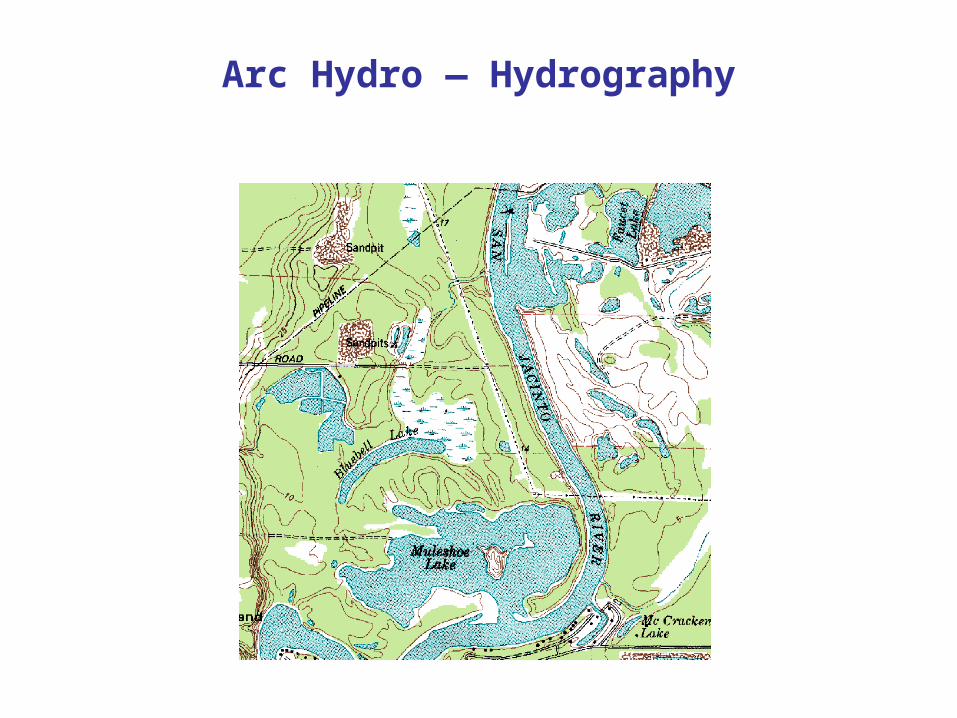
Arc Hydro — Hydrography
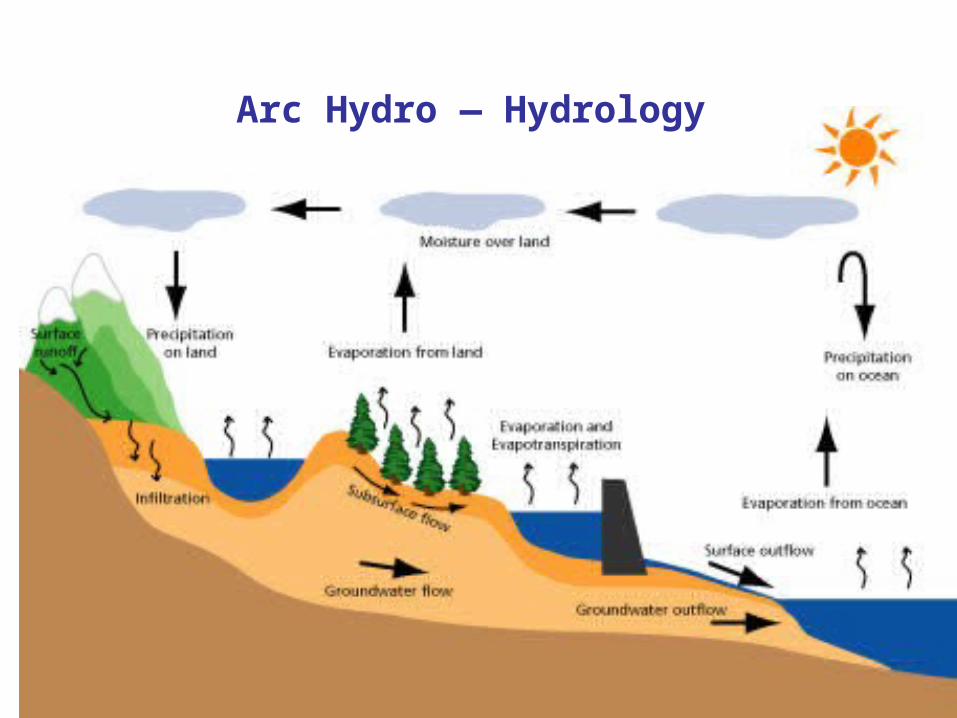
Arc Hydro — Hydrology
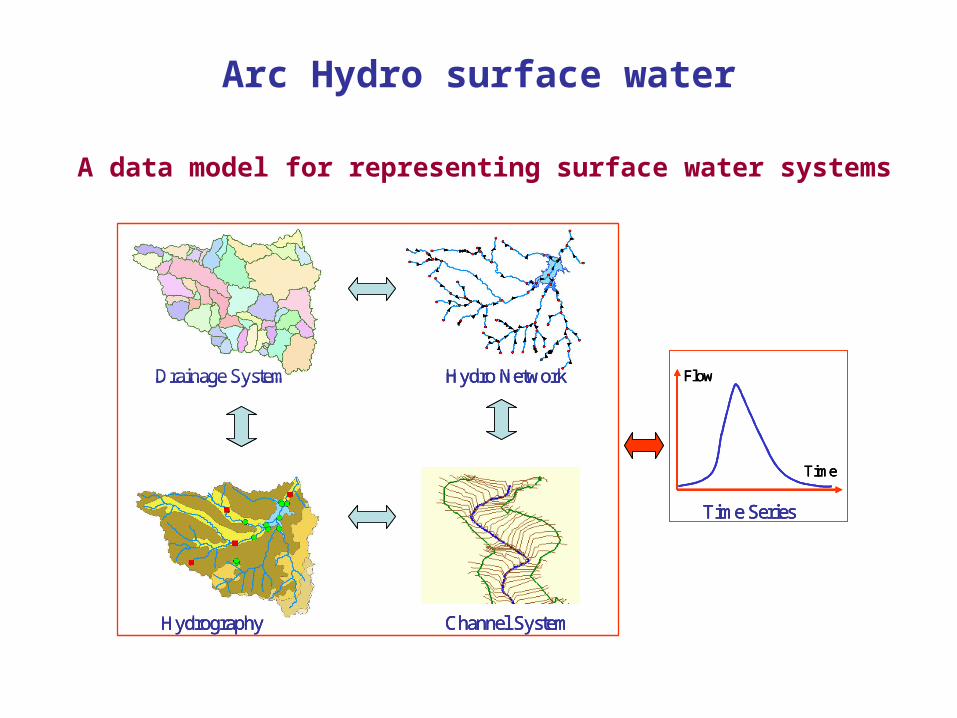
Arc Hydro surface water
Flow
Time
Time Series
Hydrography
Hydro Network
Channel System
Drainage System Flow
Time
Time Series
Flow
Time
Time Series
HydrographyHydrography
Hydro NetworkHydro Network
Channel SystemChannel System
Drainage SystemDrainage System
A data model for representing surface water systems
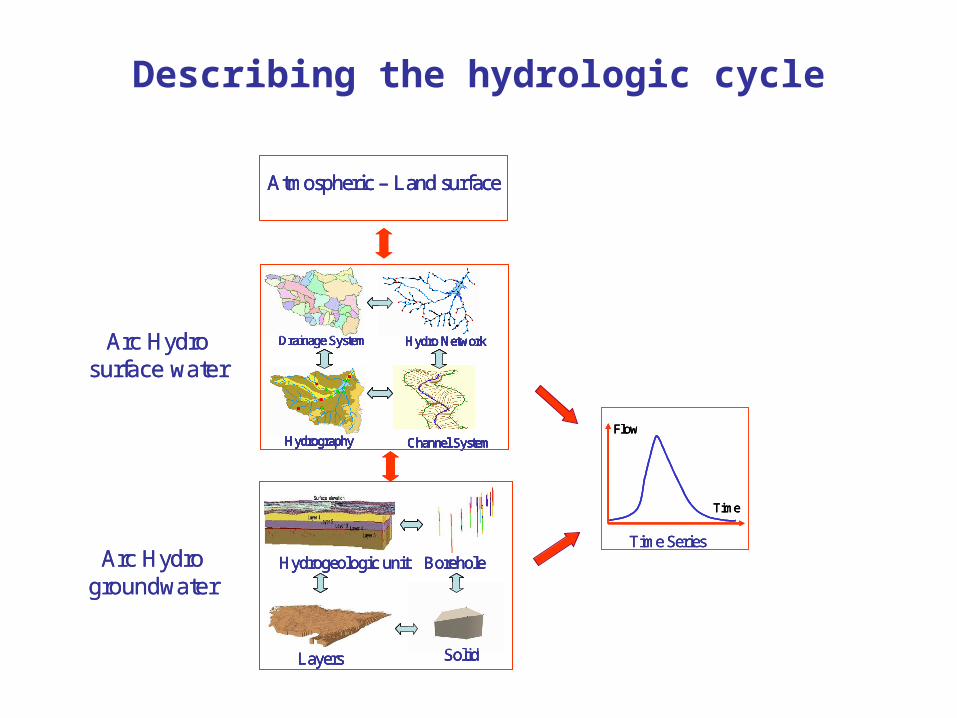
Describing the hydrologic cycle
HydrographyHydrography
Hydro NetworkHydro Network
Channel SystemChannel System
Drainage SystemDrainage System
Hydrogeologic unit Borehole
Layers Solid
Atmospheric – Land surface
Arc Hydro surface water
Arc Hydro groundwater
HydrographyHydrography
Hydro NetworkHydro Network
Channel SystemChannel System
Drainage SystemDrainage System
Hydrogeologic unit Borehole
Layers Solid
Atmospheric – Land surface
HydrographyHydrography
Hydro NetworkHydro Network
Channel SystemChannel System
Drainage SystemDrainage System
HydrographyHydrography
Hydro NetworkHydro Network
Channel SystemChannel System
Drainage SystemDrainage System
Hydrogeologic unit Borehole
Layers Solid
Hydrogeologic unit Borehole
Layers Solid
Atmospheric – Land surface
Arc Hydro surface water
Arc Hydro groundwater
Flow
Time
Time Series
Hydrography
Hydro Network
Channel System
Drainage System Flow
Time
Time Series
Flow
Time
Time Series
HydrographyHydrography
Hydro NetworkHydro Network
Channel SystemChannel System
Drainage SystemDrainage System
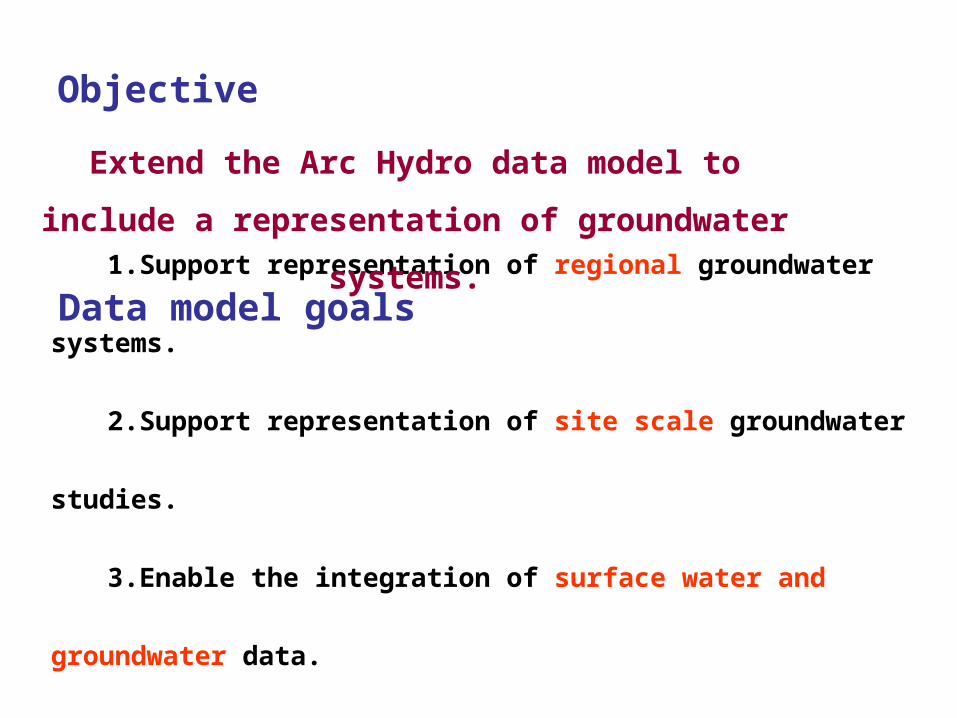
1.Support representation of regional groundwater systems.
2.Support representation of site scale groundwater studies.
3.Enable the integration of surface water and groundwater
data.
4.Connect to groundwater modeling software.
Data model goals
Objective
Extend the Arc Hydro data model to include a
representation of groundwater systems.
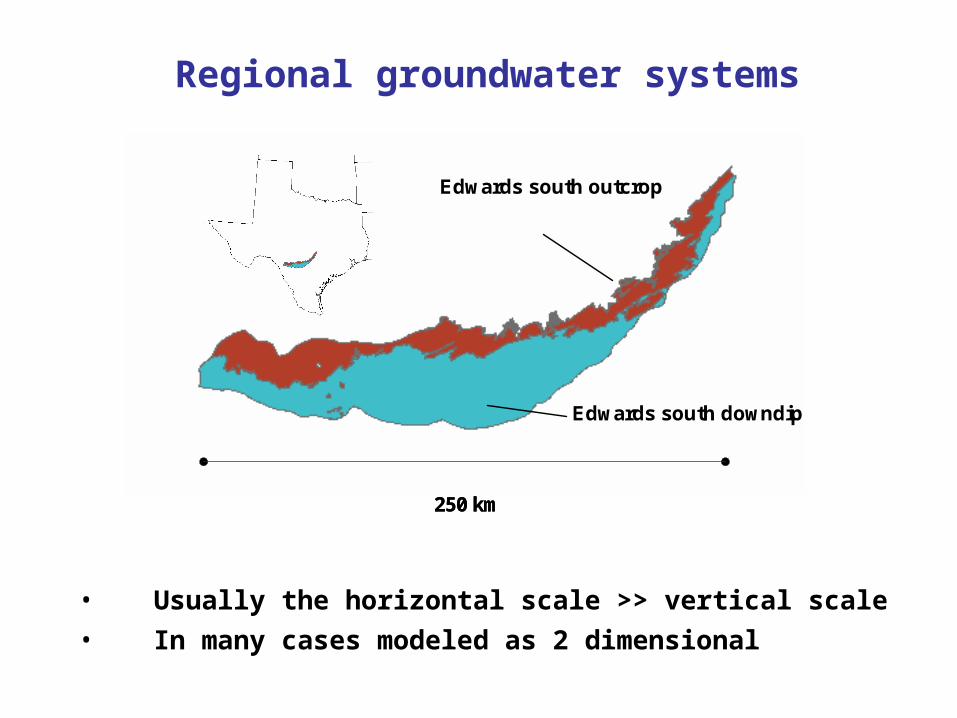
Regional groundwater systems
250 km
Edwards south outcrop
Edwards south downdip
250 km
Edwards south outcrop
Edwards south downdip
• Usually the horizontal scale >> vertical scale
• In many cases modeled as 2 dimensional

Site scale groundwater studies
Layer 1
Layer 3Layer 2
Layer 4Layer 5
Surface elevation
Layer 1
Layer 3Layer 2
Layer 4Layer 5
Surface elevation
~ 3000 m
Layer 1
Layer 3Layer 2
Layer 4Layer 5
Surface elevation
Layer 1
Layer 3Layer 2
Layer 4Layer 5
Surface elevation
~ 3000 m
Characterization of Savannah River Site in South Carolina
• Usually model 3D flow to study mass transport
• Important to establish a 3D model of the system
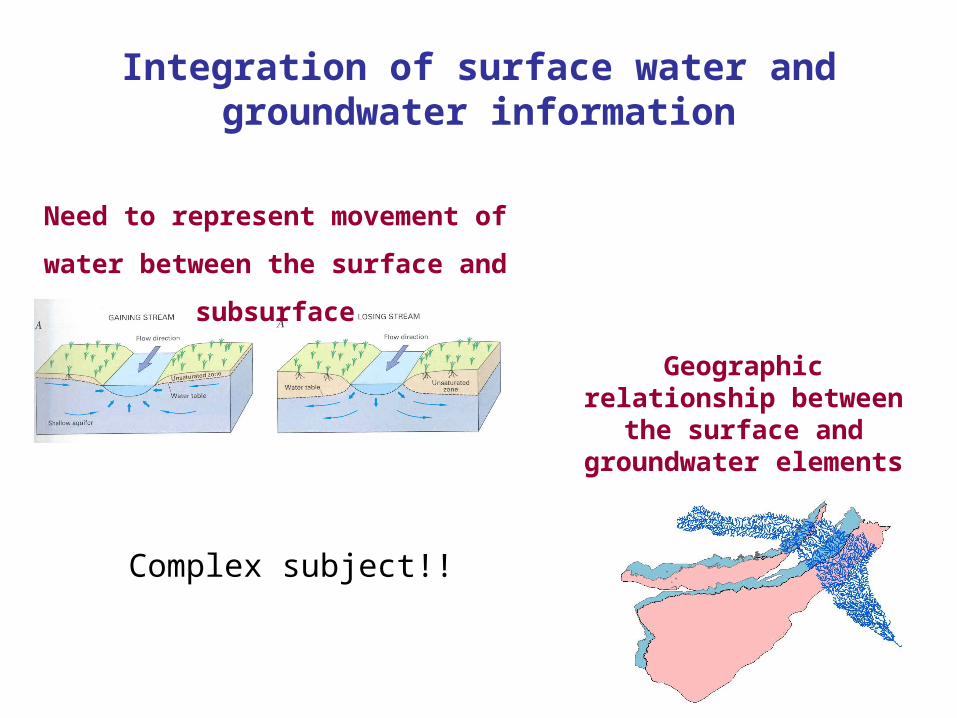
Integration of surface water and groundwater information
Geographic relationship between the surface and groundwater elements
Need to represent movement of water
between the surface and subsurface
Complex subject!!
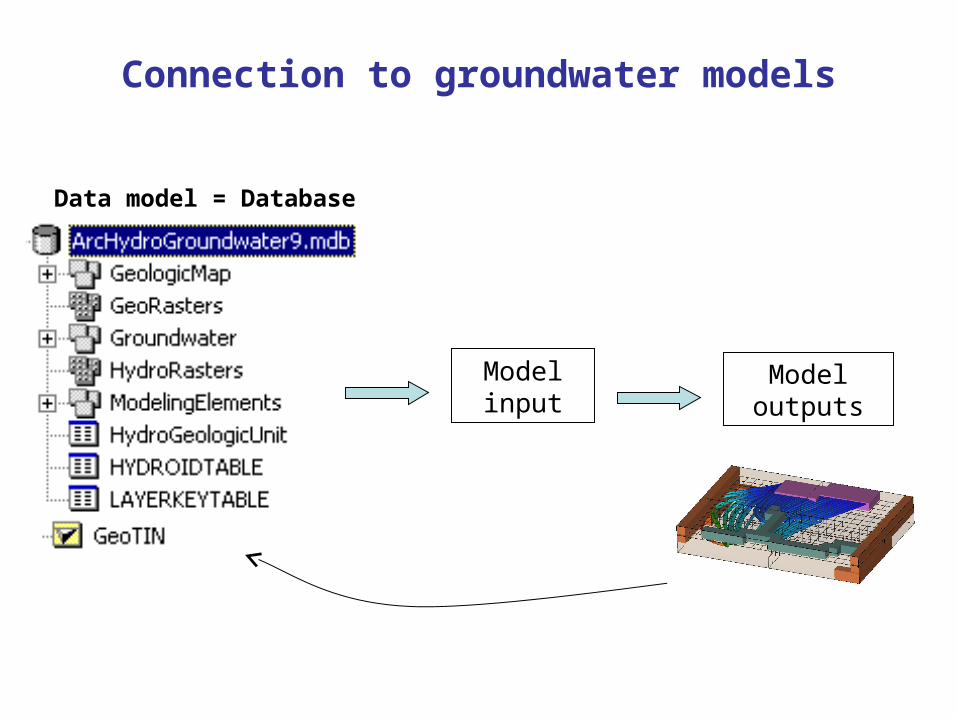
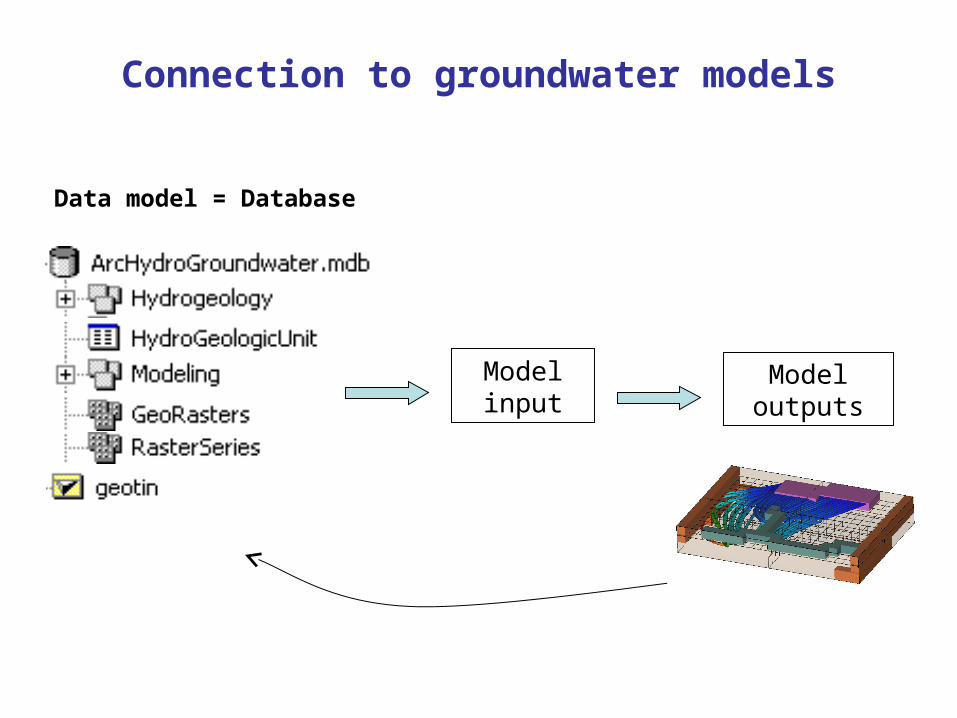
Connection to groundwater models
Data model = Database
Model input
Model outputs
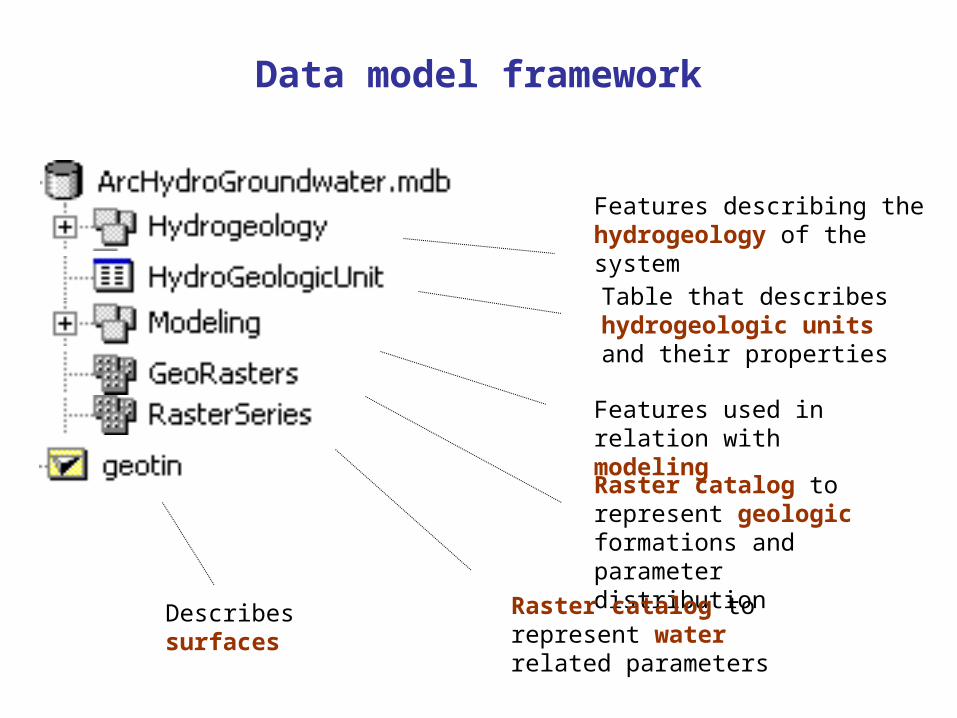
Data model framework
Raster catalog to represent geologic formations and parameter distribution
Features describing the hydrogeology of the system
Raster catalog to represent water related parameters
Features used in relation with modeling
Table that describes hydrogeologic units and their properties
Describes surfaces
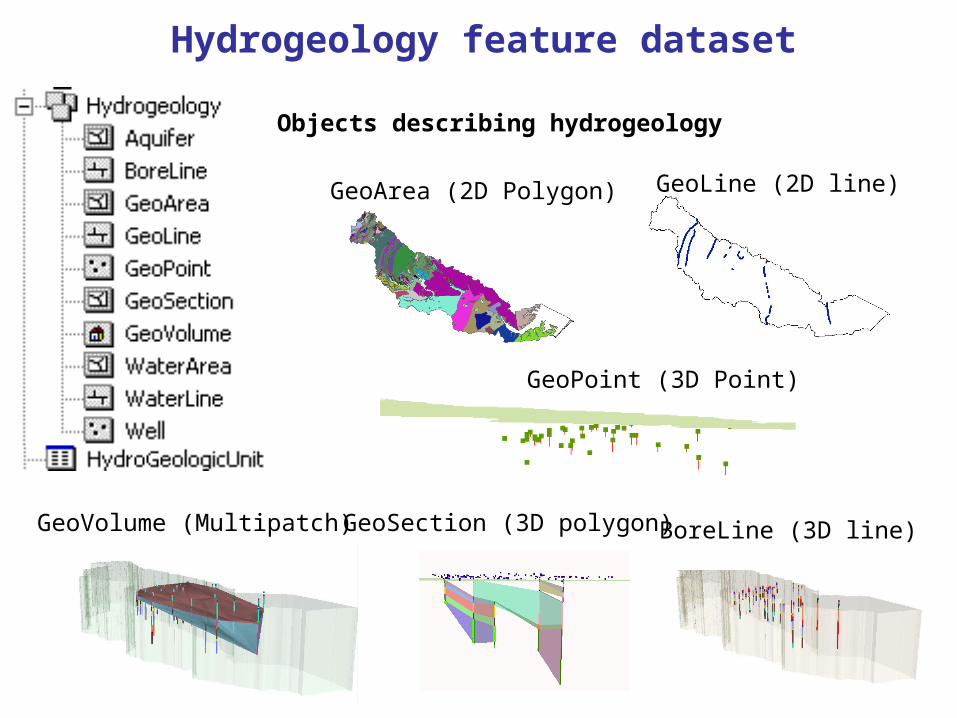
Hydrogeology feature dataset
GeoSection (3D polygon)GeoVolume (Multipatch)
Objects describing hydrogeology
GeoArea (2D Polygon) GeoLine (2D line)
GeoPoint (3D Point)
BoreLine (3D line)

Hydrogeology feature dataset
Aquifer (2D Polygon)Wells (points)
Water Area (2D Polygon)Water Line (2D line)
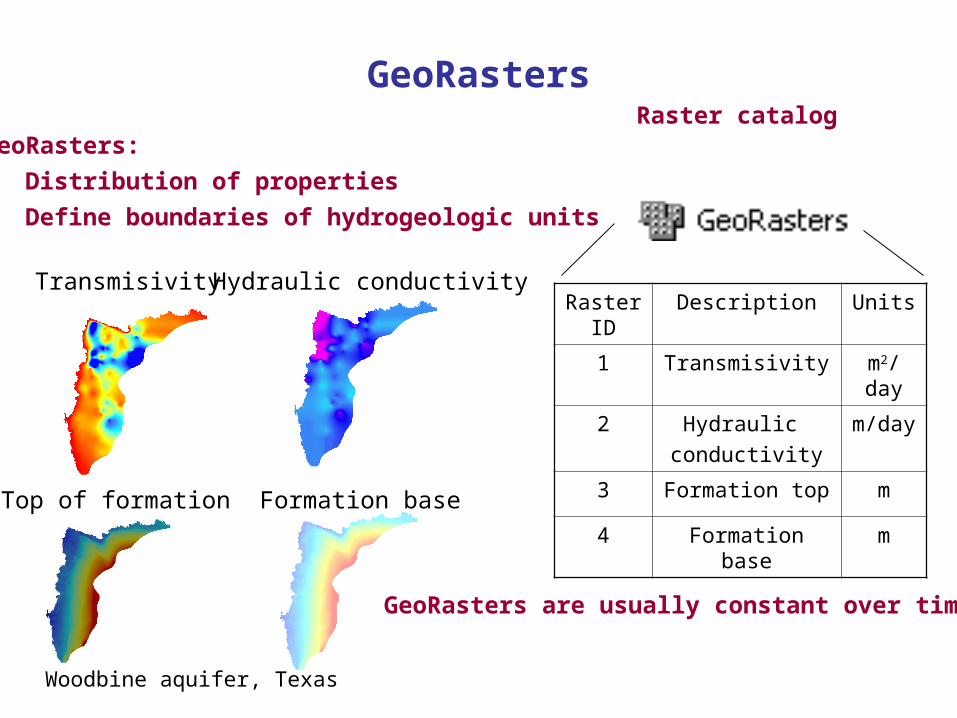
GeoRasters
Transmisivity Hydraulic conductivity
GeoRasters:
• Distribution of properties
• Define boundaries of hydrogeologic units
Top of formation Formation base
Raster ID
Description Units
1 Transmisivity m2/day
2 Hydraulic
conductivity
m/day
3 Formation top m
4 Formation base m
Raster catalog
GeoRasters are usually constant over time
Woodbine aquifer, Texas
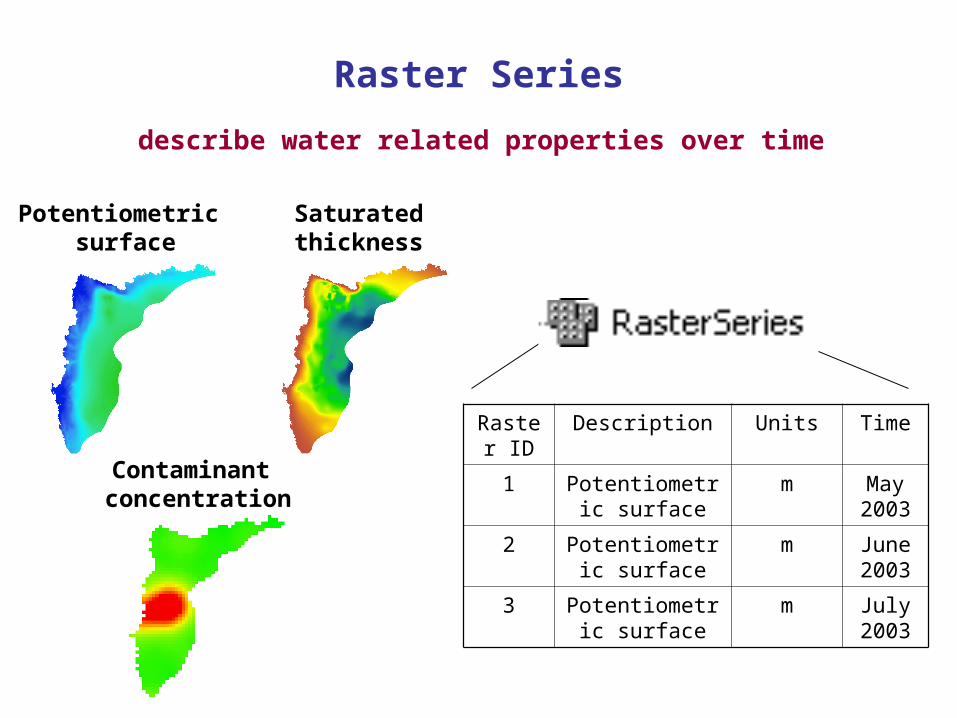
Raster Series
describe water related properties over time
Potentiometric surface
Saturated thickness
Contaminant concentration
Raster ID
Description Units Time
1 Potentiometric surface
m May 2003
2 Potentiometric surface
m June 2003
3 Potentiometric surface
m July 2003
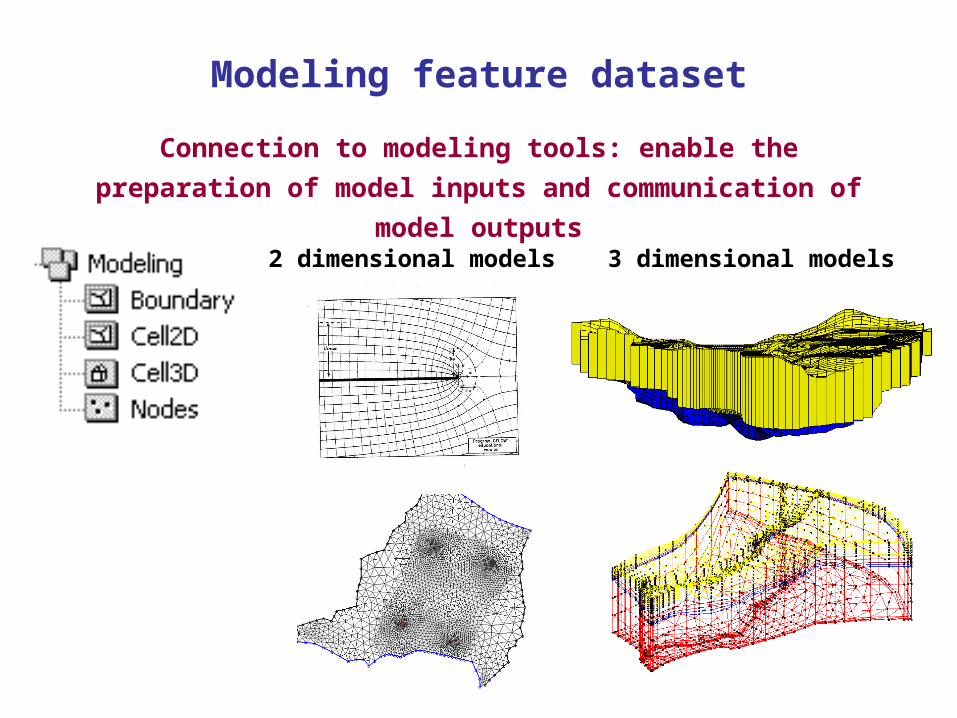
Modeling feature dataset
3 dimensional models
Connection to modeling tools: enable the preparation of model
inputs and communication of model outputs
2 dimensional models

Hydrogeologic unit
HGU ID HGU Code Formation Reference
1 1 Sand
2 8 Red Clay
3 23 Bouldery till
Hydrogeologic unit table
Describes the hydrogeologic unit and links
together the spatial representations
Example 1:
Representing hydrogeology of an aquifer system
North Carolina coastal aquifer system
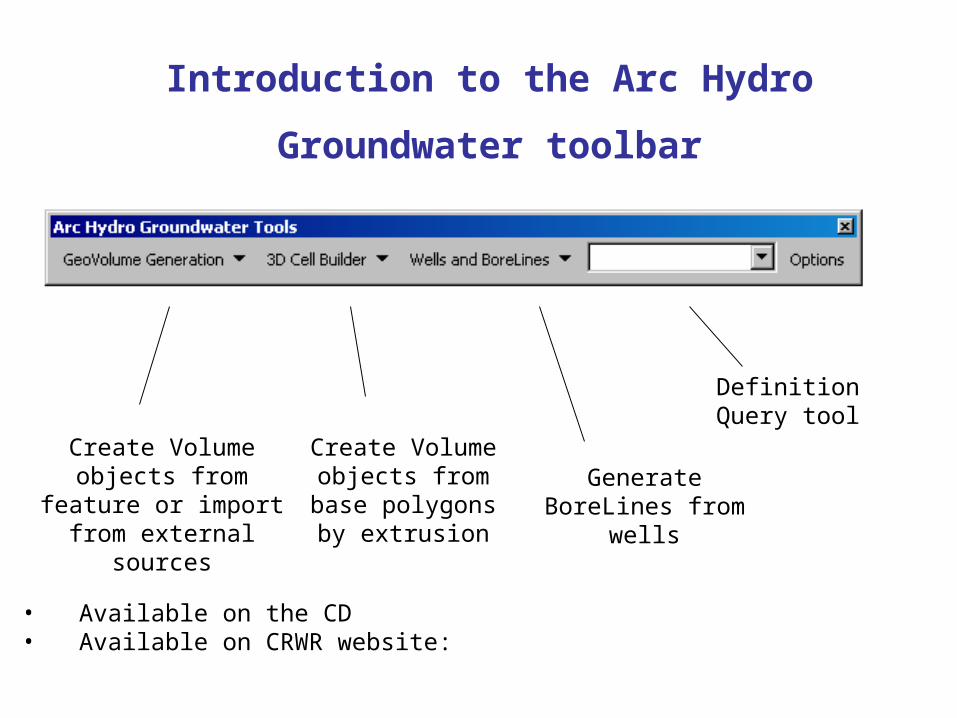
Introduction to the Arc Hydro Groundwater
toolbar
Create Volume objects from feature or import from external sources
Create Volume objects from base
polygons by extrusion
Generate BoreLines from wells
Definition Query tool
• Available on the CD• Available on CRWR website:

North Carolina coastal aquifer system
* From USGS, Water Resources Data Report of North Carolina for WY 2002
Section line

Defining the control volumeThis control volume is the boundary of the Neuse River basin down to a specified depth
Next step - Describe the subsurface within this control volume
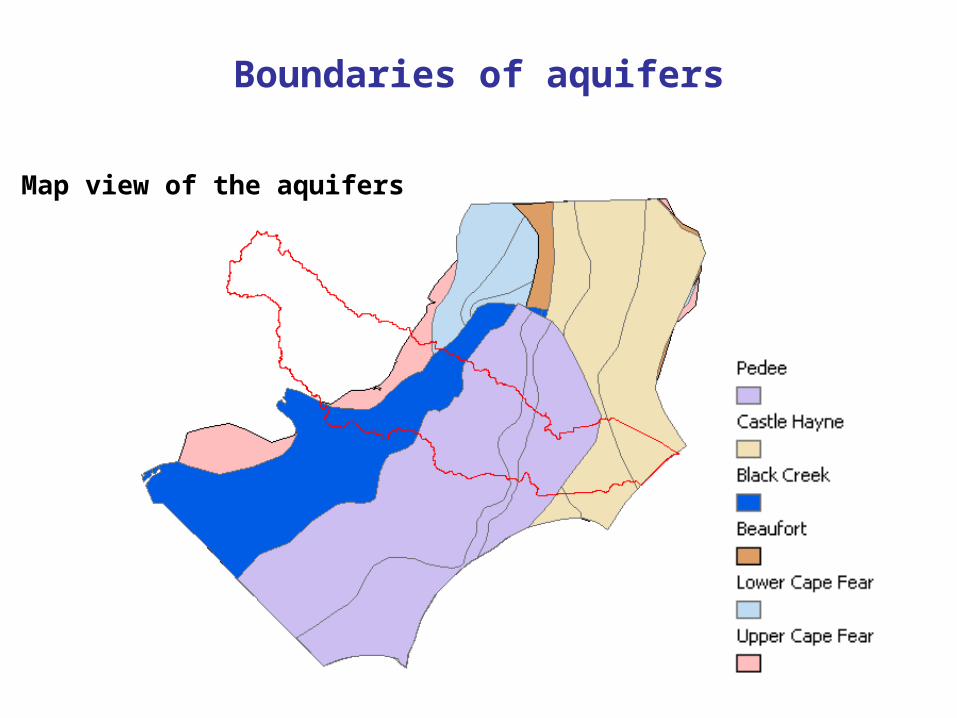
Boundaries of aquifers
Map view of the aquifers
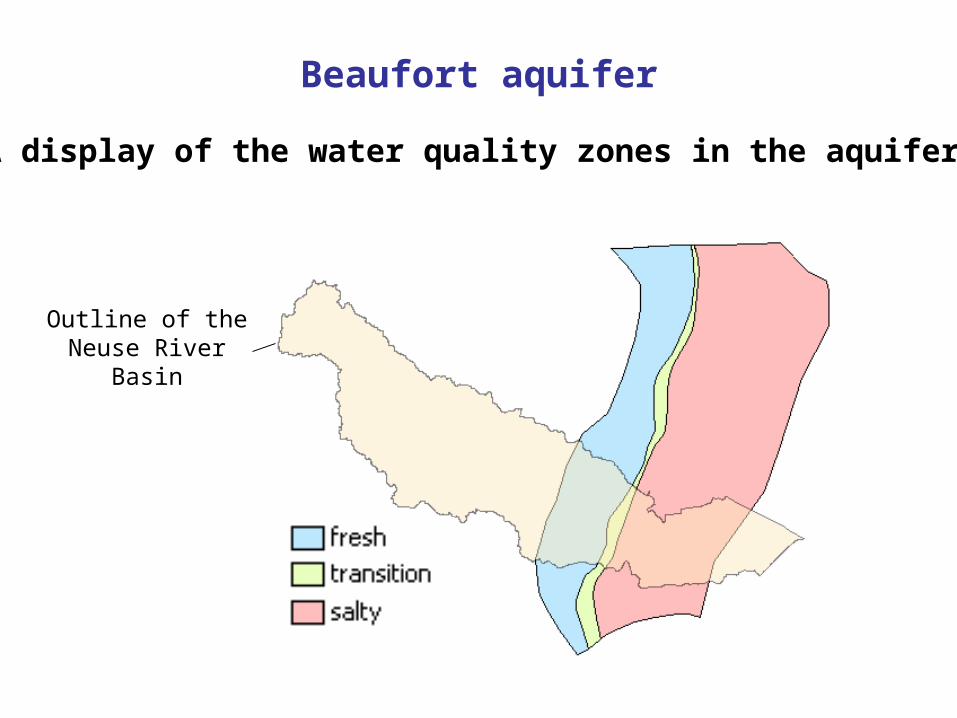
Beaufort aquifer
A display of the water quality zones in the aquifer
Outline of the Neuse River Basin
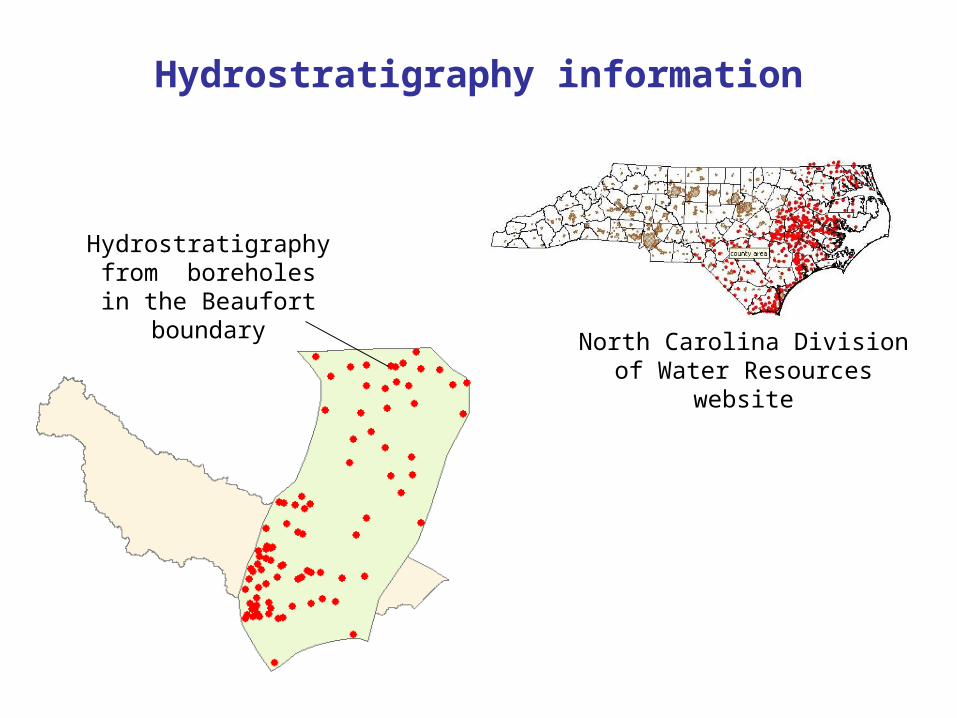
Hydrostratigraphy information
North Carolina Division of Water Resources website
Hydrostratigraphy from boreholes in the
Beaufort boundary
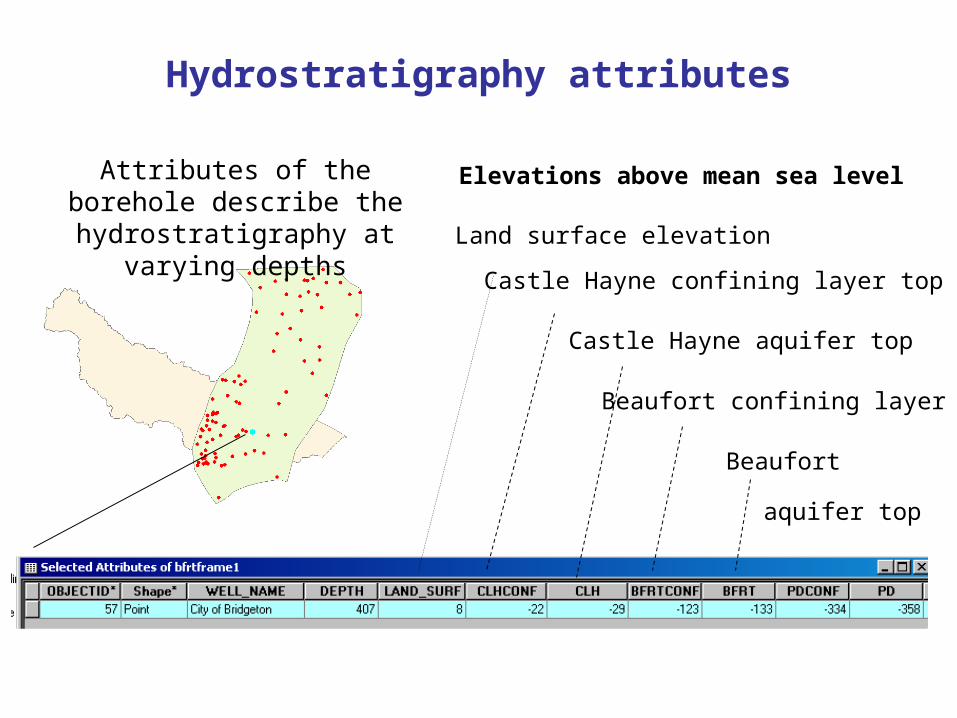
Hydrostratigraphy attributes
Attributes of the borehole describe the hydrostratigraphy at
varying depths
Beaufort aquifer top
Elevations above mean sea level
Land surface elevation
Castle Hayne confining layer top
Castle Hayne aquifer top
Beaufort confining layer top
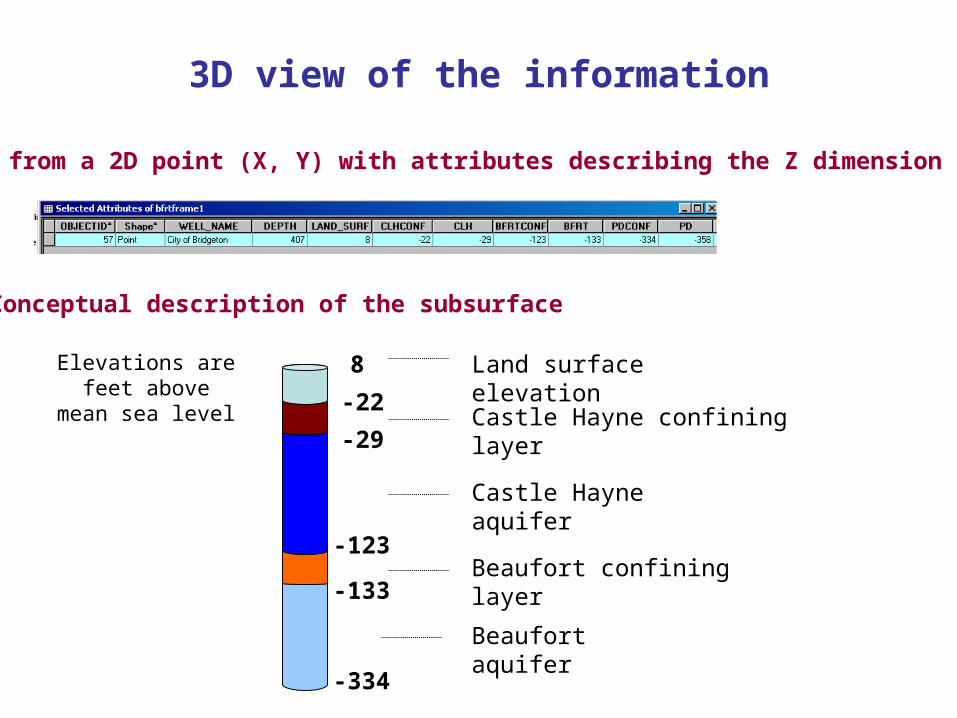
3D view of the information
Start from a 2D point (X, Y) with attributes describing the Z dimension
Conceptual description of the subsurface
8
-22
-123
-29
-133
-334
Beaufort aquifer
Elevations are feet above mean sea
level
Land surface elevation
Castle Hayne confining layer
Castle Hayne aquifer
Beaufort confining layer
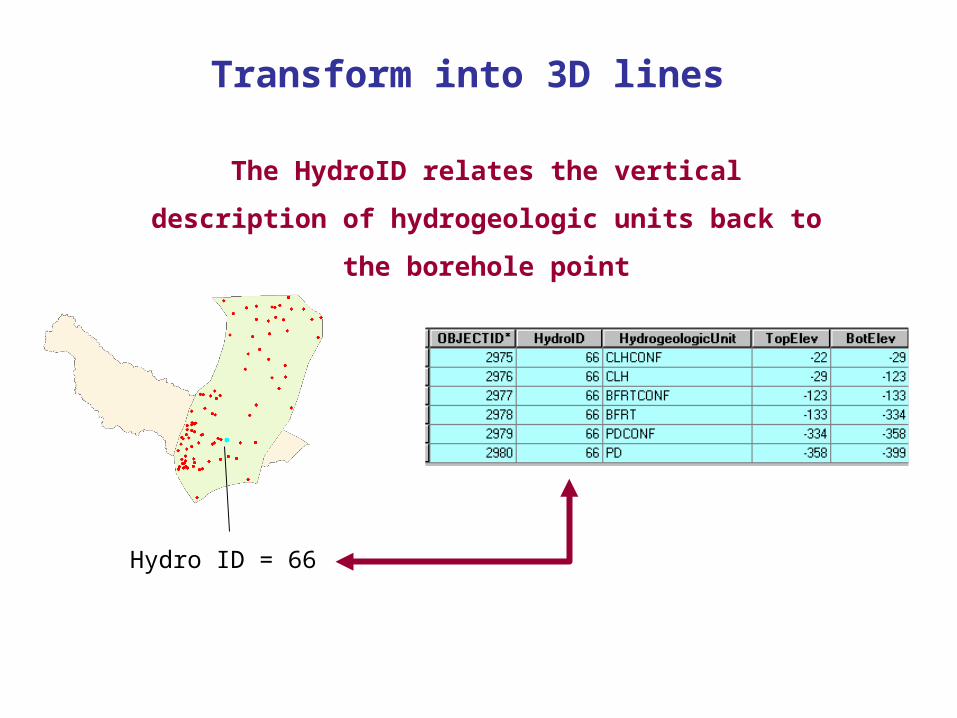
Transform into 3D lines
The HydroID relates the vertical description of
hydrogeologic units back to the borehole point
Hydro ID = 66
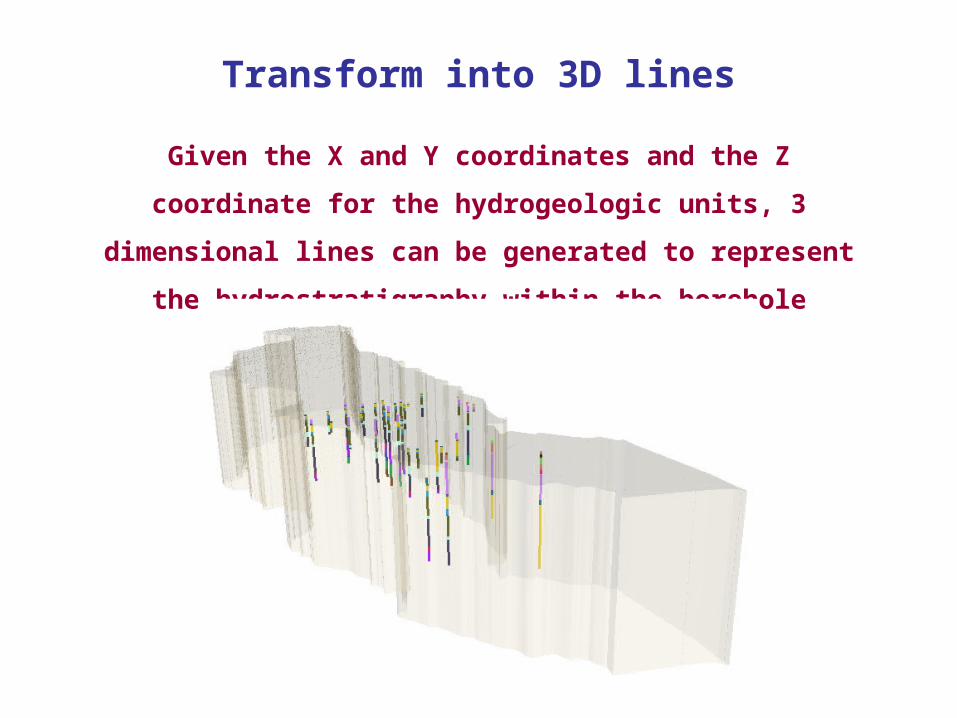
Transform into 3D lines
Given the X and Y coordinates and the Z coordinate for the
hydrogeologic units, 3 dimensional lines can be generated to
represent the hydrostratigraphy within the borehole
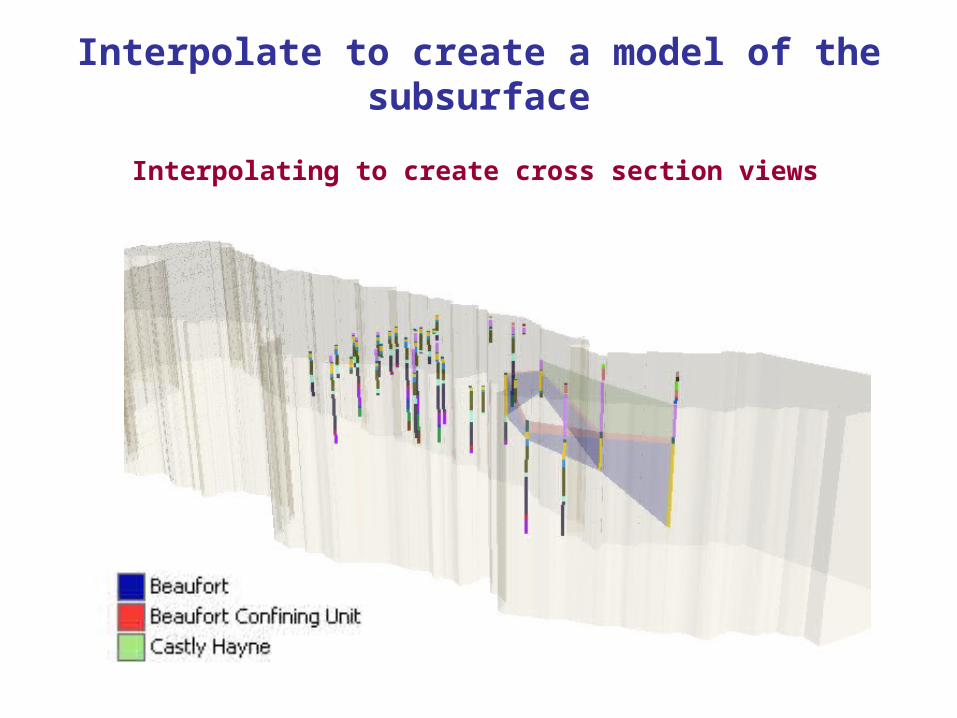
Interpolate to create a model of the subsurface
Cross sections, fence diagrams
Interpolating to create cross section views
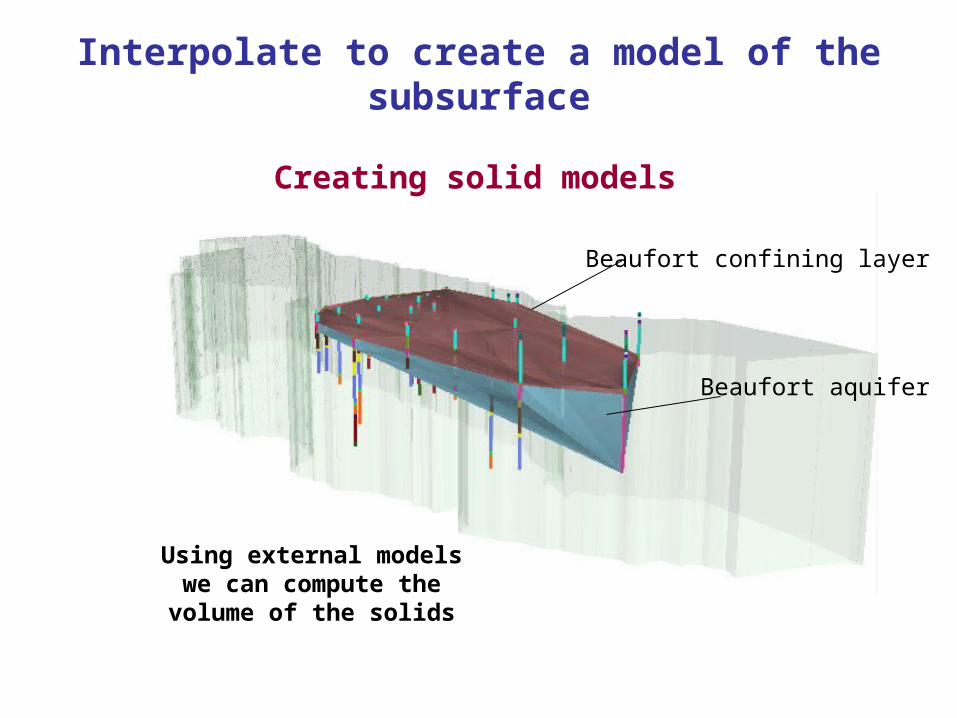
Interpolate to create a model of the subsurface
Creating solid models
Beaufort confining layer
Beaufort aquifer
Using external models we can compute the volume of
the solids
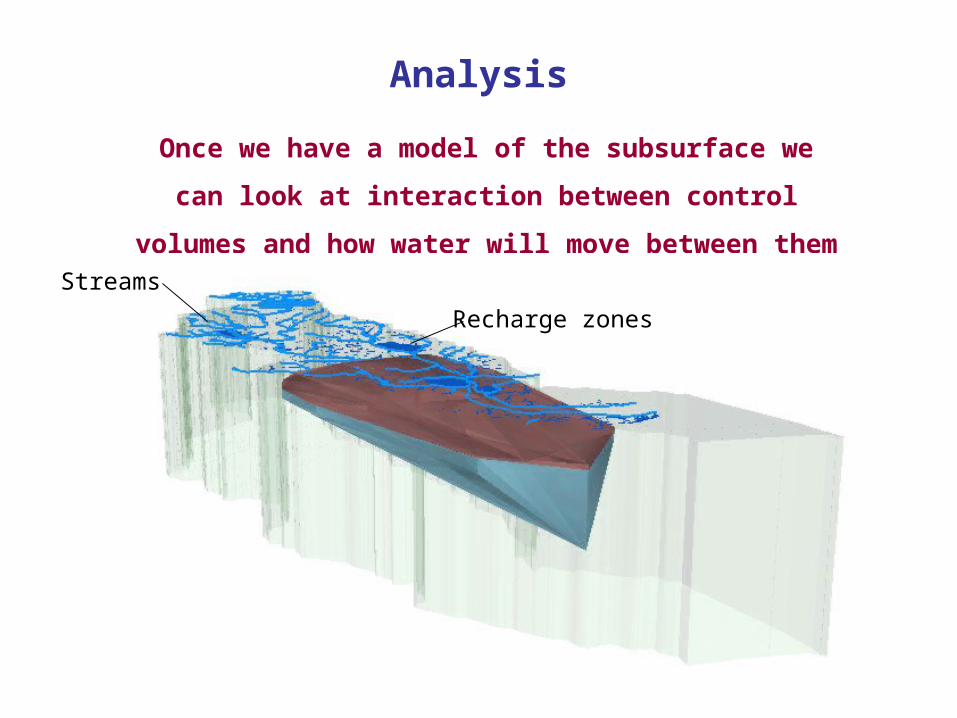
Analysis
Once we have a model of the subsurface we can look at
interaction between control volumes and how water
will move between them
Recharge zones
Streams
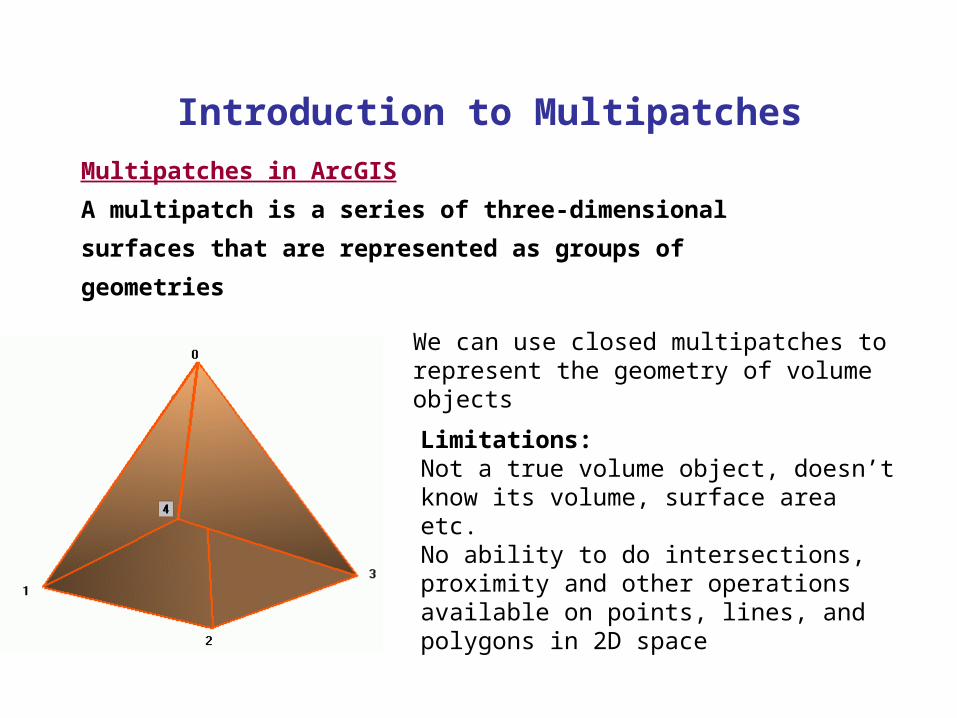
Introduction to Multipatches
Multipatches in ArcGIS
A multipatch is a series of three-dimensional surfaces that
are represented as groups of geometries
We can use closed multipatches to represent the geometry of volume objects
Limitations:Not a true volume object, doesn’t know its volume, surface area etc. No ability to do intersections, proximity and other operations available on points, lines, and polygons in 2D space
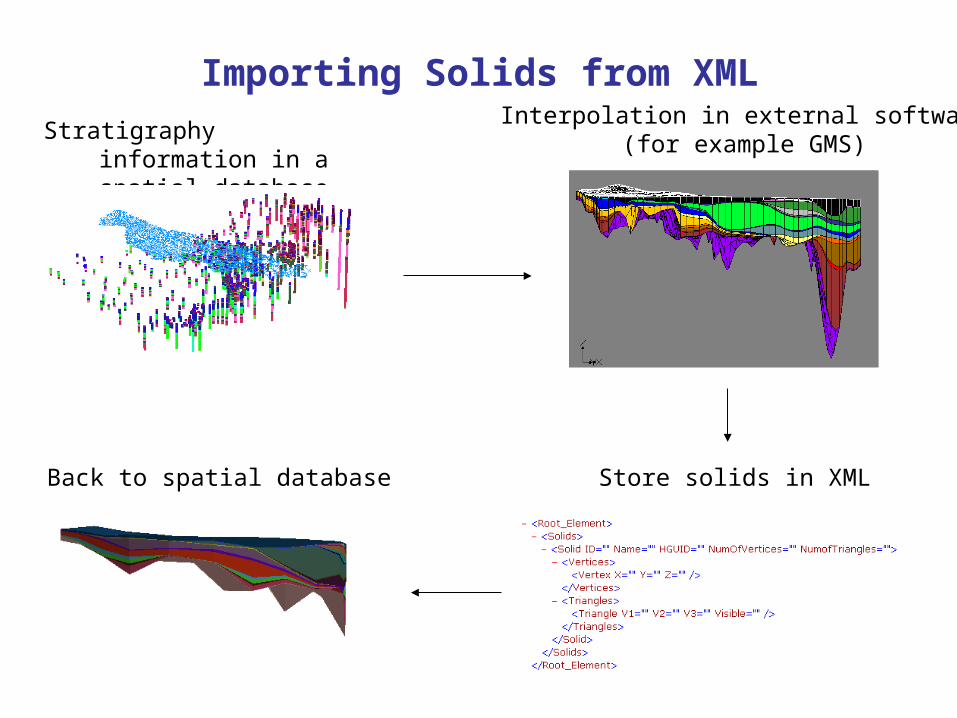
Importing Solids from XML
Stratigraphy information in a spatial database
Interpolation in external software(for example GMS)
Store solids in XMLBack to spatial database
Demo 1: Creating BoreLines and
GeoVolumes
• Create a control volume from the Neuse River Bain polygon by
extruding between two values.
• Use the Definition Query tool to display only hydrostratigraphy wells.
Then make a well selection and create borelines using the wells to
borelines tool.
• Select a set of borelines for a specific aquifer (Black Creek), then
create a GeoVolume of the aquifer using the BoreLines to
GeoVolume tool.
• Display time series for the wells (water elevations) in ArcMap.
Example 2:
Representing groundwater models
Savannah River Site, South Carolina
Connection to groundwater models
Data model = Database
Model input
Model outputs
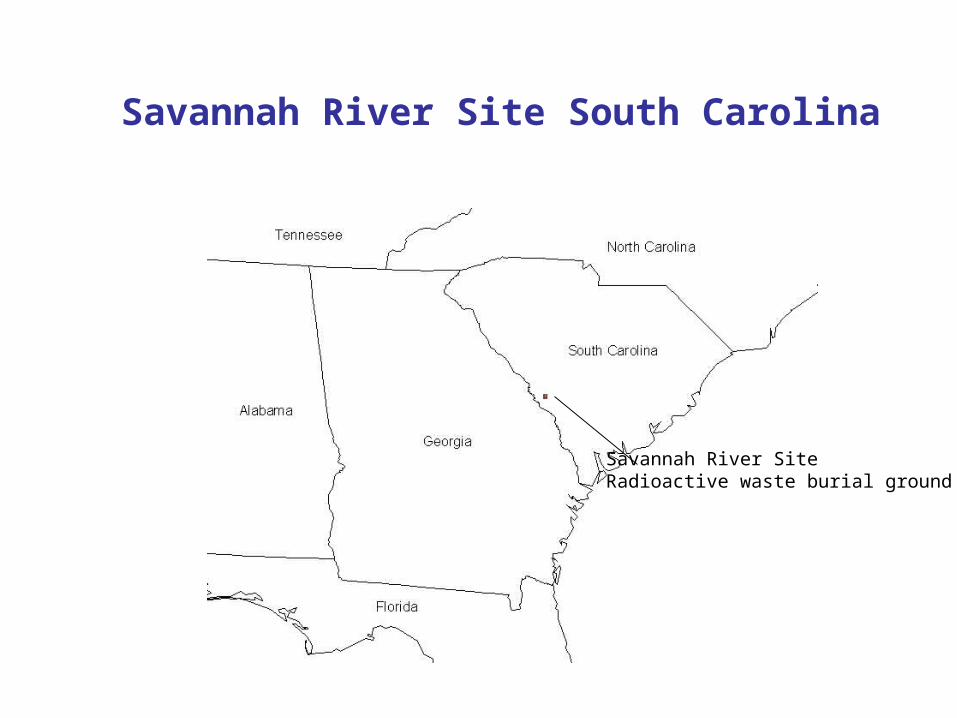
Savannah River Site South Carolina
Savannah River SiteRadioactive waste burial ground
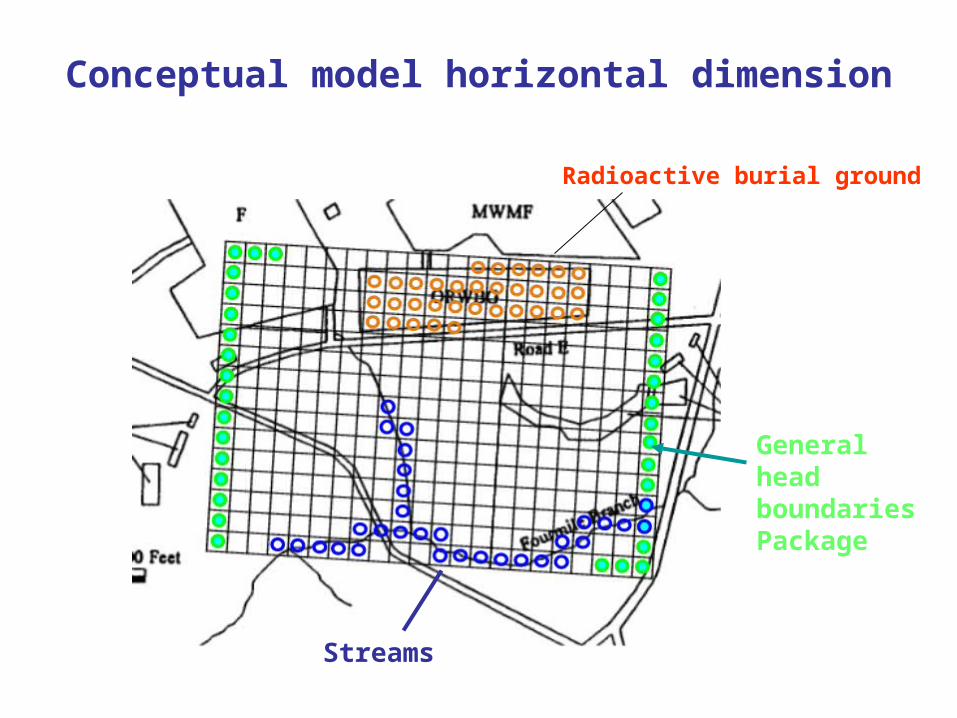
Conceptual model horizontal dimension
General head boundaries Package
Streams
Radioactive burial ground
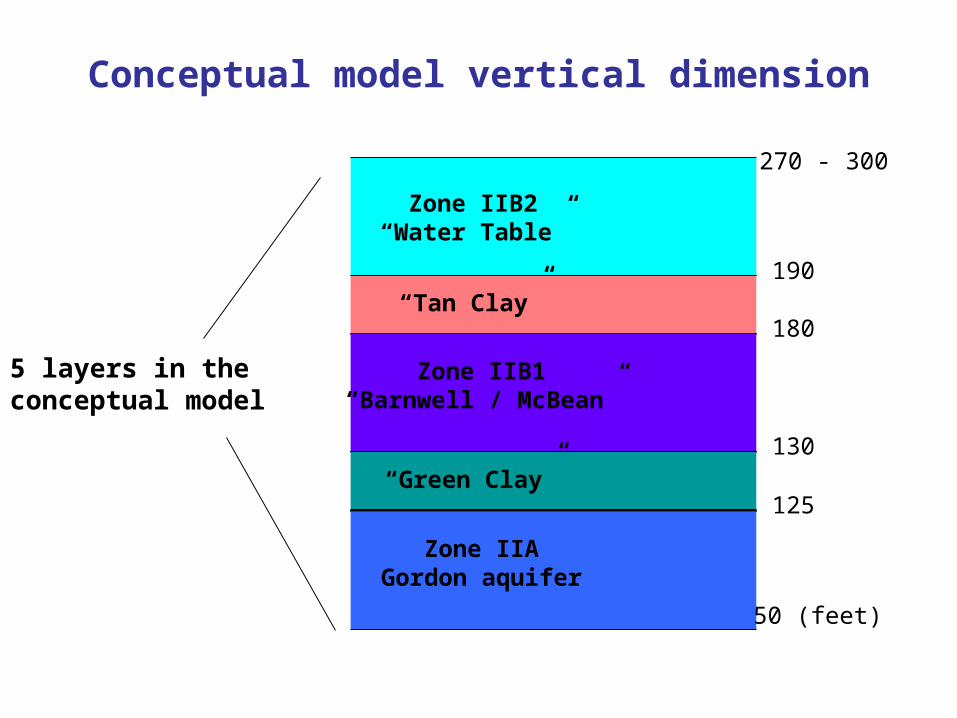
Conceptual model vertical dimension
5 layers in the conceptual model
Zone IIB2“Water Table”
190
270 - 300
“Tan Clay”180
Zone IIB1“Barnwell / McBean”
130
“Green Clay”125
Zone IIAGordon aquifer
50 (feet)
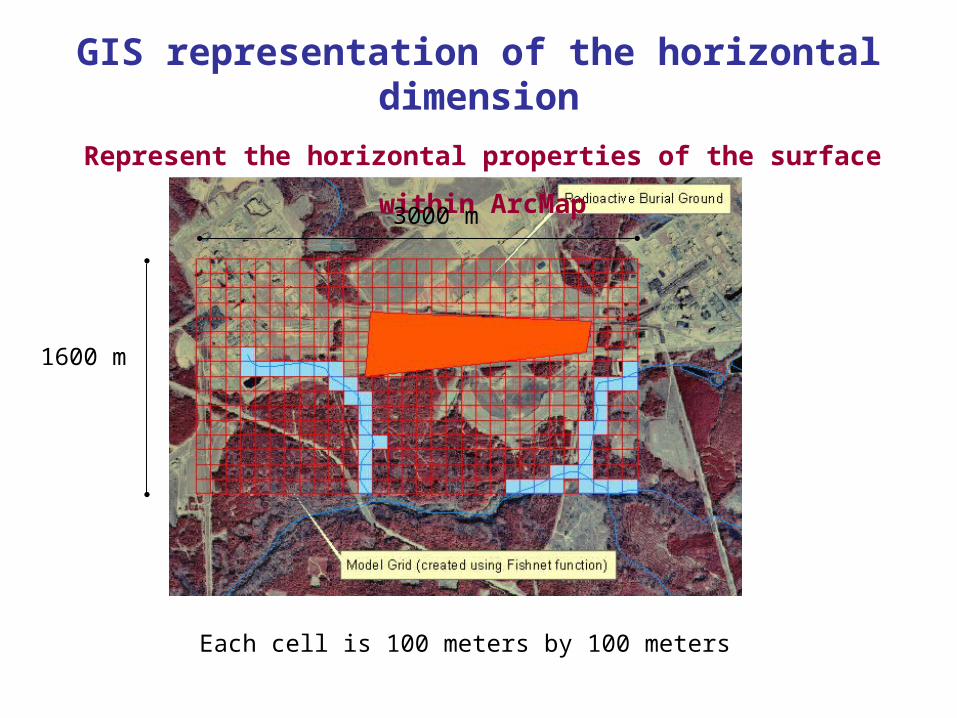
GIS representation of the horizontal dimension
Represent the horizontal properties of the surface within ArcMap
Each cell is 100 meters by 100 meters
1600 m
3000 m
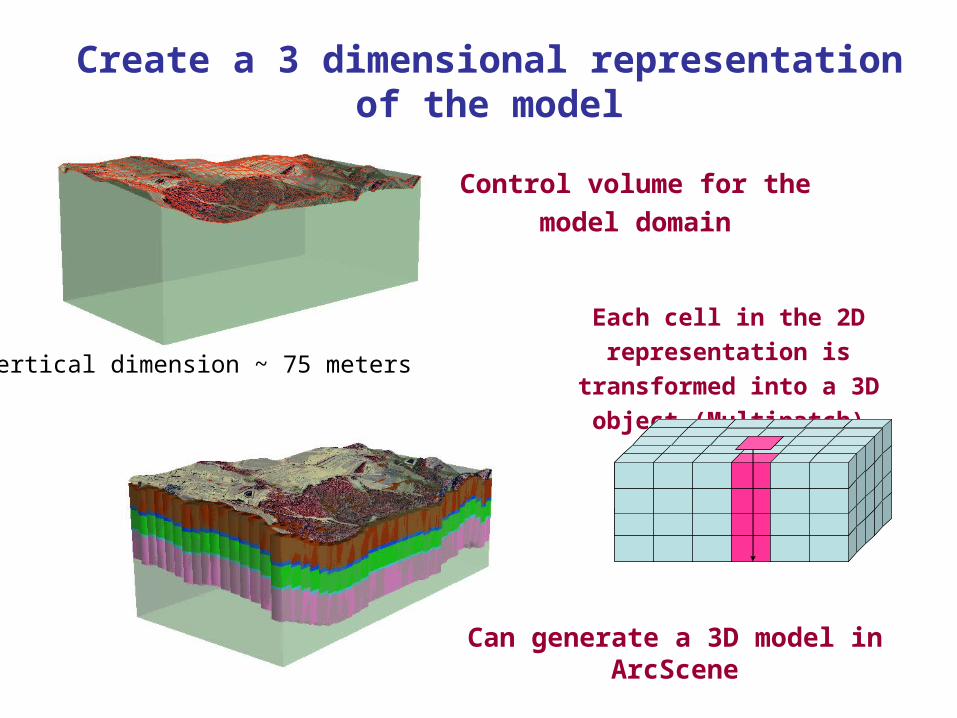
Create a 3 dimensional representation of the model
Can generate a 3D model in ArcScene
Vertical dimension ~ 75 meters
Each cell in the 2D representation
is transformed into a 3D object
(Multipatch)
Control volume for the
model domain
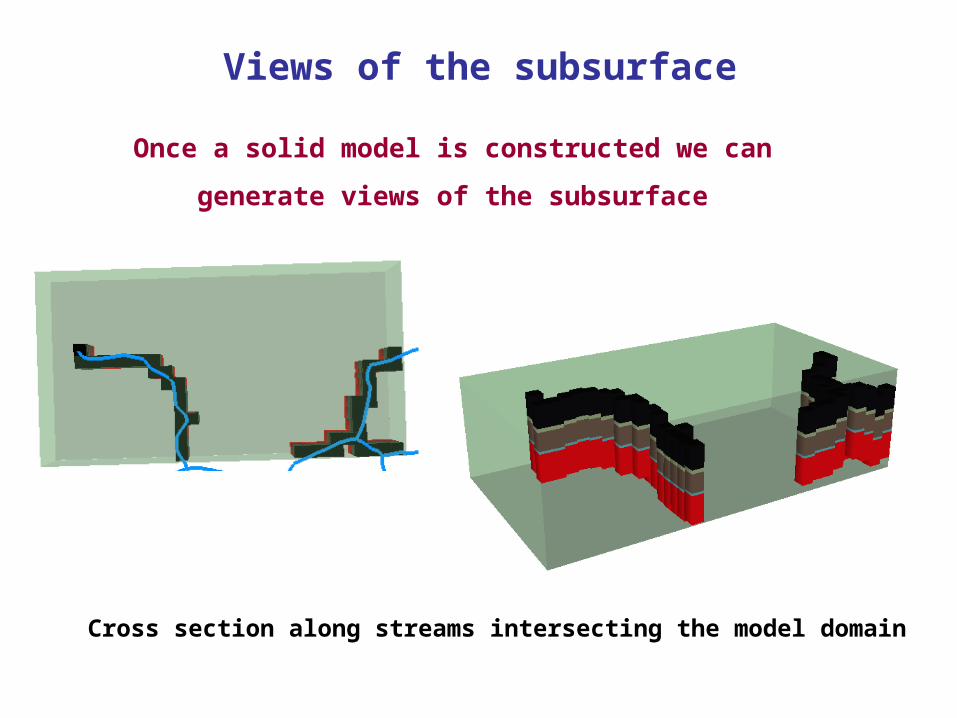
Views of the subsurface
Once a solid model is constructed we can generate views
of the subsurface
Cross section along streams intersecting the model domain
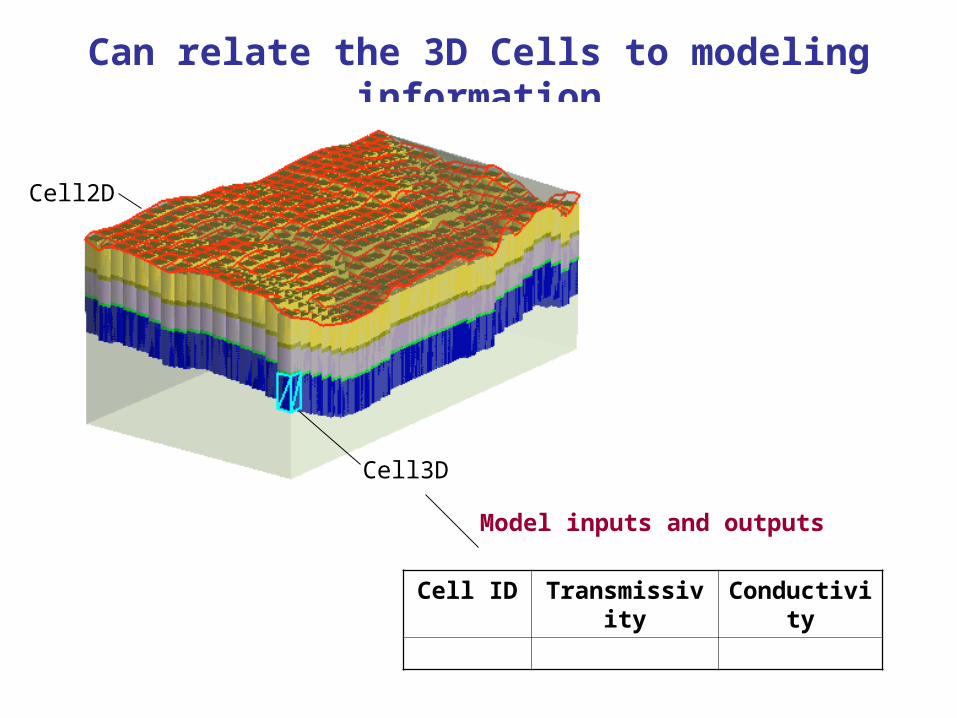
Can relate the 3D Cells to modeling information
Cell2D
Cell3D
Cell ID Transmissivity Conductivity
Model inputs and outputs
To Review the Groundwater Data Model
Please see “Groundwater” at http://support.esri.com/datamodels
To Get Latest Groundwater Tools
Please see “Groundwater” at http://http://www.crwr.utexas.edu/gis/gishydro04/