Embed Size (px)
Citation preview
Suspended Sediments in South San Francisco Bay
By Anna Kunkel
Maidment-GIS
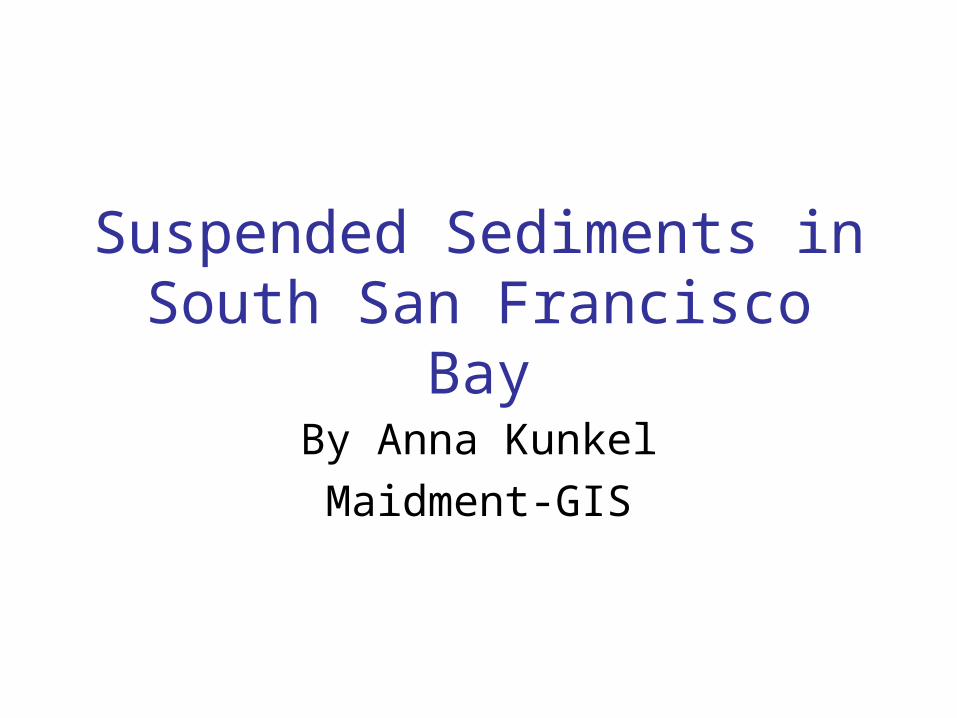
Objective
• To determine how different factors affect the levels of suspended sediments in the South San Francisco Bay.
• Factors examined– Location– Time of the Year– Precipitation
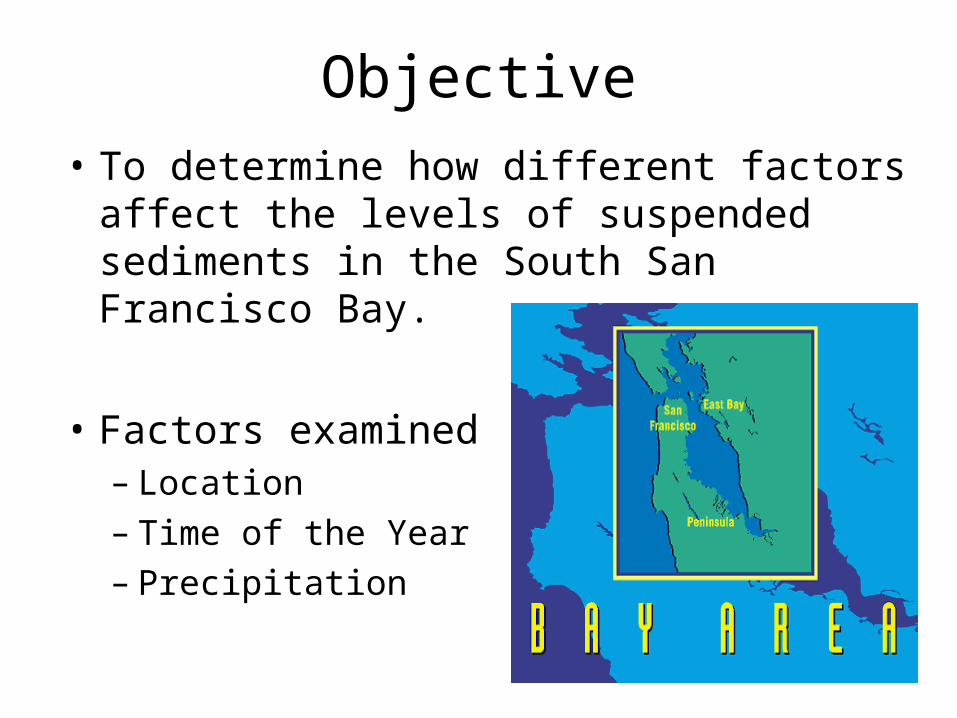
What are Suspended Sediments?
• Sediments--solid particles transported in fluid media or found in deposit after transportation by flowing water, wind, glacier and gravitational action.
• Suspension due to
River Turbidity Wind Waves
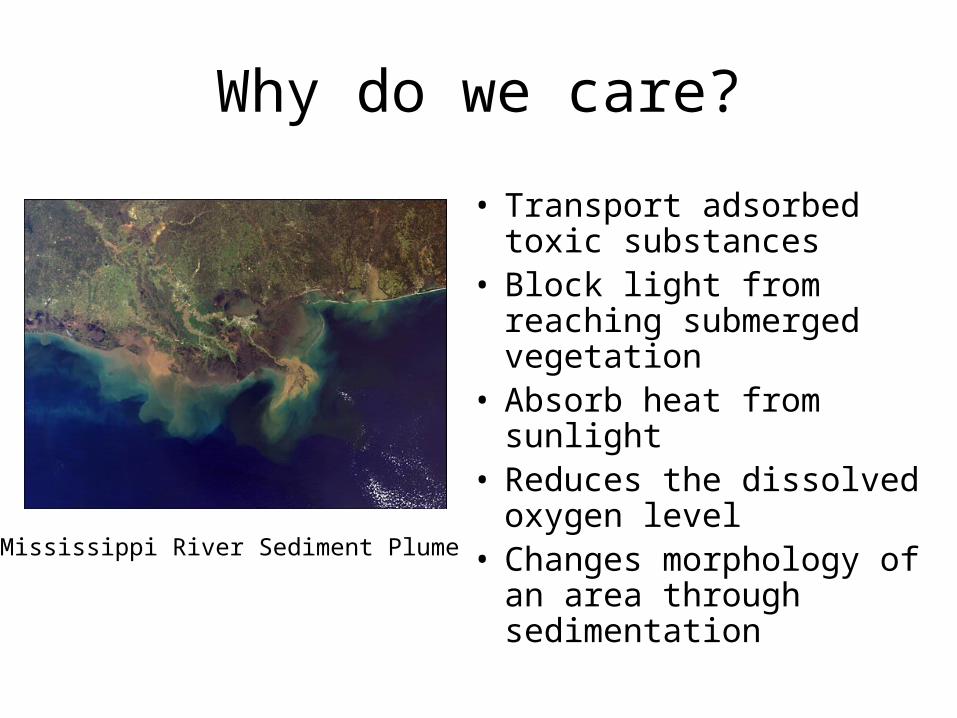
Why do we care?
• Transport adsorbed toxic substances
• Block light from reaching submerged vegetation
• Absorb heat from sunlight• Reduces the dissolved
oxygen level• Changes morphology of
an area through sedimentation
Mississippi River Sediment Plume
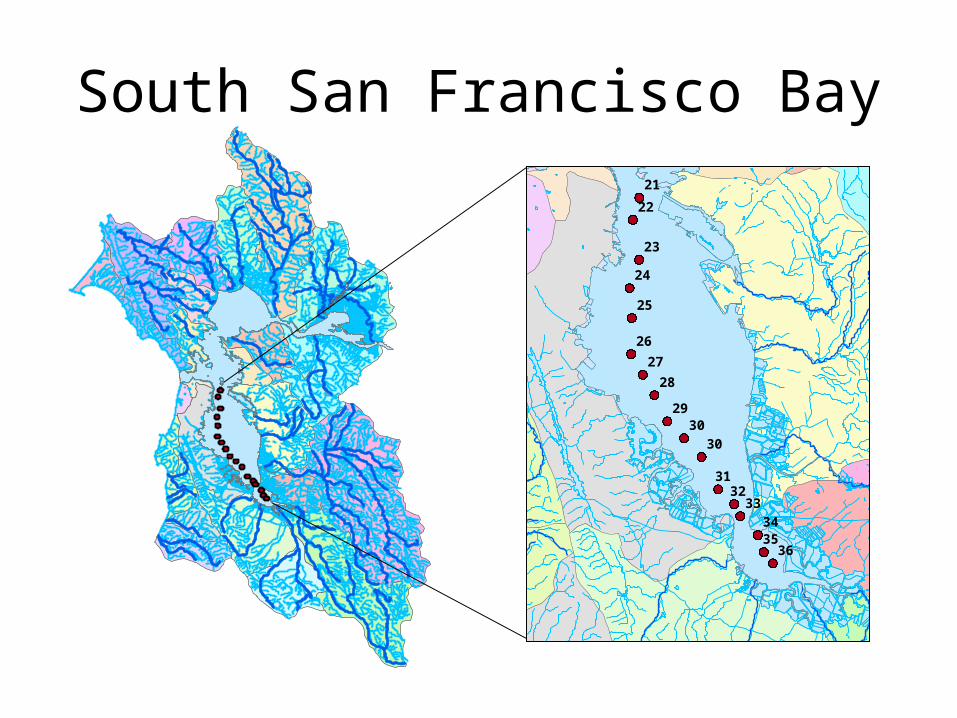
South San Francisco Bay
363534
3332
31
3030
29
28
27
26
25
24
23
22
21
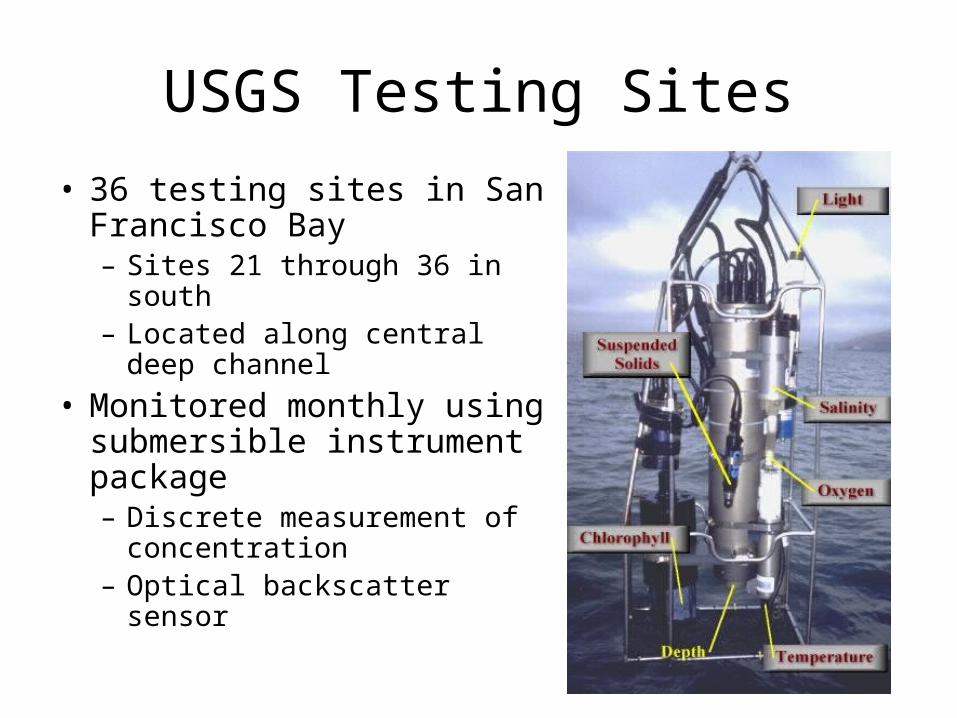
USGS Testing Sites
• 36 testing sites in San Francisco Bay– Sites 21 through 36 in south– Located along central deep
channel
• Monitored monthly using submersible instrument package– Discrete measurement of
concentration– Optical backscatter sensor

Suspended Sediment Levels Throughout 2001
0
50
100
150
200
250
Testing Station
Su
spen
ded
Sed
imen
t C
on
cen
trat
ion
(m
g/L
)
Dec
Nov
Oct
Sep
July
June
May
April
Mar
Feb
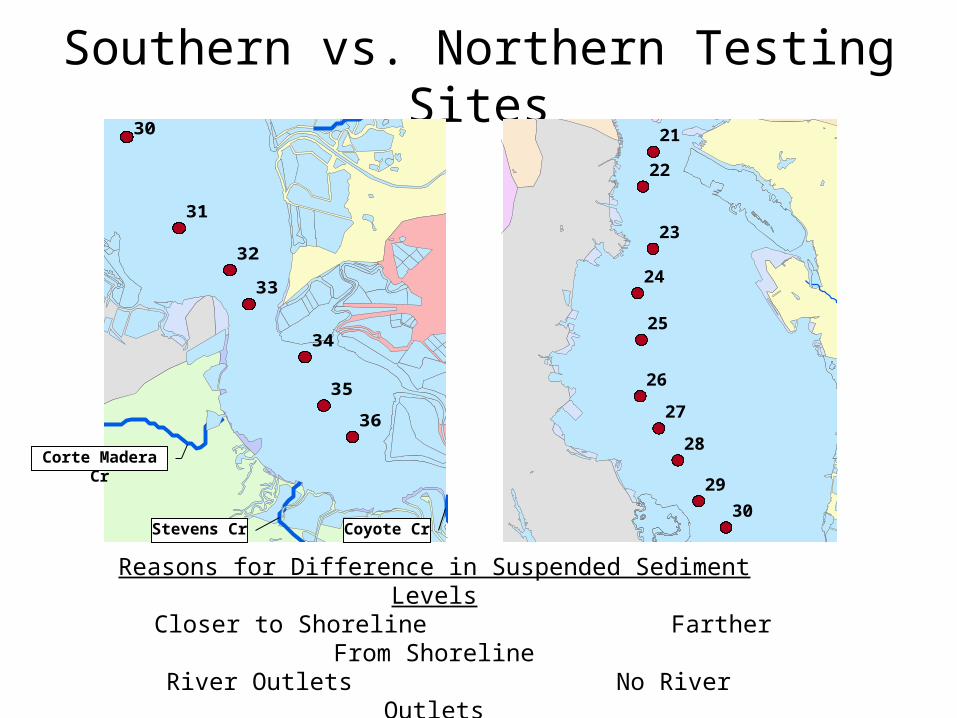
Southern vs. Northern Testing Sites
30
29
28
27
26
25
24
23
22
21
36
35
34
33
32
31
30
Reasons for Difference in Suspended Sediment Levels Closer to Shoreline Farther From Shoreline
River Outlets No River OutletsShallower Testing Sites Deeper Testing Sites
Corte Madera Cr
Stevens Cr Coyote Cr
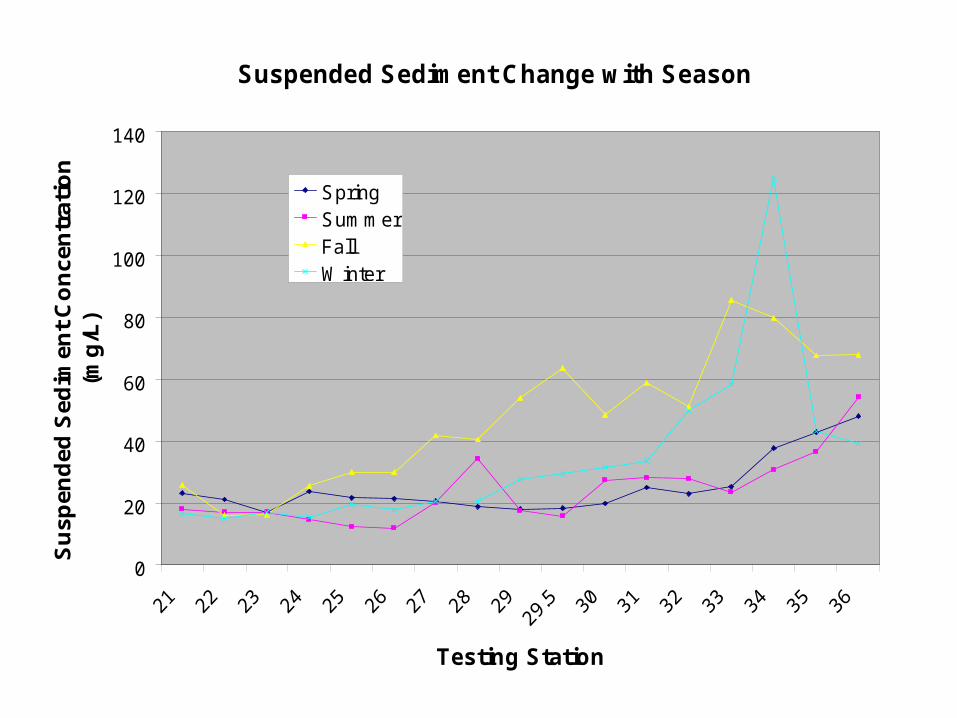
Suspended Sediment Change with Season
0
20
40
60
80
100
120
140
Testing Station
Su
spen
ded
Sed
imen
t C
on
cen
trat
ion
(m
g/L
)
SpringSummerFallW inter
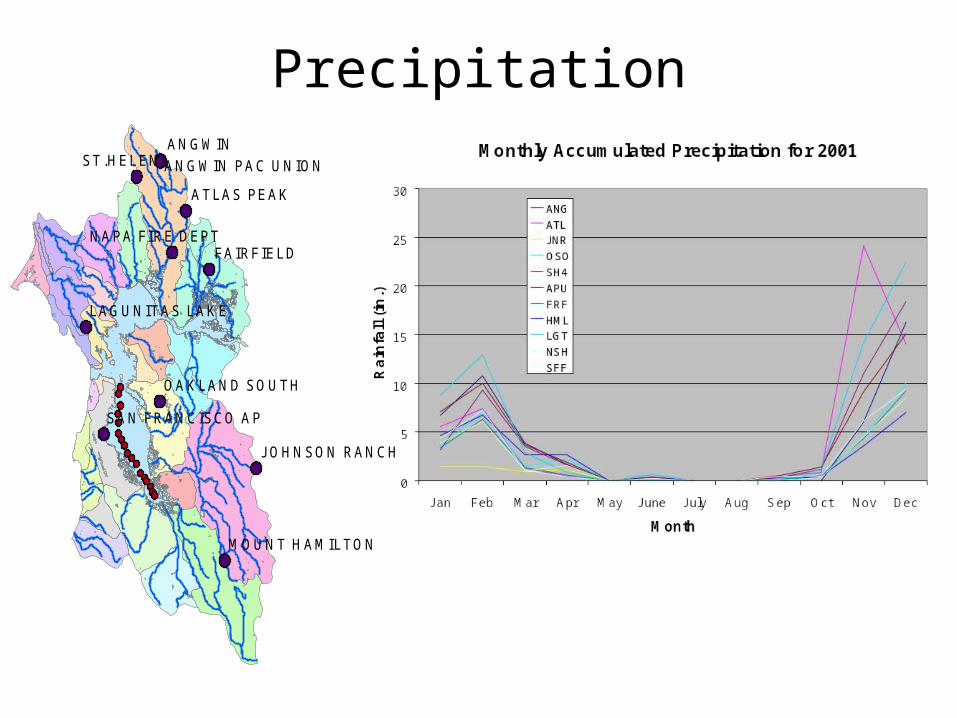
PrecipitationANGWIN
FAIRF IEL D
ST .HEL ENA
AT LAS PEAK
OAK LAND SOU TH
J OHNSON RANCH
NAP A F IRE DEP T
LAGUNIT AS LAK E
MOUNT HAMIL TON
SAN FRANCISCO AP
ANGWIN P AC UNION
SFF
NSH
LGT
HML
FRF
APUSH4
OSO
JNR
ATL
SFF
NSH
LGT
HML
FRF
APUSH4
OSO
JNR
ATL
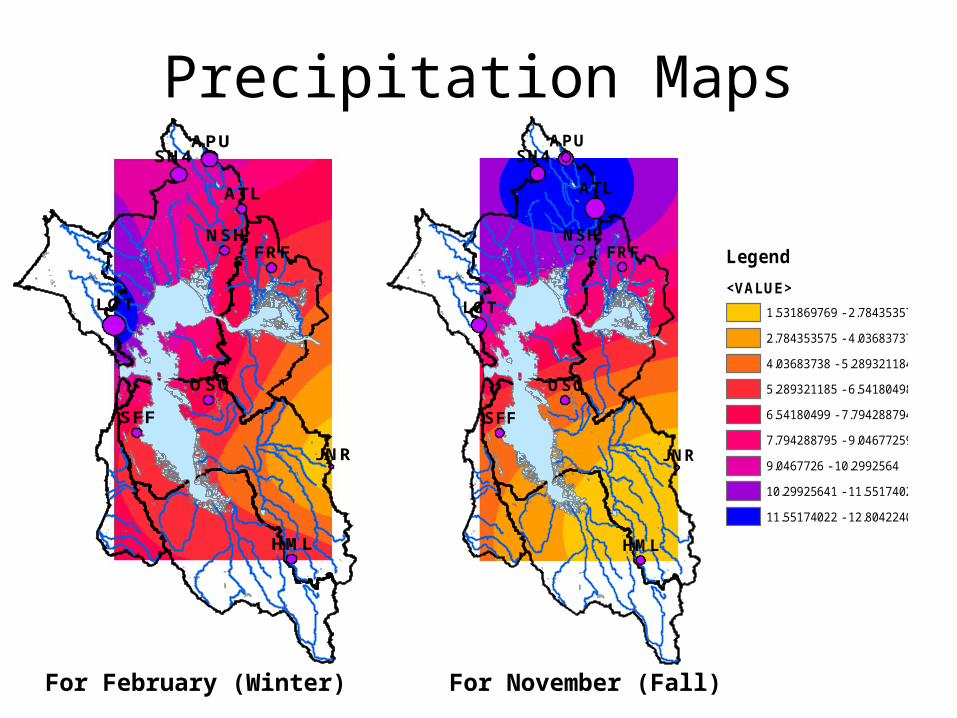
For February (Winter) For November (Fall)
Legend
<VALUE>
1.531869769 - 2.784353574
2.784353575 - 4.036837379
4.03683738 - 5.289321184
5.289321185 - 6.541804989
6.54180499 - 7.794288794
7.794288795 - 9.046772599
9.0467726 - 10.2992564
10.29925641 - 11.55174021
11.55174022 - 12.80422401
Precipitation Maps
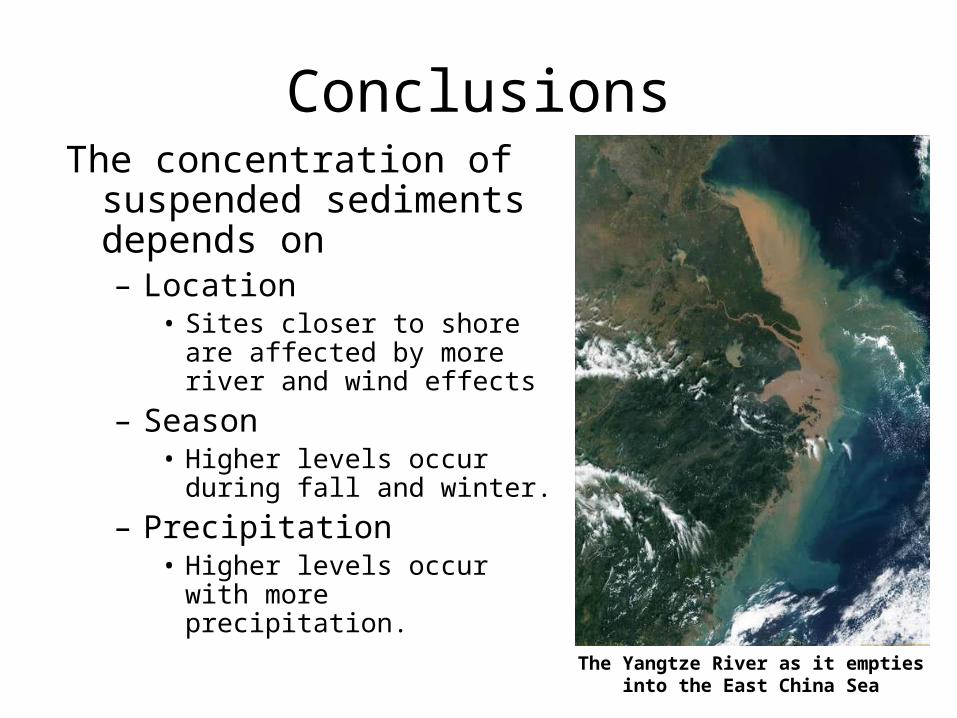
ConclusionsThe concentration of
suspended sediments depends on – Location
• Sites closer to shore are affected by more river and wind effects
– Season• Higher levels occur during fall
and winter.
– Precipitation• Higher levels occur with more
precipitation.
The Yangtze River as it empties into the East China Sea