Embed Size (px)
Citation preview

APPROACHES TO IMPROVE SPUTUM SMEAR MICROSCOPY
FOR TUBERCULOSIS DIAGNOSIS
EXPERT GROUP MEETING REPORT
GENEVA: 31 OCTOBER 2009 This report contains the collective views of an international group of experts, and does not necessarily
represent the decisions or the stated policy of the World Health Organization. Endorsement of a technology does not imply endorsement of any specific commercial product.
pre-publication copy

TABLE OF CONTENTS
1. BACKGROUND................................................................................................................................................1
2. EVIDENCE BASE ..............................................................................................................................................2
2.1 Process....................................................................................................................................2
2.2 Systematic reviews and meta-analyses.......................................................................................3
2.3 Evaluation of the strength of the evidence base .........................................................................3
2.4 Meeting procedural issues ........................................................................................................5
3. RESULTS .........................................................................................................................................................6
3.1. FRONT-LOADED VS CONVENTIONAL STRATEGIES FOR SPUTUM COLLECTION ................................6
3.1.1 Front-loaded vs conventional strategies using two specimens and direct ZN microscopy .........6
3.1.2 Front-loaded vs conventional strategies using three specimens and direct ZN microscopy .......6
3.1.3 Yield from two vs three specimens in a front-loaded approach with direct ZN microscopy .......6
3.1.4 Front-loaded vs conventional strategies in HIV-infected patients ...........................................7
3.1.5 Frontloaded vs conventional strategies using LED fluorescent microscopy..............................7
3.1.6 Single specimen microscopy in a front-loaded approach .......................................................7
3.1.7 Quality of evidence .............................................................................................................8
3.1.8 Balance of desirable and undesirable effects .........................................................................9
3.1.9 Values and preferences of patients.......................................................................................9
3.1.10 Cost and requirements...................................................................................................... 10
3.1.11 Research gaps identified ...................................................................................................10
FINAL RECOMMENDATION .............................................................................................................10
3.2 SPUTUM PROCESSING METHODS FOR IMPROVED SMEAR MICROSCOPY ....................................12
3.2.1 Bleach centrifugation .......................................................................................................12
3.2.2 Bleach sedimentation .......................................................................................................12
3.2.3 NALC-NaOH centrifugation ...............................................................................................13
3.2.4 NaOH centrifugation ........................................................................................................13
3.2.5 Any processing method in specimens from HIV-infected individuals.....................................14
3.2.6 Quality of evidence ..........................................................................................................14
3.2.7 Balance of desirable and undesirable effects ......................................................................17
pre-publication copy

3.2.8 Values and preferences of patients....................................................……………………………..17
3.2.9 Research gaps identified...................................................................................................17
FINAL RECOMMENDATION .............................................................................................................18
3.3 FLUORESCENT LIGHT EMITTING DIODE (LED) MICROSCOPY .......................................................19
3.3.1 Background .....................................................................................................................19
3.3.2 Systematic review methodology........................................................................................20
3.3.3 Study characteristics.........................................................................................................21
3.3.5 Study quality....................................................................................................................21
3.3.6 Accuracy of LED when compared to reference standards ....................................................22
3.3.7 Accuracy of LED compared to ZN microscopy .....................................................................23
3.3.8 Accuracy of LED compared to conventional FM microscopy.................................................24
3.3.9 Screening magnification....................................................................................................24
3.3.10 Time to read slides...........................................................................................................24
3.3.11 Cost estimates .................................................................................................................25
3.3.12 Training requirements...................................................................................................... 25
3.3.13 Head-to-head comparisons of LED devices.........................................................................26
3.3.14 Staining methods.............................................................................................................26
3.3.15 Fading of fluorochrome-stained slides ...............................................................................26
3.3.16 Summary of principal findings...........................................................................................28
3.3.17 Research gaps .................................................................................................................28
3.1.18 Final GRADE evaluation ....................................................................................................29
FINAL RECOMMENDATION ..........................................................................................................29
pre-publication copy

1
APPROACHES TO IMPROVE SPUTUM SMEAR MICROSCOPY FOR TUBERCULOSIS DIAGNOSIS
1. BACKGROUND
Direct sputum smear microscopy is the most widely used test for the diagnosis of pulmonary
tuberculosis (TB), available in most primary health care laboratories at health centre level. The
majority of laboratories use conventional light microscopy to examine Ziehl-Neelsen stained direct
smears, documented to be highly specific in areas with a high prevalence of TB but with varying
sensitivity (20-80%). Besides being labour-intensive, direct sputum smear microscopy may have
considerable patient costs and inconvenience associated with the need to submit multiple sputum
specimens over a period of up to three days. A number of TB control programmes have reported
high rates of initial patient default as a result.
Simple rapid diagnostics that can replace direct smear microscopy at the lower levels of health
services are urgently needed; however, it is also recognized that these are unlikely to become
available in the short to medium term. Considerable recent research has therefore focused on ways
to improve smear microscopy and its yield for TB case-finding. A series of systematic reviews
commissioned in 2005 by the UNICEF/UNDP/World Bank/WHO Special Programme for Research and
Training in Tropical Diseases (TDR) covered three ways of improving sputum microscopy: sputum
processing methods, fluorescence microscopy, and more efficient direct examination of specimens.
An Expert Consultation by WHO was subsequently convened in September 2005 to consider the
evidence in these reviews, with the following findings and recommendations:
Sputum processing methods
The systematic review on sputum processing methods reported that chemical processing (by bleach)
prior to concentration by centrifugation or overnight sedimentation improved the sensitivity of
smear microscopy by 18% and 23%, respectively. In all studies reported, sensitivity for processed
smears was higher than for direct smears, including one study involving HIV-infected individuals
(with mycobacterial culture as gold standard) where sensitivity was increased by 11%. The Expert
Consultation did, however, not recommend the use of bleach with centrifugation or sedimentation
at that time because of large variations in study methodology and inconsistencies in the results
reported. Additionally, concerns were raised about the safety of centrifugation-based methods at
peripheral laboratory level, and the feasibility of implementing such methods on a large-scale.
The Expert Consultation called for research to develop standardized methods and understand the
basis of the wide variability in performance reported. A number of research groups have addressed
this in studies since 2005.
Fluorescence microscopy
The systematic review of fluorescence microscopy (FM) reported sensitivity to be 10% higher than
conventional ZN microscopy, and noted that examination of fluorochrome-stained smears took 25%
of the time taken to examine ZN-stained smears. The Expert Consultation in 2005 recommended
that FM be considered at all levels of the health system, particularly in high HIV prevalence settings
and in settings with high laboratory workload. However, it was also acknowledged that FM based on
the technology available in 2005 (expensive microscopes with mercury vapour light sources) would
be difficult to implement in resource-poor settings. In addition, concern was expressed about the
lack of internationally-agreed methods for external quality assessment of FM.
pre-publication copy

2
The Expert Consultation called for research to develop fluorescence microscopes that could
overcome the limitations of existing equipment, particularly those related to capital costs and
maintenance needs. Since then it had been shown that low-cost ultra-bright light-emitting diodes
(LEDs) with a long lifespan could replace expensive mercury vapour lamps and enable the
development of microscopy systems that are substantially less expensive than conventional FM,
offering the possibility for widespread use of LED-based FM in resource-limited settings. In view of
these potential advantages, several companies have developed inexpensive, robust LED microscopes
or LED attachments for routine use in high-burden countries. Preliminary data suggested that LED
microscopy is feasible and as accurate as standard FM and field evaluation studies had been
completed in several countries.
Serial sputum specimen examination ('front-loading')
A systematic review of the yield of serial sputum specimen examinations for the diagnosis of TB
confirmed that the majority of TB cases were detected with the first sputum specimen (85.8%),
while the average incremental yield of the second and third sputum specimen was 11.9% and 3.1%
respectively. The Expert Consultation in 2005 concluded that, although the evidence was
compelling, the examination of three specimens would be necessary as long as the definition of a
smear-positive case required two positive smears.
The Expert Consultation called for further research on the sensitivity and specificity of a revised case
definition based on one positive smear. This research was subsequently undertaken by a number of
international partners and presented to the WHO Strategic and Technical Advisory group for TB
(STAG-TB). In 2007, the definition of a smear-positive case was revised by WHO and the minimum
number of sputum specimens to be examined reduced from three to two in settings where a well-
functioning external quality assurance system exists, the workload is high, and human resources are
limited. This approach greatly reduces the workload in laboratories, a considerable advantage in
countries with high HIV prevalence.
The Expert Consultation in 2005 also called for research on the optimal timing of specimen collection
to minimise delays in the patient diagnostic pathway. Currently, most sputum specimens - following
the spot-morning-spot system - are examined on the second day that the patient presents.
Alternatively, frontloaded microscopy (also called 'same day' or 'one-stop' microscopy) involves
sputum smear microscopy approaches that entails the majority (or all) of the specimens being
examined on the first day. Studies to determine whether the number of patient visits required for
standard TB diagnosis can be reduced, and whether the delay in diagnosis can be cut from three
days to one day, have subsequently been conducted, also investigating the possibility that drop-out
from the diagnostic pathway can be significantly reduced.
In 2009, three systematic reviews were commissioned by WHO to assess approaches to improve
microscopy for TB diagnosis. These included sputum processing methods, frontloaded strategies for
sputum investigation, and LED fluorescence microscopy.
2. EVIDENCE BASE
2.1 Process
The systematic, structured, evidence-based process for policy generation as developed recently by
WHO was followed: The first step constituted a systematic review and meta-analysis of available
data (published and unpublished) using standard methods appropriate for diagnostic accuracy
pre-publication copy

3
studies. The second step involved the convening of an Expert Group to a) evaluate the strength of
the evidence base; b) recommend operational and logistical considerations for mainstreaming such
the methods/approaches into national TB control programmes; and c) identify gaps to be addressed
in future research. Based on the Expert Group findings, the third and final step involves WHO policy
guidance on the use of these tools/approaches, presented to the WHO Strategic and Technical
Advisory Group for TB (STAG-TB) for consideration, and eventual dissemination to WHO member
states for implementation.
The Expert Group (Annex 1) consisted of researchers, clinicians, epidemiologists, end-users
(programme and laboratory representatives), and evidence synthesis experts. The Expert Group
meeting followed a structured agenda (Annex 1) and was chaired by WHO. To comply with current
standards for evidence assessment in formulation of policy recommendations, the GRADE system
(www.gradeworkinggroup.org), recently adopted by WHO for all policy and guidelines development,
was used. The GRADE approach, assessing both the quality of evidence and strength of
recommendations, aims to provide a comprehensive and transparent approach for developing policy
guidance. Started about 10 years ago to assess treatment interventions, the GRADE approach has
recently been refined for diagnostics;1 however, while the latter process shares the fundamental
logic of recommendations for other interventions (notably treatment), it also presents unique
challenges, most often due to study limitations related to a lack of data on patient-important
outcomes and impact (see below).
Randomised controlled trials (RCTs) of alternative diagnostic approaches represent the ideal study
design for informing eventual policy decisions; however, very few such studies are available for
diagnostic interventions in general. Data from RCTs were available for the systematic review on
front-loading (with outcomes focussed on diagnostic accuracy), but not for the sputum processing or
LED microscopy reviews.
Recognising that test results are surrogates for patient-important outcomes, the Expert Group
evaluated diagnostic accuracy while also drawing inferences on the likely impact of these
approaches on patient outcomes, as reflected by false-negatives (ie. cases missed) or false-positives.
In addition, the Expert Group considered the implications of each approach or method for
programmatic implementation, including laboratory infrastructure, human resources, interface
between patients and laboratory services, diagnosis and initiation of treatment, costs to the health
system and to patients, and research gaps.
2.2 Systematic reviews and meta-analyses
Systematic reviews and meta-analyses were commissioned by WHO for each approach under
evaluation. One of the standardised objectives was, for each method/approach, to perform a
systematic review of available literature (published and unpublished), followed by a meta-analysis
(where appropriate), on data examining the diagnostic accuracy of each approach for the detection
of TB cases. All systematic reviews and meta-analyses followed standard protocols, using
predetermined eligibility criteria for the primary analyses. Detailed methodology is described in
individual systematic review reports available at www.who.int/tb/dots/laboratory/policy.
2.3 Evaluation of the strength of the evidence base
Evaluation followed the GRADE system for grading quality of evidence and strength of
recommendations for diagnostic tests and strategies. The quality of evidence was graded by six
criteria:
• Study design
pre-publication copy

4
a. Cross-sectional: Random or consecutive selection of patients/specimens at risk
(preferred)
b. Case-control: Selection of patients/specimens according to reference standard
• Risk of bias (as reflected by the QUADAS tool)
Compliance of studies with 14 independent quality assessment criteria (Table 1)
• Directness
Presence of direct evidence of impact on patient-important outcomes and generalisability
• Inconsistency
Unexplained inconsistency in sensitivity or specificity estimates
• Imprecision
Wide confidence intervals for pooled sensitivity or specificity estimates
• Publication/reporting bias
Publications of research based on their nature and outcome, eg. studies showing poor
performance not being published, language bias, etc.
Study limitations were assessed by QUADAS (Quality Assessment of Diagnostic Accuracy Studies)
criteria, a validated tool based on a checklist of 14 essential items:2
As called for by GRADE, the Expert Group also considered for each method/approach the strength of
the recommendation (strong or weak), based on a balance of effects (advantages weighed against
disadvantages), patient values and preferences, and - in the case of LED microscopy - costs related to
human resources, laboratory infrastructure, equipment and consumables. Given the absence of
relevant data from the studies reviewed, assumed patient values and preferences were assessed by
test accuracy as a proxy measure, based on the relative importance/impact of false-positive and
false-negative results:
pre-publication copy

5
• True positives: Benefit to patients from earliest diagnosis and treatment;
• True negatives: Patients spared unnecessary treatment; benefit of reassurance and
alternative diagnosis;
• False positives: Likely patient anxiety and morbidity from additional testing, unnecessary
treatment; may halt further diagnostic evaluation;
• False negatives: Increased risk of patient morbidity and mortality, and continued risk of
community transmission of TB.
The GRADE process allows for systematic reviewers to add additional quality indicators if deemed
relevant. The reviews for front-loading and sputum processing methods therefore extracted
additional data on external quality assurance from studies.
2.4 Meeting procedural issues
The systematic review reports were made available to the Expert Group for scrutiny before the
meeting.
As agreed, interchange by Expert Group meeting participants was restricted to those who attended
the Expert Group meeting in person, both for the discussion and follow-up dialogue.
The Expert Group was urged to formulate practical recommendations that countries would be able
to use. WHO is committed to ensuring that the highest standards of evidence are used in
formulation of recommendations and has therefore standardised the synthesis process based on the
GRADE approach. The first paper specifically addressing the GRADE approach to diagnostic tests and
strategies was published in 2008 (Schunemann. BMJ 2008; 336:1106-1110) and was made available
to the Expert Group in the background documentation for the meeting.
It was explained that individuals were selected to be members of the Expert Group to carefully
represent and balance important perspectives for the process of formulating recommendations.
Therefore the Expert Group included technical experts, end-users and evidence synthesis
methodologists.
As expected, it took some time and energy for the Expert Group to begin to understand and work
effectively with the GRADE approach. While the Group appreciated the rationale for using a
standardised approach and endorsed the direction provided by the GRADE process, concerns were
expressed that GRADE methodology is not yet fully developed or adapted for evaluation of public
health strategies or programmatic interventions, which are often complex and multi-factorial. Four
issues in particular were highlighted:
• The lack of standardised methodology to search for and objectively synthesize evidence on
operational implementation issues, costs to health services, costs to patients, and patient
perspectives on new diagnostic tests and approaches;
• The risk that narrative evidence on the above issues may be excluded from search strategies
during systematic reviews of studies on diagnostic accuracy;
• Concern that results from qualitative and socio-economic studies may not have been
captured in the systematic reviews on diagnostic accuracy of the different approaches;
pre-publication copy

6
• The risk that results from studies on microscopy techniques may be under-weighted if
mycobacterial culture is used as the only reference standard for comparison, especially in
settings where culture capacity does not exist;
• The risk that patient outcomes may not reflect the accuracy or benefit of a diagnostic
test/approach in settings with weak overall health infrastructure (eg. rapid or improved
microscopy in facilities where stock-outs of anti-TB drugs occur frequently);
• The possible tension (for TB tuberculosis diagnosis and control) between the importances of
individual patient outcomes vs public health outcomes (eg. the notion that false-negative
sputum smear results may pose a greater public health risk than false-positive results).
The Expert Group felt strongly that these concerns should be fed back to the GRADE Working Group
and should also be taken into account when the final recommendations emerging from this
consultation are considered by STAG. These concerns should also be addressed by WHO during
future systematic reviews and Expert Group consultations.
3. RESULTS
3.1. FRONT-LOADED VS CONVENTIONAL STRATEGIES FOR SPUTUM COLLECTION
The results from seven studies involving 7,308 patients were reviewed.
3.1.1 Front-loaded vs conventional strategies using two specimens and direct ZN microscopy
Pooled summary estimates showed that the sensitivity of a front-loaded approach (64%; 95CI 59% -
69%) was similar to that of the conventional two-specimen approach (65%; 95CI 62% - 69%). Pooled
specificity estimates were identical (98%; 95CI 97% - 99%;).
One large randomised controlled trial (6,628 patients in four different sites) reported data on
differential patient losses to follow-up for the two diagnostic approaches, indicating that patients
assigned to the front-loaded scheme were more likely to submit the first two (spot-spot) specimens
than patients assigned to the conventional (spot-morning) scheme (97.9% vs 94.3%; difference 3.6%,
95%CI 2.7-4.5%).
3.1.2 Front-loaded vs conventional strategies using three specimens and direct ZN microscopy
Pooled sensitivity estimates for the two strategies were similar and did not differ statistically: front-
loading 71% (95CI 65% - 77%); conventional 68% (95CI 63% - 73%). Pooled specificity estimates were
also similar at 98% (95CI 96% - 99%) for front-loading and 99% (95CI 97% - 99%) for the conventional
approach.
In the same study mentioned above reporting data on differential losses to follow-up (6,628
patients, four different sites), patients assigned to the front-loaded approach were more likely to
submit the third specimen (94.2%) than those assigned to the conventional approach (92.7%),
difference 1.5%, 95% CI 0.3%-3.7%.
3.1.3 Yield from two vs three specimens in a front-loaded approach with direct ZN microscopy
The sensitivity of three-specimen front-loaded microscopy was slightly superior (4.8%) to that of
two-specimen front-loaded microscopy, although specificity (98%) did not vary (data not shown).
pre-publication copy

7
3.1.4 Front-loaded vs conventional strategies in HIV-infected patients
The abovementioned randomised controlled trial reported data on the performance of front-loaded
and conventional strategies in a subset of HIV-infected patients (n=586). For the two-specimen
collection strategy, the conventional approach was less sensitive (50%; 95CI 36% - 64%) than front-
loaded microscopy (66%; 95CI 52% - 78%) although this difference was not statistically significant
Specificity using front-loaded microscopy was lower (95%; 95CI 91% - 98%) than conventional
microscopy (98%; 95CI 95% - 99%), but this difference was not statistically significant). No
significantly different results were observed between a three-specimen and two-specimen front-
loaded approach.
3.1.5 Frontloaded vs conventional strategies using LED fluorescent microscopy
One study compared front-loaded and conventional strategies, using LED fluorescent microscopy, in
a subset of patients (n=2,303) enrolled in the randomised controlled trial mentioned above. Using
the two-specimen collection strategy, the sensitivity of front-loaded LED microscopy (68%; 95CI 62%
- 74%) did not differ significantly from that of conventional fluorescent microscopy (72%; 95CI 66% -
77%). Specificity of front-loaded LED microscopy (95%; 95CI 93% -96%) was also not statistically
different when compared to conventional fluorescent microscopy (94%; 95CI 92% - 95%).
Findings were similar for the three-specimen collection strategy: Sensitivity of front-loaded LED
microscopy (75%; 95CI 69% - 80%) did not differ significantly from that of conventional fluorescent
microscopy (74%; 95CI 6%8 - 79%). Specificity also did not differ between the two methods, LED
specificity being 92% (95CI 91% - 94%) and that of conventional fluorescent microscopy being 93%
(95CI 91% - 94%).
This difference was smaller when the proportion of patients with three smears was considered (94.2% in the
frontloaded and 92.7% in the standard scheme, difference 1.5%, 95%CI 0.3%-3.7%).
When three-specimen front-loaded LED microscopy was compared with a two-specimen frontloaded
LED approach, sensitivity did not differ statistically although specificity was slightly lower (data not
shown).
3.1.6 Single specimen microscopy in a front-loaded approach
Two of the paired observational studies carried out secondary analyses on the yield from two smears
prepared from the same sputum specimen (1,849 patients). Overall, the quality of evidence for both
studies was rated as low, being downgraded for risk of bias, absence of patient-important outcomes,
and inconsistent results. QUADAS criteria (risk of bias) particularly suffered from lack of patient
representativeness and uninterpretable results not being reported, possibly over-inflating accuracy
estimates:
Sensitivity and specificity estimates differed between the two studies, with lower sensitivity seen in
the study which enrolled hospitalised patients only, included a higher proportion of HIV-infected
patients, and used concentrated fluorochrome smears.
There was no significant difference in sensitivity or specificity between two-smear conventional
microscopy and two-smear single specimen microscopy; however, heterogeneity (variability) was
observed in both sensitivity and specificity in individual studies and since fewer than four studies
were available no pooled accuracy estimates could be reliably generated.
Data were therefore excluded from subsequent assessment by the Expert Group.
pre-publication copy

8
3.1.7 Quality of evidence
Table 1 provides a summary of the accuracy data for conventional vs front-loaded approaches using
microscopy.
Table 1. Summary of accuracy data on front-loaded approaches to case-finding by microscopy
APPROACH Conventional Front-loaded
# Studies 7 7
# Participants 7,308 7,308
Pooled accuracy estimates from meta-analyses
Two specimens and direct ZN
Sensitivity
Specificity
consequence assuming 20% prevalence,
with expected # per 1000
65% (95CI 62 - 69)
98% (95CI 97 - 99)
TP TN FP FN
130 784 16 70
64% (95CI 59 - 69)
98% (95CI 97 - 99)
TP TN FP FN
128 784 16 72
Three specimens and direct ZN
Sensitivity
Specificity
consequence assuming 20% prevalence,
with expected # per 1000
Note: No statistically significant difference
between two- and three-specimen
strategy
68% (95CI 63 - 73)
99% (95CI 97 - 99)
TP TN FP FN
136 792 8 64
71% (95CI 65 - 77)
98% (95CI 96 - 99)
TP TN FP FN
142 784 16 58
Accuracy estimates in subset of HIV-positive
patients (one study, n = 586)
Sensitivity
Specificity
Note: No statistically significant difference
50% (95CI 36 - 64)
98% (95CI 95 - 99)
66% (52 - 78)
95% (91 - 98)
Accuracy estimates using front-loaded LED
microscopy (one study, n = 2,303)
Sensitivity
Specificity
Note: No statistically significant difference
72% (95CI 66 - 77)
94% (95CI 92 - 95)
68% (62 - 74)
95% (93 - 96)
pre-publication copy

9
Factors affecting quality of evidence
Design1
Risk of bias (QUADAS)2
Directness (generalisability)3,4
Inconsistency
Imprecision
Publication/reporting bias
3 paired observational, 4 randomised controlled trials
None
Some uncertainty (-1 for patient-important outcomes)
Low
Low
Unlikely
1All studies used culture as a reference standard and examined unprocessed (direct) smears using light microscopy with
conventional ZN staining;
2All studies satisfied all 14 QUADAS quality requirements;
3Quality of evidence was downgraded in all systematic reviews for insufficient evidence on patient-important outcomes.
False-positive results were judged to be less serious than false-negative results for public health impact (Expert Group
opinion);
4All studies were conducted in a wide range of settings and appropriate patient groups. Many of the studies had been
carried out in high HIV-prevalence settings, although limited data on HIV status of individual patients were available..
3.1.8 Balance of desirable and undesirable effects
• Concern was expressed about the loss of the morning specimen in a front-loaded approach,
especially as the reference specimen for culture for those diagnostic centres where culture is
routinely performed;
• The proportion of patients completing diagnostic evaluation was similar in a randomised control
trial comparing front-loaded and conventional approaches; however, more data are needed
from routine/programmatic settings where patient drop-out is common to assess this patient-
important outcome more fully;
• A front-loaded approach will, at the very least, not be any worse than the conventional approach
in terms of its ability to detect and start smear positive patients on treatment.
3.1.9 Values and preferences of patients
• No data were presented on values and preferences of patients, but the opinion and experience
of selected Expert Group members suggested that (especially) poor patients have many
difficulties with the conventional approach and may prefer a front-loaded approach which at
least has the potential to reduce the time taken and patient costs incurred for a diagnosis to be
established;
• On the other hand, selected members of the Expert Group raised concerns about the
acceptability of a prolonged stay at health services while patients are waiting to produce the
second specimen in a front-loaded approach, especially by employed patients. Concerns were
also expressed about the risk of TB transmission in congregate settings and vulnerable
populations (such as HIV-positive individuals, children, and pregnant women, especially where
infection control measures are weak;
pre-publication copy

10
• Concerns were expressed on the impact of a front-loaded approach on laboratory work load and
organization, and the need to ensure that specimens collected in a front-loaded approach be
read and the results reported on the same day.
3.1.10 Cost and requirements
• No data were presented, but selected members of the Expert Group were of the opinion that
front-loading would reduce costs to both the health service and to patients;
• On the other hand, selected members of the Expert Group expressed concerns about the health
service cost related to implementation of front-loading, notably retraining of health care and
laboratory staff;
3.1.11 Research gaps identified
Further research on the patient-important outcomes of a front-loaded approach to sputum
collection is encouraged in the following areas:
• Patient preferences on front-loaded vs standard sputum collection approaches;
• Costs to patients and health services of front-loaded vs conventional sputum collection
approaches;
• Patient drop-out during the diagnostic process comparing front-loading to conventional
sputum collection approaches;
• The relative yield when two smears are prepared from the same sputum specimen.
These issues are best explored under programmatic conditions, preferably during phased
implementation, so that comparisons can be made between sites implementing front-loading and
sites still using conventional approaches.
FINAL RECOMMENDATION
The Expert Group felt that there was sufficient generalisable evidence that front-loading is
equivalent, in terms of diagnostic accuracy, to existing conventional case-finding approaches by
microscopy, irrespective of whether two or three specimens are used. However, countries that may
wish to switch to a front-loaded approach should do so through a carefully phased implementation
plan to ensure that critical programmatic and operational issues are addressed.
Implementation should be preceded by a validation phase in each setting in which a front-loaded
approach is considered, ensuring that the following programmatic issues are adequately addressed:
• Training requirements for at least the following health personnel cadres: staff responsible for
requesting sputum smear microscopy, staff instructing patients on sputum collection and
submission, laboratory staff, staff responsible for registering patients and initiating TB
treatment;
pre-publication copy

11
• Alignment of sputum collection, microscopy reporting, and initiation of TB treatment as far as
possible within existing human resource and laboratory work-load constraints. Front-loading
has the potential to reduce costs for patients, but this potential can only be realised if results are
issued and treatment initiated alongside the front-loading time-scale;
• Separation of patients producing sputum specimens from other non-coughing patient groups
(especially those with HIV) to reduce the risks of TB transmission in health care settings.
Adequate infection control practices and rapid triage of coughing patients in congregate settings
and vulnerable populations are imperative;
• Monitoring of patient drop-out between laboratory and treatment registers, and monitoring of
trends in case-detection and treatment outcomes are essential.
OVERALL QUALITY OF EVIDENCE MODERATE
STRENGTH OF RECOMMENDATION STRONG, PROVIDED THAT PROGRAMMATIC
CHALLENGES ARE SIMULTANEOUSLY ADDRESSED
WEAK, IF PROGRAMMATIC CHALLENGES ARE NOT
SIMULTANEOUSLY ADDRESSED
----- 000 -----
pre-publication copy

12
3.2 SPUTUM PROCESSING METHODS FOR IMPROVED SMEAR MICROSCOPY
Classification of studies according to chemical and physical sputum processing methods identified
four groups containing at least four studies (to allow pooled accuracy estimates to be done): Bleach
was the most common agent (14 studies), followed by NALC-NaOH (8 studies) and NaOH alone (5
studies). All studies that used NALC-NaOH or NaOH alone physically processed specimens by
centrifugation. The four groups identified by combining chemical and physical processing methods
were 1) bleach centrifugation; 2) bleach sedimentation; 3) NALC-NaOH centrifugation; and 4) NaOH
centrifugation alone. In addition to these four groups, data were synthesized separately for four
studies that reported diagnostic accuracy estimates among confirmed HIV-infected patients.
Results are summarised below. Detailed methodology and findings are described in individual
systematic review reports (www.who.int/tb/dots/laboratory/policy)
3.2.1 Bleach centrifugation
Nine cross-sectional studies involving 3,923 participants were reviewed. Five (56%) studies
performed bleach processing using a concentration of 5% or more, five (56%) studies performed
centrifugation at high speed (>=2,500 rpm or >=2,000g), and seven (788%) studies examined smears
using light microscopy after ZN staining. Six (67%) studies reported that smears were prepared and
interpreted in the same laboratory and four (44%) studies reported that external quality assurance
was in place.
No study met all QUADAS criteria assessed and only three (33%) studies adequately described
patient/specimen selection. The majority of studies did, however, satisfy all of the other QUADAS
criteria.
Sensitivity was inconsistent across studies for bleach centrifugation (range 44% - 73%; p<0.001))
when compared to direct microscopy (range 31% - 72%; p<0.001). Pooled sensitivity was higher for
bleach centrifugation (65%; 95CI 59 - 71) than for direct microscopy (56%; 95CI 49%- 63%). When
sensitivity differences were pooled across studies, bleach centrifugation microscopy was 6% (95CI
3% - 10%; p00.001) than direct microscopy.
Specificity was consistent for direct microscopy (range 95% - 100%; p0.06) but more variable for
bleach centrifugation microscopy (range 81% - 100%; p<0.001). Pooled specificity was high for both
bleach centrifugation (96%; 95CI 93% - 98%) and for direct microscopy (98%; 95CI 97% - 99%).
However, there was a small but statistically significant decrease in specificity with bleach
centrifugation microscopy (-3%; 95CI -4% to -1%; p=0.004).
Compared to direct microscopy, bleach microscopy was 3% (95CI 1% - 6%; p=0.02) more sensitive in
studies using low-speed centrifugation and 7% more sensitive (95CI 1% - 14%; p=0.002) in studies
using high-speed centrifugation. However, specificity was significantly decreased with high-speed (-
6%; 95CI -11% to -1%, p=0.02) but not with low speed centrifugation (-1%; 95CI -3% to +1%; p=0.18).
3.2.2 Bleach sedimentation
Five cross-sectional studies involving 2,307 participants were reviewed. Five (40%) performed
bleach processing using a concentration of 5% or more, 3 (60%) studies performed overnight
sedimentation, and all studies examined smears using light microscopy and ZN staining. All studies
reported that smears were prepared and interpreted in the same laboratory and two (40%) studies
reported that external quality assurance was in place. Three (60% studies met all QUADAS criteria.
Of the remaining two studies, one did not enrol ambulatory TB suspects, two did not describe
pre-publication copy

13
patient selection, and one did not report whether microscopy results were interpreted in a blinded
fashion.
Sensitivity was consistent across studies for direct microscopy (range 49% - 51%) but not for bleach
sedimentation microscopy (range 52% - 83%). Pooled sensitivity was higher for bleach
sedimentation (63%; 95CI 51% - 74%) than for direct microscopy (50%; 95CI 47% - 53%). When
sensitivity difference were pooled across studies, bleach sedimentation microscopy was 9% (95CI 4%
- 14%) more sensitive than direct microscopy.
Specificity was consistent for direct microscopy (range 96% - 99%; p=0.36) but was more variable for
bleach sedimentation (range 86% - 99%; p<0.001). Pooled specificity was high for both bleach
sedimentation (96%; 95CI 91 - 99%) and for direct microscopy (98%; 95CI 97% - 99%).
Compared to direct microscopy, bleach microscopy was 2% (95CI 3% - 37%; p=0.02) more sensitive
in studies using overnight sedimentation. There was no significant difference in specificity with
either short-term (-2%; 95CI -5% to 0%; p=0.05) or overnight sedimentation (-3%; 95CI -6% to +1%;
p=0.17.
3.2.3 NALC-NaOH centrifugation
Eight studies involving 2,785 participants were reviewed. All studies were cross-sectional in design,
reported similar NALC-NaOH processing methods, and used high-speed centrifugation. Four (50%)
examined smears using light microscopy and ZN staining. Seven (88%) studies reported that smears
were prepared and interpreted in the same laboratory and one (13%) reported that external quality
assurance was in place. No study met all QUADAS criteria. None reported enrolling ambulatory TB
suspects, two (25%) clearly described patient selection, and five (63%) reported that microscopy
results were interpreted in a blinded fashion.
Two studies were excluded when calculating pooled estimates of diagnostic accuracy because data
to calculate specificity were not reported. Sensitivity was inconsistent across studies for NALC-NaOH
centrifugation (range 52% - 93%; p<0.001) and for direct microscopy (range 29% - 82%; p<0.001).
Pooled sensitivity was higher for NALC-NaOH centrifugation (78%; 95CI 62% - 89%) than for direct
microscopy (55%; 95CI 47% - 62%). When sensitivity difference were pooled across studies, NALC-
NaOH centrifugation microscopy was 19% (95CI 7% - 32%) more sensitive than direct microscopy.
Specificity was consistent for direct microscopy (range 79% - 100%; p=0.08) but was more variable
for NALC-NaOH centrifugation microscopy (range 32% - 100%; p<0.001). Pooled specificity was high
for both NALC-NaOH centrifugation (95%; 95CI 78 - 99%) and for direct microscopy (99%; 95CI 96% -
100%).
3.2.4 NaOH centrifugation
Six studies involving 4,056 participants were reviewed. All studies were cross-sectional in design,
and performed chemical processing with 4% NaOH. Four (67%) used high-speed centrifugation and
five (83%) studies examined smears using light microscopy and ZN staining. All studies reported that
smears were prepared and interpreted in the same laboratory and one (17%) reported that external
quality assurance was in place. One study met all QUADAS criteria. Of the remaining five, three
reported enrolling ambulatory TB suspects, two clearly described patient selection, and two
reported that microscopy results were interpreted in a blinded fashion.
One study was excluded when calculating pooled estimates of diagnostic accuracy because data to
calculate specificity were not reported. Sensitivity was inconsistent across studies for NaOH
centrifugation (range 45% - 94%; p>0.001) and for direct microscopy (range 47% - 80%; p>0.001).
pre-publication copy

14
Pooled sensitivity was higher for NaOH centrifugation (78%; 95CI 61% - 89%) than for direct
microscopy (65%; 95CI 52% - 75%). When sensitivity difference were pooled across studies, NaOH
centrifugation microscopy was 8% (95CI 1% - 16%; p=0.03) more sensitive than direct microscopy.
Specificity was consistent for NaOH centrifugation microscopy (range 95% - 99%; p=0.66) and for
direct microscopy (range 95% - 99%; p=0.08). Pooled specificity was high for both NaOH
centrifugation (99%; 95CI 98 - 99%) and for direct microscopy (99%; 95CI 98% - 99%). There was no
significant difference in specificity between the two methods (p=0.53).
3.2.5 Any processing method in specimens from HIV-infected individuals
Direct microscopy was compared to bleach centrifugation microscopy in three studies and with
NALC-NaOH centrifugation in one study. Three studies examined smears using light microscopy and
ZN staining. Three studies reported that smears were prepared and examined in the same laboratory
and three studies reported that external quality assurance was in place. One study met all QUADAS
criteria assessed. Of the remaining three studies, none reported enrolling ambulatory TB suspects,
none clearly described patient selections, and two reported that microscopy results were
interpreted in a blinded fashion.
One study was excluded when calculating pooled estimates of diagnostic accuracy because data to
calculate specificity were not reported. Sensitivity was inconsistent across studies for processed
microscopy (range 52% - 55%; p=0.88) and for direct microscopy (range 47% - 51%; p0.68).
Specificity was consistent for direct microscopy (range 99% - 100%; p=0.78) but more variable for
processed microscopy (range 89% - 99%; p=0.002). Pooled estimates for sensitivity and specificity
could not be calculated as fewer than four studies were available.
Data were therefore excluded from subsequent assessment by the Expert Group.
3.2.6 Quality of evidence
Table 1 provides a summary of the accuracy data for sputum processing methods to improve
microscopy.
Table 1. Summary of accuracy data on sputum processing methods to improve microscopy
METHOD Bleach centrifugation Direct microscopy
# Studies 9 9
# Participants 3,923 3,923
Pooled accuracy estimates from meta-analyses
Sensitivity
Specificity
consequence assuming 20% prevalence,
with expected # per 1000
65% (95CI 59 - 71)
96% (95CI 93 - 98)
TP TN FP FN
130 768 32 70
56% (95CI 49 - 63)
98% (95CI 97 - 99)
TP TN FP FN
112 784 16 88
pre-publication copy

15
METHOD Bleach sedimentation Direct microscopy
# Studies 5 5
# Participants 2,307 2,307
Pooled accuracy estimates from meta-analyses
Sensitivity
Specificity
consequence assuming 20% prevalence,
with expected # per 1000
63% (95CI 51 - 74)
96% (95CI 91 - 99)
TP TN FP FN
126 768 32 74
50% (95CI 47 - 53)
98% (95CI 97 - 99)
TP TN FP FN
100 784 16 100
METHOD NALC-NaOH Direct microscopy
# Studies 6 6
# Participants 2,785 2,785
Pooled accuracy estimates from meta-analyses
Sensitivity
Specificity
consequence assuming 20% prevalence,
with expected # per 1000
78% (95CI 62 - 89)
95% (95CI 78 - 99)
TP TN FP FN
156 760 40 44
55% (95CI 47 - 62)
99% (95CI 96 - 100)
TP TN FP FN
110 792 8 90
METHOD NaOH Direct microscopy
# Studies 5 5
# Participants 4,056 4,056
Pooled accuracy estimates from meta-analyses
Sensitivity
Specificity
consequence assuming 20% prevalence,
with expected # per 1000
78% (95CI 61 - 89)
99% (98CI 98 - 99)
TP TN FP FN
156 792 8 44
65% (95CI 52 - 75)
99% (95CI 98 - 99)
TP TN FP FN
130 792 8 70
pre-publication copy

16
Factors affecting quality of evidence
Bleach centrifugation
Design
Risk of bias (QUADAS)1
Directness (generalisability)2,3
Inconsistency
Imprecision5
Publication/reporting bias
OVERALL QUALITY
Bleach sedimentation
Design
Risk of bias (QUADAS)1
Directness (generalisability)2,3
Inconsistency
Imprecision5
Publication/reporting bias
OVERALL QUALITY
NALC-NaOH centrifugation
Design
Risk of bias (QUADAS)1
Directness (generalisability)2,3
Inconsistency
Imprecision5
Publication/reporting bias
OVERALL QUALITY
NaOH centrifugation
Design
Risk of bias (QUADAS)1
Directness (generalisability)2,3
Inconsistency
Imprecision5
Publication/reporting bias
OVERALL QUALITY
9 cross-sectional
Minor
Limited (-1 for patient-important outcomes)
Serious (-1)
Moderate (-1)
Unlikely
VERY LOW
5 cross-sectional
Minor
Limited (-1 for patient-important outcomes)
Serious (-1)
Moderate (-1)
Unlikely
VERY LOW
8 cross-sectional, of which 2 excluded as data to
calculate specificity not reported
Serious (-1)
Limited (-1 for patient-important outcomes)
Serious (-1)
High (-1)
Unlikely
VERY LOW
6 cross-sectional, of which 1 excluded as data to
calculate specificity not reported
Serious (-1)
Limited (-1 for patient-important outcomes)
Serious (-1)
High (-1)
Unlikely
VERY LOW
1Some concern was expressed about the use of culture as a reference standard in settings where routine culture capacity is
not available, which may have unfairly skewed results; this issue remains unresolved given the absence of a suitable
replacement for culture as an internationally accepted reference standard. Accuracy estimates as calculated by the original
systematic review methodology were therefore retained;
2Quality of evidence was downgraded in all systematic reviews for insufficient evidence on patient-important outcomes.
False-positive results were judged to be less serious than false-negative results for public health impact (Expert Group
opinion);
3Several of the studies had been carried out in high HIV-prevalence settings, although limited data on HIV status of
individual patients were available. Several Expert Group members felt that the effect of sputum processing methods is
mostly seen on low-positivity smears, but no specific evidence was presented;
4Wide confidence intervals, especially for sensitivity estimates, observed for both processed and direct microscopy.
pre-publication copy

17
Notes:
• A major limitation was considerable heterogeneity in diagnostic accuracy estimates for both
direct and processed smear microscopy in most comparisons, largely due to variation in sputum
processing methods, study design, study settings, and patient selection;
• For bleach centrifugation, some of the observed heterogeneity could be ascribed to centrifuge
speed; however, for other processing methods specific sources of heterogeneity could not be
determined;
• Due to the considerable heterogeneity, pooled accuracy estimates should be interpreted with
caution; however, similar findings employing multiple different analyses supported the overall
conclusions;
• In addition to inconsistent results across studies, the quality of evidence was downgraded due to
limitations in study design, with at least one QUADAS criterion not satisfied by the majority of
studies in every group.
3.2.7 Balance of desirable and undesirable effects
The balance of effects was difficult to assess. The opinion of several Expert Group members was
that false-negative results may have a relatively stronger undesirable effect (generating patient
anxiety, uncertainly as to how to proceed, further testing required and negative consequences of
not receiving appropriate treatment) than false-positive results. On this premise, diagnostic accuracy
results would seem to favour sputum concentration methods over direct methods in general,
resulting in a reduction of false-negative results in most studies.
3.2.8 Values and preferences of patients
No data were presented and the opinion of the Expert Group was that patients would not express
strong values and preferences about detailed technical laboratory procedures, and that none of the
assessed methods would have likely impact on increased patient access to diagnostic services.
3.2.9 Cost and requirements
No data were presented, but concern were raised about the biosafety risk of centrifugation methods
at peripheral microscopy laboratory level, and the feasibility and cost (equipment, logistics) of
implementing such methods on a large scale. In addition, some concern was expressed about the
loss of specimens for culture when specimens are treated with bleach, the likely increase in turn-
around times (especially for overnight sedimentation), and the implications for patient
management.
3.2.10 Research gaps identified
The Expert Group is aware of ongoing studies and felt that further research in this area should be
reassessed once the results of these studies become available. It was also suggested that future
updates of sputum processing methods be preceded by an Expert consultation to assess the value
and use of culture as a reference standard.
pre-publication copy

18
FINAL RECOMMENDATION
The Expert Group felt that there was insufficient generalisable evidence that processed sputum
specimens provide results that are superior to direct smear microscopy, given the large variations in
study methods, study design, and results reported. Implementation of any of the assessed methods
in programmatic settings is therefore not recommended. The Expert Group is aware of ongoing
studies and felt that further research in this area should be reassessed once the results of these
studies have been evaluated.
OVERALL QUALITY OF EVIDENCE VERY LOW
STRENGTH OF RECOMMENDATION STRONG
----- 000 -----
pre-publication copy

19
3.3 FLUORESCENT LIGHT EMITTING DIODE (LED) MICROSCOPY
3.3.1 Background
Light emitting diode (LED) microscopy is a novel diagnostic tool developed primarily to provide
resource-limited settings access to the benefits of fluorescence microscopy. Compared to
conventional mercury vapour fluorescent microscopes, LED microscopes are less expensive, require
less power and are able to run on batteries, the bulbs have a very long half-life and do not pose the
risk of releasing potentially toxic products if broken, and are reported to perform equally well
without a dark room. These qualities make LED microscopy feasible for use in resource-limited
settings, having the potential to bring the benefits of fluorescent microscopy (improved sensitivity
and efficiency) where needed most.
The first use of LED technology was seen when existing fluorescent microscopes were converted to
LED light sources. Subsequently, several commercial LED products have become available on the
market, as listed in Table 1. These include a stand-alone bright light-fluorescent hybrid model
developed by Zeiss in collaboration with FIND (Primostar iLED), providing a high-quality all-in-one
solution for laboratories aiming to upgrade their microscopy capacity, with preferential pricing
having been negotiated for high-burden TB countries by FIND. Two stand-alone LED microscopes are
also available on the market, smaller and built for maximum portability - these include the CyScope
(Partec, Germany) and the FieldLab (Cytoscience, Switzerland). Two additional products (Lumin LW
Scientific, USA and Paralens, QBC Diagnostics, USA) are LED-enabled objective lenses which can be
swapped for a regular objective on an existing light microscope to confer epi-fluorescent capability.
Another product, the FluoLED attachment (Fraen, Italy) requires installation into an existing light
microscope and then provides full two-in-one light- and trans-fluorescent functionality.
pre-publication copy

20
3.3.2 Systematic review methodology
A systematic review was done with the following predetermined eligibility criteria for primary
analyses: assessment of the diagnostic accuracy/performance characteristics of LED microscopy for
the detection of mycobacteria in patient specimens, use of culture as reference standard, and
adequate data to populate a diagnostic 2 by 2 table. Studies using alternate reference standards (eg.
external rechecking of smears) were included and described separately, as were studies evaluating
other characteristics such as time to read slides, cost-effectiveness, user assessment, and
implementation issues such as training, and stain- or smear fading.
In addition to the accuracy estimates for LED vs conventional fluorescence microscopy (FM) and light
microscopy (LM), the report included narrative sections on operational issues for four devices, ie.
the Primostar iLED stand-alone unit, the Lumin and ParaLens objective lens attachments for routine
light microscopes, and the FluoLED attachment installed into a light microscope. No evaluations for
the two small handheld devices (CyScope and FieldLab) were available. Finally, a confidential report
on the operational issues associated with the FIND Demonstration Project for Primo Star iLED had
been made available to the Expert Group for scrutiny before the meeting.
The QUADAS criteria were used for study quality assessment. QUADAS criteria regarded as
especially relevant to this systematic review included: i) blinded interpretation of test results with
pre-publication copy

21
reference results and vice versa; ii) complete verification of test results with the same reference
standard; iii) recruitment of patients/specimens either consecutively or randomly; and iv) study
design (cross-sectional vs case-control; prospective vs retrospective).
3.3.3 Study characteristics
Study characteristics are summarised in Table 2. Detailed methodology and findings are described in
the systematic review report available at www.who.int/tb/dots/laboratory/policy. The systematic
review and meta-analysis included three published and nine unpublished studies, covering the
available evidence for four commercially available LED devices for TB: Lumin (six studies), Primostar
iLED (four studies), FluoLED (three studies), and Paralens (one study). Included in these were two
head-to-head evaluations; ie. FluoLED vs Lumin; and Primostar iLED vs FluoLED vs Lumin. A single
study used a conventional fluorescent microscope adapted for use with LED illumination.
Eight studies used mycobacterial culture as reference standard. The remaining four studies used a
microscopic reference standard - two with external rechecking and two with conventional FM. Five
studies each evaluated direct smears and concentrated smears; two studies reported data on direct
and concentrated smears separately.
Different magnifications were used for screening of smears, with 400x being the most common (six
studies) and 200x being the most common alternative magnification (four studies). A single study
used 600x magnification and one study compared 400x with 200x.
Direct comparisons of LED with ZN were available from seven studies and six studies compared LED
with conventional FM.
3.3.5 Study quality
Table 3 provides an overview of the key quality indicators for the included studies. All of these
reported blinding of the evaluation of slides using LED microscopes. Nine studies reported complete
verification using respective references standards while three used partial or differential verification.
pre-publication copy

22
Specimen recruitment was reported as prospective in all but one study, and sampling was reported
as either consecutive or random in 8 of the 12 studies. Seven of the evaluations used a case-control
study design and the remaining five used a cross-sectional design.
3.3.6 Accuracy of LED when compared to reference standards
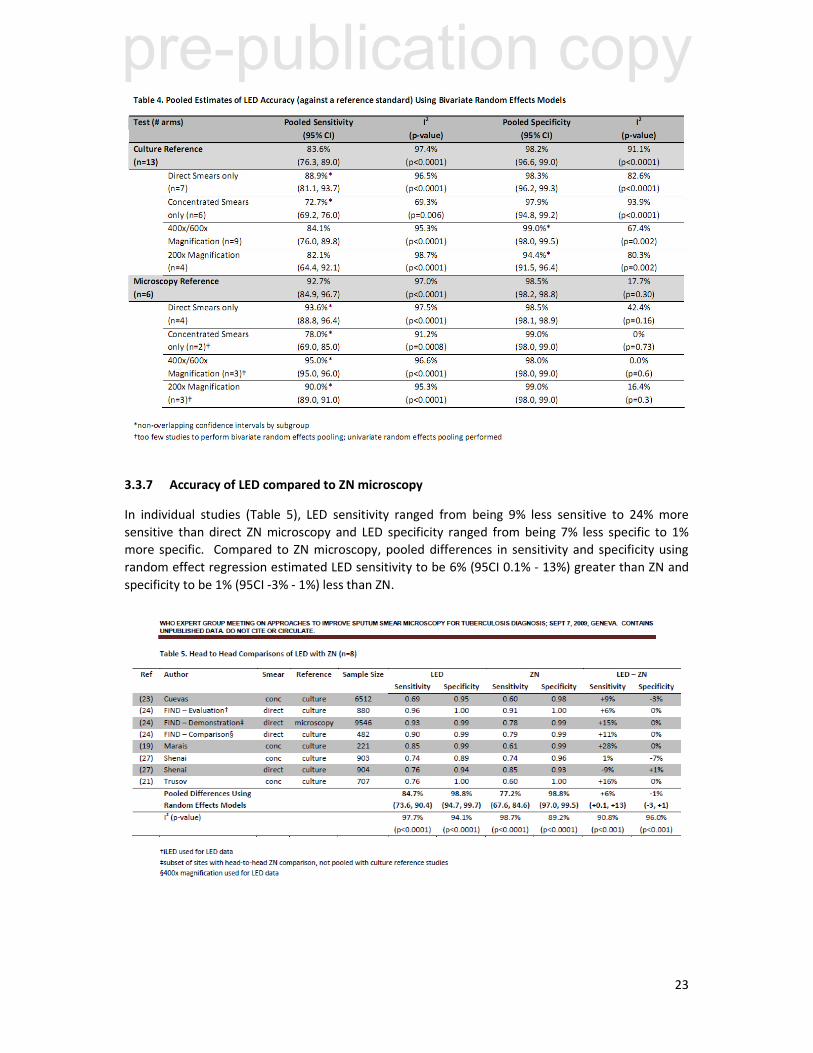
Table 4 provides a summary of the pooled estimates of sensitivity and specificity: Overall, when
culture was used as reference standard, LED achieved 84% sensitivity (95CI 76% - 89%) and 98%
specificity (95CI 85% - 97%). When a microscopic reference standard was used, overall sensitivity
was 93% (95CI 85% - 97%) and overall specificity was 99% (95CI 98% - 99%).
Table 4 also indicate the results from sub-group analyses depending on whether direct or
concentrated smears were used. In summary, there was a significant increase in sensitivity when
direct smears were used (89%; 95CI 81% - 94%) compared to concentrated smears (73%; 95CI 69% -
76%) with culture as reference standard. This difference was even more pronounced in those studies
where a microscopic reference standard was used, albeit form two studies only - one of the studies
included a head-to-head comparison of direct and concentrated smears and found improved
sensitivity and specificity using direct smears, while the second found no difference but noted that
two of their four participating sites did find that concentrated smears had a lower sensitivity than
direct smears.
pre-publication copy
23
3.3.7 Accuracy of LED compared to ZN microscopy
In individual studies (Table 5), LED sensitivity ranged from being 9% less sensitive to 24% more
sensitive than direct ZN microscopy and LED specificity ranged from being 7% less specific to 1%
more specific. Compared to ZN microscopy, pooled differences in sensitivity and specificity using
random effect regression estimated LED sensitivity to be 6% (95CI 0.1% - 13%) greater than ZN and
specificity to be 1% (95CI -3% - 1%) less than ZN.
pre-publication copy

24
3.3.8 Accuracy of LED compared to conventional FM microscopy
In individual studies (Table 6), LED sensitivity ranged from being 4% less sensitive to 16% more
sensitive than FM and LED specificity ranged from being 1% less specific to 5% more specific.
Compared to conventional FM, pooled differences estimated LED to be 5% (95CI 0% - 11%) more
sensitive and 1% (95CI -0.7% - 3%) more specific than FM.
3.3.9 Screening magnification
Subgroup analyses were performed to explore accuracy differences based on whether the screening
magnification was 200x or higher (data not shown). Within the group f studies using culture as
reference standard a lower screening magnification showed a significantly lower pooled specificity
compared to studies using a higher screening magnification. This difference was not seen in studies
using a microscopic reference standard but was observed in one head-to-head comparison of 200x
vs 400x readings. A small increase in sensitivity also detected in studies using higher magnification.
3.3.10 Time to read slides
Six studies provided measures of the time needed to examine smears using LED. In total, 14
comparisons between LED and ZN were made and 7 between LED and FM, with varying proportions
of smear-positive/smear-negative results, smear type, and screening magnification used. Using
simple averages with equal weighting given to each study arm, the mean time saved compared to ZN
microscopy was 46%. Considering estimates for smear-positive slides only, LED was 48% more
efficient than ZN; considering only smear-negative slides, LED was 59% more efficient than ZN.
Compared to FM, the time to read slides was approximately equal.
The FIND Demonstration Study measured the time to read slides one month after introduction of
LED and again after three months. The reduction in reading time after one month was 20%,
increasing to 45% after three months and showing that efficiency continued to increase with
prolonged use.
In another measure of time to read slides, the FIND Evaluation Study recorded the sensitivity of
reading smears for 30 seconds, one minute, 3 minutes and 5 minutes. Results indicated that >80%
of positive slides were correctly identified by LED or FM within 30 seconds and that increasing the
reading time from 3 minutes to 5 minutes did not significantly increased the yield. In contrast, when
pre-publication copy

25
using ZN stained slides, <50% of positive slides were correctly identified within 30 seconds and the
full 5 minutes were required to maximise yield.
3.3.11 Cost estimates
Equipment costs of the major commercial LED devices, as obtained from the respective companies,
are provided in Table 1 above.
The FIND Demonstration Studies collected costing data for three participating settings (India,
Lesotho, Peru). Taking into account equipment costs, staffing costs, chemicals and reagents,
consumables, building and overhead costs, it was estimated that the average unit cost per test
would be 10% to 12% lower for iLED compared to ZN. One important factor in this analysis was the
time saving in using iLED (estimated to require 55% less reading time), which resulted in significant
savings in staff costs. The conclusion from the FIND studies were that implementation of iLED
technology would not require significant modifications to current budgets of national TB control
programmes, except for the initial capital investment in equipment.
Previous cost estimates have shown that FM can be an effective alternative to ZN given the savings
in labour despite higher upfront equipment costs. Considering the lower equipment cost for LED
devices compared to FM and lower maintenance cost, LED technology can be considered a more
cost-effective option to FM. Considering the time saved in reading and the resultant savings in staff
costs, LED technology may also be a more cost-effective option in the long term than ZN microscopy.
3.3.12 Training requirements
During the FIND Demonstration study, staff with experience in ZN microscopy but no experience in
FM techniques were trained for one to five days before entering the first phase of the study.
Accuracy estimates for three distinct phases were calculated as follows:
Validation phase (one month post-initial training):
Overall sensitivity: 94% (95CI 92% - 95%); Overall specificity: 98% (95CI 98% - 99%)
Implementation phase (six months following implementation):
Overall sensitivity: 97% (95CI 92% - 99%); Overall specificity: 98% 95CI 98% - 99%)
Continuation phase (based on data collected to date of report):
Overall sensitivity: 97% (95CI 92% - 99%); Overall specificity: 98% 95CI 98% - 99%)
Standardised proficiency testing was performed in the FIND studies and repeated at one month and
three months. Performance targets (>95% accuracy, 100% acceptable staining quality, >80%
proficiency) were required to be met at the end of the validation phase, before proceeding to
implementation phase. These targets were met by 27 of 28 study sites, with the remaining site
achieving this target one month later.
Feedback from the microscopists undergoing training in the FIND studies emphasised the
importance of practical hands-on training, with the availability of a supervisor to assist with
distinguishing acid-fast bacilli from artefacts. Most microscopists felt that five days of training was
optimal for those experienced with ZN microscopy, and that at least 13 days of training would be
required for those without experience.
pre-publication copy
26
Training issues were not addressed in most of the non-FIND studies; however, three studies that did
not include extensive training and standardised proficiency testing noted the possible
underperformance of LED upon introduction due to insufficient training of staff.
3.3.13 Head-to-head comparisons of LED devices
Two studies included head-to-head evaluation of different LED devices. One study comparing the
LW Scientific Lumin and Fraen FluoLED showed significantly more positive smears detected using the
latter module with 200x magnification. This difference did not persist when 400x magnification was
used. Users indicated a preference for the Fraen module citing easier focusing and better image
quality.
In the FIND Comparison Study, all three LED devices (Zeiss iLED, Fraen FluoLED; LW Scientific Lumin)
resulted in improved sensitivity over ZN and received positive feedback from users. Estimates of
sensitivity gains compared to ZN resulted in +6% for iLED, +8% for FluoLED; and +4% for Lumin
(statistically significant increase for FluoLED). Estimates for specificity gains compared to ZN resulted
in +1% for iLED, -3% for FluoLED and +1% for Lumin (statistically significant decrease for FluoLED).
The time to examine slides was significantly less for all models compared to ZN, with the Lumin
examination times higher than for the other two models (2.94 min/slide for Lumin vs 2.3
minutes/slide for iLED vs 2.38 min/slide for FluoLED. Users indicated a preference for iLED citing
high quality optics, operational characteristics and ease of viewing in full light as advantages.
3.3.14 Staining methods
All studies included in the systematic review used Auramine O/KMnO4 staining.
A sub-study reported by FIND compared the performance and suitability of different commercial and
in-house stains for use with FM. Users reported that all of the fluorochrome staining methods were
easier to perform than ZN staining (likely due to the absence of a heating step). Experienced users
preferred that Auramine O/KMnO4 stain, and reading time was significantly shorter for both
Auramine O/KMnO4 and Auramine-Rhodamine/KMNO4; less experience users found it easier to
focus and less tiring to read the stains with coloured backgrounds (Auramine/Methylene Blue and
Auramine/Thiazine Red).
A separate evaluation of staining preference done in conjunction with the FIND Feasibility Study,
users preferred Auramine O/KMnO4 stain over Auramine-Rhodamine/KMNO4 and
Auramine/Methylene Blue.
3.3.15 Fading of fluorochrome-stained slides
Two studies evaluated the potential of fading of fluorochrome stained smears during storage.
In a sub-study by FIND, six microscopy centres kept a set of 10 positive smears at room temperature
(without air conditioning) and re-read them monthly for four months. None of the monthly readings
changed from the initial positivity grading at months 1, 2 or 3 and a single centre reported
misclassifying a single positive slide as negative during the month 4 reading. Qualitative
assessments from all sites reported no impairment of reading at month 1 or 2, one site reported
mild fading at month 3, and three sites reported impairment ranging from mild to significant by
month 4.
A study performed in India stored sets of 120 slides in different environments and re-read them on a
monthly basis for up to five months. Selected results are presented in Figure 6. Overall, the
pre-publication copy

27
proportion of positive slides that remained positive decreased to 63% at month 1, 43% at month 2,
26% at month 3, 15% at month 4 and 11% at month 5 for slides stored at air-conditioned room
temperature. Slides stored in a humidified incubator faded faster than those at room temperature
and, surprisingly, slides stored in a refrigerator showed the fastest fading.
(Source: Minion J, Shenai S, Vadwai V, Tipnis T, Rodriques C, Pai M, unpublished data).
pre-publication copy

28
3.3.16 Summary of principal findings
Positive
• All studies reported on sensitivity and specificity. Pooled estimates of accuracy found LED to
have 84% sensitivity and 98% specificity when compared to culture, and 93% sensitivity and 99%
specificity when compared to a microscopic reference;
• Direct comparisons estimated LED to have 6% greater sensitivity than ZN and 5% greater
sensitivity than conventional FM, with not appreciable difference in specificity;
• Many studies included qualitative assessments on user-important characteristics and important
outcomes relating to implementation, such as time to reading, cost-effectiveness, training and
smear fading;
- Timing data showed that LED has similar gains in efficiency to conventional FM (compared to
ZN), requiring approximately 46% less time than ZN for smear examination;
- Cost assessments predict improved cost-effectiveness of LED compared to ZN microscopy,
with improved efficiency being a key quality;
- Qualitative assessments of LED confirmed many touted advantages, including the ability to
use LED without a dark room, durability and (in the case of attachment models) portability.
User assessment in all field studies was reported as excellent;
• LED may provide a technology platform for other diagnostic services; eg. malaria and
trypanosomiasis, reducing costs involved in providing integrated laboratory services;
Negative
• Considerable heterogeneity was found in many of the pooled accuracy estimates; however, this
was not unexpected given the different products, diverse settings and study design used;
• The systematic review was limited by the lack of a common reference standard and lack of
agreed and consistently applied methods for smear processing and screening magnification;
• Possible barriers to large-scale implementation of LED include training of laboratory staff
unfamiliar with fluorescent microscopy and a reliable mechanism for quality control of the
inherent unstable Auramine stain used;
- Evidence from standardised training suggests that LED performance can be maximized
within a period of one month;
- Evidence regarding the effect of fluorochrome fading on the reproducibility of smear results
over time suggests that current quality assurance programmes may have to be adapted;
• Some concerns were expressed over the potential cost implications of LED introduction on other
diagnostic modalities, eg. light microscopy for urine/stool/blood examinations which will have to
be retained at peripheral health laboratory level;
• No studies evaluated the impact of LED microscopy on patient-important outcomes:
3.3.17 Research gaps
This was not discussed in detail due to time constraints. However, as with the other two approaches
to improve smear microscopy, further research on patient important outcomes of LED microscopy is
pre-publication copy
29
required, along with research into combining LED microscopy with front-loading of sputum
collection and/or sputum processing to optimise case detection.
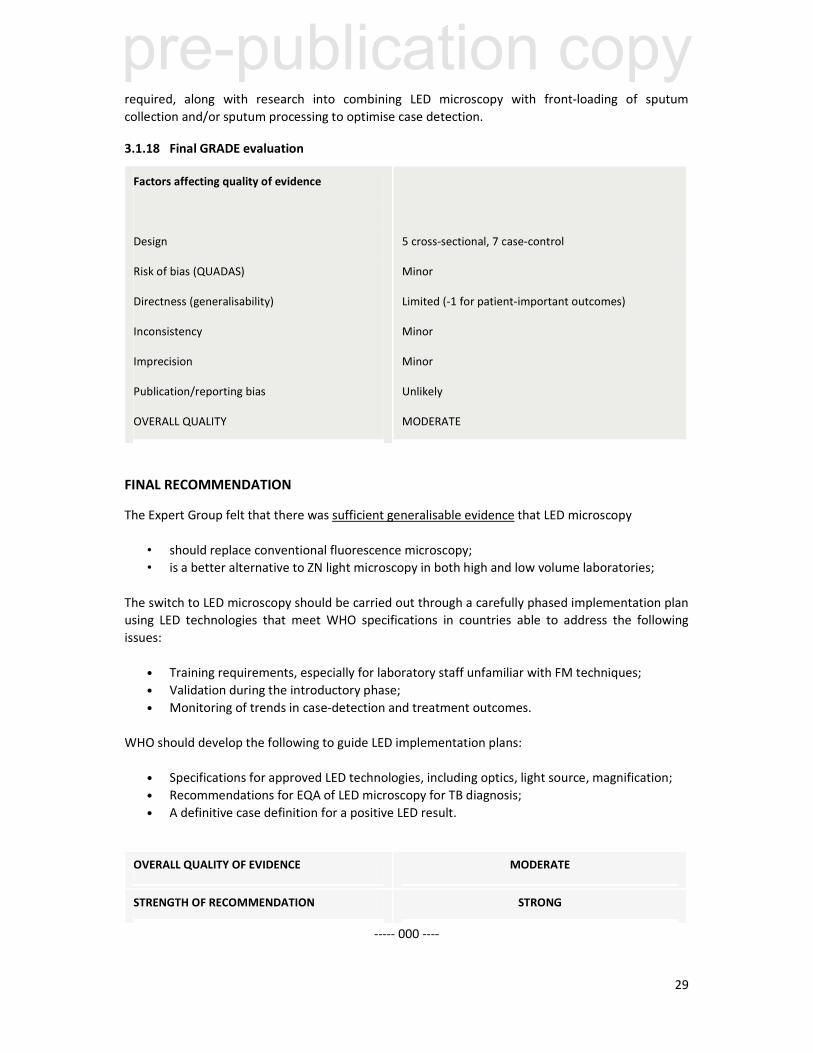
3.1.18 Final GRADE evaluation
Factors affecting quality of evidence
Design
Risk of bias (QUADAS)
Directness (generalisability)
Inconsistency
Imprecision
Publication/reporting bias
OVERALL QUALITY
5 cross-sectional, 7 case-control
Minor
Limited (-1 for patient-important outcomes)
Minor
Minor
Unlikely
MODERATE
FINAL RECOMMENDATION
The Expert Group felt that there was sufficient generalisable evidence that LED microscopy
• should replace conventional fluorescence microscopy;
• is a better alternative to ZN light microscopy in both high and low volume laboratories;
The switch to LED microscopy should be carried out through a carefully phased implementation plan
using LED technologies that meet WHO specifications in countries able to address the following
issues:
• Training requirements, especially for laboratory staff unfamiliar with FM techniques;
• Validation during the introductory phase;
• Monitoring of trends in case-detection and treatment outcomes.
WHO should develop the following to guide LED implementation plans:
• Specifications for approved LED technologies, including optics, light source, magnification;
• Recommendations for EQA of LED microscopy for TB diagnosis;
• A definitive case definition for a positive LED result.
OVERALL QUALITY OF EVIDENCE MODERATE
STRENGTH OF RECOMMENDATION STRONG
----- 000 ----
pre-publication copy