Embed Size (px)
Citation preview
13
Sputum Smear Microscopy for Tuberculosis: Evaluation of Autofocus Functions
and Automatic Identification of Tuberculosis Mycobacterium
Cicero F. F. Costa Filho and Marly G. F. Costa Centre for Electronic and Information Technology/Federal University of Amazonas
Brazil
1. Introduction
Since 1997 the World Health Organization has published an annual report on global control
of tuberculosis (TB) with the purpose of providing a comprehensive and up-to-date
assessment of the TB epidemic. According to the Global TB control report of 2010 (World
Health Organization [WHO], 2010), the global burden of disease caused by TB in 2009 is as
follows: 9.4 million incident cases, 14 million prevalent cases, 1.3 million deaths among non
HIV-positive people and 0.38 million deaths among HIV positive people.
The absolute number of cases continues to increase from year to year. The slow reduction in
incident rates per capita is outweighed by increases in population. The greatest number of
cases are in Asia (55%) and Africa (30%). Other regions have lower numbers of cases:
Eastern Mediterranean Region (7%), European Region (4%) and American Region (3%). The
main effort of WHO today concerning TB is to attain the targets included in the Millennium
Development Goals (MDGs).
Adopted by world leaders in 2000, the MDGs are a blueprint that guides the efforts of the
United Nations Development Program and various and various aid agencies, providing
concrete, numerical benchmarks for tackling extreme poverty in its many dimensions to
be achieved by 2015. The MDGs define 8 goals (United Nations [UN], 2010) with 21
targets that are measured by 60 indicators. TB falls under the 6th goal related to fighting
disease epidemics, aiming to: “Combat HIV/AIDS, Malaria and other diseases”. Within
this goal the following target refers to TB: “Halt and begin to reverse the incidence of
malaria and other major diseases”. Related to this target, the following indicator refers to
TB: Halt and begin to reverse TB incidence by 2015; Reduce prevalence and deaths due to
TB by 50% compared with a baseline of 1990.
To achieve these indicators the WHO adopted a Partnership Global Plan to Stop TB (WHO, 2011). Launched in January 2006, it includes sputum smear microscopy as the main diagnostic tool. Indeed, one of the targets of this plan is stated as follows: “A treatment success rate among sputum smear positive case of 90%”. The main reason for sputum smear
www.intechopen.com

Understanding Tuberculosis – Global Experiences and Innovative Approaches to the Diagnosis 278
microscopy to be included is that it is the main non-invasive technique employed for TB diagnosis. Other non-invasive techniques include culture and chest radiography.
Sputum smear microscopy has several operational advantages over culture as a diagnostic tool (Luelmo, 2004): “The results are available soon, correlate with infectiousness, and identify both patients at high risk of death from tuberculosis if untreated and patients who require more drugs in the initial treatment regimen because of greater bacterial load”. In addition sputum smear microscopy has an important role in follow up of TB treatment. Only when the smears are negative can the intensive phase of the treatment be suspended.
Despite the historical importance of chest radiography in TB diagnosis, it is not used today as a diagnostic tool alone. The following reasons justify this practice: 1) Some other diseases of the lung show a similar appearance in radiographic picture. Consequently radiographic exam is not specific to TB; 2) Lesions of pulmonary tuberculosis can take almost any form in a radiographic image (American Thoracic Society [ATS], 2000) .
Two main facts enable the use of sputum smear microscopy for TB diagnosis. The first one is that special dyes allow to differentiating the bacillus from the background. The second one is that there is a positive correlation between the number of bacillus in the smear and the probability of their being identified by microscopy.
To support the last statement, Table 1 (David, 1976, as cited in Toman, 2004a) shows the
positive correlation that exists between the number of bacillus present in a sputum
specimen, the number of bacillus in a smear and the probability of finding theses bacillus by
microscopy. For this study 0.01 ml of sputum was placed on a slide and spread over an area
of 200mm2. The magnification of the microscope used allowed for observing 10.000 fields on
this slide.
No. of bacilli
observed
Estimated concentration of
bacilli per ml of especimen
Probability of a
positive result
0 in 100 or more field <1000 <10%
1-2 in 300 fields 5000-10000 50%
1-9 in 100 fields about 30 000 80%
1-9 in 10 fields about 50 000 90%
1-9 per field about 100 000 96.2%
10 or more per field about 500 000 99.95%
Table 1. Number of observed bacilli, concentration of bacilli in sputum specimen (culture results) and probability of a positive result
Two techniques are used for TB diagnostic with sputum smear microscopy: Fluorescence
microscopy and conventional microscopy. Fluorescence microscopy uses an acid-fast
fluorochrome dye (eg, auramine O or auramine-rhodamine), while conventional microscopy
uses the carbolfuchsin Ziehl-Neelsen - ZN or Kinyoun acid-fast stains. While the first one
uses an intense light source, such as a halogen or high-pressure mercury vapor lamp, the
second one uses a conventional artificial light source.
www.intechopen.com
Sputum Smear Microscopy for Tuberculosis: Evaluation of Autofocus Functions and Automatic Identification of Tuberculosis Mycobacterium 279
1. Fluorescence microscopy has the following main advantages over conventional microscopy: 1) Fluorescence microscopy uses a lower power objective lens (typically 25x), while conventional microscopy uses a higher power objective lens (typically 100x). As a consequence fluorescence microscopy allows the same area of a smear to be scanned in a much shorter time than with conventional microscopy (Bennedesen & Larsen, 1966);
2. Fluorescence microscopy is on average 10% more sensitive than conventional microscopy (Steingart et. al., 2006).
The main shortcomings of fluorescence microscopy are: 1) The relatively high costs of the microscopy unit and its maintenance when compared with the conventional microscopy unit; 2) The handling and maintenance of the optical equipment require advanced technical skill (Toman, 2004b).
The sensitivity of tuberculosis diagnostic through sputum smear analysis reported in the literature varies greatly. While reported sensitivities of conventional microscopy range from 0.32 to 0.94, reported sensitivities of fluorescence microscopy range from 0.52 to 0.97. On average the specificity of fluorescence microscopy is similar to conventional microscopy and range from 0.94 to 1 (Steingart et. al., 2006).
In addition to the huge variability in sensitivity, the manual screening for bacillus identification is a labor-intensive task that consumes between 40 minutes and 3 hours, depending on patient’s level of infection and it is needed to analyse 40-100 images (Sotaquirá, 2009).
Automatic methods for bacilli screening were first developed for fluorescence microscopy images (Veropoulos et. al., 1998; Forero et. al., 2003). The first methods for automatic bacilli screening in conventional microscopy were published only in 2008 (Costa et. al., 2008; Sadaphal et. al., 2008; Raof et. al., 2008). Some other methods for automatic bacilli screening were published in recent years (Forero, 2004, 2006; Lenseigne et. al., 2007; Sotaquira et. al., 2009; Makkapati, et. al., 2009; Khutlang et. al., 2010).
Some authors (Forero et. al., 2006; Sotaquira, 2009; Khutlang, 2010) claimed that the main advantages of an automatic bacilli screening over a manual one are better reproducible values for sensitivity and specificity and a faster screening process. Table 2 shows reported values for sensitivity, specificity and time waste for one image analysis using automatic methods.
The sensitivity and specificity values previously cited for manual screening methods refer to tuberculosis diagnosis. The sensitivity and specificity values for automatic methods shown in Table 2 refer to object classification as bacillus or not bacillus. Therefore, a rigorous comparison of sensitivities and specificities between manual and automatic screening methods could not be done.
Only one paper of Table 2 cited time wasted for one image analysis, 1.87s. To compute the time consumed with a TB automatic diagnosis it is necessary to take into account the number of images needed to achieve a correct diagnosis. As previously cited, in order to achieve a correct diagnosis, it is necessary to analyze between 20 and 100 fields of one slide. With an automatic procedure, it is also necessary to take into account the time spent with focusing computations, image acquisition and microscopy displacement. According to
www.intechopen.com

Understanding Tuberculosis – Global Experiences and Innovative Approaches to the Diagnosis 280
Santos (Santos et. al., 1997) focusing computations takes 1.8s per field, while acquisition takes 0.7s, including 0.5s for slide movement. Assuming that no parallel process occurs and considering the worst case scenario of 100 images we have the time spent with an automatic diagnosis (Tad) given by:
劇銚鳥 = などど捲岫な.ぱば + な.ぱ + ど.ば岻 = 437s ≅ ば兼件券憲建結嫌 (1)
This value is a few times smaller than the value of 40 minutes previously cited for a TB manual diagnostic with sputum smear microscopy.
Author MicroscopySensitivity
(%)
Specificity
(%)
Time for one image
analysis (seconds)Computer
Veropoulos, 1998 Fluorescence 93.53 98.79 not cited --
Forero, 2006 Fluorescence 97.89 94.67 not cited --
Sotaquira, 2009 Conventional 90.90 100 1.87
Intel processor of 2
GHz and 512 MB of
RAM
Khutlang, 2010 Conventional 97.77 99.13 not cited --
Table 2. Sensitivity, Specificity and time for one image analysis
Steps involved in automated microscopy include those shown if Figure 2. In the following
sections, we analyze some of these steps. In section 2 we address the problem of auto
focusing, discussing the main functions used in auto focusing methods. In the third section
we discuss the main differences between the methods used for bacilli segmentation and
classification in fluorescence microscopy and conventional microscopy.
Fig. 2. Steps involved in automated bacilli recognition
2. Autofocus evaluation functions
Automatic microscopy is accomplished through coupling an electronic camera to a
microscope. Auto focusing of electronic cameras is accomplished by searching for the lens
position that gives the best focused image (Subbaro &. Tyan, 1995). A focused image can be
thought of as one that, for a set of images captured with different microscope stages,
presents the best average focus over an entire field of view. In a frequency viewpoint, a
focused image can be thought of as one that has more high frequency components. It is
important that samples be well prepared, resulting in thin structures, because thick samples
present structures with different foci. An auto focusing process employs a focus measure
and a procedure to determine the best focused image. A focus measure can be defined as
follow: “First, the image for which the focus measure needs to be computed is normalized
for brightness by dividing the image by its mean brightness. Then, it is convolved with a
focus measure filter (FMF). Then, the energy (sum of squared values) of the filtered image is
computed. This energy is the focus measure” (Subbaro &. Tyan, 1998). An important
conclusion concerning focus measures, established by the same authors, is that the best
focus measure could be different for different objects depending on both image content and
www.intechopen.com
Sputum Smear Microscopy for Tuberculosis: Evaluation of Autofocus Functions and Automatic Identification of Tuberculosis Mycobacterium 281
noise characteristic. In other words, there is no best focus measure that can be used for auto
focusing of different image types. Because of this, it is important to find the best focus
measure that can be used in TB auto focusing. In this section we will revise the main focus
measure functions used in automatic microscopy.
The main focus measures functions used in auto focusing can be divided into four groups:
Functions Based on Image Differentiation
Different FMF have been used for image differentiation:
Threshold Absolute Gradient: This function computes and accumulates the first difference between a pixel and its neighbor with a distance of one, when the difference is larger than a threshold.
繋痛朕_直追銚鳥 = ∑ ∑ |訣岫件, 倹 + な岻 − 訣岫件, 倹岻|朝暢 (2) 拳ℎ件健結|訣岫件, 倹 + な岻 − 訣岫件, 倹岻| ≥ 肯
Squared Gradient: Similar to the previous function but with squared difference. The larger differences influence the results more.
繋鎚槌_直追銚鳥 = ∑ ∑ |訣岫件, 倹 + な岻 − 訣岫件, 倹岻|態朝暢 (3) 拳ℎ件健結|訣岫件, 倹 + な岻 − 訣岫件, 倹岻| ≥ 肯
Tenenbaum Gradient (Krotkov, 1987): This function uses the Sobel operator.
繋痛勅津勅津 = ∑ ∑ 劇岷訣岫件, 倹岻峅朝暢 (4) 劇岷訣岫件, 倹岻峅 = 罫掴態岫件, 倹岻 + 罫槻態岫件, 倹岻 罫掴岫件, 倹岻, 罫槻岫件, 倹岻 = 荊兼欠訣結潔剣券懸剣健憲建件剣券拳件建ℎ鯨剣決結健剣喧結堅欠建剣堅嫌 Brenner Gradient (Brenner et. al., 1971): This function computes the first difference between a pixel and its neighbor with a distance of two.
繋長追勅津津勅追 = ∑ ∑ |訣岫件, 倹 + に岻 − 訣岫件, 倹岻|態朝暢 (5) 拳ℎ件健結|訣岫件, 倹 + な岻 − 訣岫件, 倹岻| ≥ 肯
Energy of Image Laplacian: This function implements the image convolution with a Laplace mask.
繋挑銚椎鎮銚頂勅 = ∑ ∑ 朝暢 盤訣岫件, 倹 + な岻 + 訣岫件, 倹 − な岻 + 訣岫件 + な, 倹岻 + 訣岫件 − な, 倹岻 − ね訣岫件, 倹岻匪態 (6)
First order Gaussian Derivative (Geusebroeck et. al., 2000): This function involves image convolution with the derivative of a Gaussian smooth filter. 繋弔銚通鎚鎚沈銚津 = 怠朝暢 ∑ ∑ 盤訣岫件, 倹岻 ∗ 罫掴岫捲, 検, 購岻匪態 +暢朝 岾訣岫件, 倹岻 ∗ 罫槻岫捲, 検, 購岻峇態
罫掴岫捲, 検, 購岻欠券穴罫槻岫捲, 検, 購岻欠堅結建ℎ結血件堅嫌建剣堅穴結堅罫欠嫌嫌憲欠件券穴結堅件懸欠建件懸結嫌件券建ℎ結捲欠券穴検穴件堅結潔建件剣券嫌 購件嫌建ℎ結嫌建欠券穴欠堅穴穴結懸件欠建件剣券 ≅ 岫穴/に岻/√ぬ, d= bacillus width
www.intechopen.com
Understanding Tuberculosis – Global Experiences and Innovative Approaches to the Diagnosis 282
Statistics-Based Functions
These functions evaluate the contrast of an image:
Variance: This function measures the variation in image gray level of pixels.
繋塚銚追 = 怠暢朝 ∑ ∑ |訣岫件, 倹岻 − 訣̅|朝暢 (7)
Normalized Variance: This function compensates for the differences in bright levels among
different images
繋塚銚追 = 怠暢朝直博 ∑ ∑ |訣岫件, 倹岻 − 訣̅|朝暢 (8)
Functions Based on Histogram
Entropy: The entropy function is a measure of information content
繋勅津痛追 = − ∑ 喧鎮健剣訣喧鎮鎮 (9) 喧鎮件嫌建ℎ結堅結健欠建件懸結血堅結圏憲結券潔検剣血訣堅欠検健結懸結健健 Variance of Log Histogram: This function emphasizes the bright pixels in the image by
multiplying the variance by the logarithm
繋塚銚追_鎮墜直 = ∑ 盤健 − 継鎮墜直岶健岼匪健剣訣喧鎮鎮 (10) 継鎮墜直岶健岼 = 布 健健剣訣喧鎮鎮 件嫌建ℎ結結捲喧結潔建結穴懸欠健憲結剣血 log ℎ件嫌建剣訣堅欠兼
Functions Based on Correlation Measurement
These functions were proposed by Vollath (Vollath, 1998) and, according to the author, had good performance in noise presence.
Autocorrelation (Vollath’s 繋替岻: 繋銚通痛墜頂墜追追 = ∑ ∑ 訣岫件 + な, 倹岻訣岫件, 倹岻朝暢 − ∑ ∑ 訣岫件 + に, 倹岻訣岫件, 倹岻朝暢 (11)
Standard Deviation-Based Correlation (Vollath’s 繋泰岻: 繋銚通痛墜頂墜追追 = ∑ ∑ 訣岫件 + な, 倹岻訣岫件, 倹岻朝暢 − 警軽訣̅態 (12)
Some measures based on frequency content have been proposed, such as the wavelet
transform (Kautsky et. al., 2002). Nevertheless it did not present good results in TB auto
focusing.
It should be observed that some of these functions depend on threshold, while some others
do not depend on any parameter. Some of these functions were used for TB auto focusing.
Table 3 shows published papers involving TB auto focusing, detailing the focus measure
employed in each one.
The papers of Russel (Russel & Douglas, 2007) and Kimura (Kimura Junior et. al., 2010) were careful to consider slides with different background contents. For example, Kimura divided
www.intechopen.com

Sputum Smear Microscopy for Tuberculosis: Evaluation of Autofocus Functions and Automatic Identification of Tuberculosis Mycobacterium 283
the TB conventional microscopy images into two groups: Images with high density background content and images with low density background content. Figure 3(a) shows an image with high density background content and Figure 3(b) an image with low density background content. In both groups the variance and normalized variance functions showed the best performance. Osibote (Osibote et. al., 2010) also obtained a better performance with the normalized variance function.
Authors Microscopy Type Evaluation Functions Results
Forero et. al.
(2004)Fluorescence
Variance, Energy of Image
Laplacian, Wavelet Transform,
Autocorrelation, Variance of
Log Histogram
The best results were
obtained with Variance of Log
Histogram Function. Other
measure produced
meaningful results
Kimura Junior et. al.
(2010)Conventional
Brenner Gradient, Energy of
Image Laplacian, Wavelet
Transform, Variance,
Normalized Variance,
Autocorrelation, Standard
Deviation-Based Correlation,
Entropy, Variance of Log
Histogram
The best results were
obtained with Variance and
Normalized Variance. Entropy
was the quickest function.
Wavelet function was the
slower function.
Osibote et. al.
(2010)Conventional
Normalized Variance, Brenner
Gradient, Energy of Image
Laplacian, Autocorrelation,
Tenembaum Gradient
The best results were
obtained with Normalized
Variance Function
Russel & Douglas
(2007)Conventional
The best results were
obtained with Energy
Laplacian Function. Compared
with manual focus: average
difference = 1.45μm. Standard
deviation = 1.88μm.
Energy of Image Laplacian,
First Order Gaussian
Derivative, Variance of Log
Histogram
Table 3. Published papers involving TB auto focusing
(a) (b)
Fig. 3. Images with different density background content. (a) high density background content; (b) low density background content
www.intechopen.com
Understanding Tuberculosis – Global Experiences and Innovative Approaches to the Diagnosis 284
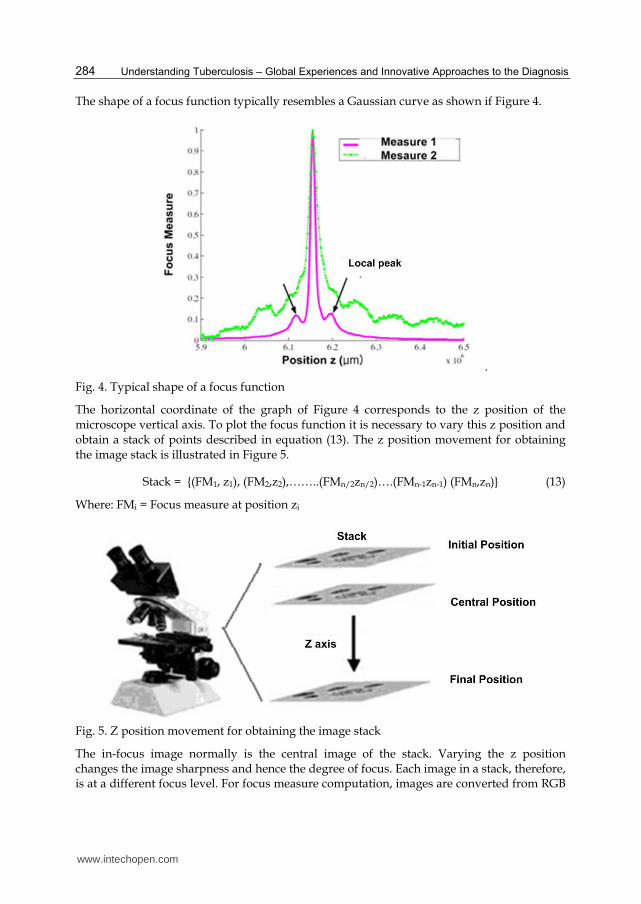
The shape of a focus function typically resembles a Gaussian curve as shown if Figure 4.
.
Fig. 4. Typical shape of a focus function
The horizontal coordinate of the graph of Figure 4 corresponds to the z position of the microscope vertical axis. To plot the focus function it is necessary to vary this z position and obtain a stack of points described in equation (13). The z position movement for obtaining the image stack is illustrated in Figure 5.
Stack = {(FM1, z1), (FM2,z2),……..(FMn/2zn/2)….(FMn-1zn-1) (FMn,zn)} (13)
Where: FMi = Focus measure at position zi
Fig. 5. Z position movement for obtaining the image stack
The in-focus image normally is the central image of the stack. Varying the z position changes the image sharpness and hence the degree of focus. Each image in a stack, therefore, is at a different focus level. For focus measure computation, images are converted from RGB
www.intechopen.com

Sputum Smear Microscopy for Tuberculosis: Evaluation of Autofocus Functions and Automatic Identification of Tuberculosis Mycobacterium 285
to gray scale. The performance of a focus measure is frequently evaluated using the focus curve and according to four features (Firestone at. al., 1991), defined as:
1. Accuracy: expressed here as the number of steps by which the maximum of a particular focus function departs from the correct focal position;
Range: the number of steps between the two neighboring local minima around the global maximum;
Number of false maxima: number of spurious focus function maxima; Width: computed at 50% of the height focus curve. This criterion describes the sharpness or
narrowness of the peak.
Santos et al. (1997) introduced a 5th feature, Execution Time, as follows:
Execution Time: the time taken for an algorithm to compute the focus plot and locate the position of maximum focus.
According to Santos (Santos et. al., 1997) a quantitative evaluation may compare a focus
curve to an ideal function with respect to each of these features. The authors define an ideal
focus function as having a value of 0 for execution time, accuracy, width and number of
false maxima and a range determined by multiplying the number of images in the stack
used to plot the focus function and the step size between each position in the stack
(adjustment step of the microscopy). To obtain a measure of how a focus measure departs
from an ideal behavior the following algorithm is used:
1. A series of focus measure curves is obtained (these series should contain images with different background content). The mean and the standard deviation of each feature in the series are obtained.
2. The five feature values of each image series are normalized by subtracting the corresponding mean and dividing by the standard deviation. This produces values for the different features that can be compared as they all now have mean zero and standard deviation equal to unity.
3. For each feature the distance from the ideal function is computed. First the differences
between the feature value in the function and in the ideal function are obtained. Then
the square root of the addition of the squares of these results is computed.
4. Finally, to produce a final figure of this function, the mean value of the five distances is obtained.
When doing a TB diagnosis with sputum smear microscopy, a bacilli count on a number of
fields of one slide is necessary. A time-consuming autofocus procedure determines the
optimal focus through the acquisition of the focus function for each field. To reduce lens
motion and achieve faster autofocus times the following procedure proposed by Osibote
(Osibote et. al., 2010) can be used:
1. Obtaining the focus position for the first field of the slide through the acquisition of a
full image stack of the focus measure, ensuring a perfect evaluation of this field to avoid
locating the optimal focus in a false minimum position;
2. Adopt a simplified procedure to determine the optimal focus position in subsequent
fields, using the optimal focus position of the previous field as a reference. For this
purpose the procedure proposed by Yanzdafar (Yanzdafar et. al., 2008) can be used.
www.intechopen.com

Understanding Tuberculosis – Global Experiences and Innovative Approaches to the Diagnosis 286
3. Automated sputum smear microscopy
According to Forero (Forero et. al., 2006) bacilli are structures that have a length between 1
and 10μm and a width between 0.2 and 0.6μm presenting a straight, curve or bent shape,
as shown if Figure 6.
Fig. 6. Different shapes of bacilli
Depending on the staining procedures used, the bacilli assume different appearances. When
the sputum smear is stained with an acid-fast fluorochrome dye, as is the case when
fluorescence microscopy is used, the bacilli fluoresce in the range between green and yellow
up to white, while the background is dark. Otherwise, when the sputum smear is stained
with carbolfuchsin Ziehl-Neelsen - ZN or Kinyoun acid-fast stains, as is the case when
conventional microscopy is used, the bacilli may have different colours, varying from light
fuchsia to dark purple. In Figure 7 we show images of both microscopy types.
Fig. 7. Fluorescence microscopy (after Forero et al., 2004) and conventional microscopy sputum smear image
The block diagram of Figure 2 shows the main steps involved in automated bacilli
recognition. Table 4 shows the main methods used in the literature for each step of this
block diagram.
As shown in Figure 2, after image capture, bacilli segmentation is performed. The
segmentation procedures adopted in both types of images shown in Figure 7 are completely
different from each other.
In fluorescence microscopy images, the bacilli are easily separated from the background with a threshold operation. Afterwards, the segmentation is performed using edge detection
www.intechopen.com
Sputum Smear Microscopy for Tuberculosis: Evaluation of Autofocus Functions and Automatic Identification of Tuberculosis Mycobacterium 287
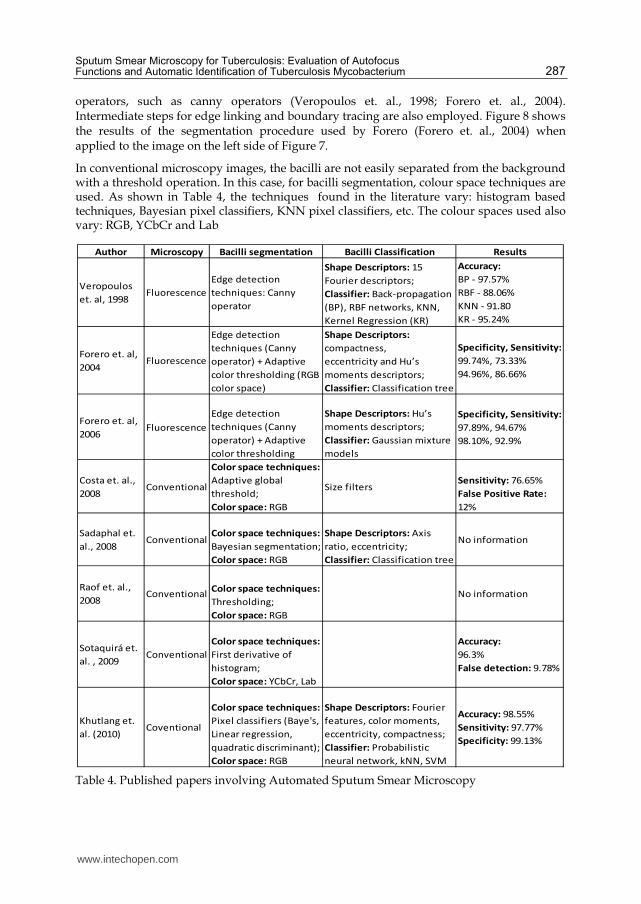
operators, such as canny operators (Veropoulos et. al., 1998; Forero et. al., 2004). Intermediate steps for edge linking and boundary tracing are also employed. Figure 8 shows the results of the segmentation procedure used by Forero (Forero et. al., 2004) when applied to the image on the left side of Figure 7.
In conventional microscopy images, the bacilli are not easily separated from the background with a threshold operation. In this case, for bacilli segmentation, colour space techniques are used. As shown in Table 4, the techniques found in the literature vary: histogram based techniques, Bayesian pixel classifiers, KNN pixel classifiers, etc. The colour spaces used also vary: RGB, YCbCr and Lab
Author Microscopy Bacilli segmentation Bacilli Classification Results
Veropoulos
et. al, 1998Fluorescence
Edge detection
techniques: Canny
operator
Shape Descriptors: 15
Fourier descriptors;
Classifier: Back-propagation
(BP), RBF networks, KNN,
Kernel Regression (KR)
Accuracy:
BP - 97.57%
RBF - 88.06%
KNN - 91.80
KR - 95.24%
Forero et. al,
2004Fluorescence
Edge detection
techniques (Canny
operator) + Adaptive
color thresholding (RGB
color space)
Shape Descriptors:
compactness,
eccentricity and Hu’s
moments descriptors;
Classifier: Classification tree
Specificity, Sensitivity:
99.74%, 73.33%
94.96%, 86.66%
Forero et. al,
2006Fluorescence
Edge detection
techniques (Canny
operator) + Adaptive
color thresholding
Shape Descriptors: Hu’s
moments descriptors;
Classifier: Gaussian mixture
models
Specificity, Sensitivity:
97.89%, 94.67%
98.10%, 92.9%
Costa et. al.,
2008 Conventional
Color space techniques:
Adaptive global
threshold;
Color space: RGB
Size filtersSensitivity: 76.65%
False Positive Rate:
12%
Sadaphal et.
al., 2008Conventional
Color space techniques:
Bayesian segmentation;
Color space: RGB
Shape Descriptors: Axis
ratio, eccentricity;
Classifier: Classification tree
No information
Raof et. al.,
2008Conventional
Color space techniques:
Thresholding;
Color space: RGB
No information
Sotaquirá et.
al. , 2009Conventional
Color space techniques:
First derivative of
histogram;
Color space: YCbCr, Lab
Accuracy:
96.3%
False detection: 9.78%
Khutlang et.
al. (2010)Coventional
Color space techniques:
Pixel classifiers (Baye's,
Linear regression,
quadratic discriminant);
Color space: RGB
Shape Descriptors: Fourier
features, color moments,
eccentricity, compactness;
Classifier: Probabilistic
neural network, kNN, SVM
Accuracy: 98.55%
Sensitivity: 97.77%
Specificity: 99.13%
Table 4. Published papers involving Automated Sputum Smear Microscopy
www.intechopen.com

Understanding Tuberculosis – Global Experiences and Innovative Approaches to the Diagnosis 288
After the segmentation step is finished, not only bacilli are segmented. Some structures
fluoresce the same way as bacilli in fluorescence microscopy images. Similarly some
structures have the same colour properties as bacilli in conventional microscopy images.
confused with bacilli. These structures, also called noise, could be debris or cells present in
the background. To illustrate this point, near the lower left corner of Figure 7, a circular
structure can be seen that fluoresces the same way as a bacillus, but because of its circular
shape could not be classified as one. Nevertheless, this structure is segmented the same way
as a bacillus, as shown in Figure 8.
Fig. 8. Objects resulting from segmentation procedures applied in the left image of Figure 7.
To separate noise from bacilli in the segmented images an additional step, called object
classification in the block diagram of Figure 2 is normally employed. For this purpose
classifiers using shape descriptors are used. As the bacilli may have different sizes, positions
and orientations, the shape descriptors used must be rotation, translation and scale
invariant. As shown in Table 4, the most used descriptors used are: compactness,
eccentricity, Hu’s moments and Fourier Descriptors. Varied classifiers such as classification
trees, Support Vector Machines and Neural Networks were employed by some authors in
order to recognize the bacilli.
The results presented in Table 4 show that, in bacilli detection, results for sensitivity and
specificity as good as 97.77% and 99.13% are cited. It is noteworthy, however that the
authors who cited these values, do not consider touching bacilli. In some cases, as the one
shown in Figure 9, these bacilli are present in large quantities. Disregarding these bacilli
implies a different count of what is done by manual means. Because of this, we believe
that other ways of removing noise than those that use shape descriptors must be
investigated.
www.intechopen.com

Sputum Smear Microscopy for Tuberculosis: Evaluation of Autofocus Functions and Automatic Identification of Tuberculosis Mycobacterium 289
Fig. 9. Conventional microscopy image showing some examples of touching bacilli
4. References
ATS (2000). Diagnostic standards and classification of tuberculosis in adults and children.
American Journal of Respiratory and Critical Care Medicine, Vol. 161, pp. 1376–1395,
ISSN 1073-449X
Brenner, J.F., Dew, B.S., Horton, J.B., King, J.B., Netrath, P.W. & Sellers, W.B. (1971), An
automated microscope for cytologic research, Journal of Histochemistry and
Cytochemistry, Vol. 24, pp 100-111, ISSN 0022-1554
www.intechopen.com
Understanding Tuberculosis – Global Experiences and Innovative Approaches to the Diagnosis 290
Bennedsen, J. & Larsen, S. O. (1966), Examination for tubercle bacilli by fluorescence,
Scandinavian Journal of Respiratory Disease, Vol. 47, pp.114–20, ISSN 0036-5572
Costa, M. G. F., Costa Filho, C. F. F., Sena, J. F., Salen, J. & Lima, M. O. (2008), Automatic
identification of mycobacterium tuberculosis with conventional light microscopy,
Proceedings of the 30th Annual International Conference of the IEEE EMBS, pp. 382-
385,Vancouver, British Columbia, Canada
Firestone, L., Cook, K., Culp, K., Talsania, N. & Preston Jr, K. (1991), Comparison of
autofocus methods for automated microscopy, Cytometry, Vol. 12, pp.195-206
Forero, M. G. & Cristóbal, G. (2003), Automatic identification techniques of tuberculosis
bacteria, Proc. SPIE, Vol. 5203, pp. 71–81, ISSN 0277-786X
Forero, M.G., Sroubek, F. & Cristóbal, G. (2004). Identification of tuberculosis bacteria based
on shape and color, Real Time Imaging, Vol. 10, pp. 251–262, ISSN 1077-2014
Forero, M.G., Cristóbal, G. & Desco, M. (2006), Automatic identification of Mycobacterium
tuberculosis by Gaussian mixture models, Journal of Microscopy, Vol. 223, pp. 120–
132, ISSN 0022-2720
Geusebrock, J., Cornelissen, F., Smeulders, A.W.M. & Geerts, G. (2000), Robust auto focusing
in microscopy, Cytometry, Vol. 39, pp.1-9, ISSN 0196-4763
Kautsky, J., Flusser, .J, Zitova, B. S. & Imberova, S., (2002), A new waveletbased measure of
image focus. Pattern Recognition Letters, Vol. 23, pp. 1785–1794.
Khutlang, R., Krishnan, S., Dendere, R., Whitelaw, A., Veropoulos, K., Learmonth, G. &
Douglas, T. S. (2010), Classification of Mycobacterium tuberculosis in Images of
ZN-Stained Sputum Smears, IEEE Transactions on Information Technology in
Biomedicine, Vol. 14, No. 4, pp. 949-957, ISSN 1089-7771
Kimura Junior, A., Costa, M., Costa Filho, C. F. F., Fujimoto, L. B.M. & Salem, J. (2010),
Evaluation of autofocus functions of conventional sputum smear microscopy for
tuberculosis, 32th Annual International IEEE EMBS Conference, pp. 3041-3044
Krotkov, E. (1987), Focusing, International Journal of Computer Vision, Vol. 1, pp. 223-227,
ISSN 0920-5691
Lenseigne, B., Brodin, P., Christophe, T. & Genovesio, A. (2007), Support vector machines
for automatic detection of tuberculosis bacteria in confocal microscopy images,
Proceedings of 4th IEEE International Symposium on Biomedical Imaging, pp. 85-88,
ISBN 0-7803-7585-8, Arlington, VA, USA
Luelmo, F. (2004), What is the role of sputum microscopy in patients attending health
facilities?, In: Toman’s Tuberculosis Case detection, treatment, and monitoring –questions
and answers, T. Frieden, pp. 7-10, World Health Organization, ISBN 9241546034,
Hong Kong, China
Makkapati, V., Agrawal, R. & Acharya, R. (2009), Segmentation and Classification of
Tuberculosis Bacilli from ZN-stained Sputum Smear Images, Proceddings of 5th
Annual IEEE Conference on Automation Science and Engineering, pp. 217-220, ISBN
978-1-60566-750-8 , Bangalore, India
Osibote, O.A., Dendere, R., Krishnan, S. & Douglas, T.S. (2010), Automated focusing in
bright-field microscopy for tuberculosis detection, Journal of Microscopy, Vol. 240, 2,
pp.155-163, ISSN 0022-2720
www.intechopen.com
Sputum Smear Microscopy for Tuberculosis: Evaluation of Autofocus Functions and Automatic Identification of Tuberculosis Mycobacterium 291
Raof, R. A. A., Salleh, Z., Sahidan, S. I., Mashor, M. Y., Md Noor, S. S., Idris, F. M. & Hasan,
H. (2008), Color Thresholding Method For Image Segmentation Algorithm of Ziehl-
Neelsen Sputum Slide Images, Proceedings of 5th International Conference on Electrical
Engineering, Computing Science and Automatic Control, pp. 212-217, ISBN 978-1-4244-
2499-3, Mexico City, Mexico
Russel, M.J & Douglas, T. S. (2007), Evaluation of autofocus algorithms for tuberculosis
microscopy, 29th Annual International IEEE EMBS Conference, pp. 3489-3492
Sadaphal, P, Rao, J., Comstock, G.W. & Beg, M.F. (2008), Image processing techniques for
identifying Mycobacterium tuberculosis in Ziehl-Neelsen stains. International
Journal of Tuberculosis Lung Disease, Vol. 12, n. 5, pp. 579-582, ISSN 1027-3719.
Santos, A., Ortiz-Solorzano, C.; Vaquero, J.; Malpica, N.; Pozo, F. Del (1997), Evaluation of
autofocus functions in molecular cytogenetic analysis. Journal of Microscopy, Vol.
188, pp. 264–272, ISSN 0022-2720
Sotaquirá, M., Rueda, L. & Narvaez, R. (2009), Detection and quantification of bacilli and
clusters present in sputum smear samples: a novel algorithm for pulmonary
tuberculosis diagnosis, Proceedings of International Conference on Digital Image
Processing, pp. 117-121, ISBN 978-0-7695-3565-4 , Bankoc, Thailand
Steingart, K. R., Henry, M., Ng, V., Hopewell, P. C., Ramsay, A., Cunningham, J.,
Urbanczik, R., Perkins, M., Aziz, M. A. & Pai, M. (2006), Fluorescence versus
conventional sputum smear microscopy for tuberculosis: a systematic review,
Lancet Infectious Deseases, Vol. 6, pp. 570-581, ISSN 1473-3099
Subbarao, M. & Tyan, J. K. (1995), The Optimal Focus Measure for Passive Autofocusing
and Depth-from-Focus, Proc. SPIE Conf. Viedometrics IV, Vol. 2, 598, pp. 89-99,
Philadelphia, ISBN 0-8194-1321-6
Subbarao, M. & Tyan, J. K. (1998), Selecting the Optimal Focus Measure for Autofocusing
and Depth-From-Focus, IEEE Transactions on Pattern Analysis and Machine
Intelligence, Vol. 20, 8, pp. 864-870, ISSN 0162-8828
UN, The Millennium Development Goals Report 2010 (2010), 18/05/2011, Available from:
<http://www.un.org/millenniumgoals/reports.shtml >
Toman, K. (2004a), How reliable is smear microscopy?, In: Toman’s Tuberculosis Case
detection, treatment, and monitoring –questions and answers, T. Frieden, pp. 7-10,
World Health Organization, ISBN 9241546034, Hong Kong, China
Toman, K. (2004b), What are the advantages and disadvantages of fluorescence
microscopy?, In: Toman’s Tuberculosis Case detection, treatment, and monitoring –
questions and answers, T. Frieden, pp. 7-10, World Health Organization, ISBN
9241546034, Hong Kong, China
Veropoulos, K., Campbell, C., Learmonth, G., Knight, B., & Simpson, J (1998), The
Automated Identification of Tubercle Bacilli using Image Processing and Neural
Computing Techniques, Proceedings of 8th International Conference on Artificial Neural
Networks, Vol. 2, pp. 797-802, ISBN 3540762639 ,Skövde, Sweden,.
Vollath, D. (1988), The influence of the scene parameters and of noise on the behaviour of
automatic focusing algorithms, Journal of Microscopy, Vol. 151, pp.133-146
WHO, Global TB Control report (2010). 18/05/2011, Available from:
<http://www.who.int/tb/publications/global_report/2010/en/index.html >
www.intechopen.com

Understanding Tuberculosis – Global Experiences and Innovative Approaches to the Diagnosis 292
Yazdanfar, S., Kenny, K.B., Tasimi, K., Corwin, A.D., Dixon, E.L. & Filkins R.J. (2008), Simple
and robust image-based auto focusing for digital microscopy. Optics Express. Vol.
16, pp. 8670–8677.
www.intechopen.com
Understanding Tuberculosis - Global Experiences and InnovativeApproaches to the DiagnosisEdited by Dr. Pere-Joan Cardona
ISBN 978-953-307-938-7Hard cover, 552 pagesPublisher InTechPublished online 15, February, 2012Published in print edition February, 2012
InTech EuropeUniversity Campus STeP Ri Slavka Krautzeka 83/A 51000 Rijeka, Croatia Phone: +385 (51) 770 447 Fax: +385 (51) 686 166www.intechopen.com
InTech ChinaUnit 405, Office Block, Hotel Equatorial Shanghai No.65, Yan An Road (West), Shanghai, 200040, China
Phone: +86-21-62489820 Fax: +86-21-62489821
Mycobacterium tuberculosis is a disease that is transmitted through aerosol. This is the reason why it isestimated that a third of humankind is already infected by Mycobacterium tuberculosis. The vast majority of theinfected do not know about their status. Mycobacterium tuberculosis is a silent pathogen, causing nosymptomatology at all during the infection. In addition, infected people cannot cause further infections.Unfortunately, an estimated 10 per cent of the infected population has the probability to develop the disease,making it very difficult to eradicate. Once in this stage, the bacilli can be transmitted to other persons and thedevelopment of clinical symptoms is very progressive. Therefore the diagnosis, especially the discriminationbetween infection and disease, is a real challenge. In this book, we present the experience of worldwidespecialists on the diagnosis, along with its lights and shadows.
How to referenceIn order to correctly reference this scholarly work, feel free to copy and paste the following:
Cicero F. F. Costa Filho and Marly G. F. Costa (2012). Sputum Smear Microscopy for Tuberculosis: Evaluationof Autofocus Functions and Automatic Identification of Tuberculosis Mycobacterium, UnderstandingTuberculosis - Global Experiences and Innovative Approaches to the Diagnosis, Dr. Pere-Joan Cardona (Ed.),ISBN: 978-953-307-938-7, InTech, Available from: http://www.intechopen.com/books/understanding-tuberculosis-global-experiences-and-innovative-approaches-to-the-diagnosis/sputum-smear-microscopy-for-tuberculosis-evaluation-of-autofocus-functions-and-automatic-identificat

© 2012 The Author(s). Licensee IntechOpen. This is an open access articledistributed under the terms of the Creative Commons Attribution 3.0License, which permits unrestricted use, distribution, and reproduction inany medium, provided the original work is properly cited.