Embed Size (px)
Citation preview
This is a repository copy of Applying Lean thinking in the Food Supply Chains: A Case Study.
White Rose Research Online URL for this paper:http://eprints.whiterose.ac.uk/86289/
Version: Accepted Version
Article:
Vlachos, I (2015) Applying Lean thinking in the Food Supply Chains: A Case Study. Production, Planning and Control, 26 (16). 1351 - 1367. ISSN 0953-7287
https://doi.org/10.1080/09537287.2015.1049238
[email protected]://eprints.whiterose.ac.uk/
Reuse
Unless indicated otherwise, fulltext items are protected by copyright with all rights reserved. The copyright exception in section 29 of the Copyright, Designs and Patents Act 1988 allows the making of a single copy solely for the purpose of non-commercial research or private study within the limits of fair dealing. The publisher or other rights-holder may allow further reproduction and re-use of this version - refer to the White Rose Research Online record for this item. Where records identify the publisher as the copyright holder, users can verify any specific terms of use on the publisher’s website.
Takedown
If you consider content in White Rose Research Online to be in breach of UK law, please notify us by emailing [email protected] including the URL of the record and the reason for the withdrawal request.
1
Applying Lean thinking in the Food Supply Chains: A Case Study
Ilias Vlachos
Leeds University Business School, University of Leeds, Leeds, UK
Ilias Vlachos
BSc MSc PhD Associate Professor in Operations & Supply Chain Management Leeds University Business School University of Leeds Maurice Keyworth Building Leeds LS2 9JT United Kingdom Tel: +44 (0) 113 343 8970 Mobile: +44 (0) 7947366112 Email: [email protected]
2
Applying Lean thinking in the Food Supply Chains: A Case Study
The purpose of the study is to examine the adoption and implementation of
lean thinking in food supply chains. Since the majority of food companies are
small and medium food enterprises (SMEs), a lean action plan was developed
taking into account the particularities of SMEs. The methodology used was a
case study research of a UK tea company. An action research approach was
adopted to study the lean process and diagnose the problems which occurred
during lean implementation. The present study developed a lean action plan
with three stages: (a) Planning for lean; (b) Interim lean diagnosis; and (c)
Lean operations and control. The first stage includes the following steps: find a
change agent, get the knowledge, find a lever, and suspend grand strategy.
Interim lean diagnosis revealed issues with top management support, expert
knowledge, and operational easiness. The last stage, lean operations and
control includes the following steps: (i) Re-define Value; (ii) Map Process
Activities and Value Streams; (iii) Detect Waste; (iv) Develop an Ideal State of
Production and Supply Chain Operations; and (v) Control lean operations. The
potential contribution of lean food small and medium companies can be
enormous given the percentage of food waste across supply chains. The
contribution of this study is threefold: (a) it develops a new lean action plan for
small and medium companies; (b) it sheds light on how lean thinking can be
applied in the food sector and achieve substantial waste reductions; (c) it tests a
unique reflecting methodology using action case research to gather, interpret,
and develop reflective learning.
Keywords: Lean Thinking, Lean Action Plan, Tea Industry, Case Research,
Action Research, Value, Value Stream, Waste Reduction, SMEs
Introduction
In times of recession, companies search for ways to reduce cost without jeopardising
quality. Lean practices relate to waste reduction in ways that do not simply reduce
waste, but in doing so add to the value offered to customers (Womack and Jones,
2005). Lean Thinking is a set of principles, philosophies, and business processes that
3
enable the elimination of waste and add value to customers (Tsasis and Bruce-Barrett,
2008). It is based upon the Toyota Production System (TPS) that focuses on
simultaneously eliminating waste and improving customer satisfaction (Pegels, 1984).
According to lean thinking, waste can be anything other than the equipment,
materials, parts, space, and working time required to provide the service.
Since their adoption by Toyota, lean practices and tools have become popular
among large companies. However, small and medium companies can also learn and
benefit from the application of lean practices and tools to detect and reduce waste
(Womack and Jones, 1996a). Although the origins of Lean Thinking stem from large
manufacturing companies, with the Toyota Production System being a yardstick of
the practice, small and medium companies in manufacturing and service have
implemented Lean Thinking in a successful manner (Womack, 2004; Cuatrecasas,
2004; Cookson et al., 2011).
Waste is not new in the food sector but its elimination requires a systematic
way of thinking. The Food and Agriculture Organization (FAO) of the United Nations
stretched the impact of food losses and waste across the supply chains in its efforts to
combat hunger, raise income, improve food security, foster economic development
and protect the environment (Gustavsson et al., 2011). The FAO further estimates that
roughly one-third of all edible food produced for human consumption, approximately
1.3 billion metric tons, is wasted or otherwise lost from the food supply per year
(Gustavsson et al., 2011). Although a recent EU study recognized that obtaining
reliable data on food waste was a recurring obstacle, the study estimated annual food
waste in the EU at approximately 179 kg per person (Bio Intelligence Service, 2010).
Buzby and Hyman (2012) estimated total value of food loss at the retail and consumer
levels in the United States as purchased at retail prices to be $165.6 billion in 2008.
4
Food waste can occur at any point of the supply chain (Gustavsson et al.,
2011). At harvesting, waste may include crops damaged during harvesting or edible
crops left in fields deteriorating. Post-harvest food waste includes food loss due to
decrease in food quantity or quality and spoilage of perishable food that deteriorates
to the point at which it is not edible or safe to consume. In processes such as
threshing, drying, primary processing, cleaning, classification, transportation,
distribution, and storage, food waste may occur due to loss through poor techniques,
facilities or infrastructure, process losses, contamination, and poor handling. Finally,
retail and post-consumer losses include food wasted from activities and operations
such as short life cycles, that may create confusion over ‘best before’ and ‘use by’
dates to consumers and poor food preparation techniques (Gustavsson et al., 2011).
Therefore, lean food supply chains can have an enormous economic, social,
and environmental impact. However, the majority of companies in the food sector are
Small and Medium Enterprises (SMEs). According to Eurostat, the European Union’s
food market is made up of approximately 310,000 companies, 99% of which are small
companies generating a relatively low proportion of value added (45.5 %) in the food
sector compared to large companies (Eurostat, 2011). Value wasted throughout the
supply chain and production operations is one of the reasons for the low value added
of SMEs.
Lean practices can eliminate waste better than the non-systematic, empirical
methods that SMEs often use (Kumar et al. 2006). According to lean thinking, there
are different types of waste that can be addressed and eliminated. Therefore, lean
practices could potentially be a solution for the wasted value in the food supply
chains. However, despite many successful lean implementations, companies often fail
to apply lean tools and techniques. Therefore, it is essential to understand how SMEs
5
attempt to implement lean tools in order to develop a successful lean action plan.
There is paucity of empirical research in this area. The research contribution of the
present work is a new lean action plan that can be adopted by small and medium
enterprises, particularly by those operating in the food sector. The practical
contribution of creating lean production and supply chain operations in SMEs can be
enormous given the percentage of food waste across supply chains. Further, since
most food ingredients are globally sourced, this study contributes to examine global
food supply chains linking production in developing regions with markets in
developed countries. This study examined a case company from the UK tea industry,
an industry with high value and ingredients sourced from overseas. Therefore, there is
a potential contribution in understanding how to apply lean thinking in global food
supply chains. Although the scope of the research questions could be generalized to
SMEs from any industry, this study’s research scope is the food industry.
The paper has five sections, including this introduction. Section 2 provides a
brief review of lean tools and techniques, the lean action plan, and unsuccessful lean
implementations. Section 2 concludes with a review of the UK tea industry. Section 3
describes the research methodology, justifies the selection of action case research,
discusses the research design, the types and sources of evidence and presents, briefly,
the case study. The findings from the action research are reported in Section 4.
Section 5 discusses the implications of the findings for practitioners and researchers,
draws conclusions, presents limitations and offers suggestions for future research.
Literature Review
There is consensus that lean techniques can eliminate waste and reduce risk to
manufacturing and services sectors including construction (Howell and Ballard,
6
1998), aerospace (Hines et al., 2004), services (Bortolotti and Romano, 2012; Suárez-
Barrazaa et al., 2012), tourism (Vlachos and Bogdanovic, 2013), hospitals (Reijula,
2012; Young and McClean, 2008), and public administration (Radnor and Walley,
2008).
Despite the lack of a universal definition of lean thinking (Shah and Ward,
2007), there is consensus that the adoption of lean thinking has a twofold impact on
the way companies do business: (a) at the strategic level, lean thinking helps
companies to define value; and (b) at the operational level, lean thinking provides a
set of tools and techniques to eliminate waste (Hasle et al., 2012). Implementing lean
thinking needs a clear understanding of what lean is and what constitutes a successful
lean action plan. The remainder of this section reviews key lean concepts and
techniques, introduces the lean action plan, reviews unsuccessful lean
implementation, and briefly presents the UK tea industry.
Lean Tools and Techniques
Lean thinking focuses on the removal of obstacles (“waste”) that hinder the
unremitting flow of work processes (Liker, 2004, p.31). According to lean thinking,
there are seven types of waste: Overproduction; waiting; transport; inappropriate
processing; unnecessary inventory; unnecessary motion; and defects). Womack and
Jones (1996a) developed the “The five steps model” which assumes that there are five
consecutive sets of actions from value to perfection which transform problematic,
operational practices into well organized flows of goods and services. Defining
‘value’ is the first step in lean thinking. Value can only be defined by the ultimate end
customer. The second step is the identification of the value stream by breaking down
value adding activities into individual steps. In this way, the value stream provides the
7
possibility to recognize actions which represent or create “waste”. The elimination of
waste gives the possibility for process re-engineering and the creation a continuous
“flow”. Companies are then able to develop a “pull” system in which the customer,
not the company, is the one who triggers the production; thus, goods and services
reach the customer only when asked for, neither before nor after requested. The final
step is a step into “perfection”, which is the complete elimination of waste so that all
activities along a value stream create value. In many cases, lean transformations are
radical changes that need a supportive organizational culture in order to be successful
(Womack and Jones, 1996b; Tsasis and Bruce-Barrett, 2008).
There are a number of lean tools available for companies to use, including SMED
(Single Minute Exchange of Dies) and Value Stream Mapping (Shingo, 1985). A
piecemeal, unsystematic application of a single lean tool or technique may reduce
waste in business processes without obstructing business as usual. However, lean
thinking is much more than implementing a lean tool: it is a set of principles and a
business philosophy (Tsasis and Bruce-Barrett, 2008). The real influence of lean tools
can be realized when they are implemented as part of a lean action plan. In this way,
lean endeavours can bring systematic and sustainable results by reducing waste and
increasing value to customers.
Lean Action Plan
There is no more than scarce evidence on how to manage the change from defining
value towards lean perfection (Simon and Canacari, 2012; Slomp et al. 2009;
Womack, 2004). For example, Wan and Chen (2009) proposed that after an
organization makes a commitment to implement lean, the journey to lean includes
8
three major activities: lean training, value stream mapping, and lean assessment. Wan
and Chen (2009) point out that extensive knowledge and experiences are needed for
identifying the correct lean tools, thus lean assessment can be considered as a step of a
learning process that helps companies to evaluate what went wrong, learn from their
mistakes, and expand their knowledge via lean training. Womack and Jones (2003,
pp. 247–255) proposed a broader perspective of lean transformation which includes
the following steps:
1. Find a lean change agent: This person should be the manager for the
transformation project until its successful completion. The lean agent should
take specific actions in cultivating the lean culture, leading, managing and
educating the personnel about lean tools and techniques.
2. Get the knowledge: Not all senior managers are aware of how to
apply lean tools and this can be a barrier in creating a lean culture as well as
diagnosing problems and devising solutions.
3. Find a lever by seizing a crisis or creating one: Lean transformation
can bring radical changes and create resistance to change. A crisis can be an
opportunity for change and lean agents should take advantage of it to initiate
lean changes. Creating and solving a crisis can help a lean change, yet it can
inflame resistance to change if the lean agent does persuade the personnel of
its cause.
4. Forget grand strategy for the moment: The change that lean brings
to operations can be radical in the extent to which the focus should be on the
process itself rather than the business strategy. For example, identification of
9
non-value added activities requires micro-management rather than strategic
thinking.
5. Map your value streams: The identification of waste requires detailed
information about the value streams and identification of all value-added and
non-value-added activities.
6. Begin as soon as possible with an important and visible activity: A
quick start and easy wins can create confidence in the process.
7. Demand immediate results: Although immediate results are always
welcomed, there is a risk regarding expecting too much from the wrong people
and activities: putting pressure in the wrong activities can jeopardize the lean
transformation.
8. As soon as you have momentum, expand your scope: As soon as the
results of the lean application and the news are spread across departments and
functions, the lean champion needs to take the opportunity to use the lean
techniques to reveal more problems and offer solutions to remove waste and
streamline the processes.
Failures to Deliver Lean Results
Womack and Jones (2003) proposed the action plan in a manufacturing context, yet
empirical and anecdotal studies have challenged the universality of lean tools. For
example, the Manufacturer Magazine (2011) reported that only 5 % of lean projects
delivered the expected results in 2011. Many successful organizations are still
successful without submitting to lean thinking. For example, companies that had won
the Shingo prize, which is awarded to companies that successfully implement
management practices such as Six Sigma and TQM, reported a gross profit and
10
revenue growth weaker or similar to their peers without a prize, three years after
receiving the prize (McCullough, 2011).
The factors that lead to lean failures have been under-researched (Cooney,
2002; Cox and Chicksand, 2005). We reviewed the literature on sciencedirect and
emerald from 1993-2013 and classified lean failure factors under three categories: (i)
leadership; (ii) business culture and people issues; and (iii) action plan customization.
Leadership
Cudney and Elrod (2011) proposed that a number of factors contribute to lean
failures: (1) Short term commitment; (2) Lack of focus on a specific issue; (3) Poor
Planning; (4) Poor employee involvement; (5) Ineffective training method; and (6)
Poor understanding from top managers. Kubiak (2011) reviewed the lean Six Sigma
initiative and supporting processes of a large multinational organization and found
that proper planning suffered because this organization's leadership desired fast
results. Achanga et al., (2006) studied ten SMEs that had recently implemented lean
projects and found that, despite the scepticism within SMEs about the benefits of lean
thinking to their business, the critical factors of lean success and failure were:
leadership, management, and strategic vision. Sarkar (2011) reported eight factors that
leading to failure of Six Sigma or lean production: (a) not having a mindshare of
leadership; (b) not working on the right business priorities; (c) not having a larger
roadmap in place; (d) not being a methodology agnostic; (e) not having the right
number of change agents; (f) not being able to coach the top management; (g) not
focusing on values necessary for creating continuous improvement culture; and (h)
not having the right organizational culture.
11
McManus (2008) argued that Six Sigma and Quality programmes in general
fail because business leaders fail to support them properly with trained mentors, team
members and funding. Seddon and Caulkin (2007) argued that leaders and managers
often make the mistake of supposing that lean tools and techniques are adequate to
deliver a profound shift in lean thinking and business culture. However, leaders need
to first unlearn and then relearn in order to initiate a radical redesign and (as a
consequence) cultural change.
Business Culture and People Issues
Bamber and Dale (2000) studied the application of lean production methods to a
traditional aerospace manufacturing organization. Despite early achievements with
the help of external lean consultants, the company could not cultivate a lean culture
since for at least two decades people have been poorly managed in the company.
Therefore, there was no commitment to lean production, and as soon as consultants
left, interest in the lean production evaporated, inhibiting improvements within the
factory as well as preventing the spread of lean production methods to suppliers. Chen
and Meng (2010) reported that since the 1990s, many enterprises in mainland China
have deployed lean production, yet many of them failed to realize their original
targets due to the following reasons: (a) companies failed to recognize the strategic
importance of lean thinking and focused too much on lean tools; (b) companies were
eager for quick results and abandoned the lean process with the first failure; (c)
companies attempted to imitate and copy success practices without adopting them to
their own business culture; and (d) knowledge of lean tools was superficial without
analytical skills to pinpoint problems. The authors suggested that only with a cultural
change lean thinking can be beneficial to Chinese companies.
12
Carter et al. (2011) reported a lean implementation failure in the public sector
(HM Revenues and Customs - HMRC) mainly due to people issues. Emiliani (2011)
commented on this study and attributed failure to the managers and consultants
promoting lean management as a zero-sum outcome that benefited the company at the
expense of workers. Emiliani further suggested that, to adopt lean in HMRC or other
civil service, senior management needs to be prepared to learn something completely
new, which is a prerequisite for the correct lean practice.
Lean Action Plan Customization
Various studies have stretched the importance of customizing lean techniques to the
social and technical specificities of the adopting organization. For example, Turesky
and Connell (2010) reported a lean manufacturing change initiative at a Northern New
England company which failed to produce sustained results and proposed a four-stage
process of a lean project: foundation, preparation, implementation and sustainability
for continuous improvements.
Cox and Chicksand (2005) presented an unsuccessful implementation of lean
principles in the red meat industry. The decision to adopt lean principles came as a
response to the observed loss of competitiveness of the industry. Although creating
lean operations was cost-effective, it was not feasible to change the business
partnerships and supply chain culture which was based on short term, adversarial
relationships. Another study on the red meat industry demonstrated that lean
principles were beneficial within one specific process of the chain (Zokaei and
Simons, 2006). The study attributed a correlation between “advanced lean cutting
rooms” and a productivity increase of 25% compared to the traditional cutting rooms
(Zokaei and Simons, 2006).
13
Operational issues can be a barrier for lean implementation (Lyons et al.,
2013). Lean tools seem more suitable for high volume sales with predictable demand
patterns and supply certainty (Pullan et al., 2013). Without strong supply chain
governance, there is a lack of leadership in initiating and implementing the necessary
changes across the supply chain. Supply chain governance can be achieved by
different types of collaborations such as strategic alliances and collaborations across
the supply chain (Kerber and Dreckshage, 2011).
Despite the effectiveness of lean tools to reduce waste, a number of failed lean
projects indicate that the action plan initially proposed by Womack and Jones (2003)
may have limitations and needs adaptation when applied to a different context other
than the manufacturing industry. The literature review has revealed only a few
recurring factors that may lead to lean failure, including: leadership; business culture
and people issues; and action plan customization. The lack of a lean action plan
especially for SMEs creates a need for action research and reflecting learning from
lean implications in practice.
The UK Tea Industry
Drunk by nearly nine in ten Britons, tea is more a household staple than a
discretionary item with a mature yet diverse market. Retail value sales of tea lifted to
£655 million in 2011, a 22% increase over the previous five years. Value and market
shares of in-home tea retail sales were in 2011, respectively: ordinary bags (£463m,
71%); fruit & herbal bags (£54m, 8%); speciality bags (£52m, 8%); decaffeinated
bags (£36m, 6%); green bags (£22m, 3%); loose (£16£, 2%); instant (£8£m, 1%); and
organic bags (£4m, 1%). Being omnipresent in every British home, the main channel
of distribution is through supermarkets (88% of the volume). 63% of the market share
14
is found between four brand leaders (Unilever, Tetley, Twinings, and Typhoo)
focusing on every-day ranges of packaged black tea. Increasing public concern about
health is slowly shifting the demand to alternatives such as green and herbal teas.
Tea grows in tropical and subtropical countries, such as India, China, Sri
Lanka, Indonesia, and Kenya. Though tea companies have to source from the same
main regions, sourcing from remote regions creates waste in supply chains, and they
need to adjust their sourcing strategy depending on factors such as the type of tea,
operational capacity, price fluctuations, and volume. The tea market is mature;
therefore, uncertainty in production due to demand fluctuations is lower.
Concentration in supply allows for economies of scale and operational efficiency to
outbalance losses from waste. Therefore, to survive and prosper, small and medium
food companies need to remove waste from their supply chains, particularly upstream
in the supply chain. Currently, the world tea market is highly concentrated: 90% of
Western trade is concentrated in seven multinational companies; 85% of world
production is sold by multinationals. In the UK, the tea market is highly concentrated
with CR4 steadily over 75%. Even at tea auctions in countries like India and Sri
Lanka, large brokers prevail; i.e., the largest tea broker in India handles over 155
million kg of tea per year, which is about one third of all tea auctioned in India.
Methodology
Case-based Action Research
Case study research was selected for an in-depth inquiry of lean adoption by a UK-
based tea company with operations overseas. Case study research attempts to explore,
15
describe, or explain events as they actually happened (Yin, 1994). Action research is
an iterative process involving researchers and practitioners acting together on a
particular cycle of activities, including problem diagnosis, action intervention, and
reflective learning (Yamnill and McLean, 2010). Holter and Schwartz-Barcott (1993)
described action research as an inquiry in the context of focused efforts to improve the
quality of an organization and its performance. Action research combines theory and
practice through change and reflection in an immediate problematic situation within a
mutually acceptable ethical framework (Avison et al., 1999). Action research involves
the research making active contributions to the case company while undertaking the
research. Critics of action research observe that researchers embedded within a study
may compromise their objectivity, yet they acknowledge that researchers offer unique
insights that outside researchers may not observe (McIntyre, 2008; Mehra et al.,
2002).
The Research Design
There is consensus that a gap exists in the academic literature on how to produce
sound research designs when conducting case research (Hamel et al., 1993; Morgan
and Morgan, 2008; Yin, 1994). Easterby-Smith et al.(1991, p. 21) defined the research
design as“... the overall configuration of a piece of research: what kind of evidence is
gathered from where, and how such evidence is interpreted in order to provide good
answers to the basic research question[s].” Zuber-Skerrit (1995) proposed a four-step
process in undertaking action research: (1) planning, which involves reconnaissance;
(2) taking actions; (3) observing processes and outcomes and collecting data at both
individual and group levels; and (4) reflective learning.
16
Validity, Reliability and Sources of Evidence
In order to increase the validity and reliability of the research design, a number of
different types of evidence can be utilized, such as documents, archival records,
interviews, direct observation, participant observation, and physical artefacts
(Easterby-Smith et al., 2012; Yin, 1994). Documents could be letters, memoranda,
agendas, study reports, or any items that could count as evidence. Documents are
stable and unobtrusive source of evidence, yet access to critical or sensitive
information may be blocked. This study used various reports in order to collect
evidence about value, value streams, operations management, and performance
objectives. Archival records could be useful since they include service records, maps,
charts, catalogues of names, survey data, and even personal records such as diaries.
However, they lay on the same limited access with documents. This study utilized
archival data in order to assist in developing the value stream mappings. Direct
observations can examine formal or casual activities, but the reliability of the
observation is the main concern. In this case study, walk-in warehouses, observation
of operations in practice were directly observed during on-site visits. Interviews are
the main source of evidence in case research (Marshall and Rossman, 2010),
therefore, in this study, the primary source of information was open-ended, semi-
structured interviews with key decision-makers. In action research, interviews take the
form of informal and formal discussions. Therefore, the interviews with decision-
makers provided evidence which were triangulated with data and information
collected from other sources such as reports and direct observations, which increases
the validity of the research design.
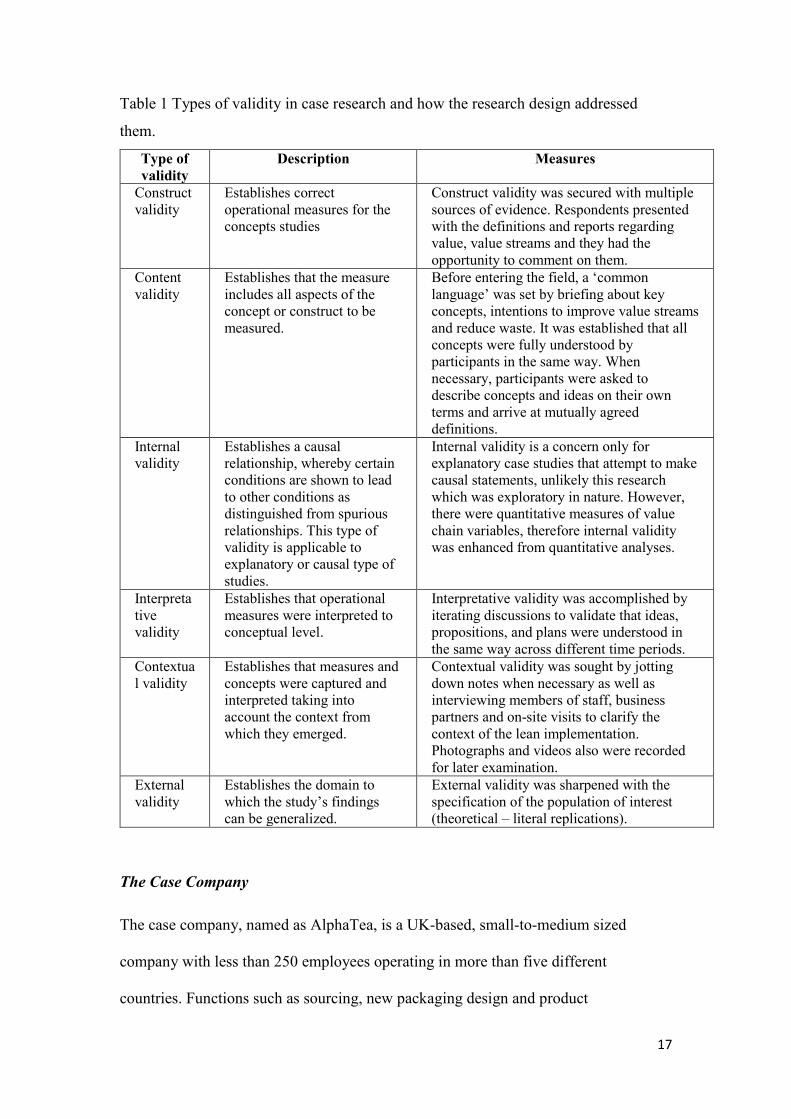
Table 1 presents the different types of validity and how this research addressed them.
17
Table 1 Types of validity in case research and how the research design addressed
them.
Type of
validity
Description Measures
Construct validity
Establishes correct operational measures for the concepts studies
Construct validity was secured with multiple sources of evidence. Respondents presented with the definitions and reports regarding value, value streams and they had the opportunity to comment on them.
Content validity
Establishes that the measure includes all aspects of the concept or construct to be measured.
Before entering the field, a ‘common language’ was set by briefing about key concepts, intentions to improve value streams and reduce waste. It was established that all concepts were fully understood by participants in the same way. When necessary, participants were asked to describe concepts and ideas on their own terms and arrive at mutually agreed definitions.
Internal validity
Establishes a causal relationship, whereby certain conditions are shown to lead to other conditions as distinguished from spurious relationships. This type of validity is applicable to explanatory or causal type of studies.
Internal validity is a concern only for explanatory case studies that attempt to make causal statements, unlikely this research which was exploratory in nature. However, there were quantitative measures of value chain variables, therefore internal validity was enhanced from quantitative analyses.
Interpretative validity
Establishes that operational measures were interpreted to conceptual level.
Interpretative validity was accomplished by iterating discussions to validate that ideas, propositions, and plans were understood in the same way across different time periods.
Contextual validity
Establishes that measures and concepts were captured and interpreted taking into account the context from which they emerged.
Contextual validity was sought by jotting down notes when necessary as well as interviewing members of staff, business partners and on-site visits to clarify the context of the lean implementation. Photographs and videos also were recorded for later examination.
External validity
Establishes the domain to which the study’s findings can be generalized.
External validity was sharpened with the specification of the population of interest (theoretical – literal replications).
The Case Company
The case company, named as AlphaTea, is a UK-based, small-to-medium sized
company with less than 250 employees operating in more than five different
countries. Functions such as sourcing, new packaging design and product
18
manufacturing are traditionally kept in-house. The company has a strong annual
growth of about 30%, with a wide range of products including black, green, white teas
and herbal infusions in more than 10 different packaging formats. The company finds
it easier to sell its products to specialist food shops, luxurious hotels and restaurants.
The company recently built a new plant in India. This decision was motivated
by the need to guarantee the best quality of tea leaves by reducing the transport time
between the tea growing regions and the manufacturing site, which was equipped with
a modern storage and climate control technology.
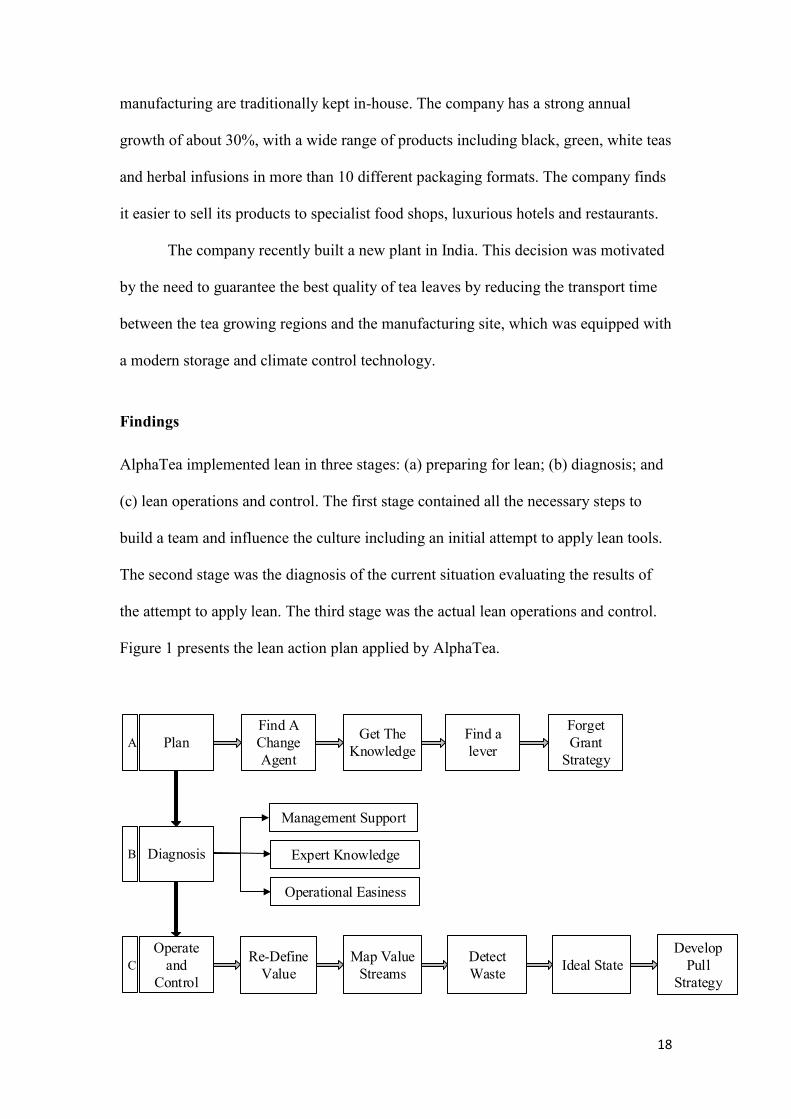
Findings
AlphaTea implemented lean in three stages: (a) preparing for lean; (b) diagnosis; and
(c) lean operations and control. The first stage contained all the necessary steps to
build a team and influence the culture including an initial attempt to apply lean tools.
The second stage was the diagnosis of the current situation evaluating the results of
the attempt to apply lean. The third stage was the actual lean operations and control.
Figure 1 presents the lean action plan applied by AlphaTea.
Find A
Change
Agent
Get The
Knowledge
Find a
lever
Diagnosis
Re-Define
Value
Map Value
Streams
Detect
WasteIdeal State
Develop
Pull
Strategy
Forget
Grant
Strategy
Management Support
Expert Knowledge
Operational Easiness
Plan
Operate
and
Control
A
B
C
19
Figure 1 Lean Action Plan
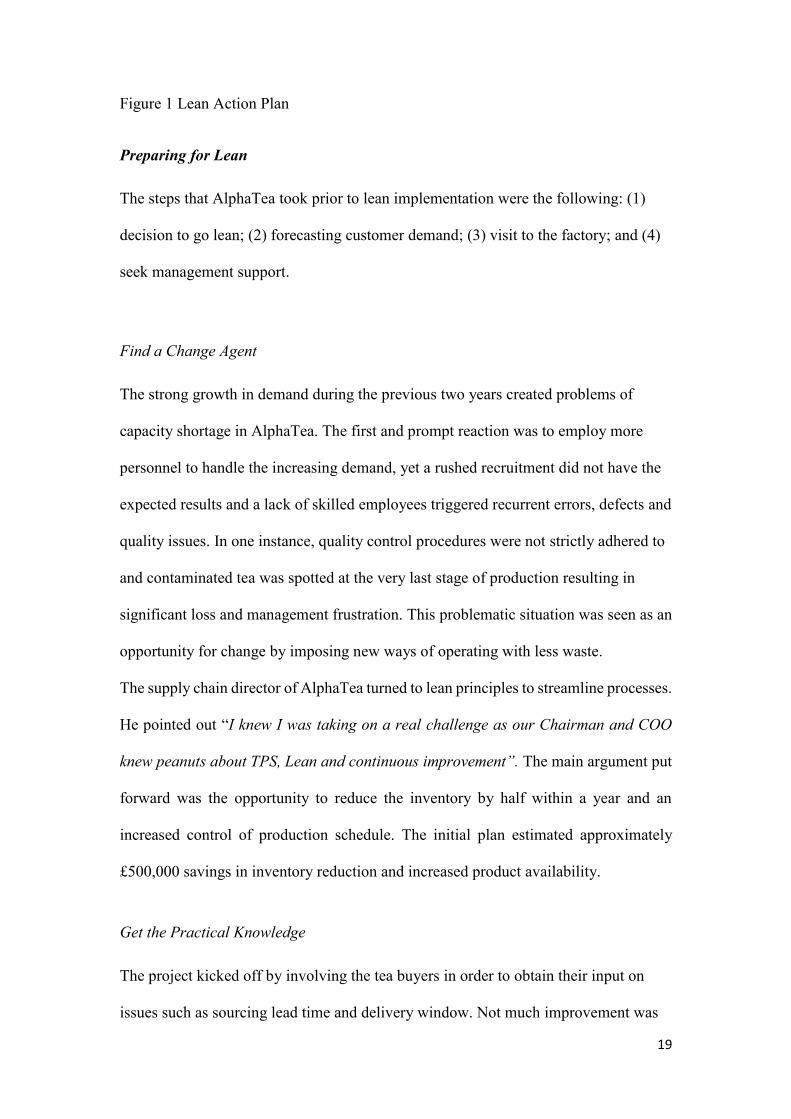
Preparing for Lean
The steps that AlphaTea took prior to lean implementation were the following: (1)
decision to go lean; (2) forecasting customer demand; (3) visit to the factory; and (4)
seek management support.
Find a Change Agent
The strong growth in demand during the previous two years created problems of
capacity shortage in AlphaTea. The first and prompt reaction was to employ more
personnel to handle the increasing demand, yet a rushed recruitment did not have the
expected results and a lack of skilled employees triggered recurrent errors, defects and
quality issues. In one instance, quality control procedures were not strictly adhered to
and contaminated tea was spotted at the very last stage of production resulting in
significant loss and management frustration. This problematic situation was seen as an
opportunity for change by imposing new ways of operating with less waste.
The supply chain director of AlphaTea turned to lean principles to streamline processes.
He pointed out “I knew I was taking on a real challenge as our Chairman and COO
knew peanuts about TPS, Lean and continuous improvement”. The main argument put
forward was the opportunity to reduce the inventory by half within a year and an
increased control of production schedule. The initial plan estimated approximately
£500,000 savings in inventory reduction and increased product availability.
Get the Practical Knowledge
The project kicked off by involving the tea buyers in order to obtain their input on
issues such as sourcing lead time and delivery window. Not much improvement was
20
obtained due to the lack of control over the process and suppliers’ production
schedules that could see variations of up to six months. Therefore, the use of buffers
appeared to be unavoidable.
Find a Lever - Visit to the Factory to Seize a Crisis
The next stage was a trip to India to meet the factory team and explain the
requirements of the lean principles. The tea factory was under a number of constraints
that could potentially generate a crisis to be seized. Firstly, the buying quantities faced
huge variations due to market and weather conditions, which affected the factory’s
ability to maintain a level production. Further, there was a lack of collaborative
culture between the company and its suppliers, which resulted in poor forecast
planning. A recent, unexpected change in Indian customs import rules would
potentially delay supply by up to a month. Given that the factory was located far away
from its suppliers and its markets, resulting in long lead-time, these import rules
would create more unwanted fluctuations and potentially a crisis in tea production
scheduling. This would be an ideal lever to seize a crisis to impose the proposed lean
changes.
The factory team immediately reacted with disbelief. The time required for the
changeovers alone did not allow for such a schedule. The changeover lead-time could
be reduced if the production sequence concerned flavourings-free products. However,
although this solution sounded logical it did not fit the actual demand pattern.
Suspend Grand Strategy
Once back in the UK, top management was debriefed and support was obtained
despite the resistance to change from factory managers. Daily online conferences
21
were scheduled with factory managers to identify the most realistic sequence of
production. The greatest challenge was with the machine as no one in the team had
the skills to dismantle and re-design some parts. The cost associated with the
assistance of a dedicated engineer from the company selling these machines was so
high that this option was quickly dismissed.
The management team decided to go ahead and put emphasis on streamlining factory
operations. Improvements were based on calculating the current takt time of the
operations, the number of operators needed as well as the number of kanban required.
Takt Time = Working hours / day ÷ Demand /day
Daily demand = Monthly demand ÷ Working days / month
Number of operators needed = Operating Cycle time ÷ Takt time
Number of Kanban required = Daily demand x (lead time + buffers) ÷ cases
per pallet
Takt time represents the ideal state of production meeting demand and is a
core measure in every lean implementation. Therefore, its introduction was a
significant step in process improvement in the lean action plan. The solution adopted
was an improvement of the previous production system, which was a pure push
system with large batches produced and shipped on a weekly basis. Therefore, the
forecasted demand for the month was divided into weekly batch requirements. The
new system was a daily schedule where the forecasted demand for a month was
broken down into daily requirements quotas. Although this approach can be qualified
as a mixed model of production, the use of batches remains strong. Each day was
divided into production windows dedicated to one product only. Changeovers were
intentionally kept to a minimum and were without doubt a very important factor
22
influencing each day’s workload. Inventory did not decrease as no opportunity to do
so could be identified. A recurrent issue linked to the kanban was when all production
kanbans were accompanying the output buffer stock or were simply damaged or lost.
The flow of the production sequence was also frequently disrupted by productions
dictated by ‘best before’ date requirements, exportation requirements to avoid import
duties and machine breakdown or maintenance. The supply chain was regularly
disrupted by events such as port health inspections, transhipment delays, poor
packaging quality, and reductions at destination ports due to theft. Any past attempt to
alter the inventory policy was quickly punished by a major shortage and unhappy
customers.
Interim Lean Diagnosis
The initial lean project faced many difficulties and it was quickly abandoned. The
attempt to improve factory operations was also unsuccessful. The AlphaTea Company
employed reflecting learning to learn by its own mistakes. The role of academics as
consultants to increase organizational learning was important during this stage.
Specifically, the Alphatea Company conducted an interim lean diagnosis to identify
problems from its inception until late discovery of problems in the production line and
revealed three problematic areas:
Lack of top management support
Top management was never directly involved in the lean project, resulting in a limited
project in scope and in scale. Lack of lean knowledge was a barrier to support and
commitment in lean changes, an attitude visible to the workforce.
23
Lack of expert knowledge
AlphaTea Company, as an SME could appoint one lean change agent in a key
position, yet knowledge about lean tools and techniques was lacking amongst most
managers. As a result, focus remained on achieving immediate, quick results rather
than long term planning and strategic lean thinking. AlphaTea attempted to overrun
this lack of knowledge by focusing on kanban methodology. They also explored
Single Minute Exchange of Dies (SMED) methodology, which aims at the elimination
of waste in the work environment that results from unorganized, unclean material,
tools and machines associated with setup/changeover processes (Shingo, 1985).
However, the attempt to obtain immediate results was not fruitful since lean
success requires a series of successful and successive steps, each depending on the
previous, i.e., first define value, then identify value streams, then create flow and so
on. Further, often the simultaneous implementation of several lean tools is required,
which necessitates an advanced knowledge of lean tools (Bhasin and Burcher, 2006;
Liker, 2004).
Operational Easiness
The tea industry, like many food industries, is unique in having high and
unpredictable supply variability due to weather conditions, seasonality and
international trade constraints. Further, demand is satisfied by recipes and in turn
recipes are based on ingredients that have an uncertain supply-side. Therefore, recipes
need to be flexible to adapt to the market environment, yet changes in production
lines are generally long and involve rigorous cleaning, and re-tuning that generate
waste. For example, strong flavour products should be produced after weak flavours,
which is another constraint to the optimum production sequence. Supply of
24
ingredients depends on auctions with prices fluctuating unpredictably. Improving
production operations while work-in-progress need long-term commitment to trade-
off any operational difficulties during transition.
Another critical factor missing to AlphaTea was a crisis to trigger the change
process. A crisis leaves little room for disagreement on a “new sense of purpose and
team spirit in saving itself from oblivion” (Womack et al, 1990, p. 258) and motivates
individuals to overcome what was perceived as impossible for years. The quality
issues that triggered the lean action plan were the missed opportunity to act as a lever
to pursue lean changes, since they were the crisis that a lean manager would ask for.
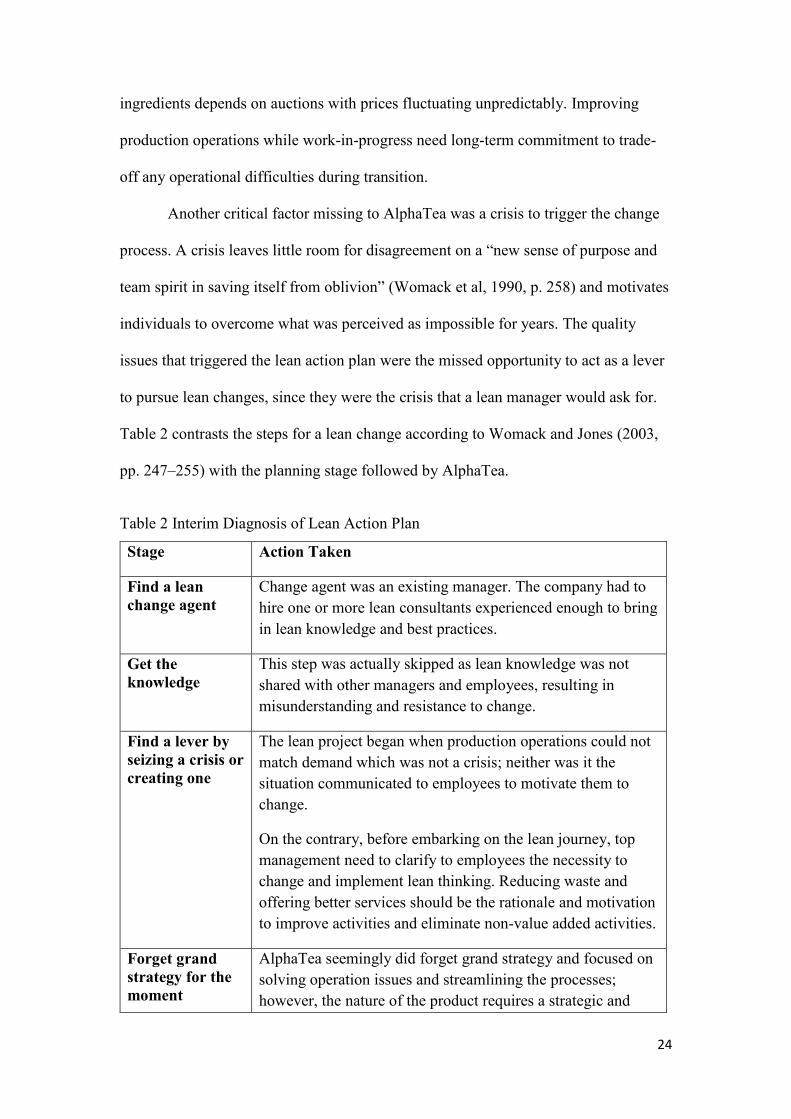
Table 2 contrasts the steps for a lean change according to Womack and Jones (2003,
pp. 247–255) with the planning stage followed by AlphaTea.
Table 2 Interim Diagnosis of Lean Action Plan
Stage Action Taken
Find a lean
change agent Change agent was an existing manager. The company had to
hire one or more lean consultants experienced enough to bring
in lean knowledge and best practices.
Get the
knowledge This step was actually skipped as lean knowledge was not
shared with other managers and employees, resulting in
misunderstanding and resistance to change.
Find a lever by
seizing a crisis or
creating one
The lean project began when production operations could not
match demand which was not a crisis; neither was it the
situation communicated to employees to motivate them to
change.
On the contrary, before embarking on the lean journey, top
management need to clarify to employees the necessity to
change and implement lean thinking. Reducing waste and
offering better services should be the rationale and motivation
to improve activities and eliminate non-value added activities.
Forget grand
strategy for the
moment
AlphaTea seemingly did forget grand strategy and focused on
solving operation issues and streamlining the processes;
however, the nature of the product requires a strategic and
25
long-term commitment since production lines needs tuning
that would disturb production flows.
Lean Implementation and Control
Based on the lessons learned from the initial attempt to implement lean techniques
and the interim diagnosis, the next stage, lean implementation and control, was
developed. AlphaTea needed to adopt the key concepts of lean thinking: value, value
stream, and pull strategy. Therefore, the lean implementation and control contained
the following steps: (1) re-define value; (2) map value streams; (3) detect waste across
the value stream; (4) develop an ideal state of production operations; and (5) control
the lean operations.
Re-define Value
Value comes first in lean thinking. This company needed to redefine what is value
based on pragmatic demand forecasting and then rationalize the product range to
satisfy demand better.
Demand Forecasting: The supply chain can make good use of sales forecasts on a 15
months period for each SKU for every local market. An elementary analysis of previous
demand forecasts showed a great variability and deviations were often as high as 200%
of the initial plans. For example, sales teams often organized promotion events without
informing operations which resulted in draining stocks, creating inventory backlogs,
and frustration among the operation teams. By integrating sales with operations and
fostering open communication channels, the sales function was no longer working in
isolation and reliable demand information was quickly passed to operations.
26
Product Range Rationalization: Having sales and operations working in silos,
another problem gradually became critical: slow moving products were never deleted
from the product range. Research and development (R&D) added new products to the
product range on a continuous basis creating a chaotic range of products offering little
or no value to consumers. A commitment to slow-moving products did not justify the
cost of sourcing and manufacturing creating a huge waste across the supply chain. Re-
defining value was necessary to remove slow-moving products that add little or no
value. AlphaTea focused on value-added products thus creating a strong basis for
rationalizing the product range in turn for optimizing value streaming.
Value Stream Mapping
Having re-defined value based on customer demands, the next step was to create a
value stream to support and offer value to customers. In order to do so, the company
needed to map the existing value streams to identify problematic areas or activities
that added little or no value. There is a variety of tools to map the value stream such
as process activity mapping, supply chain response matrix, production variety funnel,
quality filter mapping, demand amplification mapping, decision point analysis, and
physical structure (Hines and Rich, 1997). The decision of what tools to use was
based on factors such as availability of information, knowledge of lean techniques,
and time constraints, with process activity mapping being the most commonly used.
The process activity mapping broke down the process to the smallest detail. Each
activity within a process was plotted onto a spreadsheet. Each activity was described
by its characteristics, resulting in a large and clear picture of the entire process. Process
activity mapping offered an aerial view of the value-added processes and helped

27
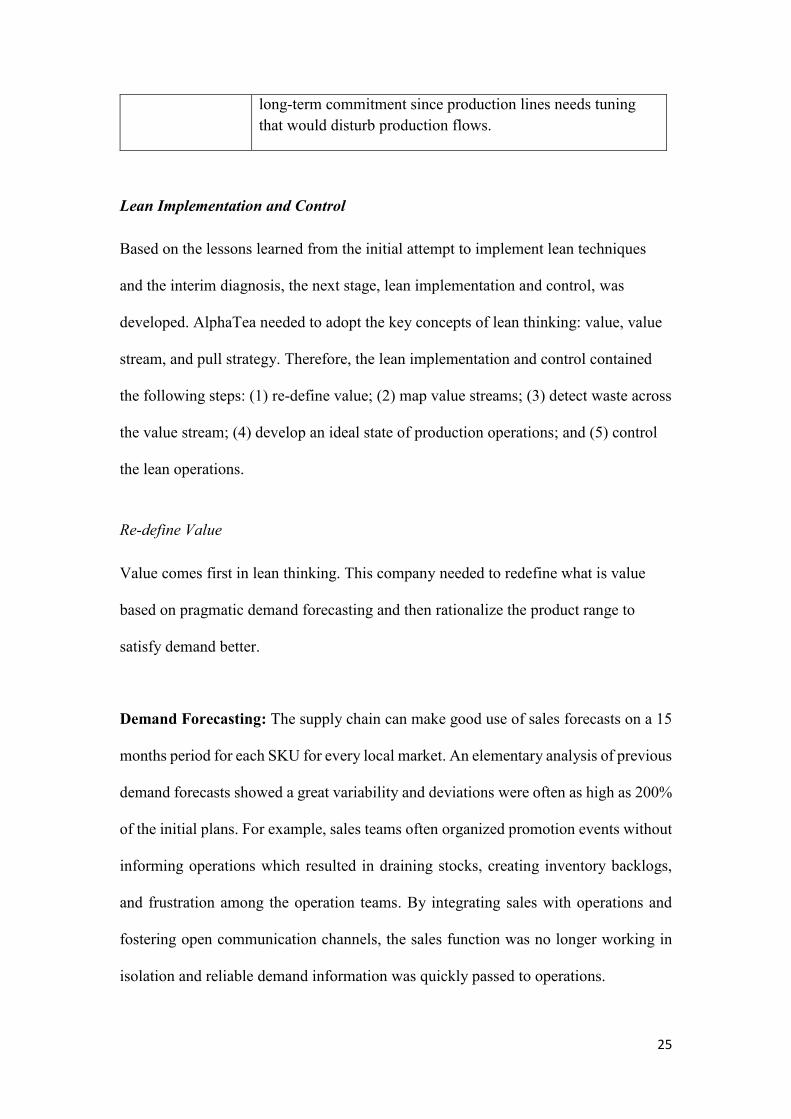
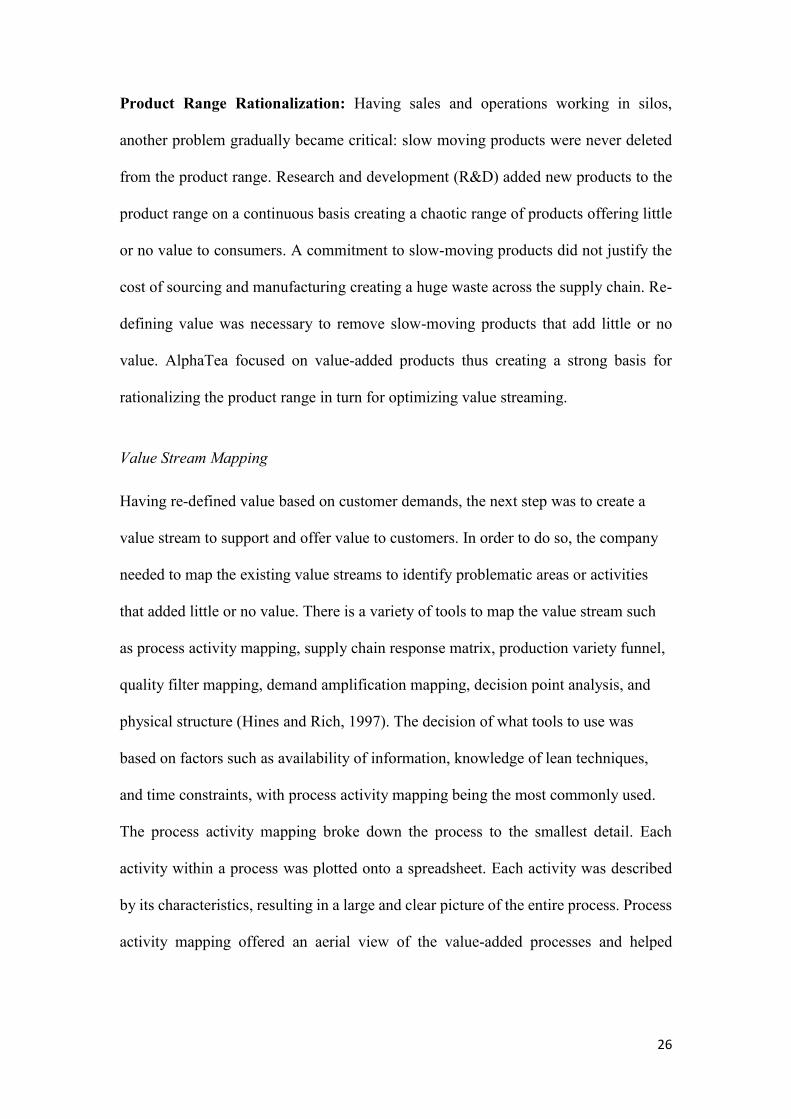
managers to identify processes that add little or no value (Wood, 2004). Figure 2 depicts
the tea value stream and the process activities of AlphaTea.
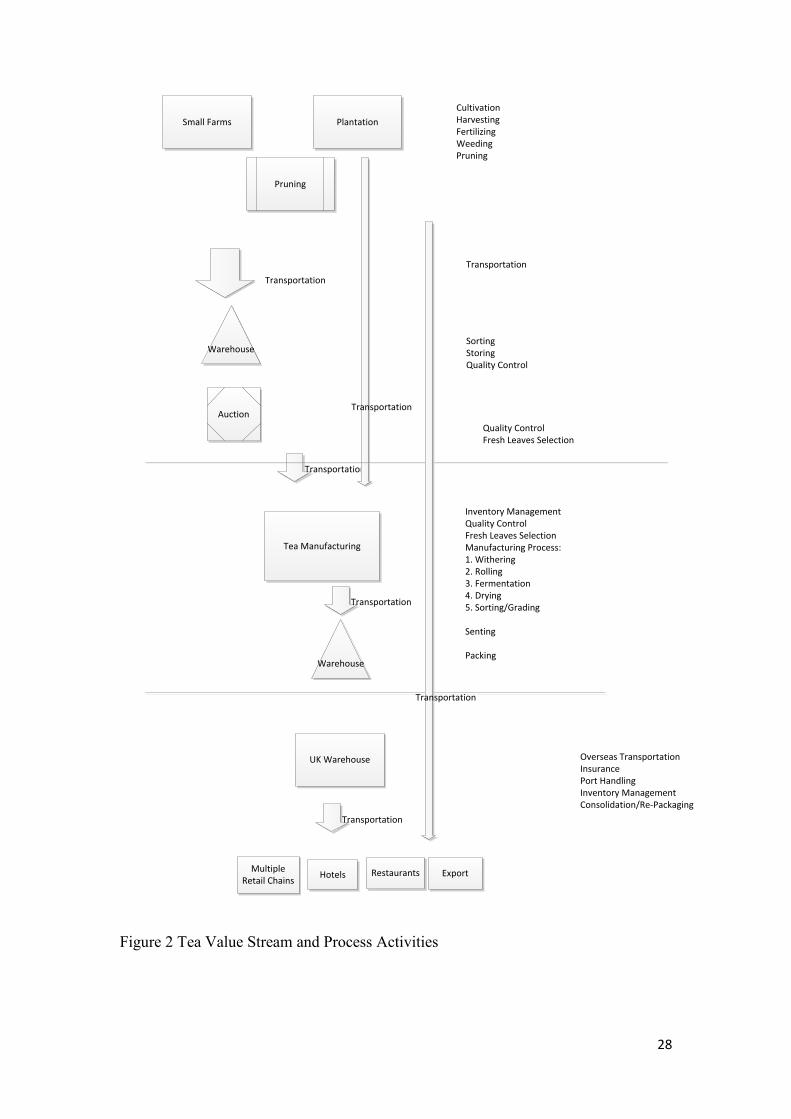
28
Figure 2 Tea Value Stream and Process Activities
Small Farms Plantation
Cultivation
Harvesting
Fertilizing
Weeding
Pruning
Transportation
Warehouse
Transportation
Sorting
Storing
Quality Control
Pruning
Quality Control
Fresh Leaves Selection
Auction
Tea Manufacturing
Transportation
Transportation
Inventory Management
Quality Control
Fresh Leaves Selection
Manufacturing Process:
1. Withering
2. Rolling
3. Fermentation
4. Drying
5. Sorting/Grading
Senting
Packing
Transportation
Warehouse
Multiple
Retail ChainsHotels Restaurants Export
UK Warehouse
Transportation
Overseas Transportation
Insurance
Port Handling
Inventory Management
Consolidation/Re-Packaging
Transportation
29
AlphaTea follows Orthodox production which consists of six stages:
1. Plucking. The tea leaves are picked by hand. Immediately after the harvest, tea
leaves will be sorted by size and shape while removing stems and any other foreign
elements.
2. Withering. The weathering process is required to soften tea leaves that are naturally
not very pliable and it lasts about 16 hours.
3. Rolling. The withered tea leaves are rolled, squeezed and twisted to bring out their
aroma.
4. Fermentation. After the rolling stage, tea leaves are left to rest for several hours to
enhance the oxidation by exposing the leaves’ enzymes and oils to ambient air. The
tea remains green if this process is circumvented.
5. Drying. Firing and drying stops oxidation and reduces moisture to below 3%. The
dryer generates a wind of above 110 degrees over approximately 20 minutes.
6. Sorting & Grading. This operation separates the bulk particles such as stems and
classifies them into different grades/sizes as per market requirements. While tea
leaves are still warm from the previous drying process, they are further passed
through an electrostatic fibre extractor to eliminate any fibres.
The bulk tea will then go through meshes to complete the grading process. Only black
tea can claim to have a general consensus about its grading. Green tea or oolong tea
does not benefit from the same consensus regarding grading. These teas are subject to
a different grading system that is much more complex to understand as it varies from
region to region.
Five main grades are used by tea traders to evaluate consistently the multiple
varieties on offer: (1) Dust: The lowest grade of all; (2) Fanning: Only small pieces of
30
leaves; (3) Broken Orange Pekoe (BOP): small tea leaves or pieces of large leaves of
medium quality; (4) Orange Pekoe (OP): large tea leaves without the flower bud; (5)
whole leaf with three descriptive traits: Golden, Tippy, and Fine; (5a) Golden Flowery
Orange Pekoe-GFOP; (5b) Tippy Golden Orange Pekoe-TGOP; (5c) Fine Tippy
Golden Flowery Orange Pekoe - FTGOP, which is the highest grade existing for tea.
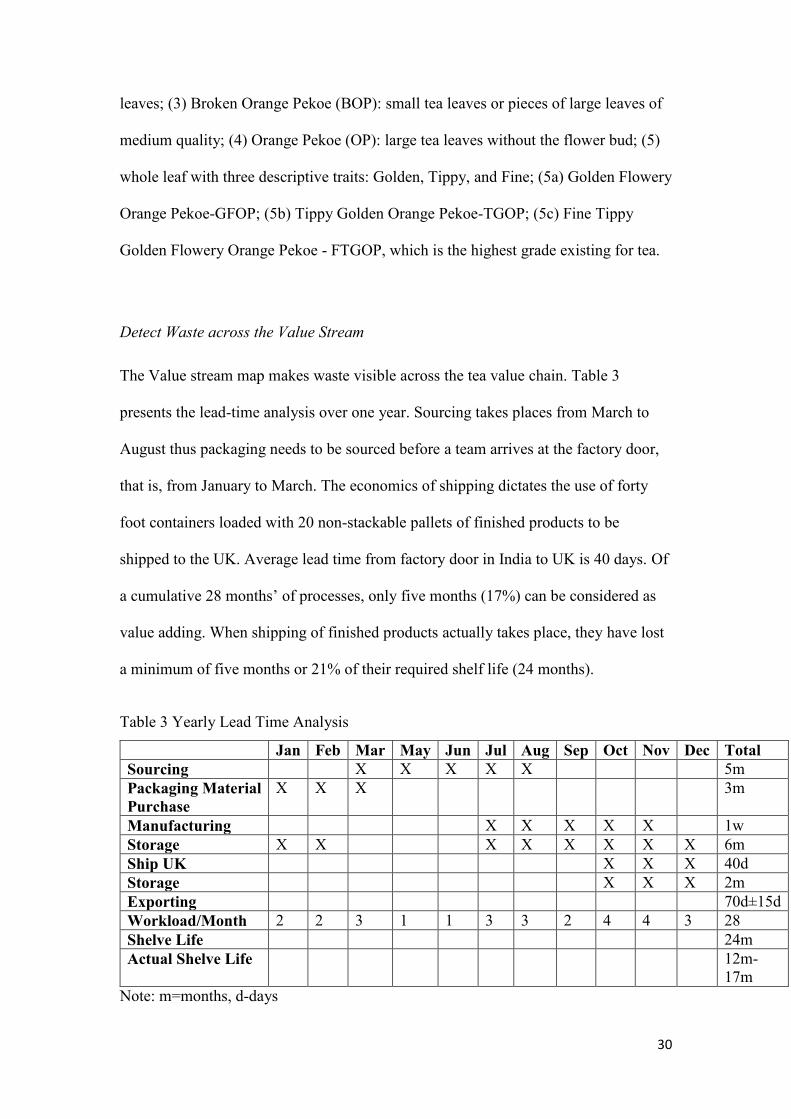
Detect Waste across the Value Stream
The Value stream map makes waste visible across the tea value chain. Table 3
presents the lead-time analysis over one year. Sourcing takes places from March to
August thus packaging needs to be sourced before a team arrives at the factory door,
that is, from January to March. The economics of shipping dictates the use of forty
foot containers loaded with 20 non-stackable pallets of finished products to be
shipped to the UK. Average lead time from factory door in India to UK is 40 days. Of
a cumulative 28 months’ of processes, only five months (17%) can be considered as
value adding. When shipping of finished products actually takes place, they have lost
a minimum of five months or 21% of their required shelf life (24 months).
Table 3 Yearly Lead Time Analysis
Jan Feb Mar May Jun Jul Aug Sep Oct Nov Dec Total
Sourcing X X X X X 5m
Packaging Material
Purchase
X X X 3m
Manufacturing X X X X X 1w
Storage X X X X X X X X 6m
Ship UK X X X 40d
Storage X X X 2m
Exporting 70d±15d
Workload/Month 2 2 3 1 1 3 3 2 4 4 3 28
Shelve Life 24m
Actual Shelve Life 12m-17m
Note: m=months, d-days
31
Develop an Ideal State of Production and Supply Chain Operations
AlphaTea achieved a certain degree of leanness by identifying the sequence of
product that would deliver better runs and allow for changeover with minimum
contamination risk and wastage. This approach is called the Fixed Sequence Variable
Volume (FSVV). A fixed sequence implies that each product actually waits for its
turn. In doing so, it considers the whole production cycle instead of focusing on
individual products and decreases the waste resulting from random and impractical
changeovers (Floyd, 2010). FSVV organizes the production schedule to address the
bulk of the operations into a fixed, schedule system that will enable the whole product
range to be produced faster and at lower cost. This scheduled, optimized production
system delivers extra capacity to respond to non-routine requirement from the market.
AlphaTea produces black (A), green (B), and white (C) teas in more than 10 different
packaging formats as well as a large number of tea products with herbal infusions. With
a traditional system and one tea packing machine to produce a range of 200 products,
random sequencing due to unpredictable demand and supply implies the possibility of
39.800 different changeovers, a virtually infinite amount of changeovers to handle
effectively. With FSVV, it would have to deal with a maximum of 200 different
changeover possibilities (Floyd, 2010). The fixed sequence minimizes waste caused by
changeovers and extra stock production. Changeovers and extra stock can therefore be
seen as “Type One Muda”, which is waste that can be reduced but not eliminated. To
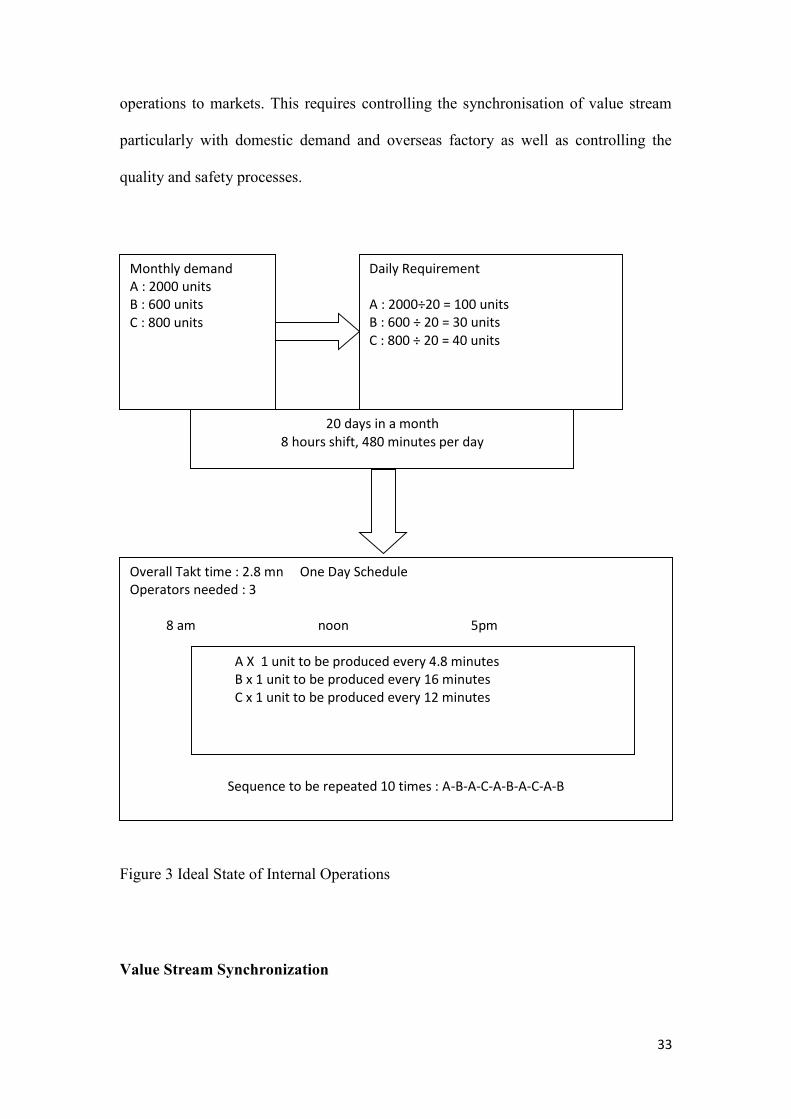
illustrate FSVV, the ideal state is calculated for the production of A, B, C with a
respective demand of 2000, 600 and 800 units per month (Figure 3). With FSVV, the
overall takt time is 2.8 minutes and for a day from 8 am to 5 pm with a one hour break,
three operators are needed with a fixed sequence of A, B, and C repeated (A-B-A-C-A-
32
B-A-C-A-B), altering only the volume based on demand for different products and
packaging formats. As opposed to Material Requirements Planning (MRP II), Kanban
and lean systems utilise extremely small lot sizes with the goal to schedule every
product, every day, in a sequence that intermixes all products. (Goddard, 1982). For
example, since volume is variable, one cycle would be: A-B-2A-C-2A-B-3A-C-4A-B,
producing in one cycle 10A, 3B, and 4C in 47.6 minutes. In this way, some constraints
can be removed. For example, since strong flavour products should be produced after
weak flavours, 2A would have the first A with weak flavour tea and the second A with
strong flavour. Or, it could have 2A with weak flavours and after C, another 2A with
strong flavour, depending on the daily demand and supply. If AlphaTea were only to
minimize changeovers, then a 100A-30B-40C cycle would require just three
changeovers. However, 100A cannot deal effectively with product flavourings and
herbal infusions; neither would supply be steady enough to safeguard 100A.The goal
of FSVV is not to eliminate the number of changeovers immediately ignoring the
demand and supply patterns. Instead, the new system reduces the number of
unnecessary changeovers gradually adopting operations and factory personnel to
organize and systematically path leaner states of operations. FSVV does not introduce
a perfect lean state but a much improved state compared to the previous system, with
less waste and better control over operations. With FSVV, AlphaTea seeks to cultivate
a culture of continuous improvement, which also paves the way to future leaner states
of operations when more stable supply and accurate demand forecasting will be
available (Goddard, 1982).
Develop a Pull Strategy to Control the Lean Operations
The next step, after detecting waste and finding an ideal, waste-less state of operations,
is to create a pull strategy so value is pulled from customers and not pushed from
33
operations to markets. This requires controlling the synchronisation of value stream
particularly with domestic demand and overseas factory as well as controlling the
quality and safety processes.
Figure 3 Ideal State of Internal Operations
Value Stream Synchronization
Monthly demand
A : 2000 units
B : 600 units
C : 800 units
Daily Requirement
A : 2000÷20 = 100 units
B : 600 ÷ 20 = 30 units
C : 800 ÷ 20 = 40 units
20 days in a month
8 hours shift, 480 minutes per day
Overall Takt time : 2.8 mn One Day Schedule
Operators needed : 3
8 am noon 5pm
Sequence to be repeated 10 times : A-B-A-C-A-B-A-C-A-B
A X 1 unit to be produced every 4.8 minutes
B x 1 unit to be produced every 16 minutes
C x 1 unit to be produced every 12 minutes
34
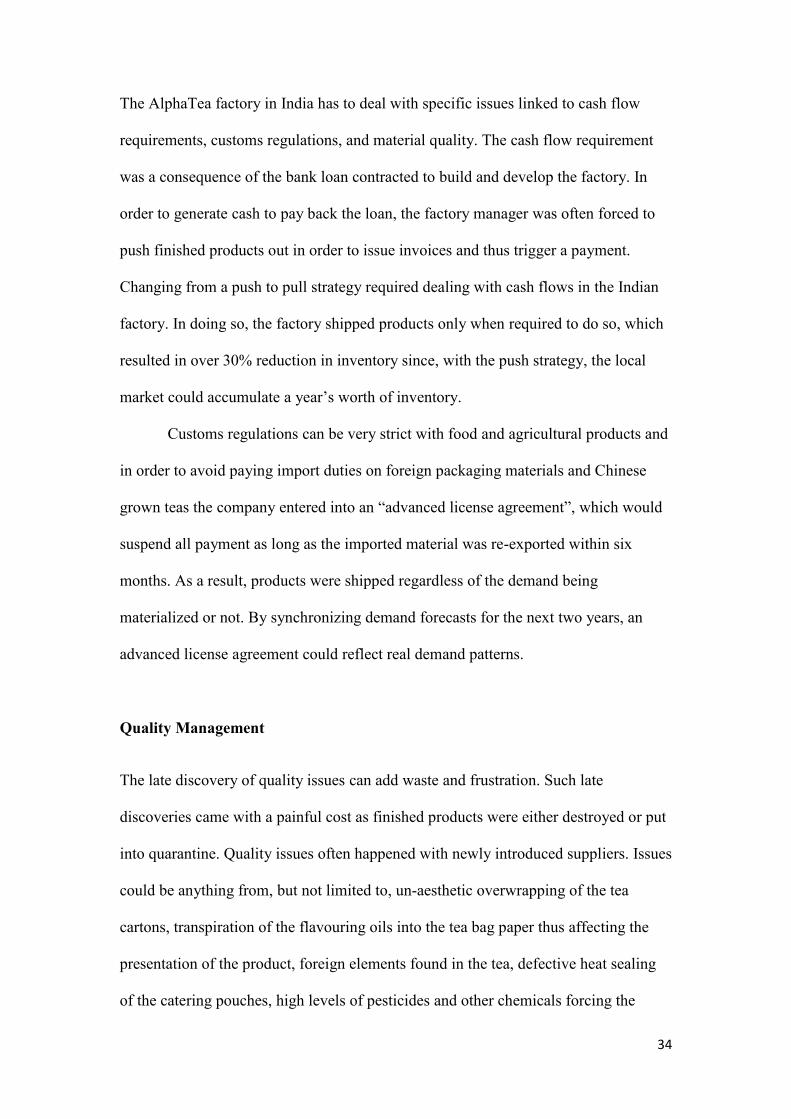
The AlphaTea factory in India has to deal with specific issues linked to cash flow
requirements, customs regulations, and material quality. The cash flow requirement
was a consequence of the bank loan contracted to build and develop the factory. In
order to generate cash to pay back the loan, the factory manager was often forced to
push finished products out in order to issue invoices and thus trigger a payment.
Changing from a push to pull strategy required dealing with cash flows in the Indian
factory. In doing so, the factory shipped products only when required to do so, which
resulted in over 30% reduction in inventory since, with the push strategy, the local
market could accumulate a year’s worth of inventory.
Customs regulations can be very strict with food and agricultural products and
in order to avoid paying import duties on foreign packaging materials and Chinese
grown teas the company entered into an “advanced license agreement”, which would
suspend all payment as long as the imported material was re-exported within six
months. As a result, products were shipped regardless of the demand being
materialized or not. By synchronizing demand forecasts for the next two years, an
advanced license agreement could reflect real demand patterns.
Quality Management
The late discovery of quality issues can add waste and frustration. Such late
discoveries came with a painful cost as finished products were either destroyed or put
into quarantine. Quality issues often happened with newly introduced suppliers. Issues
could be anything from, but not limited to, un-aesthetic overwrapping of the tea
cartons, transpiration of the flavouring oils into the tea bag paper thus affecting the
presentation of the product, foreign elements found in the tea, defective heat sealing
of the catering pouches, high levels of pesticides and other chemicals forcing the
35
destruction of an entire season’s worth of purchase, unexplained variations of the
tea’s taste compared to the pre-purchase samples. The development of strict criteria in
selecting new suppliers and developing existing ones resulted in less quality issues
and a smooth flow of value.
Continuous improvement is significant in lean thinking that seeks for
perfection. Therefore, a pull strategy, rather than being at the end of the lean process,
should trigger the search for perfection by re-defining value and challenging existing
processes until waste has been eliminated permanently.
Conclusions
The tea industry is a customer-centric business, which can improve customer
satisfaction by removing waste and defects from the products and services offered to
customers (Levy, 1997). Particularly, in countries like the UK where nine out of ten
people consume tea frequently, value needs to reflect consumer preferences. The
adage that “no two customers are the same” is based on the assumption that every
customer defines value in a unique way. Therefore, tea and food companies need tools
and techniques for managing individual value streams in an effective and efficient
way.
This study examined the adoption and implementation of lean tools in food supply
chains. Removing waste from the food industry has the potential for huge cost
savings, and increased value added. Despite the fact that 99% of the food companies
in the EU are SMEs, they generate only 45% of the value added. Lean tools have been
successfully adopted in manufacturing sectors, yet there is a high percentage of
failures and a lack of a lean paradigm of applying lean thinking in SMEs.
36
This study developed a lean action plan by adopting the Womach and Jones
(2005) action plan based on action research findings. The proposed lean action plan
contains three stages: (a) planning for lean; (b) interim lean diagnosis; and (c) lean
operations and control. Womack and Jones (2003, pp. 247–255) proposed a lean
action which includes the following steps: (1) find a lean change agent; (2) get the
knowledge; (3) find a lever by seizing a crisis or creating one; (4) forget grand
strategy for the moment; (5) map your value streams; (6) begin as soon as possible
with an important and visible activity; (7) demand immediate results; (8) as soon as
you have momentum, expand your scope. Therefore, the lean planning stage includes
the first four steps of Womack and Jones (2003) lean action plan (find a lean change
agent, get the knowledge, find a lever, and suspend grand strategy). However,
research findings indicate that SMEs after planning for lean need to include an interim
diagnosis stage in order to assess their situation before implementing lean tools.
Specifically, evidence on lean implementations have reported failures in managing the
lean process due to factors such as: lack of leadership to lean (Achanga et al., 2006;
Cudney and Elrod, 2011; Kubiak, 2011; Sarkar, 2011; Seddon and Caulkin, 2007),
resistance to change from middle managers and failure to cultivate a lean business
culture (Bamber and Dale, 2000; Carter et al., 2011; Chen and Meng, 2010; Emiliani,
2011), and lack of tools to customize the action plan to the specific needs of the
adopting company (Cox and Chicksand, 2005; Turesky and Connell, 2010; Kerber
and Dreckshage, 2011; Zokaei and Simons, 2006). AlphaTea attempted to follow the
action plan that Womack and Jones (2003) proposed. Therefore, during lean interim
diagnosis, companies need to address three barriers: (i) top management support; (ii)
knowledge and (iii) operational easiness. Then, companies can move on to the actual
implementation of lean operations and use specific tools and techniques to control
37
these operations. They are: (a) re-define value; (b) map process activities and value
streams; (c) detect waste across the value stream; (d) develop an ideal state of
production and supply chain operations; and (e) control lean operations.
Using reflective learning, the interim lean diagnosis is a learning experience
that increases the organizational lean knowledge and helps companies avoid failures
due to lack of top management support, lean knowledge, or operational easiness.
Previous studies also point out the need for organizational learning. For example,
Wan and Chen (2009) suggested lean assessment to increase lean knowledge. The
proposed lean action plan embeds organizational learning in a systematic way.
Organization learning takes place through a phased process of information
acquisition, information distribution, information interpretation and use, knowledge
transmission and storage (Hines et al., 2004). The lean action plan corresponds to the
phased process of organizational learning, since during planning for the lean phase,
companies acquire and distribute information about lean tools. Then, during interim
lean diagnosis companies interpret information based on their own experience and in
this way they acquire lean knowledge. Finally, during lean operations and the control
phase, they use the lean information and knowledge in order to improve business
operations and reduce waste. Another contribution of the proposed action plan is that
it increases organizational easiness and lean customization since companies adopt
lean tools and techniques more appropriate for their needs. Having acquired the
required knowledge, companies can customize the lean process and tools to the
specific type of waste they need to reduce and to the value proposition according to
their customers’ needs, which is another way to avoid lean project failures (Cox and
Chicksand, 2005). Finally, the design of the proposed action plan invites support from
top management and necessitates leadership throughout the duration of the lean
38
endeavour, including key stages such as interim lean diagnosis, selection of lean tools,
and control of lean operations. Thus, involving leadership and gaining top
management support reduces the possibility of failure in lean projects (Achanga et al.,
2006; Kerber and Dreckshage, 2011). Lean thinking is a set of principles,
philosophies, and business processes; thus a solitary application of a lean tool cannot
transform the business culture and make a company lean despite any temporal waste
savings (Tsasis and Bruce-Barrett, 2008). Womack and Jones (1996a) proposed a
five-steps model which assumes that there are five consecutive sets of actions from
value to perfection. Lean thinking is not an ideal state of a waste-free, perfect
organization, but rather a way to evolve from current operations and value
propositions to leaner states of business operations. The practical contribution of the
proposed lean action plan is that it directs companies to the right path using diagnosis
to learn and cultivate a lean culture towards perfection. Furthermore, the proposed
lean action plan is particularly helpful for SMEs that often lack the resources and
knowledge to implement lean tools. Lean thinking, being one of the most influential
new paradigms in manufacturing, still lacks a widely accepted action plan on how to
select and apply lean tools and techniques in order to reduce waste and increase value
for customers. A successful lean action plan can have a significant contribution to
small and medium food companies. Like the tea industry, concentration is high in
food sectors and the majority of companies are SMEs that strive to offer value for
money. Lean tools put value first and by eliminating waste reduce cost, a combination
that can offer a sustainable competitive advantage. Creating lean food supply chains
can have a significant impact on sustainability (Gustavsson et al., 2011). There is little
guidance on how lean can be applied to SMEs and the findings of this study shed light
39
on many aspects of the process: it offers a diagnosis and reflecting learning of a lean
action plan that can help companies to drive change in the right, lean direction.
The research contribution of this lean study is threefold. Firstly, it developed
and tested a lean action plan adapted to the capacity of small and medium companies.
Secondly, it applied lean thinking in the food sector, extending the research scope into
an area characterized with low productivity, low value added and high value waste
across the food supply chain. Further, it used an innovative methodology to study lean
thinking using an action case research to gather, analyse and interpret qualitative
evidence. Action research is suitable for examining the adoption and implementation
of lean tools in food supply chains since the lean change cannot ensue in an
experimental basis and studying lean as it occurs offers an unprecedented opportunity
to uncover and reflect a real case. This study took advantage of the reflecting learning
offered by the selected method to modify the lean action plan by adding the stage of
interim diagnosis of lean process as it happened. Interim diagnosis allows SMEs to
identify problematic areas and apply corrective measures into a customized action
plan. For example, AlphaTea used the activity process map to identify waste, yet
other companies may find it useful to apply other lean techniques such as quality filter
mapping, demand amplification mapping, decision point analysis, and physical
structure.
Limitations and Suggestions for Further Research
This study was based on scarce literature about lean applications in the food industry
(Bowen and Youngdahl, 1998). As a consequence, the findings and results from this
study are limited to its assumptions (Courville and Hausman, 1979). The preferred
method for researching ad-hoc situations is case research, in-depth interviewing, and
40
participant observation. However, one limitation of the case study approach is the
difficulty in drawing generalizations to every tea and food company. It was not
possible to collect data to examine value stream mapping techniques like production
funnel or quality filter; however, value stream mapping can also be useful for food
managers and further research is required.
One limitation of action research conducted in a business context derives from
the need to employ external experts such as academics or consultants. One advantage
of the proposed action lean plan is that companies can benefit from expert reflective
guidance and discussion during the interim lean diagnosis stage. This requires a clear
description of the roles and responsibilities of external actors and a willingness to
adapt timeframes and processes to suit the lean action plan. This assumption may not
be evidence in all business contexts, which could limit the usefulness of the lean
action plan approach with and without academic expertise. Future research could
compare lean techniques with other systems, such as the Kanban card system (Pegels,
1984) or other customized systems for tracking defaults and errors (Goddard, 1982).
References
Achanga, P., Shehab, E., Roy, R. and Nelder, G. 2006. “Critical success factors for lean
implementation within SMEs”, Journal of Manufacturing Technology Management,
17(4): 460–471.
Avison, D., Lau, F., Myers, M., and Nielsen, P.A., 1999. “Action research”,
Communication of the Association for Computing Machinery ACM, 42(1): 94–7.
Bamber, L. & Dale, B. 2000. “Lean production: A study of application in a traditional
manufacturing environment”, Production Planning & Control, 11(3): 291–298.
41
Bhasin, S., and Burcher, P., 2006. “Lean viewed as a philosophy”, Journal of
Manufacturing Technology Management, 17(1), 56-72.
Bio Intelligence Service, 2010. “Preparatory Study on Food Waste Across EU 27”.
European Commission – Directorate C – Industry, Paris, France.
Bortolotti, T., and Romano, P., 2012. “Lean first, then automate’: a framework for
process improvement in pure service companies. A case study”, Production Planning
& Control: The Management of Operations, 23 (7): 513-522.
Bowen, E.D. and Youngdahl, W.E., 1998. “Lean service: in defence of a production-
line approach”, International Journal of Service Industry Management, 9(3): 207–225.
Buzby, J. C. and Hyman, J. 2012. “Total and per capita value of food loss in the United
States”, Food Policy, 37: 561–570.
Carter, B., Danford, A., Howcroft, D., Richardson, H., Smith A., and Taylor, P. 2011.
“Lean and mean in the civil service: the case of processing in HMRC”, Public Money
& Management, 31(2): 115-122.
Chen, L. and Meng, B. 2010. “Why Most Chinese Enterprises Fail in Deploying Lean
Production”, Asian Social Science, 6(3): 52-57.
Cookson, D., Read, C., Mukherjee, C P., and Cooke, M., 2011. “Improving the quality
of Emergency Department care by removing waste using Lean Value Stream mapping”,
The International Journal of Clinical Leadership, 17(1): 25-30.
Cooney, R., 2002. “Is ‘lean’ a universal production system? Batch production in the
automotive industry”, International Journal of Operations & Production Management,
22 (10), 1130-1147.
Courville, L. and Hausman, W.H., 1979. “Warranty Scope and Reliability Under
Imperfect Information and Alternative Market Structures”, The Journal of Business,
52(3): 361-378.
42
Cox, A., and Chicksand, D., 2005. “The Limits of Lean Management Thinking:
Multiple Retailers and Food and Farming Supply Chains”, European Management
Journal, 23(6), 648-662.
Cuatrecasas L., 2004. “A lean management implementation method in service
operations”, International Journal of Services Technology and Management, 5(5-6):
532–544.
Cudney, E., and Elrod, C., 2011. “A comparative analysis of integrating lean concepts
into supply chain management in manufacturing and service industries”, International
Journal of Lean Six Sigma, 2(1), 5-22.
Easterby-Smith, M., Thorpe, R., and Lowe, A., 1991. “Management Research: an
Introduction”, Sage, London.
Easterby-Smith, M., Thorpe, R., and Jackson, P. 2012. “Management research”, Sage
Publications Ltd, London.
Emilliani, B. 2011. “Lean management failure at HMRC”, Management Services,
55(4): 13-15.
Eurostat, 2011. “Food: From farm to fork statistics”, Eurostat pocketbooks, Theme:
Agriculture and fisheries, Collection: Pocketbooks, Luxembourg: Publications Office
of the European Union.
Floyd, R. C. 2010. “Liquid lean: developing lean culture in the process industries”.
CRC Press.
Goddard, W. 1982. “Kanban versus MRP II-which is best for you”, Modern Materials
Handling, 37(11), 25-29.
Gustavsson, J., Cederberg, C., Sonesson, U., van Otterdijk, R., Meybeck, A. 2011.
“Global Food Losses and Food Waste: Extent Causes and Prevention”, Rome, Food
and Agriculture Organization (FAO) of the United Nations.
43
Hamel, J., Dufour, S., and Fortin, D., 1993. “Case study methods”, London, Sage
Publications.
Hasle, P. Bojesen, A., Jensen, P. L., Bramming, P., 2012. “Lean and the working
environment: a review of the literature”, International Journal of Operations &
Production Management, 32(7): 829–849.
Hines, P. and Rich, N., 1997. “The seven value stream mapping tools”, International
Journal of Operations & Production Management, 17(1): 46-64.
Hines, P., Holweg, M. and Rich, N., 2004. “Learning to evolve: A review of
contemporary lean thinking”, International Journal of Operations and Production
Management, 24(10): 994-1011.
Holter, I.M., and Schwartz-Barcott, D., 1993. “Action research: What is it? How has it
been used and how can it be used in nursing?” Journal of Advance Nursing, 123: 298–
304.
Howell, G. and Ballard, G., 1998. “Implementing Lean Construction: Understanding
and action”, Proceedings IGLC.
Kerber, B., and Dreckshage, B. J., 2011. “Lean supply chain management essentials: a
framework for materials managers”. CRC Press.
Kubiak, T M. 2011. “The Way to Fail”, Quality Progress, 44(12): 64-66.
Kumar, M., Antony, J., Singh, R.K., Tiwari, M.K. and Perry, D. 2006. “Implementing
the Lean Sigma framework in an Indian SME: a case study”, Production Planning &
Control: The Management of Operations, 17(4): 407-423.
Levy, D.L., 1997. “Lean production in an international supply chain”, Sloan
management review, 38, 94-102.
Liker, J.K., 2004. “The Toyota Way: 14 management principles from the world’s
greatest manufacturer”, New York, McGraw-Hill.
44
Lyons, A.C., Vidamour, K., Jain, R., and Sutherland, M., 2013. “Developing an
understanding of lean thinking in process industries”, Production Planning & Control:
The Management of Operations, 24 (6): 475-494.
Marshall, C., and Rossman, G. B., 2010. “Designing Qualitative Research”, Sage.
McCullough, M. 2011. “Lean manufacturing’s oversized claims”, Canadian Business,
84 (18), 131-132.
McIntyre, A., 2008. “Participatory action research”, Sage, Thousand Oaks, CA.
McManus, K. 2008. “So Long Six Sigma?”, Industrial Engineer: IE; 40(10), 18-18.
Mehra, B., Bishop, A.P., Bazzell, I., and Smith, C., 2002. “Scenarios in the Afya Project
as a Participatory Action Research (PAR) tool for studying information seeking and use
across the digital divide”, Journal of the American Society for Information Science and
Technology, 53(14): 1259–1266.
Morgan, D.L., and Morgan, R. K., 2008. “Single-Case Research Methods for the
Behavioral and Health Sciences”, Sage, London.
Pegels, C.C., 1984. “The Toyota Production System – Lessons for American
Management”, International Journal of Operations and Production Management, 4(1):
3-11.
Pullan, T.T., Bhasi, M., and Madhu, G., 2013. “Decision support tool for lean product
and process development”, Production Planning & Control: The Management of
Operations, 24(6): 449-464.
Radnor, Z. and Walley, P. 2008. “Learning to walk before we try to run: adapting lean
for the public sector”, Public Money & Management, 28(1): 13-20.
Reijula, J., 2012. “Lean hospitals: a new challenge for facility designers”, Intelligent
Buildings International, 4(2): 126-143.
45
Sarkar, D. 2011. “Eight deadly faux pas of continuous Improvement”, Performance
Improvement, 50(8): 5-8.
Seddon, J., Caulkin, S., 2007. “Systems thinking, lean production and action learning”,
Action Learning: Research & Practice, 4(1): 9-24.
Shah, R. and Ward, P.T. 2007. “Defining and developing measures of lean production”,
Journal of Operations Management, 25(4): 785-805.
Simon, R. W., and Canacari, E. G. 2012. “A practical guide to applying lean tools and
management principles to health care improvement projects”, AORN Journal, 95(1):
85-103.
Shingo, S. 1985. “A revolution in manufacturing: the SMED system”, Productivity
Press, Cambridge, MA.
Slomp, J., Bokhorst, J.A.C., and Germs, R., 2009. “A lean production control system
for high variety/low-volume environments: a case study implementation”, Production
Planning & Control: The Management of Operations, 20(7): 586-595.
Suárez-Barrazaa, M. F., Smith, T., and Dahlgaard-Park, S. M. 2012. “Lean Service: A
literature analysis and classification”, Total Quality Management And Business
Excellence, 23(3-4): 359-380.
The Manufacturer, 2011. The Lean Report 2011, The Manufacturer Magazine, found
online http://issuu.com/themanufacturer/docs/leanreport2011/1, accessed: 11
December 2014.
Tsasis, P. and Bruce-Barrett, C., 2008. “Organisational change through Lean
Thinking”, Health Services Management Research, 21, No (3): 192-198.
Turesky, E. F. and Connell, P. 2010. “Off the rails: understanding the derailment of a
lean manufacturing initiative”, Organization Management Journal, 7(2): 110-132.
46
Vlachos, I., and Bogdanovic, A., 2013. “Lean Thinking in the European Hotel
Industry”, Tourism Management, 36: 354-363.
Wan, H.D., and Chen, F.F., 2009. “Decision support for lean practitioners: A web-based
adaptive assessment approach”, Computers in Industry, 60(4): 277–283.
Womack, J. and Jones, D., 1996a. “Beyond Toyota: How to Root Out Waste and Pursue
Perfection”, Harvard Business Review, (Sept./Oct): 4-16.
Womack, J. and Jones, D., 1996b. “Lean Thinking: Banish Waste and Create Wealth
in Your Corporation”, 2nd Ed., New York, Free Press, Simon & Schuster Inc.
Womack, J. and Jones, D., 2003. “Lean Thinking”, New York: Free Press.
Womack, J. P., 2004. “An action plan for Lean Services”, Lean Service Summit Europe
2004, Amsterdam.
Womack, J. P., Jones, D. T., and Roos, D. 1991. “The machine that changed the world:
The story of lean production”. 1st Harper Perennial Ed. New York.
Womack, J.P. and Jones, D.T., 2005. “Lean consumption”, Harvard Business Review,
March: 1-12.
Wood, N. 2004. “Lean Thinking: What It Is And What It Isn’t”, Management Services,
48(2): 8-11.
Yamnill, S., and McLean, G. N., 2010. “Knowledge management in a community
setting using action research: a case study of Lumpaya community, Nakorn Pathom
Province, Thailand”, Human Resource Development International, 13(5): 541–556.
Yin, R. K., 1994. “Case study research: Design and methods”, 2nd ed., London: Sage
Publications.
Young, T.P., and McClean, S.I., 2008. “A critical look at lean thinking in healthcare”,
Quality & Safety in Health Care, 17(5): 382-386.
47
Zokaei, K. A., and Simons, D. W., 2006. Value chain analysis in consumer focus
improvement: A case study of the UK red meat industry, The International Journal of
Logistics Management, 17(2), 141-162.
Zuber-Skerrit, O., 1995. “Models for action research”, In Moving on: Creative
applications of action learning and action research, ed. S. Pinchen and R. Passfield,
3–29. Brisbane, Australia: Action Learning Action Research, and Process Management
Association (ALARPM).