Embed Size (px)
Citation preview
Company FundamentalsCompany Fundamentals\Company Profile
COMPANY PROFILE Figures in U.S. Dollars
A Wright Investors' Service Research Report:
Apple Inc.
440 Wheelers Farms Road Milford, CT 06461 U.S.A.
Wright Quality Rating:AAA20
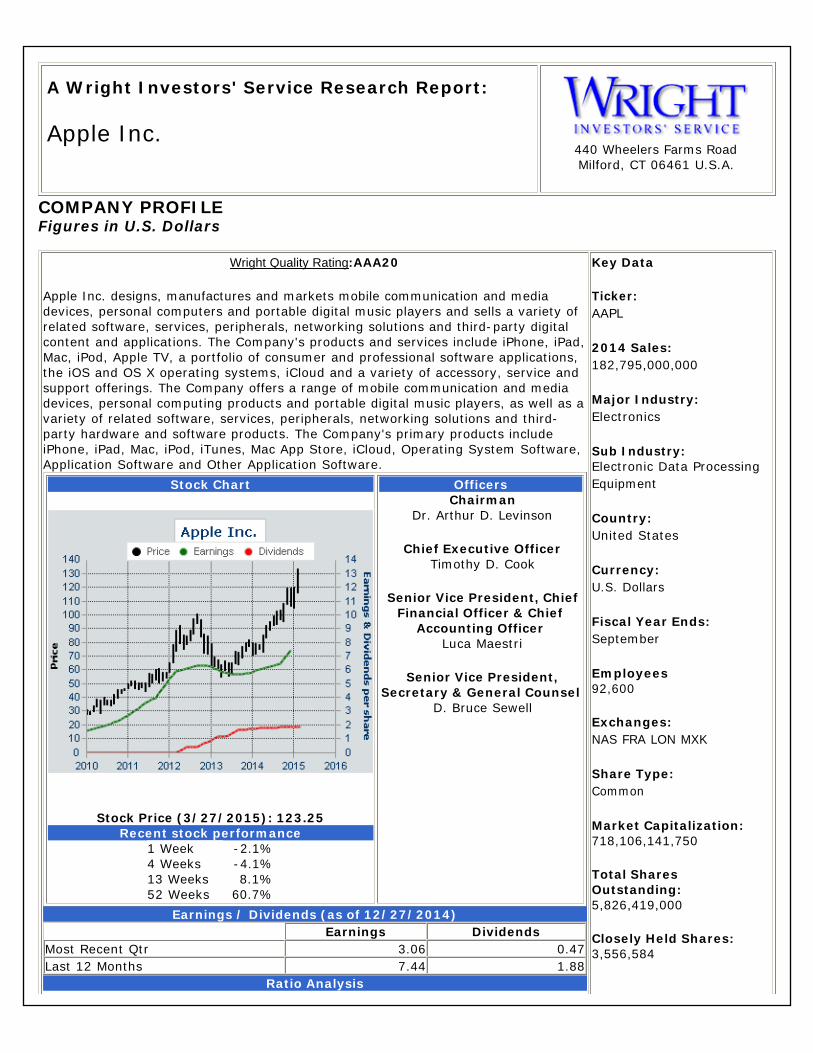
Apple Inc. designs, manufactures and markets mobile communication and media devices, personal computers and portable digital music players and sells a variety of related software, services, peripherals, networking solutions and third-party digital content and applications. The Company's products and services include iPhone, iPad, Mac, iPod, Apple TV, a portfolio of consumer and professional software applications, the iOS and OS X operating systems, iCloud and a variety of accessory, service and support offerings. The Company offers a range of mobile communication and media devices, personal computing products and portable digital music players, as well as a variety of related software, services, peripherals, networking solutions and third-party hardware and software products. The Company's primary products include iPhone, iPad, Mac, iPod, iTunes, Mac App Store, iCloud, Operating System Software, Application Software and Other Application Software.
Stock Price (3/27/2015): 123.25
Stock Chart
Recent stock performance1 Week -2.1%4 Weeks -4.1%13 Weeks 8.1%52 Weeks 60.7%
Chairman Dr. Arthur D. Levinson
Chief Executive Officer Timothy D. Cook
Senior Vice President, Chief Financial Officer & Chief
Accounting Officer Luca Maestri
Senior Vice President, Secretary & General Counsel
D. Bruce Sewell
Officers
Earnings / Dividends (as of 12/27/2014) Earnings Dividends
Most Recent Qtr 3.06 0.47 Last 12 Months 7.44 1.88
Ratio Analysis
Key Data
Ticker: AAPL
2014 Sales: 182,795,000,000
Major Industry: Electronics
Sub Industry: Electronic Data Processing Equipment
Country: United States
Currency: U.S. Dollars
Fiscal Year Ends: September
Employees 92,600
Exchanges: NAS FRA LON MXK
Share Type: Common
Market Capitalization: 718,106,141,750
Total Shares Outstanding: 5,826,419,000
Closely Held Shares: 3,556,584
Price / Earnings Ratio 16.57 Dividend Yield 1.53%
Price / Sales Ratio 3.93 Payout Ratio 25.27%
Price / Book Ratio 5.82 % Held by Insiders 0.06%
Address1 Infinite Loop Cupertino, CALIFORNIA 95014-2083 UNITED STATES
Phone +1 408 996-1010 Home Page http://www.apple.com
Company Fundamentals\Comparative Business Analysis
Comparative Business Analysis: Apple Inc. Report Date: March 29, 2015
Company Description
Apple Inc. designs, manufactures and markets mobile communication and media devices, personal computers and portable digital music players and sells a variety of related software, services, peripherals, networking solutions and third-party digital content and applications. The Company's products and services include iPhone, iPad, Mac, iPod, Apple TV, a portfolio of consumer and professional software applications, the iOS and OS X operating systems, iCloud and a variety of accessory, service and support offerings. The Company offers a range of mobile communication and media devices, personal computing products and portable digital music players, as well as a variety of related software, services, peripherals, networking solutions and third-party hardware and software products. The Company's primary products include iPhone, iPad, Mac, iPod, iTunes, Mac App Store, iCloud, Operating System Software, Application Software and Other Application Software.
Competitor Analysis
Apple Inc. operates in the Electronic computers sector. This analysis compares Apple Inc. with three other companies: Hewlett-Packard Company (2014 sales of $111.45 billion of which 30% was Personal Systems Group), Hitachi Limited of Japan (9.62 trillion Japanese Yen [US$80.30 billion] of which 18% was Information And Communication Systems Bu), and Lenovo Group Limited which is based in Hong Kong (300.26 billion Hong Kong Dollars [US$38.71 billion] of which 51% was Note Book).
Sales Analysis
During the fourth calendar quarter of 2014, sales at Apple Inc. totalled $74.60 billion. This is an increase of 29.5% from the $57.59 billion in sales at the company during the fourth quarter of 2013. During the previous 32 quarters, sales at Apple Inc. have increased compared with the same quarter in the previous year. There appears to be at least some degree of seasonality in the sales at Apple Inc.: during 8 of the previous 9 calendar years, sales were highest during the fourth quarter. The exception to this was during 2009, when the third quarter was the best quarter, accounting for 34% of sales (during that same year, the fourth quarter accounted for 32% of sales). Apple Inc. reported sales of $182.80 billion for the fiscal year ending September of 2014. This represents an increase of 7.0% versus 2013, when the company's sales were $170.91 billion. Sales at Apple Inc. have increased during each of the previous five years (and since 2009, sales have increased a total of 329%). Sales of Operating Segment - Greater China saw an increase that was more than double the company's growth rate: sales were up 17.4% in 2014, from $25.42 billion to $29.85 billion. Apple Inc. also saw significant increases in sales in Operating Segment - Japan (up 11.3% to $14.98 billion) . Not all segments of Apple Inc. experienced an increase in sales in 2014: sales of Operating Segment - Asia Pacific fell 7.5% to $10.34 billion.
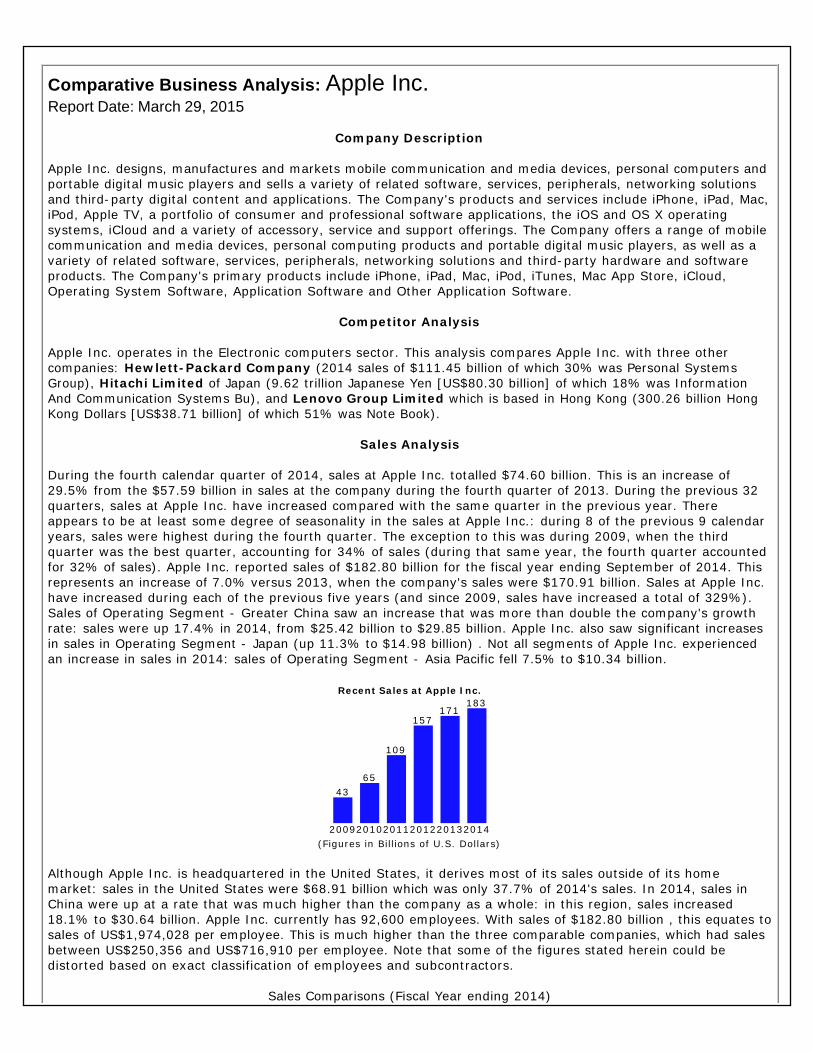
Recent Sales at Apple Inc.
(Figures in Billions of U.S. Dollars) Although Apple Inc. is headquartered in the United States, it derives most of its sales outside of its home market: sales in the United States were $68.91 billion which was only 37.7% of 2014's sales. In 2014, sales in China were up at a rate that was much higher than the company as a whole: in this region, sales increased 18.1% to $30.64 billion. Apple Inc. currently has 92,600 employees. With sales of $182.80 billion , this equates to sales of US$1,974,028 per employee. This is much higher than the three comparable companies, which had sales between US$250,356 and US$716,910 per employee. Note that some of the figures stated herein could be distorted based on exact classification of employees and subcontractors.
Sales Comparisons (Fiscal Year ending 2014)
43
65
109
157
171
183
2009 2010 2011 2012 2013 2014
Recent Stock Performance
During each of the previous 6 calendar years, this stock has increased in value (at the end of December 2008, the stock was at $12.19). For the 52 weeks ending 3/27/2015, the stock of this company was up 60.7% to $123.25. During the past 13 weeks, the stock has increased 8.1%. During the past 52 weeks, the stock of Apple Inc. has outperformed (by a large margin) the three comparable companies, which saw changes between -1.7% and 30.0%. During the 12 months ending 12/27/2014, earnings per share totalled $7.44 per share. Thus, the Price / Earnings ratio is 16.57. Earnings per share rose 28.1% in 2014 from 2013. This company is currently trading at 3.93 times sales. This is at a higher ratio than all three comparable companies, which are trading between 0.41 and 0.51 times sales. Apple Inc. is trading at 5.82 times book value. The company's price to book ratio is higher than that of all three comparable companies, which are trading between 1.48 and 4.36 times book value.
Summary of company valuations (as of 3/27/2015).
The market capitalization of this company is $718.11 billion . Management, directors, and other insiders own less than 2% of the outstanding stock. The capitalization of the floating stock (i.e., that which is not closely held) is $717.67 billion .
Dividend Analysis
During the 12 months ending 12/27/2014, Apple Inc. paid dividends totalling $1.88 per share. Since the stock is currently trading at $123.25, this implies a dividend yield of 1.5%. During the quarter ended 12/27/2014, the company paid dividends of $0.47 per share. The company has paid a dividend for 3 straight years. During the same 12 month period ended 12/27/2014, the Company reported earnings of $7.44 per share. Thus, the company paid 25.3% of its profits as dividends.
Profitability Analysis On the $182.80 billion in sales reported by the company in 2014, the cost of goods sold totalled $104.26 billion, or 57.0% of sales (i.e., the gross profit was 43.0% of sales). This gross profit margin is better than the company achieved in 2013, when cost of goods sold totalled 58.4% of sales. Apple Inc.'s 2014 gross profit margin of 43.0% was better than all three comparable companies (which had gross profits in 2014 between 13.9% and 31.1% of sales). The company's earnings before interest, taxes, depreciation and amorization (EBITDA) were $60.50 billion, or 33.1% of sales. This EBITDA to sales ratio is roughly on par with what the company achieved in 2013, when the EBITDA ratio was 32.6% of sales. The three comparable companies had EBITDA margins that were all less (between 3.5% and 11.8%) than that achieved by Apple Inc.. In 2014, earnings before extraordinary items at Apple Inc. were $39.51 billion, or 21.6% of sales. This profit margin is lower than the level the company achieved in 2013, when the profit margin was 21.7% of sales. The company's return on equity in 2014 was 32.0%. This was an improvement over the already high 31.3% return the company achieved in 2013. (Extraordinary items have been excluded).
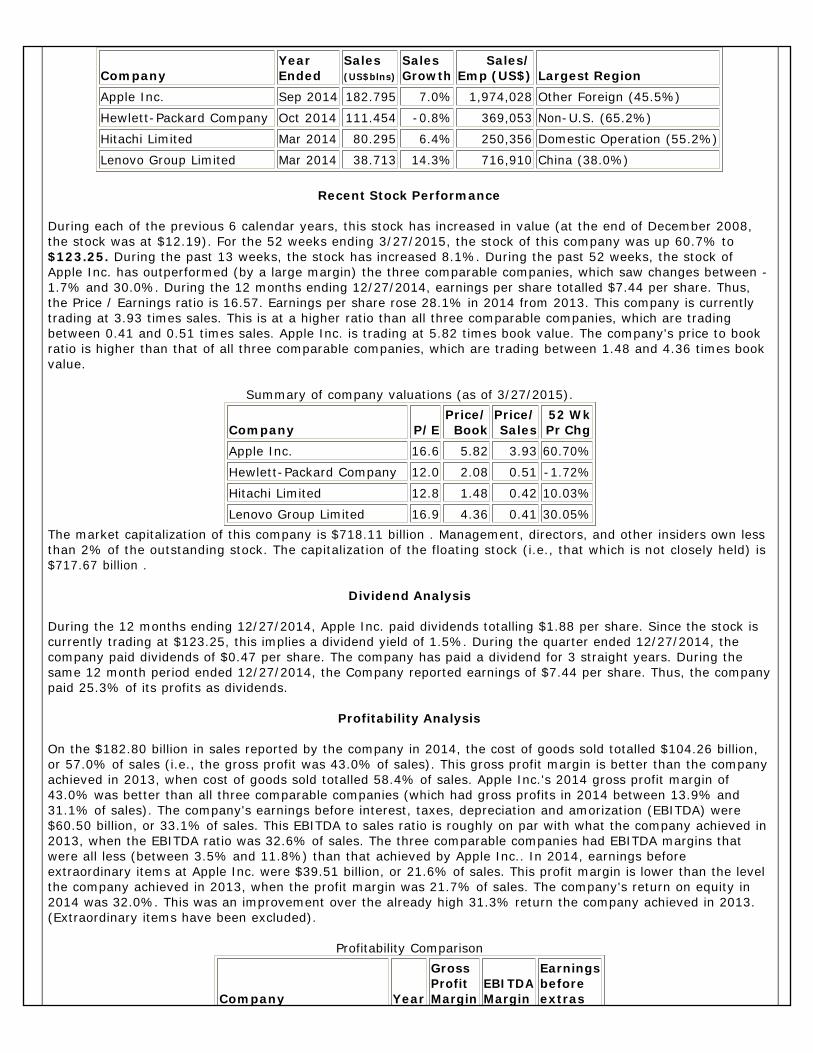
Profitability Comparison
CompanyYear Ended
Sales (US$blns)
Sales Growth
Sales/ Emp (US$) Largest Region
Apple Inc. Sep 2014 182.795 7.0% 1,974,028 Other Foreign (45.5%)
Hewlett-Packard Company Oct 2014 111.454 -0.8% 369,053 Non-U.S. (65.2%)
Hitachi Limited Mar 2014 80.295 6.4% 250,356 Domestic Operation (55.2%)
Lenovo Group Limited Mar 2014 38.713 14.3% 716,910 China (38.0%)
Company P/EPrice/
BookPrice/ Sales
52 Wk Pr Chg
Apple Inc. 16.6 5.82 3.93 60.70%
Hewlett-Packard Company 12.0 2.08 0.51 -1.72%
Hitachi Limited 12.8 1.48 0.42 10.03%
Lenovo Group Limited 16.9 4.36 0.41 30.05%
Company Year
Gross Profit Margin
EBITDA Margin
Earnings before extras
During the fourth quarter of 2014, Apple Inc. reported earnings per share of $3.06. This is an increase of 47% versus the fourth quarter of 2013, when the company reported earnings of $2.08 per share. Apple Inc. reports profits by product line. During 2014, the itemized operating profits at all divisions were $52.50 billion, which is equal to 28.7% of total sales. Of all the product lines, Operating Segment - Japan had the highest operating profits in 2014, with operating profits equal to 47.9% of sales. (However, Operating Segment - Japan only accounts for 8% of total sales at Apple Inc.). This was also the case in the previous year: in 2013, Operating Segment - Japan had the highest operating profits as well. Operating Segment - Retail had the lowest operating profit margin in 2014, with the operating profit equal to only 21.3% of sales. In 2013, Operating Segment - Retail also was the product line with the lowest operating profit margin.
Inventory Analysis
As of September 2014, the value of the company's inventory totalled $2.11 billion. Since the cost of goods sold was $104.26 billion for the year, the company had 7 days of inventory on hand (another way to look at this is to say that the company turned over its inventory 49.4 times per year). This is an almost insignificant increase in days in inventory from September 2013, when the company had $1.76 billion, which was 6 days of sales in inventory. The 7 days in inventory is lower than the three comparable companies, which had inventories between 29 and 77 days at the end of 2014.
Research and Development
Research and Development Expenses at Apple Inc. in 2014 were $6.04 billion, which is equivalent to 3.3% of sales. In 2014 R&D expenditures increased both as a percentage of sales and in actual amounts: In 2013, Apple Inc. spent $4.48 billion on R&D, which was 2.6% of sales. This company's R&D expenditures were fairly close to all three competitors, which spent between 1.9% and 3.7% of their sales on R&D. During each of the previous 5 years, the company has increased the amount of money it has spent on Research and Development (in 2009, Apple Inc. spent $1.33 billion versus $6.04 billion in 2014).
Financial Position
As of September 2014, the company's long term debt was $28.99 billion and total liabilities (i.e., all monies owed) were $120.29 billion. The long term debt to equity ratio of the company is 0.26. As of September 2014, the accounts receivable for the company were $27.22 billion, which is equivalent to 54 days of sales. This is slightly higher than at the end of 2013, when Apple Inc. had 44 days of sales in accounts receivable.
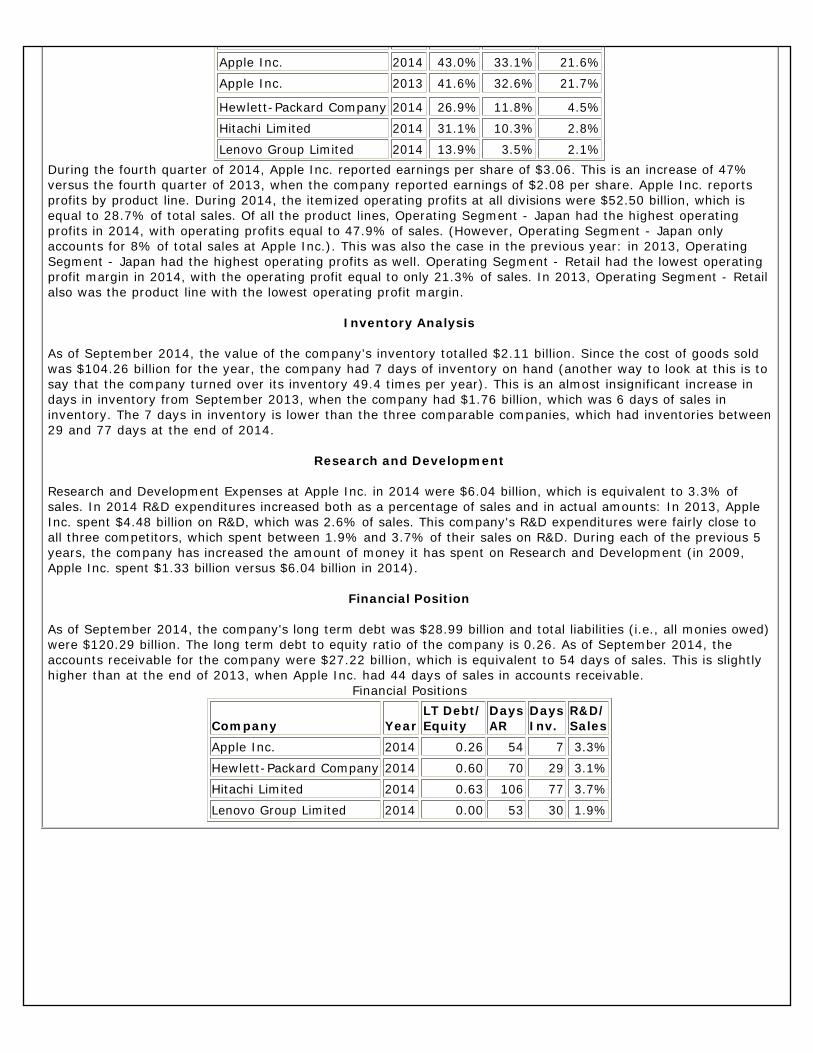
Financial Positions
Apple Inc. 2014 43.0% 33.1% 21.6%
Apple Inc. 2013 41.6% 32.6% 21.7%
Hewlett-Packard Company 2014 26.9% 11.8% 4.5%
Hitachi Limited 2014 31.1% 10.3% 2.8%
Lenovo Group Limited 2014 13.9% 3.5% 2.1%
Company YearLT Debt/ Equity
Days AR
Days Inv.
R&D/ Sales
Apple Inc. 2014 0.26 54 7 3.3%
Hewlett-Packard Company 2014 0.60 70 29 3.1%
Hitachi Limited 2014 0.63 106 77 3.7%
Lenovo Group Limited 2014 0.00 53 30 1.9%
Company Fundamentals\Summary Analysis
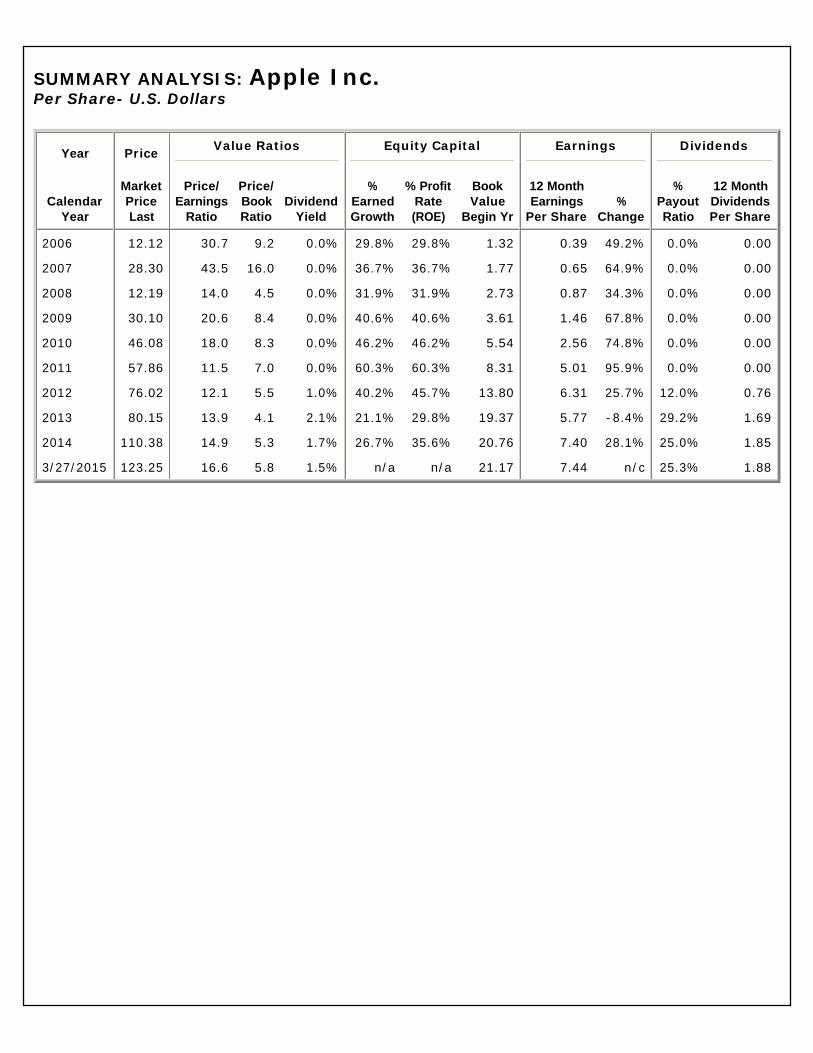
SUMMARY ANALYSIS: Apple Inc. Per Share- U.S. Dollars
Year PriceValue Ratios Equity Capital Earnings Dividends
Calendar
Year
Market Price Last
Price/ Earnings
Ratio
Price/ Book Ratio
Dividend Yield
% Earned Growth
% Profit Rate (ROE)
Book Value
Begin Yr
12 Month Earnings
Per Share%
Change
% Payout Ratio
12 Month Dividends Per Share
2006 12.12 30.7 9.2 0.0% 29.8% 29.8% 1.32 0.39 49.2% 0.0% 0.00
2007 28.30 43.5 16.0 0.0% 36.7% 36.7% 1.77 0.65 64.9% 0.0% 0.00
2008 12.19 14.0 4.5 0.0% 31.9% 31.9% 2.73 0.87 34.3% 0.0% 0.00
2009 30.10 20.6 8.4 0.0% 40.6% 40.6% 3.61 1.46 67.8% 0.0% 0.00
2010 46.08 18.0 8.3 0.0% 46.2% 46.2% 5.54 2.56 74.8% 0.0% 0.00
2011 57.86 11.5 7.0 0.0% 60.3% 60.3% 8.31 5.01 95.9% 0.0% 0.00
2012 76.02 12.1 5.5 1.0% 40.2% 45.7% 13.80 6.31 25.7% 12.0% 0.76
2013 80.15 13.9 4.1 2.1% 21.1% 29.8% 19.37 5.77 -8.4% 29.2% 1.69
2014 110.38 14.9 5.3 1.7% 26.7% 35.6% 20.76 7.40 28.1% 25.0% 1.85
3/27/2015 123.25 16.6 5.8 1.5% n/a n/a 21.17 7.44 n/c 25.3% 1.88
Company Fundamentals\Sales Analysis
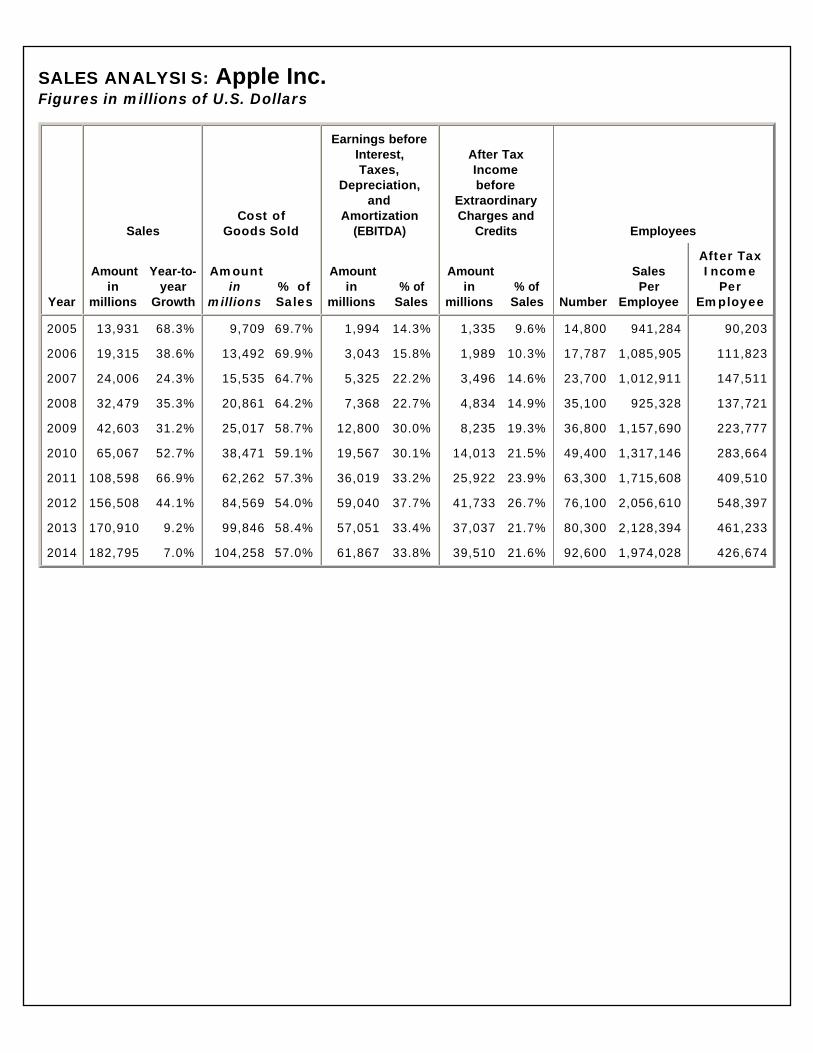
SALES ANALYSIS: Apple Inc. Figures in millions of U.S. Dollars
Year
SalesCost of
Goods Sold
Earnings before Interest, Taxes,
Depreciation, and
Amortization (EBITDA)
After Tax Income before
Extraordinary Charges and
Credits Employees
Amount in
millions
Year-to-year
Growth
Amount in
millions% of Sales
Amount in
millions% of
Sales
Amount in
millions% of
Sales Number
Sales Per
Employee
After Tax Income
Per Employee
2005 13,931 68.3% 9,709 69.7% 1,994 14.3% 1,335 9.6% 14,800 941,284 90,203
2006 19,315 38.6% 13,492 69.9% 3,043 15.8% 1,989 10.3% 17,787 1,085,905 111,823
2007 24,006 24.3% 15,535 64.7% 5,325 22.2% 3,496 14.6% 23,700 1,012,911 147,511
2008 32,479 35.3% 20,861 64.2% 7,368 22.7% 4,834 14.9% 35,100 925,328 137,721
2009 42,603 31.2% 25,017 58.7% 12,800 30.0% 8,235 19.3% 36,800 1,157,690 223,777
2010 65,067 52.7% 38,471 59.1% 19,567 30.1% 14,013 21.5% 49,400 1,317,146 283,664
2011 108,598 66.9% 62,262 57.3% 36,019 33.2% 25,922 23.9% 63,300 1,715,608 409,510
2012 156,508 44.1% 84,569 54.0% 59,040 37.7% 41,733 26.7% 76,100 2,056,610 548,397
2013 170,910 9.2% 99,846 58.4% 57,051 33.4% 37,037 21.7% 80,300 2,128,394 461,233
2014 182,795 7.0% 104,258 57.0% 61,867 33.8% 39,510 21.6% 92,600 1,974,028 426,674
Company Fundamentals\Price Analysis
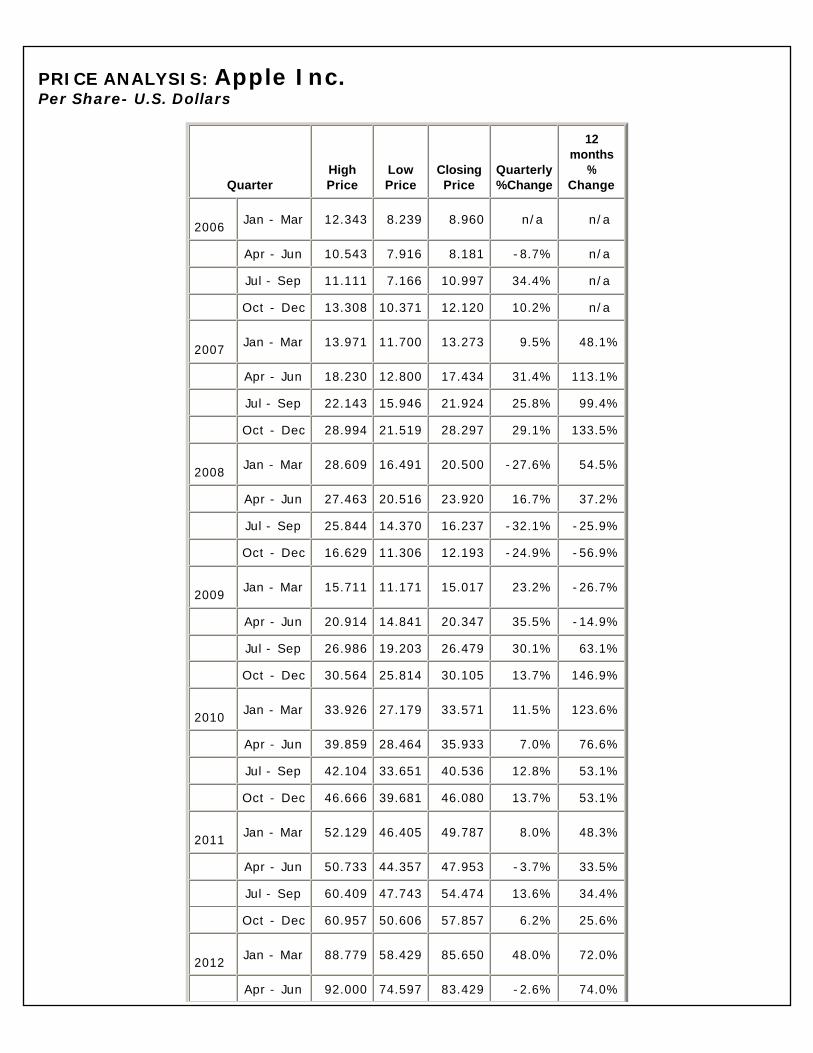
PRICE ANALYSIS: Apple Inc.
Per Share- U.S. Dollars
QuarterHigh Price
Low Price
Closing Price
Quarterly %Change
12 months
%Change
2006
Jan - Mar 12.343 8.239 8.960 n/a n/a
Apr - Jun 10.543 7.916 8.181 -8.7% n/a
Jul - Sep 11.111 7.166 10.997 34.4% n/a
Oct - Dec 13.308 10.371 12.120 10.2% n/a
2007
Jan - Mar 13.971 11.700 13.273 9.5% 48.1%
Apr - Jun 18.230 12.800 17.434 31.4% 113.1%
Jul - Sep 22.143 15.946 21.924 25.8% 99.4%
Oct - Dec 28.994 21.519 28.297 29.1% 133.5%
2008
Jan - Mar 28.609 16.491 20.500 -27.6% 54.5%
Apr - Jun 27.463 20.516 23.920 16.7% 37.2%
Jul - Sep 25.844 14.370 16.237 -32.1% -25.9%
Oct - Dec 16.629 11.306 12.193 -24.9% -56.9%
2009
Jan - Mar 15.711 11.171 15.017 23.2% -26.7%
Apr - Jun 20.914 14.841 20.347 35.5% -14.9%
Jul - Sep 26.986 19.203 26.479 30.1% 63.1%
Oct - Dec 30.564 25.814 30.105 13.7% 146.9%
2010
Jan - Mar 33.926 27.179 33.571 11.5% 123.6%
Apr - Jun 39.859 28.464 35.933 7.0% 76.6%
Jul - Sep 42.104 33.651 40.536 12.8% 53.1%
Oct - Dec 46.666 39.681 46.080 13.7% 53.1%
2011
Jan - Mar 52.129 46.405 49.787 8.0% 48.3%
Apr - Jun 50.733 44.357 47.953 -3.7% 33.5%
Jul - Sep 60.409 47.743 54.474 13.6% 34.4%
Oct - Dec 60.957 50.606 57.857 6.2% 25.6%
2012
Jan - Mar 88.779 58.429 85.650 48.0% 72.0%
Apr - Jun 92.000 74.597 83.429 -2.6% 74.0%
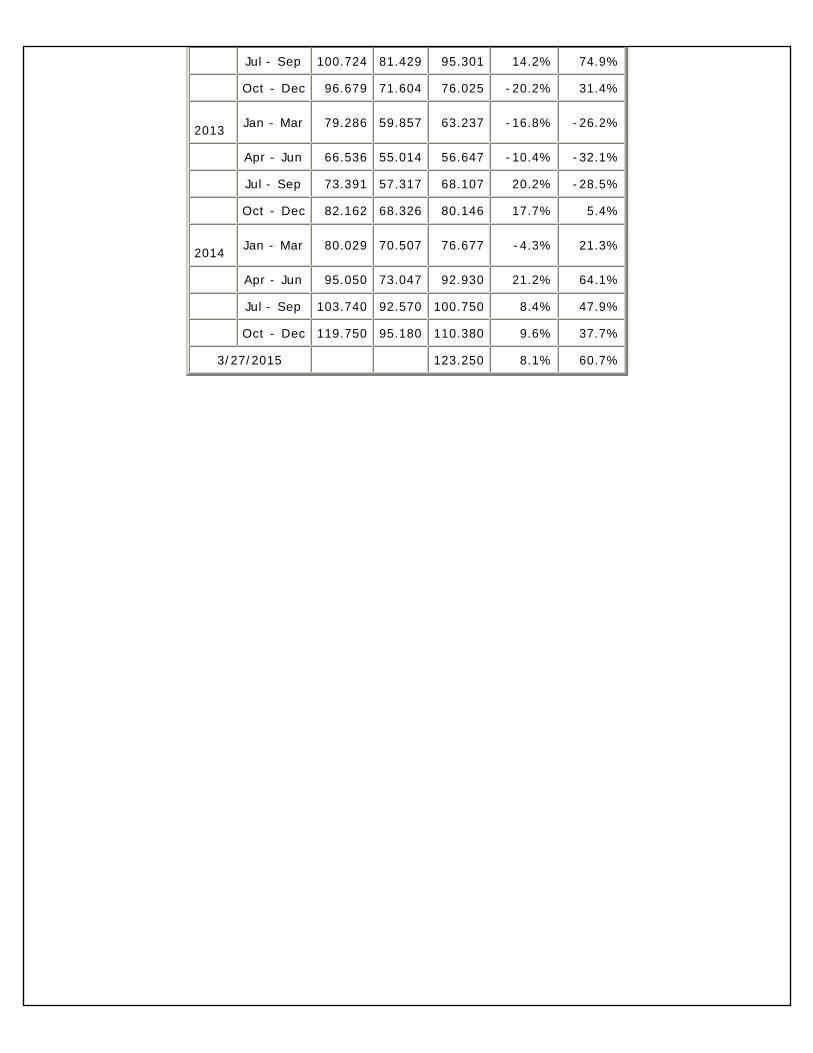
Jul - Sep 100.724 81.429 95.301 14.2% 74.9%
Oct - Dec 96.679 71.604 76.025 -20.2% 31.4%
2013
Jan - Mar 79.286 59.857 63.237 -16.8% -26.2%
Apr - Jun 66.536 55.014 56.647 -10.4% -32.1%
Jul - Sep 73.391 57.317 68.107 20.2% -28.5%
Oct - Dec 82.162 68.326 80.146 17.7% 5.4%
2014
Jan - Mar 80.029 70.507 76.677 -4.3% 21.3%
Apr - Jun 95.050 73.047 92.930 21.2% 64.1%
Jul - Sep 103.740 92.570 100.750 8.4% 47.9%
Oct - Dec 119.750 95.180 110.380 9.6% 37.7%
3/27/2015 123.250 8.1% 60.7%
Company Fundamentals\Earnings & Dividends Analysis
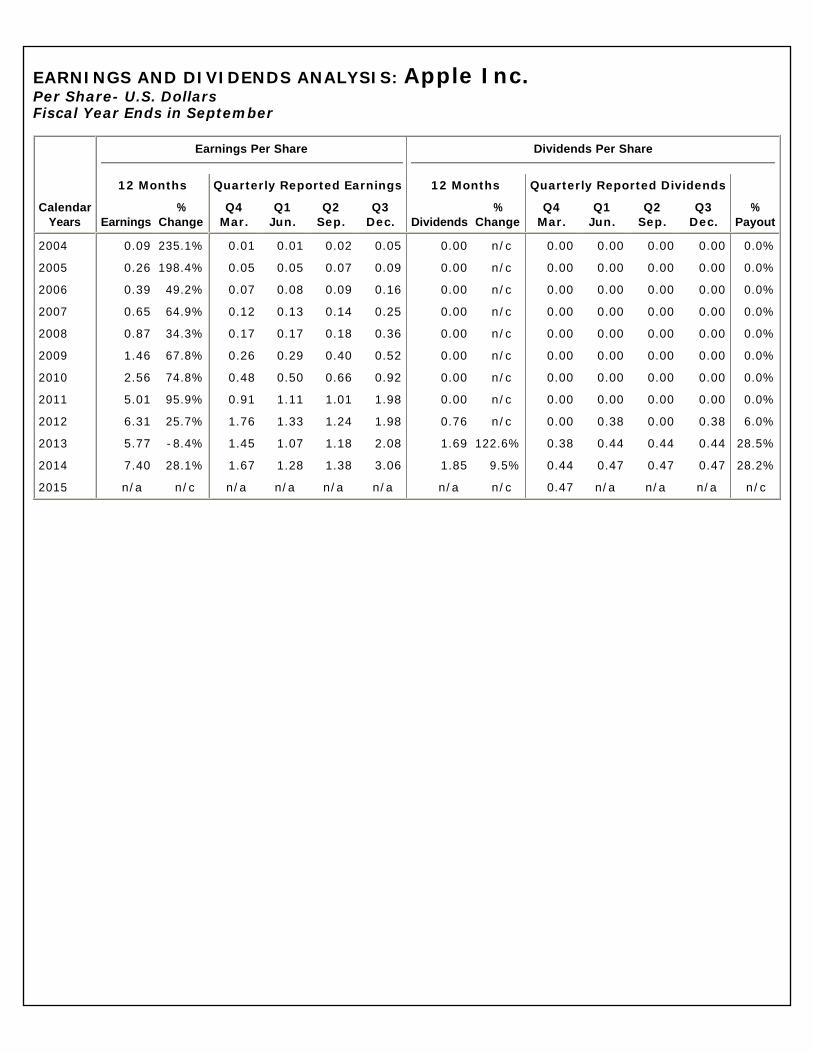
EARNINGS AND DIVIDENDS ANALYSIS: Apple Inc.
Per Share- U.S. Dollars Fiscal Year Ends in September
Calendar Years
Earnings Per Share Dividends Per Share
12 Months Quarterly Reported Earnings 12 Months Quarterly Reported Dividends
Earnings%
ChangeQ4
Mar.Q1
Jun.Q2
Sep.Q3
Dec. Dividends%
ChangeQ4
Mar.Q1
Jun.Q2
Sep.Q3
Dec.%
Payout
2004 0.09 235.1% 0.01 0.01 0.02 0.05 0.00 n/c 0.00 0.00 0.00 0.00 0.0%
2005 0.26 198.4% 0.05 0.05 0.07 0.09 0.00 n/c 0.00 0.00 0.00 0.00 0.0%
2006 0.39 49.2% 0.07 0.08 0.09 0.16 0.00 n/c 0.00 0.00 0.00 0.00 0.0%
2007 0.65 64.9% 0.12 0.13 0.14 0.25 0.00 n/c 0.00 0.00 0.00 0.00 0.0%
2008 0.87 34.3% 0.17 0.17 0.18 0.36 0.00 n/c 0.00 0.00 0.00 0.00 0.0%
2009 1.46 67.8% 0.26 0.29 0.40 0.52 0.00 n/c 0.00 0.00 0.00 0.00 0.0%
2010 2.56 74.8% 0.48 0.50 0.66 0.92 0.00 n/c 0.00 0.00 0.00 0.00 0.0%
2011 5.01 95.9% 0.91 1.11 1.01 1.98 0.00 n/c 0.00 0.00 0.00 0.00 0.0%
2012 6.31 25.7% 1.76 1.33 1.24 1.98 0.76 n/c 0.00 0.38 0.00 0.38 6.0%
2013 5.77 -8.4% 1.45 1.07 1.18 2.08 1.69 122.6% 0.38 0.44 0.44 0.44 28.5%
2014 7.40 28.1% 1.67 1.28 1.38 3.06 1.85 9.5% 0.44 0.47 0.47 0.47 28.2%
2015 n/a n/c n/a n/a n/a n/a n/a n/c 0.47 n/a n/a n/a n/c
Financial Statement AnalysesFinancial Statement Analyses\Balance Sheet - Common Size
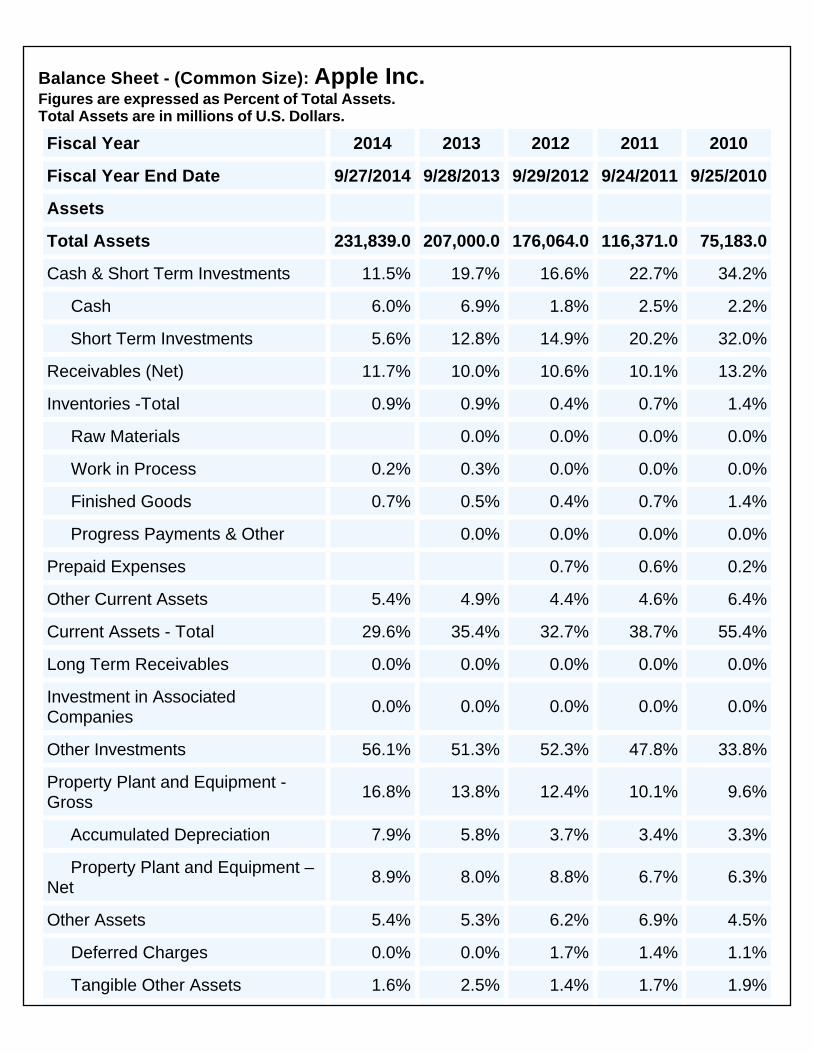
Balance Sheet - (Common Size): Apple Inc. Figures are expressed as Percent of Total Assets. Total Assets are in millions of U.S. Dollars.
Fiscal Year 2014 2013 2012 2011 2010
Fiscal Year End Date 9/27/2014 9/28/2013 9/29/2012 9/24/2011 9/25/2010
Assets
Total Assets 231,839.0 207,000.0 176,064.0 116,371.0 75,183.0
Cash & Short Term Investments 11.5% 19.7% 16.6% 22.7% 34.2%
Cash 6.0% 6.9% 1.8% 2.5% 2.2%
Short Term Investments 5.6% 12.8% 14.9% 20.2% 32.0%
Receivables (Net) 11.7% 10.0% 10.6% 10.1% 13.2%
Inventories -Total 0.9% 0.9% 0.4% 0.7% 1.4%
Raw Materials 0.0% 0.0% 0.0% 0.0%
Work in Process 0.2% 0.3% 0.0% 0.0% 0.0%
Finished Goods 0.7% 0.5% 0.4% 0.7% 1.4%
Progress Payments & Other 0.0% 0.0% 0.0% 0.0%
Prepaid Expenses 0.7% 0.6% 0.2%
Other Current Assets 5.4% 4.9% 4.4% 4.6% 6.4%
Current Assets - Total 29.6% 35.4% 32.7% 38.7% 55.4%
Long Term Receivables 0.0% 0.0% 0.0% 0.0% 0.0%
Investment in Associated Companies
0.0% 0.0% 0.0% 0.0% 0.0%
Other Investments 56.1% 51.3% 52.3% 47.8% 33.8%
Property Plant and Equipment - Gross
16.8% 13.8% 12.4% 10.1% 9.6%
Accumulated Depreciation 7.9% 5.8% 3.7% 3.4% 3.3%
Property Plant and Equipment – Net
8.9% 8.0% 8.8% 6.7% 6.3%
Other Assets 5.4% 5.3% 6.2% 6.9% 4.5%
Deferred Charges 0.0% 0.0% 1.7% 1.4% 1.1%
Tangible Other Assets 1.6% 2.5% 1.4% 1.7% 1.9%
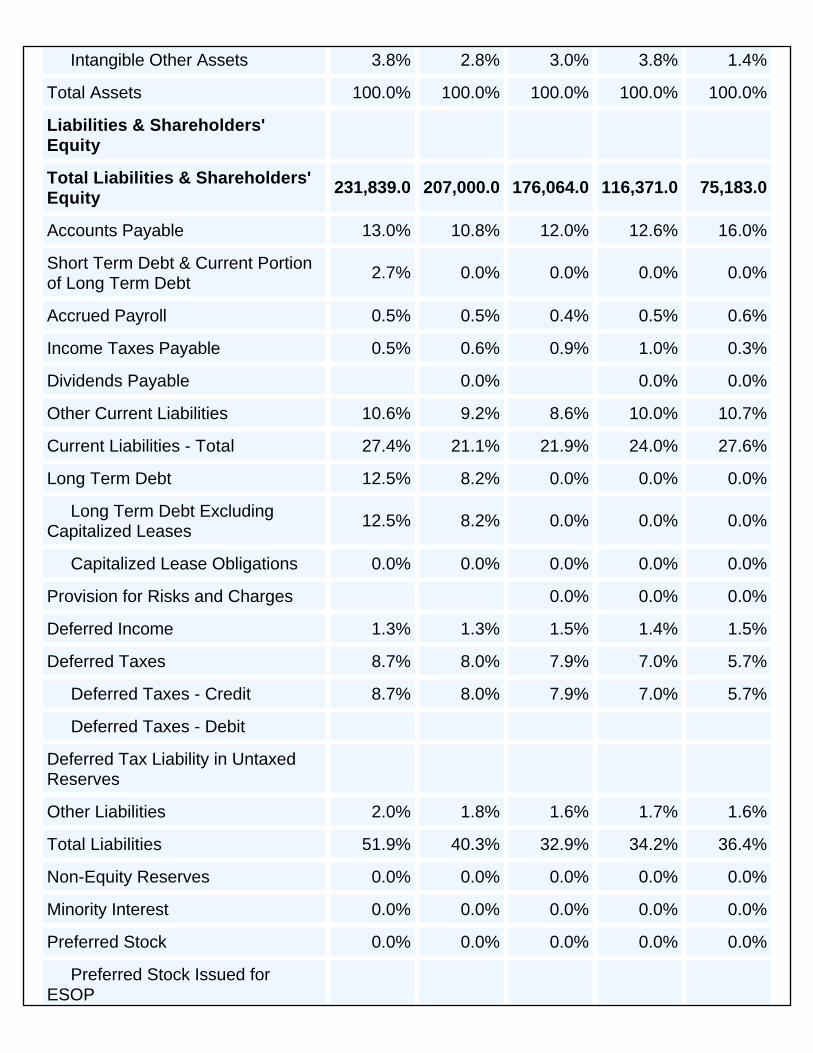
Intangible Other Assets 3.8% 2.8% 3.0% 3.8% 1.4%
Total Assets 100.0% 100.0% 100.0% 100.0% 100.0%
Liabilities & Shareholders' Equity
Total Liabilities & Shareholders' Equity
231,839.0 207,000.0 176,064.0 116,371.0 75,183.0
Accounts Payable 13.0% 10.8% 12.0% 12.6% 16.0%
Short Term Debt & Current Portion of Long Term Debt
2.7% 0.0% 0.0% 0.0% 0.0%
Accrued Payroll 0.5% 0.5% 0.4% 0.5% 0.6%
Income Taxes Payable 0.5% 0.6% 0.9% 1.0% 0.3%
Dividends Payable 0.0% 0.0% 0.0%
Other Current Liabilities 10.6% 9.2% 8.6% 10.0% 10.7%
Current Liabilities - Total 27.4% 21.1% 21.9% 24.0% 27.6%
Long Term Debt 12.5% 8.2% 0.0% 0.0% 0.0%
Long Term Debt Excluding Capitalized Leases
12.5% 8.2% 0.0% 0.0% 0.0%
Capitalized Lease Obligations 0.0% 0.0% 0.0% 0.0% 0.0%
Provision for Risks and Charges 0.0% 0.0% 0.0%
Deferred Income 1.3% 1.3% 1.5% 1.4% 1.5%
Deferred Taxes 8.7% 8.0% 7.9% 7.0% 5.7%
Deferred Taxes - Credit 8.7% 8.0% 7.9% 7.0% 5.7%
Deferred Taxes - Debit
Deferred Tax Liability in Untaxed Reserves
Other Liabilities 2.0% 1.8% 1.6% 1.7% 1.6%
Total Liabilities 51.9% 40.3% 32.9% 34.2% 36.4%
Non-Equity Reserves 0.0% 0.0% 0.0% 0.0% 0.0%
Minority Interest 0.0% 0.0% 0.0% 0.0% 0.0%
Preferred Stock 0.0% 0.0% 0.0% 0.0% 0.0%
Preferred Stock Issued for ESOP
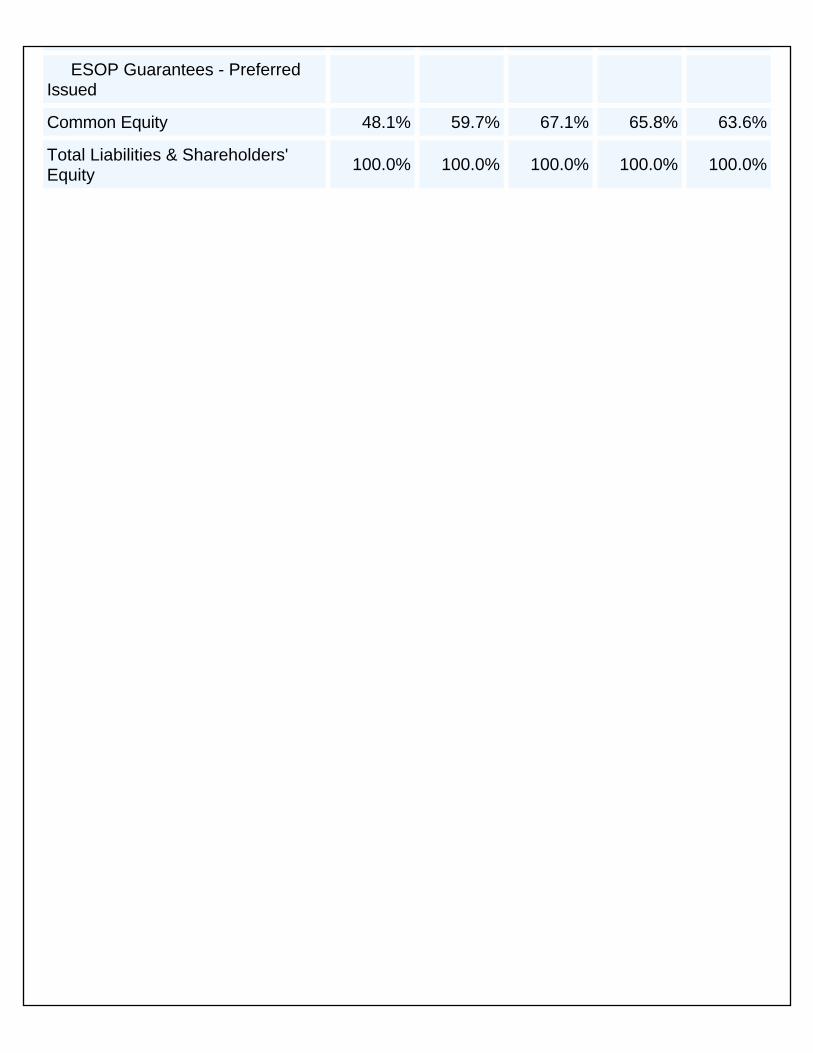
ESOP Guarantees - Preferred Issued
Common Equity 48.1% 59.7% 67.1% 65.8% 63.6%
Total Liabilities & Shareholders' Equity
100.0% 100.0% 100.0% 100.0% 100.0%
Financial Statement Analyses\Balance Sheet - Year-Year % Change
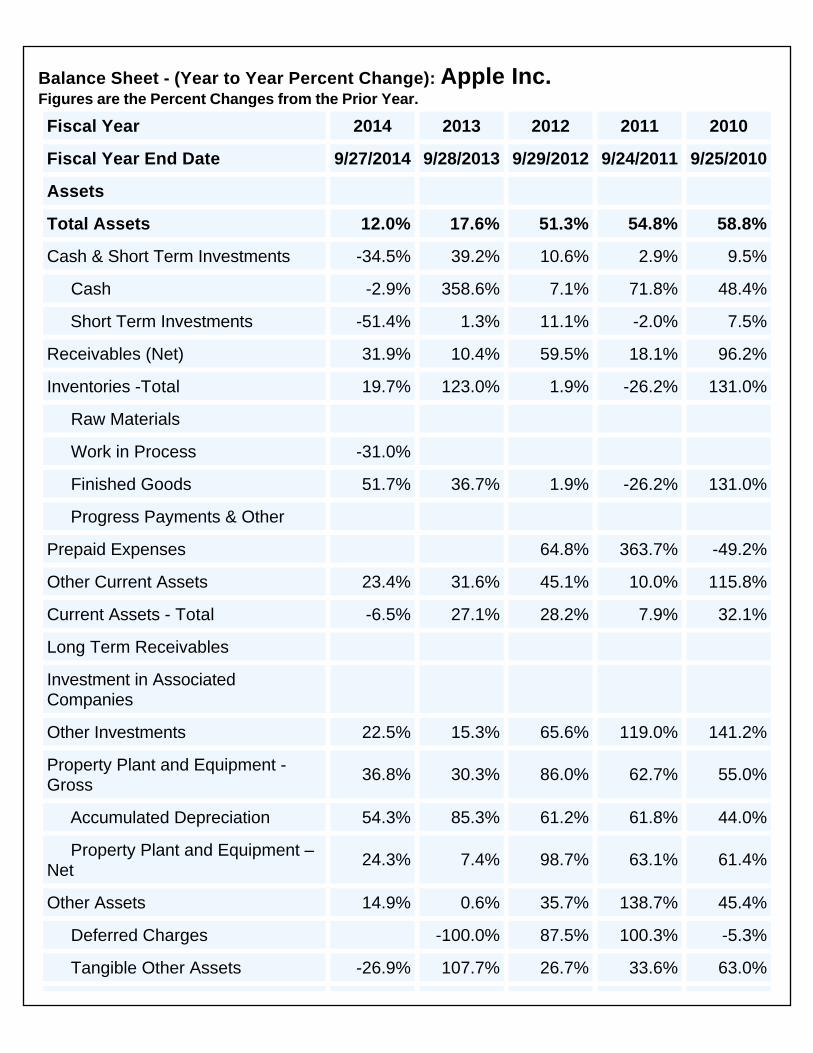
Balance Sheet - (Year to Year Percent Change): Apple Inc. Figures are the Percent Changes from the Prior Year.
Fiscal Year 2014 2013 2012 2011 2010
Fiscal Year End Date 9/27/2014 9/28/2013 9/29/2012 9/24/2011 9/25/2010
Assets
Total Assets 12.0% 17.6% 51.3% 54.8% 58.8%
Cash & Short Term Investments -34.5% 39.2% 10.6% 2.9% 9.5%
Cash -2.9% 358.6% 7.1% 71.8% 48.4%
Short Term Investments -51.4% 1.3% 11.1% -2.0% 7.5%
Receivables (Net) 31.9% 10.4% 59.5% 18.1% 96.2%
Inventories -Total 19.7% 123.0% 1.9% -26.2% 131.0%
Raw Materials
Work in Process -31.0%
Finished Goods 51.7% 36.7% 1.9% -26.2% 131.0%
Progress Payments & Other
Prepaid Expenses 64.8% 363.7% -49.2%
Other Current Assets 23.4% 31.6% 45.1% 10.0% 115.8%
Current Assets - Total -6.5% 27.1% 28.2% 7.9% 32.1%
Long Term Receivables
Investment in Associated Companies
Other Investments 22.5% 15.3% 65.6% 119.0% 141.2%
Property Plant and Equipment - Gross
36.8% 30.3% 86.0% 62.7% 55.0%
Accumulated Depreciation 54.3% 85.3% 61.2% 61.8% 44.0%
Property Plant and Equipment – Net
24.3% 7.4% 98.7% 63.1% 61.4%
Other Assets 14.9% 0.6% 35.7% 138.7% 45.4%
Deferred Charges -100.0% 87.5% 100.3% -5.3%
Tangible Other Assets -26.9% 107.7% 26.7% 33.6% 63.0%
Intangible Other Assets 52.2% 7.4% 20.9% 309.2% 93.7%
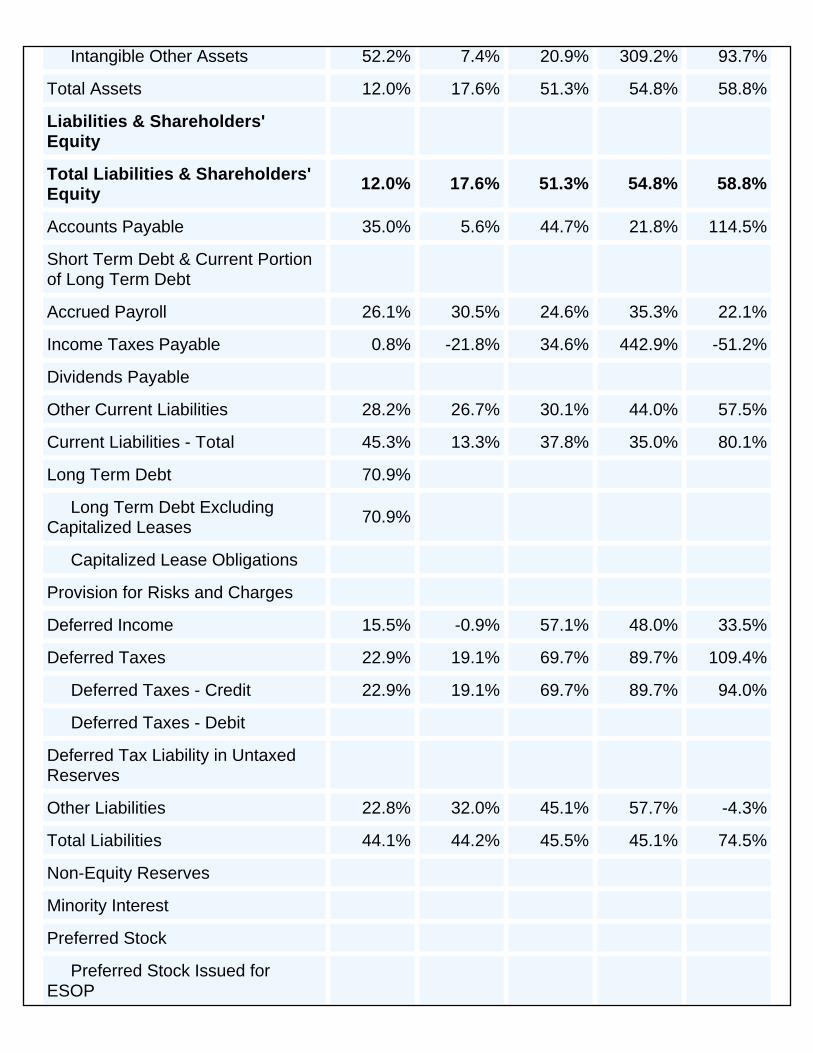
Total Assets 12.0% 17.6% 51.3% 54.8% 58.8%
Liabilities & Shareholders' Equity
Total Liabilities & Shareholders' Equity
12.0% 17.6% 51.3% 54.8% 58.8%
Accounts Payable 35.0% 5.6% 44.7% 21.8% 114.5%
Short Term Debt & Current Portion of Long Term Debt
Accrued Payroll 26.1% 30.5% 24.6% 35.3% 22.1%
Income Taxes Payable 0.8% -21.8% 34.6% 442.9% -51.2%
Dividends Payable
Other Current Liabilities 28.2% 26.7% 30.1% 44.0% 57.5%
Current Liabilities - Total 45.3% 13.3% 37.8% 35.0% 80.1%
Long Term Debt 70.9%
Long Term Debt Excluding Capitalized Leases
70.9%
Capitalized Lease Obligations
Provision for Risks and Charges
Deferred Income 15.5% -0.9% 57.1% 48.0% 33.5%
Deferred Taxes 22.9% 19.1% 69.7% 89.7% 109.4%
Deferred Taxes - Credit 22.9% 19.1% 69.7% 89.7% 94.0%
Deferred Taxes - Debit
Deferred Tax Liability in Untaxed Reserves
Other Liabilities 22.8% 32.0% 45.1% 57.7% -4.3%
Total Liabilities 44.1% 44.2% 45.5% 45.1% 74.5%
Non-Equity Reserves
Minority Interest
Preferred Stock
Preferred Stock Issued for ESOP
ESOP Guarantees - Preferred Issued
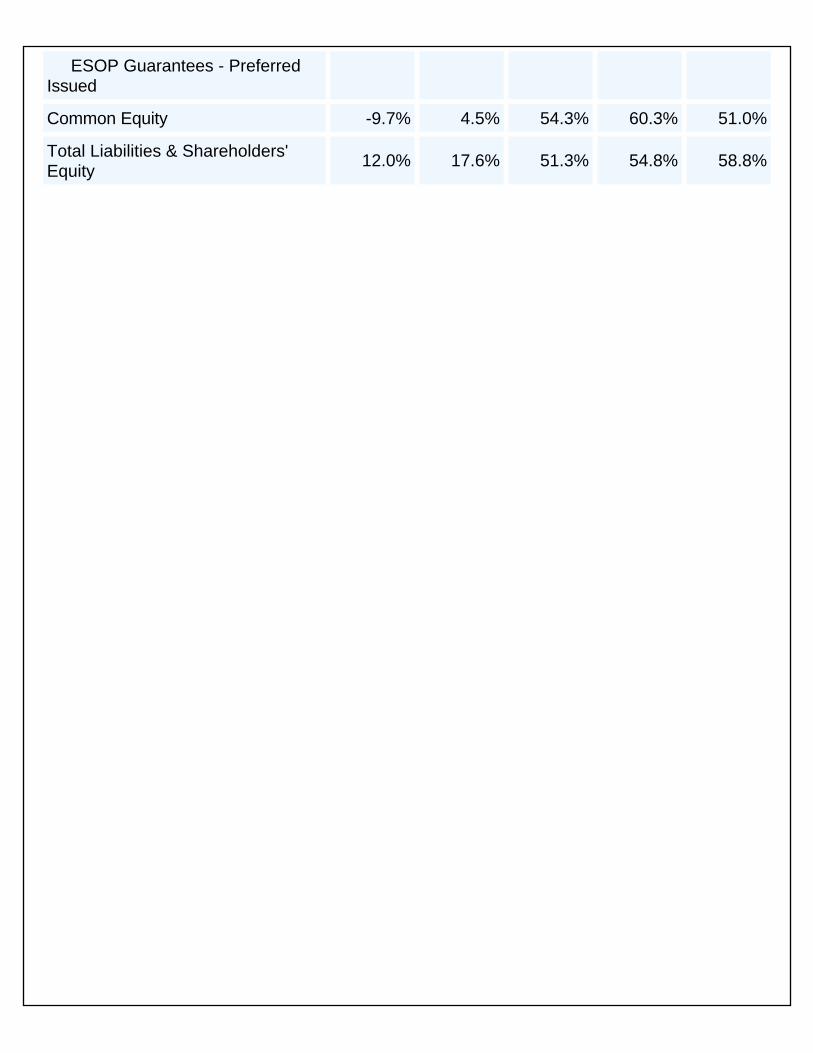
Common Equity -9.7% 4.5% 54.3% 60.3% 51.0%
Total Liabilities & Shareholders' Equity
12.0% 17.6% 51.3% 54.8% 58.8%
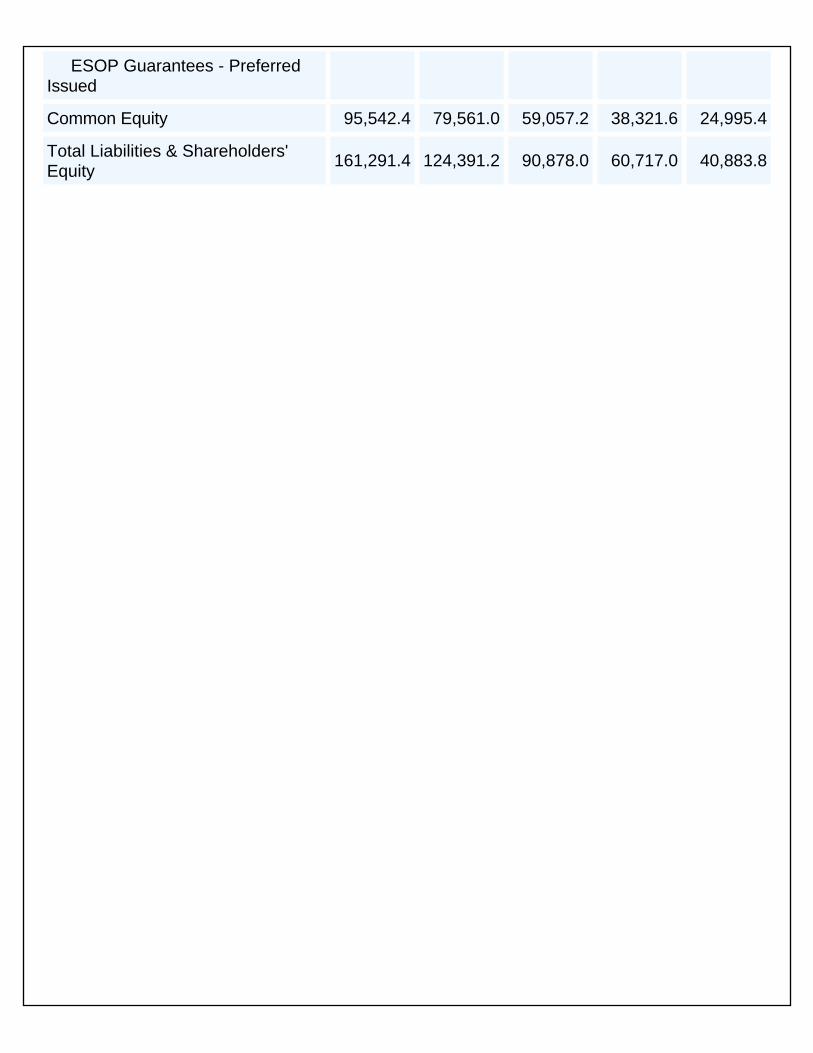
Financial Statement Analyses\Balance Sheet - Five-Year Averages
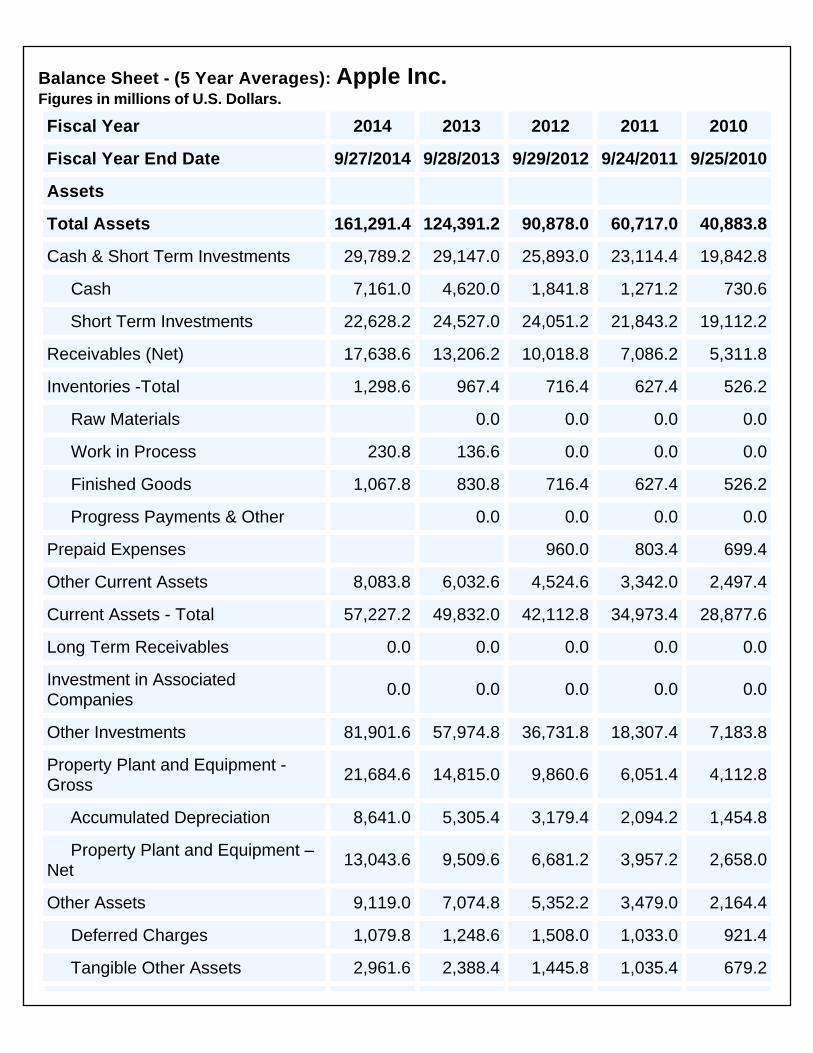
Balance Sheet - (5 Year Averages): Apple Inc. Figures in millions of U.S. Dollars.
Fiscal Year 2014 2013 2012 2011 2010
Fiscal Year End Date 9/27/2014 9/28/2013 9/29/2012 9/24/2011 9/25/2010
Assets
Total Assets 161,291.4 124,391.2 90,878.0 60,717.0 40,883.8
Cash & Short Term Investments 29,789.2 29,147.0 25,893.0 23,114.4 19,842.8
Cash 7,161.0 4,620.0 1,841.8 1,271.2 730.6
Short Term Investments 22,628.2 24,527.0 24,051.2 21,843.2 19,112.2
Receivables (Net) 17,638.6 13,206.2 10,018.8 7,086.2 5,311.8
Inventories -Total 1,298.6 967.4 716.4 627.4 526.2
Raw Materials 0.0 0.0 0.0 0.0
Work in Process 230.8 136.6 0.0 0.0 0.0
Finished Goods 1,067.8 830.8 716.4 627.4 526.2
Progress Payments & Other 0.0 0.0 0.0 0.0
Prepaid Expenses 960.0 803.4 699.4
Other Current Assets 8,083.8 6,032.6 4,524.6 3,342.0 2,497.4
Current Assets - Total 57,227.2 49,832.0 42,112.8 34,973.4 28,877.6
Long Term Receivables 0.0 0.0 0.0 0.0 0.0
Investment in Associated Companies
0.0 0.0 0.0 0.0 0.0
Other Investments 81,901.6 57,974.8 36,731.8 18,307.4 7,183.8
Property Plant and Equipment - Gross
21,684.6 14,815.0 9,860.6 6,051.4 4,112.8
Accumulated Depreciation 8,641.0 5,305.4 3,179.4 2,094.2 1,454.8
Property Plant and Equipment – Net
13,043.6 9,509.6 6,681.2 3,957.2 2,658.0
Other Assets 9,119.0 7,074.8 5,352.2 3,479.0 2,164.4
Deferred Charges 1,079.8 1,248.6 1,508.0 1,033.0 921.4
Tangible Other Assets 2,961.6 2,388.4 1,445.8 1,035.4 679.2
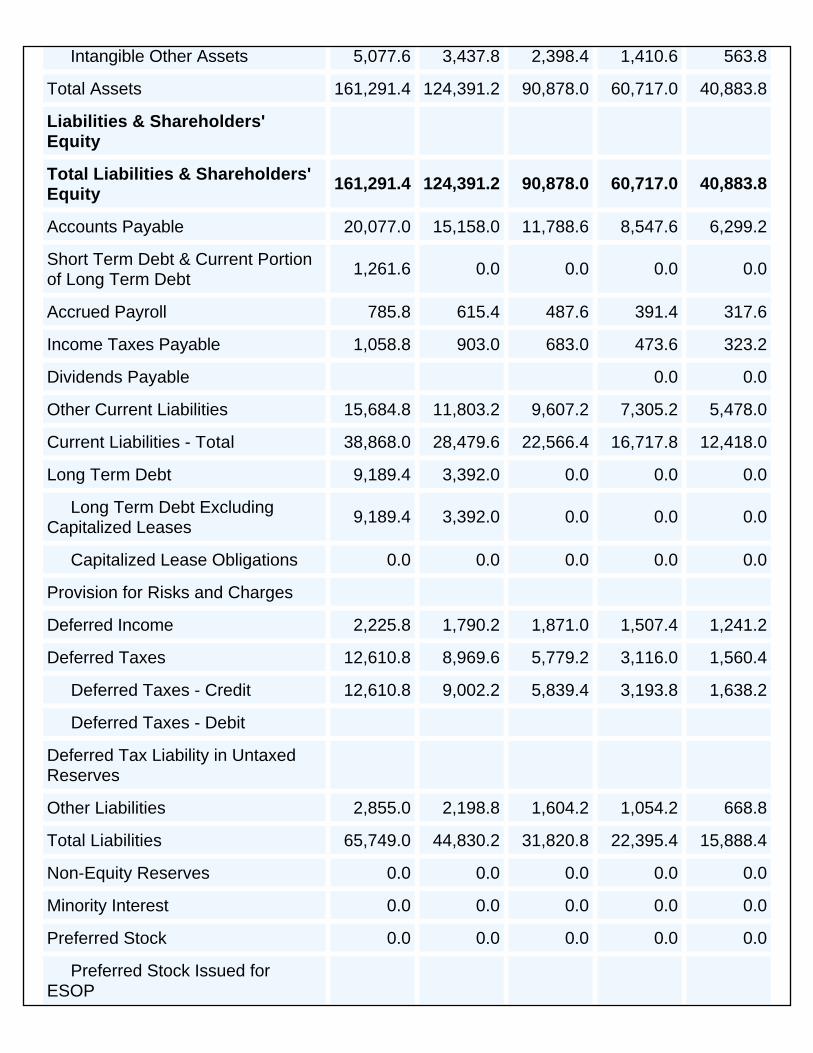
Intangible Other Assets 5,077.6 3,437.8 2,398.4 1,410.6 563.8
Total Assets 161,291.4 124,391.2 90,878.0 60,717.0 40,883.8
Liabilities & Shareholders' Equity
Total Liabilities & Shareholders' Equity
161,291.4 124,391.2 90,878.0 60,717.0 40,883.8
Accounts Payable 20,077.0 15,158.0 11,788.6 8,547.6 6,299.2
Short Term Debt & Current Portion of Long Term Debt
1,261.6 0.0 0.0 0.0 0.0
Accrued Payroll 785.8 615.4 487.6 391.4 317.6
Income Taxes Payable 1,058.8 903.0 683.0 473.6 323.2
Dividends Payable 0.0 0.0
Other Current Liabilities 15,684.8 11,803.2 9,607.2 7,305.2 5,478.0
Current Liabilities - Total 38,868.0 28,479.6 22,566.4 16,717.8 12,418.0
Long Term Debt 9,189.4 3,392.0 0.0 0.0 0.0
Long Term Debt Excluding Capitalized Leases
9,189.4 3,392.0 0.0 0.0 0.0
Capitalized Lease Obligations 0.0 0.0 0.0 0.0 0.0
Provision for Risks and Charges
Deferred Income 2,225.8 1,790.2 1,871.0 1,507.4 1,241.2
Deferred Taxes 12,610.8 8,969.6 5,779.2 3,116.0 1,560.4
Deferred Taxes - Credit 12,610.8 9,002.2 5,839.4 3,193.8 1,638.2
Deferred Taxes - Debit
Deferred Tax Liability in Untaxed Reserves
Other Liabilities 2,855.0 2,198.8 1,604.2 1,054.2 668.8
Total Liabilities 65,749.0 44,830.2 31,820.8 22,395.4 15,888.4
Non-Equity Reserves 0.0 0.0 0.0 0.0 0.0
Minority Interest 0.0 0.0 0.0 0.0 0.0
Preferred Stock 0.0 0.0 0.0 0.0 0.0
Preferred Stock Issued for ESOP
ESOP Guarantees - Preferred Issued
Common Equity 95,542.4 79,561.0 59,057.2 38,321.6 24,995.4
Total Liabilities & Shareholders' Equity
161,291.4 124,391.2 90,878.0 60,717.0 40,883.8
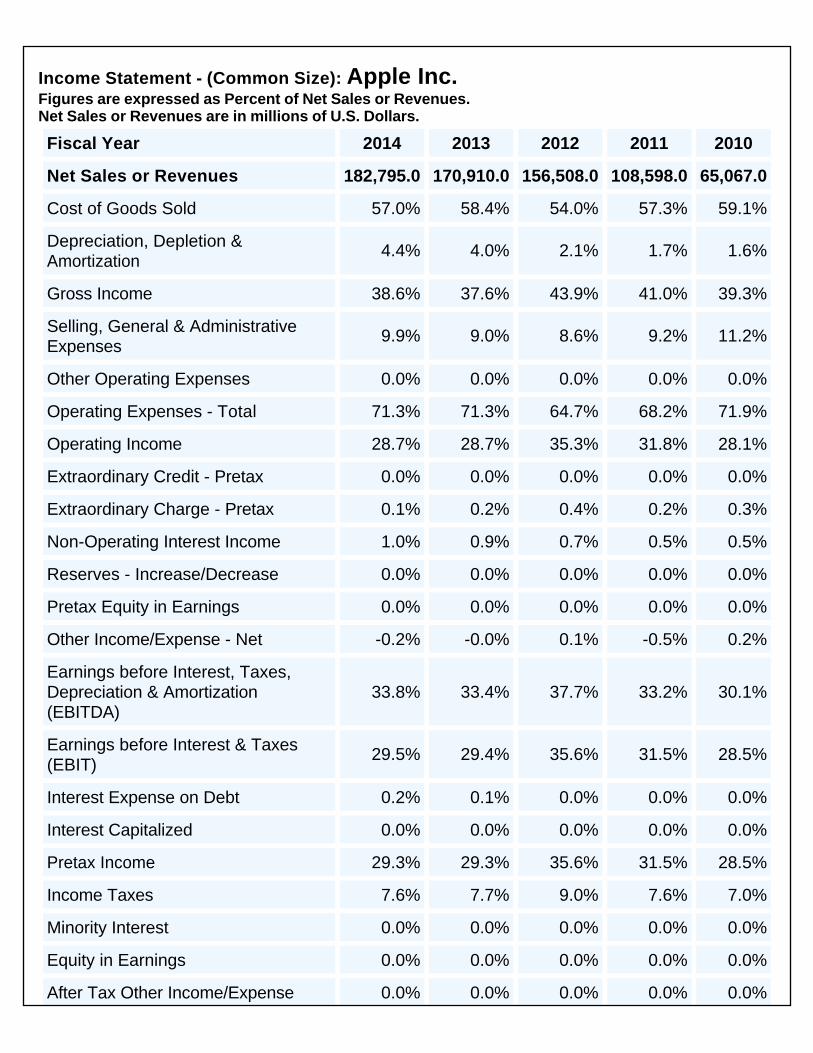
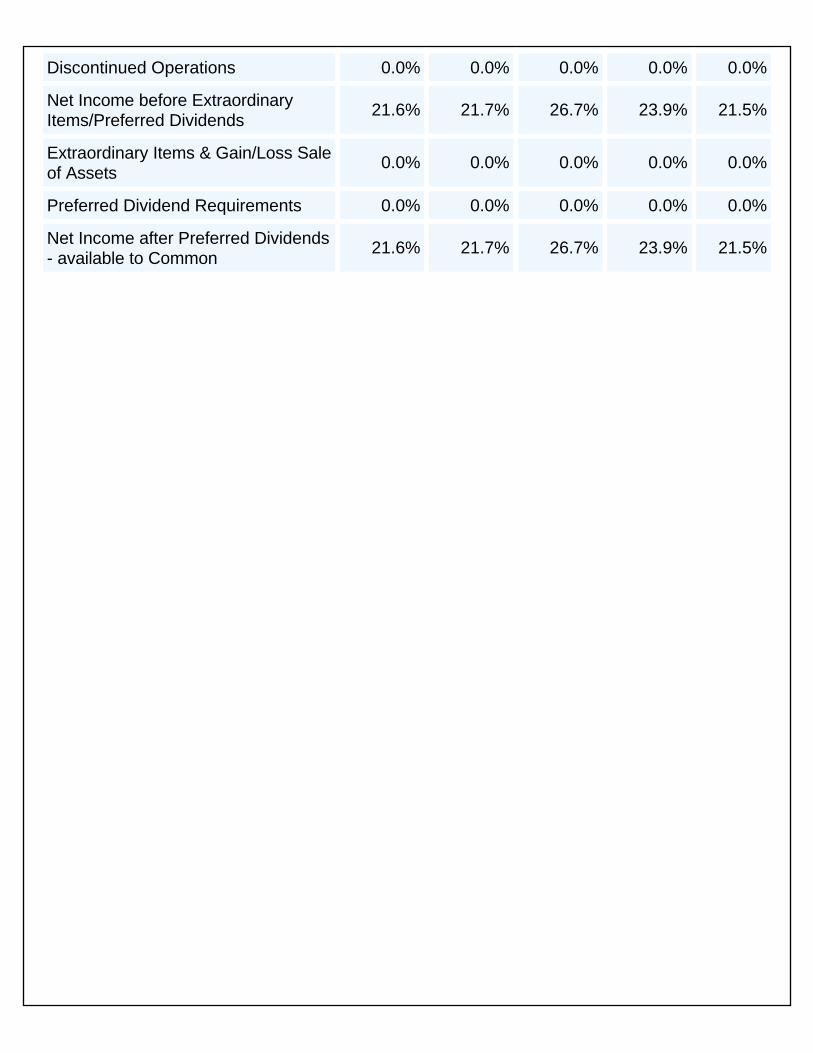
Financial Statement Analyses\Income Statement - Common Size
Income Statement - (Common Size): Apple Inc. Figures are expressed as Percent of Net Sales or Revenues. Net Sales or Revenues are in millions of U.S. Dollars.
Fiscal Year 2014 2013 2012 2011 2010
Net Sales or Revenues 182,795.0 170,910.0 156,508.0 108,598.0 65,067.0
Cost of Goods Sold 57.0% 58.4% 54.0% 57.3% 59.1%
Depreciation, Depletion & Amortization
4.4% 4.0% 2.1% 1.7% 1.6%
Gross Income 38.6% 37.6% 43.9% 41.0% 39.3%
Selling, General & Administrative Expenses
9.9% 9.0% 8.6% 9.2% 11.2%
Other Operating Expenses 0.0% 0.0% 0.0% 0.0% 0.0%
Operating Expenses - Total 71.3% 71.3% 64.7% 68.2% 71.9%
Operating Income 28.7% 28.7% 35.3% 31.8% 28.1%
Extraordinary Credit - Pretax 0.0% 0.0% 0.0% 0.0% 0.0%
Extraordinary Charge - Pretax 0.1% 0.2% 0.4% 0.2% 0.3%
Non-Operating Interest Income 1.0% 0.9% 0.7% 0.5% 0.5%
Reserves - Increase/Decrease 0.0% 0.0% 0.0% 0.0% 0.0%
Pretax Equity in Earnings 0.0% 0.0% 0.0% 0.0% 0.0%
Other Income/Expense - Net -0.2% -0.0% 0.1% -0.5% 0.2%
Earnings before Interest, Taxes, Depreciation & Amortization (EBITDA)
33.8% 33.4% 37.7% 33.2% 30.1%
Earnings before Interest & Taxes(EBIT)
29.5% 29.4% 35.6% 31.5% 28.5%
Interest Expense on Debt 0.2% 0.1% 0.0% 0.0% 0.0%
Interest Capitalized 0.0% 0.0% 0.0% 0.0% 0.0%
Pretax Income 29.3% 29.3% 35.6% 31.5% 28.5%
Income Taxes 7.6% 7.7% 9.0% 7.6% 7.0%
Minority Interest 0.0% 0.0% 0.0% 0.0% 0.0%
Equity in Earnings 0.0% 0.0% 0.0% 0.0% 0.0%
After Tax Other Income/Expense 0.0% 0.0% 0.0% 0.0% 0.0%
Discontinued Operations 0.0% 0.0% 0.0% 0.0% 0.0%
Net Income before Extraordinary Items/Preferred Dividends
21.6% 21.7% 26.7% 23.9% 21.5%
Extraordinary Items & Gain/Loss Sale of Assets
0.0% 0.0% 0.0% 0.0% 0.0%
Preferred Dividend Requirements 0.0% 0.0% 0.0% 0.0% 0.0%
Net Income after Preferred Dividends - available to Common
21.6% 21.7% 26.7% 23.9% 21.5%
Financial Statement Analyses\Income Statement - Year-Year % Change
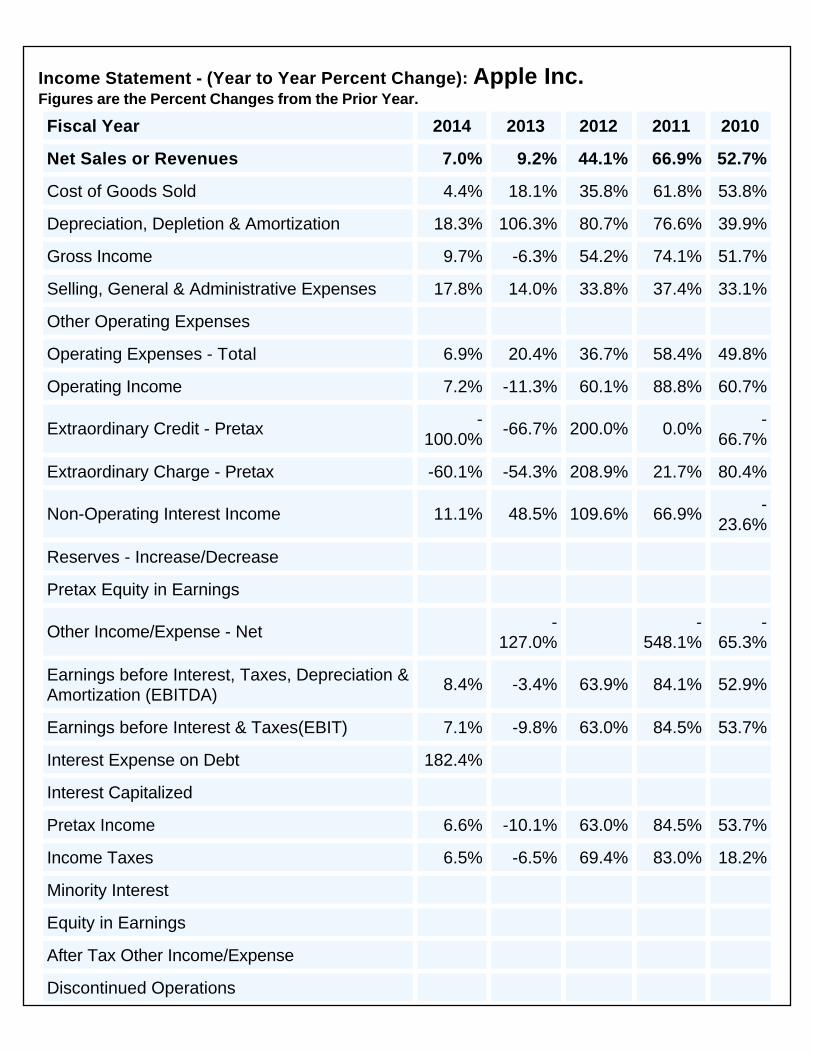
Income Statement - (Year to Year Percent Change): Apple Inc. Figures are the Percent Changes from the Prior Year.
Fiscal Year 2014 2013 2012 2011 2010
Net Sales or Revenues 7.0% 9.2% 44.1% 66.9% 52.7%
Cost of Goods Sold 4.4% 18.1% 35.8% 61.8% 53.8%
Depreciation, Depletion & Amortization 18.3% 106.3% 80.7% 76.6% 39.9%
Gross Income 9.7% -6.3% 54.2% 74.1% 51.7%
Selling, General & Administrative Expenses 17.8% 14.0% 33.8% 37.4% 33.1%
Other Operating Expenses
Operating Expenses - Total 6.9% 20.4% 36.7% 58.4% 49.8%
Operating Income 7.2% -11.3% 60.1% 88.8% 60.7%
Extraordinary Credit - Pretax -100.0%
-66.7% 200.0% 0.0% -66.7%
Extraordinary Charge - Pretax -60.1% -54.3% 208.9% 21.7% 80.4%
Non-Operating Interest Income 11.1% 48.5% 109.6% 66.9% -23.6%
Reserves - Increase/Decrease
Pretax Equity in Earnings
Other Income/Expense - Net -127.0%
-548.1%
-65.3%
Earnings before Interest, Taxes, Depreciation & Amortization (EBITDA)
8.4% -3.4% 63.9% 84.1% 52.9%
Earnings before Interest & Taxes(EBIT) 7.1% -9.8% 63.0% 84.5% 53.7%
Interest Expense on Debt 182.4%
Interest Capitalized
Pretax Income 6.6% -10.1% 63.0% 84.5% 53.7%
Income Taxes 6.5% -6.5% 69.4% 83.0% 18.2%
Minority Interest
Equity in Earnings
After Tax Other Income/Expense
Discontinued Operations
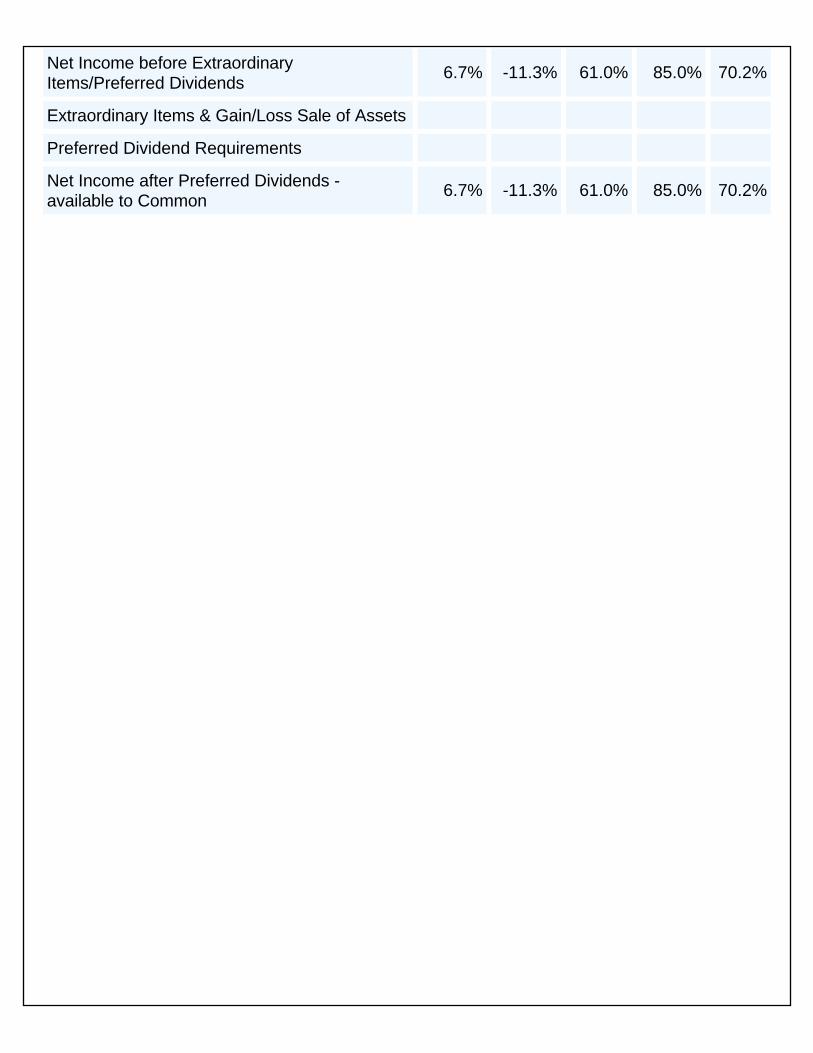
Net Income before Extraordinary Items/Preferred Dividends
6.7% -11.3% 61.0% 85.0% 70.2%
Extraordinary Items & Gain/Loss Sale of Assets
Preferred Dividend Requirements
Net Income after Preferred Dividends - available to Common
6.7% -11.3% 61.0% 85.0% 70.2%
Financial Statement Analyses\Income Statement - Five-Year Averages
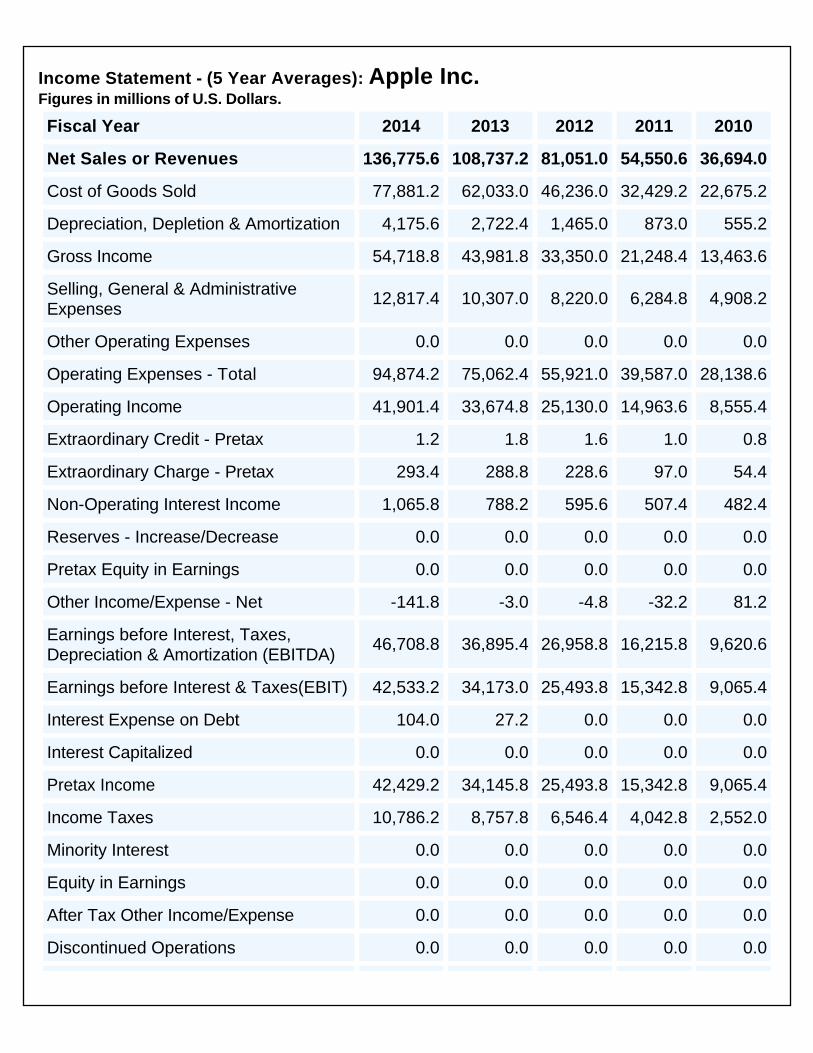
Income Statement - (5 Year Averages): Apple Inc. Figures in millions of U.S. Dollars.
Fiscal Year 2014 2013 2012 2011 2010
Net Sales or Revenues 136,775.6 108,737.2 81,051.0 54,550.6 36,694.0
Cost of Goods Sold 77,881.2 62,033.0 46,236.0 32,429.2 22,675.2
Depreciation, Depletion & Amortization 4,175.6 2,722.4 1,465.0 873.0 555.2
Gross Income 54,718.8 43,981.8 33,350.0 21,248.4 13,463.6
Selling, General & Administrative Expenses
12,817.4 10,307.0 8,220.0 6,284.8 4,908.2
Other Operating Expenses 0.0 0.0 0.0 0.0 0.0
Operating Expenses - Total 94,874.2 75,062.4 55,921.0 39,587.0 28,138.6
Operating Income 41,901.4 33,674.8 25,130.0 14,963.6 8,555.4
Extraordinary Credit - Pretax 1.2 1.8 1.6 1.0 0.8
Extraordinary Charge - Pretax 293.4 288.8 228.6 97.0 54.4
Non-Operating Interest Income 1,065.8 788.2 595.6 507.4 482.4
Reserves - Increase/Decrease 0.0 0.0 0.0 0.0 0.0
Pretax Equity in Earnings 0.0 0.0 0.0 0.0 0.0
Other Income/Expense - Net -141.8 -3.0 -4.8 -32.2 81.2
Earnings before Interest, Taxes, Depreciation & Amortization (EBITDA)
46,708.8 36,895.4 26,958.8 16,215.8 9,620.6
Earnings before Interest & Taxes(EBIT) 42,533.2 34,173.0 25,493.8 15,342.8 9,065.4
Interest Expense on Debt 104.0 27.2 0.0 0.0 0.0
Interest Capitalized 0.0 0.0 0.0 0.0 0.0
Pretax Income 42,429.2 34,145.8 25,493.8 15,342.8 9,065.4
Income Taxes 10,786.2 8,757.8 6,546.4 4,042.8 2,552.0
Minority Interest 0.0 0.0 0.0 0.0 0.0
Equity in Earnings 0.0 0.0 0.0 0.0 0.0
After Tax Other Income/Expense 0.0 0.0 0.0 0.0 0.0
Discontinued Operations 0.0 0.0 0.0 0.0 0.0
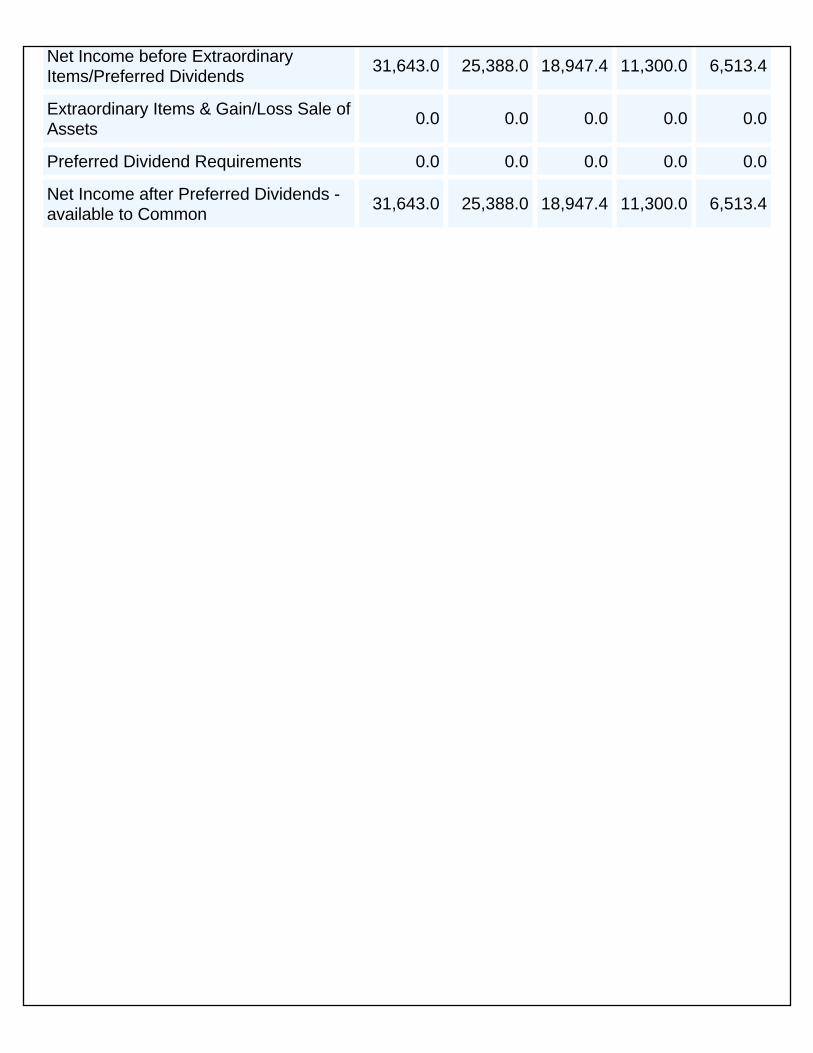
Net Income before Extraordinary Items/Preferred Dividends
31,643.0 25,388.0 18,947.4 11,300.0 6,513.4
Extraordinary Items & Gain/Loss Sale of Assets
0.0 0.0 0.0 0.0 0.0
Preferred Dividend Requirements 0.0 0.0 0.0 0.0 0.0
Net Income after Preferred Dividends - available to Common
31,643.0 25,388.0 18,947.4 11,300.0 6,513.4
Financial Statement Analyses\Sources of Capital - Net Change
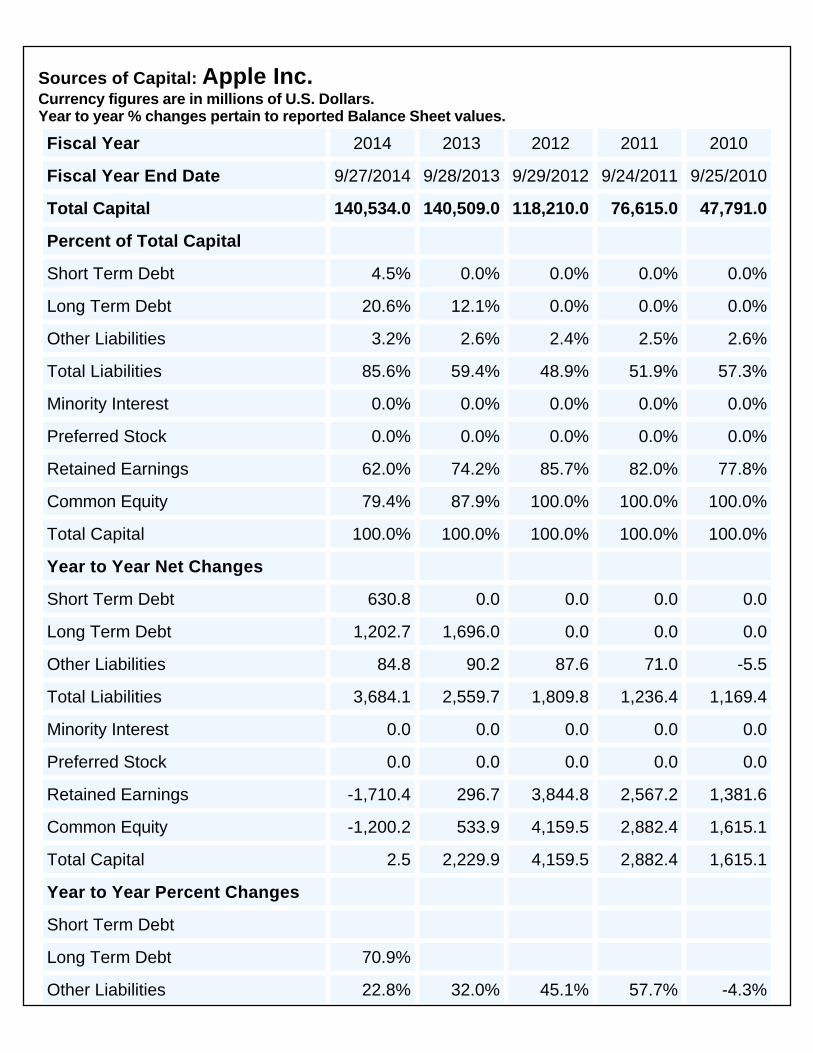
Sources of Capital: Apple Inc. Currency figures are in millions of U.S. Dollars. Year to year % changes pertain to reported Balance Sheet values.
Fiscal Year 2014 2013 2012 2011 2010
Fiscal Year End Date 9/27/2014 9/28/2013 9/29/2012 9/24/2011 9/25/2010
Total Capital 140,534.0 140,509.0 118,210.0 76,615.0 47,791.0
Percent of Total Capital
Short Term Debt 4.5% 0.0% 0.0% 0.0% 0.0%
Long Term Debt 20.6% 12.1% 0.0% 0.0% 0.0%
Other Liabilities 3.2% 2.6% 2.4% 2.5% 2.6%
Total Liabilities 85.6% 59.4% 48.9% 51.9% 57.3%
Minority Interest 0.0% 0.0% 0.0% 0.0% 0.0%
Preferred Stock 0.0% 0.0% 0.0% 0.0% 0.0%
Retained Earnings 62.0% 74.2% 85.7% 82.0% 77.8%
Common Equity 79.4% 87.9% 100.0% 100.0% 100.0%
Total Capital 100.0% 100.0% 100.0% 100.0% 100.0%
Year to Year Net Changes
Short Term Debt 630.8 0.0 0.0 0.0 0.0
Long Term Debt 1,202.7 1,696.0 0.0 0.0 0.0
Other Liabilities 84.8 90.2 87.6 71.0 -5.5
Total Liabilities 3,684.1 2,559.7 1,809.8 1,236.4 1,169.4
Minority Interest 0.0 0.0 0.0 0.0 0.0
Preferred Stock 0.0 0.0 0.0 0.0 0.0
Retained Earnings -1,710.4 296.7 3,844.8 2,567.2 1,381.6
Common Equity -1,200.2 533.9 4,159.5 2,882.4 1,615.1
Total Capital 2.5 2,229.9 4,159.5 2,882.4 1,615.1
Year to Year Percent Changes
Short Term Debt
Long Term Debt 70.9%
Other Liabilities 22.8% 32.0% 45.1% 57.7% -4.3%
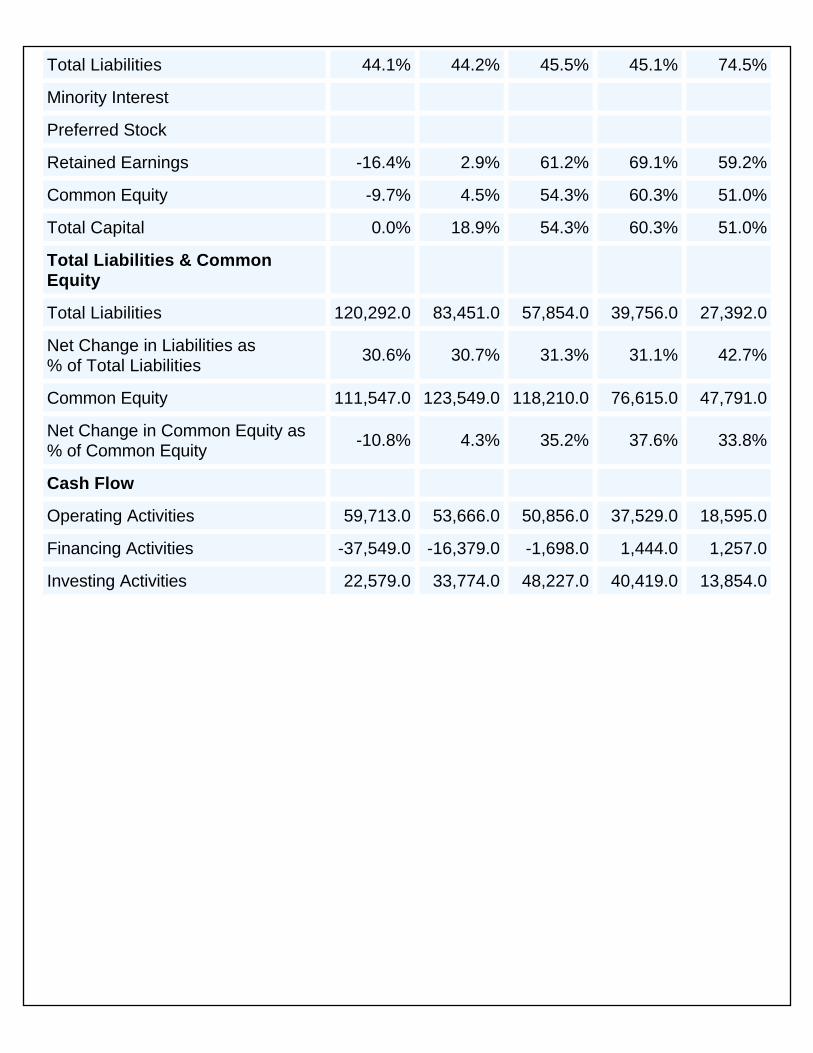
Total Liabilities 44.1% 44.2% 45.5% 45.1% 74.5%
Minority Interest
Preferred Stock
Retained Earnings -16.4% 2.9% 61.2% 69.1% 59.2%
Common Equity -9.7% 4.5% 54.3% 60.3% 51.0%
Total Capital 0.0% 18.9% 54.3% 60.3% 51.0%
Total Liabilities & Common Equity
Total Liabilities 120,292.0 83,451.0 57,854.0 39,756.0 27,392.0
Net Change in Liabilities as % of Total Liabilities
30.6% 30.7% 31.3% 31.1% 42.7%
Common Equity 111,547.0 123,549.0 118,210.0 76,615.0 47,791.0
Net Change in Common Equity as % of Common Equity
-10.8% 4.3% 35.2% 37.6% 33.8%
Cash Flow
Operating Activities 59,713.0 53,666.0 50,856.0 37,529.0 18,595.0
Financing Activities -37,549.0 -16,379.0 -1,698.0 1,444.0 1,257.0
Investing Activities 22,579.0 33,774.0 48,227.0 40,419.0 13,854.0
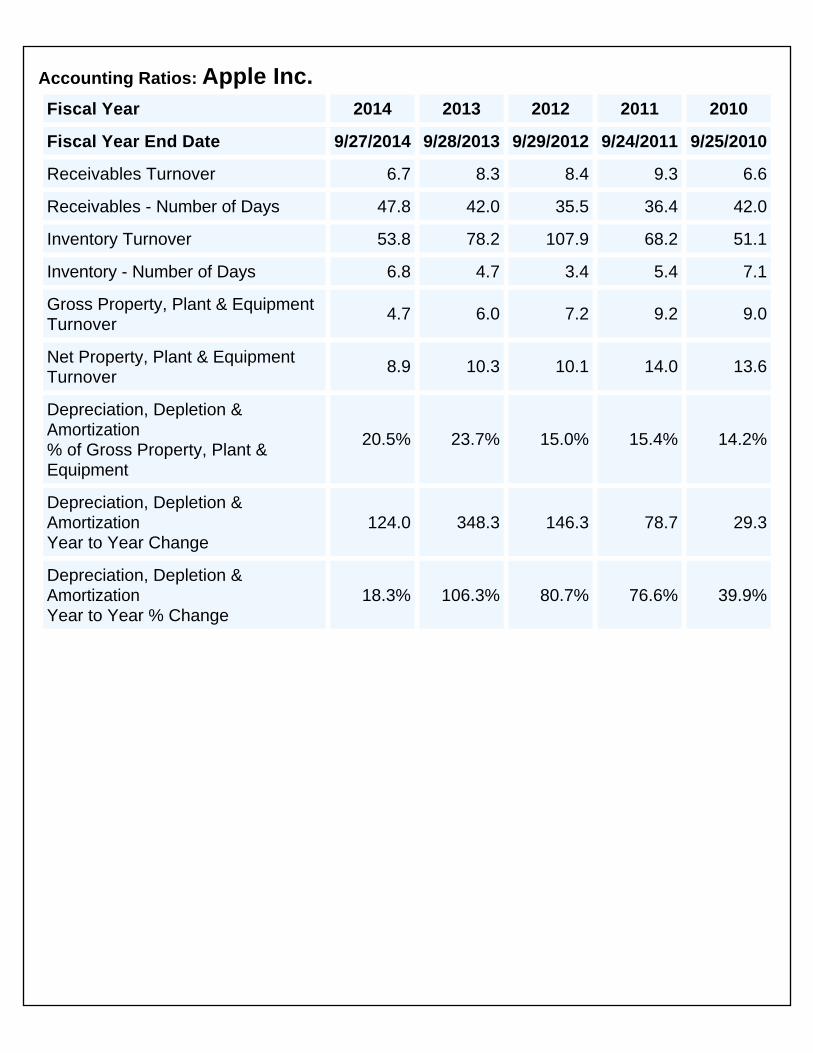
Financial Ratio AnalysesFinancial Ratio Analyses\Accounting Ratios
Accounting Ratios: Apple Inc. Fiscal Year 2014 2013 2012 2011 2010
Fiscal Year End Date 9/27/2014 9/28/2013 9/29/2012 9/24/2011 9/25/2010
Receivables Turnover 6.7 8.3 8.4 9.3 6.6
Receivables - Number of Days 47.8 42.0 35.5 36.4 42.0
Inventory Turnover 53.8 78.2 107.9 68.2 51.1
Inventory - Number of Days 6.8 4.7 3.4 5.4 7.1
Gross Property, Plant & Equipment Turnover
4.7 6.0 7.2 9.2 9.0
Net Property, Plant & Equipment Turnover
8.9 10.3 10.1 14.0 13.6
Depreciation, Depletion & Amortization % of Gross Property, Plant & Equipment
20.5% 23.7% 15.0% 15.4% 14.2%
Depreciation, Depletion & Amortization Year to Year Change
124.0 348.3 146.3 78.7 29.3
Depreciation, Depletion & Amortization Year to Year % Change
18.3% 106.3% 80.7% 76.6% 39.9%
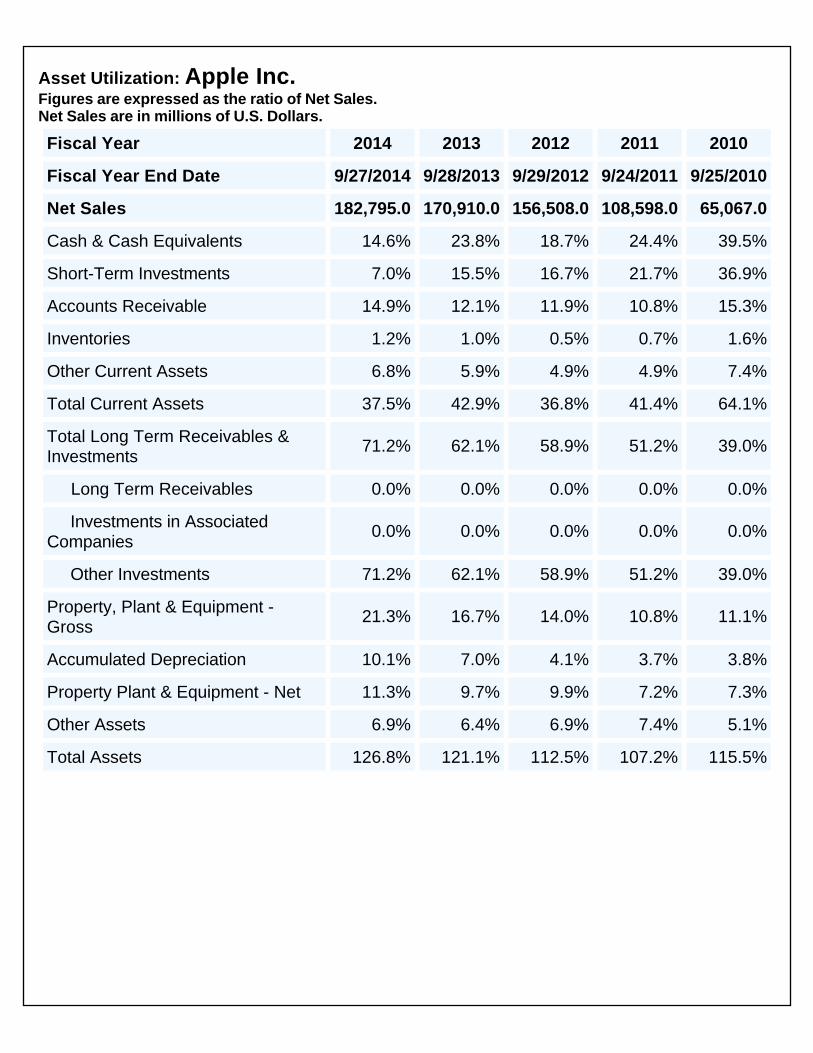
Financial Ratio Analyses\Asset Utilization
Asset Utilization: Apple Inc. Figures are expressed as the ratio of Net Sales. Net Sales are in millions of U.S. Dollars.
Fiscal Year 2014 2013 2012 2011 2010
Fiscal Year End Date 9/27/2014 9/28/2013 9/29/2012 9/24/2011 9/25/2010
Net Sales 182,795.0 170,910.0 156,508.0 108,598.0 65,067.0
Cash & Cash Equivalents 14.6% 23.8% 18.7% 24.4% 39.5%
Short-Term Investments 7.0% 15.5% 16.7% 21.7% 36.9%
Accounts Receivable 14.9% 12.1% 11.9% 10.8% 15.3%
Inventories 1.2% 1.0% 0.5% 0.7% 1.6%
Other Current Assets 6.8% 5.9% 4.9% 4.9% 7.4%
Total Current Assets 37.5% 42.9% 36.8% 41.4% 64.1%
Total Long Term Receivables & Investments
71.2% 62.1% 58.9% 51.2% 39.0%
Long Term Receivables 0.0% 0.0% 0.0% 0.0% 0.0%
Investments in Associated Companies
0.0% 0.0% 0.0% 0.0% 0.0%
Other Investments 71.2% 62.1% 58.9% 51.2% 39.0%
Property, Plant & Equipment - Gross
21.3% 16.7% 14.0% 10.8% 11.1%
Accumulated Depreciation 10.1% 7.0% 4.1% 3.7% 3.8%
Property Plant & Equipment - Net 11.3% 9.7% 9.9% 7.2% 7.3%
Other Assets 6.9% 6.4% 6.9% 7.4% 5.1%
Total Assets 126.8% 121.1% 112.5% 107.2% 115.5%
Financial Ratio Analyses\Employee Efficiency
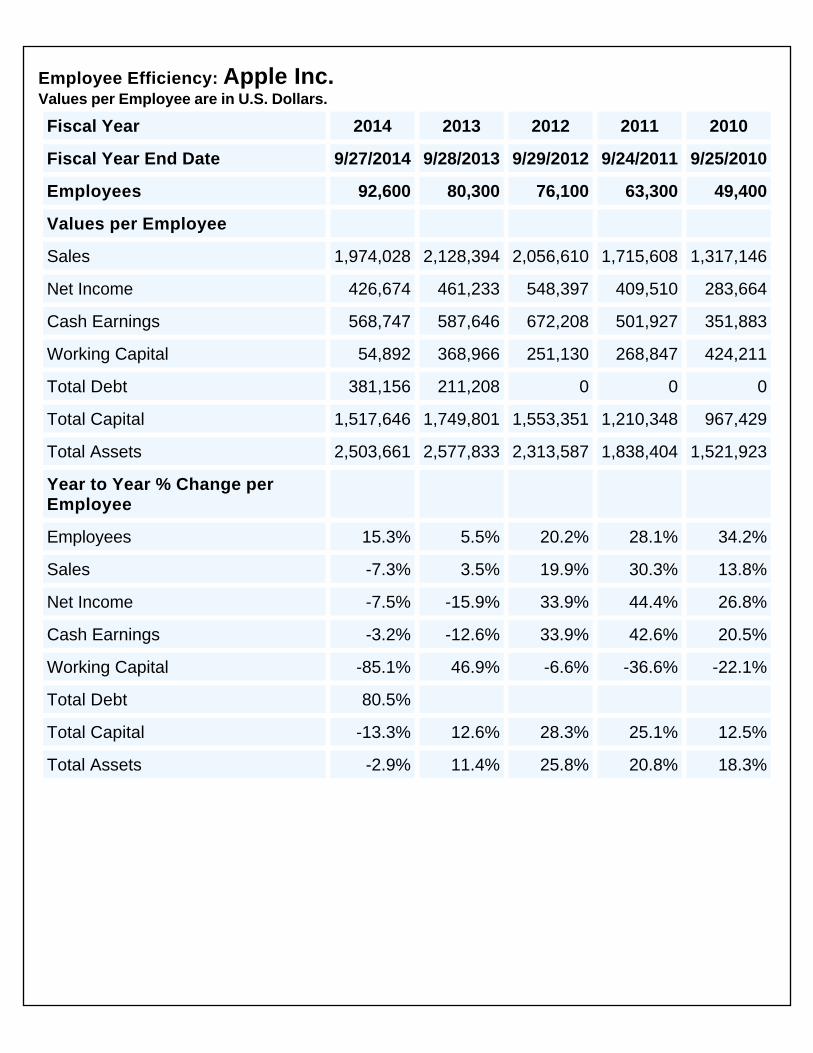
Employee Efficiency: Apple Inc. Values per Employee are in U.S. Dollars.
Fiscal Year 2014 2013 2012 2011 2010
Fiscal Year End Date 9/27/2014 9/28/2013 9/29/2012 9/24/2011 9/25/2010
Employees 92,600 80,300 76,100 63,300 49,400
Values per Employee
Sales 1,974,028 2,128,394 2,056,610 1,715,608 1,317,146
Net Income 426,674 461,233 548,397 409,510 283,664
Cash Earnings 568,747 587,646 672,208 501,927 351,883
Working Capital 54,892 368,966 251,130 268,847 424,211
Total Debt 381,156 211,208 0 0 0
Total Capital 1,517,646 1,749,801 1,553,351 1,210,348 967,429
Total Assets 2,503,661 2,577,833 2,313,587 1,838,404 1,521,923
Year to Year % Change per Employee
Employees 15.3% 5.5% 20.2% 28.1% 34.2%
Sales -7.3% 3.5% 19.9% 30.3% 13.8%
Net Income -7.5% -15.9% 33.9% 44.4% 26.8%
Cash Earnings -3.2% -12.6% 33.9% 42.6% 20.5%
Working Capital -85.1% 46.9% -6.6% -36.6% -22.1%
Total Debt 80.5%
Total Capital -13.3% 12.6% 28.3% 25.1% 12.5%
Total Assets -2.9% 11.4% 25.8% 20.8% 18.3%
Financial Ratio Analyses\Fixed Charges Coverage
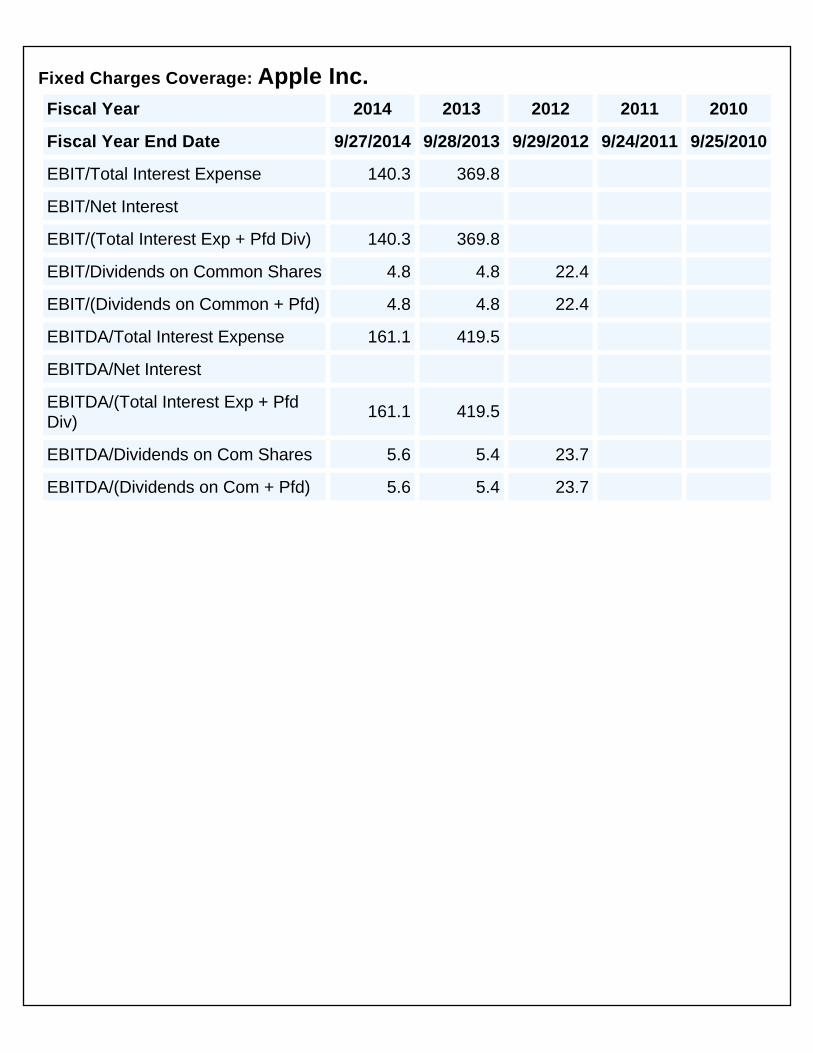
Fixed Charges Coverage: Apple Inc. Fiscal Year 2014 2013 2012 2011 2010
Fiscal Year End Date 9/27/2014 9/28/2013 9/29/2012 9/24/2011 9/25/2010
EBIT/Total Interest Expense 140.3 369.8
EBIT/Net Interest
EBIT/(Total Interest Exp + Pfd Div) 140.3 369.8
EBIT/Dividends on Common Shares 4.8 4.8 22.4
EBIT/(Dividends on Common + Pfd) 4.8 4.8 22.4
EBITDA/Total Interest Expense 161.1 419.5
EBITDA/Net Interest
EBITDA/(Total Interest Exp + Pfd Div)
161.1 419.5
EBITDA/Dividends on Com Shares 5.6 5.4 23.7
EBITDA/(Dividends on Com + Pfd) 5.6 5.4 23.7
Financial Ratio Analyses\Leverage Analysis
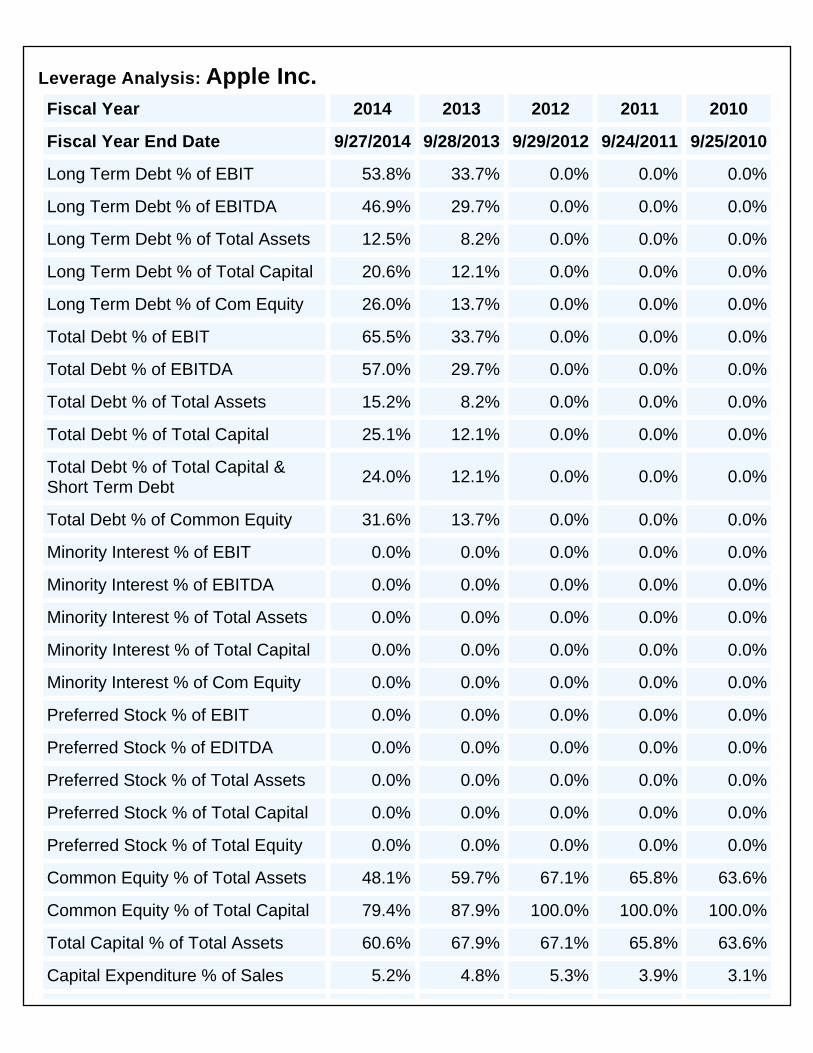
Leverage Analysis: Apple Inc. Fiscal Year 2014 2013 2012 2011 2010
Fiscal Year End Date 9/27/2014 9/28/2013 9/29/2012 9/24/2011 9/25/2010
Long Term Debt % of EBIT 53.8% 33.7% 0.0% 0.0% 0.0%
Long Term Debt % of EBITDA 46.9% 29.7% 0.0% 0.0% 0.0%
Long Term Debt % of Total Assets 12.5% 8.2% 0.0% 0.0% 0.0%
Long Term Debt % of Total Capital 20.6% 12.1% 0.0% 0.0% 0.0%
Long Term Debt % of Com Equity 26.0% 13.7% 0.0% 0.0% 0.0%
Total Debt % of EBIT 65.5% 33.7% 0.0% 0.0% 0.0%
Total Debt % of EBITDA 57.0% 29.7% 0.0% 0.0% 0.0%
Total Debt % of Total Assets 15.2% 8.2% 0.0% 0.0% 0.0%
Total Debt % of Total Capital 25.1% 12.1% 0.0% 0.0% 0.0%
Total Debt % of Total Capital & Short Term Debt
24.0% 12.1% 0.0% 0.0% 0.0%
Total Debt % of Common Equity 31.6% 13.7% 0.0% 0.0% 0.0%
Minority Interest % of EBIT 0.0% 0.0% 0.0% 0.0% 0.0%
Minority Interest % of EBITDA 0.0% 0.0% 0.0% 0.0% 0.0%
Minority Interest % of Total Assets 0.0% 0.0% 0.0% 0.0% 0.0%
Minority Interest % of Total Capital 0.0% 0.0% 0.0% 0.0% 0.0%
Minority Interest % of Com Equity 0.0% 0.0% 0.0% 0.0% 0.0%
Preferred Stock % of EBIT 0.0% 0.0% 0.0% 0.0% 0.0%
Preferred Stock % of EDITDA 0.0% 0.0% 0.0% 0.0% 0.0%
Preferred Stock % of Total Assets 0.0% 0.0% 0.0% 0.0% 0.0%
Preferred Stock % of Total Capital 0.0% 0.0% 0.0% 0.0% 0.0%
Preferred Stock % of Total Equity 0.0% 0.0% 0.0% 0.0% 0.0%
Common Equity % of Total Assets 48.1% 59.7% 67.1% 65.8% 63.6%
Common Equity % of Total Capital 79.4% 87.9% 100.0% 100.0% 100.0%
Total Capital % of Total Assets 60.6% 67.9% 67.1% 65.8% 63.6%
Capital Expenditure % of Sales 5.2% 4.8% 5.3% 3.9% 3.1%
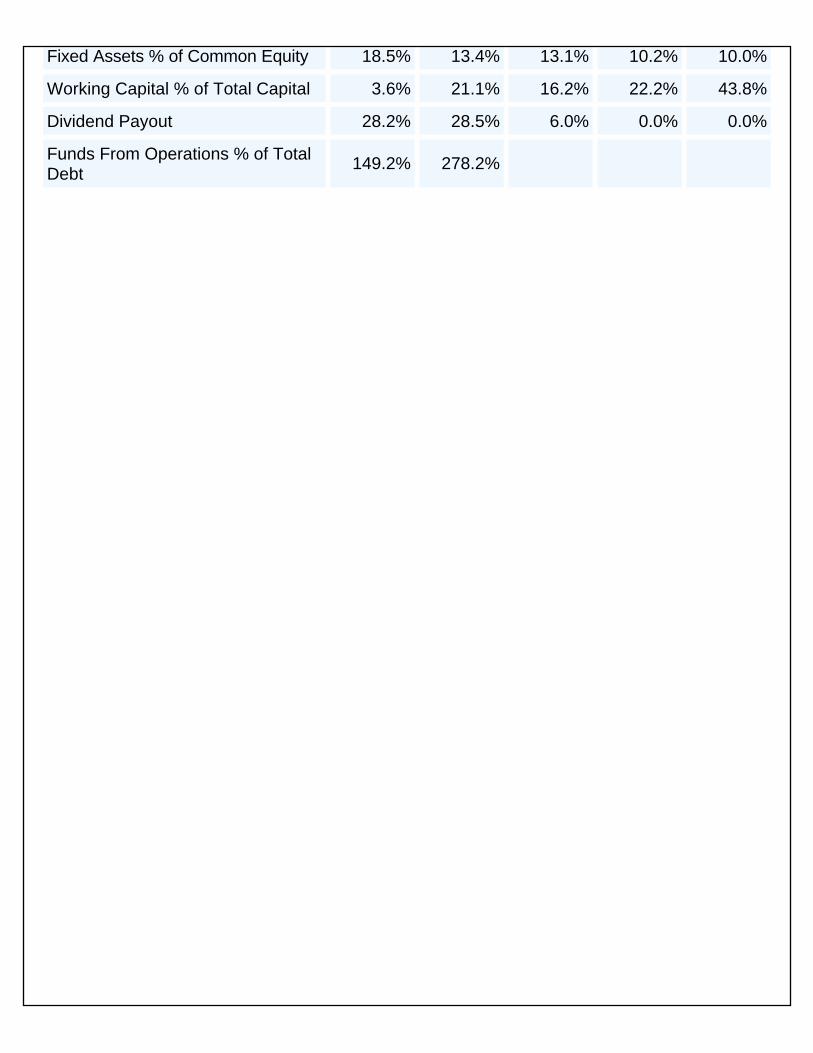
Fixed Assets % of Common Equity 18.5% 13.4% 13.1% 10.2% 10.0%
Working Capital % of Total Capital 3.6% 21.1% 16.2% 22.2% 43.8%
Dividend Payout 28.2% 28.5% 6.0% 0.0% 0.0%
Funds From Operations % of Total Debt
149.2% 278.2%
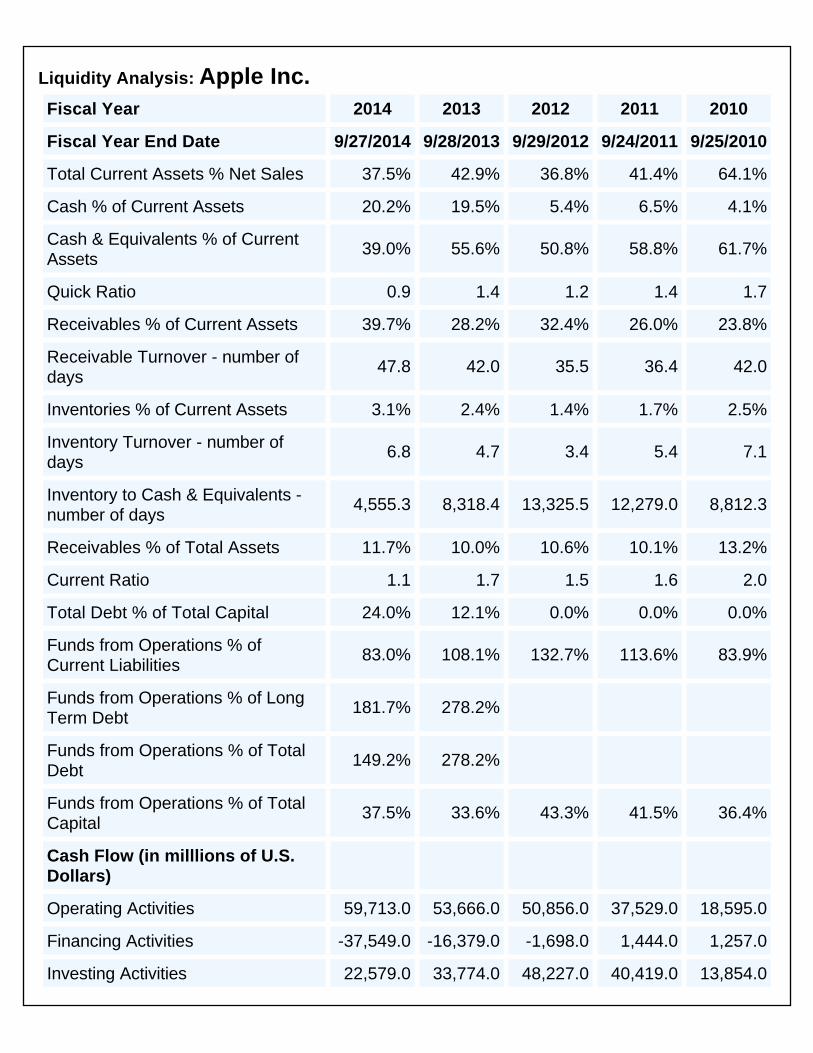
Financial Ratio Analyses\Liquidity Analysis
Liquidity Analysis: Apple Inc. Fiscal Year 2014 2013 2012 2011 2010
Fiscal Year End Date 9/27/2014 9/28/2013 9/29/2012 9/24/2011 9/25/2010
Total Current Assets % Net Sales 37.5% 42.9% 36.8% 41.4% 64.1%
Cash % of Current Assets 20.2% 19.5% 5.4% 6.5% 4.1%
Cash & Equivalents % of Current Assets
39.0% 55.6% 50.8% 58.8% 61.7%
Quick Ratio 0.9 1.4 1.2 1.4 1.7
Receivables % of Current Assets 39.7% 28.2% 32.4% 26.0% 23.8%
Receivable Turnover - number of days
47.8 42.0 35.5 36.4 42.0
Inventories % of Current Assets 3.1% 2.4% 1.4% 1.7% 2.5%
Inventory Turnover - number of days
6.8 4.7 3.4 5.4 7.1
Inventory to Cash & Equivalents - number of days
4,555.3 8,318.4 13,325.5 12,279.0 8,812.3
Receivables % of Total Assets 11.7% 10.0% 10.6% 10.1% 13.2%
Current Ratio 1.1 1.7 1.5 1.6 2.0
Total Debt % of Total Capital 24.0% 12.1% 0.0% 0.0% 0.0%
Funds from Operations % of Current Liabilities
83.0% 108.1% 132.7% 113.6% 83.9%
Funds from Operations % of Long Term Debt
181.7% 278.2%
Funds from Operations % of Total Debt
149.2% 278.2%
Funds from Operations % of Total Capital
37.5% 33.6% 43.3% 41.5% 36.4%
Cash Flow (in milllions of U.S. Dollars)
Operating Activities 59,713.0 53,666.0 50,856.0 37,529.0 18,595.0
Financing Activities -37,549.0 -16,379.0 -1,698.0 1,444.0 1,257.0
Investing Activities 22,579.0 33,774.0 48,227.0 40,419.0 13,854.0
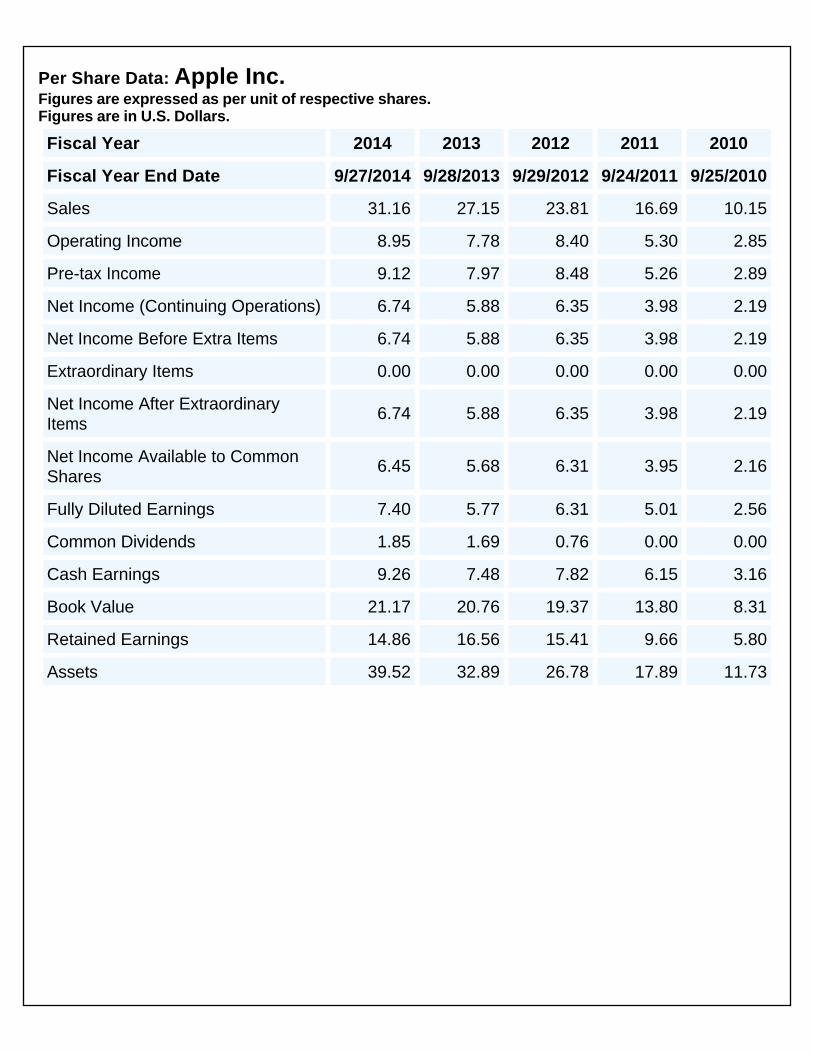
Financial Ratio Analyses\Per-Share Ratios
Per Share Data: Apple Inc. Figures are expressed as per unit of respective shares. Figures are in U.S. Dollars.
Fiscal Year 2014 2013 2012 2011 2010
Fiscal Year End Date 9/27/2014 9/28/2013 9/29/2012 9/24/2011 9/25/2010
Sales 31.16 27.15 23.81 16.69 10.15
Operating Income 8.95 7.78 8.40 5.30 2.85
Pre-tax Income 9.12 7.97 8.48 5.26 2.89
Net Income (Continuing Operations) 6.74 5.88 6.35 3.98 2.19
Net Income Before Extra Items 6.74 5.88 6.35 3.98 2.19
Extraordinary Items 0.00 0.00 0.00 0.00 0.00
Net Income After Extraordinary Items
6.74 5.88 6.35 3.98 2.19
Net Income Available to Common Shares
6.45 5.68 6.31 3.95 2.16
Fully Diluted Earnings 7.40 5.77 6.31 5.01 2.56
Common Dividends 1.85 1.69 0.76 0.00 0.00
Cash Earnings 9.26 7.48 7.82 6.15 3.16
Book Value 21.17 20.76 19.37 13.80 8.31
Retained Earnings 14.86 16.56 15.41 9.66 5.80
Assets 39.52 32.89 26.78 17.89 11.73
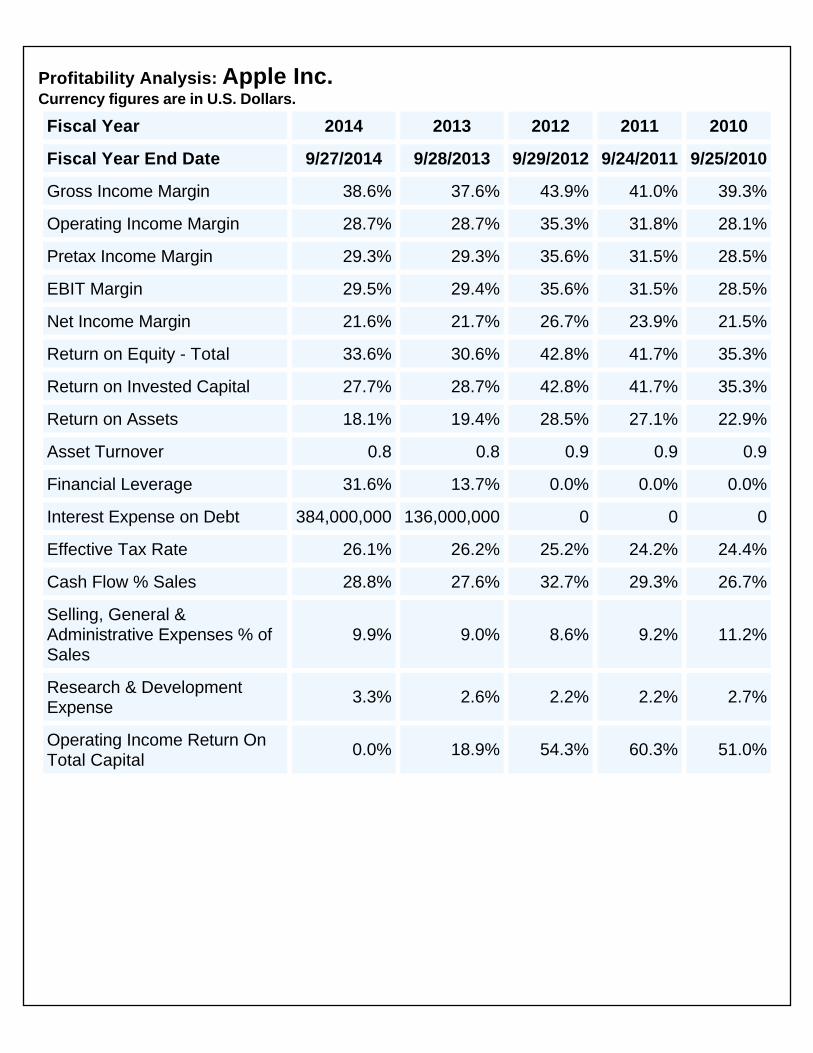
Financial Ratio Analyses\Profitability Growth
Profitability Analysis: Apple Inc. Currency figures are in U.S. Dollars.
Fiscal Year 2014 2013 2012 2011 2010
Fiscal Year End Date 9/27/2014 9/28/2013 9/29/2012 9/24/2011 9/25/2010
Gross Income Margin 38.6% 37.6% 43.9% 41.0% 39.3%
Operating Income Margin 28.7% 28.7% 35.3% 31.8% 28.1%
Pretax Income Margin 29.3% 29.3% 35.6% 31.5% 28.5%
EBIT Margin 29.5% 29.4% 35.6% 31.5% 28.5%
Net Income Margin 21.6% 21.7% 26.7% 23.9% 21.5%
Return on Equity - Total 33.6% 30.6% 42.8% 41.7% 35.3%
Return on Invested Capital 27.7% 28.7% 42.8% 41.7% 35.3%
Return on Assets 18.1% 19.4% 28.5% 27.1% 22.9%
Asset Turnover 0.8 0.8 0.9 0.9 0.9
Financial Leverage 31.6% 13.7% 0.0% 0.0% 0.0%
Interest Expense on Debt 384,000,000 136,000,000 0 0 0
Effective Tax Rate 26.1% 26.2% 25.2% 24.2% 24.4%
Cash Flow % Sales 28.8% 27.6% 32.7% 29.3% 26.7%
Selling, General & Administrative Expenses % of Sales
9.9% 9.0% 8.6% 9.2% 11.2%
Research & Development Expense
3.3% 2.6% 2.2% 2.2% 2.7%
Operating Income Return On Total Capital
0.0% 18.9% 54.3% 60.3% 51.0%
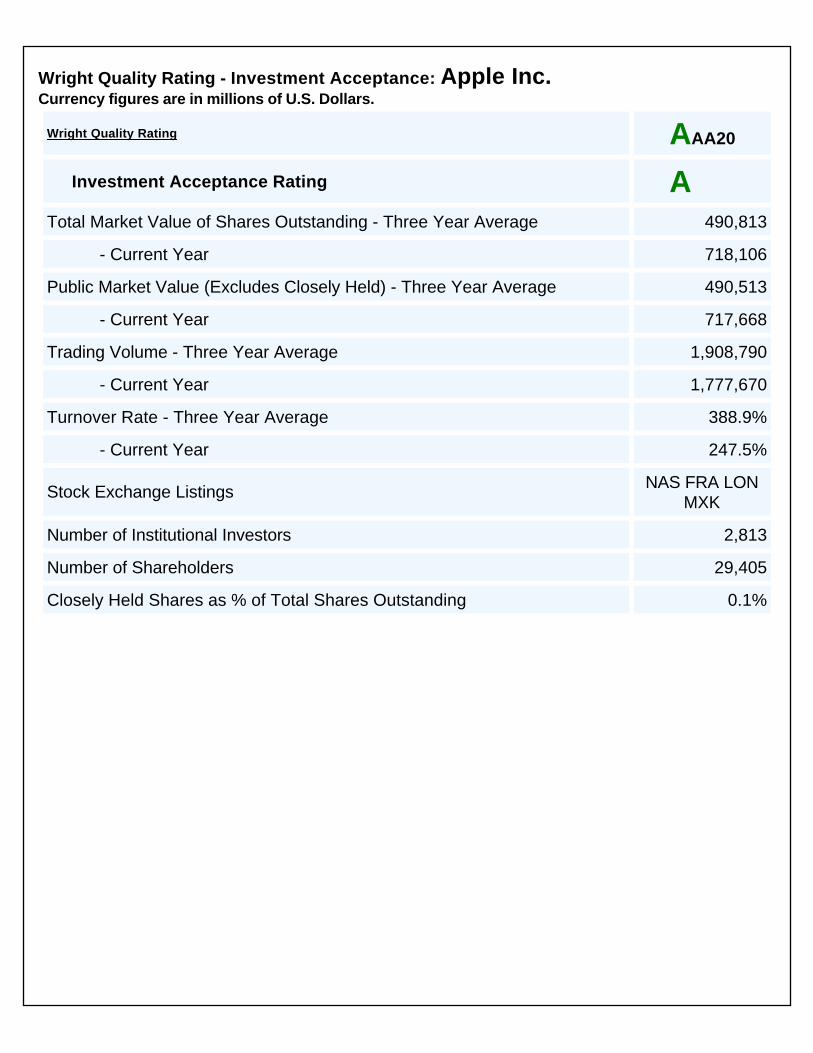
Wright Quality Rating AnalysesWright Quality Rating Analyses\Investment Acceptance
Wright Quality Rating - Investment Acceptance: Apple Inc. Currency figures are in millions of U.S. Dollars.
Wright Quality Rating AAA20
Investment Acceptance Rating AAA20
Total Market Value of Shares Outstanding - Three Year Average 490,813
- Current Year 718,106
Public Market Value (Excludes Closely Held) - Three Year Average 490,513
- Current Year 717,668
Trading Volume - Three Year Average 1,908,790
- Current Year 1,777,670
Turnover Rate - Three Year Average 388.9%
- Current Year 247.5%
Stock Exchange Listings NAS FRA LON MXK
Number of Institutional Investors 2,813
Number of Shareholders 29,405
Closely Held Shares as % of Total Shares Outstanding 0.1%
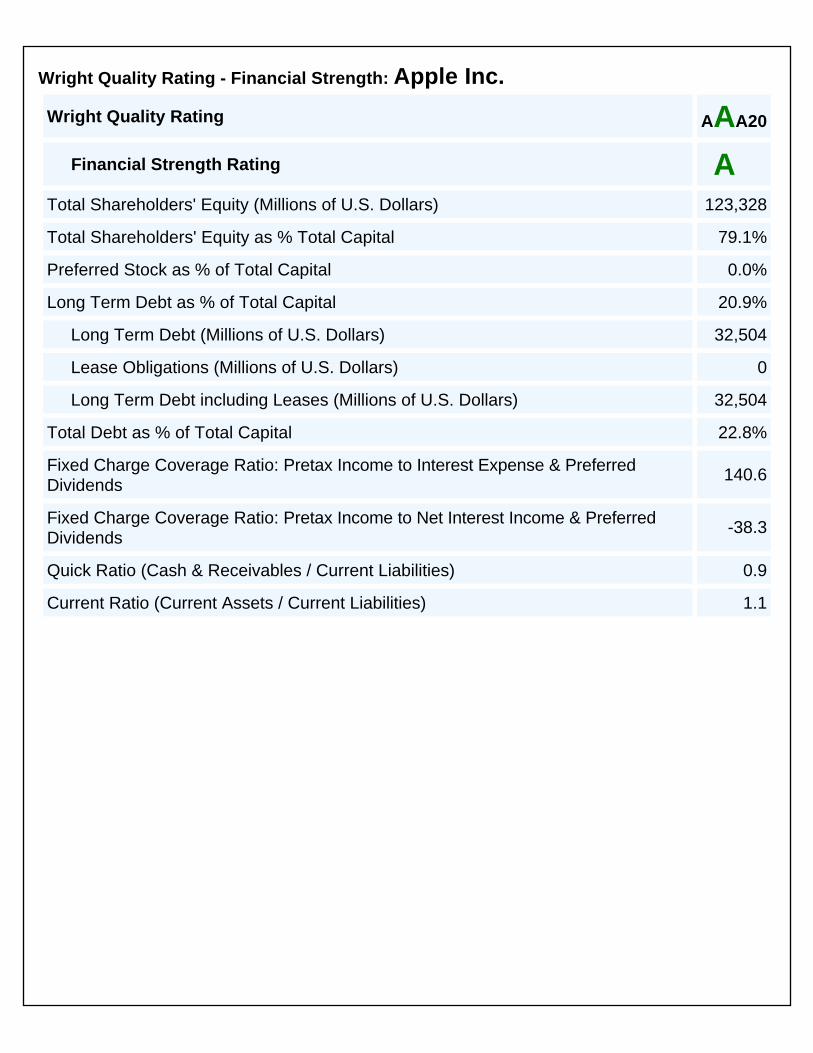
Wright Quality Rating Analyses\Financial Strength
Wright Quality Rating - Financial Strength: Apple Inc.
Wright Quality Rating AAA20
Financial Strength Rating AAA20
Total Shareholders' Equity (Millions of U.S. Dollars) 123,328
Total Shareholders' Equity as % Total Capital 79.1%
Preferred Stock as % of Total Capital 0.0%
Long Term Debt as % of Total Capital 20.9%
Long Term Debt (Millions of U.S. Dollars) 32,504
Lease Obligations (Millions of U.S. Dollars) 0
Long Term Debt including Leases (Millions of U.S. Dollars) 32,504
Total Debt as % of Total Capital 22.8%
Fixed Charge Coverage Ratio: Pretax Income to Interest Expense & Preferred Dividends
140.6
Fixed Charge Coverage Ratio: Pretax Income to Net Interest Income & Preferred Dividends
-38.3
Quick Ratio (Cash & Receivables / Current Liabilities) 0.9
Current Ratio (Current Assets / Current Liabilities) 1.1
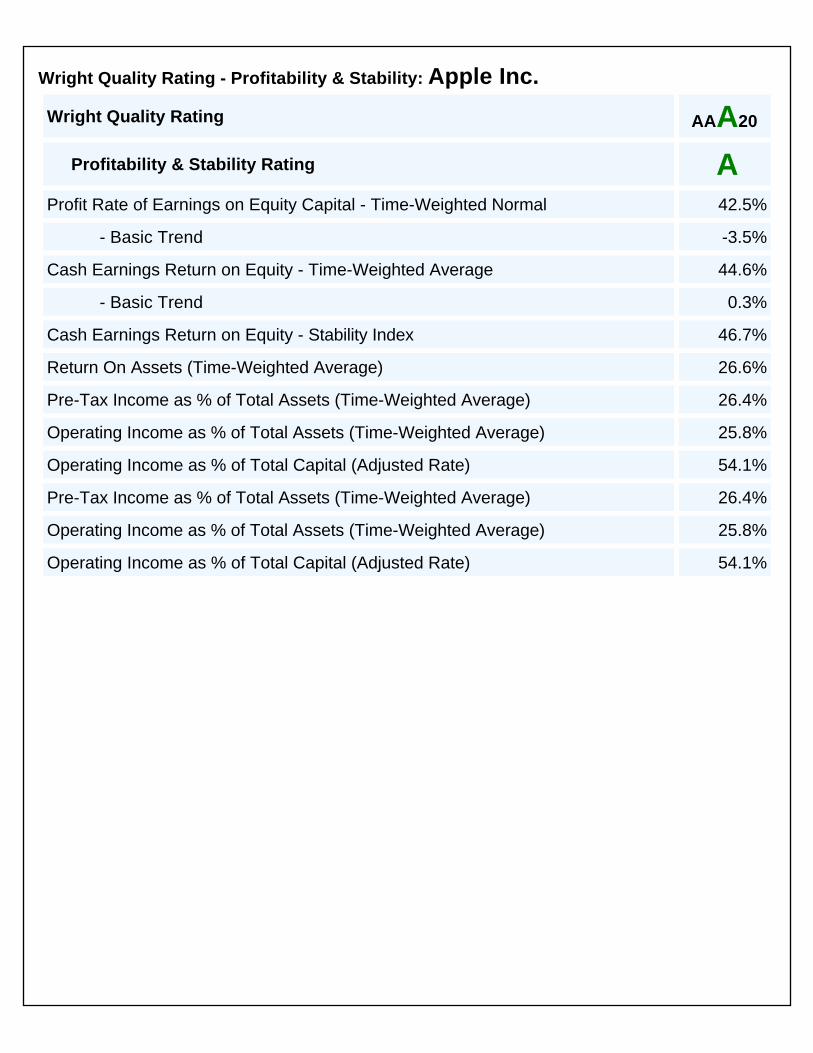
Wright Quality Rating Analyses\Profitability & Stability
Wright Quality Rating - Profitability & Stability: Apple Inc.
Wright Quality Rating AAA20
Profitability & Stability Rating AAA20
Profit Rate of Earnings on Equity Capital - Time-Weighted Normal 42.5%
- Basic Trend -3.5%
Cash Earnings Return on Equity - Time-Weighted Average 44.6%
- Basic Trend 0.3%
Cash Earnings Return on Equity - Stability Index 46.7%
Return On Assets (Time-Weighted Average) 26.6%
Pre-Tax Income as % of Total Assets (Time-Weighted Average) 26.4%
Operating Income as % of Total Assets (Time-Weighted Average) 25.8%
Operating Income as % of Total Capital (Adjusted Rate) 54.1%
Pre-Tax Income as % of Total Assets (Time-Weighted Average) 26.4%
Operating Income as % of Total Assets (Time-Weighted Average) 25.8%
Operating Income as % of Total Capital (Adjusted Rate) 54.1%
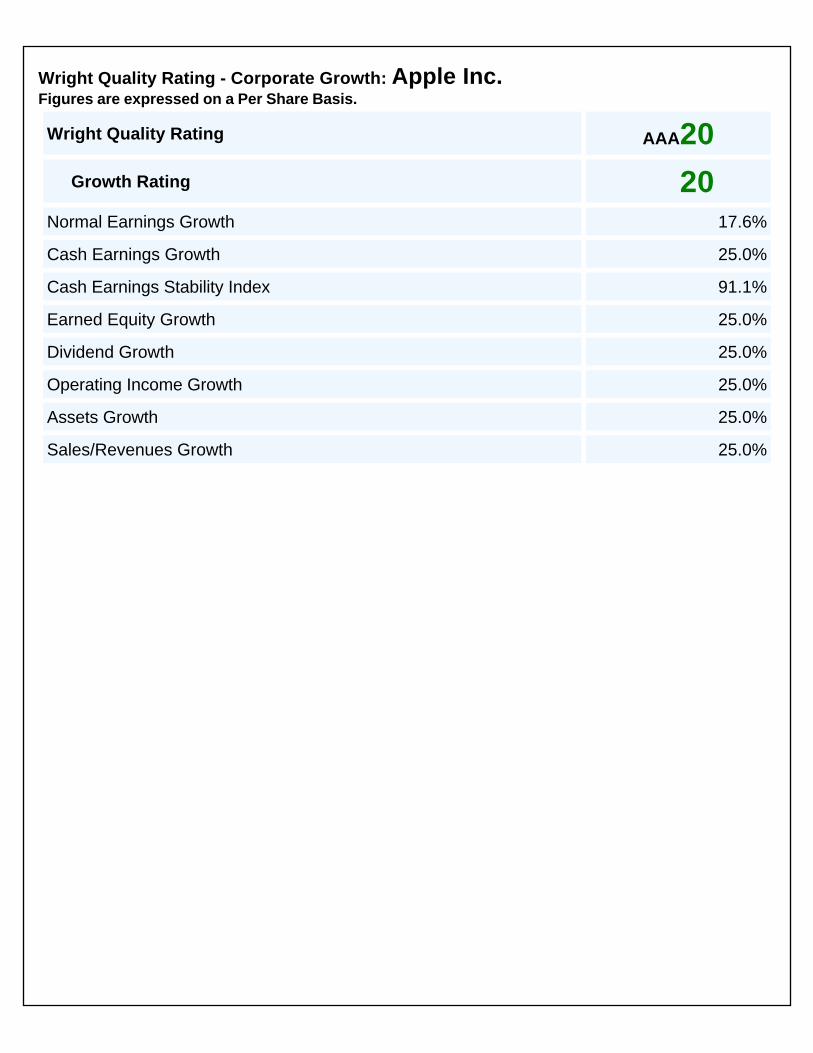
Wright Quality Rating Analyses\Corporate Growth
Wright Quality Rating - Corporate Growth: Apple Inc. Figures are expressed on a Per Share Basis.
Wright Quality Rating AAA20 Growth Rating AAA20Normal Earnings Growth 17.6%
Cash Earnings Growth 25.0%
Cash Earnings Stability Index 91.1%
Earned Equity Growth 25.0%
Dividend Growth 25.0%
Operating Income Growth 25.0%
Assets Growth 25.0%
Sales/Revenues Growth 25.0%
Industry OverviewIndustry Overview\Wright Industry Averages - Overview
Wright Industry Averages Reports
Introduction
The following pages are comprised of seven reports which contain averages for the companies in the Computers & Peripherals (Global) sector. The primary source of the data contained in these reports is the Worldscope® Database. The “averages” reports are compiled from the fundamental data compiled on the companies which make up this industry.
Industry Averages - Report Types
● Sales Analysis ● Income Statement ● Balance Sheet ● Sources of Capital ● Leverage Analysis Ratios ● Per Share Data Ratios ● Profitability Analysis Ratios
The Wright Industry Averages Reports are compiled on a fiscal year basis. Companies ending their fiscal year in January are grouped with the prior year’s reports. The values for 2012 for example are contributed by those companies that ended their fiscal year after 31 January 2012 and prior to 1 February 2013. The values shown for all reports are presented in U.S. dollars.
Data Compilation Steps
All companies in the industry with more than $1 million (U.S.) in net sales were included. Currency items in the financial statements were converted to U.S. dollars using an average exchange rate for each fiscal year. A sum (aggregate value) was computed for all financial statement items by totaling the values reported by each company in the industry sector. Industry Average report values were computed by dividing the aggregate value by the number of companies reporting.
Per share ratios were computed by using in the numerator a specific value that represents the aggregate sum for all companies in the industry divided by the aggregate value of the average number of appropriate common shares for each company.
Most companies in the industry reported Operating Income along with the major components that go into the calculation of Operating Income. For the minority of companies that did not report all underlying cost components those components were derived, where possible, utilizing the reported items. For example, if Cost of Goods Sold was not reported it was derived on a company-specific basis from the other reported items (i.e. Sales, Gross Income and Depreciation, Depletion & Amortization). The derived value was then included in the calculation of the industry average.
Industry Financial Statement AnalysesIndustry Financial Statement Analyses\Summary Analysis
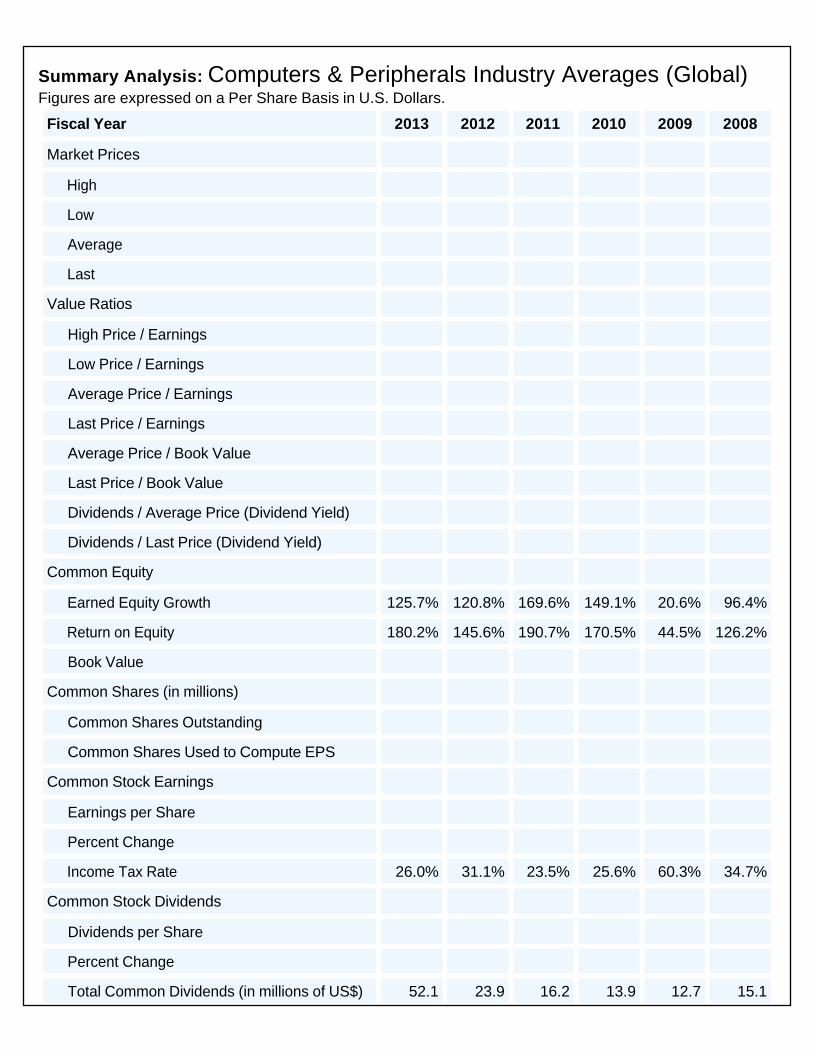
Summary Analysis: Computers & Peripherals Industry Averages (Global) Figures are expressed on a Per Share Basis in U.S. Dollars.
Fiscal Year 2013 2012 2011 2010 2009 2008
Market Prices
High
Low
Average
Last
Value Ratios
High Price / Earnings
Low Price / Earnings
Average Price / Earnings
Last Price / Earnings
Average Price / Book Value
Last Price / Book Value
Dividends / Average Price (Dividend Yield)
Dividends / Last Price (Dividend Yield)
Common Equity
Earned Equity Growth 125.7% 120.8% 169.6% 149.1% 20.6% 96.4%
Return on Equity 180.2% 145.6% 190.7% 170.5% 44.5% 126.2%
Book Value
Common Shares (in millions)
Common Shares Outstanding
Common Shares Used to Compute EPS
Common Stock Earnings
Earnings per Share
Percent Change
Income Tax Rate 26.0% 31.1% 23.5% 25.6% 60.3% 34.7%
Common Stock Dividends
Dividends per Share
Percent Change
Total Common Dividends (in millions of US$) 52.1 23.9 16.2 13.9 12.7 15.1
Dividends / Earnings (% Payout)
Capital Expenditure (in millions of US$)
Sales
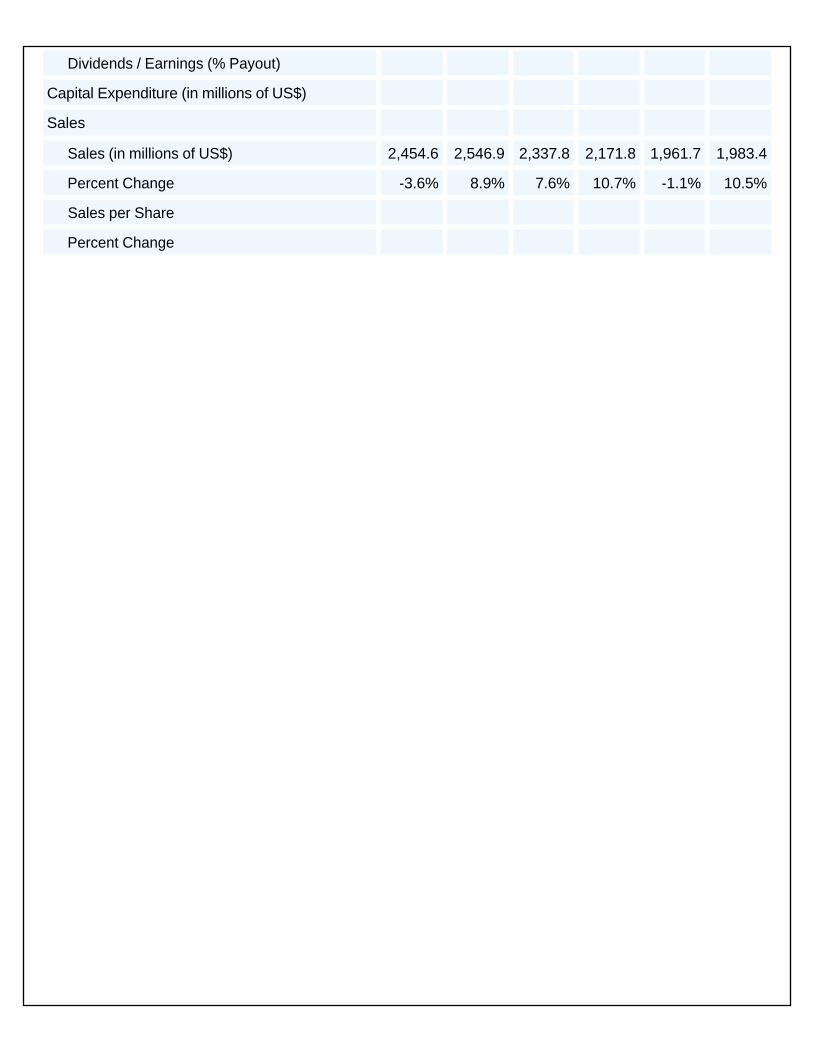
Sales (in millions of US$) 2,454.6 2,546.9 2,337.8 2,171.8 1,961.7 1,983.4
Percent Change -3.6% 8.9% 7.6% 10.7% -1.1% 10.5%
Sales per Share
Percent Change
Industry Financial Statement Analyses\Sales Analysis
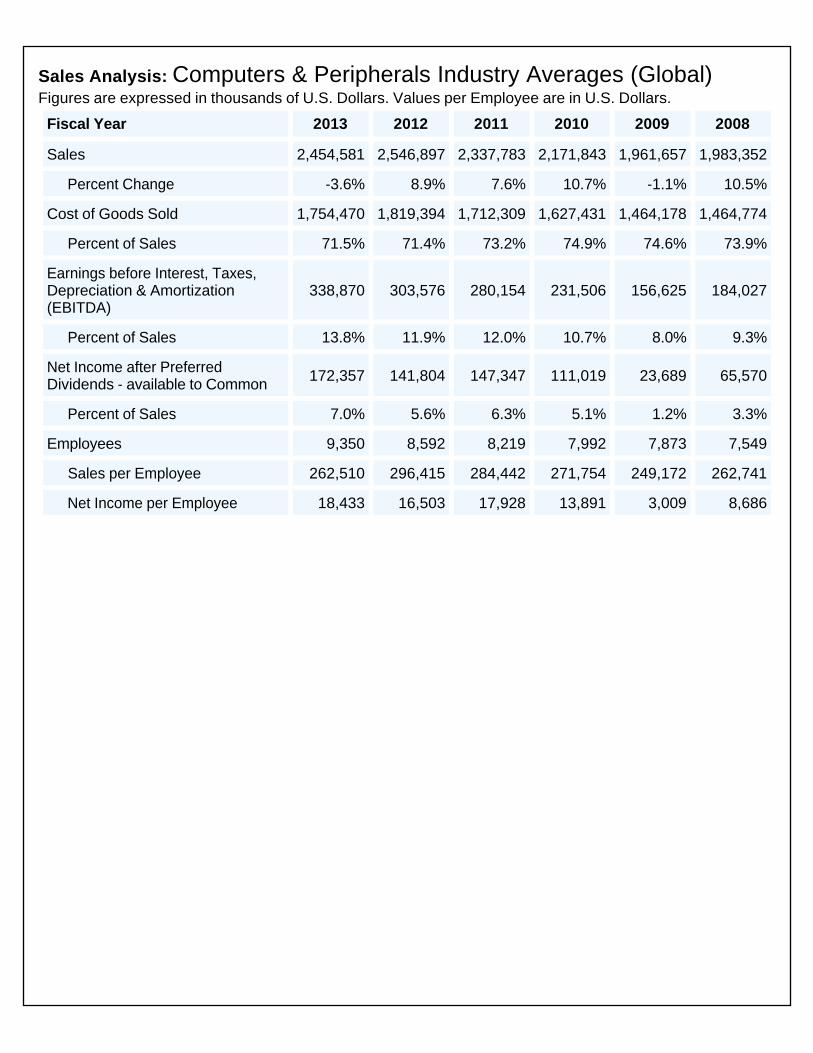
Sales Analysis: Computers & Peripherals Industry Averages (Global) Figures are expressed in thousands of U.S. Dollars. Values per Employee are in U.S. Dollars.
Fiscal Year 2013 2012 2011 2010 2009 2008
Sales 2,454,581 2,546,897 2,337,783 2,171,843 1,961,657 1,983,352
Percent Change -3.6% 8.9% 7.6% 10.7% -1.1% 10.5%
Cost of Goods Sold 1,754,470 1,819,394 1,712,309 1,627,431 1,464,178 1,464,774
Percent of Sales 71.5% 71.4% 73.2% 74.9% 74.6% 73.9%
Earnings before Interest, Taxes, Depreciation & Amortization (EBITDA)
338,870 303,576 280,154 231,506 156,625 184,027
Percent of Sales 13.8% 11.9% 12.0% 10.7% 8.0% 9.3%
Net Income after Preferred Dividends - available to Common 172,357 141,804 147,347 111,019 23,689 65,570
Percent of Sales 7.0% 5.6% 6.3% 5.1% 1.2% 3.3%
Employees 9,350 8,592 8,219 7,992 7,873 7,549
Sales per Employee 262,510 296,415 284,442 271,754 249,172 262,741
Net Income per Employee 18,433 16,503 17,928 13,891 3,009 8,686
Industry Financial Statement Analyses\Income Statement
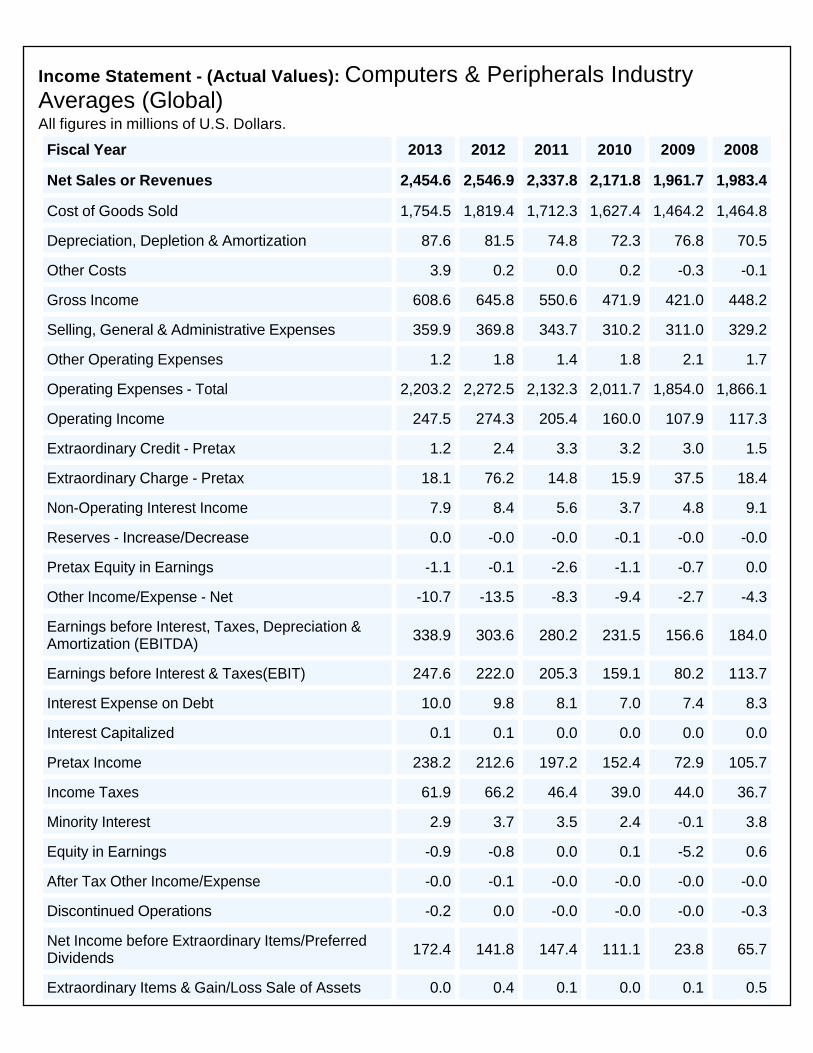
Income Statement - (Actual Values): Computers & Peripherals Industry Averages (Global) All figures in millions of U.S. Dollars.
Fiscal Year 2013 2012 2011 2010 2009 2008
Net Sales or Revenues 2,454.6 2,546.9 2,337.8 2,171.8 1,961.7 1,983.4
Cost of Goods Sold 1,754.5 1,819.4 1,712.3 1,627.4 1,464.2 1,464.8
Depreciation, Depletion & Amortization 87.6 81.5 74.8 72.3 76.8 70.5
Other Costs 3.9 0.2 0.0 0.2 -0.3 -0.1
Gross Income 608.6 645.8 550.6 471.9 421.0 448.2
Selling, General & Administrative Expenses 359.9 369.8 343.7 310.2 311.0 329.2
Other Operating Expenses 1.2 1.8 1.4 1.8 2.1 1.7
Operating Expenses - Total 2,203.2 2,272.5 2,132.3 2,011.7 1,854.0 1,866.1
Operating Income 247.5 274.3 205.4 160.0 107.9 117.3
Extraordinary Credit - Pretax 1.2 2.4 3.3 3.2 3.0 1.5
Extraordinary Charge - Pretax 18.1 76.2 14.8 15.9 37.5 18.4
Non-Operating Interest Income 7.9 8.4 5.6 3.7 4.8 9.1
Reserves - Increase/Decrease 0.0 -0.0 -0.0 -0.1 -0.0 -0.0
Pretax Equity in Earnings -1.1 -0.1 -2.6 -1.1 -0.7 0.0
Other Income/Expense - Net -10.7 -13.5 -8.3 -9.4 -2.7 -4.3
Earnings before Interest, Taxes, Depreciation & Amortization (EBITDA) 338.9 303.6 280.2 231.5 156.6 184.0
Earnings before Interest & Taxes(EBIT) 247.6 222.0 205.3 159.1 80.2 113.7
Interest Expense on Debt 10.0 9.8 8.1 7.0 7.4 8.3
Interest Capitalized 0.1 0.1 0.0 0.0 0.0 0.0
Pretax Income 238.2 212.6 197.2 152.4 72.9 105.7
Income Taxes 61.9 66.2 46.4 39.0 44.0 36.7
Minority Interest 2.9 3.7 3.5 2.4 -0.1 3.8
Equity in Earnings -0.9 -0.8 0.0 0.1 -5.2 0.6
After Tax Other Income/Expense -0.0 -0.1 -0.0 -0.0 -0.0 -0.0
Discontinued Operations -0.2 0.0 -0.0 -0.0 -0.0 -0.3
Net Income before Extraordinary Items/Preferred Dividends 172.4 141.8 147.4 111.1 23.8 65.7
Extraordinary Items & Gain/Loss Sale of Assets 0.0 0.4 0.1 0.0 0.1 0.5
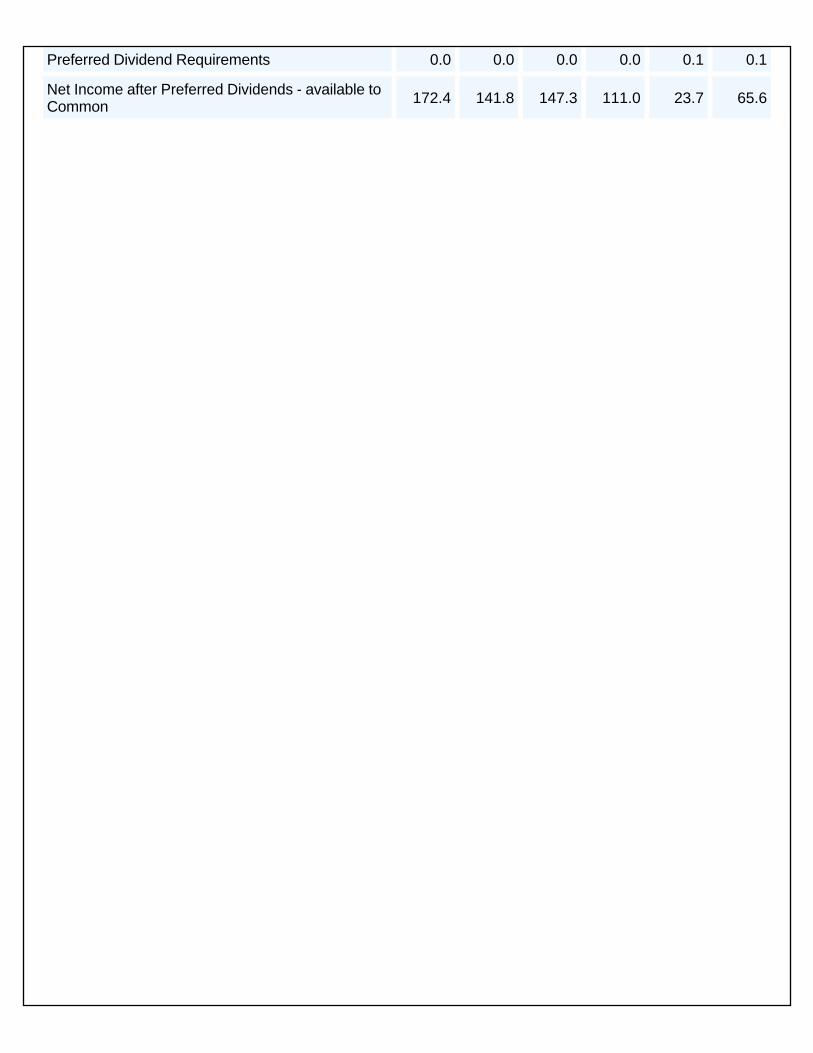
Preferred Dividend Requirements 0.0 0.0 0.0 0.0 0.1 0.1
Net Income after Preferred Dividends - available to Common 172.4 141.8 147.3 111.0 23.7 65.6
Industry Financial Statement Analyses\Balance Sheet
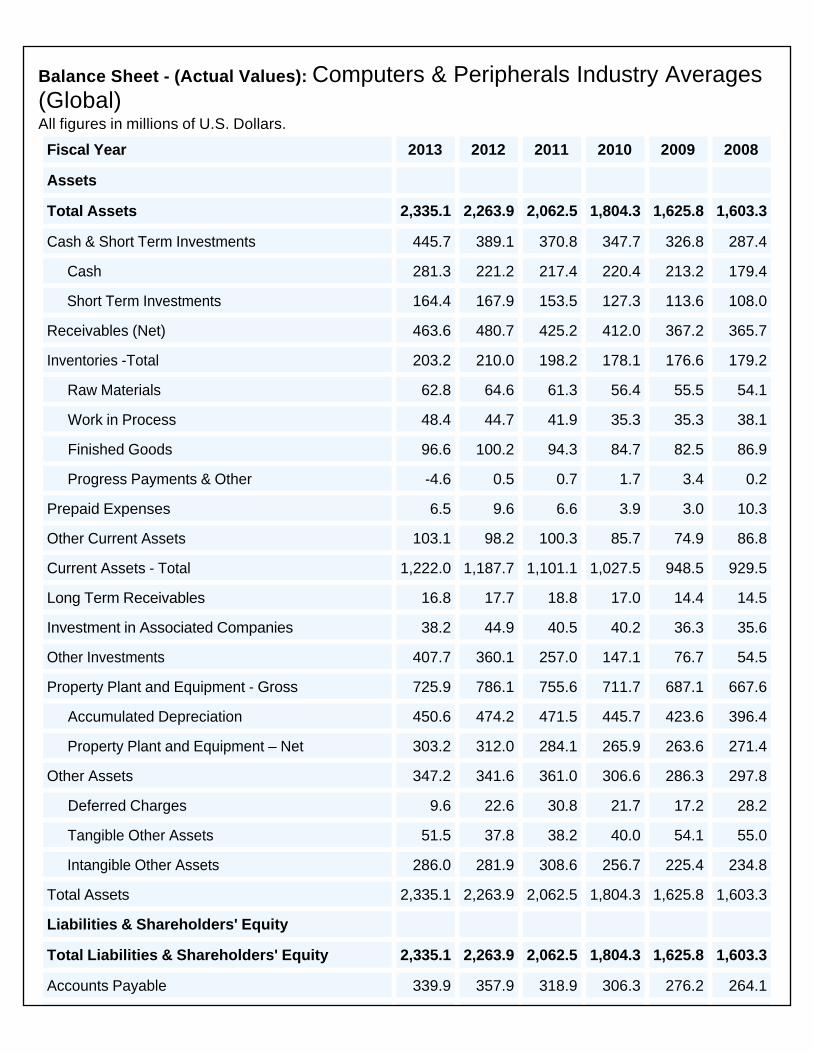
Balance Sheet - (Actual Values): Computers & Peripherals Industry Averages (Global) All figures in millions of U.S. Dollars.
Fiscal Year 2013 2012 2011 2010 2009 2008
Assets
Total Assets 2,335.1 2,263.9 2,062.5 1,804.3 1,625.8 1,603.3
Cash & Short Term Investments 445.7 389.1 370.8 347.7 326.8 287.4
Cash 281.3 221.2 217.4 220.4 213.2 179.4
Short Term Investments 164.4 167.9 153.5 127.3 113.6 108.0
Receivables (Net) 463.6 480.7 425.2 412.0 367.2 365.7
Inventories -Total 203.2 210.0 198.2 178.1 176.6 179.2
Raw Materials 62.8 64.6 61.3 56.4 55.5 54.1
Work in Process 48.4 44.7 41.9 35.3 35.3 38.1
Finished Goods 96.6 100.2 94.3 84.7 82.5 86.9
Progress Payments & Other -4.6 0.5 0.7 1.7 3.4 0.2
Prepaid Expenses 6.5 9.6 6.6 3.9 3.0 10.3
Other Current Assets 103.1 98.2 100.3 85.7 74.9 86.8
Current Assets - Total 1,222.0 1,187.7 1,101.1 1,027.5 948.5 929.5
Long Term Receivables 16.8 17.7 18.8 17.0 14.4 14.5
Investment in Associated Companies 38.2 44.9 40.5 40.2 36.3 35.6
Other Investments 407.7 360.1 257.0 147.1 76.7 54.5
Property Plant and Equipment - Gross 725.9 786.1 755.6 711.7 687.1 667.6
Accumulated Depreciation 450.6 474.2 471.5 445.7 423.6 396.4
Property Plant and Equipment – Net 303.2 312.0 284.1 265.9 263.6 271.4
Other Assets 347.2 341.6 361.0 306.6 286.3 297.8
Deferred Charges 9.6 22.6 30.8 21.7 17.2 28.2
Tangible Other Assets 51.5 37.8 38.2 40.0 54.1 55.0
Intangible Other Assets 286.0 281.9 308.6 256.7 225.4 234.8
Total Assets 2,335.1 2,263.9 2,062.5 1,804.3 1,625.8 1,603.3
Liabilities & Shareholders' Equity
Total Liabilities & Shareholders' Equity 2,335.1 2,263.9 2,062.5 1,804.3 1,625.8 1,603.3
Accounts Payable 339.9 357.9 318.9 306.3 276.2 264.1
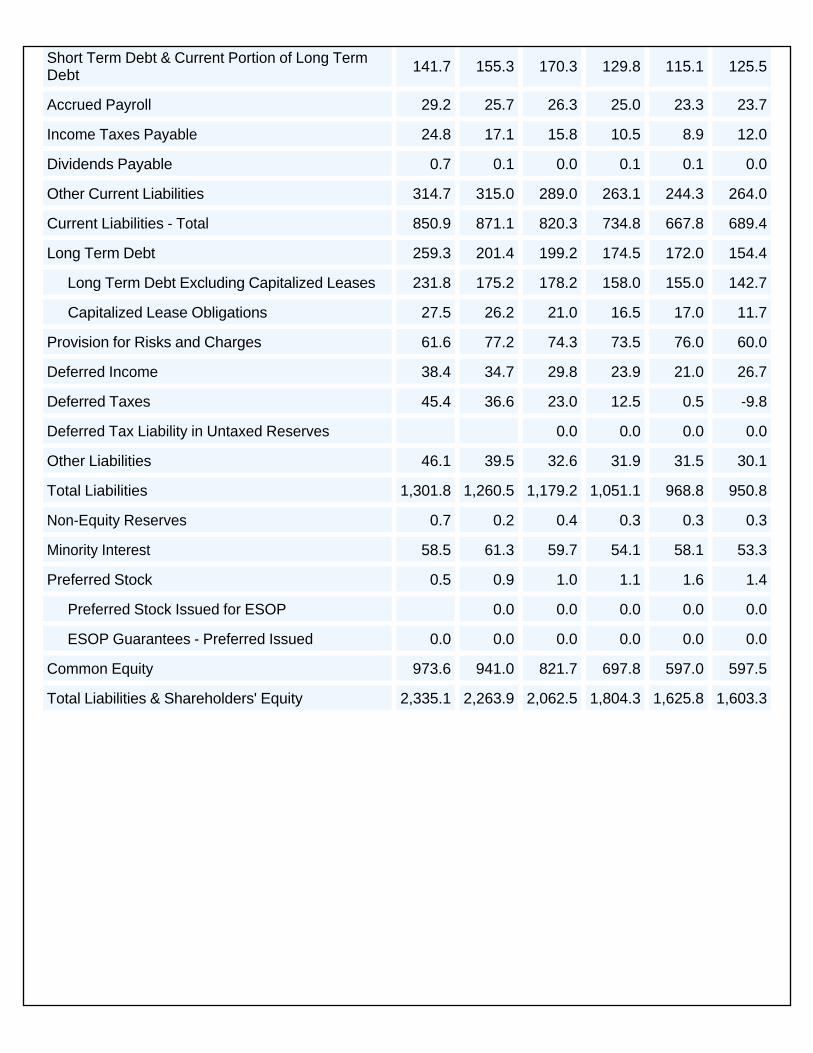
Short Term Debt & Current Portion of Long Term Debt 141.7 155.3 170.3 129.8 115.1 125.5
Accrued Payroll 29.2 25.7 26.3 25.0 23.3 23.7
Income Taxes Payable 24.8 17.1 15.8 10.5 8.9 12.0
Dividends Payable 0.7 0.1 0.0 0.1 0.1 0.0
Other Current Liabilities 314.7 315.0 289.0 263.1 244.3 264.0
Current Liabilities - Total 850.9 871.1 820.3 734.8 667.8 689.4
Long Term Debt 259.3 201.4 199.2 174.5 172.0 154.4
Long Term Debt Excluding Capitalized Leases 231.8 175.2 178.2 158.0 155.0 142.7
Capitalized Lease Obligations 27.5 26.2 21.0 16.5 17.0 11.7
Provision for Risks and Charges 61.6 77.2 74.3 73.5 76.0 60.0
Deferred Income 38.4 34.7 29.8 23.9 21.0 26.7
Deferred Taxes 45.4 36.6 23.0 12.5 0.5 -9.8
Deferred Tax Liability in Untaxed Reserves 0.0 0.0 0.0 0.0
Other Liabilities 46.1 39.5 32.6 31.9 31.5 30.1
Total Liabilities 1,301.8 1,260.5 1,179.2 1,051.1 968.8 950.8
Non-Equity Reserves 0.7 0.2 0.4 0.3 0.3 0.3
Minority Interest 58.5 61.3 59.7 54.1 58.1 53.3
Preferred Stock 0.5 0.9 1.0 1.1 1.6 1.4
Preferred Stock Issued for ESOP 0.0 0.0 0.0 0.0 0.0
ESOP Guarantees - Preferred Issued 0.0 0.0 0.0 0.0 0.0 0.0
Common Equity 973.6 941.0 821.7 697.8 597.0 597.5
Total Liabilities & Shareholders' Equity 2,335.1 2,263.9 2,062.5 1,804.3 1,625.8 1,603.3
Industry Financial Statement Analyses\Sources of Capital
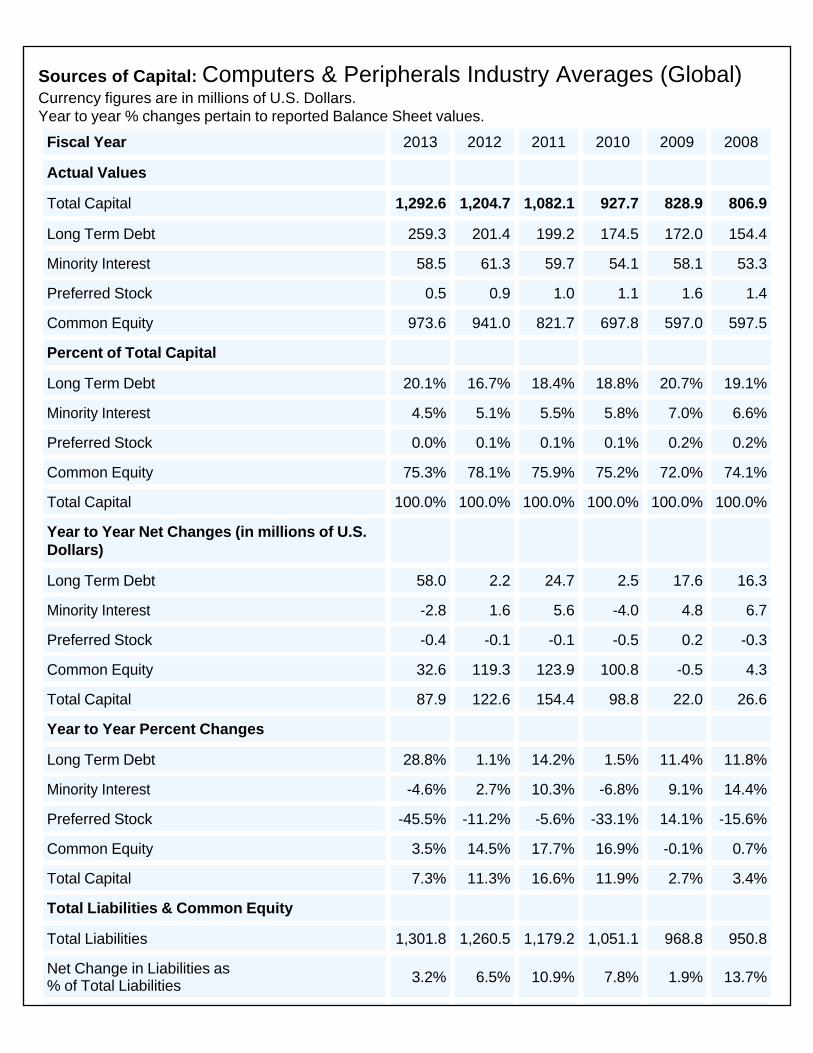
Sources of Capital: Computers & Peripherals Industry Averages (Global) Currency figures are in millions of U.S. Dollars. Year to year % changes pertain to reported Balance Sheet values.
Fiscal Year 2013 2012 2011 2010 2009 2008
Actual Values
Total Capital 1,292.6 1,204.7 1,082.1 927.7 828.9 806.9
Long Term Debt 259.3 201.4 199.2 174.5 172.0 154.4
Minority Interest 58.5 61.3 59.7 54.1 58.1 53.3
Preferred Stock 0.5 0.9 1.0 1.1 1.6 1.4
Common Equity 973.6 941.0 821.7 697.8 597.0 597.5
Percent of Total Capital
Long Term Debt 20.1% 16.7% 18.4% 18.8% 20.7% 19.1%
Minority Interest 4.5% 5.1% 5.5% 5.8% 7.0% 6.6%
Preferred Stock 0.0% 0.1% 0.1% 0.1% 0.2% 0.2%
Common Equity 75.3% 78.1% 75.9% 75.2% 72.0% 74.1%
Total Capital 100.0% 100.0% 100.0% 100.0% 100.0% 100.0%
Year to Year Net Changes (in millions of U.S. Dollars)
Long Term Debt 58.0 2.2 24.7 2.5 17.6 16.3
Minority Interest -2.8 1.6 5.6 -4.0 4.8 6.7
Preferred Stock -0.4 -0.1 -0.1 -0.5 0.2 -0.3
Common Equity 32.6 119.3 123.9 100.8 -0.5 4.3
Total Capital 87.9 122.6 154.4 98.8 22.0 26.6
Year to Year Percent Changes
Long Term Debt 28.8% 1.1% 14.2% 1.5% 11.4% 11.8%
Minority Interest -4.6% 2.7% 10.3% -6.8% 9.1% 14.4%
Preferred Stock -45.5% -11.2% -5.6% -33.1% 14.1% -15.6%
Common Equity 3.5% 14.5% 17.7% 16.9% -0.1% 0.7%
Total Capital 7.3% 11.3% 16.6% 11.9% 2.7% 3.4%
Total Liabilities & Common Equity
Total Liabilities 1,301.8 1,260.5 1,179.2 1,051.1 968.8 950.8
Net Change in Liabilities as % of Total Liabilities 3.2% 6.5% 10.9% 7.8% 1.9% 13.7%
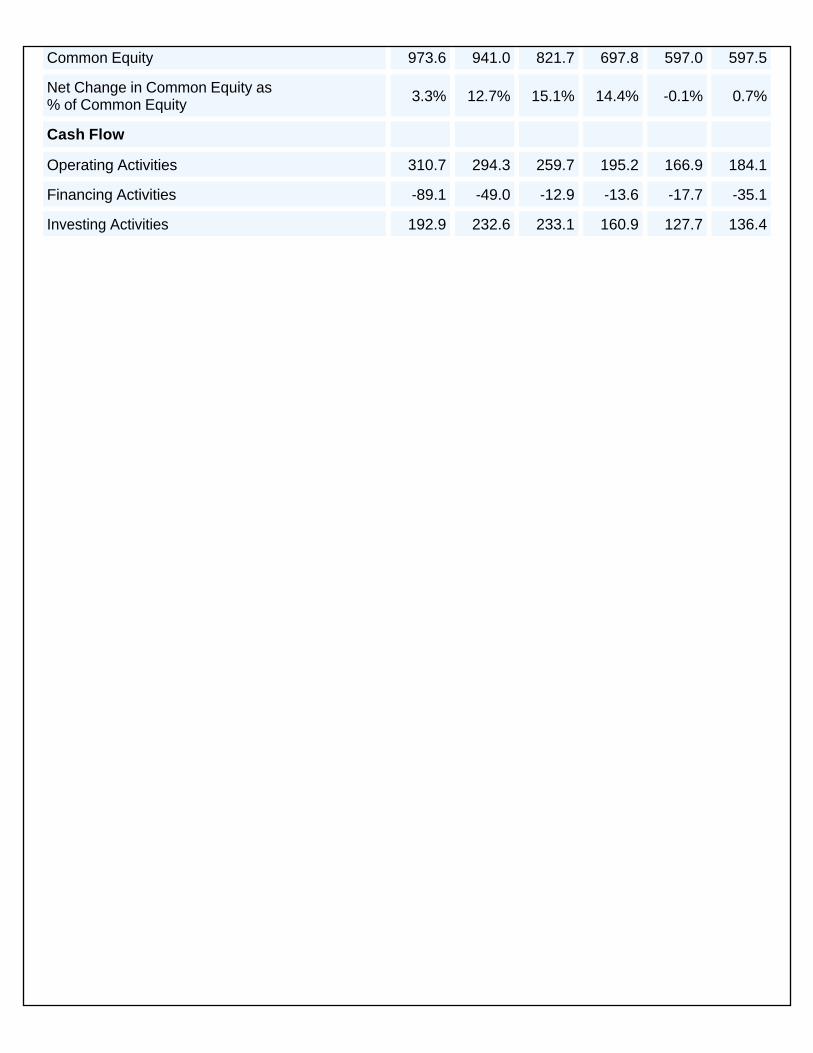
Common Equity 973.6 941.0 821.7 697.8 597.0 597.5
Net Change in Common Equity as % of Common Equity 3.3% 12.7% 15.1% 14.4% -0.1% 0.7%
Cash Flow
Operating Activities 310.7 294.3 259.7 195.2 166.9 184.1
Financing Activities -89.1 -49.0 -12.9 -13.6 -17.7 -35.1
Investing Activities 192.9 232.6 233.1 160.9 127.7 136.4
Industry Financial Ratio AnalysesIndustry Financial Ratio Analyses\Leverage Analysis
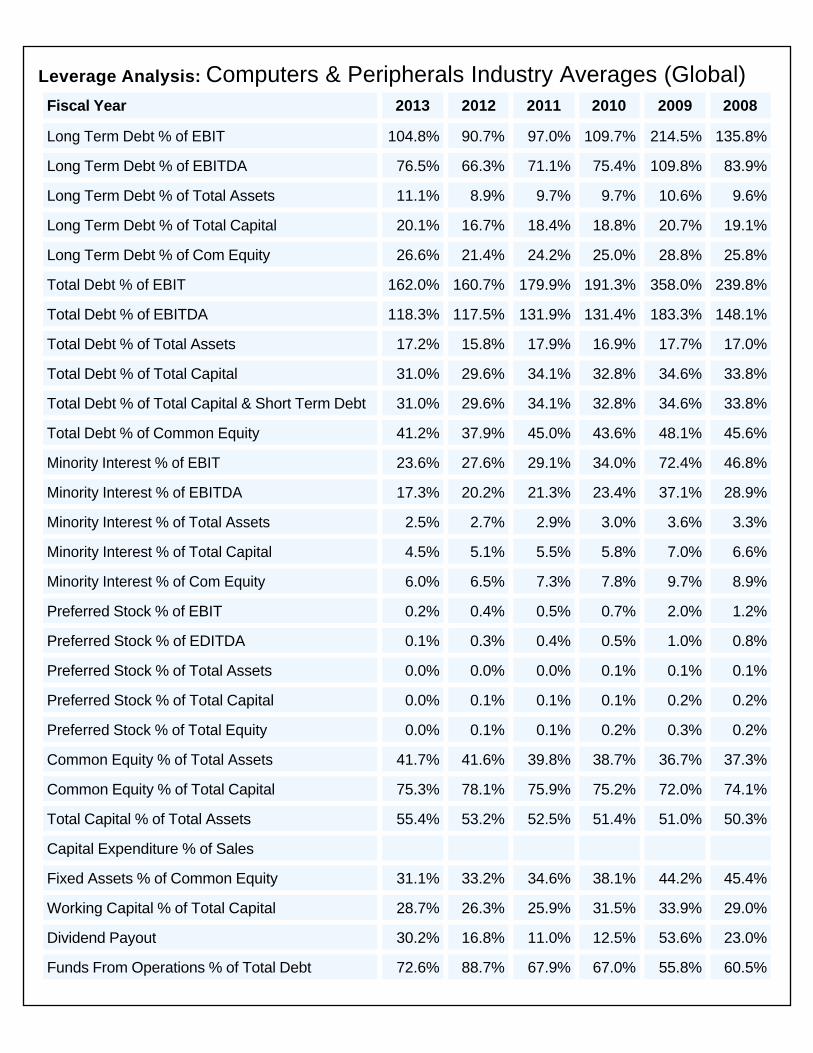
Leverage Analysis: Computers & Peripherals Industry Averages (Global)
Fiscal Year 2013 2012 2011 2010 2009 2008
Long Term Debt % of EBIT 104.8% 90.7% 97.0% 109.7% 214.5% 135.8%
Long Term Debt % of EBITDA 76.5% 66.3% 71.1% 75.4% 109.8% 83.9%
Long Term Debt % of Total Assets 11.1% 8.9% 9.7% 9.7% 10.6% 9.6%
Long Term Debt % of Total Capital 20.1% 16.7% 18.4% 18.8% 20.7% 19.1%
Long Term Debt % of Com Equity 26.6% 21.4% 24.2% 25.0% 28.8% 25.8%
Total Debt % of EBIT 162.0% 160.7% 179.9% 191.3% 358.0% 239.8%
Total Debt % of EBITDA 118.3% 117.5% 131.9% 131.4% 183.3% 148.1%
Total Debt % of Total Assets 17.2% 15.8% 17.9% 16.9% 17.7% 17.0%
Total Debt % of Total Capital 31.0% 29.6% 34.1% 32.8% 34.6% 33.8%
Total Debt % of Total Capital & Short Term Debt 31.0% 29.6% 34.1% 32.8% 34.6% 33.8%
Total Debt % of Common Equity 41.2% 37.9% 45.0% 43.6% 48.1% 45.6%
Minority Interest % of EBIT 23.6% 27.6% 29.1% 34.0% 72.4% 46.8%
Minority Interest % of EBITDA 17.3% 20.2% 21.3% 23.4% 37.1% 28.9%
Minority Interest % of Total Assets 2.5% 2.7% 2.9% 3.0% 3.6% 3.3%
Minority Interest % of Total Capital 4.5% 5.1% 5.5% 5.8% 7.0% 6.6%
Minority Interest % of Com Equity 6.0% 6.5% 7.3% 7.8% 9.7% 8.9%
Preferred Stock % of EBIT 0.2% 0.4% 0.5% 0.7% 2.0% 1.2%
Preferred Stock % of EDITDA 0.1% 0.3% 0.4% 0.5% 1.0% 0.8%
Preferred Stock % of Total Assets 0.0% 0.0% 0.0% 0.1% 0.1% 0.1%
Preferred Stock % of Total Capital 0.0% 0.1% 0.1% 0.1% 0.2% 0.2%
Preferred Stock % of Total Equity 0.0% 0.1% 0.1% 0.2% 0.3% 0.2%
Common Equity % of Total Assets 41.7% 41.6% 39.8% 38.7% 36.7% 37.3%
Common Equity % of Total Capital 75.3% 78.1% 75.9% 75.2% 72.0% 74.1%
Total Capital % of Total Assets 55.4% 53.2% 52.5% 51.4% 51.0% 50.3%
Capital Expenditure % of Sales
Fixed Assets % of Common Equity 31.1% 33.2% 34.6% 38.1% 44.2% 45.4%
Working Capital % of Total Capital 28.7% 26.3% 25.9% 31.5% 33.9% 29.0%
Dividend Payout 30.2% 16.8% 11.0% 12.5% 53.6% 23.0%
Funds From Operations % of Total Debt 72.6% 88.7% 67.9% 67.0% 55.8% 60.5%
Industry Financial Ratio Analyses\Per-Share Data
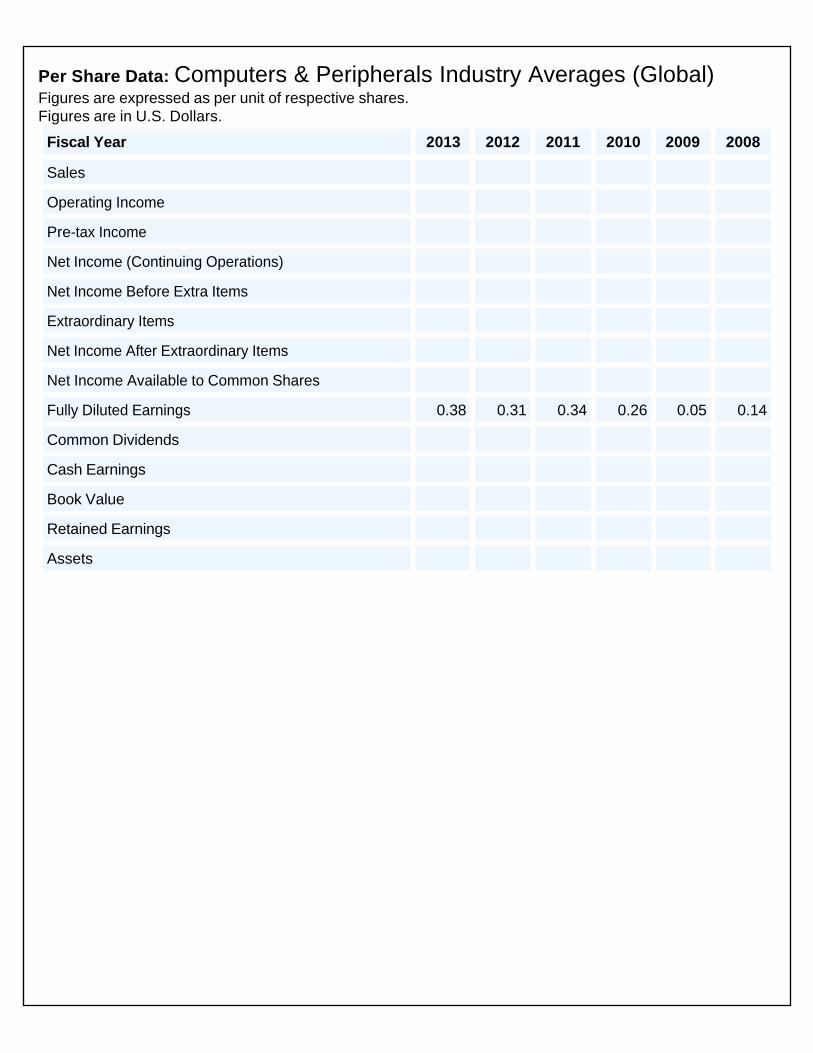
Per Share Data: Computers & Peripherals Industry Averages (Global) Figures are expressed as per unit of respective shares. Figures are in U.S. Dollars.
Fiscal Year 2013 2012 2011 2010 2009 2008
Sales
Operating Income
Pre-tax Income
Net Income (Continuing Operations)
Net Income Before Extra Items
Extraordinary Items
Net Income After Extraordinary Items
Net Income Available to Common Shares
Fully Diluted Earnings 0.38 0.31 0.34 0.26 0.05 0.14
Common Dividends
Cash Earnings
Book Value
Retained Earnings
Assets
Industry Financial Ratio Analyses\Profitability Analysis
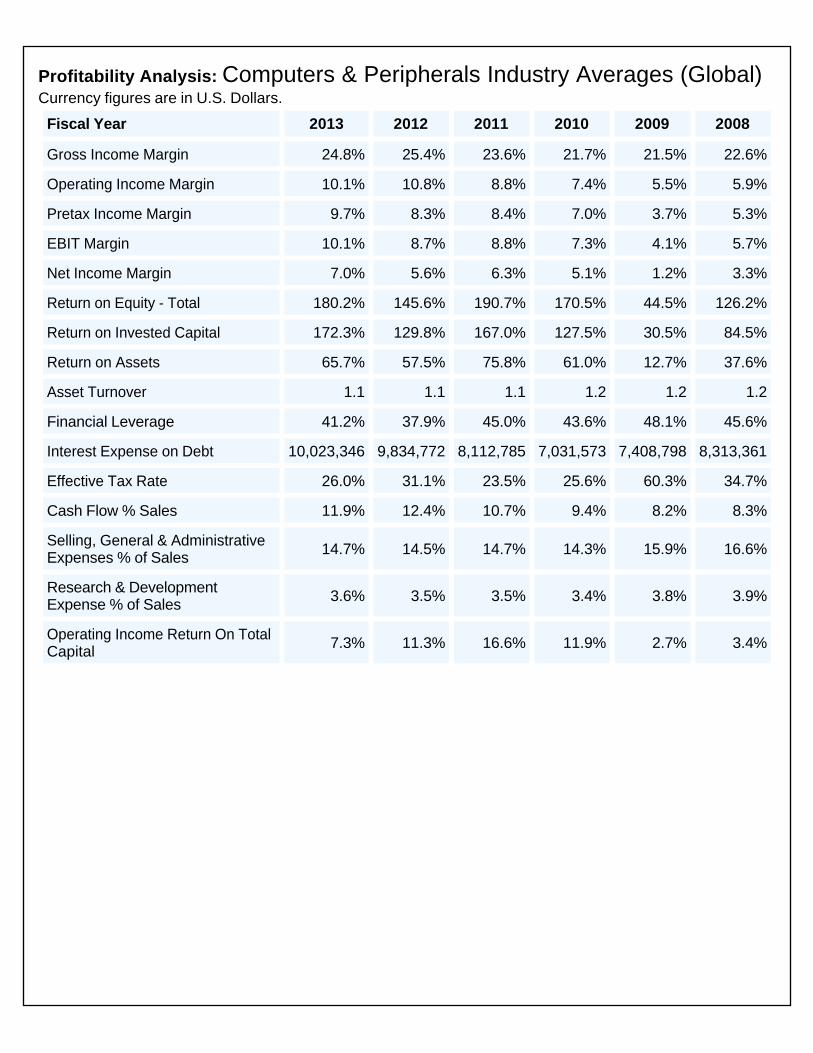
Profitability Analysis: Computers & Peripherals Industry Averages (Global) Currency figures are in U.S. Dollars.
Fiscal Year 2013 2012 2011 2010 2009 2008
Gross Income Margin 24.8% 25.4% 23.6% 21.7% 21.5% 22.6%
Operating Income Margin 10.1% 10.8% 8.8% 7.4% 5.5% 5.9%
Pretax Income Margin 9.7% 8.3% 8.4% 7.0% 3.7% 5.3%
EBIT Margin 10.1% 8.7% 8.8% 7.3% 4.1% 5.7%
Net Income Margin 7.0% 5.6% 6.3% 5.1% 1.2% 3.3%
Return on Equity - Total 180.2% 145.6% 190.7% 170.5% 44.5% 126.2%
Return on Invested Capital 172.3% 129.8% 167.0% 127.5% 30.5% 84.5%
Return on Assets 65.7% 57.5% 75.8% 61.0% 12.7% 37.6%
Asset Turnover 1.1 1.1 1.1 1.2 1.2 1.2
Financial Leverage 41.2% 37.9% 45.0% 43.6% 48.1% 45.6%
Interest Expense on Debt 10,023,346 9,834,772 8,112,785 7,031,573 7,408,798 8,313,361
Effective Tax Rate 26.0% 31.1% 23.5% 25.6% 60.3% 34.7%
Cash Flow % Sales 11.9% 12.4% 10.7% 9.4% 8.2% 8.3%
Selling, General & Administrative Expenses % of Sales 14.7% 14.5% 14.7% 14.3% 15.9% 16.6%
Research & Development Expense % of Sales 3.6% 3.5% 3.5% 3.4% 3.8% 3.9%
Operating Income Return On Total Capital 7.3% 11.3% 16.6% 11.9% 2.7% 3.4%
Wright Quality Rating AnalysesWright Quality Rating Analyses\Explanation of Wright Quality Rating
Wright Quality Rating®
Since 1970, Wright Investors' Service has rated all of the companies in its database (when there is sufficient information available). The Wright Quality Rating, measures the overall investment quality of a company.
Wright Quality Ratings are based on numerous individual measures of quality, grouped into four principal components: (1) Investment Acceptance (i.e. stock liquidity), (2) Financial Strength, (3) Profitability & Stability, and (4) Growth. The ratings are based on established principles using 5-6 years of corporate record and other investment data.
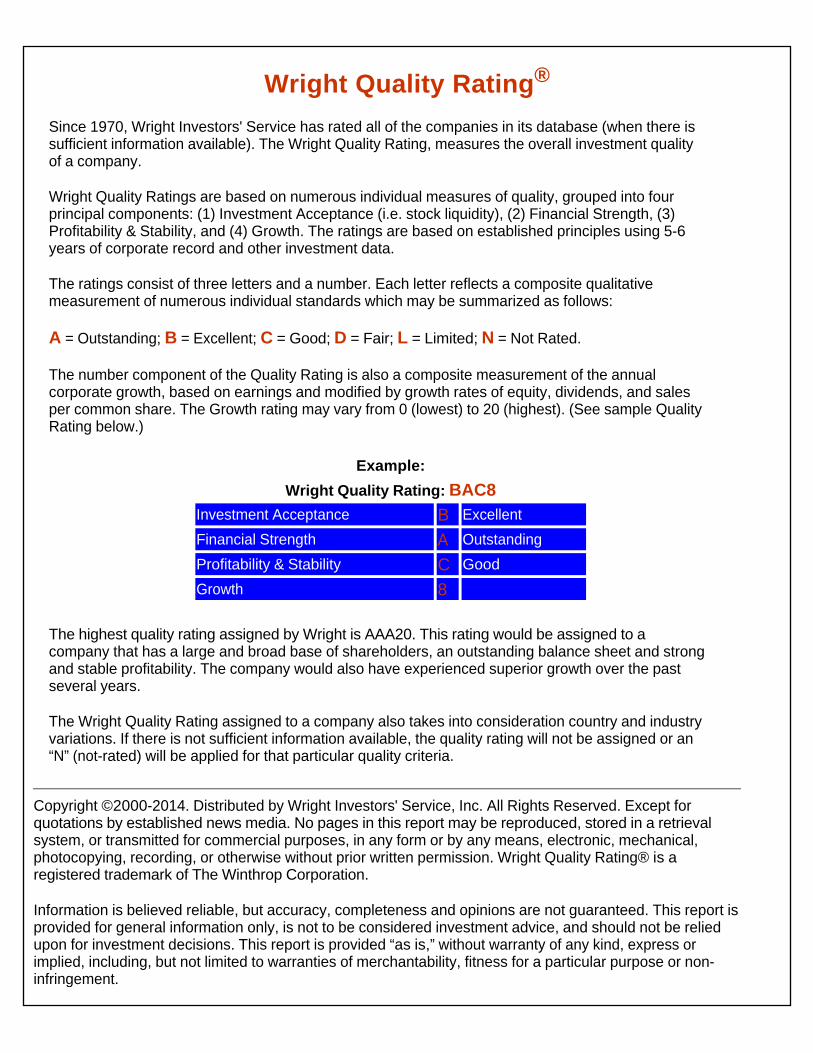
The ratings consist of three letters and a number. Each letter reflects a composite qualitative measurement of numerous individual standards which may be summarized as follows:
A = Outstanding; B = Excellent; C = Good; D = Fair; L = Limited; N = Not Rated.
The number component of the Quality Rating is also a composite measurement of the annual corporate growth, based on earnings and modified by growth rates of equity, dividends, and sales per common share. The Growth rating may vary from 0 (lowest) to 20 (highest). (See sample Quality Rating below.)
The highest quality rating assigned by Wright is AAA20. This rating would be assigned to a company that has a large and broad base of shareholders, an outstanding balance sheet and strong and stable profitability. The company would also have experienced superior growth over the past several years.
The Wright Quality Rating assigned to a company also takes into consideration country and industry variations. If there is not sufficient information available, the quality rating will not be assigned or an “N” (not-rated) will be applied for that particular quality criteria.
Example:
Wright Quality Rating: BAC8Investment Acceptance B Excellent
Financial Strength A Outstanding
Profitability & Stability C Good
Growth 8
Copyright ©2000-2014. Distributed by Wright Investors' Service, Inc. All Rights Reserved. Except for quotations by established news media. No pages in this report may be reproduced, stored in a retrieval system, or transmitted for commercial purposes, in any form or by any means, electronic, mechanical, photocopying, recording, or otherwise without prior written permission. Wright Quality Rating® is a registered trademark of The Winthrop Corporation.
Information is believed reliable, but accuracy, completeness and opinions are not guaranteed. This report is provided for general information only, is not to be considered investment advice, and should not be relied upon for investment decisions. This report is provided “as is,” without warranty of any kind, express or implied, including, but not limited to warranties of merchantability, fitness for a particular purpose or non-infringement.