Embed Size (px)
Citation preview
2014 Annual Report
APK-Invest Corporation
ABOUT APK-INVEST CORPORATION 4
Company overview 4Areas of business 4Mission 5Operational highlights 6Brief history 8Corporate structure 9Business model 10Geography of operations 12
ADDRESS BY THE MANAGEMENT 13
DEVELOPMENT STRATEGY 16
PERFORMANCE OVERVIEW 17
Key market trends 17International grain market 19Production of grains in Kazakhstan 22Results 26Financial highlights 27Financial condition analysis 29Credit ratings 32
RISK MANAGEMENT 35
CORPORATE GOVERNANCE 37
Ownership structure 38Organizational structure 38Corporate governance principles 40Internal control and audit 41Liability section 42
ANNEX. Financial statements 43
GLOSSARY 111
CONTACT INFORMATION 113
Table of Contents
4 5
2014 Annual Report
Company overview
APK-Invest Corporation LLP (hereinafter – APK-Invest) is one of the leaders of Kazakhstan’s grain market. The company focuses on both grain imports and exports. APK-Invest accounts for about 25 percent of all Kazakhstan’s grain exports. The company has been on the market for more than 15 years. In 2014, APK-Invest was ranked 26th among Kazakhstan’s largest com-panies by RAEX rating agency (Expert RA Kazakhstan) and as the largest agricultural company.The Corporation has all the necessary resources for successful sustainable development, in-cluding professional employees, reliable suppliers and advanced transport infrastructure.
Areas of business
The Corporation focuses on buying and selling agricultural products domestically, as well as supplying products to other markets through both existing distribution channels and new routes that are being developed for the future.
80%
12%
7% 1%
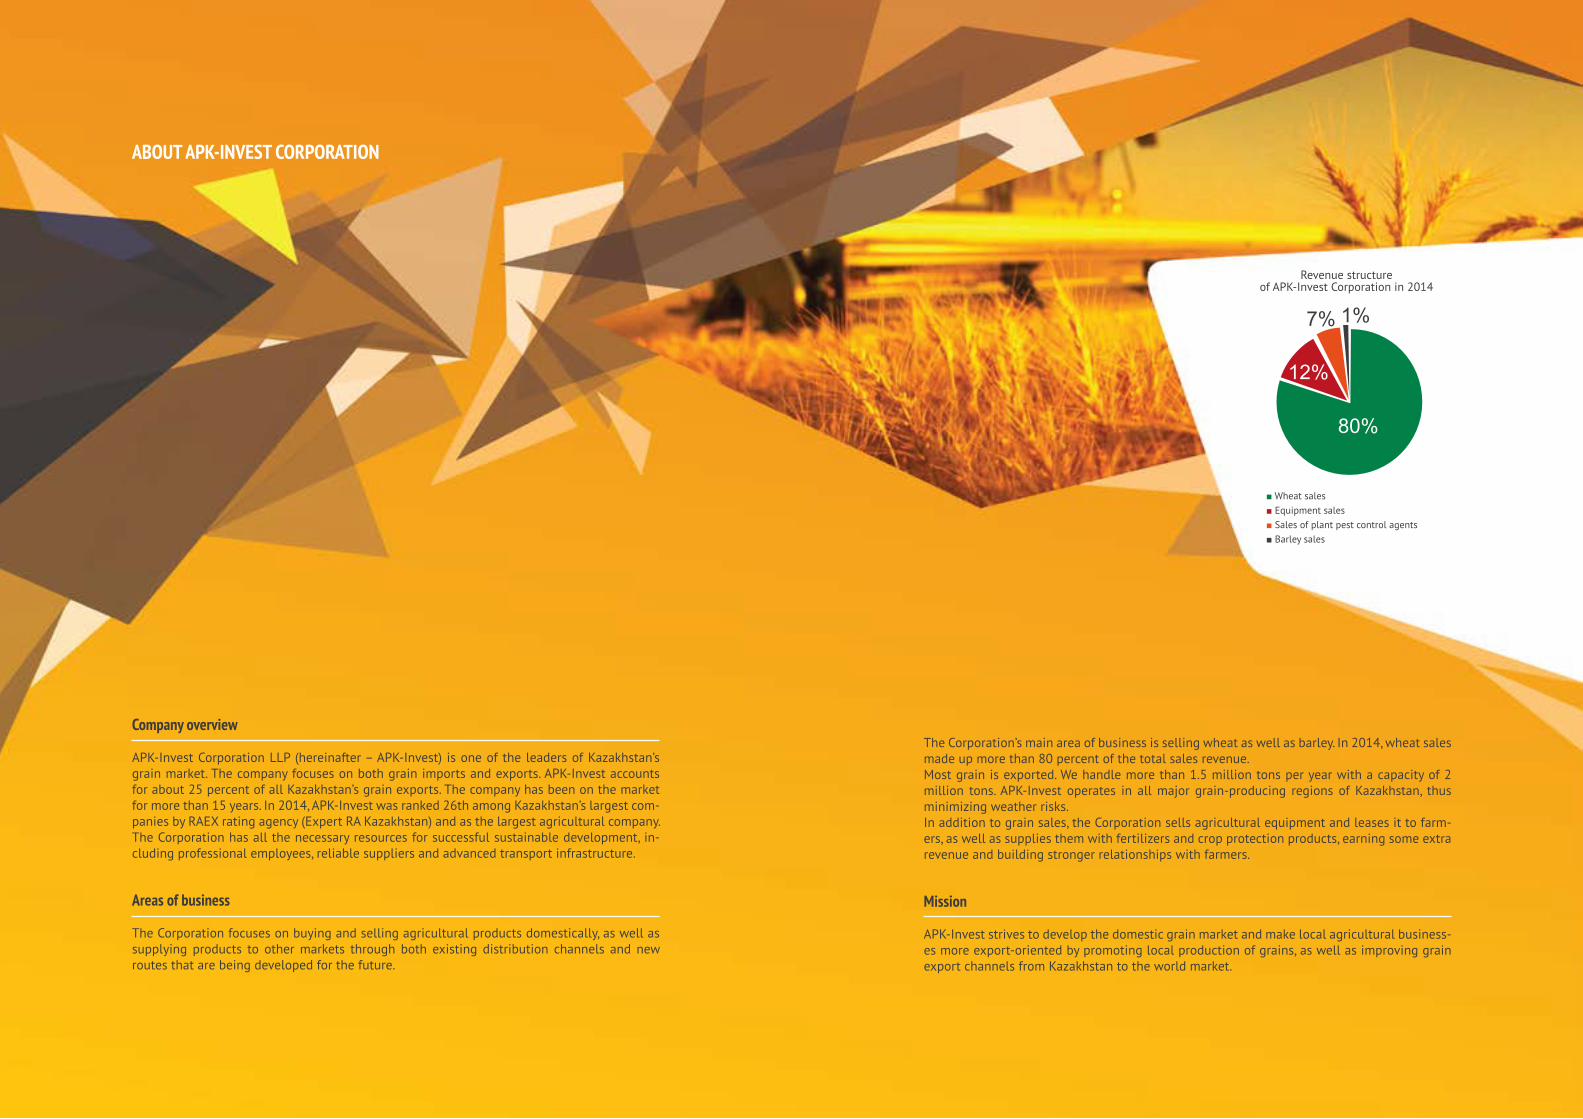
■ Wheat sales■ Equipment sales■ Sales of plant pest control agents■ Barley sales
Revenue structure of APK-Invest Corporation in 2014
The Corporation’s main area of business is selling wheat as well as barley. In 2014, wheat sales made up more than 80 percent of the total sales revenue.Most grain is exported. We handle more than 1.5 million tons per year with a capacity of 2 million tons. APK-Invest operates in all major grain-producing regions of Kazakhstan, thus minimizing weather risks. In addition to grain sales, the Corporation sells agricultural equipment and leases it to farm-ers, as well as supplies them with fertilizers and crop protection products, earning some extra revenue and building stronger relationships with farmers.
Mission
APK-Invest strives to develop the domestic grain market and make local agricultural business-es more export-oriented by promoting local production of grains, as well as improving grain export channels from Kazakhstan to the world market.
ABOUT APK-INVEST CORPORATION
6 7
2014 Annual Report
Income, million Tenge Net income, million Tenge
EBITDA, million Tenge
Assets, million Tenge Grain sold, thousand tons
ROE, %
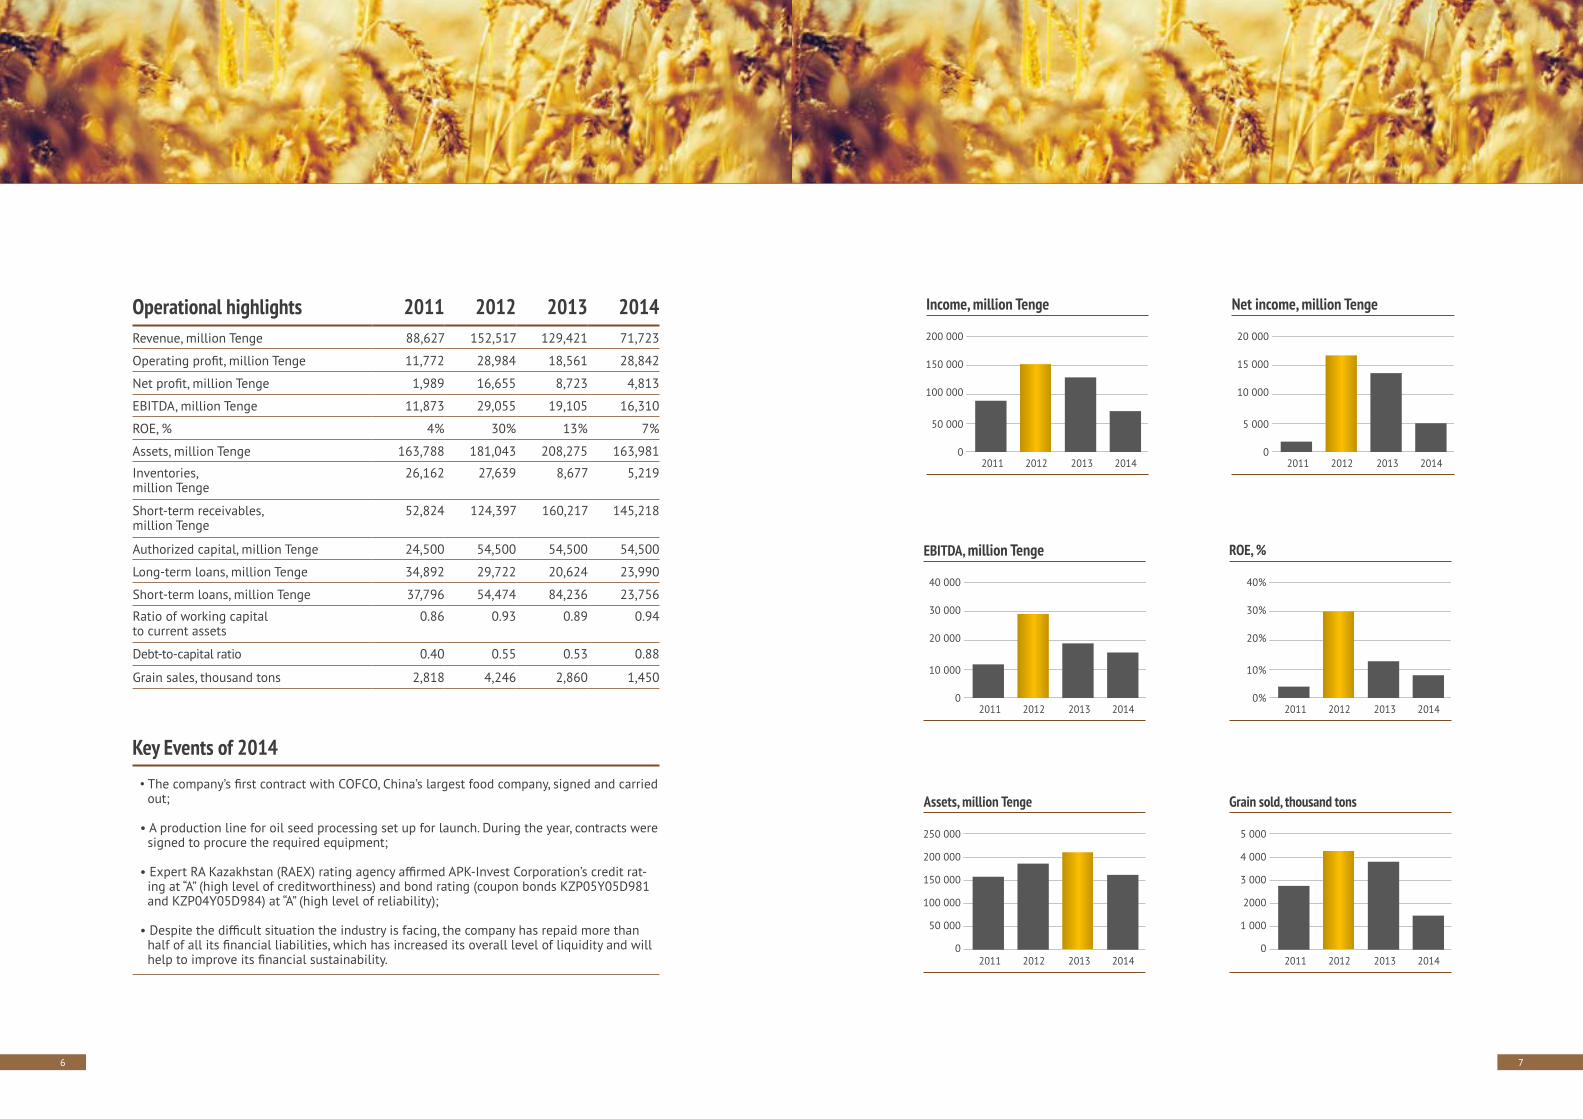
Operational highlights 2011 2012 2013 2014Revenue, million Tenge 88,627 152,517 129,421 71,723
Operating profit, million Tenge 11,772 28,984 18,561 28,842
Net profit, million Tenge 1,989 16,655 8,723 4,813
EBITDA, million Tenge 11,873 29,055 19,105 16,310
ROE, % 4% 30% 13% 7%
Assets, million Tenge 163,788 181,043 208,275 163,981
Inventories, million Tenge
26,162 27,639 8,677 5,219
Short-term receivables, million Tenge
52,824 124,397 160,217 145,218
Authorized capital, million Tenge 24,500 54,500 54,500 54,500
Long-term loans, million Tenge 34,892 29,722 20,624 23,990
Short-term loans, million Tenge 37,796 54,474 84,236 23,756
Ratio of working capital to current assets
0.86 0.93 0.89 0.94
Debt-to-capital ratio 0.40 0.55 0.53 0.88
Grain sales, thousand tons 2,818 4,246 2,860 1,450
Key Events of 2014• The company’s first contract with COFCO, China’s largest food company, signed and carried
out;
• A production line for oil seed processing set up for launch. During the year, contracts were signed to procure the required equipment;
• Expert RA Kazakhstan (RAEX) rating agency affirmed APK-Invest Corporation’s credit rat-ing at “A” (high level of creditworthiness) and bond rating (coupon bonds KZP05Y05D981 and KZP04Y05D984) at “A” (high level of reliability);
• Despite the difficult situation the industry is facing, the company has repaid more than half of all its financial liabilities, which has increased its overall level of liquidity and will help to improve its financial sustainability.
200 000
150 000
100 000
50 000
0
20 000
15 000
10 000
5 000
0
40 000
30 000
20 000
10 000
0
250 000
200 000
150 000
100 000
50 000
0
5 000
4 000
3 000
2000
1 000
0
40%
30%
20%
10%
0%
2011 2012 2013 2014 2011 2012 2013 2014
2011 2012 2013 2014
2011 2012 2013 2014 2011 2012 2013 2014
2011 2012 2013 2014
8 9
2014 Annual Report
Brief history 1998 – Agrofirma Alibi LLP was established, laying the foundation for Corporation. The found-ers included Mr. Tleubayev’s Alibi OJSC, an active grain business at the time.
2001 – From the very beginning Agrofirma Alibi focused on both domestic and international trade, shipping its first one million tons of grain to other markets by the end of the year.
2002 – Agrofirma Alibi is joined by other large players on the market, such as Alibi-Senim LLP, NurAl LLP and Agrofirma Zher-Ana LLP.
2003 – Agrofirma-Alibi LLP changes its name and re-registers as APK-Invest Corporation LLP. First acquisitions of agricultural equipment from such manufacturers as Case Corporation, Deere and Company, Degelman, Balzer, etc. The Corporation becomes a shareholder of Grain Insurance Company JSC after buying a 25 percent stake in the agricultural insurance company.
2005 – APK-Invest Corporation raises first loans from European banks.
2007 – Corporation acquires a 100 percent stake in Azov Port Elevator LLC.
2008 – Building partnership with farmers with a total land area of one million hectares. The Corporation receives Gold Key Customer award from John Deere. This manufacturer’s sales exceed one hundred million US dollars.
2009 – Corporation starts building a grain terminal at Beyneu station in Mangistau Region (western Kazakhstan). Beyneu Port Elevator LLP has a planned storage capacity of 100,000 tons with annual transhipments of at least one million tons. With its production capacity, the mill can produce up to 400 tons of flour daily.
2010 – Corporation receives Structured Finance Deal of the Year award from Islamic Finance News for attracting 40 million dollars of investments through Murabaha, an Islamic financing structure. One hundred percent of Beyneu Grain Terminal LLP was sold to Grain Leasing Com-pany LLP.
2011 – Corporation becomes the owner of Ventspils grain terminal, one of the most advanced grain terminals in the Baltic States.
2012 – Corporation sells record four million tons of wheat, including 1.5 million tons exported.
2013 – Corporation ships 3,000 tons to China, making this its first shipment to this country.
2014 – Preparation for launching a processing line for oilseed crops. During this year, the company signed contracts for supplying processing equipment for oilseed crops.
2015 – Opening of a new subsidiary MEZ-SKO LLP.
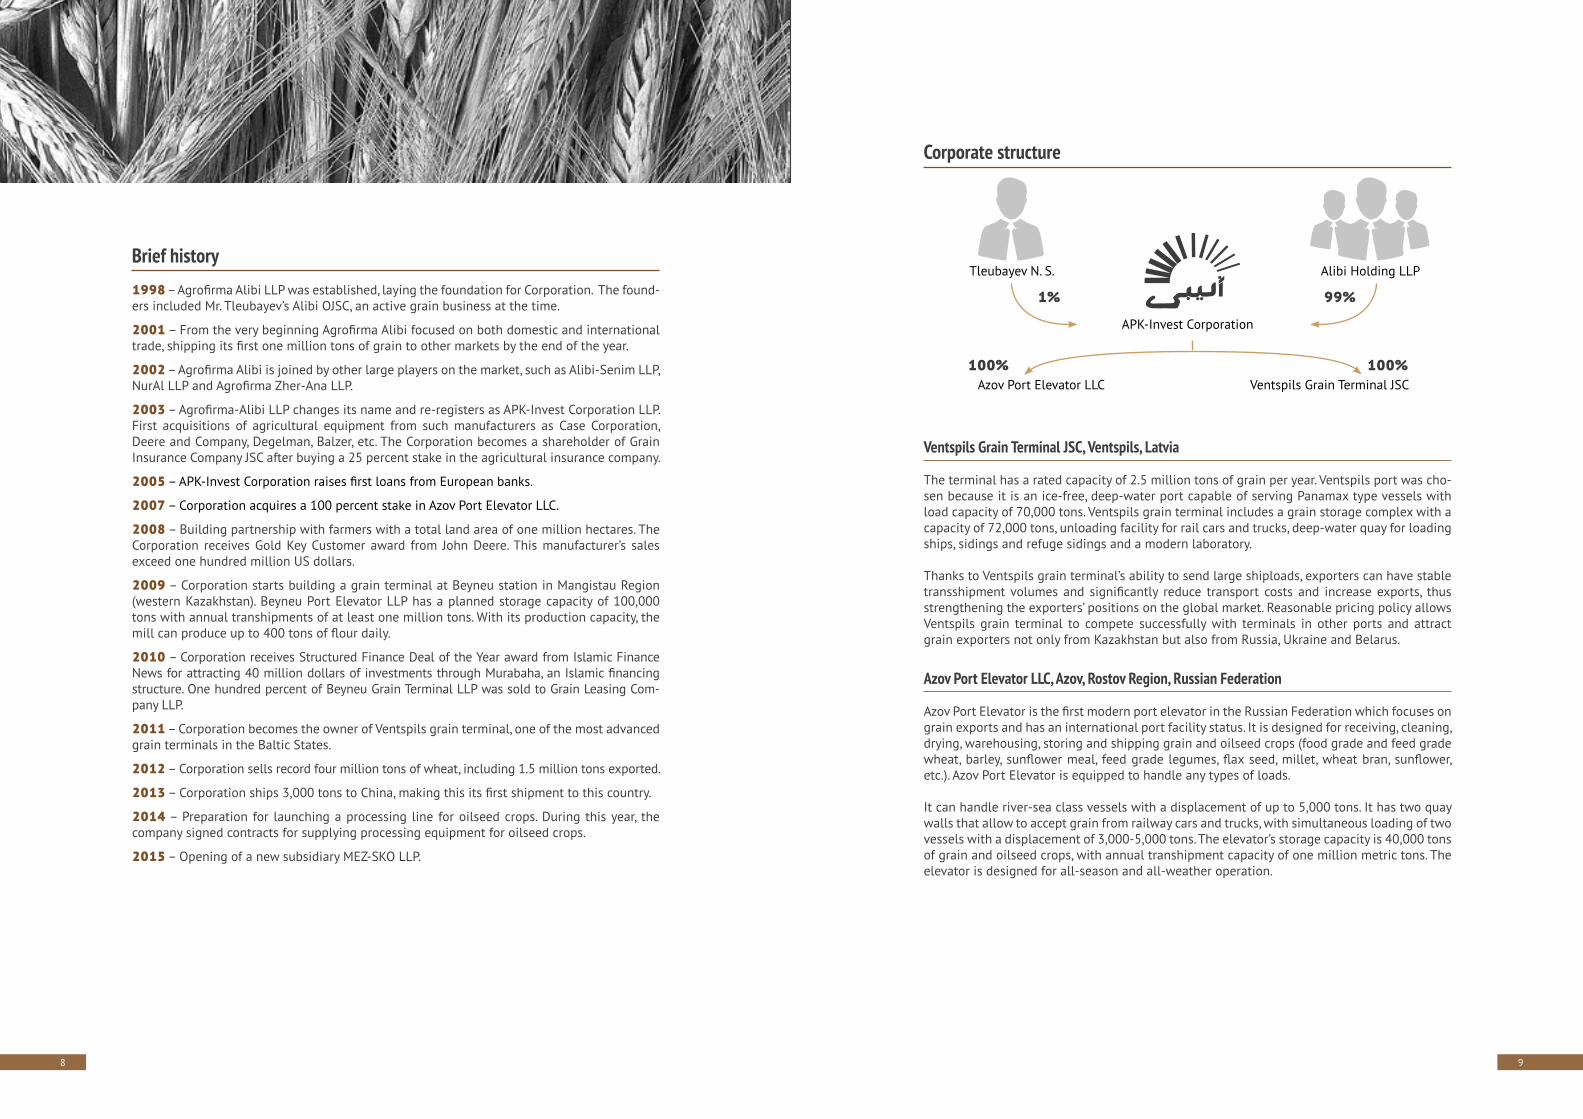
Corporate structure
Ventspils Grain Terminal JSC, Ventspils, Latvia
The terminal has a rated capacity of 2.5 million tons of grain per year. Ventspils port was cho-sen because it is an ice-free, deep-water port capable of serving Panamax type vessels with load capacity of 70,000 tons. Ventspils grain terminal includes a grain storage complex with a capacity of 72,000 tons, unloading facility for rail cars and trucks, deep-water quay for loading ships, sidings and refuge sidings and a modern laboratory.
Thanks to Ventspils grain terminal’s ability to send large shiploads, exporters can have stable transshipment volumes and significantly reduce transport costs and increase exports, thus strengthening the exporters’ positions on the global market. Reasonable pricing policy allows Ventspils grain terminal to compete successfully with terminals in other ports and attract grain exporters not only from Kazakhstan but also from Russia, Ukraine and Belarus.
Azov Port Elevator LLC, Azov, Rostov Region, Russian Federation
Azov Port Elevator is the first modern port elevator in the Russian Federation which focuses on grain exports and has an international port facility status. It is designed for receiving, cleaning, drying, warehousing, storing and shipping grain and oilseed crops (food grade and feed grade wheat, barley, sunflower meal, feed grade legumes, flax seed, millet, wheat bran, sunflower, etc.). Azov Port Elevator is equipped to handle any types of loads.
It can handle river-sea class vessels with a displacement of up to 5,000 tons. It has two quay walls that allow to accept grain from railway cars and trucks, with simultaneous loading of two vessels with a displacement of 3,000-5,000 tons. The elevator’s storage capacity is 40,000 tons of grain and oilseed crops, with annual transhipment capacity of one million metric tons. The elevator is designed for all-season and all-weather operation.
APK-Invest Corporation
Alibi Holding LLPTleubayev N. S.
Azov Port Elevator LLC Ventspils Grain Terminal JSC
1%
100% 100%
99%
10 11
2014 Annual Report
Grain purchasing
The company works with 44 farmers in Kostanay, North Kazakhstan and Akmola Regions within long-term partnership contracts. Through these partners, APK-Invest has access to one million hectares of agricultural land for growing wheat, leased for 49 years. Under annual renewable contracts, the company buys grain from other local producers on market terms.
Leasing
APK-Invest offers its partners modern agricultural equipment for lease.The Corporation finances the planting and provides farmers with agricultural equipment for which they can pay in autumn after harvesting. Financial leasing is offered for machinery and equipment from the best manufacturers like Case Corporation, Deere & Company (under John Deere brand), Degelman, Balzer, etc. The average lease period is 10-15 years. The company’s consolidated income from leasing transactions is about 25 million dollars, or 4-5 percent of APK-Invest’s gross income. Since 2003, the company leased out about 400 combine harvesters, 700 tractors and planting ma-chines, over 40 spraying devices, 150 mowers and 200 soil cultivators. The company’s revenue from this business over a ten-year period reached twenty billion Tenge. With a business of this size, it is quite remarkable to have a zero rate of non-performing assets.
Herbicide sales
Sales of herbicides to farmers make up a significant part of the company’s sales revenue. Sales of chemicals farmers for increasing crop yields are an important area where the company works with partners, as it allows to maximize profits from interaction.
Storage and logistics
Using a proven supply chain and its own terminals, both at home and abroad (the Black Sea and Baltic port cities), the company exports grain to nearby and faraway countries. Granaries (16 elevators with a capacity of 1.5 million tons; another 0.5 million tons can be stored at four elevators owned by the company’s long-term partners) and loading terminals (transhipment capacity of up to 3 million tons of grain per year) owned by the company, make its export channels least prone to seasonal problems with transportation, storage and ship-ment of products.
Marketing and sales
Every year, the company sells up to 4 million tons of grain (1.5 million tons to long-term part-ners and the rest is bought in the domestic market under annual contracts), of which more than a third is exported.
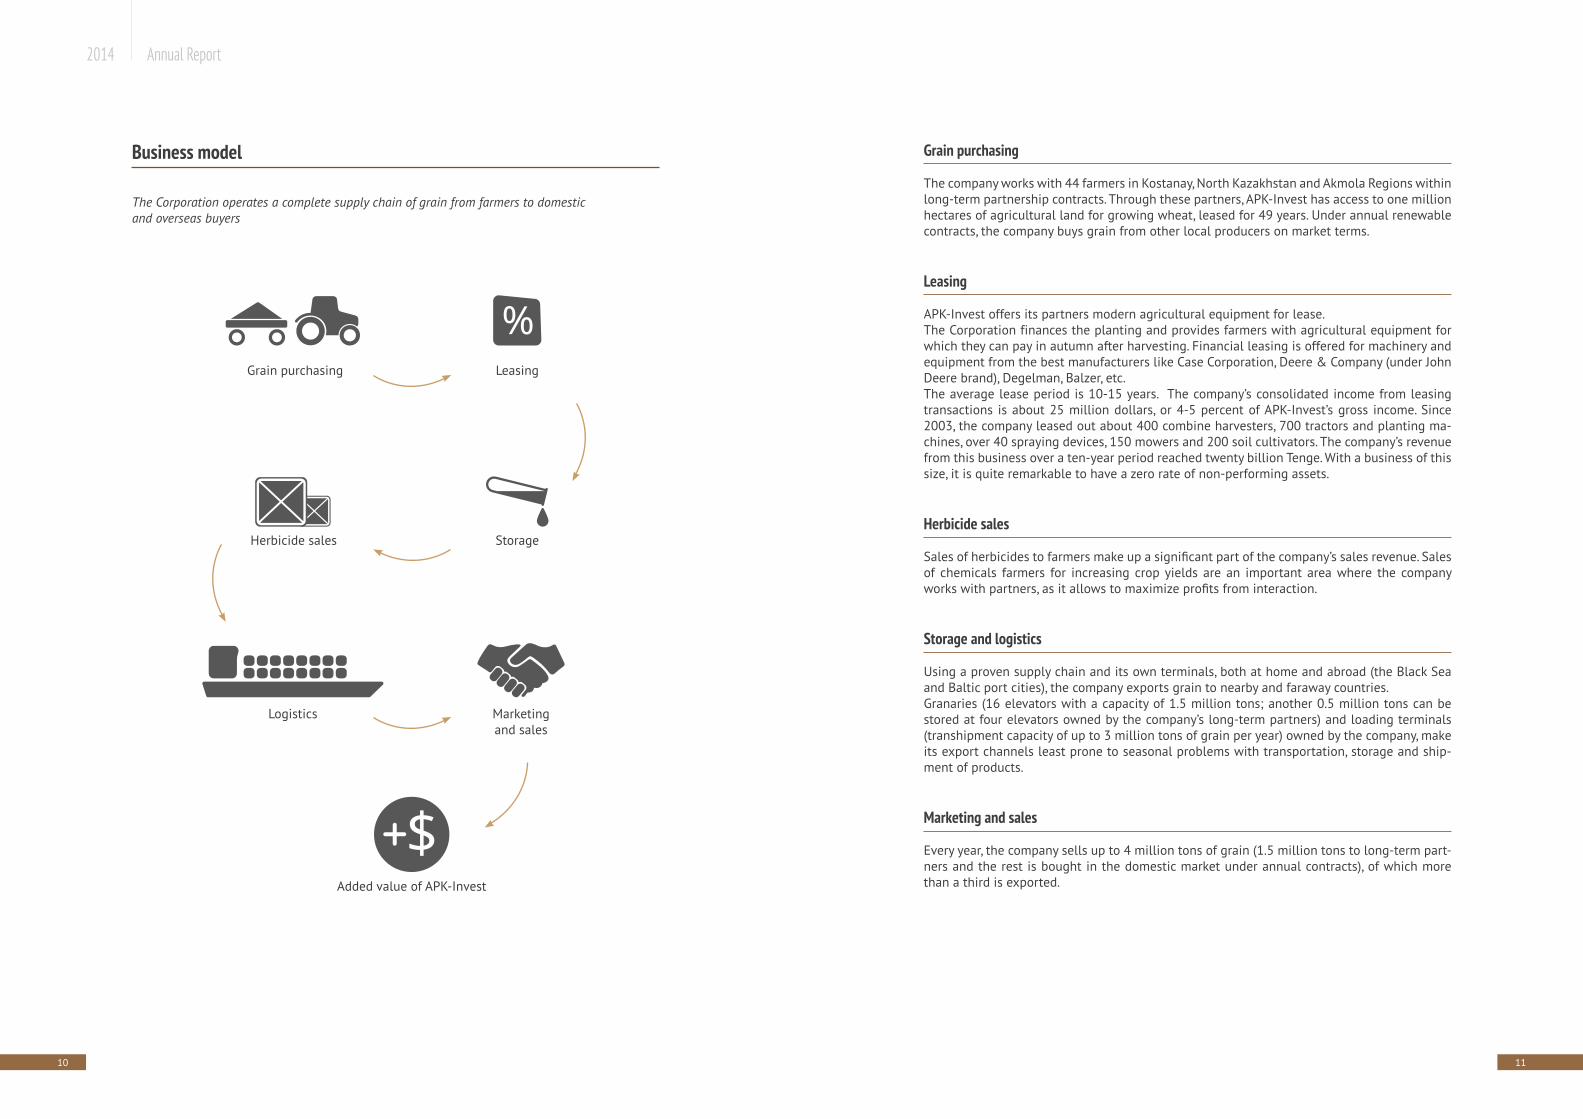
Business model
The Corporation operates a complete supply chain of grain from farmers to domestic and overseas buyers
Grain purchasing
StorageHerbicide sales
Logistics Marketing and sales
Added value of APK-Invest
Leasing
12 13
2014 Annual Report
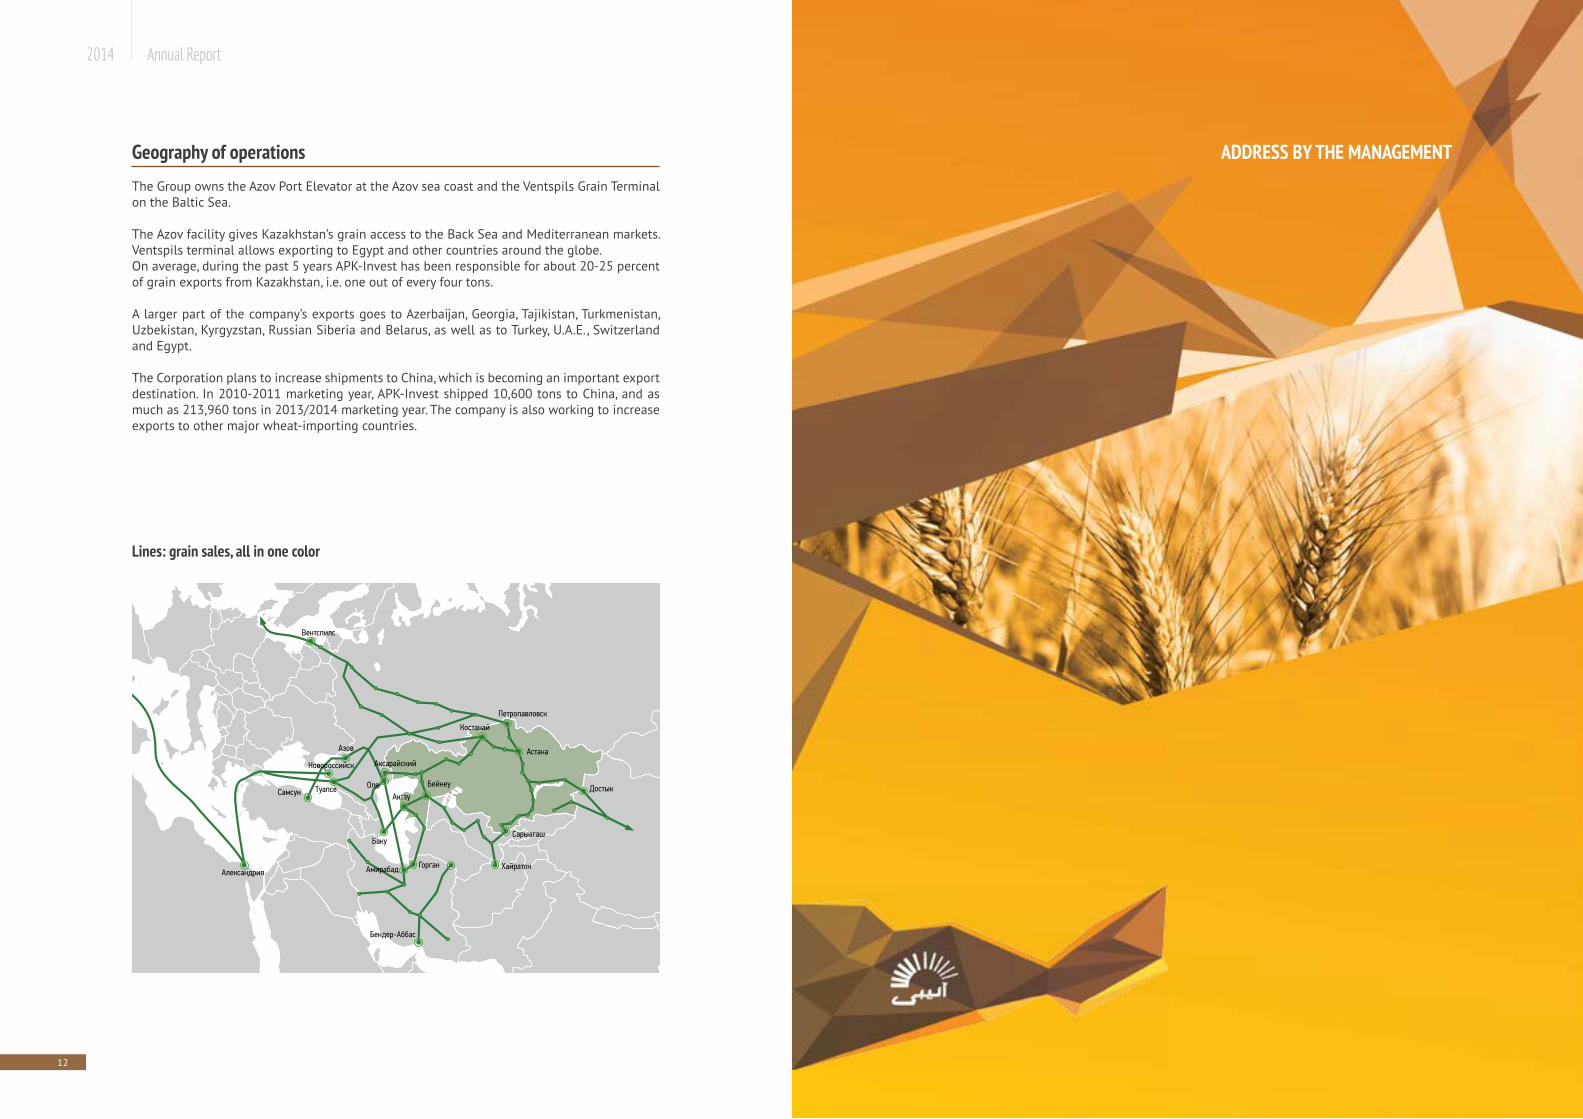
Geography of operationsThe Group owns the Azov Port Elevator at the Azov sea coast and the Ventspils Grain Terminal on the Baltic Sea.
The Azov facility gives Kazakhstan’s grain access to the Back Sea and Mediterranean markets. Ventspils terminal allows exporting to Egypt and other countries around the globe.On average, during the past 5 years APK-Invest has been responsible for about 20-25 percent of grain exports from Kazakhstan, i.e. one out of every four tons. A larger part of the company’s exports goes to Azerbaijan, Georgia, Tajikistan, Turkmenistan, Uzbekistan, Kyrgyzstan, Russian Siberia and Belarus, as well as to Turkey, U.A.E., Switzerland and Egypt.
The Corporation plans to increase shipments to China, which is becoming an important export destination. In 2010-2011 marketing year, APK-Invest shipped 10,600 tons to China, and as much as 213,960 tons in 2013/2014 marketing year. The company is also working to increase exports to other major wheat-importing countries.
ADDRESS BY THE MANAGEMENT
Lines: grain sales, all in one color
14 15
2014 Annual Report
ADDRESS BY THE MANAGEMENT
Dear friends and colleagues,
2014 was a tough year for our company and the industry as a whole. However, we have man-aged to achieve positive results and we have been quite successful in our endeavors.
Looking at the current situation in agriculture, it should be noted that Agrobusiness 2020, the government program for promoting agriculture in the Republic of Kazakhstan during 2013-2020, arrived at a very opportune moment, which undoubtedly will help the industry to grow and change dramatically.
The main challenges during the reporting year were crop failures and, of course, the systemic financial crisis. We managed to mitigate the impact of crop failure to some extent thanks to effective trading decisions and emerging opportunities. Because crop failure forced us to scale back our operations, the financial crisis has not been a big problem for us; on the contrary, it allowed the company to establish itself as a stable and reliable trader and helped us find new strategic partners.
As expected, prolonged grain crop failure affected earnings in the reporting year, yet, thanks to adequate measures and strategic planning, we managed to show a profit at the end of the period. It is important to note that, despite the difficult situation in the industry, we managed to repay more than half of all our debt, thus increasing the overall level of liquidity and im-proving financial sustainability. APK-Invest has vividly demonstrated its high credit worthiness and ability to honor its financial obligations without help, even in such harsh economic envi-ronment.
One of the successes of this year was signing a contract with COFCO Group, China’s largest food Corporation. COFCO is a diversified state-owned monopoly on the Chinese food market, buyer and trader of corn, rice and wheat; it also conducts enhanced grain processing.
The key event of 2015 was the opening of our subsidiary, MEZ-SKO LLP. The subsidiary will manufacture refined oils and fats, which in our opinion is a promising business.
As for production plans, in 2015 we intend to work in the same mode as in 2014, because the financial crisis is still a bitter reality. We plan to expand our sales geography, especially to China, as this country stands to become an important export customer. In financial terms, we intend to maintain the current level of debt and will carefully monitor the company’s effective-ness, maintaining its financial stability.
I am sure that this year, we will be able to achieve new successes and overcome the existing industry challenges. By focusing on strategic areas in the medium term, we will ensure suc-cessful development of the company and remain as one of the industry leaders.
Asylbek Tleubayev General Director

16 17
2014 Annual Report
Our main goal is to become one of the leading exporters of agricultural products in Central Asia. We are focused on regions with low productivity of agriculture and with potential to in-crease the number of transactions.
Key strategic medium-term goals:
• Modernization of logistics network The company expects the increase of export potential in all areas, which is facilitated by
practical implementation of key objectives of the State Transport Infrastructure Develop-ment Program. Therefore, the company intends to continue to expand and upgrade its logis-tics infrastructure.
• Increasing business liquidity The company intends to improve its financial performance through debt burden reduction
and cost optimization.
• Remaining Kazakhstan’s leading grain exporter We focus on traditional export destinations, like Azerbaijan, Georgia, Tajikistan, Kyrgyzstan,
the Middle East and we will use opportunities offered by new markets. Our goal is to keep export and domestic sales at the level of 4 million tons, achieved in 2012.
DEVELOPMENT STRATEGY PERFORMANCE OVERVIEW
Key market trends
Between 2010/11 and 2014/15 marketing years, the average world grain production totaled 1.9 billion tons. Seven largest producers account for 73 percent of grain production in the 2014/2015 season, including the United States, China, the EU-28 (EU countries), India, Russia, Canada and Ukraine.
Wheat makes up 36 percent of world grain production and 50 percent of grain exports.
Kazakhstan is one of the key producers of high-quality wheat and it is the world’s seventh largest exporter by volume, shipping 8.8 million tons of wheat for exports in 2013/2014.
The main drivers for growth of grain exports:- Population growth: the world’s population is expected to reach 9.1 billion people by 2050;- Changes in the global consumption structure: rising purchasing power of the developing countries;- Less agricultural land: driven by population growth, urbanization and desertification.
18 19
2014 Annual Report
International grain market
According to the International Grains Council (IGC), the global supply of grains, rice and oilseeds during 2013/2014 has surged, with the production of wheat, corn, soy beans and rice reaching new record highs. As experts note, there has been a faster than usual growth in consumption; however, carry-over stocks have also improved. According to the IGC report, the global trade in grains, pri-marily wheat and corn, has reached its historical maximum. However, sellers were affected by the decline in export prices. During the 2013/2014 fiscal year, on the average, Grains and Oilseeds In-dex (GOI) was 13 percent lower than in the previous period. The increased demand was not enough to provide sufficient support to declining prices.
Total worldwide production of grains (wheat and coarse grains) in 2013/2014 increased by 11 per-cent, reaching 1,994 million tons. The growth was driven by increased wheat, corn and barley crops. Large crops were harvested almost everywhere, as a result, production in the eight major exporting countries increased by approximately 20 percent, for the first time exceeding one billion tons.
World wheat production in 2013/2014 increased by 9 percent and reached its historic maximum of 713 million tons. Record crops of wheat were harvested in Canada, China, Egypt and Morocco, with production in the CIS recovering after the previous season’s drought. Increased crop harvesting also took place in Argentina, Australia and the EU. India’s crop was a bit smaller than a year earlier, but still it was the second largest in the country’s history.
The world’s total land area for growing barley slightly declined compared to the last year; however, the record average yield resulted in boosting production to a four-year high of 145 million tons (12 percent more than in the previous year). High barley yields occurred in the EU, Russia, Ukraine, Canada, Turkey, Morocco and Australia. However, in Australia, reduction of cultivated lands and bad weather conditions caused a decline in production.
After the first decline in 14 years, which happened in the previous season, the total world consump-tion of grain in 2013/2014 grew by 6 percent to 1,926 million tons, which is a new high, according to the IGC. Significant growth in grain production caused a drop in prices, resulting in an 8 percent rise of the global feed use to 839 million tons. Yet, the growing use of coarse grains has limited the interest in wheat fodder. According to the International Grains Council, cheaper prices for raw materials caused a 6 percent increase in demand in the industrial sector, reaching 314 million tons. Global food grains consumption totaled 649 million tons, which is 2 percent more than the year before.
The world consumption of wheat in 2013/2014 increased by 3 percent reaching 695 million tons. Total barley consumption rose by 8 million tons reaching 141 million tons, including an increase of 7 million tons in feed barley consumption totaling 94 million tons. Industrial use of barley in-creased by 2 percent reaching 30 million tons. IGC experts say that the growth is mostly driven by stronger demand from the beer industry in certain countries, particularly in China and Brazil.
According to the International Grains Council, the world carry-over grain stocks at the end of 2013/2014 (total volume for the relevant local marketing years) increased for the first time in four seasons by 68 million tons, reaching 403 million tons. After record harvests, most of the growth occurred in wheat and corn production with an increase of 18 million tons and 44 million tons respectively. The ratio of world reserves and grain use increased by two percentage points to a four-year high of 21 percent.
The world grain trade in 2013/2014 (July/June) increased by 38 million tons compared with last
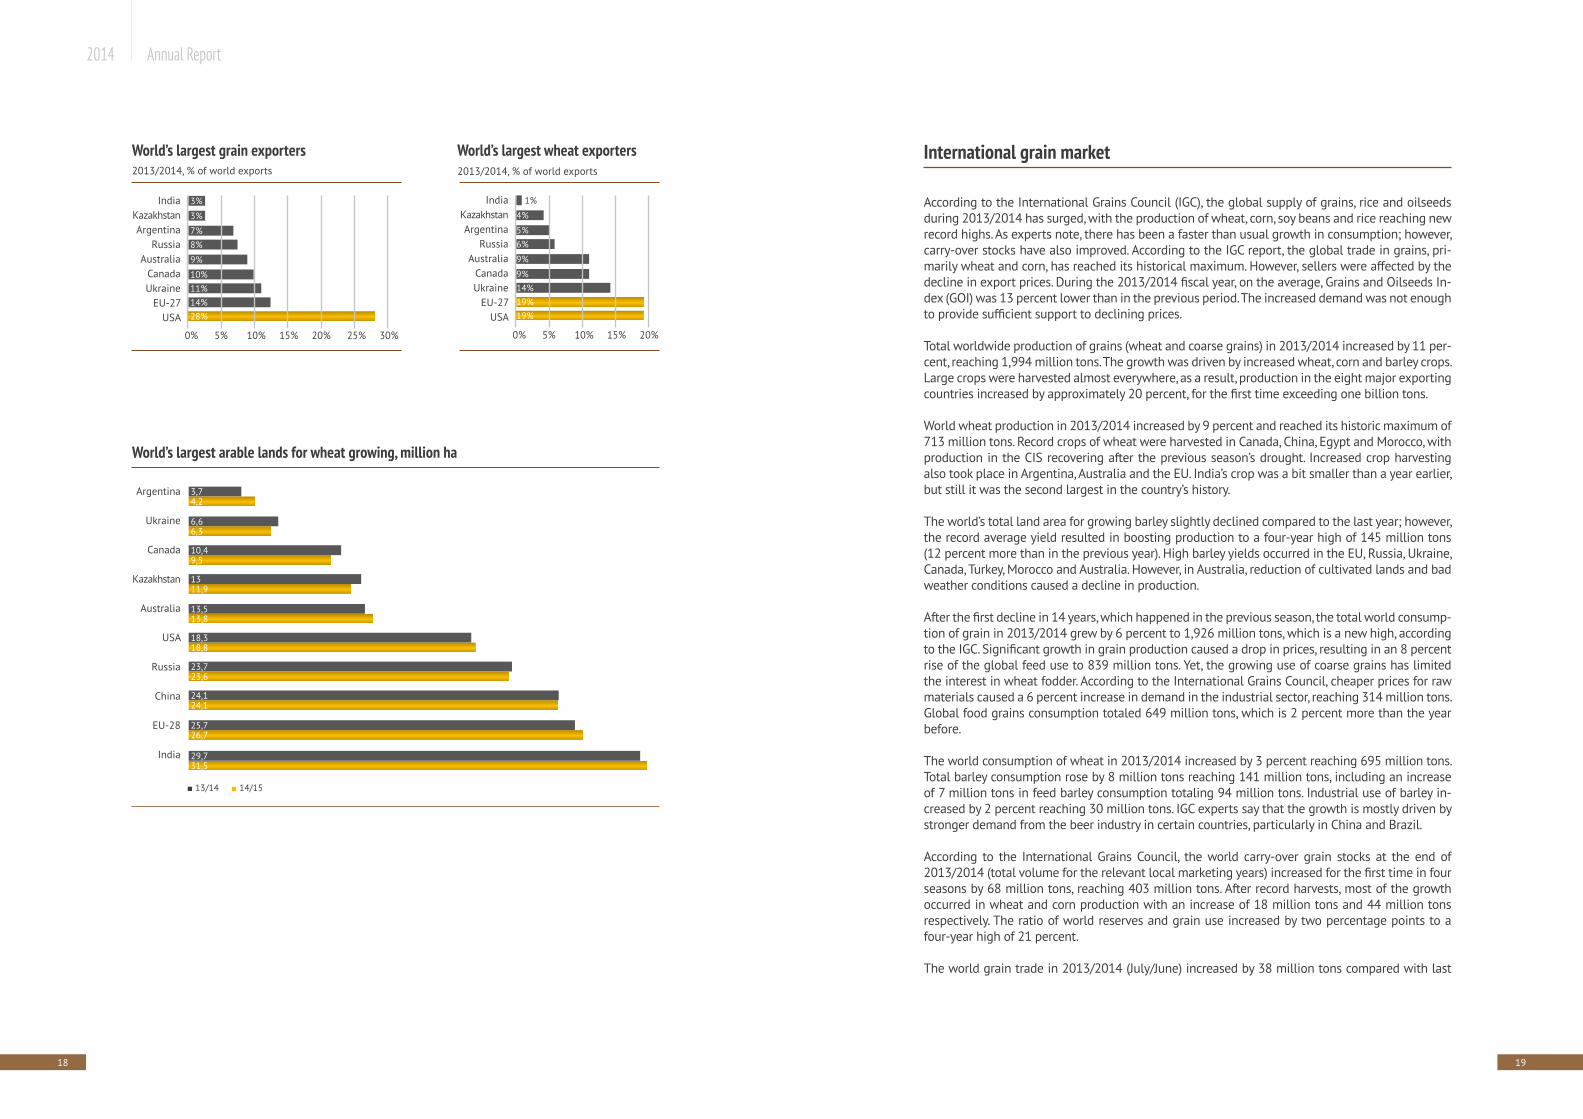
World’s largest grain exporters
World’s largest arable lands for wheat growing, million ha
IndiaKazakhstanArgentina
RussiaAustralia
Canada Ukraine
EU-27USA
Argentina
Ukraine
Canada
Kazakhstan
Australia
USA
Russia
China
EU-28
India
2013/2014, % of world exports
3%
3,7
3%
4,2
7%
6,6
8%
6,3
9%
10,4
10%
9,5
11%
13
14%
11,9
28%
13,513,8
18,8
23,623,7
24,124,1
25,726,7
29,7
■ 13/14 ■ 14/15
31,5
18,3
0% 5% 10% 15% 20% 25% 30%
World’s largest wheat exporters
IndiaKazakhstanArgentina
RussiaAustralia
Canada Ukraine
EU-27USA
2013/2014, % of world exports
1%
4%
5%6%
9%
9%14%19%19%
0% 5% 10% 15% 20%
20 21
2014 Annual Report
year to a record of 307 million tons. Wheat trade increased by 14 million tons to 155 million tons. There was an increase in demand for milling wheat in China, the United States, Egypt and Saudi Arabia. China’s imports doubled due to poor grain quality of local crops, reaching a nine-year high of nearly 7 million tons. The EU showed a particularly strong export appetite, with shipments reaching a record high of 31 million tons. And this is despite strong competition from the CIS, with soaring sales from Kazakhstan, Russia and Ukraine. According to the IGC, supply chain problems impeded shipments in North America, yet, exports from the United States and Canada still exceed-ed last year’s figures.
World barley trade in 2013/2014 increased by 18 percent to 22.9 million tons. Saudi imports reached 9 million tons, which is 10 percent more than last year. Growth in demand was due to competitive prices. China’s imports (especially barley for malting) increased by 95 percent to 4.1 million tons, which is also due to poor local crops and substandard grain quality. Australia’s exports in July/June surged by 45 percent to 6.4 million tons thanks to a large crop, while shipments from the EU increased by 14 percent to 5.7 million tons, which is a record high since 2000/2001.
As expected, record grain yields and growing supply caused a decline in export prices for grains and oilseeds during 12 months leading to June 2014, with the biggest drop being in corn prices. In early August, the IGC’s GOI dropped to its absolute low in 20 months, mostly because of the decline in the cultivated crops sector. Although prices recovered slightly, especially in February and early March, they were increasingly affected by an unfavorable supply and demand forecast. At the end of June 2014, GOI was 9 percent lower than a year earlier, due to a 27 percent decline in corn. Sub-in-dexes for both soybeans and rice dropped 7 percent compared to the last year, as the subindex for wheat fell by 2 percent.
Initially, export prices for wheat dropped due to abundant global supply and in view of the adverse impact from the reduction in corn prices, the trend towards weakening persisted on the markets until the end of January. Early in 2014, prices partly recovered due to uncertainty created by the conflict in Ukraine, excessively dry weather for the next crop in the United States and Canada’s supply chain problems. However, given the increasingly optimistic crop prospects for 2014/2015 in other regions, prices dropped again in May and June.
million tons
Total for grains 12/13 13/14 estimate
14/15 forecast
15/16 forecast
Change
Production 1,794 2002 2008 1,947 -3%
Trade 269 307 311 306 -1.6%
Consumption, including: 1,818 1,936 1,971 1,970 -0.1%
food 629 645 654 661 1.1%
feed 777 845 873 864 -1%
industrial 299 317 323 326 0.9%
Carry-over stocks 335 401 438 415 -5.3%
For major exporters* 99 122 150 133 -11.3%
million tons
Wheat 12/13 13/14 estimate
14/15 forecast
15/16 forecast
Change
Production 655 713 721 705 -2.2%
Trade 141 155 152 151 -0.7%
Consumption 676 698 709 711 0.3%
Carry-over stocks 171 187 199 194 -2.5%
For major exporters* 51 56 67 65 -3%
*Argentina, Australia, Canada, The EU, Kazakhstan, Russia, Ukraine, United StatesSource: INTERNATIONAL GRAINS COUNCIL
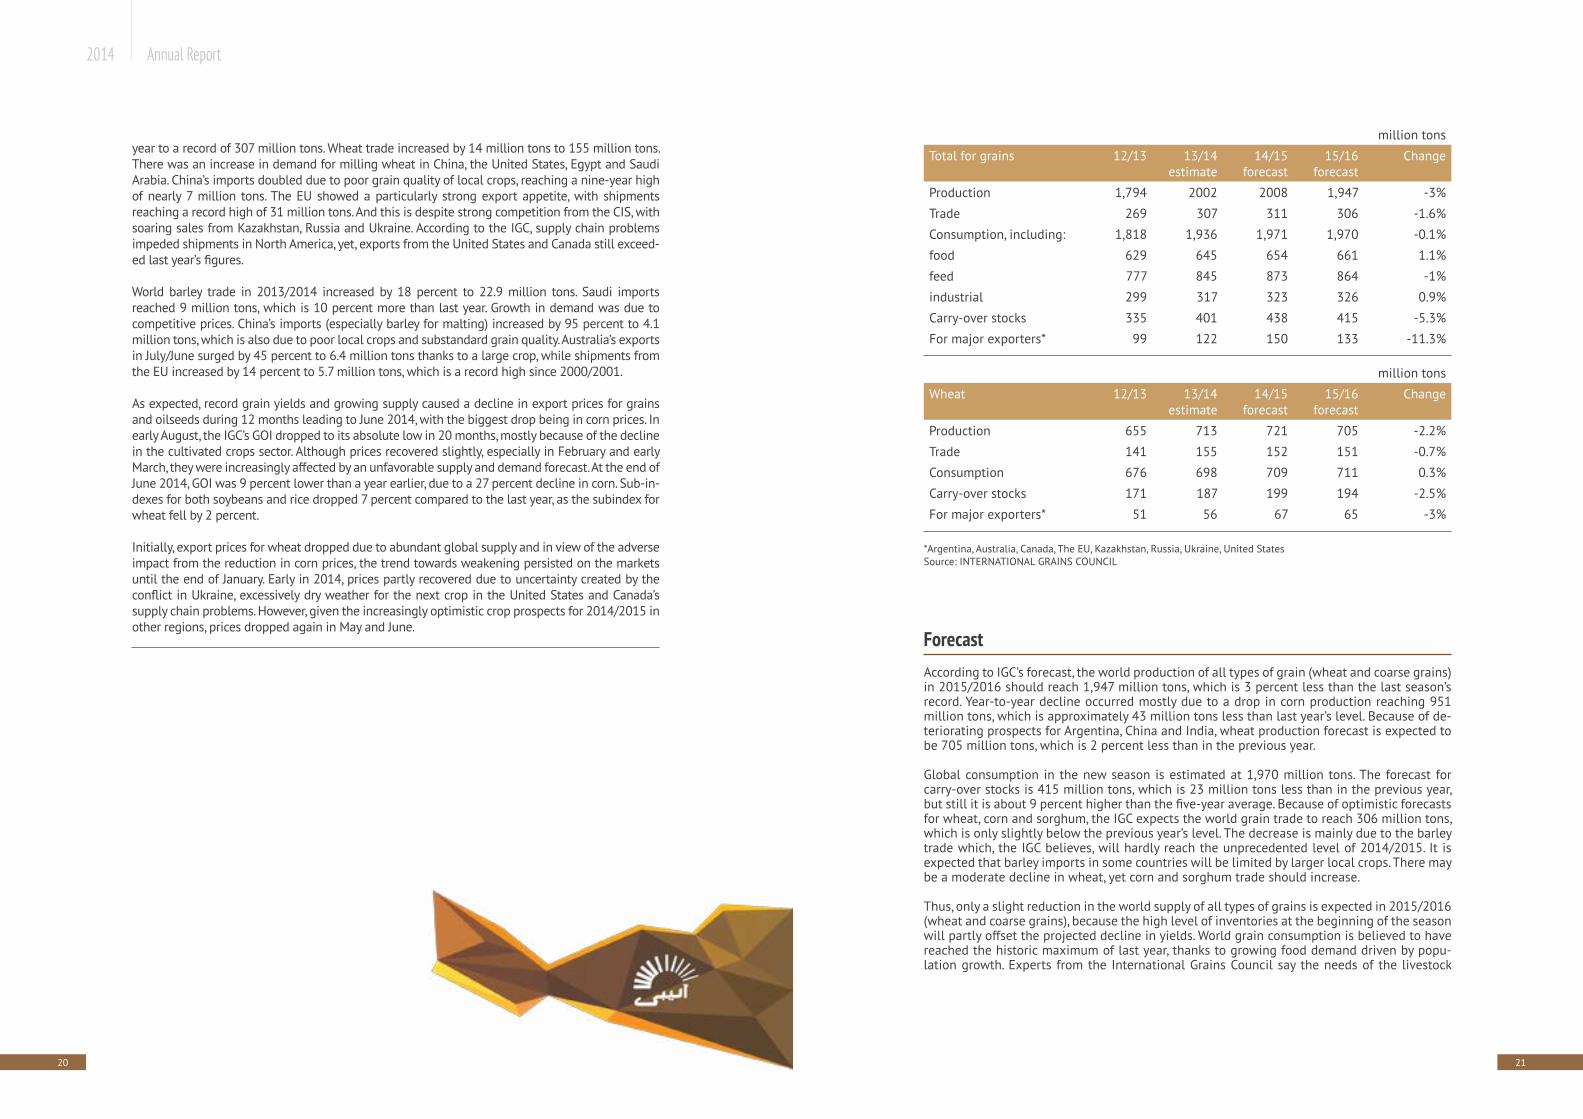
ForecastAccording to IGC’s forecast, the world production of all types of grain (wheat and coarse grains) in 2015/2016 should reach 1,947 million tons, which is 3 percent less than the last season’s record. Year-to-year decline occurred mostly due to a drop in corn production reaching 951 million tons, which is approximately 43 million tons less than last year’s level. Because of de-teriorating prospects for Argentina, China and India, wheat production forecast is expected to be 705 million tons, which is 2 percent less than in the previous year.
Global consumption in the new season is estimated at 1,970 million tons. The forecast for carry-over stocks is 415 million tons, which is 23 million tons less than in the previous year, but still it is about 9 percent higher than the five-year average. Because of optimistic forecasts for wheat, corn and sorghum, the IGC expects the world grain trade to reach 306 million tons, which is only slightly below the previous year’s level. The decrease is mainly due to the barley trade which, the IGC believes, will hardly reach the unprecedented level of 2014/2015. It is expected that barley imports in some countries will be limited by larger local crops. There may be a moderate decline in wheat, yet corn and sorghum trade should increase.
Thus, only a slight reduction in the world supply of all types of grains is expected in 2015/2016 (wheat and coarse grains), because the high level of inventories at the beginning of the season will partly offset the projected decline in yields. World grain consumption is believed to have reached the historic maximum of last year, thanks to growing food demand driven by popu-lation growth. Experts from the International Grains Council say the needs of the livestock
22 23
2014 Annual Report
sector will remain strong; however, the use of coarse grains will still face competition from alternative feeds, especially oilseed meals with an abundant supply of them being available. Industrial use is expected to grow, mainly in starch production and beer brewing, while de-mand in the ethanol industry as a whole will remain at last year’s level.
Production of grains in Kazakhstan
КKazakhstan has about 21.5 million hectares of arable lands, of which approximately 60 per-cent is used for wheat growing. Kazakhstan is the second largest country in Europe and the CIS in terms of cultivated land area, with 11.9 million hectares of land used for wheat growing in 2014/2015 marketing year.
In 2012, the Ministry of Agriculture, regional authorities, KazAgro National Managing Holding and Kazagroinnovacia signed memorandums of cooperation to ensure crop diversification. As a result, in the ensuing five years the wheat crop area declined by 2.4 million hectares. Accord-ing to the Ministry of Agriculture, the measures taken have made it possible to balance supply and demand for wheat, eliminated the causes of dumping prices, helped to introduce crop ro-tation and expanded the crop areas of coarse grains, oilseeds, feed and cucurbits/melon crops.About 95 percent of the wheat produced in Kazakhstan is spring wheat grown in the steppe and forest-steppe areas. According to the International Grains Council, the average annual wheat production in Kazakhstan is 14 million tons. Kazakhstan’s climate is perfect for the pro-duction of high-quality wheat. Up to 90 percent of cultivated wheat with a minimum gluten content of 23 percent is suitable for making flour.
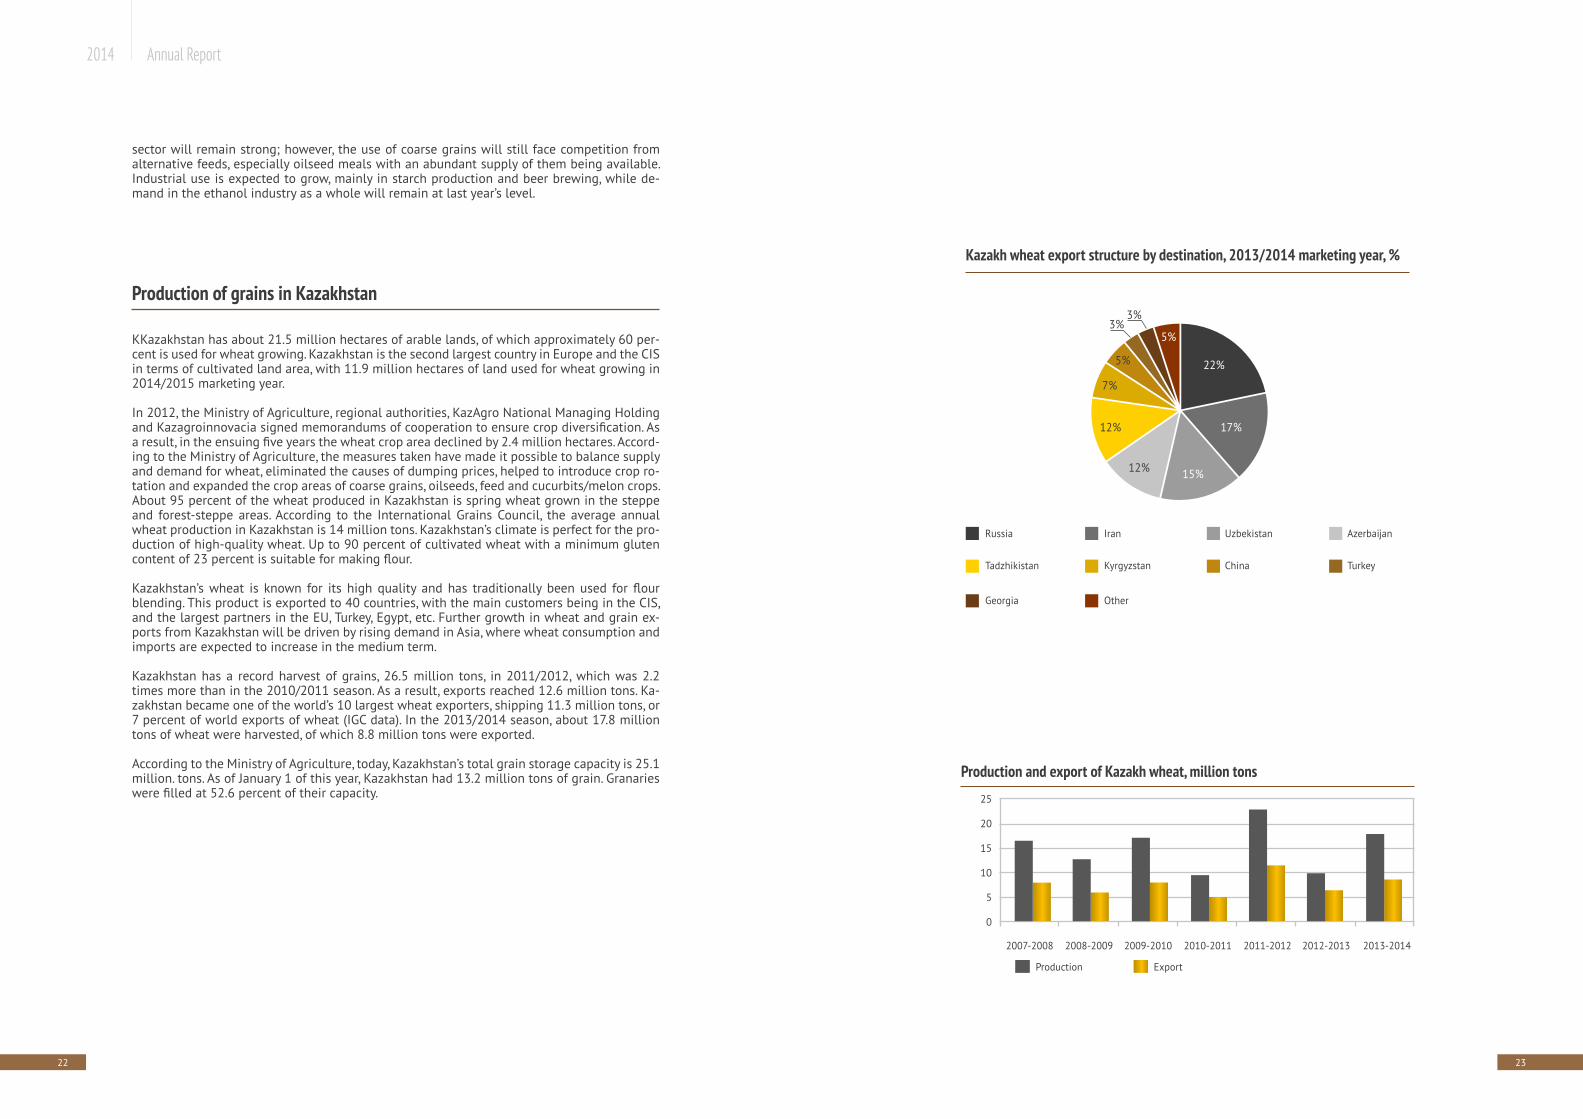
Kazakhstan’s wheat is known for its high quality and has traditionally been used for flour blending. This product is exported to 40 countries, with the main customers being in the CIS, and the largest partners in the EU, Turkey, Egypt, etc. Further growth in wheat and grain ex-ports from Kazakhstan will be driven by rising demand in Asia, where wheat consumption and imports are expected to increase in the medium term.
Kazakhstan has a record harvest of grains, 26.5 million tons, in 2011/2012, which was 2.2 times more than in the 2010/2011 season. As a result, exports reached 12.6 million tons. Ka-zakhstan became one of the world’s 10 largest wheat exporters, shipping 11.3 million tons, or 7 percent of world exports of wheat (IGC data). In the 2013/2014 season, about 17.8 million tons of wheat were harvested, of which 8.8 million tons were exported.
According to the Ministry of Agriculture, today, Kazakhstan’s total grain storage capacity is 25.1 million. tons. As of January 1 of this year, Kazakhstan had 13.2 million tons of grain. Granaries were filled at 52.6 percent of their capacity.
Production and export of Kazakh wheat, million tons
25
20
15
10
5
0
2007-2008
ExportProduction
2008-2009 2009-2010 2010-2011 2011-2012 2012-2013 2013-2014
Kazakh wheat export structure by destination, 2013/2014 marketing year, %
Russia Iran Uzbekistan Аzerbaijan
Tadzhikistan Kyrgyzstan China Turkey
Georgia Other
17%
22%
15%12%
12%
7%
5%
3%3%
5%
24 25
2014 Annual Report
Industry prospects
Kazakhstan’s 2013-2020 agriculture development program is aimed at improving sustainabil-ity of grain production and stabilizing the grain market in Kazakhstan, as well as improving productivity in agriculture.
The targets of this master plan include:
• Crop diversification with decreasing wheat crop areas to 11.5 million ha by 2020 and in-creasing feed grains, legumes and cereal grains crop areas to 4.3 million ha, oilseeds – to 2.1 million ha, cucurbits/melon crops and potatoes – to 430,000 ha, feed grains – to 4.3 million ha;
• Adoption of scientifically proven crop rotations throughout the acreage;• Introduction of water and resource-saving technologies on 12.8 million ha, including 4.8
million ha of no-tillage areas;
• Increasing grain yields to 13.2 hundred kg/ha by 2020, and grain production to 21.1 million tons;
• Increasing exports of grain and flour in grain equivalent to 9.1 million tons by 2020;• Increasing the share of insured acreage to 100 percent by 2020;
• Introduction of additional storage facilities with a capacity of 3.5 million tons by 2020, in-cluding 350,000 tons for major export destinations.
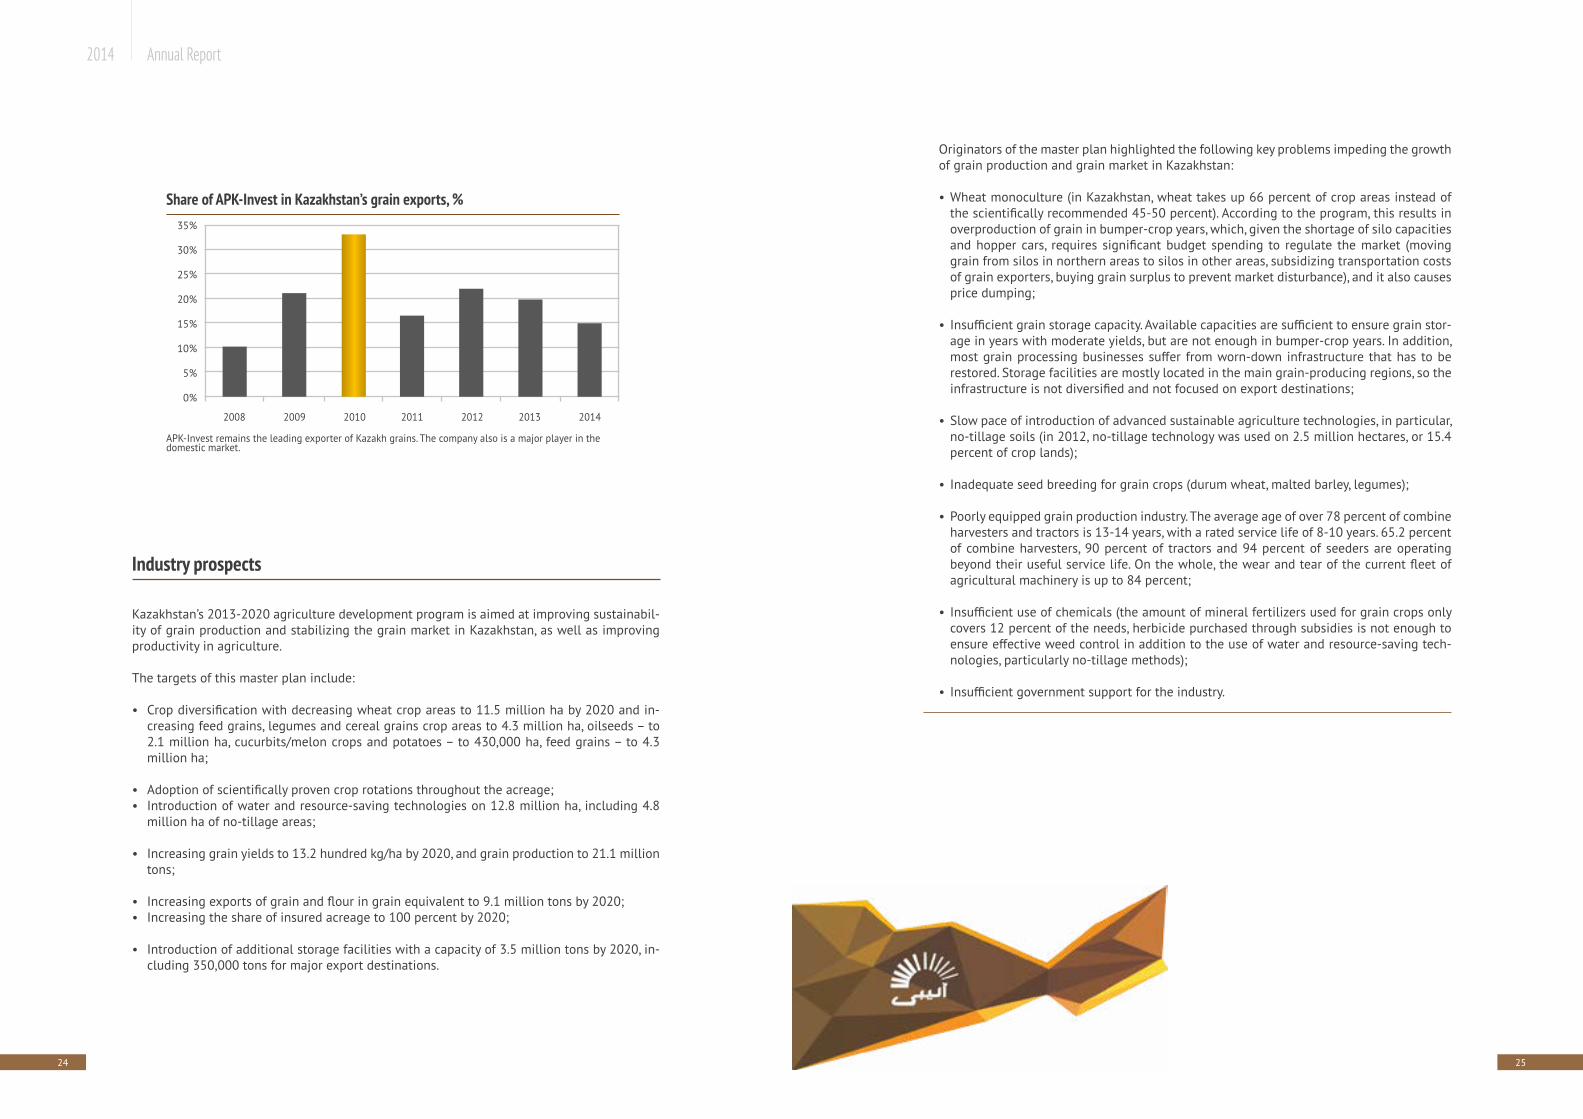
Share of APK-Invest in Kazakhstan’s grain exports, %35%
30%
25%
20%
15%
10%
5%
0%
2008 2009 2010 2011 2012 2013 2014
APK-Invest remains the leading exporter of Kazakh grains. The company also is a major player in the domestic market.
Originators of the master plan highlighted the following key problems impeding the growth of grain production and grain market in Kazakhstan:
• Wheat monoculture (in Kazakhstan, wheat takes up 66 percent of crop areas instead of the scientifically recommended 45-50 percent). According to the program, this results in overproduction of grain in bumper-crop years, which, given the shortage of silo capacities and hopper cars, requires significant budget spending to regulate the market (moving grain from silos in northern areas to silos in other areas, subsidizing transportation costs of grain exporters, buying grain surplus to prevent market disturbance), and it also causes price dumping;
• Insufficient grain storage capacity. Available capacities are sufficient to ensure grain stor-age in years with moderate yields, but are not enough in bumper-crop years. In addition, most grain processing businesses suffer from worn-down infrastructure that has to be restored. Storage facilities are mostly located in the main grain-producing regions, so the infrastructure is not diversified and not focused on export destinations;
• Slow pace of introduction of advanced sustainable agriculture technologies, in particular, no-tillage soils (in 2012, no-tillage technology was used on 2.5 million hectares, or 15.4 percent of crop lands);
• Inadequate seed breeding for grain crops (durum wheat, malted barley, legumes);
• Poorly equipped grain production industry. The average age of over 78 percent of combine harvesters and tractors is 13-14 years, with a rated service life of 8-10 years. 65.2 percent of combine harvesters, 90 percent of tractors and 94 percent of seeders are operating beyond their useful service life. On the whole, the wear and tear of the current fleet of agricultural machinery is up to 84 percent;
• Insufficient use of chemicals (the amount of mineral fertilizers used for grain crops only covers 12 percent of the needs, herbicide purchased through subsidies is not enough to ensure effective weed control in addition to the use of water and resource-saving tech-nologies, particularly no-tillage methods);
• Insufficient government support for the industry.
26 27
2014 Annual Report
ResultsAPK-Invest Corporation operates in the following areas of business:
• Wheat and barley trade;• Port services;• Other agricultural activities, which includes selling herbicides, agricultural equipment
and fuel;• Other areas, including selling diversified goods and services, plus interest income from
lease finance.
Sales in 2014 declined by 50 percent, or by 1.5 million tons. The main reason is decline in sales on the domestic market, where shipments decreased by almost 1 million tons.
Revenue by segment, million Tenge
2010 2011 2012 2013 2014 Change compared with 2014, %
Wheat and barley trade
86,620 83,146 14,2821 122,270 62,959 -49%
Port services 668 1,447 2,711 1,896 1,974 4%
Other agricultural activities
4,328 3,797 4,862 3,420 5,545 62%
Other segments 3,832 4,008 2,825 1,704 1,244 -27%
Total 95,448 92,398 153,219 129,421 71,723 -45%
Grain sold by APK-Invest 2008 2009 2010 2011 2012 2013 2014
Exports, million tons 0.56 0.77 1.79 0.59 1.81 1.1 0.64
Domestic market, million tons
0.58 0.72 1.77 2.28 2.2 1.8 0.81
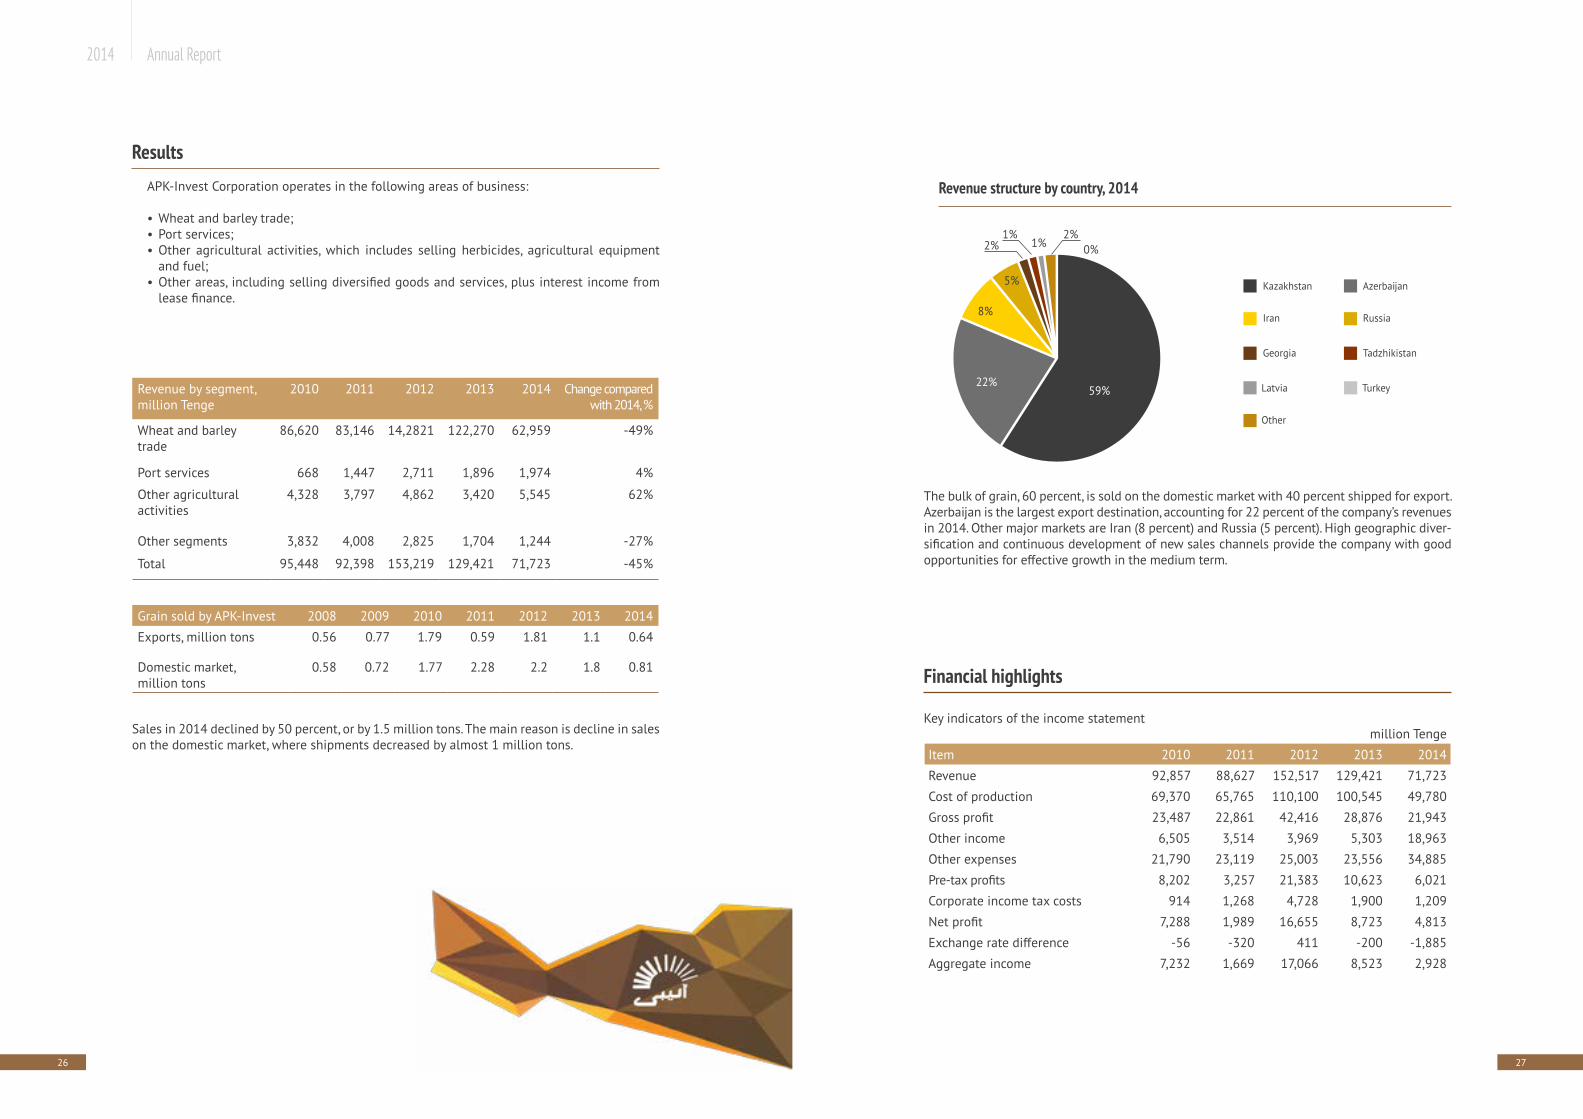
The bulk of grain, 60 percent, is sold on the domestic market with 40 percent shipped for export. Azerbaijan is the largest export destination, accounting for 22 percent of the company’s revenues in 2014. Other major markets are Iran (8 percent) and Russia (5 percent). High geographic diver-sification and continuous development of new sales channels provide the company with good opportunities for effective growth in the medium term.
Financial highlights
Key indicators of the income statementmillion Tenge
Item 2010 2011 2012 2013 2014
Revenue 92,857 88,627 152,517 129,421 71,723
Cost of production 69,370 65,765 110,100 100,545 49,780
Gross profit 23,487 22,861 42,416 28,876 21,943
Other income 6,505 3,514 3,969 5,303 18,963
Other expenses 21,790 23,119 25,003 23,556 34,885
Pre-tax profits 8,202 3,257 21,383 10,623 6,021
Corporate income tax costs 914 1,268 4,728 1,900 1,209
Net profit 7,288 1,989 16,655 8,723 4,813
Exchange rate difference -56 -320 411 -200 -1,885
Aggregate income 7,232 1,669 17,066 8,523 2,928
Revenue structure by country, 2014
Kazakhstan Аzerbaijan
Latvia Turkey
Iran Russia
Other
Georgia Tadzhikistan
59%22%
8%
5%
2%1%
1% 0%2%
28 29
2014 Annual Report
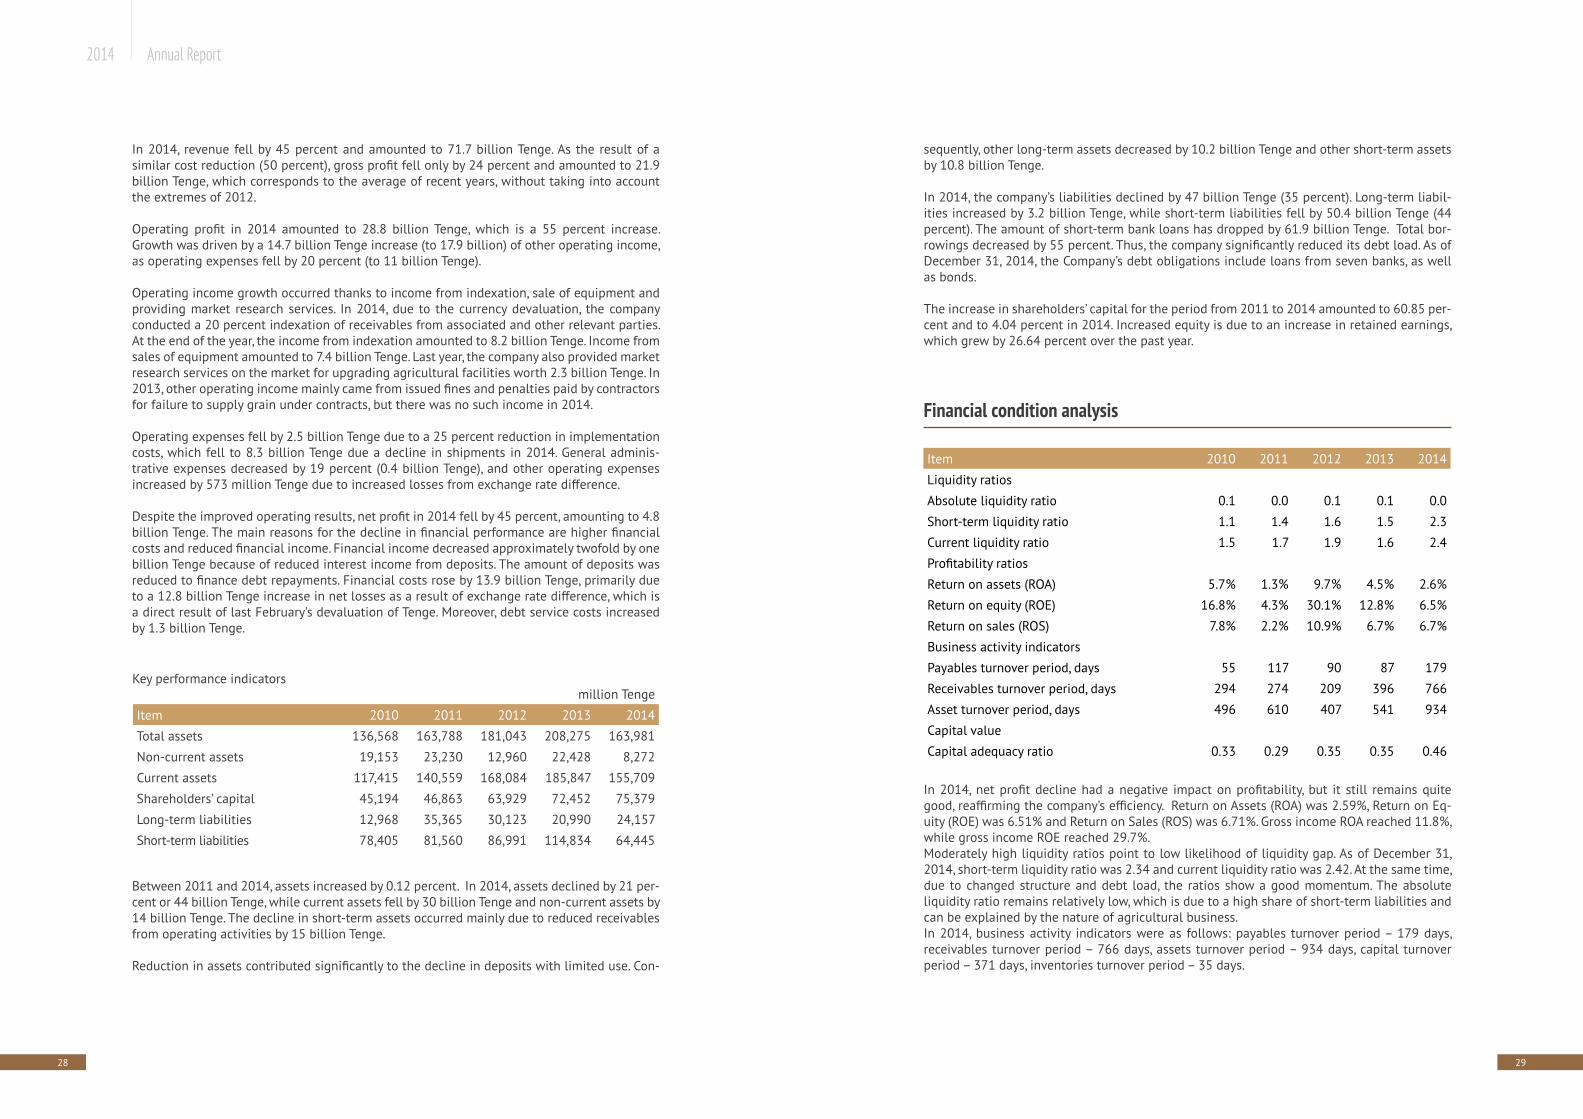
In 2014, revenue fell by 45 percent and amounted to 71.7 billion Tenge. As the result of a similar cost reduction (50 percent), gross profit fell only by 24 percent and amounted to 21.9 billion Tenge, which corresponds to the average of recent years, without taking into account the extremes of 2012.
Operating profit in 2014 amounted to 28.8 billion Tenge, which is a 55 percent increase. Growth was driven by a 14.7 billion Tenge increase (to 17.9 billion) of other operating income, as operating expenses fell by 20 percent (to 11 billion Tenge).
Operating income growth occurred thanks to income from indexation, sale of equipment and providing market research services. In 2014, due to the currency devaluation, the company conducted a 20 percent indexation of receivables from associated and other relevant parties. At the end of the year, the income from indexation amounted to 8.2 billion Tenge. Income from sales of equipment amounted to 7.4 billion Tenge. Last year, the company also provided market research services on the market for upgrading agricultural facilities worth 2.3 billion Tenge. In 2013, other operating income mainly came from issued fines and penalties paid by contractors for failure to supply grain under contracts, but there was no such income in 2014.
Operating expenses fell by 2.5 billion Tenge due to a 25 percent reduction in implementation costs, which fell to 8.3 billion Tenge due a decline in shipments in 2014. General adminis-trative expenses decreased by 19 percent (0.4 billion Tenge), and other operating expenses increased by 573 million Tenge due to increased losses from exchange rate difference.
Despite the improved operating results, net profit in 2014 fell by 45 percent, amounting to 4.8 billion Tenge. The main reasons for the decline in financial performance are higher financial costs and reduced financial income. Financial income decreased approximately twofold by one billion Tenge because of reduced interest income from deposits. The amount of deposits was reduced to finance debt repayments. Financial costs rose by 13.9 billion Tenge, primarily due to a 12.8 billion Tenge increase in net losses as a result of exchange rate difference, which is a direct result of last February’s devaluation of Tenge. Moreover, debt service costs increased by 1.3 billion Tenge.
Between 2011 and 2014, assets increased by 0.12 percent. In 2014, assets declined by 21 per-cent or 44 billion Tenge, while current assets fell by 30 billion Tenge and non-current assets by 14 billion Tenge. The decline in short-term assets occurred mainly due to reduced receivables from operating activities by 15 billion Tenge.
Reduction in assets contributed significantly to the decline in deposits with limited use. Con-
Key performance indicators million Tenge
Item 2010 2011 2012 2013 2014
Total assets 136,568 163,788 181,043 208,275 163,981
Non-current assets 19,153 23,230 12,960 22,428 8,272
Current assets 117,415 140,559 168,084 185,847 155,709
Shareholders’ capital 45,194 46,863 63,929 72,452 75,379
Long-term liabilities 12,968 35,365 30,123 20,990 24,157
Short-term liabilities 78,405 81,560 86,991 114,834 64,445
sequently, other long-term assets decreased by 10.2 billion Tenge and other short-term assets by 10.8 billion Tenge.
In 2014, the company’s liabilities declined by 47 billion Tenge (35 percent). Long-term liabil-ities increased by 3.2 billion Tenge, while short-term liabilities fell by 50.4 billion Tenge (44 percent). The amount of short-term bank loans has dropped by 61.9 billion Tenge. Total bor-rowings decreased by 55 percent. Thus, the company significantly reduced its debt load. As of December 31, 2014, the Company’s debt obligations include loans from seven banks, as well as bonds.
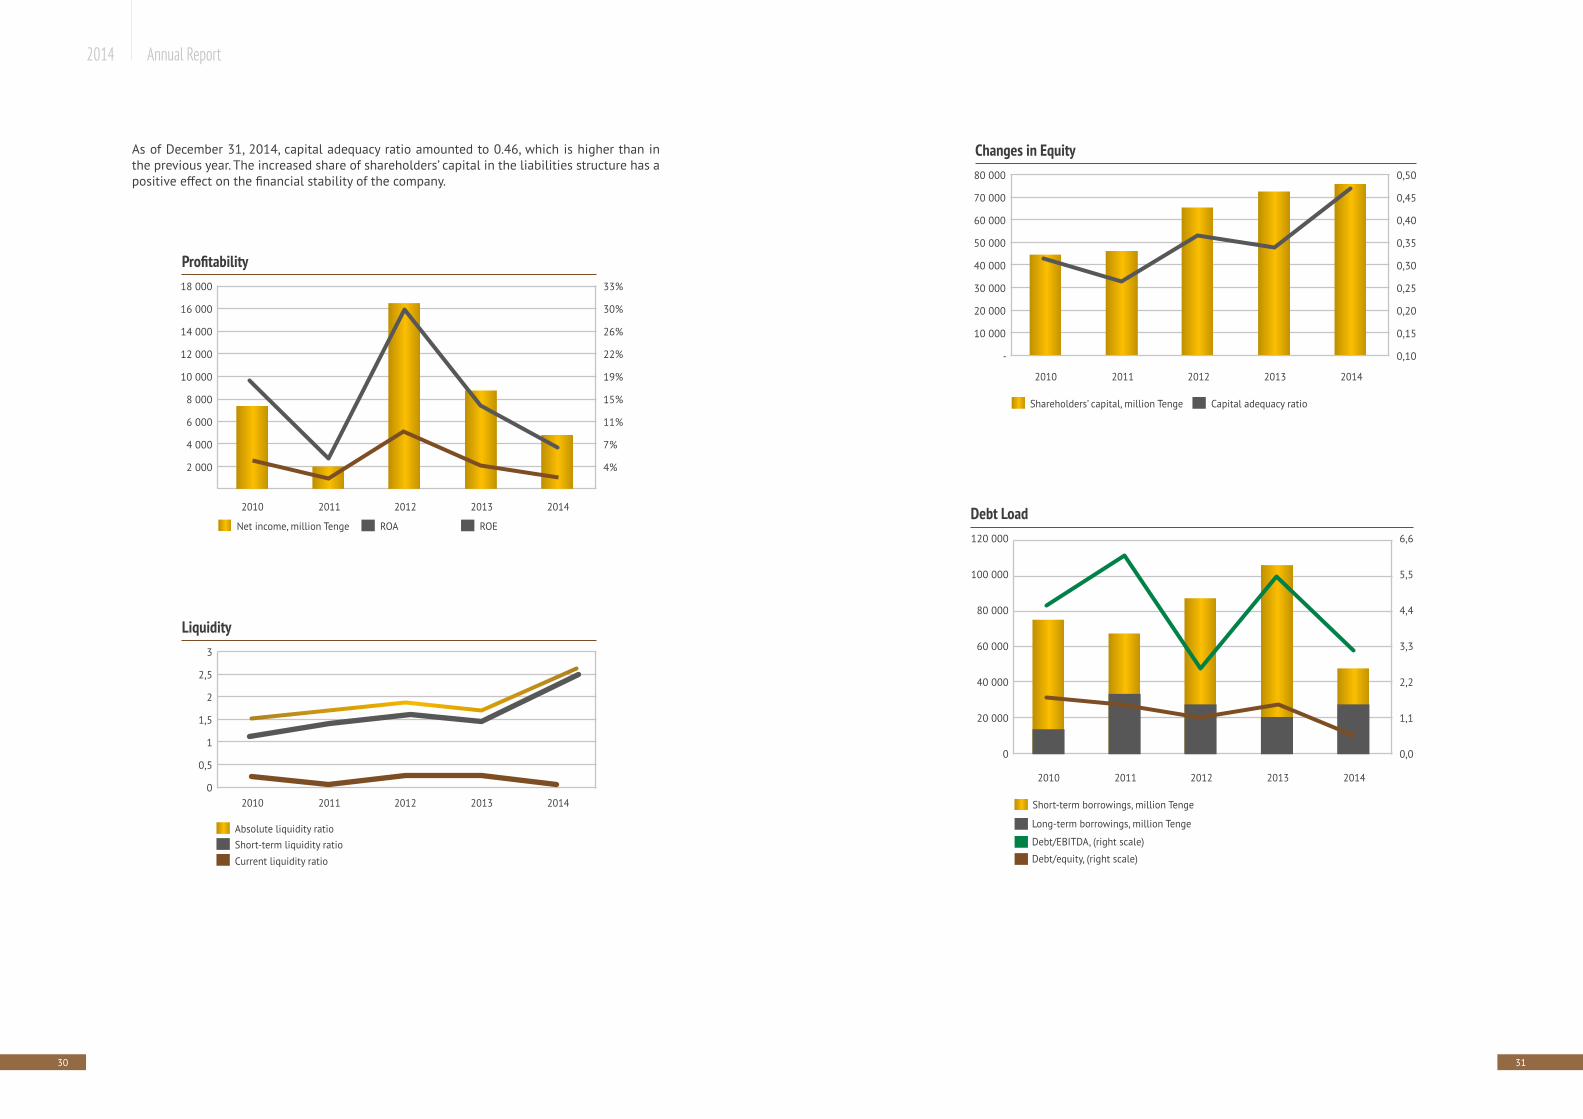
The increase in shareholders’ capital for the period from 2011 to 2014 amounted to 60.85 per-cent and to 4.04 percent in 2014. Increased equity is due to an increase in retained earnings, which grew by 26.64 percent over the past year.
Financial condition analysis
In 2014, net profit decline had a negative impact on profitability, but it still remains quite good, reaffirming the company’s efficiency. Return on Assets (ROA) was 2.59%, Return on Eq-uity (ROE) was 6.51% and Return on Sales (ROS) was 6.71%. Gross income ROA reached 11.8%, while gross income ROE reached 29.7%. Moderately high liquidity ratios point to low likelihood of liquidity gap. As of December 31, 2014, short-term liquidity ratio was 2.34 and current liquidity ratio was 2.42. At the same time, due to changed structure and debt load, the ratios show a good momentum. The absolute liquidity ratio remains relatively low, which is due to a high share of short-term liabilities and can be explained by the nature of agricultural business. In 2014, business activity indicators were as follows: payables turnover period – 179 days, receivables turnover period – 766 days, assets turnover period – 934 days, capital turnover period – 371 days, inventories turnover period – 35 days.
Item 2010 2011 2012 2013 2014
Liquidity ratios
Absolute liquidity ratio 0.1 0.0 0.1 0.1 0.0
Short-term liquidity ratio 1.1 1.4 1.6 1.5 2.3
Current liquidity ratio 1.5 1.7 1.9 1.6 2.4
Profitability ratios
Return on assets (ROA) 5.7% 1.3% 9.7% 4.5% 2.6%
Return on equity (ROE) 16.8% 4.3% 30.1% 12.8% 6.5%
Return on sales (ROS) 7.8% 2.2% 10.9% 6.7% 6.7%
Business activity indicators
Payables turnover period, days 55 117 90 87 179
Receivables turnover period, days 294 274 209 396 766
Asset turnover period, days 496 610 407 541 934
Capital value
Capital adequacy ratio 0.33 0.29 0.35 0.35 0.46
30 31
2014 Annual Report
As of December 31, 2014, capital adequacy ratio amounted to 0.46, which is higher than in the previous year. The increased share of shareholders’ capital in the liabilities structure has a positive effect on the financial stability of the company.
Profitability
Liquidity
18 000
16 000
14 000
12 000
10 000
8 000
6 000
4 000
2 000
3
2,5
2
1,5
1
0,5
0
33%
30%
26%
22%
19%
15%
11%
7%
4%
2010
2010
Net income, million Tenge
Absolute liquidity ratioShort-term liquidity ratioCurrent liquidity ratio
ROA ROE
2011
2011
2012
2012
2013
2013
2014
2014
Changes in Equity80 000
70 000
60 000
50 000
40 000
30 000
20 000
10 000
-
0,50
0,45
0,40
0,35
0,30
0,25
0,20
0,15
0,10
2010
Shareholders’ capital, million Tenge Capital adequacy ratio
2011 2012 2013 2014
Debt Load120 000
100 000
80 000
60 000
40 000
20 000
0
6,6
5,5
4,4
3,3
2,2
1,1
0,0
2010
Short-term borrowings, million Tenge
Long-term borrowings, million Tenge
Debt/EBITDA, (right scale)
Debt/equity, (right scale)
2011 2012 2013 2014
32 33
2014 Annual Report
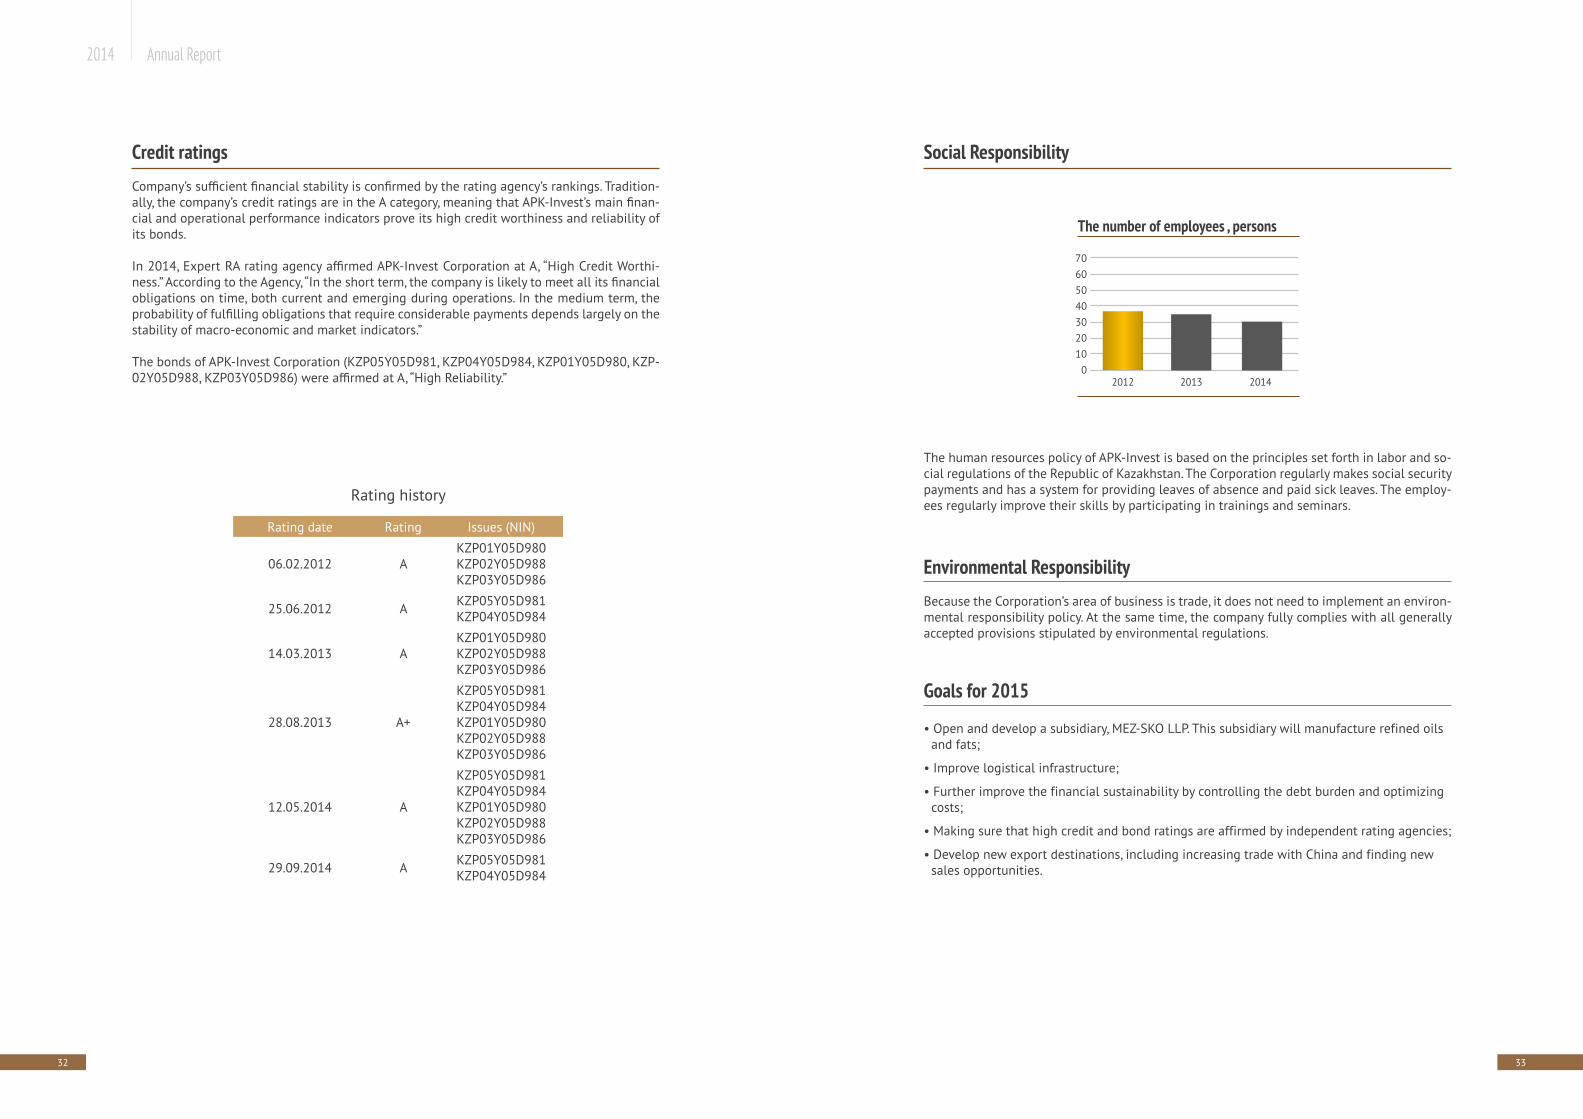
Credit ratingsCompany’s sufficient financial stability is confirmed by the rating agency’s rankings. Tradition-ally, the company’s credit ratings are in the A category, meaning that APK-Invest’s main finan-cial and operational performance indicators prove its high credit worthiness and reliability of its bonds.
In 2014, Expert RA rating agency affirmed APK-Invest Corporation at A, “High Credit Worthi-ness.” According to the Agency, “In the short term, the company is likely to meet all its financial obligations on time, both current and emerging during operations. In the medium term, the probability of fulfilling obligations that require considerable payments depends largely on the stability of macro-economic and market indicators.”
The bonds of APK-Invest Corporation (KZP05Y05D981, KZP04Y05D984, KZP01Y05D980, KZP-02Y05D988, KZP03Y05D986) were affirmed at A, “High Reliability.”
Social Responsibility
The human resources policy of APK-Invest is based on the principles set forth in labor and so-cial regulations of the Republic of Kazakhstan. The Corporation regularly makes social security payments and has a system for providing leaves of absence and paid sick leaves. The employ-ees regularly improve their skills by participating in trainings and seminars.
Environmental Responsibility Because the Corporation’s area of business is trade, it does not need to implement an environ-mental responsibility policy. At the same time, the company fully complies with all generally accepted provisions stipulated by environmental regulations.
Goals for 2015
• Open and develop a subsidiary, MEZ-SKO LLP. This subsidiary will manufacture refined oils and fats;
• Improve logistical infrastructure;
• Further improve the financial sustainability by controlling the debt burden and optimizing costs;
• Making sure that high credit and bond ratings are affirmed by independent rating agencies;
• Develop new export destinations, including increasing trade with China and finding new sales opportunities.
2012
Rating history
Rating date Rating Issues (NIN)
06.02.2012 АKZP01Y05D980KZP02Y05D988KZP03Y05D986
25.06.2012 А KZP05Y05D981KZP04Y05D984
14.03.2013 АKZP01Y05D980KZP02Y05D988KZP03Y05D986
28.08.2013 А+
KZP05Y05D981KZP04Y05D984 KZP01Y05D980KZP02Y05D988KZP03Y05D986
12.05.2014 А
KZP05Y05D981KZP04Y05D984 KZP01Y05D980KZP02Y05D988KZP03Y05D986
29.09.2014 А KZP05Y05D981KZP04Y05D984
The number of employees , persons
70605040302010
02013 2014
34 35
2014 Annual Report
Risk factors:
Business risks.
The company mostly operates in the agricultural sector, which is exposed to a number of risks. In this regard, the key business risks depend on external factors, such as weather, which affect the yield and quality of wheat and other products. This may cause sharp fluctuations in the crops harvested.
Key industry risks:• Weather and other natural hazards (droughts, floods, locust)• Overproduction of similar products in the world• High volatility in grain prices• Policies of neighboring countries• Reduced demand as a result of reduced consumption• Sharp increase in production costs (prices for fuel, herbicides and seeds) • Loss and seizure of lands by the state• Inadequate logistics of delivering grain to the end consumer (lack of hopper cars)
The occurrence of one or more of the above risks may cause a decline in income and deterio-ration of business conditions.
In exchange for wheat and other products for trading after harvesting, the company provides farms with financing, which is shown in the balance sheet as Advances Paid. These advances are a financial risk for the company. The management strictly monitors the balance of ad-vanced paid to minimize credit losses.
Financial risk factors.
Financial risk management in the company covers risks associated with prices for goods, finan-cial risks, operational risks and legal risks.
RISK MANAGEMENT
As mentioned before, the company’s main business is selling wheat, which exposes it to risks of product price changes. Local and global market conditions could cause changes, including significant changes in prices for agricultural products.
Operational and legal risk management was established to ensure the proper functioning of the internal policies and procedures and minimize operational and legal risks.
Financial risks include market risks (currency risk, interest rate risk and other price risks), credit risk and liquidity risk. The main goal of financial risk management is to determine risk limits and further ensure compliance with established limits.
Risk management program is based on the implied unpredictability of financial markets and focuses on minimizing the adverse impacts on the company’s financial condition. Daily oper-ations are overseen by the supreme body of operational management, responsible for oper-ating decision making and legal risk management under the control of the company’s legal department.
Credit risk. The company is exposed to credit risk, meaning that one party to a financial instru-ment could bring financial loss to the other party, being unable to perform its contractual ob-ligations. Exposure to credit risk arises from selling the company products on credit, as well as from other transactions with counterparties, where financial assets are created. The company has policies to ensure it sells its products and services to customers with an appropriate credit history. The company has no internal ranking procedures or limits imposed on counterparties. The management analyses the unpaid receivables by maturity and keeps track of overdue receivables.
Concentration of credit risk. The company is exposed to concentration of credit risk. As of December 31, 2014, the company had four counterparties, of which two are significant other parties (2013: four counterparties, of which two were related parties and the other two were other significant parties). Receivables outstanding from these counterparties made up over 10 percent of the total receivables from the core business and other receivables. The receivables totaled 12.2 billion Tenge (2013: 19.7 billion, or 50 percent of the total receivables from the core business and other receivables, 2013: 40 percent).
36 37
2014 Annual Report
Market risk. The company is exposed to market risks. Market risks are associated with open po-sitions on a) foreign currencies and b) assets, generating interest income and interest obliga-tions that are exposed to general and specific market movements. The management sets risk limits and monitors compliance with them on a regular basis. However, this approach cannot prevent losses in excess of these limits in the event of more significant market movements.
Currency risk. Revenue from export sales is mainly in United States dollars, while loans are partially in foreign currency, mainly in United States dollars and euros.
Risk of interest rate changes affecting cash flow. The company is exposed to the risk of interest rate fluctuations affecting its financial condition and cash flow. In particular, we are talking about the risk of interest rate changes associated with loans and short-term bank deposits. The company has floating-rate loans.
Liquidity risk. Liquidity risk affects the company’s ability to meet its financial obligations. The company’s approach to liquidity management is to ensure continuous and sufficient liquidity to repay obligations as they mature (in both normal and unusual situations), avoiding unac-ceptable losses or reputational risks.
By virtue of the dynamic nature of the business, the company tries to maintain a stable funding base, consisting mostly of shareholders’ capital, loans, payables from core activities and other payables.
The management controls cash flow projections. The company ensures the availability of funds at short notice in an amount sufficient to cover the expected operating costs. At the same time, the potential impact of exceptional circumstances – which could not be reasonably foreseen, like for instance, natural disasters – is not taken into account.
Capital risk management. The goal of risk management with regard to capital management is to ensure continuity of the company’s operations in order to preserve ROE for the members and provide benefits for other stakeholders.
Like other companies in the industry, APK-Invest has substantial borrowing needs. Financing management is carried out on a daily basis by the supreme operational management body, re-sponsible for operational decision making, and by other senior managers. The company active-ly manages its debt obligations to reduce financing costs. There are certain borrowings, where a certain debt-to-capital ratio has to be met. When discussing new credit lines, the company needs to get approval from such borrowers, who have to agree with the new debt-to-capital ratio.
As of December 31, 2014 and 2013, the company considered the ratio of its total debt to its to-tal capital to be adequate and consistent with industry standards. The share of debt declined from 59 percent in 2013 to 39 percent in 2014.
CORPORATE GOVERNANCE
38 39
2014 Annual Report
CORPORATE GOVERNANCE
Ownership structure
As of December 31, the ultimate beneficiary of the company is Nurlan Tleubayev (99%).
Owner Equity shareAlibi Holding LLP 99%Tleubayev N. S. 1%
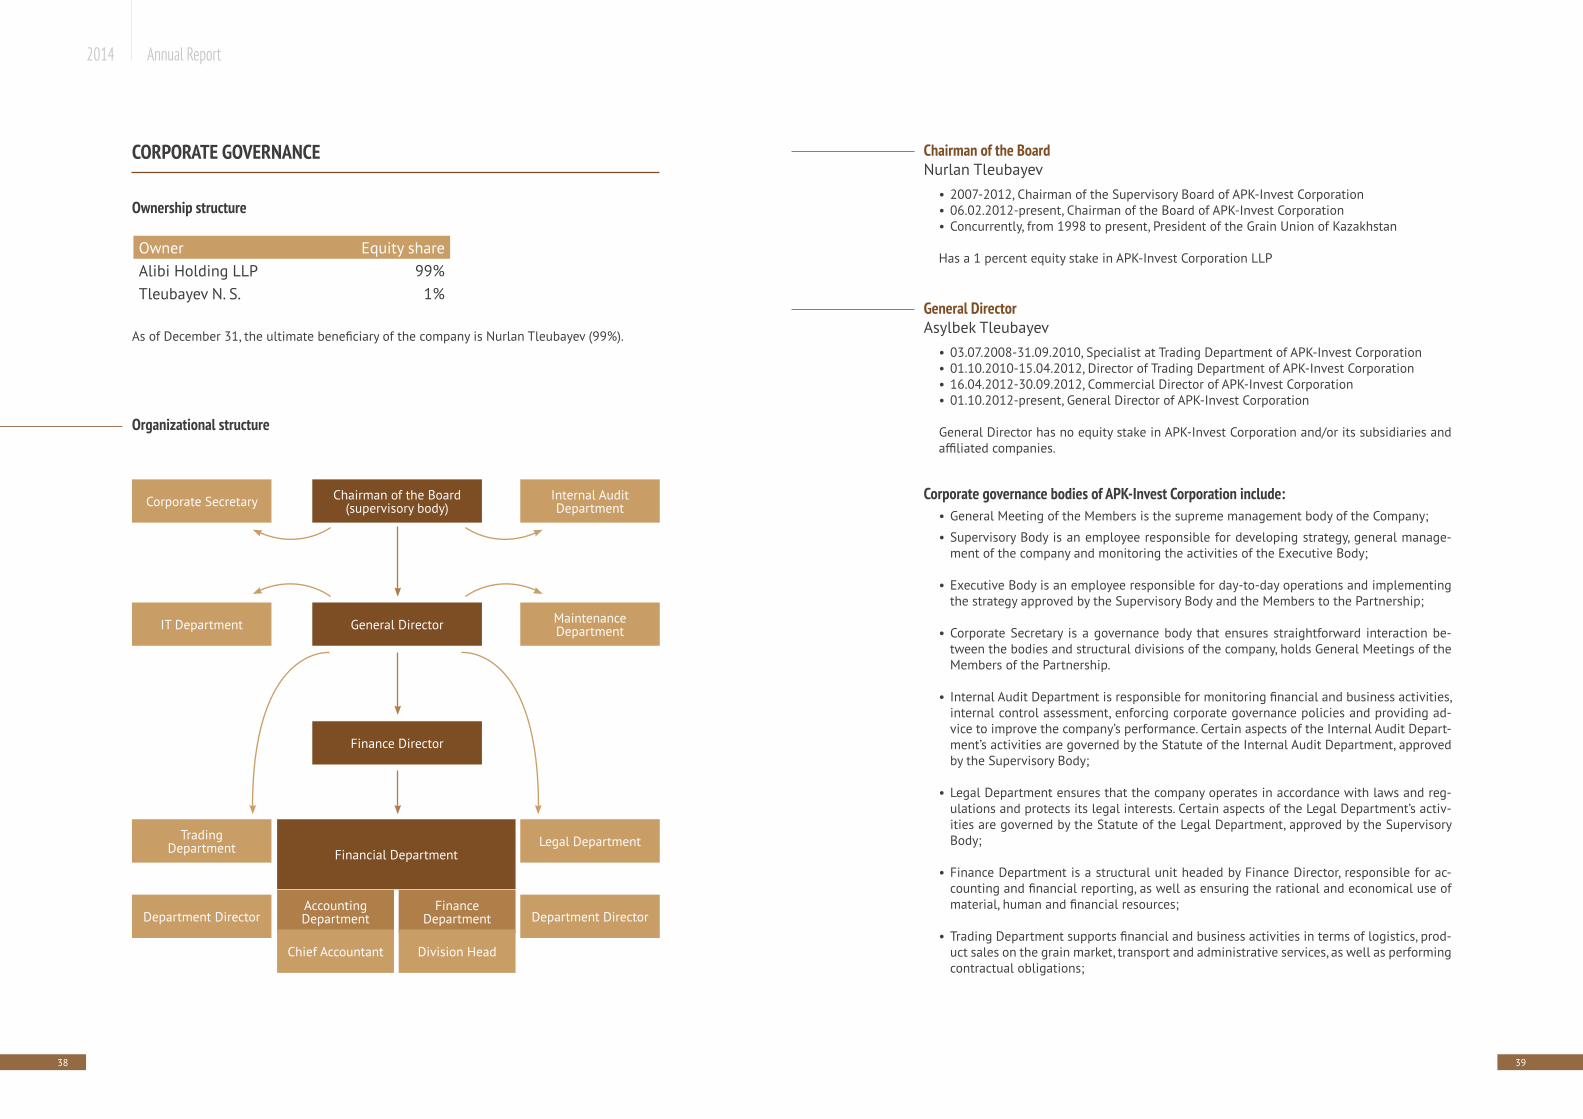
Organizational structure
Corporate Secretary
IT Department
Trading Department Financial Department
Accounting Department
Chief Accountant
Finance Department
Division Head
Legal Department
Department DirectorDepartment Director
Chairman of the Board(supervisory body)
General Director
Finance Director
Internal Audit Department
MaintenanceDepartment
Chairman of the Board Nurlan Tleubayev
• 2007-2012, Chairman of the Supervisory Board of APK-Invest Corporation• 06.02.2012-present, Chairman of the Board of APK-Invest Corporation• Concurrently, from 1998 to present, President of the Grain Union of Kazakhstan
Has a 1 percent equity stake in APK-Invest Corporation LLP
General DirectorAsylbek Tleubayev
• 03.07.2008-31.09.2010, Specialist at Trading Department of APK-Invest Corporation• 01.10.2010-15.04.2012, Director of Trading Department of APK-Invest Corporation• 16.04.2012-30.09.2012, Commercial Director of APK-Invest Corporation• 01.10.2012-present, General Director of APK-Invest Corporation
General Director has no equity stake in APK-Invest Corporation and/or its subsidiaries and affiliated companies.
Corporate governance bodies of APK-Invest Corporation include:• General Meeting of the Members is the supreme management body of the Company;
• Supervisory Body is an employee responsible for developing strategy, general manage-ment of the company and monitoring the activities of the Executive Body;
• Executive Body is an employee responsible for day-to-day operations and implementing the strategy approved by the Supervisory Body and the Members to the Partnership;
• Corporate Secretary is a governance body that ensures straightforward interaction be-tween the bodies and structural divisions of the company, holds General Meetings of the Members of the Partnership.
• Internal Audit Department is responsible for monitoring financial and business activities, internal control assessment, enforcing corporate governance policies and providing ad-vice to improve the company’s performance. Certain aspects of the Internal Audit Depart-ment’s activities are governed by the Statute of the Internal Audit Department, approved by the Supervisory Body;
• Legal Department ensures that the company operates in accordance with laws and reg-ulations and protects its legal interests. Certain aspects of the Legal Department’s activ-ities are governed by the Statute of the Legal Department, approved by the Supervisory Body;
• Finance Department is a structural unit headed by Finance Director, responsible for ac-counting and financial reporting, as well as ensuring the rational and economical use of material, human and financial resources;
• Trading Department supports financial and business activities in terms of logistics, prod-uct sales on the grain market, transport and administrative services, as well as performing contractual obligations;
40 41
2014 Annual Report
• IT Department is responsible for organization, management, coordination, monitoring and implementation of activities to ensure the smooth functioning and development of the company’s software and hardware systems;
• Maintenance Department is responsible for keeping the car fleet up and running, its safe operation and timely provision of vehicles to other staff to perform their responsibilities.
Corporate governance principles
Corporate governance of APK-Invest Corporation is based on the principles of justice, honesty, responsibility, transparency, professionalism and competence. Effective corporate governance means respect for the rights and interests of all stakeholders, helping the company to be suc-cessful, including increasing its value, fostering its financial stability and profitability.
The fundamental principles of corporate governance include:
• Protection of the rights and interests of the Members;Corporate governance in the Partnership is based on the principle of protection of and respect for the rights and legitimate interests of its Members, facilitating efficient opera-tion of the Partnership, including increasing its assets and fostering its financial stability and profitability.
• Independence of the Partnership;The Partnership operates with a view to respect the interests of its Members to the max-imum extent possible. The Partnership operates independently. Transactions and the re-lationship between the Members of the Partnership are based on the usual commercial principles in accordance with the current laws and regulations.
• Transparency and objectivity of disclosure of information about the activities of the Part-nership;
For informed decision making, the Partnership ensures timely disclosure of accurate in-formation about the Partnership to its Members and other interested parties, including its financial condition and performance, business results, ownership and management structure.
• Legality and ethics;The Partnership is guided by the law, generally accepted principles of business and cor-porate ethics, its Charter, the Corporate Governance Code and its contractual obligations. The relationship between the Members, the Supervisory Body, the Executive Body and other structural units of the Partnership are based on mutual trust, respect, accountability and control.
• Effective human resources policy.Corporate governance in the Partnership is based on the principle of protecting the rights of its employees in accordance with laws and regulations, and seeks to promote co-oper-ation between the Partnership and its employees in resolving social issues and regulating working conditions. One of the key principles of the human resources policy is to preserve jobs to the extent possible, depending on the performance of the Partnership, improve working conditions and provide employees with the necessary social protection.
Internal control and audit
To ensure internal control and internal audit, APK-Invest Corporation has the Internal Audit Department reporting to the Chairman of the Board. The Internal Audit Department is respon-sible for monitoring financial and business activities of the company.
To enforce the principles of objectivity and impartiality, the Supervisory Body approved the Statute of the Internal Audit Department.
Internal control and internal audit allow to quickly identify, prevent and limit financial and operational risks, as well as possible employee misconduct. Thus, internal control and inter-nal audit help the company to reduce its costs and facilitate the effective management of its resources.
The goals of internal control and internal audit in APK-Invest Corporation include: • Achieving operational and financial effectiveness, which involves inspecting the efficiency
and cost-effectiveness of asset management and determining the probability of losses;• Reliability, completeness and timeliness of financial and management information; This in-
volves ensuring that financial statements are reliable and of high quality, which also applies to other financial instruments used by the company when making decisions.
The system of internal control and internal audit in APK-Invest Corporation consists of five main elements: the internal control environment, identification of risks and control objects, control procedures, information support and monitoring.
The existence of the internal control environment means APK-Invest Corporation should have an appropriate organizational structure, helping to minimize risks, increase employee aware-ness of risk management and internal control as a part of the company’s corporate culture.
42 43
2014 Annual Report
Liability section
The present annual report may contain certain forward-looking statements with respect to business activities, strategies and development plans of the Company, as well as the develop-ment of the industry.
Statements containing a forecast of future events are influenced by risk factors, uncertainties and other factors, because of which the actual results may not match the expected results.In this regard, the Company recommends against excessive reliance on the accuracy of fore-casting of future events provided in this Annual Report. The Company does not undertake any obligation to review these forward-looking statements publicly, except as otherwise required by applicable laws and regulations.
ANNEX
Financial statements
44 45
2014 Annual Report
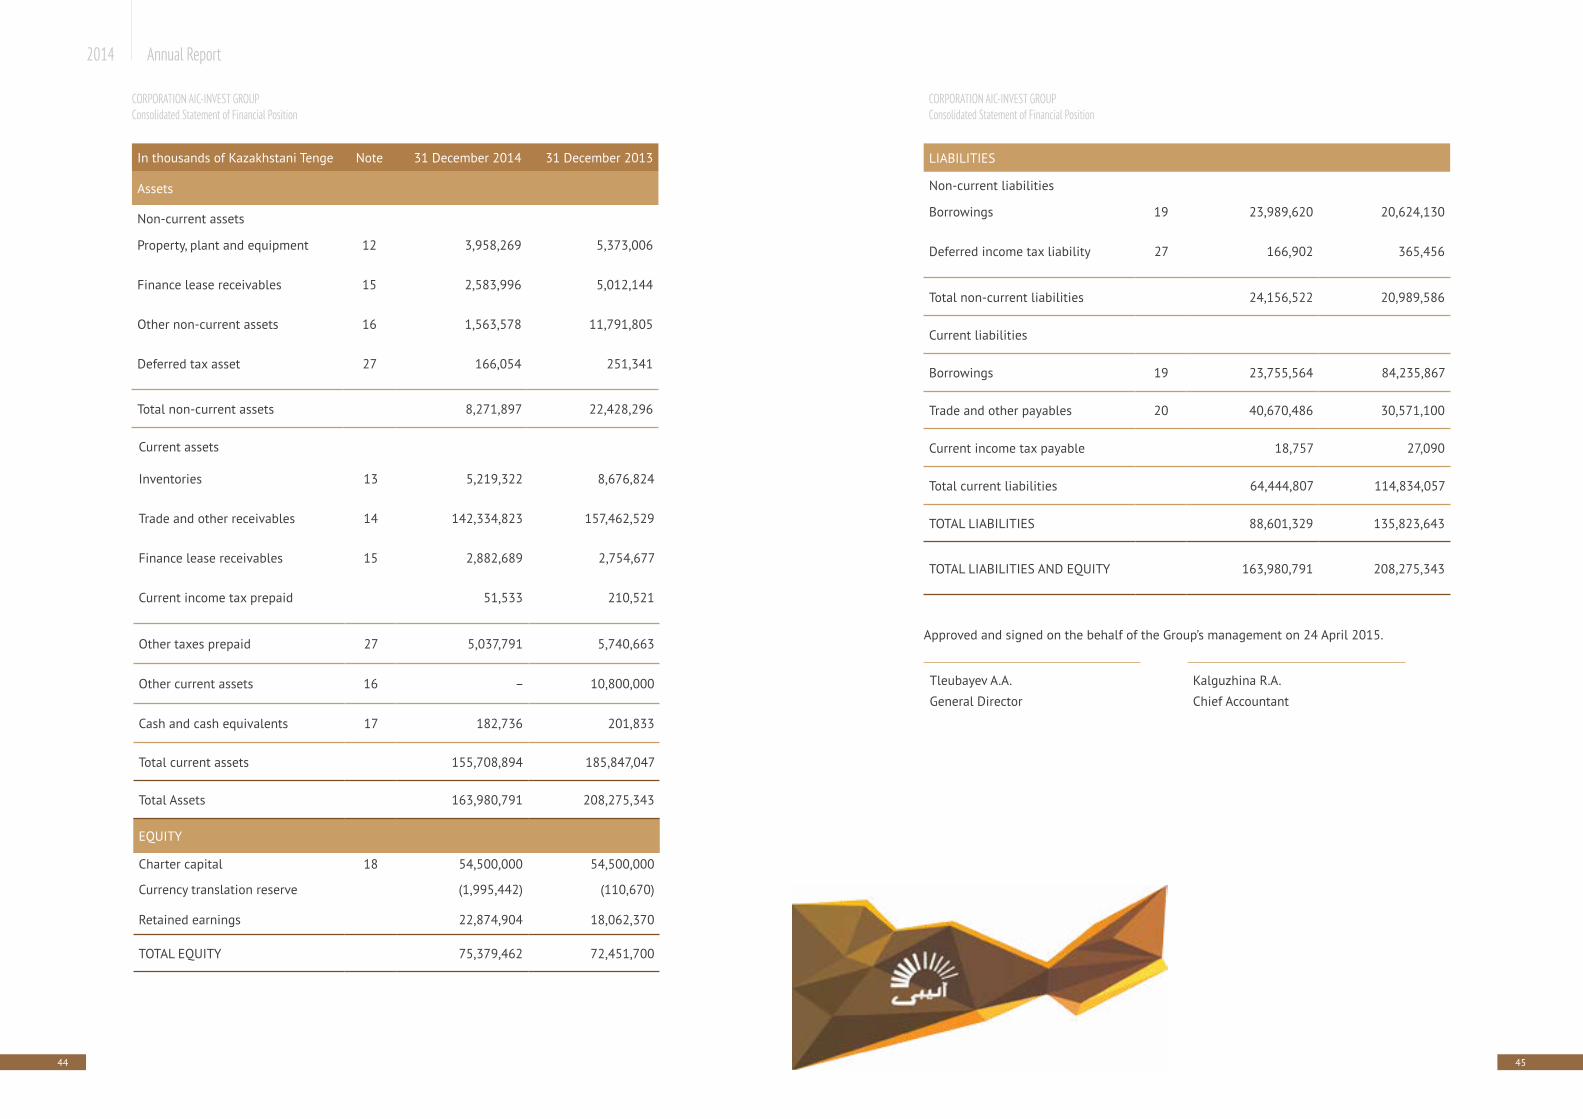
LIABILITIES
Non-current liabilities
Borrowings 19 23,989,620 20,624,130
Deferred income tax liability 27 166,902 365,456
Total non-current liabilities 24,156,522 20,989,586
Current liabilities
Borrowings 19 23,755,564 84,235,867
Trade and other payables 20 40,670,486 30,571,100
Current income tax payable 18,757 27,090
Total current liabilities 64,444,807 114,834,057
TOTAL LIABILITIES 88,601,329 135,823,643
TOTAL LIABILITIES AND EQUITY 163,980,791 208,275,343
Approved and signed on the behalf of the Group’s management on 24 April 2015.
Tleubayev A.A. Kalguzhina R.A.
General Director Chief Accountant
In thousands of Kazakhstani Tenge Note 31 December 2014 31 December 2013
Assets
Non-current assets
Property, plant and equipment 12 3,958,269 5,373,006
Finance lease receivables 15 2,583,996 5,012,144
Other non-current assets 16 1,563,578 11,791,805
Deferred tax asset 27 166,054 251,341
Total non-current assets 8,271,897 22,428,296
Current assets
Inventories 13 5,219,322 8,676,824
Trade and other receivables 14 142,334,823 157,462,529
Finance lease receivables 15 2,882,689 2,754,677
Current income tax prepaid 51,533 210,521
Other taxes prepaid 27 5,037,791 5,740,663
Other current assets 16 – 10,800,000
Cash and cash equivalents 17 182,736 201,833
Total current assets 155,708,894 185,847,047
Total Assets 163,980,791 208,275,343
EQUITY
Charter capital 18 54,500,000 54,500,000
Currency translation reserve (1,995,442) (110,670)
Retained earnings 22,874,904 18,062,370
TOTAL EQUITY 75,379,462 72,451,700
CORPORATION AIC-INVEST GROUPConsolidated Statement of Financial Position
CORPORATION AIC-INVEST GROUPConsolidated Statement of Financial Position
46 47
2014 Annual Report
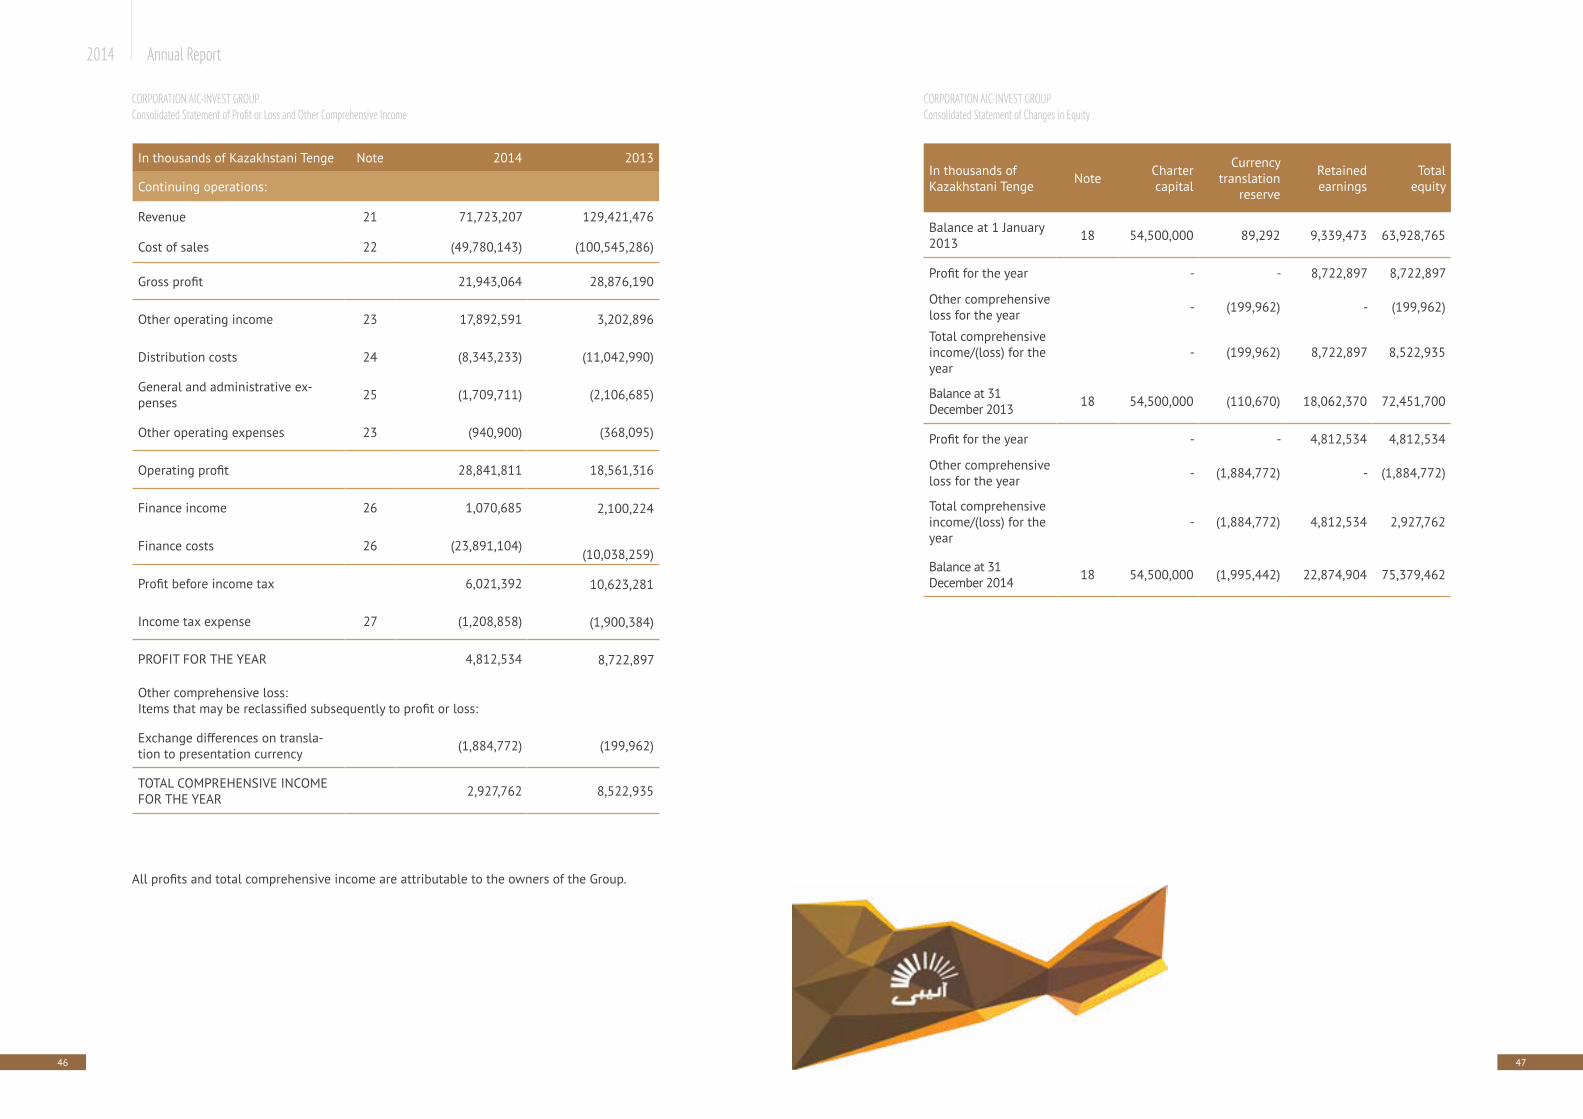
In thousands of Kazakhstani Tenge Note Charter
capital
Currencytranslation
reserve
Retainedearnings
Totalequity
Balance at 1 January 2013 18 54,500,000 89,292 9,339,473 63,928,765
Profit for the year - - 8,722,897 8,722,897
Other comprehensive loss for the year - (199,962) - (199,962)
Total comprehensive income/(loss) for the year
- (199,962) 8,722,897 8,522,935
Balance at 31 December 2013 18 54,500,000 (110,670) 18,062,370 72,451,700
Profit for the year - - 4,812,534 4,812,534
Other comprehensive loss for the year - (1,884,772) - (1,884,772)
Total comprehensive income/(loss) for the year
- (1,884,772) 4,812,534 2,927,762
Balance at 31 December 2014 18 54,500,000 (1,995,442) 22,874,904 75,379,462
In thousands of Kazakhstani Tenge Note 2014 2013
Continuing operations:
Revenue 21 71,723,207 129,421,476
Cost of sales 22 (49,780,143) (100,545,286)
Gross profit 21,943,064 28,876,190
Other operating income 23 17,892,591 3,202,896
Distribution costs 24 (8,343,233) (11,042,990)
General and administrative ex-penses 25 (1,709,711) (2,106,685)
Other operating expenses 23 (940,900) (368,095)
Operating profit 28,841,811 18,561,316
Finance income 26 1,070,685 2,100,224
Finance costs 26 (23,891,104) (10,038,259)
Profit before income tax 6,021,392 10,623,281
Income tax expense 27 (1,208,858) (1,900,384)
PROFIT FOR THE YEAR 4,812,534 8,722,897
Other comprehensive loss:Items that may be reclassified subsequently to profit or loss:
Exchange differences on transla-tion to presentation currency (1,884,772) (199,962)
TOTAL COMPREHENSIVE INCOME FOR THE YEAR 2,927,762 8,522,935
All profits and total comprehensive income are attributable to the owners of the Group.
CORPORATION AIC-INVEST GROUPConsolidated Statement of Profit or Loss and Other Comprehensive Income
CORPORATION AIC-INVEST GROUPConsolidated Statement of Changes in Equity
48 49
2014 Annual Report
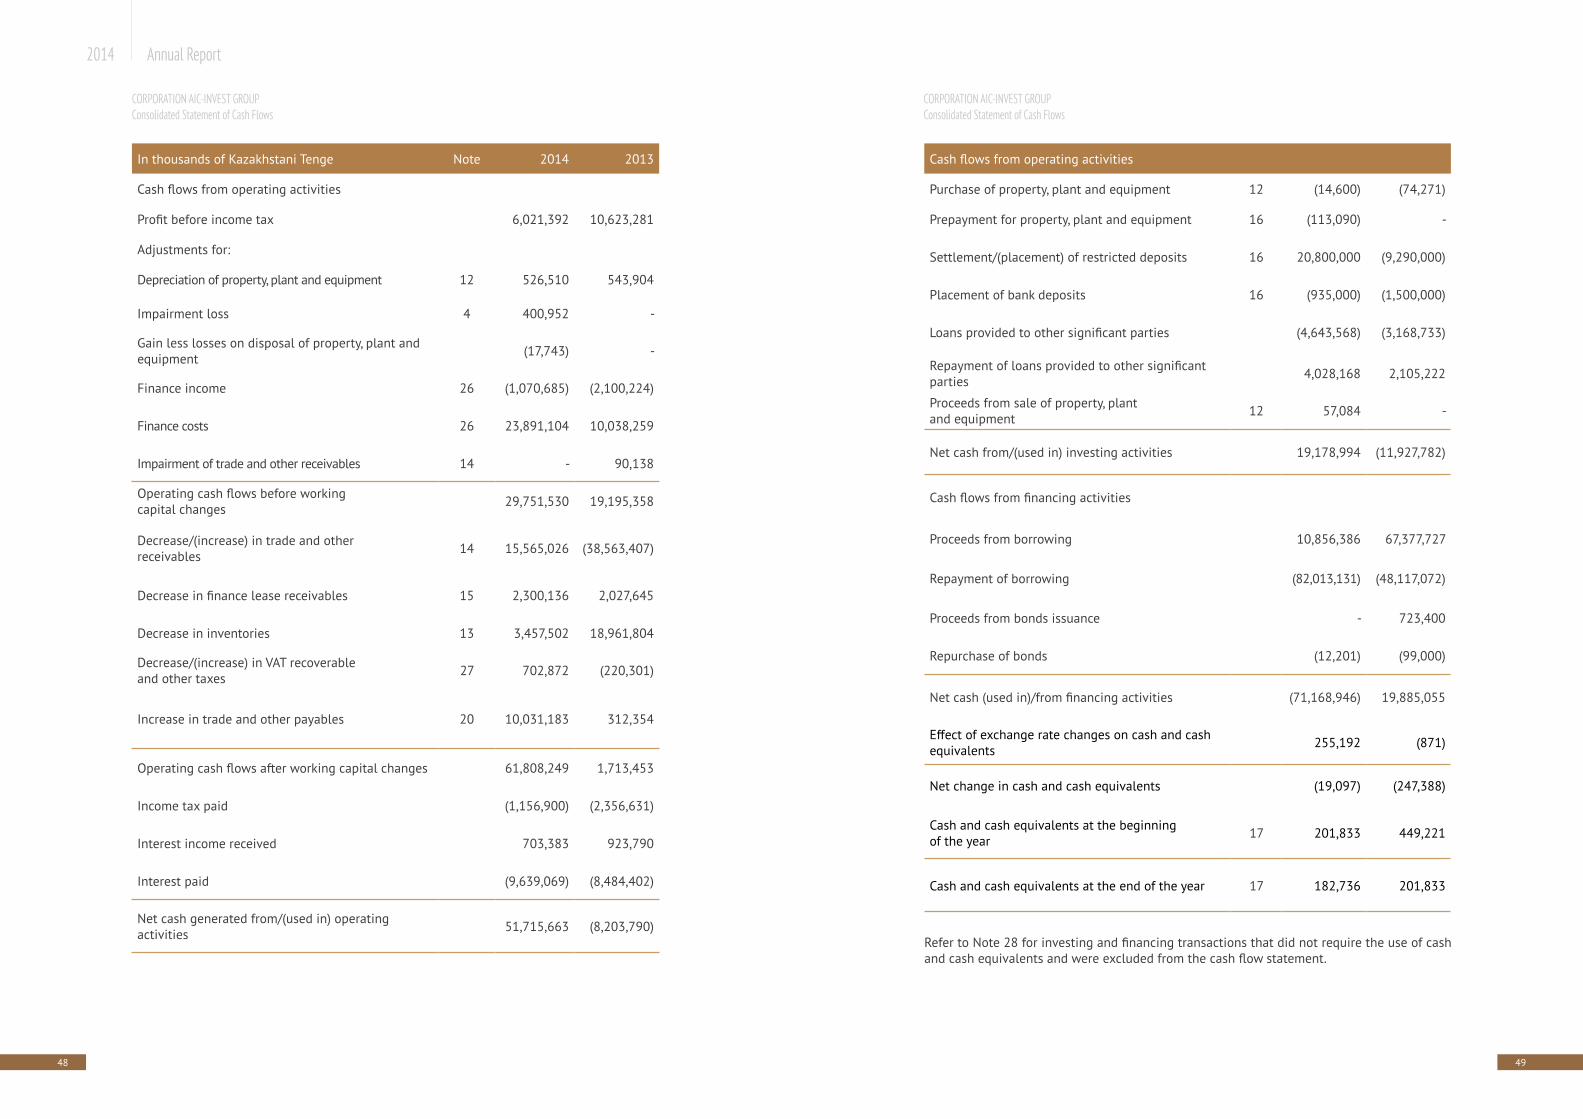
Cash flows from operating activities
Purchase of property, plant and equipment 12 (14,600) (74,271)
Prepayment for property, plant and equipment 16 (113,090) -
Settlement/(placement) of restricted deposits 16 20,800,000 (9,290,000)
Placement of bank deposits 16 (935,000) (1,500,000)
Loans provided to other significant parties (4,643,568) (3,168,733)
Repayment of loans provided to other significant parties 4,028,168 2,105,222
Proceeds from sale of property, plant and equipment 12 57,084 -
Net cash from/(used in) investing activities 19,178,994 (11,927,782)
Cash flows from financing activities
Proceeds from borrowing 10,856,386 67,377,727
Repayment of borrowing (82,013,131) (48,117,072)
Proceeds from bonds issuance - 723,400
Repurchase of bonds (12,201) (99,000)
Net cash (used in)/from financing activities (71,168,946) 19,885,055
Effect of exchange rate changes on cash and cash equivalents 255,192 (871)
Net change in cash and cash equivalents (19,097) (247,388)
Cash and cash equivalents at the beginningof the year 17 201,833 449,221
Cash and cash equivalents at the end of the year 17 182,736 201,833
Refer to Note 28 for investing and financing transactions that did not require the use of cash and cash equivalents and were excluded from the cash flow statement.
In thousands of Kazakhstani Tenge Note 2014 2013
Cash flows from operating activities
Profit before income tax 6,021,392 10,623,281
Adjustments for:
Depreciation of property, plant and equipment 12 526,510 543,904
Impairment loss 4 400,952 -
Gain less losses on disposal of property, plant and equipment (17,743) -
Finance income 26 (1,070,685) (2,100,224)
Finance costs 26 23,891,104 10,038,259
Impairment of trade and other receivables 14 - 90,138
Operating cash flows before working capital changes 29,751,530 19,195,358
Decrease/(increase) in trade and other receivables 14 15,565,026 (38,563,407)
Decrease in finance lease receivables 15 2,300,136 2,027,645
Decrease in inventories 13 3,457,502 18,961,804
Decrease/(increase) in VAT recoverable and other taxes 27 702,872 (220,301)
Increase in trade and other payables 20 10,031,183 312,354
Operating cash flows after working capital changes 61,808,249 1,713,453
Income tax paid (1,156,900) (2,356,631)
Interest income received 703,383 923,790
Interest paid (9,639,069) (8,484,402)
Net cash generated from/(used in) operating activities 51,715,663 (8,203,790)
CORPORATION AIC-INVEST GROUPConsolidated Statement of Cash Flows
CORPORATION AIC-INVEST GROUPConsolidated Statement of Cash Flows
50 51
2014 Annual Report
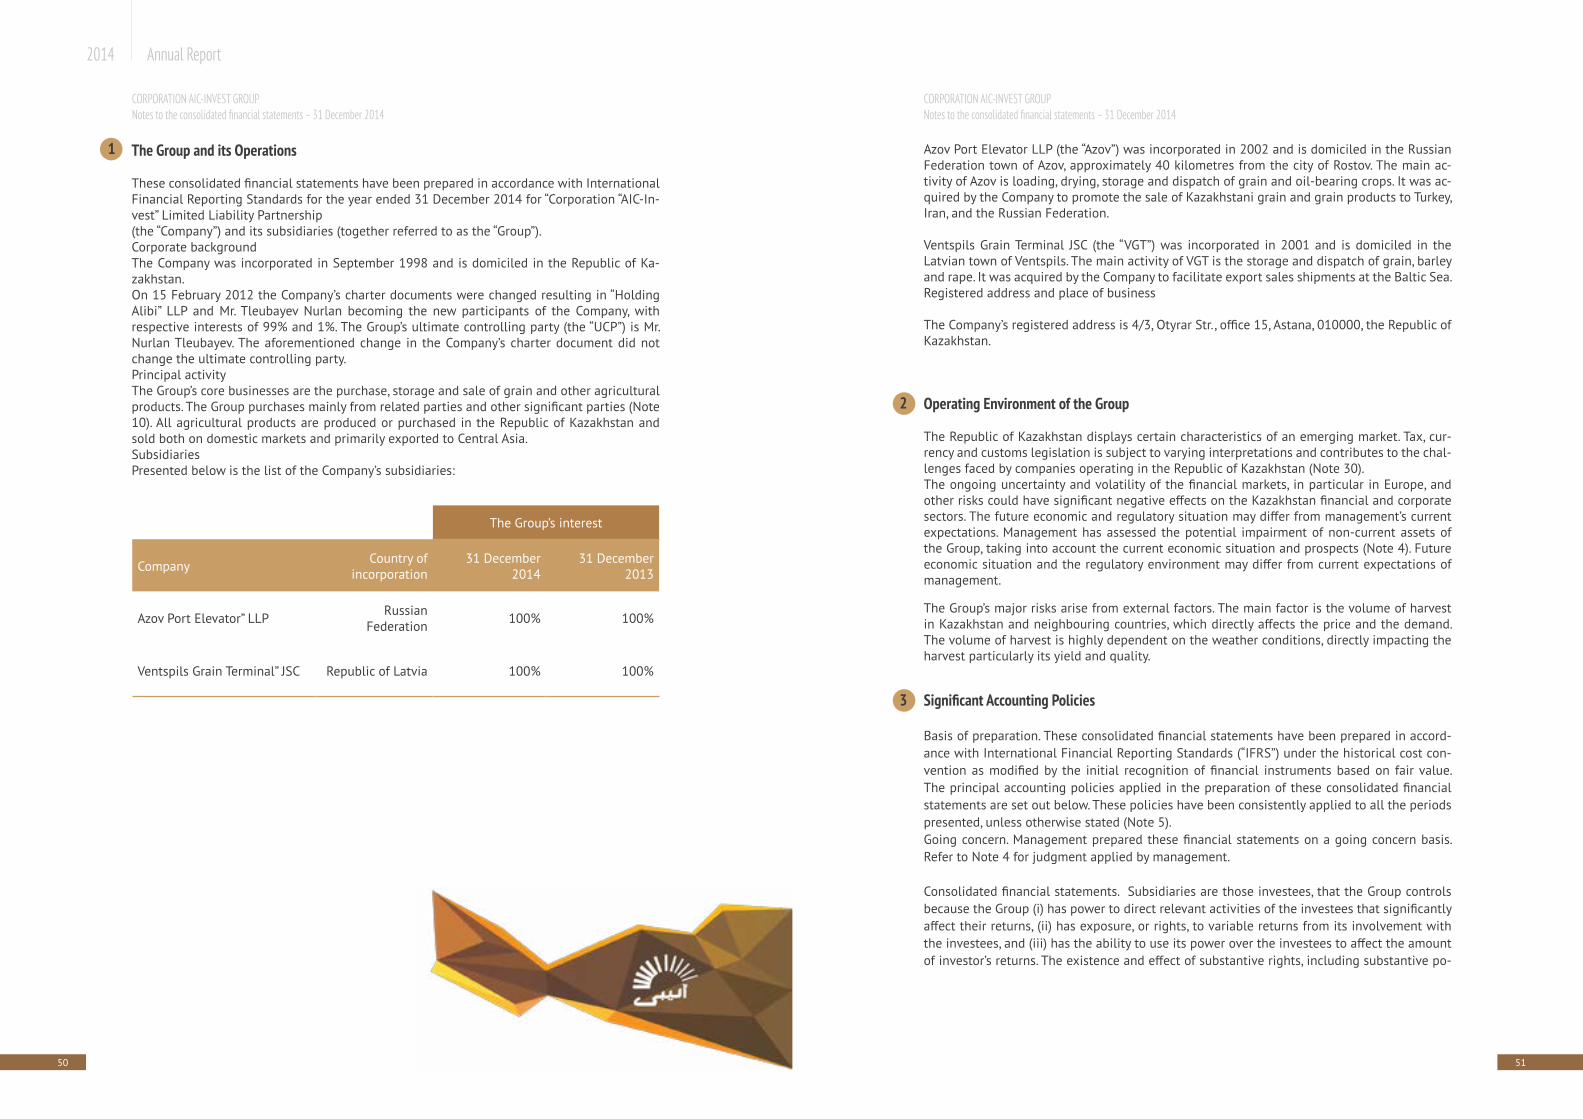
Azov Port Elevator LLP (the “Azov”) was incorporated in 2002 and is domiciled in the Russian Federation town of Azov, approximately 40 kilometres from the city of Rostov. The main ac-tivity of Azov is loading, drying, storage and dispatch of grain and oil-bearing crops. It was ac-quired by the Company to promote the sale of Kazakhstani grain and grain products to Turkey, Iran, and the Russian Federation.
Ventspils Grain Terminal JSC (the “VGT”) was incorporated in 2001 and is domiciled in the Latvian town of Ventspils. The main activity of VGT is the storage and dispatch of grain, barley and rape. It was acquired by the Company to facilitate export sales shipments at the Baltic Sea.Registered address and place of business
The Company’s registered address is 4/3, Otyrar Str., office 15, Astana, 010000, the Republic of Kazakhstan.
Operating Environment of the Group
The Republic of Kazakhstan displays certain characteristics of an emerging market. Tax, cur-rency and customs legislation is subject to varying interpretations and contributes to the chal-lenges faced by companies operating in the Republic of Kazakhstan (Note 30).The ongoing uncertainty and volatility of the financial markets, in particular in Europe, and other risks could have significant negative effects on the Kazakhstan financial and corporate sectors. The future economic and regulatory situation may differ from management’s current expectations. Management has assessed the potential impairment of non-current assets of the Group, taking into account the current economic situation and prospects (Note 4). Future economic situation and the regulatory environment may differ from current expectations of management.
The Group’s major risks arise from external factors. The main factor is the volume of harvest in Kazakhstan and neighbouring countries, which directly affects the price and the demand. The volume of harvest is highly dependent on the weather conditions, directly impacting the harvest particularly its yield and quality.
Significant Accounting Policies
Basis of preparation. These consolidated financial statements have been prepared in accord-ance with International Financial Reporting Standards (“IFRS”) under the historical cost con-vention as modified by the initial recognition of financial instruments based on fair value. The principal accounting policies applied in the preparation of these consolidated financial statements are set out below. These policies have been consistently applied to all the periods presented, unless otherwise stated (Note 5). Going concern. Management prepared these financial statements on a going concern basis. Refer to Note 4 for judgment applied by management.
Consolidated financial statements. Subsidiaries are those investees, that the Group controls because the Group (i) has power to direct relevant activities of the investees that significantly affect their returns, (ii) has exposure, or rights, to variable returns from its involvement with the investees, and (iii) has the ability to use its power over the investees to affect the amount of investor’s returns. The existence and effect of substantive rights, including substantive po-
The Group’s interest
Company Country ofincorporation
31 December 2014
31 December 2013
Azov Port Elevator” LLP Russian Federation 100% 100%
Ventspils Grain Terminal” JSC Republic of Latvia 100% 100%
CORPORATION AIC-INVEST GROUP Notes to the consolidated financial statements – 31 December 2014
CORPORATION AIC-INVEST GROUP Notes to the consolidated financial statements – 31 December 2014
2
1 The Group and its Operations
These consolidated financial statements have been prepared in accordance with International Financial Reporting Standards for the year ended 31 December 2014 for “Corporation “AIC-In-vest” Limited Liability Partnership (the “Company”) and its subsidiaries (together referred to as the “Group”). Corporate background The Company was incorporated in September 1998 and is domiciled in the Republic of Ka-zakhstan. On 15 February 2012 the Company’s charter documents were changed resulting in “Holding Alibi” LLP and Mr. Tleubayev Nurlan becoming the new participants of the Company, with respective interests of 99% and 1%. The Group’s ultimate controlling party (the “UCP”) is Mr. Nurlan Tleubayev. The aforementioned change in the Company’s charter document did not change the ultimate controlling party.Principal activityThe Group’s core businesses are the purchase, storage and sale of grain and other agricultural products. The Group purchases mainly from related parties and other significant parties (Note 10). All agricultural products are produced or purchased in the Republic of Kazakhstan and sold both on domestic markets and primarily exported to Central Asia. SubsidiariesPresented below is the list of the Company’s subsidiaries:
3
52 53
2014 Annual Report
ment of orders for the sale of products in a single transaction might affect the quoted price.Valuation techniques such as discounted cash flow models or models based on recent arm’s length transactions or consideration of financial data of the investees are used to fair value certain financial instruments for which external market pricing information is not available. Fair value measurements are analysed by level in the fair value hierarchy as follows: (i) level one are measurements at quoted prices (unadjusted) in active markets for identical assets or liabilities, (ii) level two measurements are valuations techniques with all material inputs ob-servable for the asset or liability, either directly (that is, as prices) or indirectly (that is, derived from prices), and (iii) level three measurements are valuations not based on solely observable market data (that is, the measurement requires significant unobservable inputs). There are no recurring fair value measurements.
Transaction costs are incremental costs that are directly attributable to the acquisition, issue or disposal of a financial instrument. An incremental cost is one that would not have been in-curred if the transaction had not taken place. Transaction costs include fees and commissions paid to agents (including employees acting as selling agents), advisors, brokers and dealers, levies by regulatory agencies and securities exchanges, and transfer taxes and duties. Transac-tion costs do not include debt premiums or discounts, financing costs or internal administra-tive or holding costs.
Amortised cost is the amount at which the financial instrument was recognised at initial rec-ognition less any principal repayments, plus accrued interest, and for financial assets less any write-down for incurred impairment losses. Accrued interest includes amortisation of transac-tion costs deferred at initial recognition and of any premium or discount to maturity amount using the effective interest method. Accrued interest income and accrued interest expense, including both accrued coupon and amortised discount or premium (including fees deferred at origination, if any), are not presented separately and are included in the carrying values of related items in the statement of financial position.
The effective interest method is a method of allocating interest income or interest expense over the relevant period so as to achieve a constant periodic rate of interest (effective interest rate) on the carrying amount. The effective interest rate is the rate that exactly discounts esti-mated future cash payments or receipts (excluding future credit losses) through the expected life of the financial instrument or a shorter period, if appropriate, to the net carrying amount of the financial instrument. The effective interest rate discounts cash flows of floating interest instruments to the next interest re-pricing date except for the premium or discount which reflects the credit spread over the floating rate specified in the instrument, or other variables that are not reset to market rates. Such premiums or discounts are amortised over the whole expected life of the instrument. The present value calculation includes all fees paid or re-ceived between parties to the contract that are an integral part of the effective interest rate.A major assumption having a significant impact on the reported amounts of financial assets and liabilities is the discount rate used for determination of either fair values or amortised cost. The Group provides interest free loans to other significant parties (Note 10) and issued interest free financial guarantees under related parties and other significant parties’ borrow-ings (Note 20). The discount rate for each group of assets and liabilities was determined based on inherent risks associated with particular asset or liability. Available market information, officially published industry statistics, weighted average cost of capital were considered in determining discount rate (level 3 of hierarchy).Classification of financial assets. Financial assets have the following categories: (a) loans and
tential voting rights, are considered when assessing whether the Group has power over anoth-er entity. For a right to be substantive, the holder must have practical ability to exercise that right when decisions about the direction of the relevant activities of the investee need to be made. The Group may have power over an investee even when it holds less than the majority of voting power in an investee. In such a case, the Group assesses the size of its voting rights relative to the size and dispersion of holdings of the other vote holders to determine if it has de-facto power over the investee. Protective rights of other investors, such as those that relate to fundamental changes of investee’s activities or apply only in exceptional circumstances, do not prevent the Group from controlling an investee. Subsidiaries are consolidated from the date on which control is transferred to the Group (acquisition date) and are deconsolidated from the date on which control ceases.
The acquisition method of accounting is used to account for the acquisition of subsidiaries. Identifiable assets acquired and liabilities and contingent liabilities assumed in a business combination are measured at their fair values at the acquisition date, irrespective of the extent of any non-controlling interest.
Goodwill is measured by deducting the net assets of the acquiree from the aggregate of the consideration transferred for the acquiree, the amount of non-controlling interest in the ac-quiree and fair value of an interest in the acquiree held immediately before the acquisition date. Any negative amount (“negative goodwill”) is recognised in profit or loss, after manage-ment reassesses whether it identified all the assets acquired and all liabilities and contingent liabilities assumed and reviews the appropriateness of their measurement.
The consideration transferred for the acquiree is measured at the fair value of the assets given up, equity instruments issued and liabilities incurred or assumed, including fair value of assets or liabilities from contingent consideration arrangements but excludes acquisition related costs such as advisory, legal, valuation and similar professional services. Transaction costs related to the acquisition and incurred for issuing equity instruments are deducted from equity; transaction costs incurred for issuing debt as part of the business combination are deducted from the carrying amount of the debt and all other transaction costs associated with the acquisition are expensed.
Intercompany transactions, balances and unrealised gains on transactions between group companies are eliminated; unrealised losses are also eliminated unless the cost cannot be recovered. The Company and all of its subsidiaries use uniform accounting policies consistent with the Group’s policies.Financial instruments – key measurement terms. Depending on their classification financial instruments of the Group are carried at fair value or amortised cost as described below.Fair value is the price that would be received to sell an asset or paid to transfer a liability in an orderly transaction between market participants at the measurement date. The best evidence of fair value is price in an active market. An active market is one in which transactions for the asset or liability take place with sufficient frequency and volume to provide pricing informa-tion on an ongoing basis. Fair value of financial instruments traded in an active market, estimated as the amount ob-tained by multiplying the quoted price of a single asset or liability on the number retained by the company. This is the case even if the normal daily turnover of the market is not sufficient to absorb the amount of assets and liabilities which are available at the company and the place-
CORPORATION AIC-INVEST GROUP Notes to the consolidated financial statements – 31 December 2014
CORPORATION AIC-INVEST GROUP Notes to the consolidated financial statements – 31 December 2014
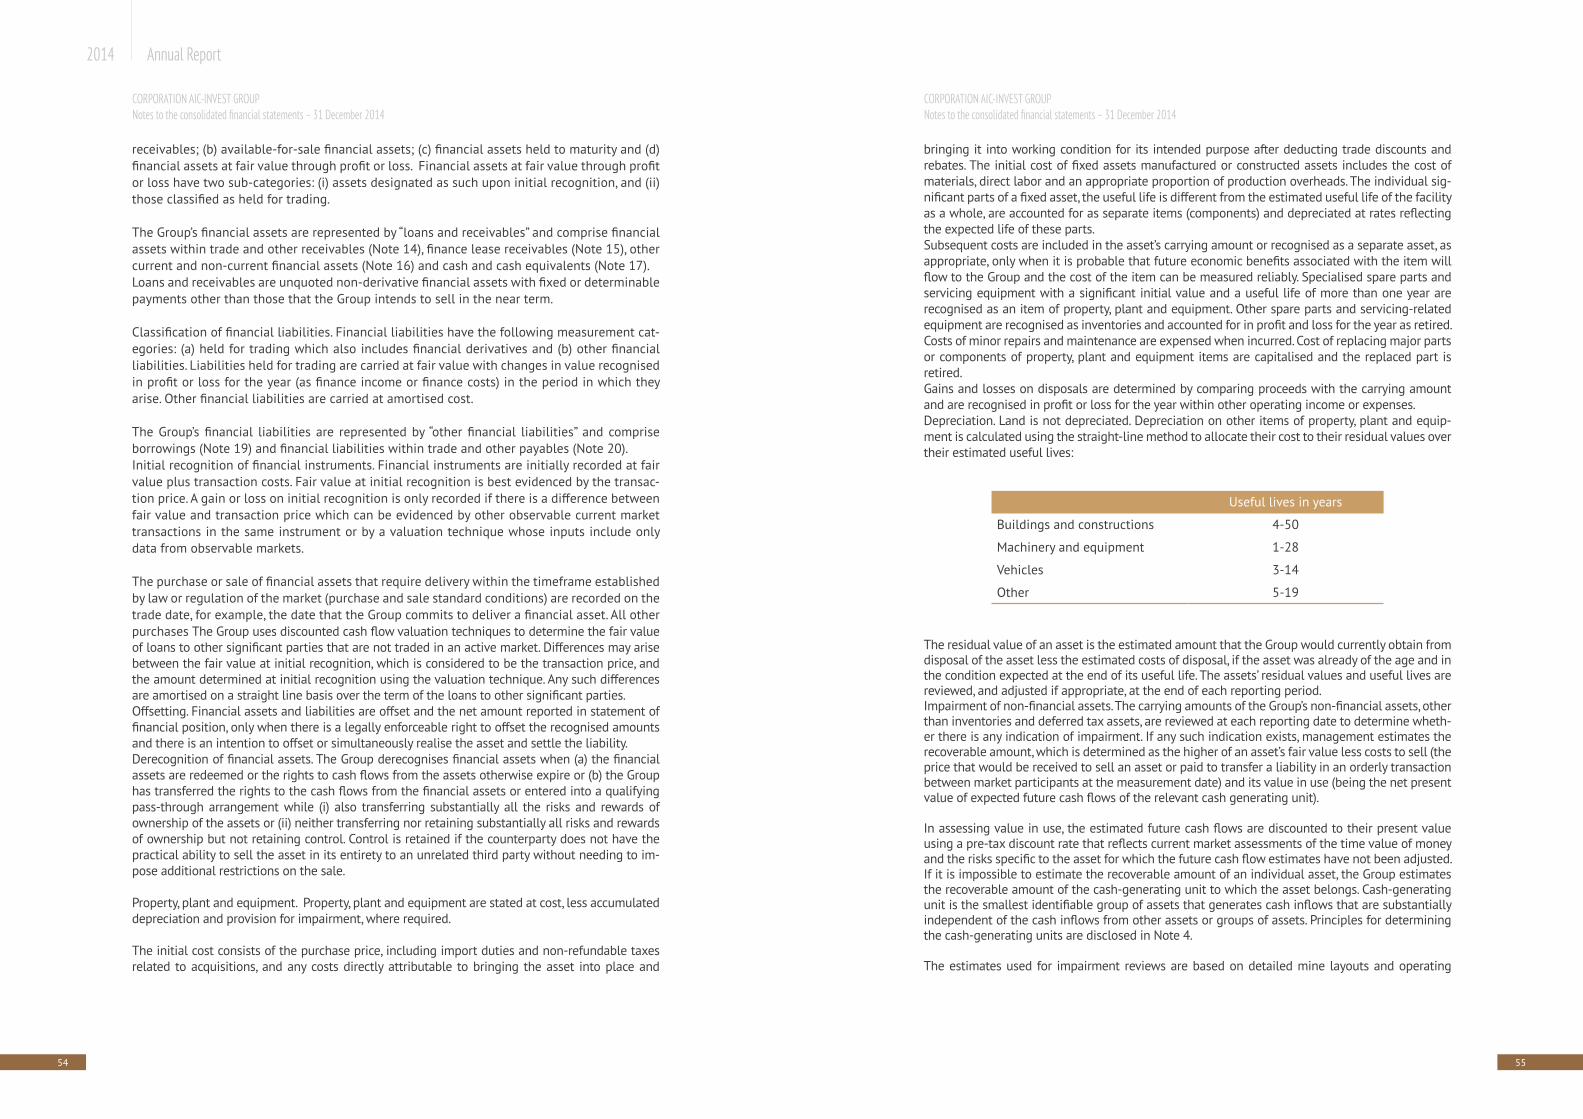
54 55
2014 Annual Report
bringing it into working condition for its intended purpose after deducting trade discounts and rebates. The initial cost of fixed assets manufactured or constructed assets includes the cost of materials, direct labor and an appropriate proportion of production overheads. The individual sig-nificant parts of a fixed asset, the useful life is different from the estimated useful life of the facility as a whole, are accounted for as separate items (components) and depreciated at rates reflecting the expected life of these parts.Subsequent costs are included in the asset’s carrying amount or recognised as a separate asset, as appropriate, only when it is probable that future economic benefits associated with the item will flow to the Group and the cost of the item can be measured reliably. Specialised spare parts and servicing equipment with a significant initial value and a useful life of more than one year are recognised as an item of property, plant and equipment. Other spare parts and servicing-related equipment are recognised as inventories and accounted for in profit and loss for the year as retired.Costs of minor repairs and maintenance are expensed when incurred. Cost of replacing major parts or components of property, plant and equipment items are capitalised and the replaced part is retired.Gains and losses on disposals are determined by comparing proceeds with the carrying amount and are recognised in profit or loss for the year within other operating income or expenses.Depreciation. Land is not depreciated. Depreciation on other items of property, plant and equip-ment is calculated using the straight-line method to allocate their cost to their residual values over their estimated useful lives:
The residual value of an asset is the estimated amount that the Group would currently obtain from disposal of the asset less the estimated costs of disposal, if the asset was already of the age and in the condition expected at the end of its useful life. The assets’ residual values and useful lives are reviewed, and adjusted if appropriate, at the end of each reporting period.Impairment of non-financial assets. The carrying amounts of the Group’s non-financial assets, other than inventories and deferred tax assets, are reviewed at each reporting date to determine wheth-er there is any indication of impairment. If any such indication exists, management estimates the recoverable amount, which is determined as the higher of an asset’s fair value less costs to sell (the price that would be received to sell an asset or paid to transfer a liability in an orderly transaction between market participants at the measurement date) and its value in use (being the net present value of expected future cash flows of the relevant cash generating unit).
In assessing value in use, the estimated future cash flows are discounted to their present value using a pre-tax discount rate that reflects current market assessments of the time value of money and the risks specific to the asset for which the future cash flow estimates have not been adjusted.If it is impossible to estimate the recoverable amount of an individual asset, the Group estimates the recoverable amount of the cash-generating unit to which the asset belongs. Cash-generating unit is the smallest identifiable group of assets that generates cash inflows that are substantially independent of the cash inflows from other assets or groups of assets. Principles for determining the cash-generating units are disclosed in Note 4.
The estimates used for impairment reviews are based on detailed mine layouts and operating
receivables; (b) available-for-sale financial assets; (c) financial assets held to maturity and (d) financial assets at fair value through profit or loss. Financial assets at fair value through profit or loss have two sub-categories: (i) assets designated as such upon initial recognition, and (ii) those classified as held for trading.
The Group’s financial assets are represented by “loans and receivables” and comprise financial assets within trade and other receivables (Note 14), finance lease receivables (Note 15), other current and non-current financial assets (Note 16) and cash and cash equivalents (Note 17).Loans and receivables are unquoted non-derivative financial assets with fixed or determinable payments other than those that the Group intends to sell in the near term.
Classification of financial liabilities. Financial liabilities have the following measurement cat-egories: (a) held for trading which also includes financial derivatives and (b) other financial liabilities. Liabilities held for trading are carried at fair value with changes in value recognised in profit or loss for the year (as finance income or finance costs) in the period in which they arise. Other financial liabilities are carried at amortised cost.
The Group’s financial liabilities are represented by “other financial liabilities” and comprise borrowings (Note 19) and financial liabilities within trade and other payables (Note 20). Initial recognition of financial instruments. Financial instruments are initially recorded at fair value plus transaction costs. Fair value at initial recognition is best evidenced by the transac-tion price. A gain or loss on initial recognition is only recorded if there is a difference between fair value and transaction price which can be evidenced by other observable current market transactions in the same instrument or by a valuation technique whose inputs include only data from observable markets.
The purchase or sale of financial assets that require delivery within the timeframe established by law or regulation of the market (purchase and sale standard conditions) are recorded on the trade date, for example, the date that the Group commits to deliver a financial asset. All other purchases The Group uses discounted cash flow valuation techniques to determine the fair value of loans to other significant parties that are not traded in an active market. Differences may arise between the fair value at initial recognition, which is considered to be the transaction price, and the amount determined at initial recognition using the valuation technique. Any such differences are amortised on a straight line basis over the term of the loans to other significant parties.Offsetting. Financial assets and liabilities are offset and the net amount reported in statement of financial position, only when there is a legally enforceable right to offset the recognised amounts and there is an intention to offset or simultaneously realise the asset and settle the liability.Derecognition of financial assets. The Group derecognises financial assets when (a) the financial assets are redeemed or the rights to cash flows from the assets otherwise expire or (b) the Group has transferred the rights to the cash flows from the financial assets or entered into a qualifying pass-through arrangement while (i) also transferring substantially all the risks and rewards of ownership of the assets or (ii) neither transferring nor retaining substantially all risks and rewards of ownership but not retaining control. Control is retained if the counterparty does not have the practical ability to sell the asset in its entirety to an unrelated third party without needing to im-pose additional restrictions on the sale.
Property, plant and equipment. Property, plant and equipment are stated at cost, less accumulated depreciation and provision for impairment, where required.
The initial cost consists of the purchase price, including import duties and non-refundable taxes related to acquisitions, and any costs directly attributable to bringing the asset into place and
CORPORATION AIC-INVEST GROUP Notes to the consolidated financial statements – 31 December 2014
CORPORATION AIC-INVEST GROUP Notes to the consolidated financial statements – 31 December 2014
Useful lives in years
Buildings and constructions 4-50
Machinery and equipment 1-28
Vehicles 3-14
Other 5-19
56 57
2014 Annual Report
respect of taxable profits or losses for the current and prior periods. Taxable profits or losses are based on estimates where the consolidated financial statements are authorised prior to the filing of the relevant tax returns. Taxes, other than on income, are recorded within operat-ing expenses.Deferred income tax is provided using the balance sheet liability method for tax loss carry forwards and temporary differences arising between the tax bases of assets and liabilities and their carrying amounts for financial reporting purposes. Deferred tax balances are measured at tax rates enacted or substantively enacted at the end of reporting period which are expected to apply to the period when the temporary differences will reverse or the tax loss carry for-wards will be utilised. Deferred tax assets and liabilities are netted only within the individual companies of the Group. Deferred tax assets for deductible temporary differences and tax loss carry forwards and unused tax offsets are recorded only to the extent that it is probable that future taxable profits will be available against which the deductions can be utilised.
The Group controls the reversal of temporary differences relating to taxes chargeable on div-idends from subsidiaries or on gains upon their disposal. The Group does not recognise de-ferred tax liabilities on such temporary differences except to the extent that management expects the temporary differences to reverse in the foreseeable future.
Uncertain tax positions. The Group’s uncertain tax positions are reassessed by management at the end of each reporting period. Liabilities are recorded for income tax positions that are determined by management as more likely than not to result in additional taxes being levied if the positions were to be challenged by the tax authorities based on the interpretation of tax laws that have been enacted or substantively enacted by the end of the reporting period and any known court or other filings on such issues. Liabilities for penalties, interest and taxes oth-er than on income are recognised based on management’s best estimate of the expenditure required to settle the obligations at the end of reporting period.
Inventories. Inventories are stated at the lower of cost and net realisable value. Cost of in-ventory is determined on the weighted average cost basis. The cost of inventory comprises the purchase price of inventories and other direct costs. Net realisable value is the estimated selling price in the ordinary course of business, less selling expenses.
Trade and other receivables. Trade and other receivables except for prepayments and other non-financial receivables are carried at amortised cost using the effective interest method less impairment.
Impairment of financial assets carried at amortised cost. Impairment losses are recognised in profit or loss when incurred as a result of one or more events (“loss events”) that occurred after the initial recognition of the financial asset and which have an impact on the amount or timing of the estimated future cash flows of the financial asset or group of financial assets that can be reliably estimated. If the Group determines that no objective evidence exists that impairment has occurred for an individually assessed financial asset, whether significant or not, it includes the asset in a group of financial assets with similar credit risk characteristics and collectively assesses them for impairment. The primary factors that the Group considers in determining whether a financial asset is impaired are its overdue status, history of debtors relations and
Finance lease receivables. Where the Group is a lessor in a lease which transfers substantially all the risks and rewards incidental to ownership to the lessee, the assets leased out are presented as a finance lease receivable and carried at the present value of the future lease payments. Finance lease receivables are initially recognised at commencement (when the lease term begins), using a discount rate determined at inception (the earlier of the date of the lease agreement and the date of commitment by the parties to the principal provisions of the lease).
The difference between the gross receivable and the present value represents unearned finance income. This income is recognised over the term of the lease using the net investment method (before tax), which reflects a constant periodic rate of return. Incremental costs directly attributable to negotiating and arranging the lease are included in the initial measurement of the finance lease receivable and reduce the amount of income recognised over the lease term. Finance income from leases is recorded within revenue in profit or loss for the year.
Impairment losses are recognised in profit or loss when incurred as a result of one or more events (“loss events”) that occurred after the initial recognition of finance lease receivables. Refer to the accounting policy “Impairment of financial assets carried at amortised cost”.Goodwill. Goodwill is carried at cost less accumulated impairment losses, if any. The Group tests goodwill for impairment at least annually and whenever there are indications that goodwill may be impaired. Goodwill is allocated to cash-generating units, or groups of cash-generating units, that are expected to benefit from the synergies of the business combination. Such units or groups of units represent the lowest level at which the Group monitors goodwill and are not larger than an operating segment.
Gains or losses on disposal of an operation within a cash generating unit to which goodwill has been allocated include the carrying amount of goodwill associated with the disposed operation, generally measured on the basis of the relative values of the disposed operation and the portion of the cash-generating unit which is retained.
Intangible assets. All of the Group’s intangible assets have definite useful lives and include cap-italised computer software. Acquired software is capitalised on the basis of the costs incurred to acquire and bring them to use. Intangible assets are amortised using the straight-line method over their useful lives, estimated by the management as the period from 3 to 7 years.
If impaired, the carrying amount of intangible assets is written down to the higher of value in use and fair value less costs to sell. Intangible assets are shown in the consolidated statement of fi-nancial position within property, plant and equipment.
budgets, modified as appropriate to meet the requirements of IAS 36 “Impairment of Assets”. Future cash flows are based on:
- estimated quantities of grain handling:- future commodity prices (assuming that the current market prices will not differ from the average
price calculated by the Group in the long term, usually for a period of up to five years), and- future costs and other operating and capital costs.
Operating leases. Where the Group is a lessee in a lease which does not transfer substantially all the risks and rewards incidental to ownership from the lessor to the Group, the total lease pay-ments are charged to profit or loss on a straight-line basis over the lease term. The lease term is the non-cancellable period for which the lessee has contracted to lease the asset together with any further terms for which the lessee has the option to continue to lease the asset, with or without further payment, when at the inception of the lease it is reasonably certain that the lessee will exercise the option.
Income taxes. Income taxes have been provided for in the financial statements in accordance with legislation enacted or substantively enacted by the end of the reporting period. The in-come tax charge comprises current tax and deferred tax and is recognised in profit or loss for the year, except if it is recognised in other comprehensive income or directly in equity because it relates to transactions that are also recognised, in the same or a different period, in other comprehensive income or directly in equity.
Current tax is the amount expected to be paid to or recovered from the taxation authorities in
CORPORATION AIC-INVEST GROUP Notes to the consolidated financial statements – 31 December 2014
CORPORATION AIC-INVEST GROUP Notes to the consolidated financial statements – 31 December 2014
58 59
2014 Annual Report
realisability of related collateral, if any. The following other principal criteria are also used to determine whether there is objective evidence that an impairment loss has occurred:
- any portion or instalment is overdue and the late payment cannot be attributed to a delay caused by the settlement systems;
- the counterparty experiences a significant financial difficulty as evidenced by its financial information that the Group obtains;
- the counterparty considers bankruptcy or a financial reorganisation;- there is an adverse change in the payment status of the counterparty as a result of changes
in the national or local economic conditions that impact the counterparty; or- the value of collateral, if any, significantly decreases as a result of deteriorating market
conditions.
If the terms of an impaired financial asset held at amortised cost are renegotiated or other-wise modified because of financial difficulties of the counterparty, impairment is measured using the original effective interest rate before the modification of terms. The renegotiated asset is then derecognised and a new asset is recognised at its fair value only if the risks and rewards of the asset substantially changed. This is normally evidenced by a substantial differ-ence between the present values of the original cash flows and the new expected cash flows.
Impairment losses are always recognised through an allowance account to write down the as-set’s carrying amount to the present value of expected cash flows (which exclude future credit losses that have not been incurred) discounted at the original effective interest rate of the as-set. The calculation of the present value of the estimated future cash flows of a collateralised financial asset reflects the cash flows that may result from foreclosure less costs for obtaining and selling the collateral, whether or not foreclosure is probable.If, in a subsequent period, the amount of the impairment loss decreases and the decrease can be related objectively to an event occurring after the impairment was recognised (such as an improvement in the debtor’s credit rating), the previously recognised impairment loss is re-versed by adjusting the allowance account through profit or loss for the year.Uncollectible assets are written off against the related impairment loss provision after all the necessary procedures to recover the asset have been completed and the amount of the loss has been determined. Subsequent recoveries of amounts previously written off are credited to impairment loss account within the profit or loss for the year.
Prepayments. Prepayments are carried at cost less provision for any impairment. A prepay-ment is classified as non-current when the goods or services relating to the prepayment are expected to be obtained after one year, or when the prepayment relates to an asset which will itself be classified as non-current upon initial recognition. Prepayments to acquire assets are transferred to the carrying amount of the asset once the Group has obtained control of the asset and it is probable that future economic benefits associated with the asset will flow to the Group. Other prepayments are written off to profit or loss when the goods or services relating to the prepayments are received. If there is an indication that the assets, goods or services relating to a prepayment will not be received, the carrying value of the prepayment is written down accordingly and a corresponding impairment loss is recognised in profit or loss for the year. Non-current prepayments are not discounted.
Cash and cash equivalents. Cash and cash equivalents include cash in hand and deposits held at call with banks and other short-term highly liquid investments with original maturities of three months or less. Restricted balances are excluded from cash and cash equivalents for the purposes of the statement of cash flows. Balances restricted from being exchanged or used to settle a liability within 12 months after reporting period and for at least 12 months after reporting period are included in other current and non-current financial assets, respectively.
Charter capital. Assets contributed to charter capital are recognised at fair value at the time of contribution. Any excess of the fair value of assets contributed over the nominal value of charter contribution upon its legal registration is credited directly to equity under the heading of share premium.
Value added tax. Output value added tax (“VAT”) related to sales is payable to tax authorities on the earlier of (a) collection of receivables from customers or (b) delivery of goods or servic-es to customers. Input VAT is generally recoverable against output VAT upon receipt of the VAT invoice. The tax authorities permit the settlement of VAT on a net basis. VAT related to sales and purchases unsettled at the consolidated balance sheet date is recognised in the statement of financial position on a gross basis.
Where provision has been made for impairment of receivables, impairment loss is recorded for the gross amount of the debtor, including VAT.
Borrowings. Borrowings are carried at amortised cost using the effective interest method.Trade and other payables. Trade payables are accrued when the counterparty performs its obligations under the contract and are carried at amortised cost using the effective interest method.Provisions for liabilities and charges. Provisions for liabilities and charges are non-financial liabilities of uncertain timing or amount. They are accrued when the Group has a present legal or constructive obligation as a result of past events, it is probable that an outflow of resources embodying economic benefits will be required to settle the obligation, and a reliable estimate of the amount of the obligation can be made.
Financial guarantees. Financial guarantees are irrevocable contracts that require the Group to make specified payments to reimburse the holder of the guarantee for a loss it incurs because a specified debtor fails to make payment when due in accordance with the terms of a debt instrument. Financial guarantees are initially recognised at their fair value, which is normally evidenced by the amount of fees received. This amount is amortised on a straight line basis over the life of the guarantee. At the end of each reporting period, the guarantees are measured at the higher of (a) the remaining unamortised balance of the amount at initial recognition and (b) the best estimate of expenditure required to settle the obligation at the end of the reporting period.
Foreign currency translation. The functional currency of each of the Group’s consolidated en-tities is the currency of the primary economic environment in which the entity operates. The functional currency of the Company and the Group’s presentation currency is the national currency of the Republic of Kazakhstan, Tenge. The functional currency of Azov subsidiary is Russian roubles (“RR”). Functional currency of the VGT was changed from Latvian Lat (“LVL”) to Euro (“EUR”) on January 1, 2014 in connection with Latvia’s accession to the Eurozone. Accounting of VGT was carried out in 2014 with the conversion of financial reporting as of December 31, 2013 from LVL to Euro at the official exchange rate of the Bank of Latvia 1 Euro = 0.702804 LVL and in accordance with the rules established by the legislation of Latvia.
Monetary assets and liabilities are translated into each entity’s functional currency at the re-spective official exchange rate of the National Bank of the Republic of Kazakhstan (“NBRK”), the Central bank of the Russian Federation (“CBRF”) or European Central Bank (“ECB”) at the end of the respective reporting period. Foreign exchange gains and losses resulting from the settlement of the transactions and from the translation of monetary assets and liabilities into each entity’s functional currency at year-end official exchange rates of the NBRK, CBRF and ECB are recognised in profit or loss. Non-monetary items measured at fair value in a foreign currency are translated using the exchange rates at the date when the fair value was deter-
CORPORATION AIC-INVEST GROUP Notes to the consolidated financial statements – 31 December 2014
CORPORATION AIC-INVEST GROUP Notes to the consolidated financial statements – 31 December 2014
60 61
2014 Annual Report
mined. Effects of exchange rate changes on non-monetary items measured at fair value in a foreign currency are recorded as part of the fair value gain or loss.
Non-monetary items measured at fair value in a foreign currency are translated using the exchange rates that were in effect at the time of the determination of fair value. Translation differences on non-monetary items measured at fair value in a foreign currency are recorded as part of the gain or loss on remeasurement to fair value.
The results and financial position of each group entity are translated into the presentation currency as follows:
(i) assets and liabilities for each statement of financial position are translated at the closing rate at the end of the respective reporting period;
(ii) income and expenses are translated at average exchange rates (unless this average is not a reasonable approximation of the cumulative effect of the rates prevailing on the transaction dates, in which case income and expenses are translated at the dates of the transactions);
(iii) components of equity are translated at the historic rate; and (iv) all resulting exchange differences are recognised in other comprehensive income.
When control over a foreign operation is lost, the previously recognised exchange differences on translation to a different presentation currency are reclassified from other comprehensive income to profit or loss for the year as part of the gain or loss on disposal. On partial disposal of a subsidiary without loss of control, the related portion of accumulated currency translation differences is reclassified to non-controlling interest within equity.At 31 December 2014, the principal rate of exchange used for translating foreign currency balances into Tenge was US Dollar 1 = 182.35 Tenge (2013: US Dollar 1 = Tenge 153.61), RR 1 = Tenge 3.17 (2013: RR 1 = Tenge 4.69) and EUR 1 = 221.97 Tenge (2013: LVL 1 = 300.96 Tenge).All amounts in these consolidated financial statements are presented in thousands of Kazakh-stani Tenge (“thousands of Tenge”), unless otherwise stated.
Revenue recognition. Revenues from sales of goods are recognised at the point of transfer of risks and rewards of ownership of the goods, normally when the goods are shipped in case of sales of domestic goods within Kazakhstan. In case of international export sales, if the Group agrees to transport goods to a specified location then revenue is recognised when the goods are passed to the customer at the designated destination point.
When goods or services are exchanged or swapped for goods or services which are of a similar nature and value, the exchange is not regarded as a transaction which generates revenue.Sales of port services are recognised in the accounting period in which the services are ren-dered, by reference to stage of completion of the specific transaction assessed on the basis of the actual service provided as a proportion of the total services to be provided.Sales are shown net of VAT and discounts.
Revenues are measured at the fair value of the consideration received or receivable. When the fair value of goods received in a barter transaction cannot be measured reliably, the revenue is measured at the fair value of the goods or service given up.
Interest income is recognised on a time-proportion basis using the effective interest method. Barter transactions and mutual cancellations. A portion of sales and purchases are settled by mutual cancellations or barter settlements. These transactions are generally in the form of direct settlements by dissimilar goods and services from the final customer (barter) or cancel-lation of mutual balances.
Sales and purchases that are expected to be settled by mutual settlements or barter settle-
ments are recognised based on management’s estimate of the fair value to be received or given up in non-cash settlements. The fair value is determined with reference to observable market information.
Non-cash transactions have been excluded from the statement of cash flows. Investing and financing activities and the total of operating activities represent actual cash flows. Payroll expense and related contributions. Wages, salaries, contributions to pension and social insurance funds, paid annual leave and sick leave, bonuses, and non-monetary benefits are accrued in the period in which the associated services are rendered by the employees of the Group.
In accordance with the legal requirements of the Republic of Kazakhstan, the Russian Feder-ation and the Republic of Latvia the Group withholds pension contributions from employee salaries and transfers them to the state pension funds upon the employee decision. Upon retirement of employees, the Group’s legal obligations are ceased and all further pension pay-ments are administered by the state and private accumulation pension funds.
Segment reporting. Operating segments are reported in a manner consistent with the internal reporting provided to the Group’s chief operating decision maker (“CODM”). Segments whose revenue, result or assets are ten percent or more of all the segments are reported separately.
Critical Accounting Estimates and Judgments in Applying Accounting Policies
The Group makes estimates and assumptions that affect the amounts recognised in the con-solidated financial statements and the carrying amounts of assets and liabilities within the next financial year. Estimates and judgements are continually evaluated and are based on management’s experience and other factors, including expectations of future events that are believed to be reasonable under the circumstances. Management also makes certain judge-ments, apart from those involving estimations, in the process of applying accounting policies. Judgements that have the most significant effect on the amounts recognised in the consolidat-ed financial statements and estimates that can cause a significant adjustment to the carrying amount of assets and liabilities within the next financial year include:
Going concern. The Group’s consolidated financial statements have been prepared on the going concern basis, which assumes that the Group will continue to be able to meet its liabilities as they fall due for the foreseeable future. The Group has net working capital of Tenge 91,264,087 thousand as of 31 December 2014. A substantial portion of the current assets element is repre-sented by advances for future grain purchases in the amount of Tenge 101,112,247 thousand. Management expects that these advances will ultimately be realised in cash via the sale of grain following the harvest during the Group’s main trading season at the end of the third quarter and in the fourth quarter of 2015. Furthermore, the Group had an operating cash in-flow in the year ended 31 December 2014 of Tenge 51,715,663 thousand. The Group breached certain financial covenants that resulted in the reclassification of Tenge 7,434,775 thousands of borrowing from long term to short term as of 31 December 2014 (Note 19). The Group’s trading performance in 2014 was impacted by a poor harvest that resulted in poorer quality grain available to purchase and trade.
Management believes it is appropriate to continue to adopt the going concern basis in prepar-ing the Group consolidated financial statements. The bases for this conclusion were:
• As of 31 December 2014 the Group repaid significant portion of the borrowings in the amount of Tenge 57,114,813 thousand.
CORPORATION AIC-INVEST GROUP Notes to the consolidated financial statements – 31 December 2014
CORPORATION AIC-INVEST GROUP Notes to the consolidated financial statements – 31 December 2014
4
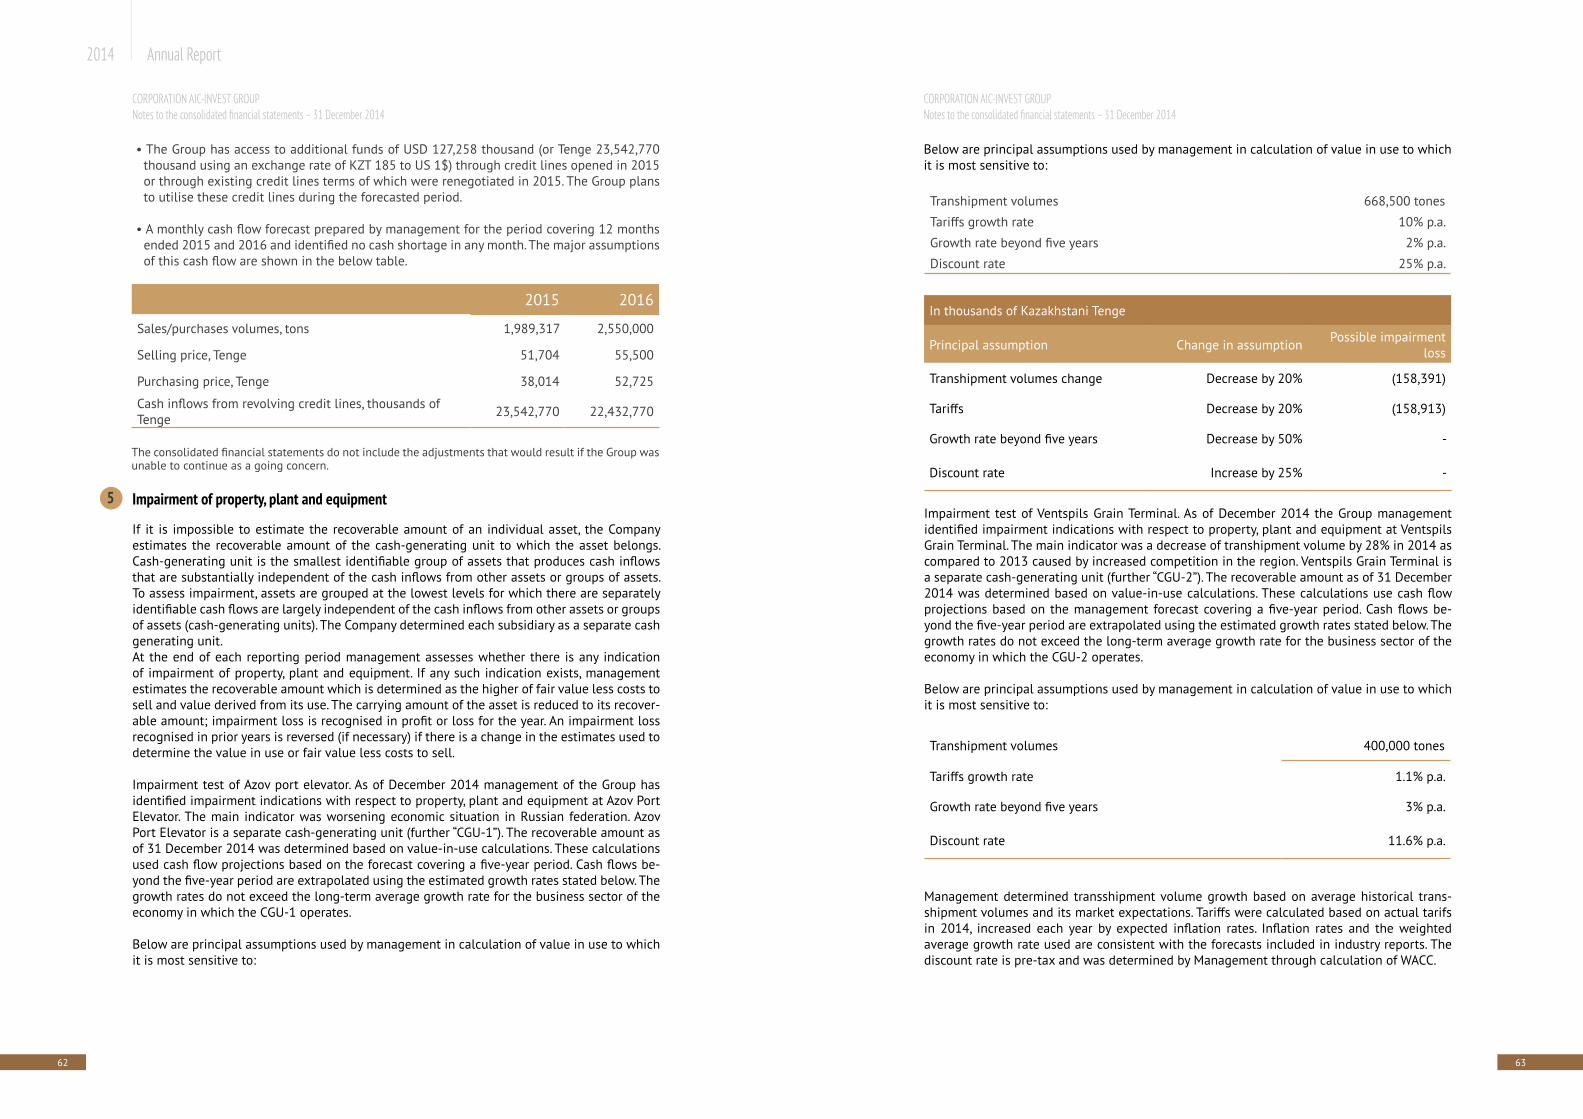
62 63
2014 Annual Report
• The Group has access to additional funds of USD 127,258 thousand (or Tenge 23,542,770 thousand using an exchange rate of KZT 185 to US 1$) through credit lines opened in 2015 or through existing credit lines terms of which were renegotiated in 2015. The Group plans to utilise these credit lines during the forecasted period.
• A monthly cash flow forecast prepared by management for the period covering 12 months ended 2015 and 2016 and identified no cash shortage in any month. The major assumptions of this cash flow are shown in the below table.
CORPORATION AIC-INVEST GROUP Notes to the consolidated financial statements – 31 December 2014
2015 2016
Sales/purchases volumes, tons 1,989,317 2,550,000
Selling price, Tenge 51,704 55,500
Purchasing price, Tenge 38,014 52,725
Cash inflows from revolving credit lines, thousands of Tenge 23,542,770 22,432,770
The consolidated financial statements do not include the adjustments that would result if the Group was unable to continue as a going concern.
Impairment of property, plant and equipment
If it is impossible to estimate the recoverable amount of an individual asset, the Company estimates the recoverable amount of the cash-generating unit to which the asset belongs. Cash-generating unit is the smallest identifiable group of assets that produces cash inflows that are substantially independent of the cash inflows from other assets or groups of assets. To assess impairment, assets are grouped at the lowest levels for which there are separately identifiable cash flows are largely independent of the cash inflows from other assets or groups of assets (cash-generating units). The Company determined each subsidiary as a separate cash generating unit.At the end of each reporting period management assesses whether there is any indication of impairment of property, plant and equipment. If any such indication exists, management estimates the recoverable amount which is determined as the higher of fair value less costs to sell and value derived from its use. The carrying amount of the asset is reduced to its recover-able amount; impairment loss is recognised in profit or loss for the year. An impairment loss recognised in prior years is reversed (if necessary) if there is a change in the estimates used to determine the value in use or fair value less costs to sell.
Impairment test of Azov port elevator. As of December 2014 management of the Group has identified impairment indications with respect to property, plant and equipment at Azov Port Elevator. The main indicator was worsening economic situation in Russian federation. Azov Port Elevator is a separate cash-generating unit (further “CGU-1”). The recoverable amount as of 31 December 2014 was determined based on value-in-use calculations. These calculations used cash flow projections based on the forecast covering a five-year period. Cash flows be-yond the five-year period are extrapolated using the estimated growth rates stated below. The growth rates do not exceed the long-term average growth rate for the business sector of the economy in which the CGU-1 operates.
Below are principal assumptions used by management in calculation of value in use to which it is most sensitive to:
Below are principal assumptions used by management in calculation of value in use to which it is most sensitive to:
Transhipment volumes 668,500 tones
Tariffs growth rate 10% p.a.
Growth rate beyond five years 2% p.a.
Discount rate 25% p.a.
CORPORATION AIC-INVEST GROUP Notes to the consolidated financial statements – 31 December 2014
In thousands of Kazakhstani Tenge
Principal assumption Change in assumption Possible impairment loss
Transhipment volumes change Decrease by 20% (158,391)
Tariffs Decrease by 20% (158,913)
Growth rate beyond five years Decrease by 50% -
Discount rate Increase by 25% -
Impairment test of Ventspils Grain Terminal. As of December 2014 the Group management identified impairment indications with respect to property, plant and equipment at Ventspils Grain Terminal. The main indicator was a decrease of transhipment volume by 28% in 2014 as compared to 2013 caused by increased competition in the region. Ventspils Grain Terminal is a separate cash-generating unit (further “CGU-2”). The recoverable amount as of 31 December 2014 was determined based on value-in-use calculations. These calculations use cash flow projections based on the management forecast covering a five-year period. Cash flows be-yond the five-year period are extrapolated using the estimated growth rates stated below. The growth rates do not exceed the long-term average growth rate for the business sector of the economy in which the CGU-2 operates.
Below are principal assumptions used by management in calculation of value in use to which it is most sensitive to:
Management determined transshipment volume growth based on average historical trans-shipment volumes and its market expectations. Tariffs were calculated based on actual tarifs in 2014, increased each year by expected inflation rates. Inflation rates and the weighted average growth rate used are consistent with the forecasts included in industry reports. The discount rate is pre-tax and was determined by Management through calculation of WACC.
Transhipment volumes 400,000 tones
Tariffs growth rate 1.1% p.a.
Growth rate beyond five years 3% p.a.
Discount rate 11.6% p.a.
5
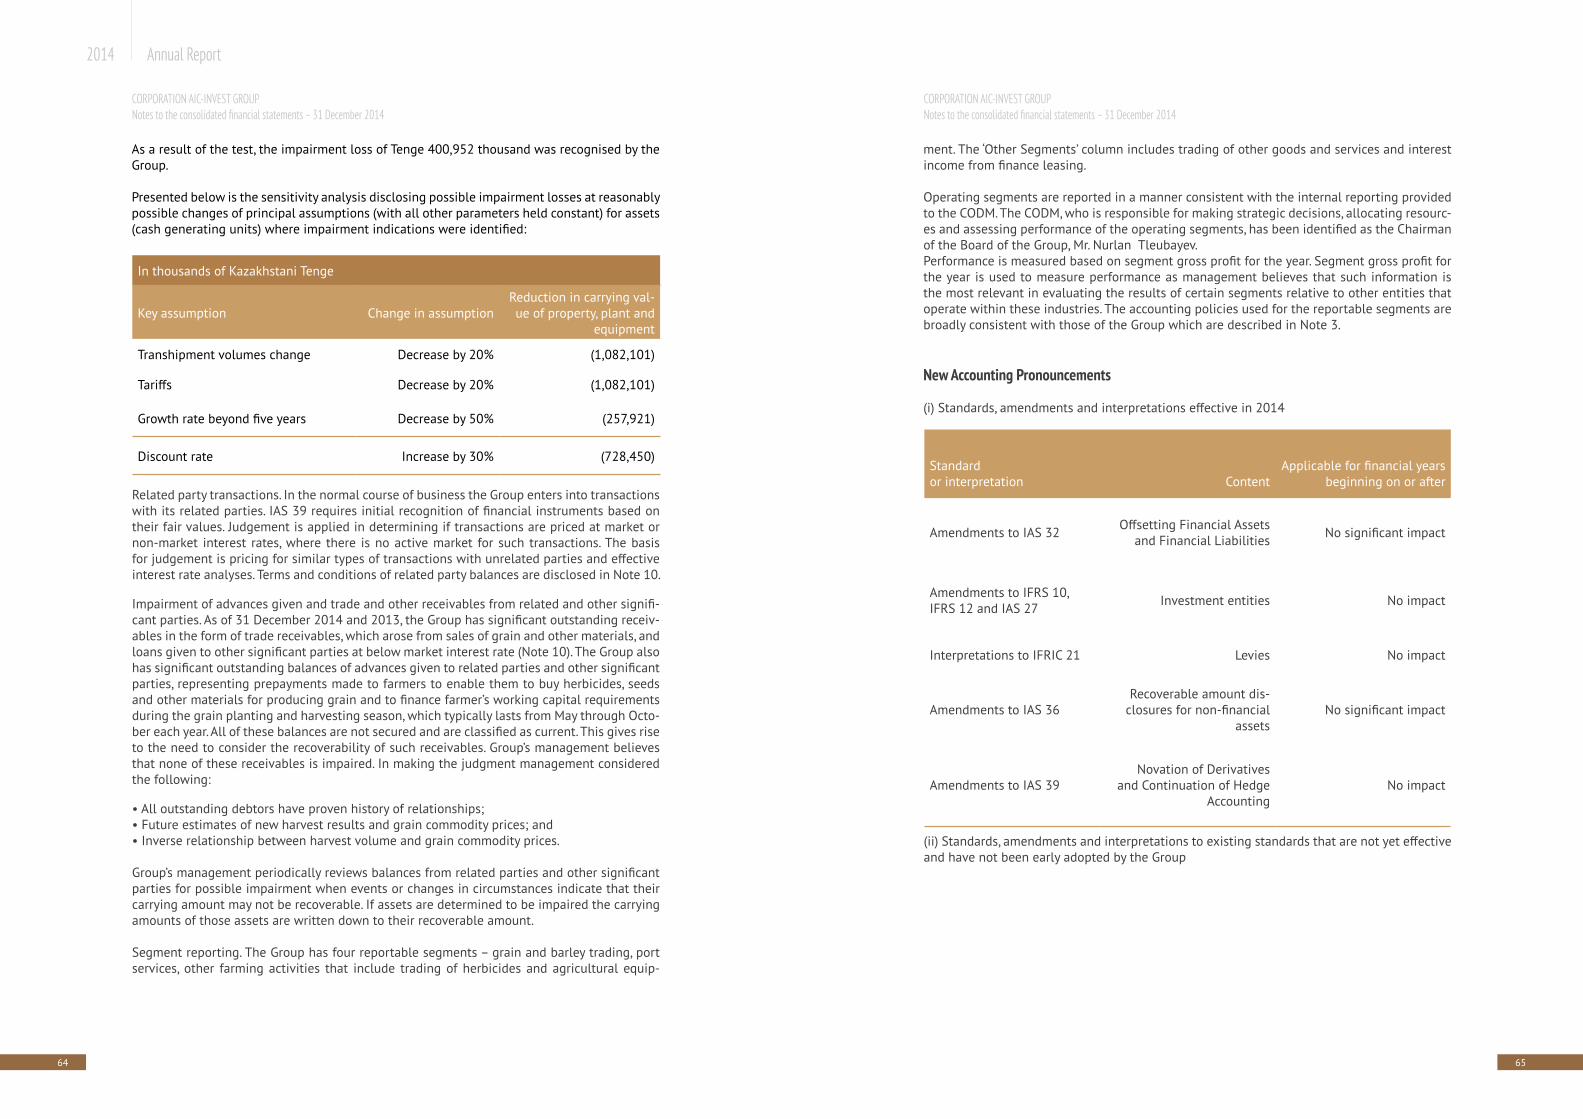
64 65
2014 Annual Report
CORPORATION AIC-INVEST GROUP Notes to the consolidated financial statements – 31 December 2014
In thousands of Kazakhstani Tenge
Key assumption Change in assumptionReduction in carrying val-ue of property, plant and
equipment
Transhipment volumes change Decrease by 20% (1,082,101)
Tariffs Decrease by 20% (1,082,101)
Growth rate beyond five years Decrease by 50% (257,921)
Discount rate Increase by 30% (728,450)
Related party transactions. In the normal course of business the Group enters into transactions with its related parties. IAS 39 requires initial recognition of financial instruments based on their fair values. Judgement is applied in determining if transactions are priced at market or non-market interest rates, where there is no active market for such transactions. The basis for judgement is pricing for similar types of transactions with unrelated parties and effective interest rate analyses. Terms and conditions of related party balances are disclosed in Note 10.
Impairment of advances given and trade and other receivables from related and other signifi-cant parties. As of 31 December 2014 and 2013, the Group has significant outstanding receiv-ables in the form of trade receivables, which arose from sales of grain and other materials, and loans given to other significant parties at below market interest rate (Note 10). The Group also has significant outstanding balances of advances given to related parties and other significant parties, representing prepayments made to farmers to enable them to buy herbicides, seeds and other materials for producing grain and to finance farmer’s working capital requirements during the grain planting and harvesting season, which typically lasts from May through Octo-ber each year. All of these balances are not secured and are classified as current. This gives rise to the need to consider the recoverability of such receivables. Group’s management believes that none of these receivables is impaired. In making the judgment management considered the following:
• All outstanding debtors have proven history of relationships;• Future estimates of new harvest results and grain commodity prices; and• Inverse relationship between harvest volume and grain commodity prices.
Group’s management periodically reviews balances from related parties and other significant parties for possible impairment when events or changes in circumstances indicate that their carrying amount may not be recoverable. If assets are determined to be impaired the carrying amounts of those assets are written down to their recoverable amount.
Segment reporting. The Group has four reportable segments – grain and barley trading, port services, other farming activities that include trading of herbicides and agricultural equip-
CORPORATION AIC-INVEST GROUP Notes to the consolidated financial statements – 31 December 2014
As a result of the test, the impairment loss of Tenge 400,952 thousand was recognised by the Group.
Presented below is the sensitivity analysis disclosing possible impairment losses at reasonably possible changes of principal assumptions (with all other parameters held constant) for assets (cash generating units) where impairment indications were identified:
(ii) Standards, amendments and interpretations to existing standards that are not yet effective and have not been early adopted by the Group
Standard or interpretation Content
Applicable for financial years beginning on or after
Amendments to IAS 32 Offsetting Financial Assets and Financial Liabilities No significant impact
Amendments to IFRS 10, IFRS 12 and IAS 27 Investment entities No impact
Interpretations to IFRIC 21 Levies No impact
Amendments to IAS 36Recoverable amount dis-
closures for non-financial assets
No significant impact
Amendments to IAS 39Novation of Derivatives
and Continuation of Hedge Accounting
No impact
ment. The ‘Other Segments’ column includes trading of other goods and services and interest income from finance leasing.
Operating segments are reported in a manner consistent with the internal reporting provided to the CODM. The CODM, who is responsible for making strategic decisions, allocating resourc-es and assessing performance of the operating segments, has been identified as the Chairman of the Board of the Group, Mr. Nurlan Tleubayev.Performance is measured based on segment gross profit for the year. Segment gross profit for the year is used to measure performance as management believes that such information is the most relevant in evaluating the results of certain segments relative to other entities that operate within these industries. The accounting policies used for the reportable segments are broadly consistent with those of the Group which are described in Note 3.
New Accounting Pronouncements
(i) Standards, amendments and interpretations effective in 2014
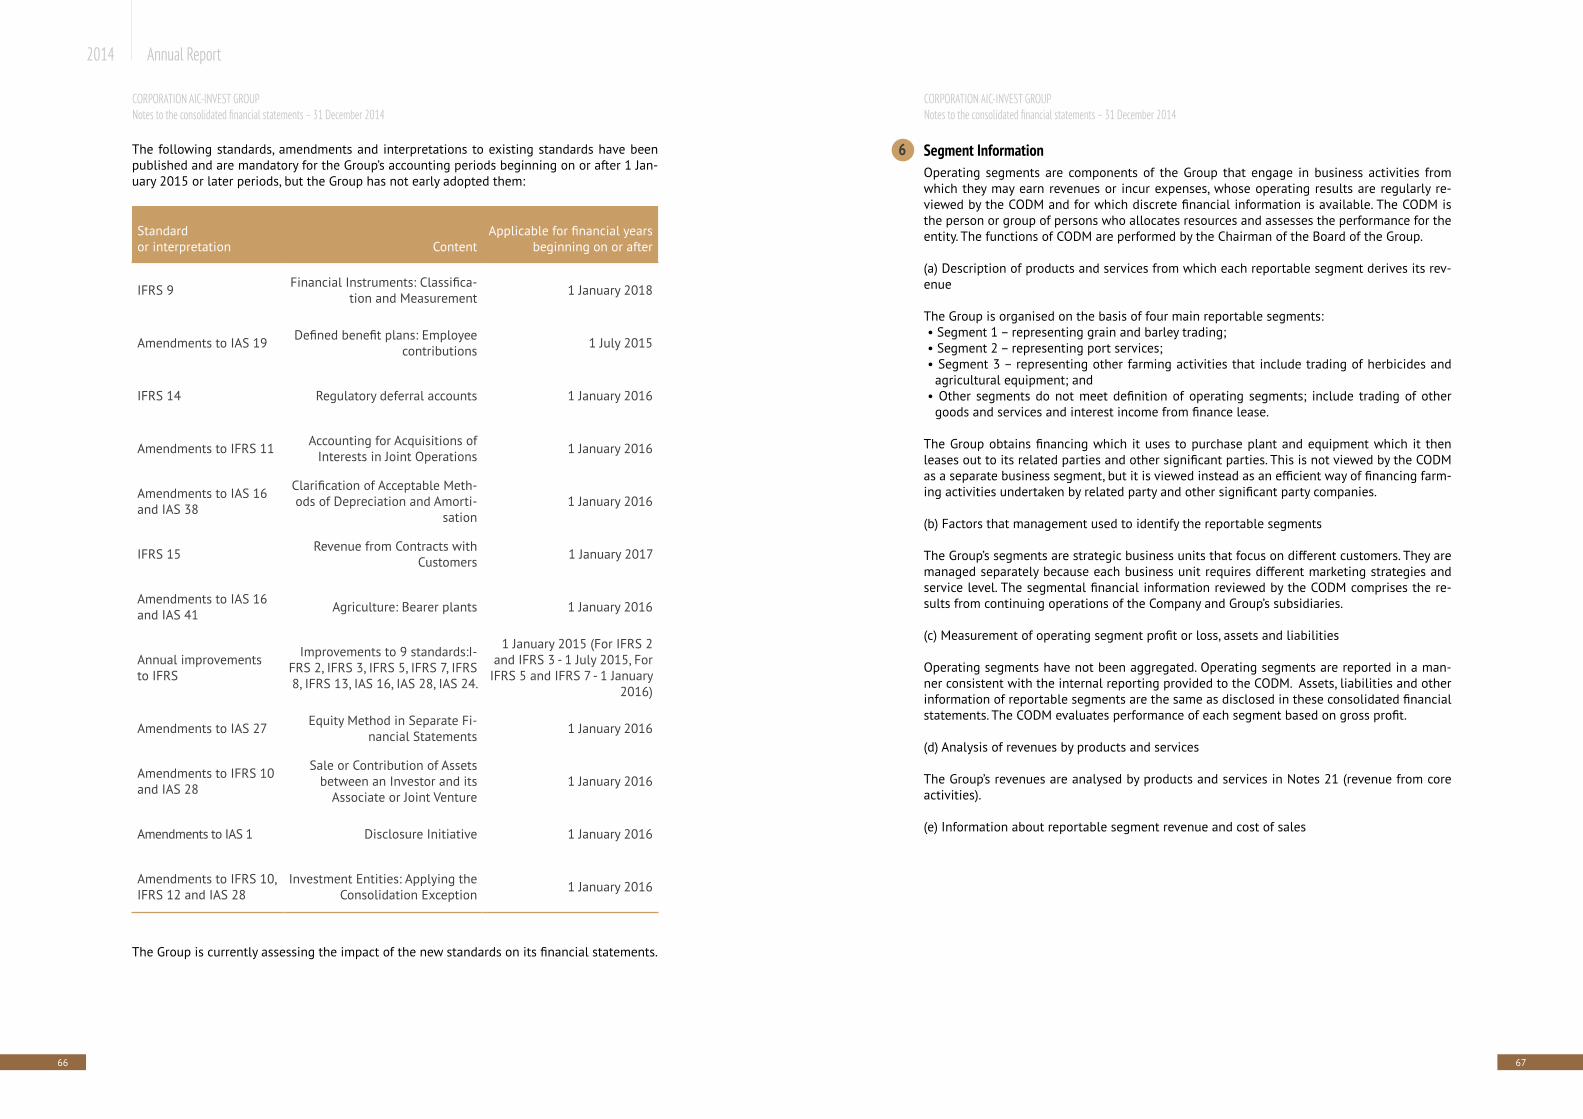
66 67
2014 Annual Report
Standard or interpretation Content
Applicable for financial years beginning on or after
IFRS 9 Financial Instruments: Classifica-tion and Measurement 1 January 2018
Amendments to IAS 19 Defined benefit plans: Employee contributions 1 July 2015
IFRS 14 Regulatory deferral accounts 1 January 2016
Amendments to IFRS 11 Accounting for Acquisitions of Interests in Joint Operations 1 January 2016
Amendments to IAS 16 and IAS 38
Clarification of Acceptable Meth-ods of Depreciation and Amorti-
sation1 January 2016
IFRS 15 Revenue from Contracts with Customers 1 January 2017
Amendments to IAS 16 and IAS 41 Agriculture: Bearer plants 1 January 2016
Annual improvements to IFRS
Improvements to 9 standards:I-FRS 2, IFRS 3, IFRS 5, IFRS 7, IFRS 8, IFRS 13, IAS 16, IAS 28, IAS 24.
1 January 2015 (For IFRS 2 and IFRS 3 - 1 July 2015, For
IFRS 5 and IFRS 7 - 1 January 2016)
Amendments to IAS 27 Equity Method in Separate Fi-nancial Statements 1 January 2016
Amendments to IFRS 10 and IAS 28
Sale or Contribution of Assets between an Investor and its
Associate or Joint Venture1 January 2016
Amendments to IAS 1 Disclosure Initiative 1 January 2016
Amendments to IFRS 10, IFRS 12 and IAS 28
Investment Entities: Applying the Consolidation Exception 1 January 2016
The following standards, amendments and interpretations to existing standards have been published and are mandatory for the Group’s accounting periods beginning on or after 1 Jan-uary 2015 or later periods, but the Group has not early adopted them:
The Group is currently assessing the impact of the new standards on its financial statements.
CORPORATION AIC-INVEST GROUP Notes to the consolidated financial statements – 31 December 2014
Segment InformationOperating segments are components of the Group that engage in business activities from which they may earn revenues or incur expenses, whose operating results are regularly re-viewed by the CODM and for which discrete financial information is available. The CODM is the person or group of persons who allocates resources and assesses the performance for the entity. The functions of CODM are performed by the Chairman of the Board of the Group.
(a) Description of products and services from which each reportable segment derives its rev-enue
The Group is organised on the basis of four main reportable segments: • Segment 1 – representing grain and barley trading;• Segment 2 – representing port services;• Segment 3 – representing other farming activities that include trading of herbicides and
agricultural equipment; and• Other segments do not meet definition of operating segments; include trading of other
goods and services and interest income from finance lease.
The Group obtains financing which it uses to purchase plant and equipment which it then leases out to its related parties and other significant parties. This is not viewed by the CODM as a separate business segment, but it is viewed instead as an efficient way of financing farm-ing activities undertaken by related party and other significant party companies.
(b) Factors that management used to identify the reportable segments
The Group’s segments are strategic business units that focus on different customers. They are managed separately because each business unit requires different marketing strategies and service level. The segmental financial information reviewed by the CODM comprises the re-sults from continuing operations of the Company and Group’s subsidiaries.
(c) Measurement of operating segment profit or loss, assets and liabilities
Operating segments have not been aggregated. Operating segments are reported in a man-ner consistent with the internal reporting provided to the CODM. Assets, liabilities and other information of reportable segments are the same as disclosed in these consolidated financial statements. The CODM evaluates performance of each segment based on gross profit.
(d) Analysis of revenues by products and services
The Group’s revenues are analysed by products and services in Notes 21 (revenue from core activities).
(e) Information about reportable segment revenue and cost of sales
6
CORPORATION AIC-INVEST GROUP Notes to the consolidated financial statements – 31 December 2014
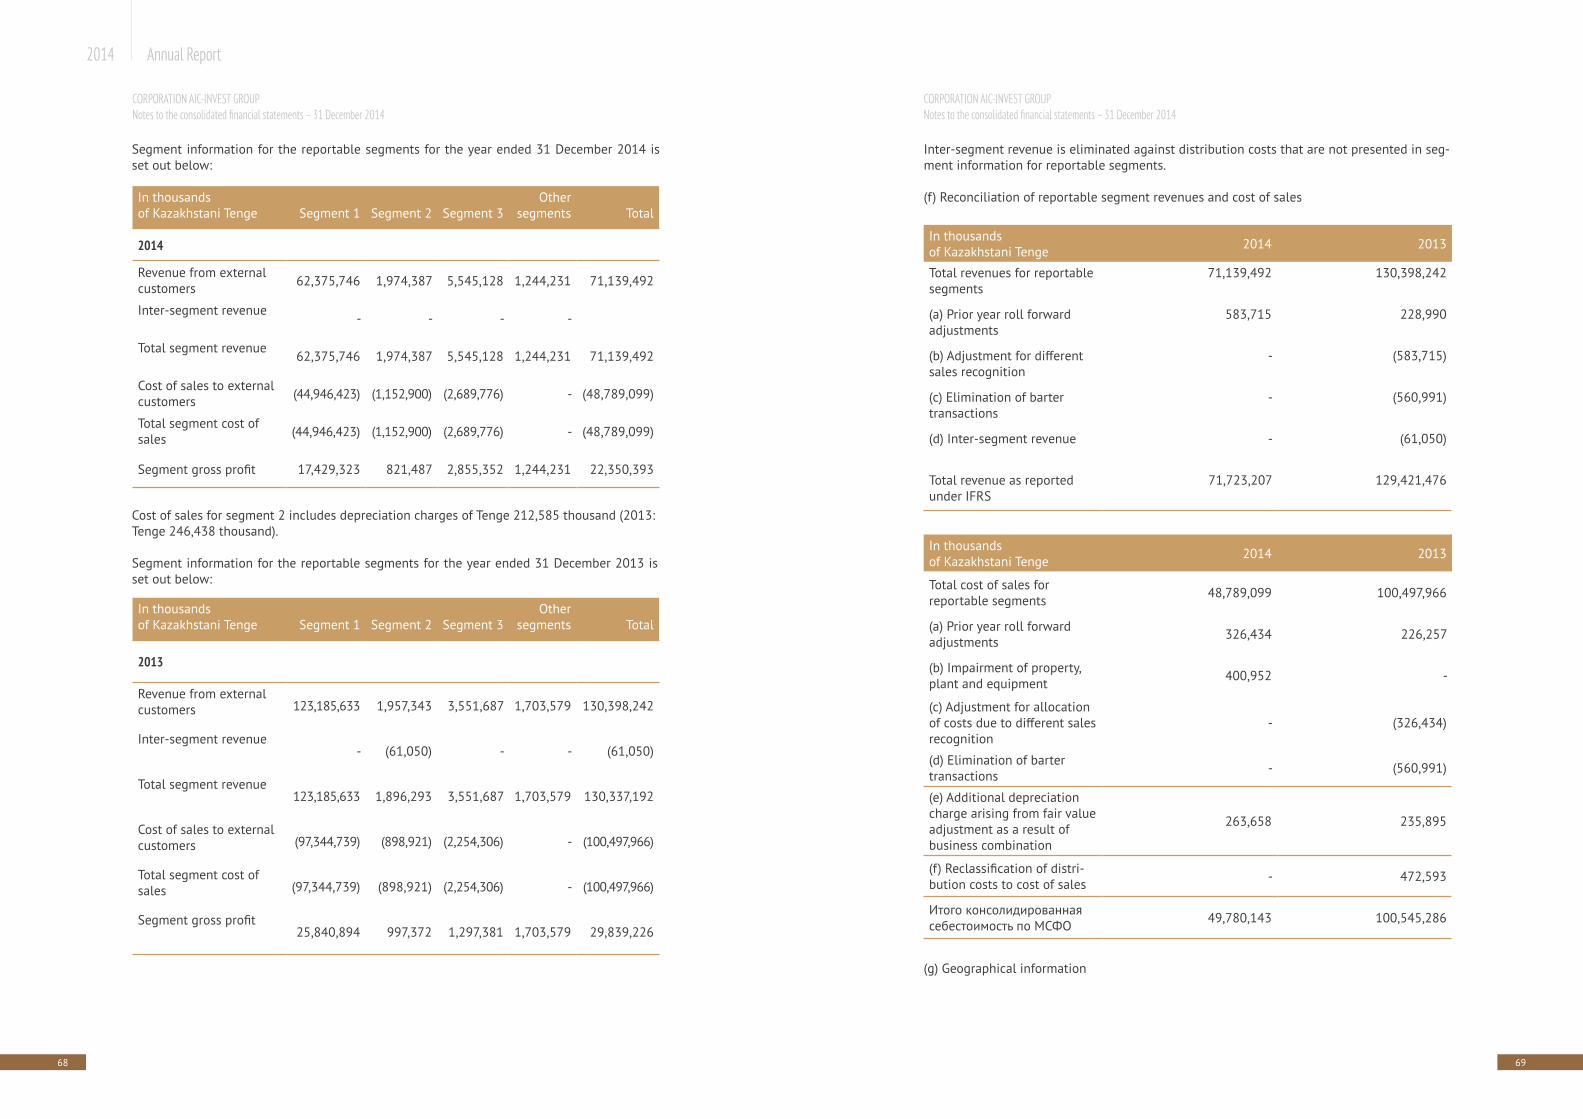
68 69
2014 Annual Report
Segment information for the reportable segments for the year ended 31 December 2014 is set out below:
Cost of sales for segment 2 includes depreciation charges of Tenge 212,585 thousand (2013: Tenge 246,438 thousand).
Segment information for the reportable segments for the year ended 31 December 2013 is set out below:
In thousands of Kazakhstani Tenge Segment 1 Segment 2 Segment 3
Othersegments Total
2014
Revenue from external customers 62,375,746 1,974,387 5,545,128 1,244,231 71,139,492
Inter-segment revenue- - - -
Total segment revenue62,375,746 1,974,387 5,545,128 1,244,231 71,139,492
Cost of sales to external customers (44,946,423) (1,152,900) (2,689,776) - (48,789,099)
Total segment cost of sales (44,946,423) (1,152,900) (2,689,776) - (48,789,099)
Segment gross profit 17,429,323 821,487 2,855,352 1,244,231 22,350,393
In thousands of Kazakhstani Tenge Segment 1 Segment 2 Segment 3
Othersegments Total
2013
Revenue from external customers 123,185,633 1,957,343 3,551,687 1,703,579 130,398,242
Inter-segment revenue- (61,050) - - (61,050)
Total segment revenue123,185,633 1,896,293 3,551,687 1,703,579 130,337,192
Cost of sales to external customers (97,344,739) (898,921) (2,254,306) - (100,497,966)
Total segment cost of sales (97,344,739) (898,921) (2,254,306) - (100,497,966)
Segment gross profit25,840,894 997,372 1,297,381 1,703,579 29,839,226
CORPORATION AIC-INVEST GROUP Notes to the consolidated financial statements – 31 December 2014
Inter-segment revenue is eliminated against distribution costs that are not presented in seg-ment information for reportable segments.
(f) Reconciliation of reportable segment revenues and cost of sales
(g) Geographical information
In thousands of Kazakhstani Tenge 2014 2013
Total revenues for reportable segments
71,139,492 130,398,242
(a) Prior year roll forward adjustments
583,715 228,990
(b) Adjustment for different sales recognition
- (583,715)
(c) Elimination of barter transactions
- (560,991)
(d) Inter-segment revenue - (61,050)
Total revenue as reported under IFRS
71,723,207 129,421,476
In thousands of Kazakhstani Tenge 2014 2013
Total cost of sales for reportable segments 48,789,099 100,497,966
(a) Prior year roll forward adjustments 326,434 226,257
(b) Impairment of property, plant and equipment 400,952 -
(c) Adjustment for allocation of costs due to different sales recognition
- (326,434)
(d) Elimination of barter transactions - (560,991)
(e) Additional depreciation charge arising from fair value adjustment as a result of business combination
263,658 235,895
(f) Reclassification of distri-bution costs to cost of sales - 472,593
Итого консолидированная себестоимость по МСФО 49,780,143 100,545,286
CORPORATION AIC-INVEST GROUP Notes to the consolidated financial statements – 31 December 2014
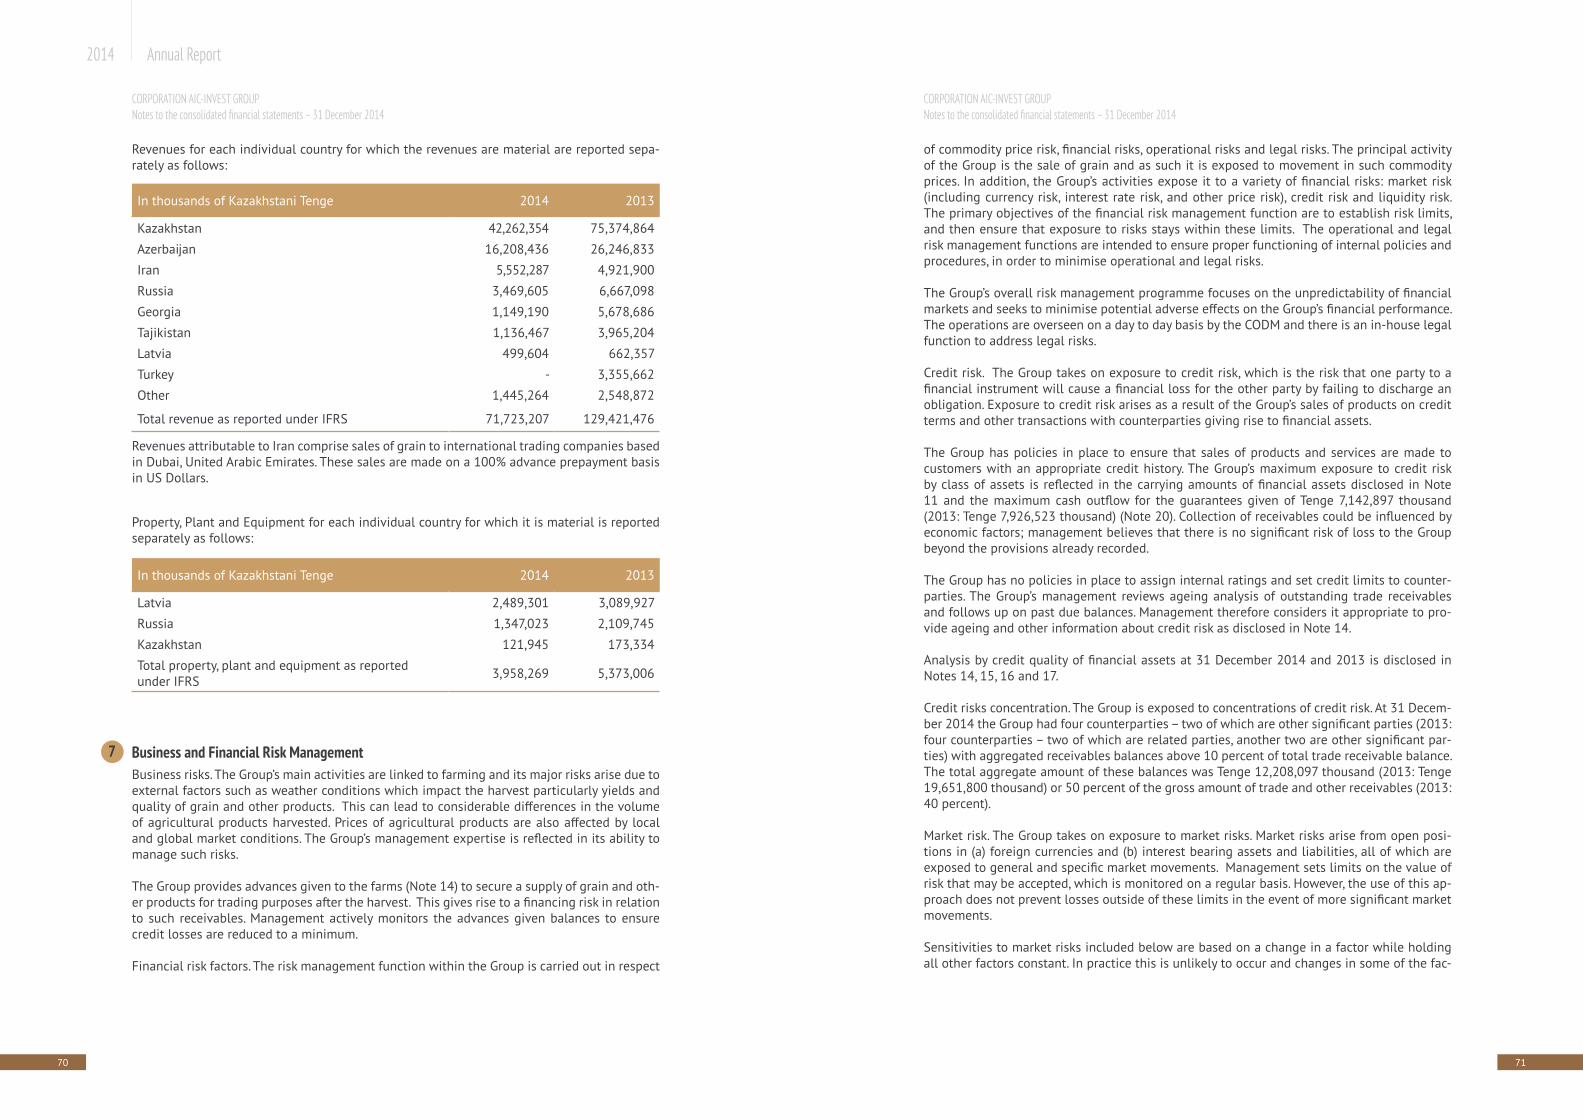
70 71
2014 Annual Report
Revenues for each individual country for which the revenues are material are reported sepa-rately as follows:
Revenues attributable to Iran comprise sales of grain to international trading companies based in Dubai, United Arabic Emirates. These sales are made on a 100% advance prepayment basis in US Dollars.
Property, Plant and Equipment for each individual country for which it is material is reported separately as follows:
Business and Financial Risk ManagementBusiness risks. The Group’s main activities are linked to farming and its major risks arise due to external factors such as weather conditions which impact the harvest particularly yields and quality of grain and other products. This can lead to considerable differences in the volume of agricultural products harvested. Prices of agricultural products are also affected by local and global market conditions. The Group’s management expertise is reflected in its ability to manage such risks.
The Group provides advances given to the farms (Note 14) to secure a supply of grain and oth-er products for trading purposes after the harvest. This gives rise to a financing risk in relation to such receivables. Management actively monitors the advances given balances to ensure credit losses are reduced to a minimum. Financial risk factors. The risk management function within the Group is carried out in respect
In thousands of Kazakhstani Tenge 2014 2013
Kazakhstan 42,262,354 75,374,864
Azerbaijan 16,208,436 26,246,833
Iran 5,552,287 4,921,900
Russia 3,469,605 6,667,098
Georgia 1,149,190 5,678,686
Tajikistan 1,136,467 3,965,204
Latvia 499,604 662,357
Turkey - 3,355,662
Other 1,445,264 2,548,872
Total revenue as reported under IFRS 71,723,207 129,421,476
In thousands of Kazakhstani Tenge 2014 2013
Latvia 2,489,301 3,089,927
Russia 1,347,023 2,109,745
Kazakhstan 121,945 173,334
Total property, plant and equipment as reported under IFRS 3,958,269 5,373,006
7
CORPORATION AIC-INVEST GROUP Notes to the consolidated financial statements – 31 December 2014
of commodity price risk, financial risks, operational risks and legal risks. The principal activity of the Group is the sale of grain and as such it is exposed to movement in such commodity prices. In addition, the Group’s activities expose it to a variety of financial risks: market risk (including currency risk, interest rate risk, and other price risk), credit risk and liquidity risk. The primary objectives of the financial risk management function are to establish risk limits, and then ensure that exposure to risks stays within these limits. The operational and legal risk management functions are intended to ensure proper functioning of internal policies and procedures, in order to minimise operational and legal risks.
The Group’s overall risk management programme focuses on the unpredictability of financial markets and seeks to minimise potential adverse effects on the Group’s financial performance. The operations are overseen on a day to day basis by the CODM and there is an in-house legal function to address legal risks.
Credit risk. The Group takes on exposure to credit risk, which is the risk that one party to a financial instrument will cause a financial loss for the other party by failing to discharge an obligation. Exposure to credit risk arises as a result of the Group’s sales of products on credit terms and other transactions with counterparties giving rise to financial assets.
The Group has policies in place to ensure that sales of products and services are made to customers with an appropriate credit history. The Group’s maximum exposure to credit risk by class of assets is reflected in the carrying amounts of financial assets disclosed in Note 11 and the maximum cash outflow for the guarantees given of Tenge 7,142,897 thousand (2013: Tenge 7,926,523 thousand) (Note 20). Collection of receivables could be influenced by economic factors; management believes that there is no significant risk of loss to the Group beyond the provisions already recorded.
The Group has no policies in place to assign internal ratings and set credit limits to counter-parties. The Group’s management reviews ageing analysis of outstanding trade receivables and follows up on past due balances. Management therefore considers it appropriate to pro-vide ageing and other information about credit risk as disclosed in Note 14.
Analysis by credit quality of financial assets at 31 December 2014 and 2013 is disclosed in Notes 14, 15, 16 and 17.
Credit risks concentration. The Group is exposed to concentrations of credit risk. At 31 Decem-ber 2014 the Group had four counterparties – two of which are other significant parties (2013: four counterparties – two of which are related parties, another two are other significant par-ties) with aggregated receivables balances above 10 percent of total trade receivable balance. The total aggregate amount of these balances was Tenge 12,208,097 thousand (2013: Tenge 19,651,800 thousand) or 50 percent of the gross amount of trade and other receivables (2013: 40 percent).
Market risk. The Group takes on exposure to market risks. Market risks arise from open posi-tions in (a) foreign currencies and (b) interest bearing assets and liabilities, all of which are exposed to general and specific market movements. Management sets limits on the value of risk that may be accepted, which is monitored on a regular basis. However, the use of this ap-proach does not prevent losses outside of these limits in the event of more significant market movements.
Sensitivities to market risks included below are based on a change in a factor while holding all other factors constant. In practice this is unlikely to occur and changes in some of the fac-
CORPORATION AIC-INVEST GROUP Notes to the consolidated financial statements – 31 December 2014
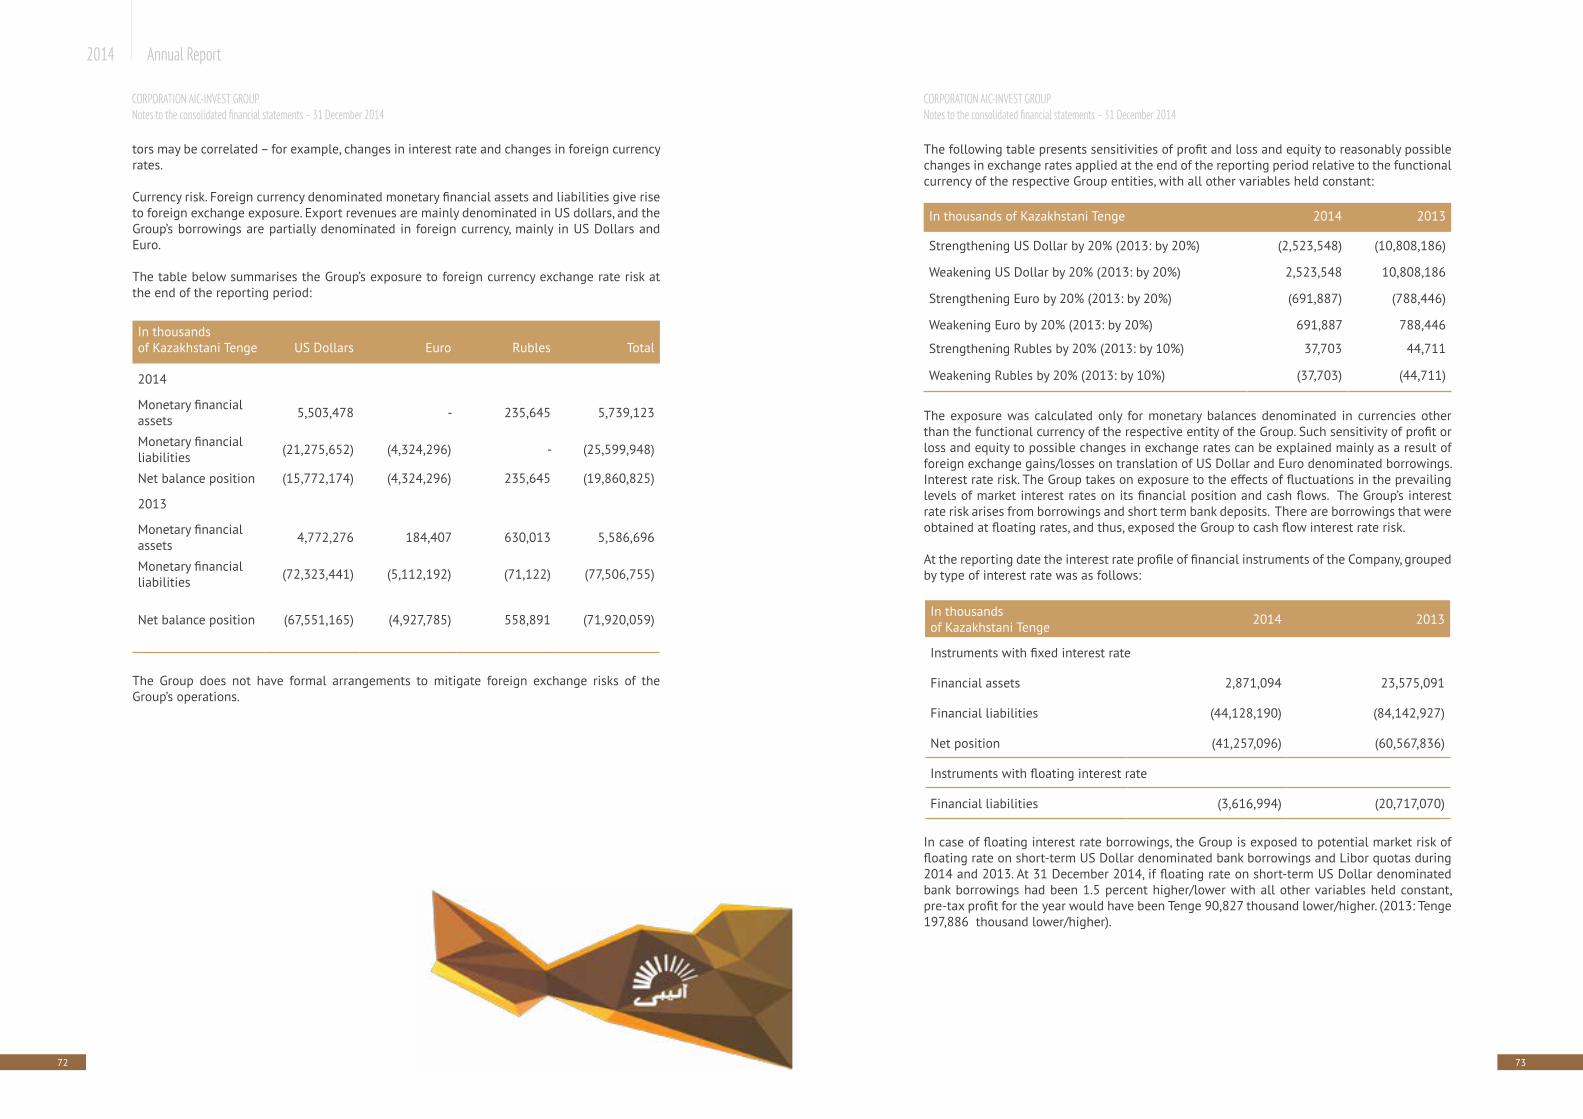
72 73
2014 Annual Report
tors may be correlated – for example, changes in interest rate and changes in foreign currency rates.
Currency risk. Foreign currency denominated monetary financial assets and liabilities give rise to foreign exchange exposure. Export revenues are mainly denominated in US dollars, and the Group’s borrowings are partially denominated in foreign currency, mainly in US Dollars and Euro.
The table below summarises the Group’s exposure to foreign currency exchange rate risk at the end of the reporting period:
The Group does not have formal arrangements to mitigate foreign exchange risks of the Group’s operations.
In thousands of Kazakhstani Tenge US Dollars Euro Rubles Total
2014
Monetary financial assets 5,503,478 - 235,645 5,739,123
Monetary financial liabilities (21,275,652) (4,324,296) - (25,599,948)
Net balance position (15,772,174) (4,324,296) 235,645 (19,860,825)
2013
Monetary financial assets 4,772,276 184,407 630,013 5,586,696
Monetary financial liabilities (72,323,441) (5,112,192) (71,122) (77,506,755)
Net balance position (67,551,165) (4,927,785) 558,891 (71,920,059)
CORPORATION AIC-INVEST GROUP Notes to the consolidated financial statements – 31 December 2014
The following table presents sensitivities of profit and loss and equity to reasonably possible changes in exchange rates applied at the end of the reporting period relative to the functional currency of the respective Group entities, with all other variables held constant:
The exposure was calculated only for monetary balances denominated in currencies other than the functional currency of the respective entity of the Group. Such sensitivity of profit or loss and equity to possible changes in exchange rates can be explained mainly as a result of foreign exchange gains/losses on translation of US Dollar and Euro denominated borrowings.Interest rate risk. The Group takes on exposure to the effects of fluctuations in the prevailing levels of market interest rates on its financial position and cash flows. The Group’s interest rate risk arises from borrowings and short term bank deposits. There are borrowings that were obtained at floating rates, and thus, exposed the Group to cash flow interest rate risk.
At the reporting date the interest rate profile of financial instruments of the Company, grouped by type of interest rate was as follows:
In case of floating interest rate borrowings, the Group is exposed to potential market risk of floating rate on short-term US Dollar denominated bank borrowings and Libor quotas during 2014 and 2013. At 31 December 2014, if floating rate on short-term US Dollar denominated bank borrowings had been 1.5 percent higher/lower with all other variables held constant, pre-tax profit for the year would have been Tenge 90,827 thousand lower/higher. (2013: Tenge 197,886 thousand lower/higher).
In thousands of Kazakhstani Tenge 2014 2013
Strengthening US Dollar by 20% (2013: by 20%) (2,523,548) (10,808,186)
Weakening US Dollar by 20% (2013: by 20%) 2,523,548 10,808,186
Strengthening Euro by 20% (2013: by 20%) (691,887) (788,446)
Weakening Euro by 20% (2013: by 20%) 691,887 788,446
Strengthening Rubles by 20% (2013: by 10%) 37,703 44,711
Weakening Rubles by 20% (2013: by 10%) (37,703) (44,711)
In thousands of Kazakhstani Tenge 2014 2013
Instruments with fixed interest rate
Financial assets 2,871,094 23,575,091
Financial liabilities (44,128,190) (84,142,927)
Net position (41,257,096) (60,567,836)
Instruments with floating interest rate
Financial liabilities (3,616,994) (20,717,070)
CORPORATION AIC-INVEST GROUP Notes to the consolidated financial statements – 31 December 2014
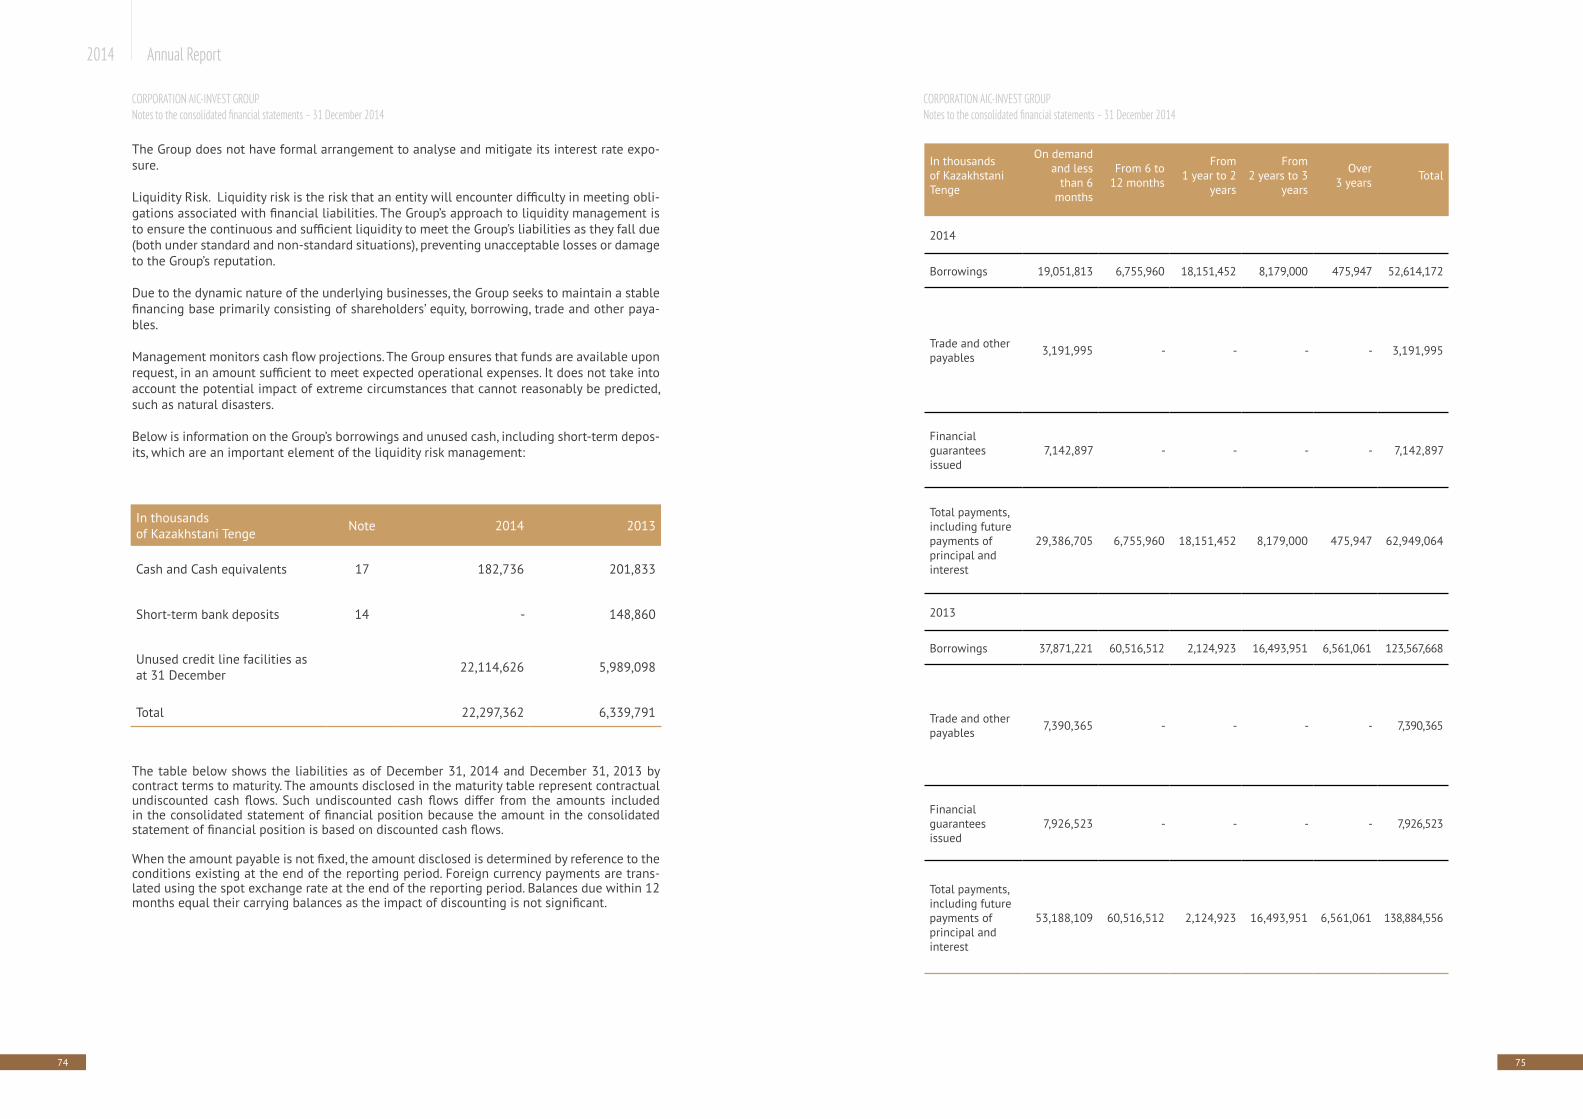
74 75
2014 Annual Report
The Group does not have formal arrangement to analyse and mitigate its interest rate expo-sure.
Liquidity Risk. Liquidity risk is the risk that an entity will encounter difficulty in meeting obli-gations associated with financial liabilities. The Group’s approach to liquidity management is to ensure the continuous and sufficient liquidity to meet the Group’s liabilities as they fall due (both under standard and non-standard situations), preventing unacceptable losses or damage to the Group’s reputation.
Due to the dynamic nature of the underlying businesses, the Group seeks to maintain a stable financing base primarily consisting of shareholders’ equity, borrowing, trade and other paya-bles.
Management monitors cash flow projections. The Group ensures that funds are available upon request, in an amount sufficient to meet expected operational expenses. It does not take into account the potential impact of extreme circumstances that cannot reasonably be predicted, such as natural disasters.
Below is information on the Group’s borrowings and unused cash, including short-term depos-its, which are an important element of the liquidity risk management:
The table below shows the liabilities as of December 31, 2014 and December 31, 2013 by contract terms to maturity. The amounts disclosed in the maturity table represent contractual undiscounted cash flows. Such undiscounted cash flows differ from the amounts included in the consolidated statement of financial position because the amount in the consolidated statement of financial position is based on discounted cash flows.
When the amount payable is not fixed, the amount disclosed is determined by reference to the conditions existing at the end of the reporting period. Foreign currency payments are trans-lated using the spot exchange rate at the end of the reporting period. Balances due within 12 months equal their carrying balances as the impact of discounting is not significant.
In thousands of Kazakhstani Tenge Note 2014 2013
Cash and Cash equivalents 17 182,736 201,833
Short-term bank deposits 14 - 148,860
Unused credit line facilities as at 31 December 22,114,626 5,989,098
Total 22,297,362 6,339,791
CORPORATION AIC-INVEST GROUP Notes to the consolidated financial statements – 31 December 2014
In thousands of Kazakhstani Tenge
On demand and less
than 6 months
From 6 to 12 months
From 1 year to 2
years
From2 years to 3
years
Over 3 years Total
2014
Borrowings 19,051,813 6,755,960 18,151,452 8,179,000 475,947 52,614,172
Trade and other payables 3,191,995 - - - - 3,191,995
Financial guarantees issued
7,142,897 - - - - 7,142,897
Total payments, including future payments of principal and interest
29,386,705 6,755,960 18,151,452 8,179,000 475,947 62,949,064
2013
Borrowings 37,871,221 60,516,512 2,124,923 16,493,951 6,561,061 123,567,668
Trade and other payables 7,390,365 - - - - 7,390,365
Financial guarantees issued
7,926,523 - - - - 7,926,523
Total payments, including future payments of principal and interest
53,188,109 60,516,512 2,124,923 16,493,951 6,561,061 138,884,556
CORPORATION AIC-INVEST GROUP Notes to the consolidated financial statements – 31 December 2014
76 77
2014 Annual Report
Capital risk management. The Group’s objectives when managing capital are to safeguard the Group’s ability to continue as a going concern in order to provide returns for participants and benefits to other stakeholders.
Consistent with others in the industry, the Group requires significant amount of debt. Fi-nancing is monitored on a day to day basis by the CODM and senior management. The Group actively manages its debt to lower the cost of financing. The Group has certain borrowings which specify debt to equity ratios. When negotiating new lines of credit the Group obtains confirmation from respective borrowers that new debt to equity ratios are acceptable to such borrowers.
The gearing ratios at 31 December 2014 and 2013 were as follows:
The Group management considers the level of gearing ratio at 31 December 2014 and 2013 as appropriate and reflecting the requirements of the industry.
In thousands of Kazakhstani Tenge Note 2014 2013
Total borrowings 19 47,745,184 104,859,997
Less: cash and cash equivalents 17 (182,736) (201,833)
Net debt 47,562,448 104,658,164
Total equity 74,127,672 72,451,700
Total capital 121,690,120 177,109,864
Gearing ratio 39% 59%
CORPORATION AIC-INVEST GROUP Notes to the consolidated financial statements – 31 December 2014
Fair Value of Financial Instruments Fair value measurements are analysed by level in the fair value hierarchy as follows: (i) level one are measurements at quoted prices (unadjusted) in active markets for identical assets or liabilities, (ii) level two measurements are valuations techniques with all material inputs ob-servable for the asset or liability, either directly (that is, as prices) or indirectly (that is, derived from prices), and (iii) level three measurements are valuations not based on observable market data (that is, unobservable inputs). Management applies judgement in categorising financial instruments using the fair value hierarchy. If a fair value measurement uses observable inputs that require significant adjustment, that measurement is a Level 3 measurement. The signifi-cance of a valuation input is assessed against the fair value measurement in its entirety.Financial assets carried at amortised cost. The fair value of floating rate instruments is nor-mally their carrying amount. The estimated fair value of fixed interest rate instruments is based on estimated future cash flows expected to be received discounted at current interest rates for new instruments with similar credit risk and remaining maturity, which is a level 3 of fair value hierarchy. Discount rates used depend on the credit risk of the counterparty. The carrying amount of financial assets approximates their fair value due to the short term repay-ment period. (Note 11).
Key management personnel compensation
Key management compensation is disclosed in Note 10. During 2014 and 2013 the key man-agement personnel includes the Chairman of the Board and the General Director. The remu-neration of key management personnel represents salaries and short term employee benefits.
Balances and Transactions with Related Parties and Other Significant Parties
For the purposes of these consolidated financial statements, parties are considered to be related if one party has the ability to control the other party, is under common control, or can exercise significant influence over the other party in making financial and operational decisions. Entities under common control of the Group’s participants include businesses under control of the Company’s owner - “Holding Alibi” LLP and the company controlled by Mr Nurlan Tleubayev. Other significant parties include entities owned by Mr. Nurlan Tleubayev’s extend-ed family members and business and trading partners with which the Group has significant trading transactions; in some instances employees of the Group have certain temporary man-agement positions in these entities. The relationship with these other significant parties does not allow these entities to be treated as related parties of the Group in accordance with IAS 24 (“Related Parties”), but the Group believes disclosure of these transactions is relevant to an understanding of the financial statements.
10
9
8
CORPORATION AIC-INVEST GROUP Notes to the consolidated financial statements – 31 December 2014
78 79
2014 Annual Report
At 31 December 2014, the outstanding balances with related parties and other significant parties were as follows:
In 2014 and 2013, Group’s bank deposits were collateralised under borrowings taken by the Group, related parties and other significant parties (Note 16).
Related parties
In thousands of Kazakhstani Tenge Note
Entities un-der common
control of the Group’s
participants
Key management
personnelGroup’s owners
Other significant
parties
Trade receivables 14 791,500 - - 9,061,396
Loans at below market interest rate 14,16 - - - 1,936,094
Other receivables 14 - - - 21,280
Advances given 14 11,254,511 - 66,996,700 22,978,278
Finance lease receivables, current portion
15 477,024 - - 1,761,954
Finance lease receivables, non current portion
15 4,518 - - 2,318,875
Trade payables 20 491,291 - 610,377
Short term loans 19 - 2,935 - -
Advances received for goods and services
20 4,424,654 - - 22,966,342
CORPORATION AIC-INVEST GROUP Notes to the consolidated financial statements – 31 December 2014
In 2014 and 2013 related and other significant parties provided pledges, in form of grain and property, plant and equipment following the borrowings obtained by the Group.
The Group also provides prepayments (advances given) to its related parties and other sig-nificant parties to enable them to buy herbicides, seeds and other materials for producing grain and finance farmer’s working capital requirements during grain planting and harvesting season, which typically lasts from May through October each year. Advances given to Group’s owner in the amount of Tenge 66,996,700 thousand (2013: Tenge 12,945,000 thousand) also represents prepayment for future grain. The prepayments will further be distributed by Group’s owner to farmers. Amounts of advances given during 2014 and 2013 are further disclosed in Note 14.
The income and expense items with related parties and other significant parties for the year
2014 were as follows:
Related parties
In thousands of Kazakhstani Tenge
Entities un-der common
control of the Group's
participants
Key management
personnelGroup’s owners
Other significant
parties
Revenue 20,303,630 15,156,856
Purchases 1,818,242 - - 37,214,201
Other operating income 1,829,320 - 8,735,597
Distribution costs 741,436 - - 15,793
General and administrative expenses - - 445,872
Unwinding of the present value discount for other financial assets
- - - 514,271
Remuneration of key management of personnel - - - -
руководящего персонала 378,817 - -
CORPORATION AIC-INVEST GROUP Notes to the consolidated financial statements – 31 December 2014
80 81
2014 Annual Report
In 2014 and 2013, the Group acted as a guarantor for borrowings taken by related parties and other significant parties. According to guarantee contracts, the Group takes the full responsi-bility for repayment of borrowings in case of related parties’s and other significant parties’s failure to repay the borrowings. Losses on initial recognition on issuance of financial guaran-tees and income on amortisation of loss recognised on initital recognition of financial guar-antees comprised Tenge 249,102 thousand and Tenge 161,614 thousand, respectively (2013: Tenge 201,935 thousand and Tenge 447,098 thousand) (Note 26). At 31 December 2014 and 31 December 2013 all borrowings which were due were paid in time by related parties and other significant parties according to schedules. Maximum exposure to credit risk was shown in Note 7 within “Business and financial risk management”.
Purchases from other significant parties in the amount of Tenge 1,500,000 thousand include equipment, sale proceeds of which are included in other operating income (Note 23). In ad-dition, the Group has provided agricultural objects market research services to one of other significant parties for the amount of Tenge 2,285,303 thousand (Note 23).
In 2013 the Group charged fines and penalties to its suppliers, including related and other significant parties, for non delivery of grain in accordance with the contracts (Note 23).
At 31 December 2013, the outstanding balances with related parties and other significant parties were as follows:
Related parties
In thousands of Kazakhstani Tenge Note
Entities un-der common
control of the Group’s
participants
Key management
personnelGroup’s owners
Other significant
parties
Trade receivables 14 24,283,641 - - 12,879,409
Loans at below market interest rate 14,16 - - - 2,626,231
Other receivables 14 - - - 32,363
Advances given 14 12,362,391 - 12,945,000 62,679,886
Finance lease receiva-bles, current portion 15 464,414 - - 1,760,641
Finance lease receiv-ables, non current portion
15 469,336 - - 4,153,465
Trade payables 20 927,305 - 81 1,651,441
Advances received for goods and services 20 - - - 8,270,610
CORPORATION AIC-INVEST GROUP Notes to the consolidated financial statements – 31 December 2014
The income and expense items with related parties and other significant parties for the year 2013 were as follows:
Related parties
In thousands of Kazakhstani Tenge
Entities un-der common
control of the Group's
participants
Key management
personnelGroup’s owners
Other significant
parties
Revenue 46,129,796 - - 12,097,770
Purchases 1,927,174 - 72 55,202,638
Other operating income 648,371 - - 1,602,530
Distribution costs 1,144,581 - - 22,594
General and administrative expenses - - - 153,510
Loss on origination of other financial assets - - - 273,710
Unwinding of the present value discount for other financial assets
- - - 261,859
Remuneration of key manage-ment of personnel - 389,694 - -
CORPORATION AIC-INVEST GROUP Notes to the consolidated financial statements – 31 December 2014
82 83
2014 Annual Report
Finance Instruments by Measurement CategoriesThe accounting policies for financial instruments have been applied to line items below:
In thousands of Kazakhstani Tenge Note 2014 2013
Loans and receivables
Cash and cash equivalents 17 182,736 201,833
Trade and other receivables 14 25,385,026 48,638,639
Finance lease receivables 15 5,466,685 7,766,821
Other current assets 16 - 10,800,000
Other non-current assets 16 1,450,488 11,791,805
Total financial assets 32,484,935 79,199,098
Financial liabilities at amortised cost
Borrowings 19 47,745,184 104,859,997
Trade and other payables 20 3,411,756 7,558,330
Total financial liabilities 51,156,940 112,418,327
CORPORATION AIC-INVEST GROUP Notes to the consolidated financial statements – 31 December 2014
11 Property, Plant and Equipment Movements in the carrying amount of property, plant and equipment were as follows:
In thousands of Kazakh-stani Tenge Land
Buildings and con-
structions
Machinery and equip-
ment
Транс-портные средства Vehicles Other Total
Cost at 1 Janu-ary 2013 35,014 4,027,869 2,937,338 178,509 92,996 84,179 7,355,905
Accumulated depreciation - (599,045) (806,685) (71,329) (49,220) - (1,526,279)
Carrying amount at 1 January 2013
35,014 3,428,824 2,130,653 107,180 43,776 84,179 5,829,626
Additions 12,528 5,398 5,585 15,663 9,714 42,188 91,076
Disposals - - (53) - (390) (14,569) (15,012)
Depreciation charge - (162,040) (335,656) (29,138) (17,070) - (543,904)
Effect of trans-lation to presentation currency
(2,142) (88,122) 160,476 (16,187) (11,319) (31,486) 11,220
Cost at 31 December 2013
45,400 3,913,512 3,149,686 194,850 44,638 80,312 7,428,398
Accumulated depreciation - (729,452) (1,188,681) (117,332) (19,927) - (2,055,392)
Carrying amount at 31 December 2013
45,400 3,184,060 1,961,005 77,518 24,711 80,312 5,373,006
Additions - - 636 1,778 4,284 7,902 14,600
Impairment loss - (212,333) (185,932) - (2,687) - (400,952)
Disposals - - (27,985) (40,825) (71) - (68,881)
Depreciation charge - (147,800) (338,082) (23,379) (17,249) - (526,510)
Effect of translation to presentation currency
(14,714) (405,527) (16,257) 3,694 27,365 (27,556) (432,995)
Cost at31 December 2014
30,686 3,150,482 2,844,539 145,139 71,198 60,658 6,302,702
Accumulated depreciation - (732,082) (1,451,154) (126,353) (34,845) - (2,344,433)
Carrying amount at 31 December 2014
30,686 2,418,400 1,393,385 18,786 36,353 60,658 3,958,269
12
CORPORATION AIC-INVEST GROUP Notes to the consolidated financial statements – 31 December 2014
84 85
2014 Annual Report
At 31 December 2014 property, plant and equipment carried at Tenge 2,489,301 thousand have been pledged to banks as collateral for borrowings (2013: Tenge 5,199,672 thousand).
Depreciation charge is allocated to the following expenses:
Inventories
Trade and Other Receivables
Depreciation charge Note 2014 2013
Cost of sales 22 476,243 482,333
General and administrative expenses 25 50,267 61,571
Total depreciation charge 526,510 543,904
In thousands of Kazakhstani Tenge 2014 2013
Grain 5,170,570 8,442,123
Barley 4,520 183,855
Other 44,232 50,846
Total inventories 5,219,322 8,676,824
In thousands of Kazakhstani Tenge Note 2014 2013
Trade receivables from third parties 18,914,704 15,284,400
Trade receivables from other signifi-cant parties 10 9,061,396 12,879,409
Loans at below market rate to other significant parties 10 1,420,606 834,426
Trade receivables from related parties 10 791,500 24,283,641
Short-term bank deposits (2013: 7%- 7.5 % p.a.) - 148,860
Other receivables 21,280 32,363
Less: provision for impairment (4,824,460) (4,824,460)
Total financial assets 25,385,026 48,638,639
14
13
CORPORATION AIC-INVEST GROUP Notes to the consolidated financial statements – 31 December 2014
Short term bank deposits include cash on deposit accounts with original maturity of more than three months.
Movements on the provision for impairment on trade and other receivables are as follows:
Carrying amount of financial assets within trade and other receivables approximates their fair value due to the short-term of such instruments.
In thousands of Kazakhstani Tenge Note 2014 2013
Advances given to related parties 10 78,251,211 25,307,391
Advances given to other significant parties 10 22,978,278 62,679,886
Advances given to third parties 15,675,525 20,720,809
Prepaid expenses 43,659 110,751
Other receivables 1,124 5,053
Total non-financial assets 116,949,797 108,823,890
Total trade and other receivables 142,334,823 157,462,529
In thousands of Kazakhstani Tenge 2014 2013
Provision for impairment at 1 January 4,824,460 4,770,379
Provision for impairment during the year - 90,138
Receivables written off during the year as uncollectible - (36,057)
Effect of translation to presentation currency - -
Provision for impairment at 31 December 4,824,460 4,824,460
CORPORATION AIC-INVEST GROUP Notes to the consolidated financial statements – 31 December 2014
86 87
2014 Annual Report
There are no available external rating on the neither past due nor impaired trade receivable balances. The Group assesses the credit quality of those trade receivable as positive, consider-ing the proven history of relationships and the history of no defaults.
Carrying amount of the Group’s financial assets (trade and other receivables) are denominated in the following currencies:
Provided below is credit quality analysis of financial assets within trade and other receivables:
In thousands of Kazakhstani Tenge 2014 2013
Tenge 17,257,078 42,340,137
US Dollars 5,503,346 4,765,958
Euro 1,052,992 41,734
Rubles 1,571,610 1,487,445
LVL - 3,365
Total financial assets 25,385,026 48,638,639
2014 2013
In thousands of Kazakhstani Tenge
Tradereceivables
Otherfinancial
receivablesTrade
receivables
Otherfinancial
receivables
Neither past due nor impaired
- from other signifi-cant parties 9,178,648 1,067,709 2,506,689 866,789
- from third parties 8,343,845 21,280 5,053,168 148,860
- from related parties 791,500 - 12,272,481 -
CORPORATION AIC-INVEST GROUP Notes to the consolidated financial statements – 31 December 2014
Balances renegotiat-ed during the period
- from third parties 5,746,399 - 5,406,772 -
- from other signifi-cant parties 235,645 - 10,372,720 -
- from related parties - - 12,011,160 -
Total neither past due nor impaired 24,296,037 1,088,989 47,622,990 1,015,649
Past due but not impaired
- overdue from 31 to 180 days - - - -
- overdue from 180 to 360 days - - - -
- overdue over 360 days - - - -
Итого просроченные, но не обесцененные
- - - -
Total past due but not impaired receiv-ables
- - - -
Individually deter-mined to be im-paired (gross)
4,824,460 - 4,824,460 -
- overdue over 360 days 4,824,460 - 4,824,460 -
Less: provision for impairment (4,824,460) - (4,824,460) -
Total financial assets within trade and other receivables
24,296,037 1,088,989 47,622,990 1,015,649
CORPORATION AIC-INVEST GROUP Notes to the consolidated financial statements – 31 December 2014
88 89
2014 Annual Report
Balances renegotiated during the period represent closing balances whose repayment terms have been extended by an extra three to six months.
Movements in advances given are as follows:
In thousands of Kazakhstani Tenge
Advances given to related parties and other
significant parties
Advances given to third parties
Carrying value at 1 January 2013 56,654,145 15,373,309
Additions 78,347,528 28,821,998
Repayment by cash (23,833,338) (8,554,311)
Offset with other contracts 10,199,148 (279,305)
Receivables derecognised on receipt of related goods and services
(33,070,812) (14,640,601)
Effect of translation to pres-entation currency (309,394) (281)
Total advances given at 31 December 2013 87,987,277 20,720,809
Additions 129,230,685 34,470,857
Repayment by cash (85,256,259) (18,692,713)
Offset with other contracts (11,564,829) (11,412,724)
Receivables derecognised on receipt of related goods and services
(18,882,479) (9,396,521)
Effect of translation to pres-entation currency (284,906) (14,183)
Total advances given at 31 December 2014 101,229,489 15,675,525
CORPORATION AIC-INVEST GROUP Notes to the consolidated financial statements – 31 December 2014
Advances given to related parties and other significant parties mainly represent prepayments made to farmers to enable them to buy herbicides, seeds and other materials for producing grain and finance farmer’s working capital requirements during grain planting and harvesting season, which typically lasts from May through October each year. These advances are mostly settled by farmers in the form of harvested grain in the end of the grain production season.
Other receivables mainly represent prepayments made for purchase of grain, herbicides and other materials and are carried out as a means of financing farming activities.
Finance Lease Receivables
Since 2006, the Group has been actively involved in finance lease activities as a lessor. The Group leases agricultural and other equipment mostly to related party and other significant party farmers and other companies under mid-term and long-term finance lease arrangements with maturities up to 2023.
The finance lease receivables are effectively collateralised by the leased assets and the Group has provided for in the contracts a right to revert the leased assets back in case of the coun-terparty’s default
Below is the analysis of finance lease receivables as at 31 December 2014:
In thousands of Kazakstani Tenge Due in 1 year
Due between2 and 5 years
Due after5 years Total
Finance lease payments receivable at 31 December 2014
3,776,362 3,402,295 84,524 7,263,181
Unearned finance income (893,673) (886,449) (16,374) (1,796,496)
Present value of lease payments receivable at 31 December 2014
2,882,689 2,515,846 68,150 5,466,685
15
CORPORATION AIC-INVEST GROUP Notes to the consolidated financial statements – 31 December 2014
90 91
2014 Annual Report
Below is the analysis of finance lease receivables as at 31 December 2013:
The primary factor that the Group considers in determining whether a receivable is impaired is its overdue status and history of relations with the debtor. There is no available external rating on the neither past due nor impaired finance lease receivable balances. The Group assesses the credit quality of those finance lease receivable as positive, considering the proven history of relationships and the history of no defaults.
Provided below is credit quality analysis of financial assets within finance lease receivables:
In thousands of Kazakstani Tenge Due in 1 year
Due between2 and 5 years
Due after5 years Total
Finance lease payments receivable at 31 December 2013
3,854,841 6,306,990 699,495 10,861,326
Unearned finance income (1,100,164) (1,855,248) (139,093) (3,094,505)
Present value of lease payments receivable at 31 December 2013
2,754,677 4,451,742 560,402 7,766,821
In thousands of Kazakhstani Tenge 2014 2013
Neither past due nor impaired
- from other significant parties 4,080,829 5,764,789
- from related parties 481,542 1,186,611
- from third parties 439,589 519,721
Total neither past due nor impaired 5,001,960 7,471,121
CORPORATION AIC-INVEST GROUP Notes to the consolidated financial statements – 31 December 2014
As a result of the above analysis, there are no finance lease receivables that are individually determined to be impaired. The carrying amount of finance lease receivables approximates their fair value as of both year-ends.
Other non-current assets
Long term deposits amounting to Tenge 925,000 thousand are not pledged and are placed for the period of more than one year. Restricted deposits amounting to Tenge 10,000 thousand include collateralised bank deposits in Tsesnabank JSC with interest rate of 7% p.a. Deposits were pledged following credit line.
The Group provides loans at below market rate to other significant parties. Short-term portion of the loans are reflected in Note 14. The carrying amount of restricted deposits and loans provided approximates their fair value.
In thousands of Kazakhstani Tenge 2014 2013
Past due but not impaired
- less than 30 days overdue - -
- over 30 days overdue 464,725 295,700
Total past due but not impaired receivables 464,725 295,700
Total financial assets within finance lease receivables 5,466,685 7,766,821
In thousands of Kazakhstani Tenge 2014 2013
Long term bank deposits (2014: 7% p.a.) 925,000 -
Loans at below market rate to other signifi-cant parties (Note 10) 515,488 1,791,805
Restricted deposits (2014 and 2013: 7% p.a.) 10,000 10,000,000
Total financial assets 1,450,488 11,791,805
Prepayment for property, plant and equipment 113,090 -
Total non-current assets 1,563,578 11,791,805
CORPORATION AIC-INVEST GROUP Notes to the consolidated financial statements – 31 December 2014
92 93
2014 Annual Report
CORPORATION AIC-INVEST GROUP Notes to the consolidated financial statements – 31 December 2014
The credit quality of deposits can be assessed by reference to external credit ratings and sum-marised as follows:
The credit quality of restricted and bank deposits can be assessed by reference to external credit ratings and summarised as follows:
Restricted deposits in 2013 amounting to Tenge 9,300,000 thousand related to collateral placed in two banks – Delta Bank JSC and Tsesnabank JSC at interest rates of 7-7.5 percent per annum. Deposits were collateralised following borrowings taken by related parties and other significant parties. According to pledge contracts, the deposits became unrestricted after full repayment of the borrowings by the related parties and other significant parties. Fixed-term bank deposits in 2013 amounting to Tenge 1,500,000 thousand relate to deposits placed in Eximbank JSC. The carrying amount of restricted deposits and fixed-term deposits approxi-mates their fair value.
In thousands of Kazakhstani Tenge Rating agency Rating 2014 2013
Eximbank Kazakhstan JSC (long term)
Expert RA Kazakhstan B++ 925,000 -
Tsesnabank JSC (restricted) S&P’s B+ 10,000 -
Delta Bank JSC (restricted) S&P’s B - 10,000,000
Total deposits 935,000 10,000,000
В тысячах казахстанских тенге 2014 г. 2013 г.
Restricted deposits (2013: 7-7.5% p.a) - 9,300,000
Fixed-term bank deposits (2013: 8% p.a.) - 1,500,000
Total deposits - 10,800,000
In thousands of Kazakhstani Tenge Rating agency Rating 2014 2013
Delta Bank JSC S&P’s B - 9,290,000
Tsesnabank JSC S&P’s B+ - 10,000
Eximbank Kazakhstan JSC Expert RA Kazakhstan В++ - 1,500,000
Total deposits - 10,800,000
Cash and Cash equivalents
In thousands of Kazakhstani Tenge 2014 2013
Cash on current accounts in foreign currency 168,799 150,996
Cash on current accounts in Tenge 10,611 44,618
Cash on card accounts in Tenge 3,272 6,005
Cash on hand in Tenge 51 1
Cash on hand in foreign currency 3 213
Total cash and cash equivalents 182,736 201,833
The Group’s cash and cash equivalents are denominated in the following currencies:
In thousands of Kazakhstani Tenge 2014 2013
Euro 168,640 142,673
Tenge 13,934 50,835
US Dollars 132 6,318
Rubles 30 26
LVL - 1,981
Total cash and cash equivalents 182,736 201,833
CORPORATION AIC-INVEST GROUP Notes to the consolidated financial statements – 31 December 2014
17
94 95
2014 Annual Report
CORPORATION AIC-INVEST GROUP Notes to the consolidated financial statements – 31 December 2014
In thousands of Kazakhstani Tenge Rating agency Rating
(S&P) 2014 2013
Cash and cash equivalent
Nordea Bank Finland Plc. S&P’s AA- 125,592 131,791
Swedbank AS S&P’s A+ 43,180 12,866
JSC «Kazkommertsbank» S&P’s B 5,477 1,048
JSC «Halyk Bank» S&P’s BB+ 3,399 6,199
SB JSC «Sberbank» Moody’s Ba2 1,487 1,020
JSC «Eurasian Bank» S&P’s B+ 1,159 1,550
JSC «BankPositiv Kazakhstan» - - 566 4,687
Development Bank of Kazakh-stan S&P’s BBB 480 3,512
Islamic Bank «Al Hilal» Fitch A1 361 1,118
JSC «Eximbank Kazakhstan» Эксперт РА Казахстан B++ 287 26,488
JSC «Delta Bank» S&P’s B 229 906
Credit Europe Bank Moody’s Ba2 132 6,317
SB «Alfa bank» S&P’s B+ 130 872
JSC «Citibank Kazakhstan» S&P’s A 91 949
JSC «Bank Centercredit» S&P’s B+ 30 65
JSC «Bank VTB (Kazakhstan)» S&P’s BB 29 961
Sberbank of Russia Moody’s Baa1 27 26
JSC «Tsesnabank» S&P’s B+ 26 822
SB «RBS «Kazakhstan» S&P’s BBB+ - 167
JSC «Alians Bank» S&P’s В - 130
JSC «Kazinvestbank» S&P’s B- - 69
JSC «AsiaCredit Bank» S&P’s Отозван - 38
JSC «Temirbank» S&P’s B - 18
Total cash and cash equivalents, excluding cash on hand 182,682 201,619
The credit quality of cash and cash equivalents can be assessed by reference to external credit
ratings (if available) and summarised as follows:In thousands of Kazakhstani Tenge Ownership
share 2014 2013
“Holding Alibi" LLP 99% 53,955,000 53,955,000
Tleubayev N.S. 1% 545,000 545,000
Total charter capital 100% 54,500,000 54,500,000
In thousands of Kazakhstani Tenge 2014 2013
Non-current borrowings
Issued bonds 20,774,675 20,624,130
Bank borrowings 3,214,945 -
Total non-current borrowings 23,989,620 20,624,130
Current borrowings
Bank borrowings 21,608,955 83,528,882
Current portion of non-current borrowings 1,440,056 -
Coupon payable 706,553 706,985
Total current borrowings 23,755,564 84,235,867
Total borrowings 47,745,184 104,859,997
In thousands of Kazakhstani Tenge 2014 2013
Tenge 21,481,228 21,331,115
US Dollars 21,185,454 71,845,198
Euro 5,075,567 5,112,192
Rubles 2,935 6,571,492
Total borrowings 47,745,184 104,859,997
During 2014 and 2013 no dividends were declared.
Charter Capital
At 31 December 2014 and 2013 the carrying amount of borrowings approximates their fair value.
Borrowings
The carrying amount of the Group’s borrowings is denominated in the following currencies:
19
CORPORATION AIC-INVEST GROUP Notes to the consolidated financial statements – 31 December 2014
96 97
2014 Annual Report
The Group’s borrowings at 31 December 2014 are represented by the following:
*As of 31 December 2014 the Group breached certain financial covenants with respect to long-term borrowings from Development Bank of Kazakhstan. As a result, long term borrowings in the amount of Tenge 7,434,775 thousand were reclassified to short-term.
The Group’s borrowings at 31 December 2013 are represented by the following:
Carrying amount
In thousands of Kazakhstani Tenge Currency Effective
interest rateInception
yearMaturity
yearCurrent portion
Non-current portion
Issued bonds Tenge 10% 2011 2017 - 20,774,675
SB JSC Sberbank US Dollars 10% 2011 2018 1,440,056 3,214,945
Total non-current borrowings 1,440,056 23,989,620
Development Bank of Kazakhstan US Dollars 8.5 % 2013 2016* 7,436,530 -
Eurasian Bank Euro 9 % 2014 2015 4,324,296 -
Amsterdam Trade Bank US Dollars Libor+7.5 % 2011 2015 3,616,994 -
Credit Europe Bank N.V US Dollars 5.35 % 2014 2015 2,735,601 -
Islamic Bank “Al Hilal” US Dollars 8 % 2014 2015 2,741,328 -
Nordea Bank Finland Euro 6 % 2006 2015 751,271 -
Coupon payable Tenge 10 % 2011 2015 706,553 -
Shiryaev D.A. Rubles 5 % 2014 2015 2,935
Total current borrowings 22,315,508 -
Total borrowings 23,755,564 23,989,620
Carrying amount
In thousands of Kazakhstani Tenge Currency Effective
interest rateInception
yearMaturity
yearCurrent portion
Non-current portion
Issued bonds Tenge 10% 2011 2017 - 20,624,130
Total non-current borrowings - 20,624,130
CORPORATION AIC-INVEST GROUP Notes to the consolidated financial statements – 31 December 2014
Carrying amount
In thousands of Kazakhstani Tenge Currency Effective
interest rateInception
yearMaturity
yearCurrent portion
Non-current portion
Development Bank of Kazakhstan US Dollars 8.5 % 2013 2016* 13,862,294 -
SB Sberbank US Dollars 10 % 2013 2014 13,442,900 -
Citibank N.Y. US Dollars Libor+5 % 2013 2014 9,018,129 -
Sberbank of Russia Rubles 9.5 -10.5 % 2013 2014 6,571,492 -
Amsterdam Trade Bank US Dollars Libor+7.5 % 2011 2014 6,059,987 -
SB Sberbank US Dollars 10 % 2011 2018* 5,109,832 -
Development Bank of Kazakhstan US Dollars 8.5 % 2011 2014 4,290,557 -
Tsesnabank US Dollars 7 % 2012 2014 4,251,691 -
Tsesnabank Euro 7 % 2012 2014 4,237,361 -
Credit Europe Bank N.V US Dollars Libor+4.5 % 2013 2014 3,795,267 -
Eurasian Bank US Dollars 10 % 2013 2014 3,778,897 -
VTB Bank US Dollars 8 % 2013 2014 3,009,783 -
“Al Hilal” Islamic Bank US Dollars 8 % 2013 2014 2,310,294 -
Citibank Kazakh-stan US Dollars Libor+7 % 2013 2014 1,843,687 -
Bank Positiv US Dollars 8 % 2013 2014 1,071,880 -
Nordea Bank Finland Euro 6 % 2006 2016* 874,831 -
Coupon payable KZT 10 % 2011 2014 706,985 -
Total current borrowings 84,235,867 -
Total borrowings 84,235,867 20,624,130
CORPORATION AIC-INVEST GROUP Notes to the consolidated financial statements – 31 December 2014
98 99
2014 Annual Report
*As of 31 December 2013 the Group breached certain financial covenants with respect to long-term borrowings from Development Bank of Kazakhstan, SB Sberbank and Nordea Bank Finland. As a re-sult, long term borrowings in the amount of Tenge 13,513,830 thousand were reclassified to short-term. Subsequent to the reporting date, the Group received waivers from the banks confirming that there is no intention to demand early repayment of long-term borrowings reclassified to current liabilities in the amount of 12,799,964 thousand tenge. Development Bank of Kazakhstan. In November 2013, the Group obtained additional tranche in the amount of Tenge 13,824,900 thousand within credit line facility from the Development Bank of Kazakhstan to purchase grain for export. The borrowing was obtained at a fixed nominal interest rate of 8.5%. Interest and principal amounts are repayable on monthly basis starting from February 2014 till August 2016. During 2014, the Group repaid principal and accrued interest in the amount of Tenge 8,980,601 thousand and Tenge 1,222,490 thousand, respectively. Borrowing is secured by pledged inventory of other significant party, financial guarantee provided by third party bank and by personal guarantee of Tleubayev N.S.
Sberbank. In 2011 the Group obtained borrowing from Sberbank of Russia in four tranches in the total amount of Tenge 7,161,854 thousand to purchase 100% shares of the Ventspils Grain Terminal JSC. The borrowing was obtained at a fixed nominal interest rate of 10%. The principal is payable each March, April and May in equal instalments starting 2012 and until March 2018. Interest is pay-able quarterly. During 2014, the Group repaid principal and accrued interest in the amount of Tenge 1,379,959 thousand and Tenge 503.772 thousand, respectively. The borrowing is secured by 100% shares of the Ventspils Grain Terminal JSC, pledged inventory of Group’s participant – Alibi Holding, cash flows from future grain export contracts in the amount of Tenge 1,480,000 thousand and by personal guarantee of Tleubayev N.S. (Note 29).
Issued bonds. In 2011 the Group obtained right to issue 30,000 thousand non-convertible bonds with a face value of Tenge 1,000 for a period of 5 years. As of 31 December 2014 the Group has issued 21,139,226 thousands of bonds with a face value of Tenge 1,000.
Trade and Other Payables
In thousands of Kazakhstani Tenge Note 2014 2013
Trade payables to third parties 2,090,327 4,811,619
Trade payables to other significant parties 10 610,377 1,651,441
Trade payables to related parties 10 491,291 927,305
Financial guarantees issued 219,761 167,965
Total financial liabilities 3,411,756 7,558,330
CORPORATION AIC-INVEST GROUP Notes to the consolidated financial statements – 31 December 2014
During 2014 and 2013 the Group provided its related parties and other significant parties with financial guarantees for borrowings taken from banks.
The carrying amounts of the Group’s financial liabilities (trade payables) are denominated in the following currencies:
In thousands of Kazakhstani Tenge Note 2014 2013
Advances received for goods and services from other significant parties 10 22,966,342 8,270,610
Advances received for goods and services from third parties 9,722,071 14,591,952
Advances received for goods and services from related parties 10 4,424,654 -
Taxes payable 79,511 41,451
Other payables 66,152 108,757
Total non-financial liabilities 37,258,730 23,012,770
Total trade and other payables 40,670,486 30,571,100
In thousands of Kazakhstani Tenge 2014 2013
Tenge 3,137,019 6,790,059
Rubles 152,271 270,998
US Dollars 90,198 478,243
Euro 32,268 -
LVL - 19,030
Total financial liabilities within trade and other payables 3,411,756 7,558,330
CORPORATION AIC-INVEST GROUP Notes to the consolidated financial statements – 31 December 2014
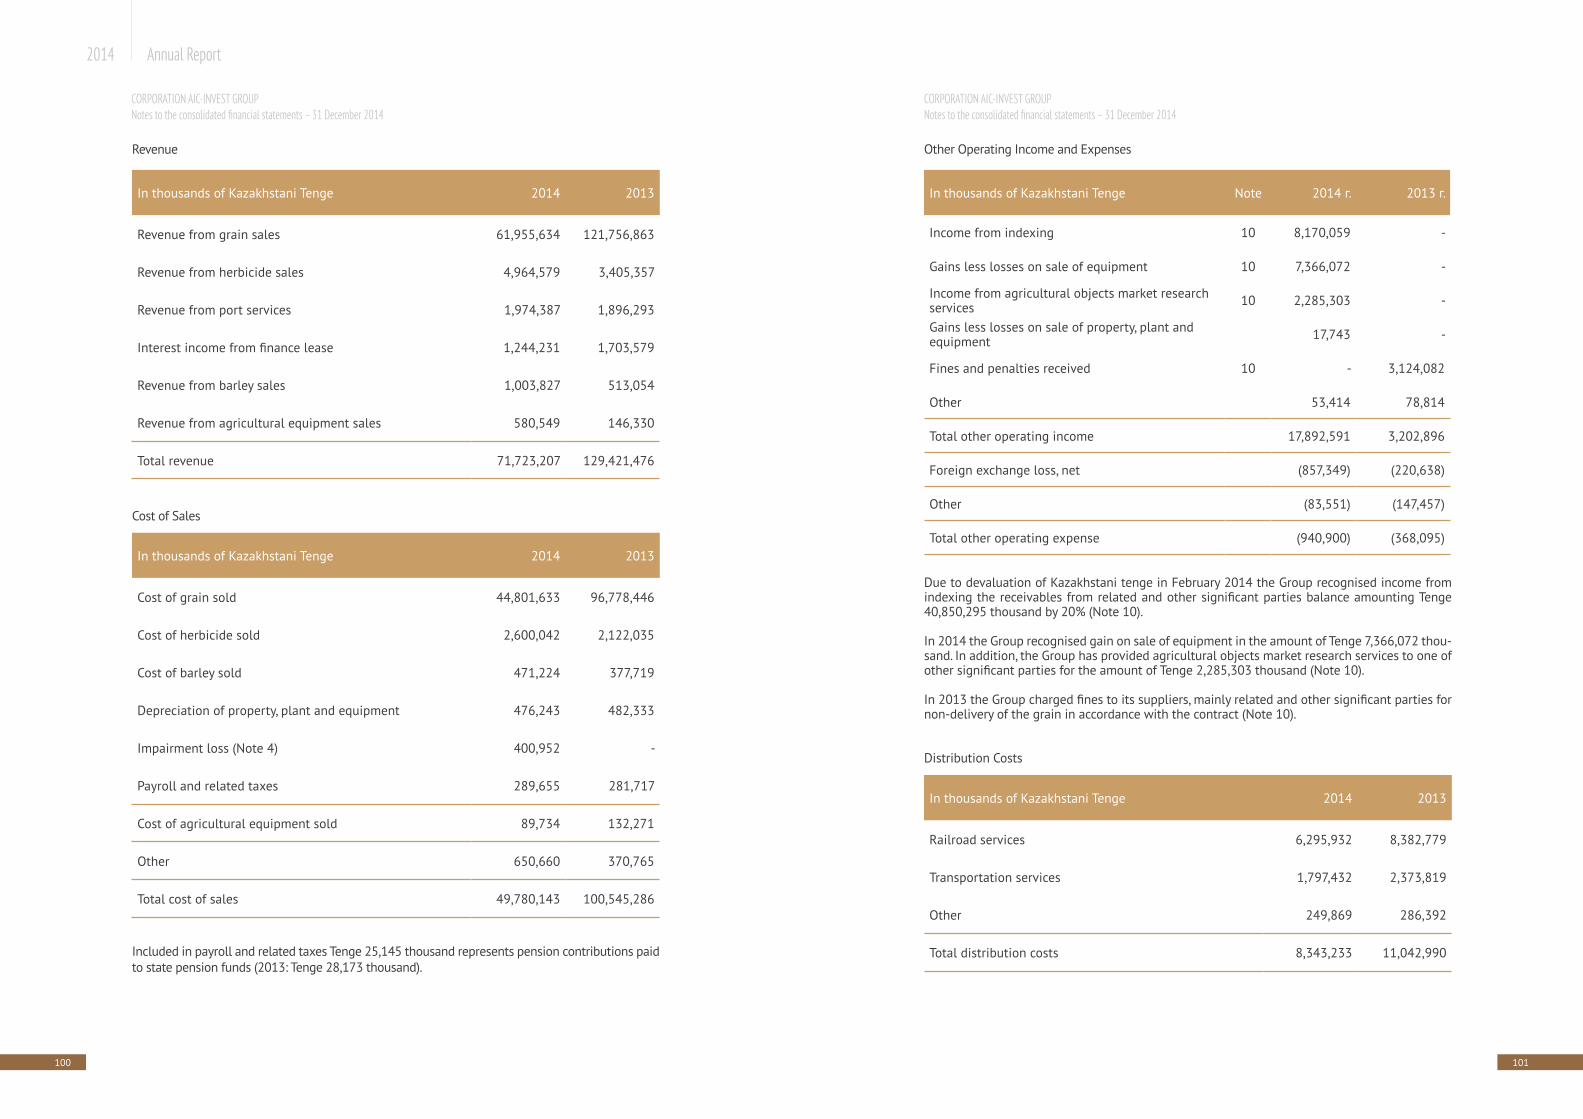
100 101
2014 Annual Report
In thousands of Kazakhstani Tenge 2014 2013
Revenue from grain sales 61,955,634 121,756,863
Revenue from herbicide sales 4,964,579 3,405,357
Revenue from port services 1,974,387 1,896,293
Interest income from finance lease 1,244,231 1,703,579
Revenue from barley sales 1,003,827 513,054
Revenue from agricultural equipment sales 580,549 146,330
Total revenue 71,723,207 129,421,476
In thousands of Kazakhstani Tenge 2014 2013
Cost of grain sold 44,801,633 96,778,446
Cost of herbicide sold 2,600,042 2,122,035
Cost of barley sold 471,224 377,719
Depreciation of property, plant and equipment 476,243 482,333
Impairment loss (Note 4) 400,952 -
Payroll and related taxes 289,655 281,717
Cost of agricultural equipment sold 89,734 132,271
Other 650,660 370,765
Total cost of sales 49,780,143 100,545,286
Revenue
Cost of Sales
Included in payroll and related taxes Tenge 25,145 thousand represents pension contributions paid to state pension funds (2013: Tenge 28,173 thousand).
CORPORATION AIC-INVEST GROUP Notes to the consolidated financial statements – 31 December 2014
In thousands of Kazakhstani Tenge Note 2014 г. 2013 г.
Income from indexing 10 8,170,059 -
Gains less losses on sale of equipment 10 7,366,072 -
Income from agricultural objects market research services 10 2,285,303 -
Gains less losses on sale of property, plant and equipment 17,743 -
Fines and penalties received 10 - 3,124,082
Other 53,414 78,814
Total other operating income 17,892,591 3,202,896
Foreign exchange loss, net (857,349) (220,638)
Other (83,551) (147,457)
Total other operating expense (940,900) (368,095)
Other Operating Income and Expenses
Due to devaluation of Kazakhstani tenge in February 2014 the Group recognised income from indexing the receivables from related and other significant parties balance amounting Tenge 40,850,295 thousand by 20% (Note 10).
In 2014 the Group recognised gain on sale of equipment in the amount of Tenge 7,366,072 thou-sand. In addition, the Group has provided agricultural objects market research services to one of other significant parties for the amount of Tenge 2,285,303 thousand (Note 10).
In 2013 the Group charged fines to its suppliers, mainly related and other significant parties for non-delivery of the grain in accordance with the contract (Note 10).
Distribution Costs
In thousands of Kazakhstani Tenge 2014 2013
Railroad services 6,295,932 8,382,779
Transportation services 1,797,432 2,373,819
Other 249,869 286,392
Total distribution costs 8,343,233 11,042,990
CORPORATION AIC-INVEST GROUP Notes to the consolidated financial statements – 31 December 2014
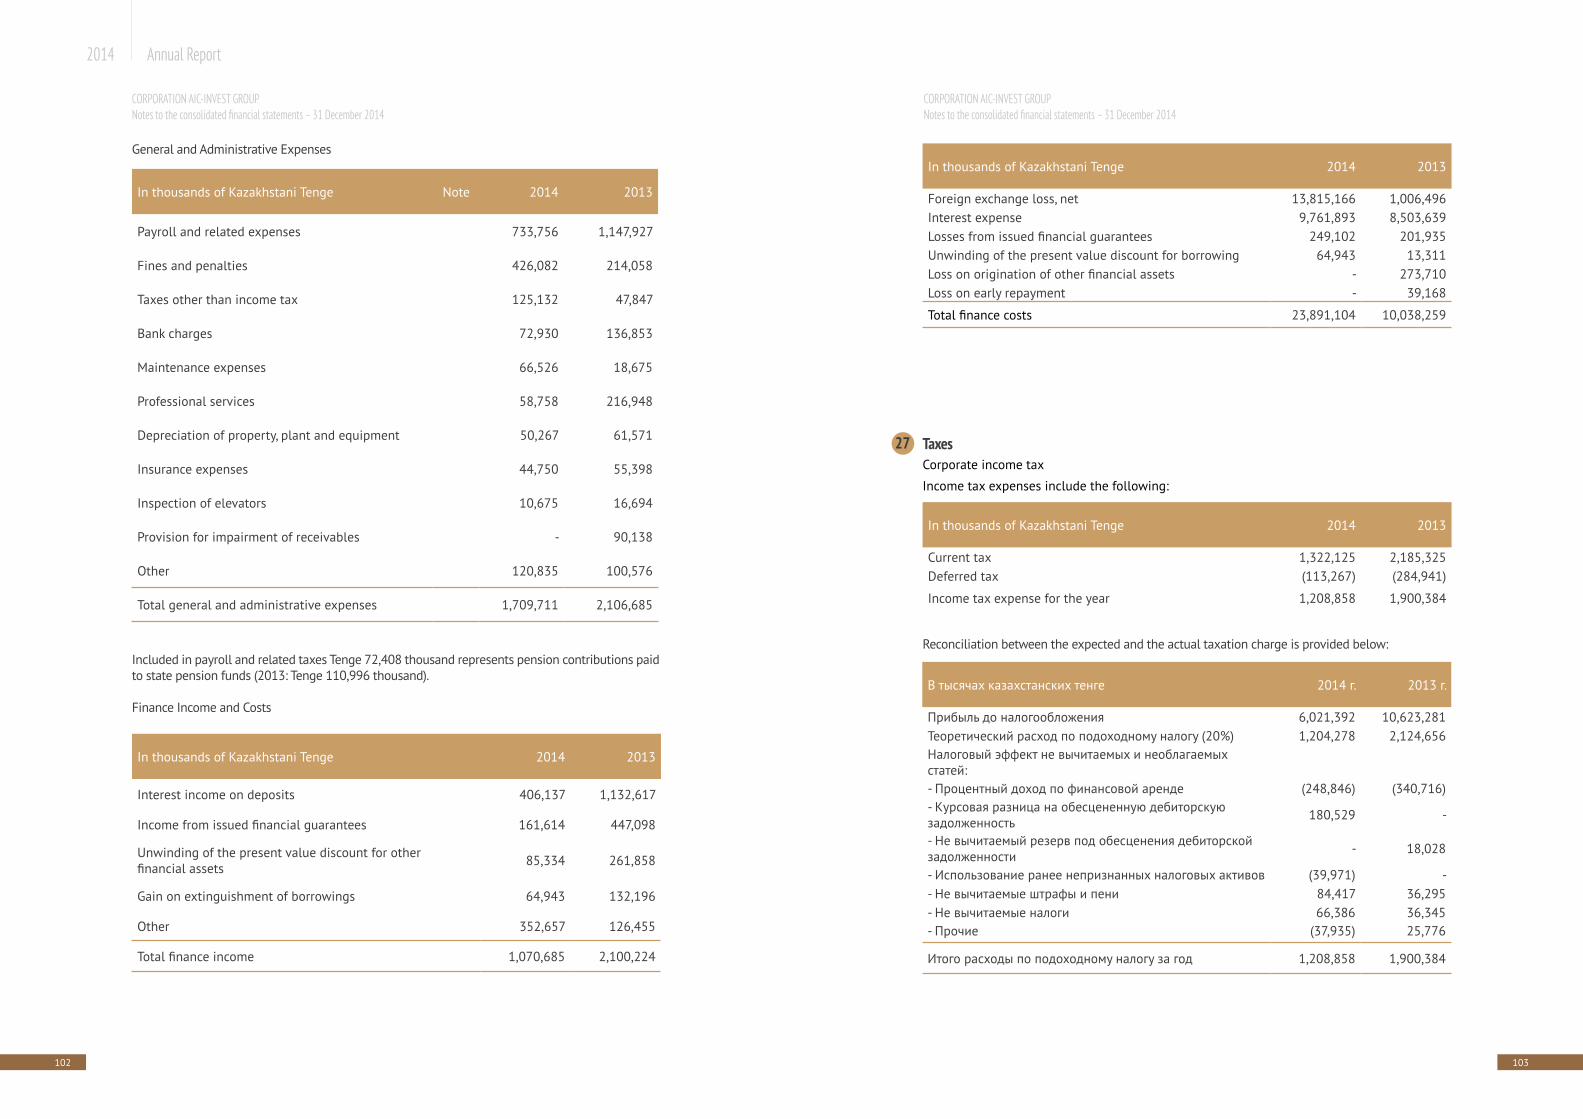
102 103
2014 Annual Report
In thousands of Kazakhstani Tenge Note 2014 2013
Payroll and related expenses 733,756 1,147,927
Fines and penalties 426,082 214,058
Taxes other than income tax 125,132 47,847
Bank charges 72,930 136,853
Maintenance expenses 66,526 18,675
Professional services 58,758 216,948
Depreciation of property, plant and equipment 50,267 61,571
Insurance expenses 44,750 55,398
Inspection of elevators 10,675 16,694
Provision for impairment of receivables - 90,138
Other 120,835 100,576
Total general and administrative expenses 1,709,711 2,106,685
In thousands of Kazakhstani Tenge 2014 2013
Interest income on deposits 406,137 1,132,617
Income from issued financial guarantees 161,614 447,098
Unwinding of the present value discount for other financial assets 85,334 261,858
Gain on extinguishment of borrowings 64,943 132,196
Other 352,657 126,455
Total finance income 1,070,685 2,100,224
General and Administrative Expenses
Included in payroll and related taxes Tenge 72,408 thousand represents pension contributions paid to state pension funds (2013: Tenge 110,996 thousand).
Finance Income and Costs
CORPORATION AIC-INVEST GROUP Notes to the consolidated financial statements – 31 December 2014
In thousands of Kazakhstani Tenge 2014 2013
Foreign exchange loss, net 13,815,166 1,006,496Interest expense 9,761,893 8,503,639Losses from issued financial guarantees 249,102 201,935Unwinding of the present value discount for borrowing 64,943 13,311Loss on origination of other financial assets - 273,710Loss on early repayment - 39,168
Total finance costs 23,891,104 10,038,259
In thousands of Kazakhstani Tenge 2014 2013
Current tax 1,322,125 2,185,325Deferred tax (113,267) (284,941)
Income tax expense for the year 1,208,858 1,900,384
В тысячах казахстанских тенге 2014 г. 2013 г.
Прибыль до налогообложения 6,021,392 10,623,281Теоретический расход по подоходному налогу (20%) 1,204,278 2,124,656Налоговый эффект не вычитаемых и необлагаемых статей:- Процентный доход по финансовой аренде (248,846) (340,716)- Курсовая разница на обесцененную дебиторскую задолженность 180,529 -
- Не вычитаемый резерв под обесценения дебиторской задолженности - 18,028
- Использование ранее непризнанных налоговых активов (39,971) -- Не вычитаемые штрафы и пени 84,417 36,295- Не вычитаемые налоги 66,386 36,345- Прочие (37,935) 25,776
Итого расходы по подоходному налогу за год 1,208,858 1,900,384
TaxesCorporate income tax
Income tax expenses include the following:
Reconciliation between the expected and the actual taxation charge is provided below:
27
CORPORATION AIC-INVEST GROUP Notes to the consolidated financial statements – 31 December 2014
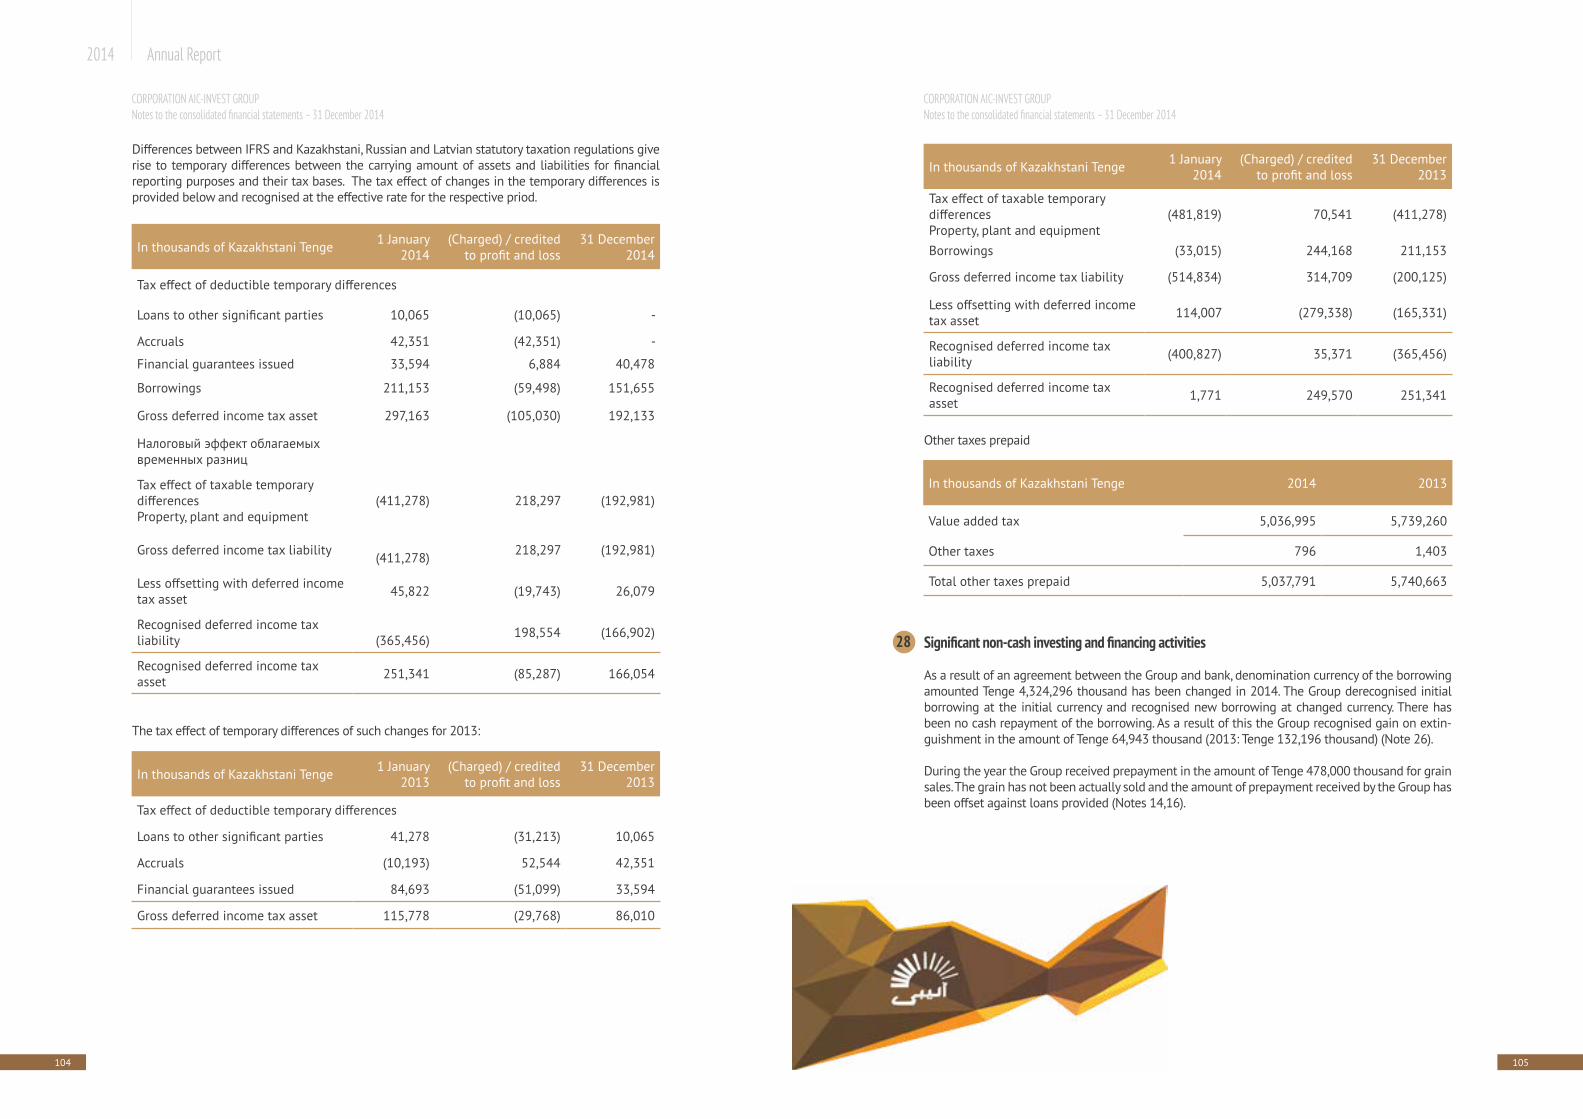
104 105
2014 Annual Report
Differences between IFRS and Kazakhstani, Russian and Latvian statutory taxation regulations give rise to temporary differences between the carrying amount of assets and liabilities for financial reporting purposes and their tax bases. The tax effect of changes in the temporary differences is provided below and recognised at the effective rate for the respective priod.
The tax effect of temporary differences of such changes for 2013:
In thousands of Kazakhstani Tenge 1 January2014
(Charged) / credited to profit and loss
31 December 2014
Tax effect of deductible temporary differences
Loans to other significant parties 10,065 (10,065) -
Accruals 42,351 (42,351) -
Financial guarantees issued 33,594 6,884 40,478
Borrowings 211,153 (59,498) 151,655
Gross deferred income tax asset 297,163 (105,030) 192,133
Налоговый эффект облагаемых временных разниц
Tax effect of taxable temporary differences Property, plant and equipment
(411,278) 218,297 (192,981)
Gross deferred income tax liability (411,278) 218,297 (192,981)
Less offsetting with deferred income tax asset 45,822 (19,743) 26,079
Recognised deferred income tax liability
(365,456) 198,554 (166,902)
Recognised deferred income tax asset 251,341 (85,287) 166,054
In thousands of Kazakhstani Tenge 1 January2013
(Charged) / credited to profit and loss
31 December 2013
Tax effect of deductible temporary differences
Loans to other significant parties 41,278 (31,213) 10,065
Accruals (10,193) 52,544 42,351
Financial guarantees issued 84,693 (51,099) 33,594
Gross deferred income tax asset 115,778 (29,768) 86,010
CORPORATION AIC-INVEST GROUP Notes to the consolidated financial statements – 31 December 2014
Significant non-cash investing and financing activities
As a result of an agreement between the Group and bank, denomination currency of the borrowing amounted Tenge 4,324,296 thousand has been changed in 2014. The Group derecognised initial borrowing at the initial currency and recognised new borrowing at changed currency. There has been no cash repayment of the borrowing. As a result of this the Group recognised gain on extin-guishment in the amount of Tenge 64,943 thousand (2013: Tenge 132,196 thousand) (Note 26).
During the year the Group received prepayment in the amount of Tenge 478,000 thousand for grain sales. The grain has not been actually sold and the amount of prepayment received by the Group has been offset against loans provided (Notes 14,16).
Other taxes prepaid
In thousands of Kazakhstani Tenge 1 January2014
(Charged) / credited to profit and loss
31 December 2013
Tax effect of taxable temporary differences Property, plant and equipment
(481,819) 70,541 (411,278)
Borrowings (33,015) 244,168 211,153
Gross deferred income tax liability (514,834) 314,709 (200,125)
Less offsetting with deferred income tax asset 114,007 (279,338) (165,331)
Recognised deferred income tax liability (400,827) 35,371 (365,456)
Recognised deferred income tax asset 1,771 249,570 251,341
In thousands of Kazakhstani Tenge 2014 2013
Value added tax 5,036,995 5,739,260
Other taxes 796 1,403
Total other taxes prepaid 5,037,791 5,740,663
CORPORATION AIC-INVEST GROUP Notes to the consolidated financial statements – 31 December 2014
28
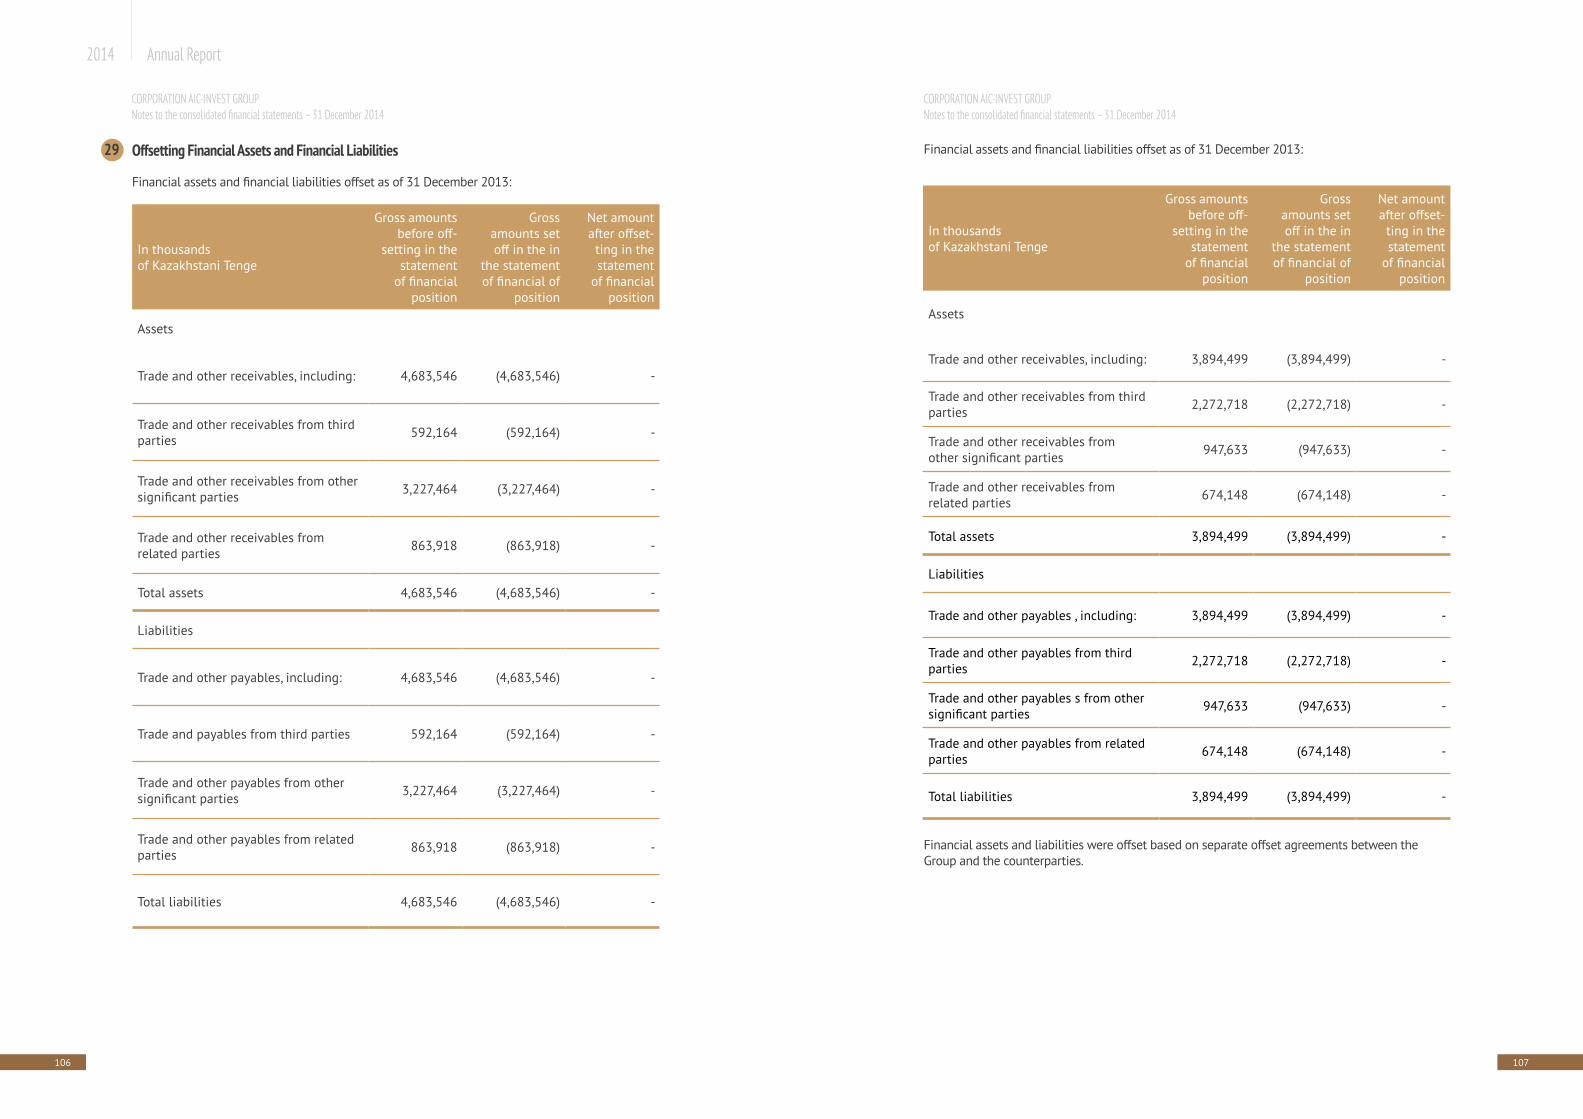
106 107
2014 Annual Report
Financial assets and financial liabilities offset as of 31 December 2013:
Offsetting Financial Assets and Financial Liabilities
In thousands of Kazakhstani Tenge
Gross amounts before off-
setting in the statement
of financial position
Gross amounts set off in the in
the statement of financial of
position
Net amount after offset-
ting in the statement
of financial position
Assets
Trade and other receivables, including: 4,683,546 (4,683,546) -
Trade and other receivables from third parties 592,164 (592,164) -
Trade and other receivables from other significant parties 3,227,464 (3,227,464) -
Trade and other receivables from related parties 863,918 (863,918) -
Total assets 4,683,546 (4,683,546) -
Liabilities
Trade and other payables, including: 4,683,546 (4,683,546) -
Trade and payables from third parties 592,164 (592,164) -
Trade and other payables from other significant parties 3,227,464 (3,227,464) -
Trade and other payables from related parties 863,918 (863,918) -
Total liabilities 4,683,546 (4,683,546) -
29
CORPORATION AIC-INVEST GROUP Notes to the consolidated financial statements – 31 December 2014
Financial assets and financial liabilities offset as of 31 December 2013:
Financial assets and liabilities were offset based on separate offset agreements between the Group and the counterparties.
In thousands of Kazakhstani Tenge
Gross amounts before off-
setting in the statement
of financial position
Gross amounts set off in the in
the statement of financial of
position
Net amount after offset-
ting in the statement
of financial position
Assets
Trade and other receivables, including: 3,894,499 (3,894,499) -
Trade and other receivables from third parties 2,272,718 (2,272,718) -
Trade and other receivables from other significant parties 947,633 (947,633) -
Trade and other receivables from related parties 674,148 (674,148) -
Total assets 3,894,499 (3,894,499) -
Liabilities
Trade and other payables , including: 3,894,499 (3,894,499) -
Trade and other payables from third parties 2,272,718 (2,272,718) -
Trade and other payables s from other significant parties 947,633 (947,633) -
Trade and other payables from related parties 674,148 (674,148) -
Total liabilities 3,894,499 (3,894,499) -
CORPORATION AIC-INVEST GROUP Notes to the consolidated financial statements – 31 December 2014
108 109
2014 Annual Report
Contingencies, Commitments and Operating RisksTax legislation. Kazakhstani, Russian and Latvian tax legislation and practice are in a state of continuous development and therefore are subject to varying interpretations and frequent changes, which may be retroactive. Further, the interpretation of tax legislation by tax author-ities as applied to the transactions and activities of the Group may not coincide with that of management. As a result, transactions may be challenged by tax authorities and the Company may be assessed additional taxes, penalties and interest. Tax periods remain open to retroac-tive review by the Kazakhstan tax authorities for five years. The Group’s management believes that its interpretation of the relevant legislation is appropriate and the Group’s tax, currency legislation and customs provisions will be sustained.
Whilst there is a risk that the tax authorities may challenge the policies, including those relat-ing to transfer pricing legislation, the management believes that they would be successful in defending their position and notes that the amount of potential claim of the tax authorities cannot be reliably estimated. Accordingly, at 31 December 2014 no provision for potential tax liabilities had been recorded in consolidated financial statements (2013: no provision recorded).
Transfer pricing. Under the Kazakhstan transfer pricing law, international business transac-tions are subject to transfer pricing control. This law prescribes the Kazakhstani companies are required to maintain and, if required, to provide the economic rationale and method of determination of prices applied in controllable transactions, including documentation sup-porting the prices and differentials. Additionally, differentials could not be applied to interna-tional business transactions with entities registered in offshore countries. In case of deviation of transaction price from market price the tax authorities have the right to adjust taxable income and to impose additional taxes, fines and interest penalties. However, specifically for transactions with agricultural produce, the law provides a 10 per cent “safe harbour” deviation from market price.
Regardless of the inherent risks that the tax authorities may question transfer pricing policy of the Company, the management of the Company believes that it will be able to sustain its position in case the transfer pricing policy of the Company is challenged by the tax authorities. Therefore, no additional tax obligations were recorded by the Company in these consolidated financial statements.
Russian transfer pricing legislation was introduced from 1999 and was amended with effect from 1 January 2012. The new transfer pricing rules appear to be more technically elaborate and, to a certain extent, better aligned with the international transfer pricing principles de-veloped by the Organisation for Economic Cooperation and Development (OECD). The new legislation provides the possibility for tax authorities to make transfer pricing adjustments and impose additional tax liabilities in respect of controlled transactions (transactions with related parties and some types of transactions with unrelated parties), provided that the trans-action price is not arm’s length.
Management believes that its pricing policy used in 2014 and preceding years is arm’s length and it has implemented internal controls to be in compliance with the new transfer pricing legislation.
Given the specifics of transfer pricing rules, impact of any challenge of the Company’s transfer prices cannot be reliably estimated, however, it may affect the financial conditions and/or the overall operations of the Group.
30
CORPORATION AIC-INVEST GROUP Notes to the consolidated financial statements – 31 December 2014
Environmental matters. The enforcement of environmental regulation in the Republic of Ka-zakhstan and the Russian Federation is evolving and the enforcement posture of government authorities of the Republic of Kazakhstan is continually being reconsidered. The Group peri-odically evaluates its obligations under environmental regulations. As obligations are deter-mined, they are recognised immediately in the consolidated financial statements. The Group’s management believes that there are no material liabilities for environmental damage.
Insurance. The Group insures its risks as follows: • Insurance of civil responsibility for causing damage to the life, health and property of the
third parties and environment; • Property insurance; • Obligatory insurance of civil responsibility of the vehicle owners; • Obligatory insurance of civil responsibility of owners of properties, operations of which can
cause damage to third parties; and• Obligatory environmental insurance.
Legal proceedings. During the ordinary operations, claims against the Group may be received. The management believes that the Group does not have any current outstanding litigation or other claims the outcome of which will have significant adverse effect on the financial posi-tion of the Group.
Capital commitments. At 31 December 2014 the Group has a contractual commitment for purchase of property, plant in the amount of Tenge 4,561,484 thousand (2013: nil).As at 31 December 2014 the Group has concluded a contract for a total amount of Tenge 90,000,000 thousand with one of the Group’s owners Holding Alibi LLP, Tenge 65,991,700 thousand of which was given as an advance as at 31 December 2014.
Assets pledged and restricted. At 31 December 2014 and at 31 December 2013 the Group has the following assets pledged as collateral:
CORPORATION AIC-INVEST GROUP Notes to the consolidated financial statements – 31 December 2014
110 111
2014 Annual Report
Assets pledged and restricted. At 31 December 2014 and at 31 December 2013 the Group has the following assets pledged as collateral:
In 2014 restricted deposits in the amount of Tenge 10,000 thousand include security depos-its in JSC “Tsesnabank” with an interest rate of 7% per annum. Deposits were collateralised following credit line at the bank. In 2013, the Group’s cash deposits were placed as collateral following of related and other significant parties (Note 16).
100% shares of the Ventspils Grain Terminal JSC are pledged under borrowing obtained from Sberbank Kazakhstan in the amount of Tenge 4,655,001 thousand. The shares were pledged in 2011, when the Group acquired the subsidiary – Ventspils Grain Terminal JSC and the bor-rowing was obtained.
Borrowings in the amount of Tenge 4,655,001 thousand were secured by cash flows from fu-ture grain export for the total amount of Tenge 1,480,000 thousand.
Compliance with covenants. The Group is subject to certain covenants related primarily to its borrowings. Non-compliance with such covenants may result in negative consequences for the Group. As of 31 December 2014 the Group breached certain financial covenants with respect to long-term borrowings from Development Bank of Kazakhstan. As a result, long term borrow-ings in the amount of Tenge 7,434,775 thousand (2013: Tenge 13,513,830 thousand) were reclassified to short-term liabilities (Note 19).
Events after the reporting periodGroup registered a new subsidiary LLP “MEZ-SKO” on February 13, 2015. Subsidiary will be engaged in the production of refined oils and fats.
Group received short-term borrowing in the amount of Tenge 2,413,450 thousand from JSC «Bank RBK» in March - April 2015 and the borrowing from JSC “Tsesnabank” in the amount of Tenge 11,143,500 thousand in April 2015.
2014 2013
In thousands of Kazakhstani Tenge Note
Asset pledged
Related liability
Asset pledged
Related liability
Property plant and equipment 12 2,489,301 751,271 5,199,672 7,446,323
Inventory 13 3,600,895 3,613,444 7,727,623 8,448,550
Total 6,090,196 4,364,715 12,927,295 15,894,873
CORPORATION AIC-INVEST GROUP Notes to the consolidated financial statements – 31 December 2014
GLOSSARY
EBITDAEarnings before interest, taxes, depreciation and amortization.
PanamaxType of container ships, as well as tankers and other ships that are within the size limits for ships traveling through the Panama Canal, with dimensions being as follows: 305 meters long, 33.5 meters wide and 26 meters deep
ROAROA is determined by dividing net income for a certain period by total average assets
ROE ROE is determined by dividing net income for a certain period by shareholders’ capital
ROSReturn on Sales is a profitability indicator providing insight into how much profit is being produced per Tenge of sales determined by dividing net income by sales
АРЕAzov Port Elevator
VGTVentspils Grain Terminal
yr.Year
haHectare
Herbicides Chemicals used for weed control
EUEuropean Union
Debt-to-capital ratioThe ratio of equity to liabilities
Adequate capital ratioThe ratio of equity to assets
CITCorporate income tax
myAgricultural marketing year. Wheat marketing year begins on June 1 and ends on May
112 113
2014 Annual Report
mlnMillion
blnBillion
NINNational Identification Number
UAEUnited Arab Emirates
Payables turnover periodShows the extension or reduction of commercial credit provided to the company: Revenue / Average annual amount of payables
Receivables turnover periodShows the turnover rate of receivables: Revenue / Average annual amount of receivables
Assets turnover periodShows the turnover rate of the entire capital of the company: Revenue / Average annual value of assets
RKThe Republic of Kazakhstan
AgrAgriculture
CISThe Commonwealth of Independent States
USAThe United States of America
ths. Thousand
Partnership (Company, Corporation) APK-Invest Corporation LLP
MemberMember of APK-Invest Corporation Limited Liability Partnership
Lease Finance A type of lease, where the lessor will purchase an asset and lease that asset to a lessee for the term approaching the duration of the asset’s service life, with amortization of the entire or the greater part of the asset’s value.
CONTACT INFORMATION
APK-Invest Corporation LLPAddress: Astana, Almaty District, 4/3 Otyrar St., Office 15
Tel.: +7 (7172) 10/21/62-10-62, +7 (7172) 10/21/41-10-41Fax: +7 (7172) 21-11-47
Auditor: PricewaterhouseCoopers LLPAddress: 050040, Republic of Kazakhstan, Almaty, 29/6 Satpayev Ave., Hyatt Regency Hotel, Office Tower, floor 4
Tel.: (7272) 980448; Fax: (7272) 980252
Registrar: Integrated Securities Registrar JSC Address: 050000, Republic of Kazakhstan, Almaty, 141 Ablai Khan Ave., corner of Kurmangazy St.
Tel.: +7 (727) 272-69-40, 272-69-90Fax: +7 (727) 272-69-40