Embed Size (px)
Citation preview

77MORE ANALYSTS, BETTER RATINGS
Journal of Applied Economics, Vol. VII, No. I (May 2004), 77-98
MORE ANALYSTS, BETTER RATINGS:DO RATING AGENCIES INVEST ENOUGH
IN LESS DEVELOPED COUNTRIES?
GIOVANNI FERRI *
University of Bari
Submitted November 2002; accepted December 2003
Rating agencies’ track record is good in developed countries but poor in emergingeconomies. Why? Given the almost-monopolistic structure of the industry, we conjecturethat agencies might underinvest in information gathering. We propose an indicatorquantifying the agencies’ effort to gather information and assess whether greater effortaffects rating levels. We detect: (i) absolute underinvestment for non-OECD sovereigns(less effort in spite of greater opaqueness); (ii) relative underinvestment for non-OECDfirms compared with OECD ones (though the former receive a larger effort, more intenseeffort boosts firm ratings in non-OECD countries while depressing them in OECD countries).
JEL classification codes: G2, G3
Key words: sovereign risk, credit ratings, rating agencies’ effort
I. Introduction
Rating agencies are a very important ingredient of world financial markets.
Their role has rapidly expanded with globalization (Sylla, 2002) and is
receiving a powerful boost from regulators, e.g. in the ongoing revision of
the Basel minimum capital requirements for banks (Basel Committee on
Banking Supervision, 2001). Rating agencies’ mission is to collect and process
* Ferri: Department of Economics, University of Bari, Via C. Rosalba 53, 70124 Bari,Italy; fax +39-080-5049149; email [email protected]. Without involving them in anyremaining error, I would like to thank Giuseppe De Arcangelis, Marcello de Cecco, PatrickHonohan, Li-Gang Liu and Giovanni Majnoni for helpful discussion. I am also very gratefulto Alvaro Forteza and two anonymous referees for providing key insight. Vincenzo D’Apiceprovided valuable research assistance. Daniel Dicther contributed to streamline my prose.

78 JOURNAL OF APPLIED ECONOMICS
information on sovereign and private entities around the world so as to assign
them an individual rating. The rating, representing the estimated probability
that the borrower will be able to meet its financial obligations, is valuable to
investors as a corrective for the disadvantages of informational asymmetry
vis-à-vis borrowers.
Rating agencies have a very good track record in anticipating borrowers’
default in the developed countries where they have long been active, most
notably the USA (Ederington, Yawitz and Roberts, 1987). On the other hand,
in recent years they have been severely reproached for their poor performance
in connection with major financial crises, such as the Mexican and Asian
crises. Many hold that rating agencies’ downgrades of Asian crisis countries
were late and also disproportionate with respect to these countries’ economic
fundamentals (Ferri, Liu and Stiglitz, 1999; International Monetary Fund,
1999; Monfort and Mulder, 2000). Others observe, more generally, that in
evaluating private entities from less developed countries rating agencies rely
excessively on sovereign ratings and attribute too little weight to individual
firms’ performance (Bongini, Laeven and Majnoni, 2001; Ferri, Liu and
Majnoni, 2001; Ferri and Liu, 2003).
What is the source of this inadequate rating behavior in less developed
countries? We answer this question by taking an industrial organization
approach. We start out observing that the rating industry is highly concentrated,
with just three global players (Moody’s, Standard & Poor and Fitch). This
almost monopolistic market structure (White, 2002) raises two potential issues:
rent extraction and underinvestment. Focusing on the latter issue, we propose
a synthetic indicator of the effort made by the agency to collect and process
information about each rated entity. Then, referring to Moody’s, we empirically
assess whether more intense effort affects rating levels.1
Comparing countries belonging to the Organization for Economic
Cooperation and Development (OECD) with non-OECD countries, we find:
(i) absolute underinvestment for non-OECD sovereigns, where agencies’ effort
is lower in the latter countries than for OECD sovereigns, and (ii) relative
1 While a more complete assessment should include Standard & Poor and Fitch, the dataneeded to test this problem according to our methodology were publicly available only forMoody’s. This is a limitation of our study that has to be acknowledged upfront.

79MORE ANALYSTS, BETTER RATINGS
underinvestment for non-OECD versus OECD firms, where the former receive
a larger effort than the latter, but more intense effort significantly boosts firm
ratings for the former while depressing them for the latter.
The rest of the paper is organized as follows. Section II expands on the
perils of rating agencies’ underinvestment in collecting and processing
information on issuers from less developed countries (LDCs). In section III
we propose our indicator of the agencies’ effort to assign individual ratings
and present some descriptive evidence. Our econometric results are reported
in section IV. Section V discusses the policy implications of the main findings.
II. Why Underinvestment in Rating Matters
In view of the substantial extent to which investors’ decisions rely on
ratings, any issuer approaching international financial markets de facto needs
to obtain a rating. Investors look to ratings to help overcome their asymmetry
of information vis-à-vis issuers. The attention they pay to ratings is now being
reinforced by regulatory developments, assigning a central role to rating
agencies’ verdicts on issuers (e.g. Basel Committee on Banking Supervision,
2001).
In theory, a reputation mechanism should induce rating agencies to make
the socially optimal level of investment in collecting and processing
information on issuers, since they put their reputation at risk any time they
underinvest and thus do not carry out their business properly.2 In practice,
however, the highly concentrated market structure of the rating industry may
hinder the smooth functioning of such reputation mechanism. Not only does
the industry count only three global players, Moody’s, Standard & Poor and
Fitch, but the agencies tend to move their ratings together (Cantor and Packer,
1997). This almost monopolistic industry structure raises at least two problems.
First, rating agencies may be able to extract rent from issuers (the party
paying for the rating). Evidence on this is reported by White (2002),
2 It is worth stressing that in this paper we disregard the possibility that ratings are distortedby conflicts of interest. A referee pointed out the possible parallel with what happens in theareas of auditing and investment banking: rating agencies, being paid by the issuers andnot by investors, might be tempted to overstate the issuers’ quality.

80 JOURNAL OF APPLIED ECONOMICS
documenting the high returns of the rating agencies. However, in our view,though rent extraction raises a distributive issue, it does not per se implyinefficiency.
Second, thanks to their market power, rating agencies may indulge inunderinvestment. This problem is more serious than the first because theinformation content of the ratings might be less than socially optimal. Thiswould engender inefficiency, since investors would either have to supplementrating agencies’ work or renounce holding some assets.
In view of this argument, it seems essential to check whether rating agenciesdo in fact underinvest in collecting and processing information on issuers.This problem is even more acute for issuers in LDCs. To be sure, the lowerquality of information released by (potential) issuers in LDCs likely intensifiesthe extent of informational asymmetries faced by investors (largely fromdeveloped countries). As a result, there may be large negative consequencesin terms of increased cost or diminished availability of funds for borrowerslocated in LDCs.
Far from discarding the underinvestment hypothesis, various recentevidence suggests that rating agencies may not be investing enough in LDCs.Nickell, Perraudin and Varotto (2000) show that issuers suffer a domicileeffect—i.e. their ratings are constrained because of the level of the ratingobtained by their sovereigns—and that this poses greater problems in LDCs.Ferri, Liu and Majnoni (2001) find that firm ratings are downgraded inconnection with sovereign downgrades in non-OECD countries, while thesame does not hold in OECD countries. Ferri and Liu (2003) show that:(i) individual firms’ idiosyncratic risks (as proxied by the performanceindicators reportedly used by rating agencies) play an immeasurably largerrole for OECD firms than for non-OECD ones, while sovereign ratings aremuch more important for the latter than for the former; (ii) cross-countryindicators of information/institutional quality help explain this unsatisfactorysituation in LDCs but do not solve the puzzle entirely.
But how can we tell whether rating agencies are underinvesting? In the
next section we propose a measure to quantify the agency’s effort.
III. Rating Agencies’ Effort to Assign Individual Ratings
Our methodology—to proxy the effort made by the agency in collecting

81MORE ANALYSTS, BETTER RATINGS
and processing information used to assign the rating to any issuer—relies on
the units of analysts (UNIANA) allocated to that issuer.3
In practice, we use data from Moody’s on-line archive www.moodys.com
(consulted between January and May 2001) and calculate UNIANA as
follows. For any rating issued by Moody’s, beside the level of the rating the
archive also reports the names of up to two analysts—the chief analyst and
the backup analyst, if any—responsible for the rating. We then account for
the fact that the same analyst is typically responsible for more than one rating.
Thus, the average effort (time) each analyst allocates to the ratings he is in
charge of is a decreasing function of the number of ratings he handles. Then,
to quantify such average effort we have to count how many firms (not
sovereigns, since as a rule analysts engaged on sovereign ratings are not
employed in firm ratings and vice versa) that analyst is engaged with.
Assuming that each analyst j distributes his effort uniformly over the nj firms
(sovereigns) handled and considering that more than one analyst may be in
charge of firm (sovereign) i, we calculate the total analyst effort made by
Moody’s for any firm (sovereign) i as:
(1)
where mi = 1, 2 is the total number of analysts in charge of firm (sovereign) i
and nij is the total number of firms (sovereigns) to which analyst j assigns a
rating, including the rating of firm (sovereign) i.4
In our sample of sovereign issuers, UNIANA varies from a minimum of
0.037 (i.e. the sovereign obtains its rating from only one analyst in charge of
3 While the indicator for sovereigns is calculated for all available countries, the equivalentindicator for non-bank firms will be computed for countries other than the USA. Thischoice stems from two motives. First, ratings are disproportionately more widespread inthe USA than elsewhere. In addition, within rating agencies, analysis of US firms is largelysegregated from that of the rest of the world and, accordingly, the analysts engaged in onesector are normally not employed in the other.
4 Our measure can only be a proxy of Moody’s effort; analysts differ in terms of theirability and/or experience, but we cannot measure this on the basis of the information availableon Moody’s web site. Unfortunately, this is a limitation of our data that we could notovercome.
1
(1/ )im
ii j
j
UNIANA n=
= ∑

82 JOURNAL OF APPLIED ECONOMICS
27 sovereign ratings, or from two analysts each responsible for 54 sovereign
ratings, or from any equivalent combination) to a maximum of 0.133 (i.e. the
sovereign obtains its rating from only one analyst in charge of 7.5 sovereign
ratings, or from two analysts each responsible for 15 sovereign ratings). Mean
and median values of UNIANA for sovereigns are, respectively, 0.084 (12
ratings per analyst) and 0.087 (11.5 ratings per analyst).
In our sample of non-financial firms’ ratings, UNIANA varies from a
minimum of 0.001 (i.e. the firm receives its rating from an analyst who is
involved in some 500 firm ratings) to a maximum of 2 (the firm receives its
rating from two analysts who rate that firm only). Mean and median values of
UNIANA for firms are, respectively, 0.077 (13 ratings per analyst) and 0.042
(23.8 ratings per analyst).
Our basic conjecture is that the higher is UNIANAi (UNIANA
k), the larger
is the investment made by Moody’s to gather and process information on
firm i (on sovereign k), so that UNIANAi (UNIANA
k) provides a rough and
ready gauge of the informational value added Moody’s creates for firm i (for
sovereign k) compared with what was previously known about it by the public.
Naturally, UNIANAi (UNIANA
k) is only a proxy. Analysts of course may
differ in ability and experience, but it is impossible for us to capture these
differences on the basis of the information available on Moody’s web site.
Thus, we can only hope that these differences in skill do not cause a systematic
bias in our data.
An important issue for our analysis is whether there are systematic
differences between the rating effort for firms and sovereigns from developed
countries (for convenience, identified as the group of OECD countries) and
that for firms and sovereigns from developing countries (for convenience,
identified as the group of non-OECD countries). The issue stems primarily
from our expectation that the availability and quality of information will be
better in OECD countries than in non-OECD countries. For example, La Porta,
Lopez-de-Silanes, Shleifer and Vishny (1998) highlight the substantial
differences across countries in terms of their ability to: (i) ensure the provision
of high-quality information to the public (accounting standards); (ii) enforce
existing legislation (rule of law); (iii) safeguard creditors’ rights. La Porta et
al. also document that financial markets are less well developed in countries
that are poor performers on the previous ladder.
83MORE ANALYSTS, BETTER RATINGS
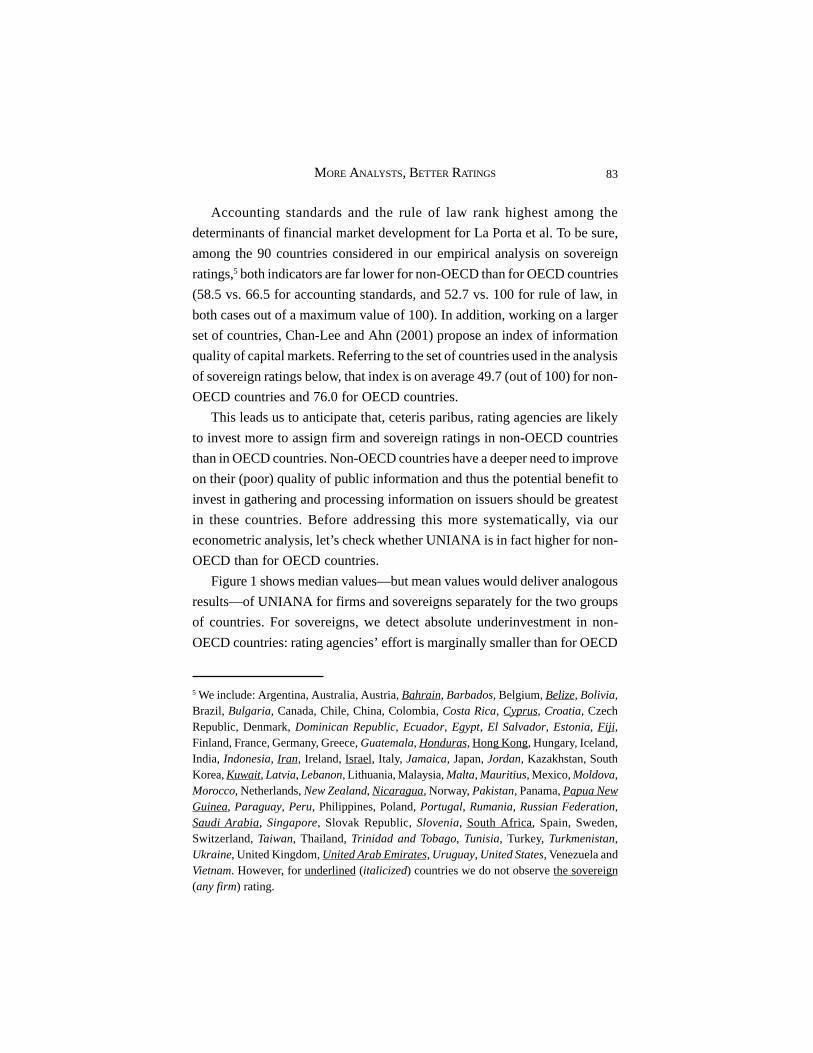
Accounting standards and the rule of law rank highest among the
determinants of financial market development for La Porta et al. To be sure,
among the 90 countries considered in our empirical analysis on sovereign
ratings,5 both indicators are far lower for non-OECD than for OECD countries
(58.5 vs. 66.5 for accounting standards, and 52.7 vs. 100 for rule of law, in
both cases out of a maximum value of 100). In addition, working on a larger
set of countries, Chan-Lee and Ahn (2001) propose an index of information
quality of capital markets. Referring to the set of countries used in the analysis
of sovereign ratings below, that index is on average 49.7 (out of 100) for non-
OECD countries and 76.0 for OECD countries.
This leads us to anticipate that, ceteris paribus, rating agencies are likely
to invest more to assign firm and sovereign ratings in non-OECD countries
than in OECD countries. Non-OECD countries have a deeper need to improve
on their (poor) quality of public information and thus the potential benefit to
invest in gathering and processing information on issuers should be greatest
in these countries. Before addressing this more systematically, via our
econometric analysis, let’s check whether UNIANA is in fact higher for non-
OECD than for OECD countries.
Figure 1 shows median values—but mean values would deliver analogous
results—of UNIANA for firms and sovereigns separately for the two groups
of countries. For sovereigns, we detect absolute underinvestment in non-
OECD countries: rating agencies’ effort is marginally smaller than for OECD
5 We include: Argentina, Australia, Austria, Bahrain, Barbados, Belgium, Belize, Bolivia,Brazil, Bulgaria, Canada, Chile, China, Colombia, Costa Rica, Cyprus, Croatia, CzechRepublic, Denmark, Dominican Republic, Ecuador, Egypt, El Salvador, Estonia, Fiji ,Finland, France, Germany, Greece, Guatemala, Honduras, Hong Kong, Hungary, Iceland,India, Indonesia, Iran, Ireland, Israel, Italy, Jamaica, Japan, Jordan, Kazakhstan, SouthKorea, Kuwait, Latvia, Lebanon, Lithuania, Malaysia, Malta, Mauritius, Mexico, Moldova,Morocco, Netherlands, New Zealand, Nicaragua, Norway, Pakistan, Panama, Papua NewGuinea, Paraguay, Peru, Philippines, Poland, Portugal, Rumania, Russian Federation,Saudi Arabia, Singapore, Slovak Republic, Slovenia, South Africa, Spain, Sweden,Switzerland, Taiwan, Thailand, Trinidad and Tobago, Tunisia, Turkey, Turkmenistan,Ukraine, United Kingdom, United Arab Emirates, Uruguay, United States, Venezuela andVietnam. However, for underlined (italicized) countries we do not observe the sovereign(any firm) rating.

84 JOURNAL OF APPLIED ECONOMICS
countries. This is at odds with the observation that information quality is
lower for non-OECD countries. By contrast, for firm ratings the data confirm
our hypothesis that the rating effort is likely to be larger in non-OECD
countries; the median value of UNIANA is 0.071 for non-OECD countries,
versus 0.033 for OECD countries. Naturally, even though the latter evidence
goes in the expected direction, it does not automatically guarantee that rating
agencies invest enough in evaluating firms from non-OECD countries.
Figure 1. Units of Analysts for Firms and Sovereigns (Median)
0,0936
0,087
0,033
0,071
0 0,01 0,02 0,03 0,04 0,05 0,06 0,07 0,08 0,09 0,1
Sovereigns
Firms
OECD Countries Non-OECD Countries
Figure 2 reports the distribution of the effort variable separately for firms
and sovereigns and also distinguishes between OECD and non-OECD
countries. It is worth noting that the effort is systematically higher—and not
just higher at the median—for OECD sovereigns, while the opposite holds
for firms. Furthermore, as might be expected, Moody’s spends less analyst
effort to rate firms than to rate sovereigns.
Lastly, let’s take a glimpse at median firm and sovereign ratings for the two
groups of countries. To do this, we convert alphanumeric ratings into numeric

85MORE ANALYSTS, BETTER RATINGS
Figure 2. Distribution of Effort by Moody’s to Rate Firms andSovereigns: OECD vs. non-OECD Countries
(Firms are on Left-hand Sale: Sovereigns are on Right-hand Sale)
0
0,2
0,4
0,6
0,8
1
1,2
1,4
1,6
1,8
2
Mi i 0 01 0 05 0 1 0 25 0 5 0 75 0 9 0 95 0 99 M i0
0,02
0,04
0,06
0,08
0,1
0,12
0,14
6 In Moody’s scale: Aaa = 100; Aa1 = 95; Aa2 = 90; Aa3 = 85; A1 = 80; A2 = 75; A3 = 70;Baa1 = 65; Baa2 = 60; Baa3 = 55; Ba1 = 50; Ba2 = 45; Ba3 = 40; B1 = 35; B2 = 30; B3 =25; Caa1 = 20; Caa2 = 15; Caa3 = 10; Caa = 5; C = 0.
non-OECD firms OECD firms non-OECD sovereigns OECD sovereigns
values on the scale 0-100.6 As expected, both sovereign and firm ratings are
far lower in non-OECD than in OECD countries. Median ratings—but the
landscape would be the same for mean values—differ more for sovereigns (52.5
against 96.25) than for firms (45 against 65). This evidence suggests there may
be a sample selection bias, according to which in non-OECD countries only
the best firms request a rating, whereas such requests are much more common
for firms in non-OECD countries (even excluding the USA).
Although this descriptive evidence is suggestive, it does not offer decisive
support in testing our hypothesis. It is now time to go for a deeper analysis,
by means of multivariate econometric analysis.

86 JOURNAL OF APPLIED ECONOMICS
7 All of the following regressions are OLS. Where appropriate, as pointed out by the valueof the Cook-Weisberg test, we used the White correction for heteroscedasticity.
8 In the sovereign regressions we also include the USA.
IV. Econometric Results
We analyze sovereign and firm ratings separately.7 Regarding sovereign
ratings, we estimate an equation exploring the determinants of the ratings as
a function of other variables and of UNIANAk. For non-financial firms, we
estimate an equation of the determinants of the ratings as a function of other
variables and of UNIANAi.
A. Sovereign Ratings
The first equation we estimate for sovereign ratings is the following:
(2)
where, for country k, RATk is its sovereign rating, luni
k is the logarithm of
UNIANAk, lppc
k is the logarithm of GDP per capita, lgdp
k is the logarithm of
GDP (in billions of current US$), lpopk is the logarithm of the population (in
millions of inhabitants), ldistk is the logarithm of the distance of the country
(in kilometers) from the USA, where rating agencies have their headquarters,
oecdk is a 0-1 dummy variable taking value 1 for industrialized countries
traditionally belonging to the OECD (i.e., Australia, Austria, Belgium, Canada,
Denmark, Finland, France, Germany, Greece, Iceland, Ireland, Italy, Japan,
Netherlands, New Zealand, Norway, Portugal, Spain, Sweden, Switzerland,
United Kingdom, USA) and linfk is the logarithm of the information quality
indicator proposed by Chan-Lee and Ahn (2001).8
This specification is motivated as follows. First, we expect that the country’s
sovereign ratings should reflect its economic fundamentals (Cantor and Packer,
1996). Thus, the rating should be higher for countries with larger lppc. Second,
the size of the country might affect the rating: this is captured here by lgdp
0 1 2 3 4RAT lgk k k k kluni lppc dp lpopβ β β β β= + + + +
5 6 7k k k kldist oecd lβ β β ε+ + + +inf

87MORE ANALYSTS, BETTER RATINGS
and lpop. Third, we presume that ldist may have a negative impact, since it
might raise the rating agencies’ transaction costs.9 Fourth, we expect that
ratings may be higher for OECD—industrialized—countries (oecd = 1) and
for countries with better information quality (higher linf).10 Fifth, and most
importantly here, our expectation is that as the effort by the rating agency
(i.e. luni) increases, the asymmetry of information will decrease and the rating
should thus be higher on average. Finally, all independent variables—save
the oecd dummy—are expressed in logarithms to allow: (i) for possible
nonlinear relationships, and (ii) easy reading of the coefficient as elasticities.
The basic descriptive statistics for these variables are presented in Table 1.
Once more, we can appreciate the major difference in sovereign rating levels
between OECD and non-OECD countries. Ratings show ample variability, as
do country size variables, distance and GDP per capita. Information quality
(accounting) standards vary from a minimum of 21.1 (24.0) to the maximum
of 100.0 (83.0). OECD countries account for 24% of our sample. On average
(and on median), more effort is made for OECD sovereign ratings than for non-
OECD ones.
Results obtained from estimating equation (2) are reported in Table 2.
We proceed from the most general specification to the preferred one, obtained
by eliminating those regressors that turn out to be statistically insignificant.
We report results for four different specifications. Specification (i) introduces
luni together with the other explanatory variables, omitting, however, the
institutional regressors oecd, linf and accounting, where the last two variables
would imply losing several observations. Specification (ii) considers all the
explanatory variables, omitting, however, accounting, which is alternative
to linf , thus losing 30 observations. Specification (iii) runs preferred
specification (i) on the sub-sample of 46 countries for which linf is available.
9 We also tried, without success, to include englk, a 0-1 variable taking value 1 for English-
speaking countries and 0 for the others, presuming that it could reduce the transactioncosts for determining the rating.
10 As an alternative to linf, we also considered accounting, the logarithm of ACCOUNTING,as proposed by La Porta et al. (1998), even though the former is preferable as it coversmore countries.

88 JOURNAL OF APPLIED ECONOMICS
Table 1. Descriptive Statistics: Sovereign Ratings
Variables Mean Median Min. Max. Source
RAT 62.2 57.5 5 100 Moody’s
- OECD 95.2 96.3 75 100
- non-OECD 48.8 51.3 5 97.5
UNIANA 0.084 0.087 0.037 0.133 Moody’s
- OECD 0.096 0.094 0.067 0.133
- non-OECD 0.080 0.087 0.037 0.117
ACCOUNTING 61.4 63 24 83 La Porta et al.
- OECD 67.2 66.5 54 83 (1998)
- non-OECD 55.6 58.5 24 78
INF 60.7 62.7 21.1 100 Chan-Lee and
- OECD 75.9 79.3 50.4 100 Ahn (2001)
- non-OECD 49.7 49.8 21.1 91.7
POP 53.6 9.2 0.2 1,200 IMF
GDP 322.8 56.9 0.7 8,700 IMF
GDP per capita 9228.8 3830 370 38,350 IMF
DIST 7,900 7,262 0 16,165 World Atlas
oecd 0.24 0 0 1 OECD
Specification (iv) is obtained by replacing linf with accounting, thus losing
9 additional observations.
Focusing our comment on the preferred specifications, all reach a high
explanatory power, as highlighted by the R2. In addition, it is confirmed that
sovereign ratings are positively related with lppc, while their correlation with
the size of the country is generally insignificant. As to the institutional
explanatory variables, accounting is not significant (specification iv) but both
oecd and linf strongly correlate with higher ratings.
The effort variable that is most interesting here (luni) has a positive sign.
However, it is significant only in specification (i), where we omit institutional
variables and refer to the full sample of 76 countries. To check whether the
significance of luni is driven by the omission of the institutional variables or
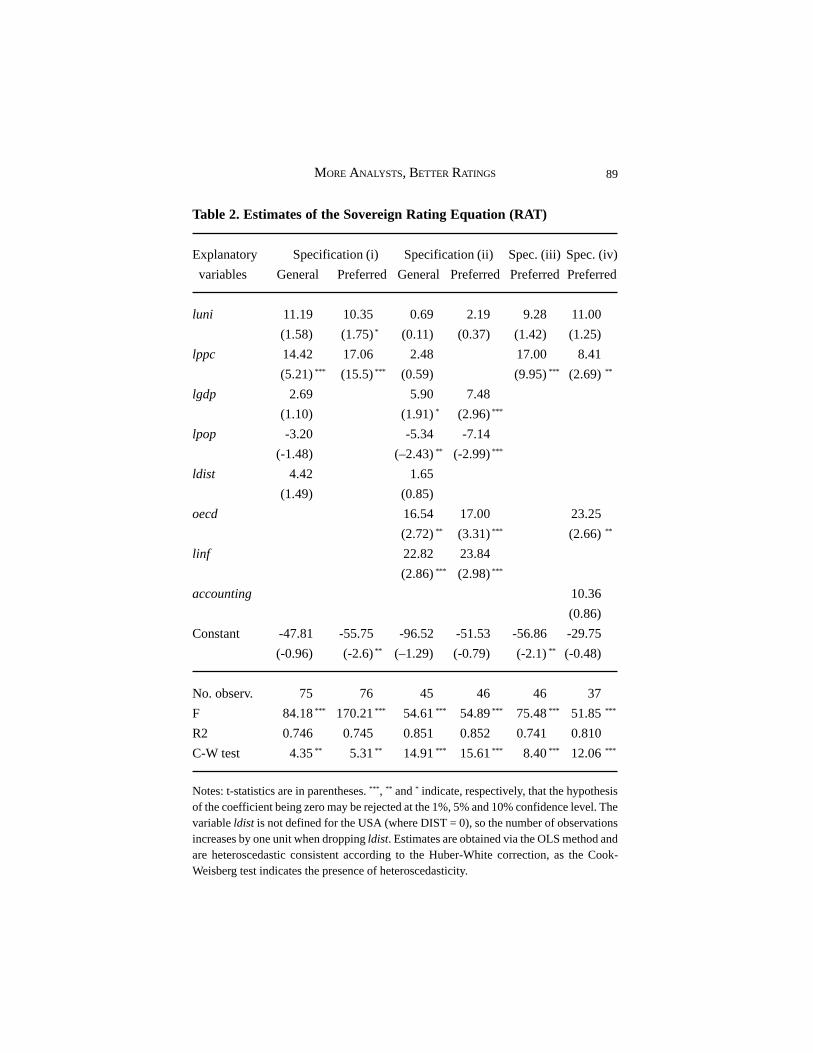
89MORE ANALYSTS, BETTER RATINGS
Table 2. Estimates of the Sovereign Rating Equation (RAT)
Explanatory Specification (i) Specification (ii) Spec. (iii) Spec. (iv)
variables General Preferred General Preferred Preferred Preferred
luni 11.19 10.35 0.69 2.19 9.28 11.00
(1.58) (1.75)* (0.11) (0.37) (1.42) (1.25)
lppc 14.42 17.06 2.48 17.00 8.41
(5.21)*** (15.5)*** (0.59) (9.95)*** (2.69)**
lgdp 2.69 5.90 7.48
(1.10) (1.91)* (2.96)***
lpop -3.20 -5.34 -7.14
(-1.48) (–2.43)** (-2.99)***
ldist 4.42 1.65
(1.49) (0.85)
oecd 16.54 17.00 23.25
(2.72)** (3.31)*** (2.66)**
linf 22.82 23.84
(2.86)*** (2.98)***
accounting 10.36
(0.86)
Constant -47.81 -55.75 -96.52 -51.53 -56.86 -29.75
(-0.96) (-2.6)** (–1.29) (-0.79) (-2.1)** (-0.48)
No. observ. 75 76 45 46 46 37
F 84.18*** 170.21*** 54.61*** 54.89*** 75.48*** 51.85***
R2 0.746 0.745 0.851 0.852 0.741 0.810
C-W test 4.35** 5.31** 14.91*** 15.61*** 8.40*** 12.06***
Notes: t-statistics are in parentheses. *** , ** and * indicate, respectively, that the hypothesisof the coefficient being zero may be rejected at the 1%, 5% and 10% confidence level. Thevariable ldist is not defined for the USA (where DIST = 0), so the number of observationsincreases by one unit when dropping ldist. Estimates are obtained via the OLS method andare heteroscedastic consistent according to the Huber-White correction, as the Cook-Weisberg test indicates the presence of heteroscedasticity.

90 JOURNAL OF APPLIED ECONOMICS
by the different sample, in specification (iii) we re-run specification (i) on the
smaller sample of 46 countries for which we observe linf. Here luni is
insignificant. Thus, losing observations on so many countries is sufficient to
dismiss the effort variable and specifications (i) and (ii) are not really
comparable. All in all, we may conclude that there is at least some evidence
of a positive association between luni and sovereign ratings, indicating that,
ceteris paribus, the sovereign rating increases when the rating agency allocates
to that sovereign more units of analysts.
Thus, our results suggest that higher investment to gather and process
information on sovereign issuers may raise their ratings. As we have seen,
such investment is lower in non-OECD than in OECD countries. We can
therefore conclude that LDCs may be somewhat damaged by rating agencies’
underinvestment.
B. Non-bank Firm Ratings
In line with what we have done for sovereign ratings, we estimate a rating
determination equation for non-bank firm ratings. The equation we estimate
for firm ratings is:
The dependent variable (FRATi) is the individual rating of the firm, and
is regressed on: the contemporaneous sovereign rating in the country where
the firm is incorporated (RATi); the number of units of analysts engaged in
the rating of the firm (unii, the value of UNIANA
i, as described in formula
(1), but rescaled over 0-100), a 0-1 dummy variable identifying firms
domiciled in non-OECD countries (noecdi, taking value 1 if firm i does not
belong to OECD countries); the information quality indicator for the country
the firm is domiciled in (INFi); an interaction variable norat
i, obtained
multiplying RATi by noecd
i; an interaction variable nouni
i, obtained
multiplying unii by noecd
i; an interaction variable noinf
i, obtained multiplying
INFi by noecd
i; a vector of 0-1 dummy variables controlling for the sector
0 1 2 3 4 5FRAT RAT INFi i i i i iuni noecd noratβ β β β β β= + + + + +
6 7 8i i i inouni noinf dusctβ β β ε+ + + +
(3)

91MORE ANALYSTS, BETTER RATINGS
to which the firm belongs, taking value 1 if firm i’s main activity belongs to
that sector (duscti).
We know that non-OECD firms have lower ratings, so we may anticipate
that noecd is negative and significant. We expect that the rating of the firm
depends largely on its sovereign rating (RAT positive and significant), but
that this link may be stronger for non-OECD countries and weaker for OECD
countries (norat positive and significant).11 By the same token, we anticipate
that the positive impact on firm ratings deriving from better information quality
(INF positive and significant) might be stronger for non-OECD countries
(noinf positive and significant), which suffer more acute information
asymmetry. As to sector characteristics—here grossly proxying firm
performance—we don’t have any specific a priori. Finally, we expect that
there might be a relationship between the number of units of analysts engaged
in the firm’s rating and the rating assigned. The relationship might be generally
negative if the rating agency makes a larger effort vis-à-vis problematic firms;
this could happen, for example, if a firm with poor prospects in its specific
sector/country is put under special watch by the rating agency, with the agency
increasing its effort level—assigning more analysts to supervise the firm—
and soon or simultaneously lowering that firm’s rating (in this case, we expect
the coefficient of uni to be negative and significant). By contrast, the
relationship between the agency’s effort and the firm’s rating might be positive
in situations where the agency is underinvesting in information gathering and
processing; for example, in a highly opaque environment, relatively low ratings
may be prudently assigned but when the agency increases its efforts (assigning
more analysts) toward individual firms in that environment it may
systematically discover that these firms deserve higher ratings. As argued
above, this situation might obtain in countries with lower quality of disclosure,
i.e. in non-OECD countries (in this case, we expect a significant coefficient
for nouni with a positive sign and possibly larger in absolute value than the
coefficient for uni).
Key descriptive statistics for the dependent and independent variables are
presented in Table 3. First, we observe that 84% of the firms in our sample
are from OECD countries. Second, as expected, we find that the major
11 See, among others, Ferri, Liu and Majnoni, (2001) and Ferri and Liu (2003).

92 JOURNAL OF APPLIED ECONOMICS
difference in sovereign rating levels between OECD and non-OECD countries
also obtains here and it translates into firm ratings too. Third, the level of
information quality significantly lags behind in non-OECD countries. Finally,
on average (and on median), more effort is made for non-OECD firm ratings
than for OECD ones.
Results obtained from estimating equation (3) are reported in Table 4. We
report results for two different specifications. Specification (i) introduces uni
together with the other explanatory variables omitting, however, the
institutional regressor INF and the related noinf, where the last two variables
imply dropping ten observations (from 631 to 621). Specification (ii) considers
all the explanatory variables. The preferred specifications are obtained by
eliminating those regressors that turn out to be statistically insignificant.
The results confirm that firm ratings depend largely on their sovereign
ratings (and also on the sector to which they belong): on average, increasing
Table 3. Descriptive Statistics: Firm Ratings
Variables Mean Median Min. Max. Source
FRAT 58 60 0 100 Moody’s
- OECD 60.7 65 0 100
- non-OECD 44 45 10 70
RAT 87.7 90 25 100 Moody’s
-OECD 94.5 95 75 100
- non-OECD 51.1 55 25 70
UNIANA 0.077 0.042 0.001 2 Moody’s
- OECD 0.065 0.033 0.001 1.167
- non-OECD 0.141 0.071 0.001 2
INF 81.1 89.5 21.1 100 Chan-Lee and
Ahn (2001)
- OECD 86.9 89.5 50.4 100
- non-OECD 49.1 49.8 21.1 75.6
oecd 0.84 1 0 1 OECD

93MORE ANALYSTS, BETTER RATINGS
Table 4. Estimates of the Firm Rating Equation (FRAT)
Explanatory Specification (i) Specification (ii)
variables General Preferred General Preferred
RAT 0.345 0.318 0.491 0.515
(2.36)** (2.17)** (3.20)*** (3.37)***
uni -0.262 -0.261 -0.281 -0.266
(-2.34)** (-2.35)** (-2.52)** (-2.39)**
noecd -29.968 -32.052 -30.566 -30.775
(-1.90)* (-2.04)** (-1.89)* (-1.91)*
INF -0.154 -0.191
(-2.06)** (-2.58)**
norat 0.518 0.523 0.358 0.307
(2.55)** (2.58)** (1.56) (1.35)
nouni 0.197 0.310 0.212 0.322
(0.95) (1.77)* (1.02) (1.83)*
noinf 0.190 0.246
(1.20) (1.57)
Constant 35.101 34.764 34.531 30.888
(2.50)** (2.51)** (2.43)** (2.20)**
No. observations 631 631 621 621
F 12.46*** 15.49*** 11.67*** 16.39***
Adjusted R2 0.286 0.2812 0.292 0.2842
C-W test 0.31 0.71 0.16 0.48
Notes: t-statistics are in parentheses. *** , ** and * indicate, respectively, that the hypothesisof the coefficient being zero may be rejected at the 1%, 5% and 10% confidence level.Estimates are obtained via the OLS method. We do not apply the Huber-White correction,as the Cook-Weisberg test rejects the presence of heteroscedasticity. Though not reportedin the table, we distinguish 18 macro-sectors: oil (62 firms; omitted in the estimates);electric industry (37 firms); telecoms (52); trading, retail & consumer products (40); TV,telephone, electronics & electrical equipment (73); construction, real estate, building material& cement (24); agriculture (12); automotive, tires, transports, aerospace, shipping,machinery & mechanical components (60); metals, mining, shipyards, containers, steel &railroads (50); hotels, casinos, entertainment, amusements, motion pictures, records,

94 JOURNAL OF APPLIED ECONOMICS
advertising, media, jewelry & broadcasting (21); restaurants, food, drinks, brewery, sugar& tobacco (48); finance, diversified & miscellaneous (43); textiles, apparel & shoes (6);chemicals, plastics, paper, pharmaceuticals & drugs (59); health equipment, help supplyservices, office systems, environment, research development labs, hospitals & hospitalsupplies (9); printing, publishing, glass, photo & optical products (18); sovereign guaranteed(5); other firms not included elsewhere (16).
the sovereign rating by 10 points (e.g. passing from Aa1 to Aaa) implies that
the firm rating rises by 3 to 5 points, depending on the specification.
Furthermore, non-OECD firm ratings are more sensitive to sovereign ratings:
if sovereign ratings rise by 10 points, firm ratings increase by 8 points for
non-OECD firms. As to our effort variable (uni), it is significant and negative,
thus confirming our expectation that rating agencies invest more vis-à-vis
more problematic firms: a 10% increase in the agency’s effort is accompanied
by a decrease in the rating by 2.5 points. Most interestingly to us, however,
the underinvestment hypothesis also receives some support. Namely, there is
a specific positive impact of the effort for non-OECD firms (nouni) and the
coefficient for nouni is larger in absolute value than that for uni. Thus, an
increase in the agencies’ effort correlates with a drop in the rating for OECD
firms but with a slight increase in the rating for non-OECD firms. This indicates
that in non-OECD countries higher informational investment by Moody’s is
accompanied by better firm ratings. In turn, this reveals that when Moody’s
decides to put more into analyzing non-OECD firms—on which little is
known—these firms, on average, turn out to be deserving. This suggests that
Moody’s is underinvesting in these firms.
Inserting the information quality variable (INF) does not generally alter
the results. The only noticeable change is that the special sensitivity of non-
OECD firm ratings to sovereign ratings becomes insignificant.12 Interestingly,
controlling for the other regressors, firm ratings exhibit a negative correlation
with the level of INF. Again, this is probably to be interpreted as evidence
that lower-quality firms may also wish to get a rating in countries with higher
information standards—and with more developed capital markets—whereas
equivalent firms in countries with lower standards wouldn’t consider such a
course.
12 However, this might be explained by the collinearity between INF and oecd.

95MORE ANALYSTS, BETTER RATINGS
All in all, our results on firm ratings are even more suggestive than those
we obtained on sovereign ratings. We find that, on average, comparing two
otherwise equivalent non-OECD firms γ and δ, if firm γ has one more analyst
than firm δ exclusively dedicated to it by Moody’s, then the rating for firm γis almost 3 points above that of firm δ. In practice, in our sample of non-
OECD firms, uni—rescaled to 0-100—varies from a minimum of 0.05 to a
median of 3.55 to a maximum of 100. Accordingly, a firm moving from the
median to the maximum level of uni could benefit from an increase in its
rating of 5.4 points (just above one notch, which amounts to 5 points).
Generally, such increase would significantly reduce the interest rate charged
on that firm. More specifically, for the 7% of non-OECD firms with a rating
of 50 (Ba1 in Moody’s alphanumeric scale), such an increase in Moody’s’
effort would allow them to move from a below-investment-grade rating to a
rating above the investment grade threshold (i.e. above 55, or Baa3 in Moody’s
alphanumeric scale).13 On the basis of the historical linkage between rating
levels and interest rate spreads in the USA (e.g. Hickman, 1960; Atkinson,
1967), such firms would enjoy a reduction in their interest rate of about 200
basis points.
Thus, our results suggest that even though rating agencies spend more
effort, on average, on non-OECD firms than on OECD firms, they may still
be underinvesting in collecting and processing information on the former. It
appears that non-OECD firms, probably suffering because of inadequate
information disclosure and quality of institutions in their home countries,
would generally stand to gain if rating agencies decided to intensify scrutiny
of them. In fact, given their expected gain, non-OECD firms might be willing
to pay higher fees to elicit more effort from rating agencies and, hence, get
better ratings.
It is worth recalling that the basic reason rating agencies exist is that they
may reduce informational asymmetries between issuers and investors. In light
of this, our results indicate that rating agencies should definitely invest more
resources in their ratings of firms in non-OECD countries. This need will
only be heightened in the immediate future, as the enforcement of the new
13 Moving from below to above the threshold greatly expands potential investors in thefirm (Dale and Thomas, 1991).
96 JOURNAL OF APPLIED ECONOMICS
Basel regulation will link bank minimum capital requirements—and, thus,
credit supply—to ratings assigned to firms and sovereigns by the rating
agencies.
V. Conclusions
This paper started out by asking whether rating agencies invest enough in
assessing the credit worthiness of issuers in less developed countries. When
they assign ratings to these issuers, rating agencies send potent signals to
global financial markets and these signals will become even more compelling
with prescribed changes in regulation. Even though a reputation mechanism
should, in theory, elicit adequate effort from rating agencies, two observations
led us to question whether this is actually true for the ratings of issuers in
LDCs. First, the almost-monopolistic market structure of their industry raises
the suspicion that, with no sanction, rating agencies may not only practice
rent extraction but also indulge in underinvestment, particularly vis-à-vis
borrowers in LDCs in a poor position to complain of unfair treatment. Second,
the consensus view holds that rating agencies failed recent crucial exams,
e.g. the East Asian crisis; rather than forewarning markets, they were late to
downgrade and, possibly, downgrades were too heavy handed.
In the light of this, we proposed a synthetic measure quantifying the effort
made by the rating agency to collect and process information on each rated
entity. We used data (on both sovereign and non-bank firm ratings) from
Moody’s to check empirically for any sign of underinvestment vis-à-vis entities
in LDCs. Underinvestment may occur either in absolute or in relative terms.
The former, more obvious, case is proved if rating agencies’ effort is lower in
LDCs than in developed countries. The latter case needs a premise. Because
of the poorer quality of information they disclose, issuers in LDCs are likely
to be subject to more acute informational asymmetries with investors than
those prevailing in developed countries. Accordingly, rating agencies’ effort
should be more intense vis-à-vis issuers from LDCs. We posited that if we
were to find evidence that stepped-up effort raises rating levels in LDCs but
not in developed countries, this would indicate relative underinvestment.
In our empirical results we found evidence of: (i) absolute underinvestment
on sovereign issuers from LDCs, i.e. rating agencies’ effort is smaller there

97MORE ANALYSTS, BETTER RATINGS
than in developed countries; and (ii) relative underinvestment on non-financial
firms from LDCs, i.e. despite a larger rating effort on firms in LDCs than in
firms in developed countries, the ratings of the latter decrease with effort
while those of the former do not and sometimes even increase.
In our view, this raises an important policy issue. Incentives should be
devised to induce rating agencies to increase their effort in less developed
countries. Otherwise, the distortion deriving from their underinvestment could
prove an obstacle to LDCs’ access to global financial markets.
References
Atkinson, R.T. (1967), Trends in Corporate Bond Quality, New York, NBER.
Basel Committee on Banking Supervision (2001), The New Basel Capital
Accord, Basel.
Bongini, P., Laeven, L., and G. Majnoni, (2001), “How Good is the Market at
Assessing Bank Fragility? A Horse Race between Different Indicators,”
Policy Research Working Paper, World Bank.
Cantor, R. and F. Packer (1996), “Determinants and Impacts of Sovereign
Credit Ratings,” Federal Reserve Bank of New York Economic Policy
Review 2: 37-53.
Cantor, R., and F. Packer (1997), “Differences of Opinion and Selection Bias
in the Credit Rating Industry,” Journal of Banking and Finance 21: 1395-
1417.
Chan-Lee, J., and S. Ahn (2001), “Information Quality of Financial Systems
and Economic Development: An indicator Approach for East Asia,”
Working Paper 20, Asian Development Bank Institute.
Dale, R.S., and S.H. Thomas (1991), “The Regulatory Use of Credit Ratings
in International Financial Markets,” Journal of International Securities
Markets 5 : 9-18.
Ederington, L.H., Yawitz, J.B., and B.E. Roberts (1987), “The Information
Content of Bond Ratings,” The Journal of Financial Research 10: 211-
26.
Ferri, G., and L. Liu (2003), “How Do Global Credit Rating Agencies Rate
Firms from Developing Countries?,” Asian Economic Papers 2,
forthcoming.

98 JOURNAL OF APPLIED ECONOMICS
Ferri, G., Liu, L., and G. Majnoni (2001), “The Role of Rating Agency
Assessments in Less Developed Countries: Impact of The Proposed Basel
Guidelines,” Journal of Banking and Finance 25: 115-48.
Ferri, G., Liu, L., and J.E. Stiglitz (1999), “The Procyclical Role of Rating
Agencies: Evidence from the East Asian Crisis,” Economic Notes 28: 335-
56.
Hickman, W.B. (1960), Statistical Measures of Corporate Bond Financing
since 1900, Princeton University Press for NBER.
International Monetary Fund (1999), Capital Market Development,
Washington, DC, IMF.
La Porta, R., Lopez-de-Silanes, F., Shleifer, A., and R.W. Vishny (1998),
“Law and Finance,” Journal of Political Economy 106: 1113-56.
Monfort, B., and C. Mulder (2000), “The Impact of Using Sovereign Ratings
by Credit Rating Agencies on the Capital Requirements for Banks: A
Study of Emerging Market Economies,” WP/00/69, IMF.
Nickell, P., Perraudin, W., and S. Varotto (2000), “Stability of Rating
Transitions,” Journal of Banking and Finance 24: 203-27.
Sylla, R., (2002), “A Historical Primer on the Business of Credit Ratings,” in
R.M. Levich, G. Majnoni, and C. Reinhart, eds., Ratings, Rating Agencies
and the Global Financial System, Dordrecht, Boston and London, Kluwer
Academic Publishers.
White, L.J. (2002), “The Credit Rating Industry: An Industrial Organization
Analysis,” in R.M. Levich, G. Majnoni, and C. Reinhart, eds., Ratings,
Rating Agencies and the Global Financial System, Dordrecht, Boston and
London, Kluwer Academic Publishers.