Embed Size (px)
Citation preview

M O R G A N S T A N L E Y
S E L E C T D I M E N S I O N S I N V E S T M E N T S E R I E S
Annu al ReportD E C E M B E R 3 1 , 2 0 1 5
The Portfolios are intended to be the funding vehicle for variable annuity contracts and variable life insurance policies offered by the
separate accounts of certain life insurance companies.
Merrill Corp - MS Select Dimensions Annual Report [Funds] 033-54047 12-31-2015 ED [AUX] | pweakly | 18-Feb-16 15:50 | 16-1344-2.aa | Sequence: 1CHKSUM Content: 51153 Layout: 15091 Graphics: No Graphics CLEAN
JOB: 16-1344-2 CYCLE#;BL#: 8; 0 TRIM: 7.5" x 8.75" AS: Merrill New York: 212-620-5600 COMPOSITECOLORS: Black, ~note-color 2, ~note-color 3 GRAPHICS: none V1.5
Morgan Stanley Select Dimensions Investment SeriesTable of Contents
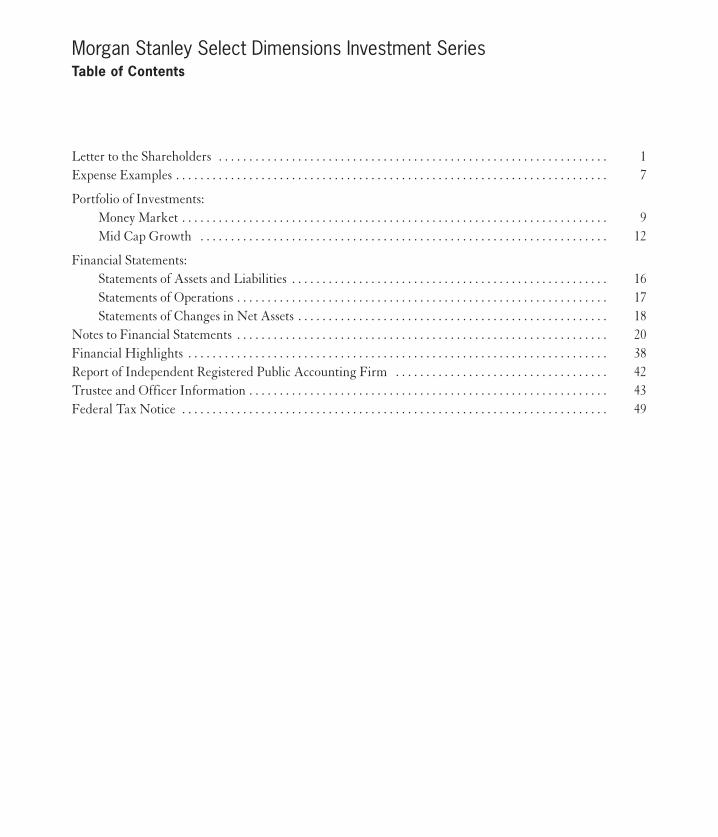
Letter to the Shareholders . . . . . . . . . . . . . . . . . . . . . . . . . . . . . . . . . . . . . . . . . . . . . . . . . . . . . . . . . . . . . . . . 1
Expense Examples . . . . . . . . . . . . . . . . . . . . . . . . . . . . . . . . . . . . . . . . . . . . . . . . . . . . . . . . . . . . . . . . . . . . . . . 7
Portfolio of Investments:
Money Market . . . . . . . . . . . . . . . . . . . . . . . . . . . . . . . . . . . . . . . . . . . . . . . . . . . . . . . . . . . . . . . . . . . . . . 9
Mid Cap Growth . . . . . . . . . . . . . . . . . . . . . . . . . . . . . . . . . . . . . . . . . . . . . . . . . . . . . . . . . . . . . . . . . . . 12
Financial Statements:
Statements of Assets and Liabilities . . . . . . . . . . . . . . . . . . . . . . . . . . . . . . . . . . . . . . . . . . . . . . . . . . . . 16
Statements of Operations . . . . . . . . . . . . . . . . . . . . . . . . . . . . . . . . . . . . . . . . . . . . . . . . . . . . . . . . . . . . . 17
Statements of Changes in Net Assets . . . . . . . . . . . . . . . . . . . . . . . . . . . . . . . . . . . . . . . . . . . . . . . . . . . 18
Notes to Financial Statements . . . . . . . . . . . . . . . . . . . . . . . . . . . . . . . . . . . . . . . . . . . . . . . . . . . . . . . . . . . . . 20
Financial Highlights . . . . . . . . . . . . . . . . . . . . . . . . . . . . . . . . . . . . . . . . . . . . . . . . . . . . . . . . . . . . . . . . . . . . . 38
Report of Independent Registered Public Accounting Firm . . . . . . . . . . . . . . . . . . . . . . . . . . . . . . . . . . . 42
Trustee and Officer Information . . . . . . . . . . . . . . . . . . . . . . . . . . . . . . . . . . . . . . . . . . . . . . . . . . . . . . . . . . . 43
Federal Tax Notice . . . . . . . . . . . . . . . . . . . . . . . . . . . . . . . . . . . . . . . . . . . . . . . . . . . . . . . . . . . . . . . . . . . . . . 49
Merrill Corp - MS Select Dimensions Annual Report [Funds] 033-54047 12-31-2015 ED [AUX] | pweakly | 18-Feb-16 15:50 | 16-1344-2.aa | Sequence: 2CHKSUM Content: 37593 Layout: 20700 Graphics: No Graphics CLEAN
JOB: 16-1344-2 CYCLE#;BL#: 8; 0 TRIM: 7.5" x 8.75" AS: Merrill New York: 212-620-5600 COMPOSITECOLORS: Black, ~note-color 2, ~note-color 3 GRAPHICS: none V1.5

Morgan Stanley Select Dimensions Investment SeriesLetter to the Shareholders n December 31, 2015 (unaudited)
Dear Shareholder:In 2015, investors began to reckon with implications of a less-dominant Chinese economy and the end ofthe U.S.’s era of zero interest rates. Commodity prices remained in a rout, emerging market economiescame under severe stress, default fears spread across energy and materials companies and corporate profitgrowth shrank. Meanwhile, as the U.S. prepared for tightening monetary conditions, policy makers inEurope, Japan and China tried to prop up their economies through monetary easing and other stimulusmeasures. Reflecting the uncertainties of this environment, the investment landscape turned more volatilein the past year. Gains across many asset classes became more elusive amid subdued global demand andmuted expectations.
Domestic Equity OverviewThe U.S. stock market ended the period at nearly the same level where it started. U.S. economic data weremixed throughout 2015, with the overall recovery maintaining its modest pace. The jobs market improvedmarkedly during the period, aiding the Fed’s decision to raise its main policy interest rate at itsDecember meeting. The move was perceived as a vote of confidence on the health of the economy. Yet, anumber of headwinds slowed corporate earnings growth during the period, including falling commodityprices, the U.S. dollar’s appreciation and lackluster consumer spending. In this environment, a narrowgroup of large-cap companies generated most of the broad market’s return.
Fixed Income OverviewLike their equity counterparts, major bond indexes hardly moved during the period. Also like equities,despite their flat return, bonds also exhibited volatility as investors awaited the Fed’s rate hike, theEuropean Central Bank embarked on its own bond-buying program to ease financial conditions andpotentially boost European economies, geopolitical events stoked uncertainty and commodity prices fell.
Treasury yields rose over the period but exhibited significant volatility along the way. For example, theyield on the 10-year U.S. Treasury note increased by 10 basis points from 2.17% at the beginning of theperiod to 2.27% at period-end, but during the year reached a low of 1.64% and a high of 2.48%.(i)
The actions of the Federal Open Market Committee (FOMC) – including its economic forecasts andforward guidance about the much-anticipated rate increase, as well as the testing of the tool designed tohelp control short-term interest rates – continued to be a major focus in the money markets during thereporting period. For nearly the entire year, money market yields remained constrained by the FOMC’s
(i) Yields and yield spreads data from Bloomberg L.P.
Merrill Corp - MS Select Dimensions Annual Report [Funds] 033-54047 12-31-2015 ED [AUX] | pweakly | 18-Feb-16 15:51 | 16-1344-2.ba | Sequence: 1CHKSUM Content: 52184 Layout: 29190 Graphics: No Graphics CLEAN
JOB: 16-1344-2 CYCLE#;BL#: 8; 0 TRIM: 7.5" x 8.75" AS: Merrill New York: 212-620-5600 COMPOSITECOLORS: Black, ~note-color 2, ~note-color 3 GRAPHICS: none V1.5

Morgan Stanley Select Dimensions Investment SeriesLetter to the Shareholders n December 31, 2015 (unaudited) continued
2
near-zero interest rate policy, as has been the case since 2009. Short-term spreads widened and rates backedup in the final months of the year, beginning in November amid rising expectations for a rate hike inDecember, and continuing to widen in December, as the Committee announced a 25 basis point increase toits target federal funds rate. The Committee also continued to emphasize that its stance remainsaccommodative, with future policy rate increases applied gradually and informed by incoming data.
Money Market PortfolioAn investment in a money market fund is not insured or guaranteed by the Federal Deposit InsuranceCorporation or any other government agency. Although money market funds seek to preserve the value ofan investment at $1.00 per share, it is possible to lose money by investing in such funds.
As of December 31, 2015, Select Dimensions – Money Market Portfolio had net assets of approximately$36.5 million with an average portfolio maturity of 10 days. For the seven-day period ended December 31,2015, the Portfolio’s Class X shares provided an effective annualized yield of 0.01% (subsidized) and -1.24%(non-subsidized) and a current yield of 0.01% (subsidized) and -1.25% (non-subsidized), while its 30-daymoving average yield for December 31, 2015 was 0.01% (subsidized) and -1.29% (non-subsidized). Yieldquotations more closely reflect the current earnings of the Portfolio. The non-subsidized yield reflects whatthe yield would have been had a fee and/or expense waiver not been in place during the period shown. Forthe 12-month period ended December 31, 2015, the Portfolio’s Class X shares returned 0.01%. Past
performance is no guarantee of future results.
For the seven-day period ended December 31, 2015, the Portfolio’s Class Y shares provided an effectiveannualized yield of 0.01% (subsidized) and -1.49% (non-subsidized) and a current yield of 0.01%(subsidized) and -1.50% (non-subsidized), while its 30-day moving average yield for December 31, 2015 was0.01% (subsidized) and -1.54% (non-subsidized). Yield quotations more closely reflect the current earningsof the Portfolio. The non-subsidized yield reflects what the yield would have been had a fee and/or expensewaiver not been in place during the period shown. For the 12-month period ended December 31, 2015, thePortfolio’s Class Y shares returned 0.01%. Past performance is no guarantee of future results.
The performance of the Portfolio’s two share classes varies because each has different expenses. The Portfolio’s total
returns assume the reinvestment of all distributions but do not reflect the deduction of any charges by your
insurance company. Such costs would lower performance.
We remain quite comfortable in our conservative approach to managing the Portfolio, focusing onsecurities with high liquidity and short durations. We believe our investment process and focus on creditresearch and risk management, combined with the high degree of liquidity and short maturity position of
Merrill Corp - MS Select Dimensions Annual Report [Funds] 033-54047 12-31-2015 ED [AUX] | pweakly | 18-Feb-16 15:51 | 16-1344-2.ba | Sequence: 2CHKSUM Content: 64327 Layout: 49212 Graphics: No Graphics CLEAN
JOB: 16-1344-2 CYCLE#;BL#: 8; 0 TRIM: 7.5" x 8.75" AS: Merrill New York: 212-620-5600 COMPOSITECOLORS: Black, ~note-color 2, ~note-color 3 GRAPHICS: none V1.5

Morgan Stanley Select Dimensions Investment SeriesLetter to the Shareholders n December 31, 2015 (unaudited) continued
3
the Portfolio, has put us in a favorable position to respond to market uncertainty. Our investmentphilosophy continues to revolve around prudent credit and risk management and portfolios that arepositioned defensively and with very high levels of liquidity.
There is no guarantee that any sectors mentioned will continue to perform as discussed above or that securities in
such sectors will be held by the Portfolio in the future.
Mid Cap Growth PortfolioFor the 12-month period ended December 31, 2015, Select Dimensions – Mid Cap Growth PortfolioClass X shares produced a total return of -6.59%, underperforming the Russell Midcap® Growth Index (the“Index”), which returned -0.20%. For the same period, the Portfolio’s Class Y shares returned -6.81%. Past
performance is no guarantee of future results.
The performance of the Portfolio’s two share classes varies because each has different expenses. The Portfolio’s total
returns assume the reinvestment of all distributions but do not reflect the deduction of any charges by your
insurance company. Such costs would lower performance.
The Portfolio’s underperformance during the period was driven by stock selection, with most of the relativelosses occurring in the information technology (IT), consumer staples and consumer discretionary sectors.
A global communications platform was the largest detractor in both the IT sector and the overall portfoliofor this period. The company’s shares have been plagued for some time by concerns around user growth,which has generally disappointed Wall Street expectations. While we continue to monitor the situation, webelieve the reach of the company’s global platform is far greater than its registered user base, andaccordingly that the company has a sizeable opportunity to monetize user engagement via variousadvertising solutions.
In the consumer staples sector, relative results were hurt by a leading single-serve coffee provider. Thecompany’s poor execution around the launch of its 2.0 coffee brewer resulted in weaker-than-expectedfundamentals, and both the price point and timeline to launch its new cold beverage system had alsodisappointed investors. Although the shares spiked in early December on news that the company agreed tobe acquired by a privately held company at an 80 percent premium, the stock detracted from performancefor the period overall.
In the consumer discretionary sector, a position in a branded apparel and accessories retailer was the mostdetrimental to relative performance. Currency headwinds and lower tourism volumes in North Americaand Europe hindered the company’s same-store sales growth, which weighed on stock prices. We remain
Merrill Corp - MS Select Dimensions Annual Report [Funds] 033-54047 12-31-2015 ED [AUX] | pweakly | 18-Feb-16 15:51 | 16-1344-2.ba | Sequence: 3CHKSUM Content: 8788 Layout: 64338 Graphics: No Graphics CLEAN
JOB: 16-1344-2 CYCLE#;BL#: 8; 0 TRIM: 7.5" x 8.75" AS: Merrill New York: 212-620-5600 COMPOSITECOLORS: Black, ~note-color 2, ~note-color 3 GRAPHICS: none V1.5
4
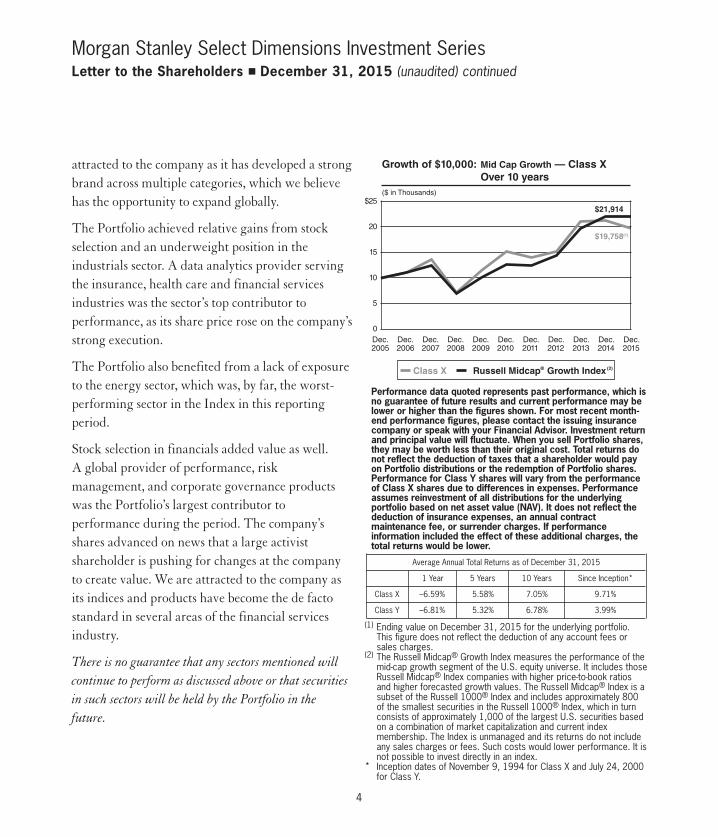
attracted to the company as it has developed a strongbrand across multiple categories, which we believehas the opportunity to expand globally.
The Portfolio achieved relative gains from stockselection and an underweight position in theindustrials sector. A data analytics provider servingthe insurance, health care and financial servicesindustries was the sector’s top contributor toperformance, as its share price rose on the company’sstrong execution.
The Portfolio also benefited from a lack of exposureto the energy sector, which was, by far, the worst-performing sector in the Index in this reportingperiod.
Stock selection in financials added value as well.A global provider of performance, riskmanagement, and corporate governance productswas the Portfolio’s largest contributor toperformance during the period. The company’sshares advanced on news that a large activistshareholder is pushing for changes at the companyto create value. We are attracted to the company asits indices and products have become the de factostandard in several areas of the financial servicesindustry.
There is no guarantee that any sectors mentioned will
continue to perform as discussed above or that securities
in such sectors will be held by the Portfolio in the
future.
Morgan Stanley Select Dimensions Investment SeriesLetter to the Shareholders n December 31, 2015 (unaudited) continued
Performance data quoted represents past performance, which isno guarantee of future results and current performance may belower or higher than the figures shown. For most recent month-end performance figures, please contact the issuing insurancecompany or speak with your Financial Advisor. Investment returnand principal value will fluctuate. When you sell Portfolio shares,they may be worth less than their original cost. Total returns donot reflect the deduction of taxes that a shareholder would payon Portfolio distributions or the redemption of Portfolio shares.Performance for Class Y shares will vary from the performanceof Class X shares due to differences in expenses. Performanceassumes reinvestment of all distributions for the underlyingportfolio based on net asset value (NAV). It does not reflect thededuction of insurance expenses, an annual contractmaintenance fee, or surrender charges. If performanceinformation included the effect of these additional charges, thetotal returns would be lower.
Average Annual Total Returns as of December 31, 2015
1 Year 5 Years 10 Years Since Inception*
Class X –6.59% 5.58% 7.05% 9.71%
Class Y –6.81% 5.32% 6.78% 3.99% (1) Ending value on December 31, 2015 for the underlying portfolio.
This figure does not reflect the deduction of any account fees orsales charges.
(2) The Russell Midcap® Growth Index measures the performance of themid-cap growth segment of the U.S. equity universe. It includes thoseRussell Midcap® Index companies with higher price-to-book ratiosand higher forecasted growth values. The Russell Midcap® Index is asubset of the Russell 1000® Index and includes approximately 800of the smallest securities in the Russell 1000® Index, which in turnconsists of approximately 1,000 of the largest U.S. securities basedon a combination of market capitalization and current indexmembership. The Index is unmanaged and its returns do not includeany sales charges or fees. Such costs would lower performance. It isnot possible to invest directly in an index.
* Inception dates of November 9, 1994 for Class X and July 24, 2000for Class Y.
0
5
10
15
20
$25
Growth of $10,000: Mid Cap Growth — Class X Over 10 years($ in Thousands)
$21,914
Dec.2005
Dec.2007
Dec.2006
Dec.2008
Dec.2009
Dec.2010
Dec.2011
Dec.2012
Dec.2013
Dec.2015
Dec.2014
$19,758(1)
Class X Russell Midcap® Growth Index(2)
Merrill Corp - MS Select Dimensions Annual Report [Funds] 033-54047 12-31-2015 ED [AUX] | pweakly | 18-Feb-16 15:51 | 16-1344-2.ba | Sequence: 4CHKSUM Content: 14413 Layout: 57803 Graphics: 57175 CLEAN
JOB: 16-1344-2 CYCLE#;BL#: 8; 0 TRIM: 7.5" x 8.75" AS: Merrill New York: 212-620-5600 COMPOSITECOLORS: Black, ~note-color 2, ~note-color 3 GRAPHICS: 1344-2_Select Dimension.eps V1.5
Morgan Stanley Select Dimensions Investment SeriesLetter to the Shareholders n December 31, 2015 (unaudited) continued
5
We appreciate your ongoing support of Morgan Stanley Select Dimensions Investment Series and lookforward to continuing to serve your investment needs.
Very truly yours,
John H. GernonPresident and Principal Executive Officer
Merrill Corp - MS Select Dimensions Annual Report [Funds] 033-54047 12-31-2015 ED [AUX] | pweakly | 18-Feb-16 15:51 | 16-1344-2.ba | Sequence: 5CHKSUM Content: 50268 Layout: 22518 Graphics: 44807 CLEAN
JOB: 16-1344-2 CYCLE#;BL#: 8; 0 TRIM: 7.5" x 8.75" AS: Merrill New York: 212-620-5600 COMPOSITECOLORS: Black, ~note-color 2, ~note-color 3 GRAPHICS: John_Gernon_Sig.eps V1.5
Morgan Stanley Select Dimensions Investment SeriesLetter to the Shareholders n December 31, 2015 (unaudited) continued
6
For More Information About Portfolio HoldingsEach Morgan Stanley fund provides a complete schedule of portfolio holdings in its semiannual and annualreports within 60 days of the end of the fund’s second and fourth fiscal quarters. The semiannual reports andthe annual reports are filed electronically with the Securities and Exchange Commission (SEC) on Form N-CSRSand Form N-CSR, respectively. Morgan Stanley also delivers the semiannual and annual reports to fundshareholders and makes these reports available on its public web site, www.morganstanley.com/im. EachMorgan Stanley fund also files a complete schedule of portfolio holdings with the SEC for the fund’s firstand third fiscal quarters on Form N-Q and monthly holdings for each money market fund on Form N-MFP.Morgan Stanley does not deliver these reports to shareholders, nor are the first and third fiscal quarterreports posted to the Morgan Stanley public web site. However, the holdings for each money market fundare posted to the Morgan Stanley public web site. You may obtain the Form N-Q filings (as well as theForm N-CSR, N-CSRS and N-MFP filings) by accessing the SEC’s web site, http://www.sec.gov. You mayalso review and copy them at the SEC’s public reference room in Washington, DC. Information on theoperation of the SEC’s public reference room may be obtained by calling the SEC at (800) SEC-0330. Youcan also request copies of these materials, upon payment of a duplicating fee, by electronic request at theSEC’s e-mail address ([email protected]) or by writing the public reference section of the SEC,Washington, DC 20549-1520.
Proxy Voting Policy and Procedures and Proxy Voting RecordYou may obtain a copy of the Portfolios’ Proxy Voting Policy and Procedures without charge, uponrequest, by calling toll free (800) 548-7786 or by visiting the Mutual Fund Center on our web site atwww.morganstanley.com/im. It is also available on the SEC’s web site at http://www.sec.gov.
You may obtain information regarding how the Portfolios voted proxies relating to portfolio securitiesduring the most recent twelve-month period ended June 30 without charge by visiting the Mutual FundCenter on our web site at www.morganstanley.com/im. This information is also available on the SEC’s website at http://www.sec.gov.
Merrill Corp - MS Select Dimensions Annual Report [Funds] 033-54047 12-31-2015 ED [AUX] | pweakly | 18-Feb-16 15:51 | 16-1344-2.ba | Sequence: 6CHKSUM Content: 15425 Layout: 49212 Graphics: No Graphics CLEAN
JOB: 16-1344-2 CYCLE#;BL#: 8; 0 TRIM: 7.5" x 8.75" AS: Merrill New York: 212-620-5600 COMPOSITECOLORS: Black, ~note-color 2, ~note-color 3 GRAPHICS: none V1.5

Morgan Stanley Select Dimensions Investment SeriesExpense Examples n December 31, 2015 (unaudited)
7
As a shareholder of a Portfolio, you incur two types of costs: (1) insurance company charges; and(2) ongoing costs, including advisory fees, administration fees, distribution and services (12b-1) fees, andother Portfolio expenses. These examples are intended to help you understand your ongoing costs (indollars) of investing in each Portfolio and to compare these costs with the ongoing costs of investing in othermutual funds.
These examples are based on an investment of $1,000 invested at the beginning of the period and held forthe entire period 07/01/15 – 12/31/15.
Actual ExpensesThe first line of the tables on the following page provides information about actual account values andactual expenses. You may use the information in this line, together with the amount you invested, toestimate the expenses that you paid over the period. Simply divide your account value by $1,000 (forexample, an $8,600 account value divided by $1,000 = 8.6), then multiply the result by the number in thefirst line under the heading entitled “Expenses Paid During Period” to estimate the expenses you paid onyour account during this period.
Hypothetical Example for Comparison PurposesThe second line of the tables on the following page provides information about hypothetical expenses basedon the Portfolio’s actual expense ratio and an assumed rate of return of 5% per year before expenses, whichis not the Portfolio’s actual return. The hypothetical account values and expenses may not be used toestimate the actual ending account balance or expenses you paid for the period. You may use thisinformation to compare the ongoing cost of investing in the Portfolio and other funds. To do so, comparethis 5% hypothetical example with the 5% hypothetical examples that appear in the shareholder reports ofthe other funds.
Please note that the expenses shown in the tables are meant to highlight your ongoing costs only and do notreflect any insurance company charges. Therefore, the second line of the tables is useful in comparingongoing costs, and will not help you determine the relative total cost of owning different funds. In addition,if these insurance company charges were included, your costs would have been higher.
Merrill Corp - MS Select Dimensions Annual Report [Funds] 033-54047 12-31-2015 ED [AUX] | pweakly | 18-Feb-16 15:51 | 16-1344-2.ca | Sequence: 1CHKSUM Content: 7284 Layout: 42571 Graphics: No Graphics CLEAN
JOB: 16-1344-2 CYCLE#;BL#: 8; 0 TRIM: 7.5" x 8.75" AS: Merrill New York: 212-620-5600 COMPOSITECOLORS: Black, ~note-color 2, ~note-color 3 GRAPHICS: none V1.5

Morgan Stanley Select Dimensions Investment SeriesExpense Examples n December 31, 2015 (unaudited) continued
8
Money Market Beginning Ending Expenses Paid Account Value Account Value During Period@ 07/01/15 – 07/01/15 12/31/15 12/31/15 Class XActual (0.01% return) . . . . . . . . . . . . . . . . . . . . . . . . . . . . . . $1,000.00 $1,000.05 $0.55Hypothetical (5% annual return before expenses) . . . . . . $1,000.00 $1,024.65 $0.56
Class YActual (0.01% return) . . . . . . . . . . . . . . . . . . . . . . . . . . . . . . $1,000.00 $1,000.05 $0.55Hypothetical (5% annual return before expenses) . . . . . . $1,000.00 $1,024.65 $0.56
@ Expenses are equal to the Portfolio’s annualized expense ratios of 0.11% and 0.11% for Class X and Class Y shares,respectively, multiplied by the average account value over the period, multiplied by 184/365 (to reflect the one-half year period).If the Portfolio had borne all of its expenses, the annualized expense ratios would have been 1.03% and 1.28% for Class X andClass Y shares, respectively.
Mid Cap Growth Beginning Ending Expenses Paid Account Value Account Value During Period@ 07/01/15 – 07/01/15 12/31/15 12/31/15 Class XActual (-8.22% return) . . . . . . . . . . . . . . . . . . . . . . . . . . . . . $1,000.00 $ 917.80 $6.57Hypothetical (5% annual return before expenses) . . . . . . $1,000.00 $1,018.35 $6.92
Class YActual (-8.33% return) . . . . . . . . . . . . . . . . . . . . . . . . . . . . . $1,000.00 $ 916.70 $7.73Hypothetical (5% annual return before expenses) . . . . . . $1,000.00 $1,017.14 $8.13
@ Expenses are equal to the Portfolio’s annualized expense ratios of 1.36% and 1.60% for Class X and Class Y shares,respectively, multiplied by the average account value over the period, multiplied by 184/365 (to reflect the one-half year period).
Merrill Corp - MS Select Dimensions Annual Report [Funds] 033-54047 12-31-2015 ED [AUX] | pweakly | 18-Feb-16 15:51 | 16-1344-2.ca | Sequence: 2CHKSUM Content: 55413 Layout: 45503 Graphics: No Graphics CLEAN
JOB: 16-1344-2 CYCLE#;BL#: 8; 0 TRIM: 7.5" x 8.75" AS: Merrill New York: 212-620-5600 COMPOSITECOLORS: Black, ~note-color 2, ~note-color 3 GRAPHICS: none V1.5
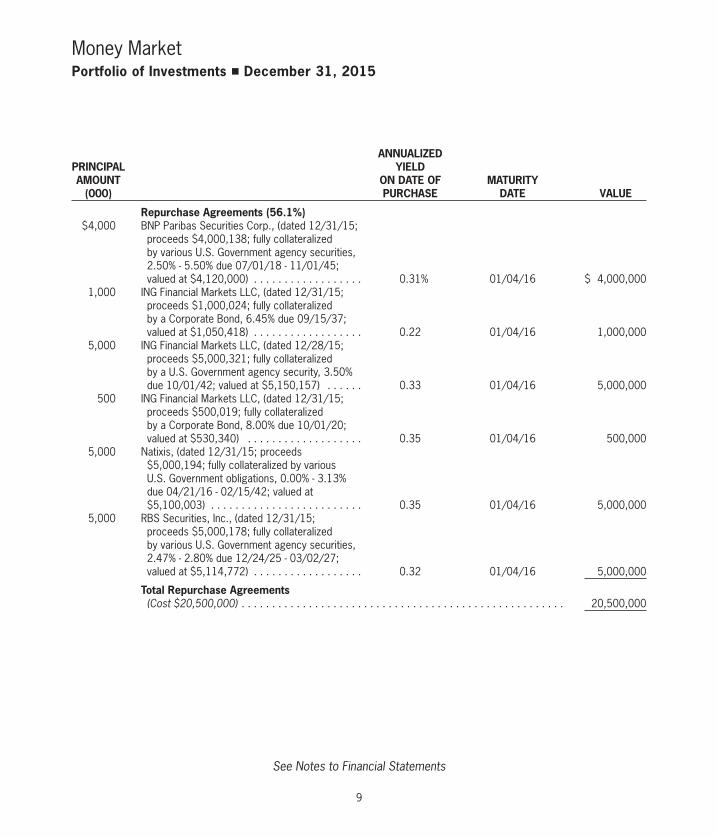
Money MarketPortfolio of Investments n December 31, 2015
Repurchase Agreements (56.1%)$4,000 BNP Paribas Securities Corp., (dated 12/31/15;
proceeds $4,000,138; fully collateralized by various U.S. Government agency securities, 2.50% - 5.50% due 07/01/18 - 11/01/45; valued at $4,120,000) . . . . . . . . . . . . . . . . . . 0.31% 01/04/16 $ 4,000,000
1,000 ING Financial Markets LLC, (dated 12/31/15; proceeds $1,000,024; fully collateralized by a Corporate Bond, 6.45% due 09/15/37; valued at $1,050,418) . . . . . . . . . . . . . . . . . . 0.22 01/04/16 1,000,000
5,000 ING Financial Markets LLC, (dated 12/28/15; proceeds $5,000,321; fully collateralized by a U.S. Government agency security, 3.50% due 10/01/42; valued at $5,150,157) . . . . . . 0.33 01/04/16 5,000,000
500 ING Financial Markets LLC, (dated 12/31/15; proceeds $500,019; fully collateralized by a Corporate Bond, 8.00% due 10/01/20; valued at $530,340) . . . . . . . . . . . . . . . . . . . 0.35 01/04/16 500,000
5,000 Natixis, (dated 12/31/15; proceeds $5,000,194; fully collateralized by various U.S. Government obligations, 0.00% - 3.13% due 04/21/16 - 02/15/42; valued at $5,100,003) . . . . . . . . . . . . . . . . . . . . . . . . . 0.35 01/04/16 5,000,000
5,000 RBS Securities, Inc., (dated 12/31/15; proceeds $5,000,178; fully collateralized by various U.S. Government agency securities, 2.47% - 2.80% due 12/24/25 - 03/02/27; valued at $5,114,772) . . . . . . . . . . . . . . . . . . 0.32 01/04/16 5,000,000
Total Repurchase Agreements (Cost $20,500,000) . . . . . . . . . . . . . . . . . . . . . . . . . . . . . . . . . . . . . . . . . . . . . . . . . . . . . 20,500,000
9
See Notes to Financial Statements
ANNUALIZED PRINCIPAL YIELD AMOUNT ON DATE OF MATURITY (000) PURCHASE DATE VALUE
Merrill Corp - MS Select Dimensions Annual Report [Funds] 033-54047 12-31-2015 ED [AUX] | pweakly | 18-Feb-16 15:51 | 16-1344-2.da | Sequence: 1CHKSUM Content: 10499 Layout: 40233 Graphics: No Graphics CLEAN
JOB: 16-1344-2 CYCLE#;BL#: 8; 0 TRIM: 7.5" x 8.75" AS: Merrill New York: 212-620-5600 COMPOSITECOLORS: Black, ~note-color 2, ~note-color 3 GRAPHICS: none V1.5

Money MarketPortfolio of Investments n December 31, 2015 continued
Other Repurchase Agreement (21.9%)$8,000 Interest in $750,000,000 joint repurchase
agreement, dated 12/31/15 under which ABN Amro Securities LLC, will repurchase the securities provided as collateral for $750,027,500 on 01/04/16. The securities provided as collateral at the end of the period held with BNY Mellon, tri-party agent, were various U.S. Government agency securities and U.S. Government obligations with various maturities to 01/20/65; valued at $772,319,593. (Cost $8,000,000) . . . . . . . 0.33% 01/04/16 $ 8,000,000
COUPON DEMAND RATE(a) DATE(b)
Floating Rate Notes (11.6%)Domestic Banks (8.9%)
1,500 JP Morgan Chase Bank NA . . . 0.61% 03/07/16 06/07/16 1,500,000 1,000 Wells Fargo Bank NA (c) . . . . . 0.60 01/20/16 06/17/16 1,000,000 750 Wells Fargo Bank NA . . . . . . . . 0.63 03/15/16 06/14/16 750,000 3,250,000
International Bank (2.7%) 1,000 Royal Bank of Canada . . . . . . . 0.45 01/04/16 06/30/16 999,984
Total Floating Rate Notes (Cost $4,249,984) . . . . . . . . . . . . . . . . . . . . . . . . . . . . . . . . . . . . . . . . . . . . . . . . . . . . . . 4,249,984
ANNUALIZED YIELD ON DATE OF PURCHASE
Time Deposits (5.5%)International Banks
1,000 Canadian Imperial Bank of Commerce . . . . . . . . 0.15% 01/04/16 1,000,000 1,000 National Australia Bank Ltd. . . . . . . . . . . . . . . . 0.10 01/04/16 1,000,000
Total Time Deposits (Cost $2,000,000) . . . . . . . . . . . . . . . . . . . . . . . . . . . . . . . . . . . . . . . . . . . . . . . . . . . . . . 2,000,000
10
See Notes to Financial Statements
ANNUALIZED PRINCIPAL YIELD AMOUNT ON DATE OF MATURITY (000) PURCHASE DATE VALUE
Merrill Corp - MS Select Dimensions Annual Report [Funds] 033-54047 12-31-2015 ED [AUX] | pweakly | 18-Feb-16 15:51 | 16-1344-2.da | Sequence: 2CHKSUM Content: 14822 Layout: 57476 Graphics: No Graphics CLEAN
JOB: 16-1344-2 CYCLE#;BL#: 8; 0 TRIM: 7.5" x 8.75" AS: Merrill New York: 212-620-5600 COMPOSITECOLORS: Black, ~note-color 2, ~note-color 3 GRAPHICS: none V1.5

Money MarketPortfolio of Investments n December 31, 2015 continued
Extendible Floating Rate Note (2.8%)International Bank
$1,000 Svenska Handelsbanken AB (c) (Extendible MaturityDate 05/13/16) (Cost $1,000,000) . . . . . . . 0.52% 01/15/16 05/13/16 $ 1,000,000
ANNUALIZED YIELD ON DATE OF PURCHASE
Commercial Paper (1.4%)International Bank
500 Danske Corp. (Cost $499,851) . . . . . . . . . . . . 0.32% 02/04/16 499,851
U.S. Agency Security (0.8%) 300 Federal Home Loan Bank (Cost $299,720) . . . . 0.48 03/11/16 299,720
Total Investments (Cost $36,549,555) (d) . . . . . . . . . . . . . . . . . . . . . . . . . . . . . . . . . 100.1% 36,549,555 Liabilities in Excess of Other Assets . . . . . . . . . . . . . . . . . . . . . . (0.1) (25,435)
Net Assets . . . . . . . . . . . . . . . . . . . . . . . . . . . . . . . . . . . . . . . . . . . 100.0% $36,524,120
(a) Rate shown is the rate in effect at December 31, 2015. (b) Date of next interest rate reset. (c) 144A security — Certain conditions for public sale may exist. Unless otherwise noted, these securities are deemed to
be liquid. (d) The aggregate cost for Federal income tax purposes approximates the aggregate cost for book purposes.
MATURITY SCHEDULE† (unaudited)
1 - 30 Days . . . . . . . . . . . . . . . . . . . . 91.6%31 - 60 Days . . . . . . . . . . . . . . . . . . . . 1.461 - 90 Days . . . . . . . . . . . . . . . . . . . . 7.0 100.0%
† As a percentage of total investments.
11
See Notes to Financial Statements
PRINCIPAL AMOUNT COUPON DEMAND MATURITY (000) RATE(a) DATE(b) DATE VALUE
Merrill Corp - MS Select Dimensions Annual Report [Funds] 033-54047 12-31-2015 ED [AUX] | pweakly | 18-Feb-16 15:51 | 16-1344-2.da | Sequence: 3CHKSUM Content: 64178 Layout: 19650 Graphics: No Graphics CLEAN
JOB: 16-1344-2 CYCLE#;BL#: 8; 0 TRIM: 7.5" x 8.75" AS: Merrill New York: 212-620-5600 COMPOSITECOLORS: Black, ~note-color 2, ~note-color 3 GRAPHICS: none V1.5

12
See Notes to Financial Statements
NUMBER OF SHARES VALUE
Mid Cap GrowthPortfolio of Investments n December 31, 2015
Hotels, Restaurants & Leisure (5.6%) 264 Chipotle Mexican Grill,
Inc. (a) . . . . . . . . . . . . . . $ 126,680 9,832 Dunkin’ Brands Group, Inc. . 418,745 5,270 Marriott International, Inc.,
Class A . . . . . . . . . . . . . . 353,301 898,726
Information Technology Services (3.3%) 2,568 FleetCor Technologies,
Inc. (a) . . . . . . . . . . . . . . 367,044 1,708 Gartner, Inc. (a) . . . . . . . . . 154,916 521,960
Internet & Catalog Retail (1.5%) 1,078 TripAdvisor, Inc. (a) . . . . . . 91,899 659 Vipshop Holdings Ltd. ADR
(China) (a) . . . . . . . . . . . . 10,063 3,444 Zalando SE
(Germany) (a)(c) . . . . . . . . 136,052 238,014
Internet Software & Services (14.8%) 5,126 Autohome, Inc. ADR
(China) (a) . . . . . . . . . . . . 179,000 15,229 Dropbox, Inc. (a)(d)(e)(f)
(acquisition cost - $137,809; acquired 05/01/12) . . . . 218,079
2,979 LinkedIn Corp., Class A (a) . 670,513 1,577 MercadoLibre, Inc. (Brazil) . 180,314 7,809 Pandora Media, Inc. (a) . . . 104,719 22,447 Twitter, Inc. (a) . . . . . . . . . 519,424 2,902 Yelp, Inc. (a) . . . . . . . . . . . 83,578 5,553 Zillow Group, Inc.,
Class A (a)(b) . . . . . . . . . . 144,600 11,105 Zillow Group, Inc.,
Class C (a)(b) . . . . . . . . . 260,745 2,360,972
Life Sciences Tools & Services (5.3%) 4,408 Illumina, Inc. (a) . . . . . . . . . 846,094
NUMBER OF SHARES VALUE
Common Stocks (92.0%)Aerospace & Defense (1.1%)
773 TransDigm Group, Inc. (a) . $ 176,592Air Freight & Logistics (0.5%)
2,858 XPO Logistics, Inc. (a)(b) . . 77,881Automobiles (4.5%)
2,993 Tesla Motors, Inc. (a)(b) . . . 718,350Beverages (3.3%)
3,562 Monster Beverage Corp. (a) . . . . . . . . . . . . . 530,596
Biotechnology (1.2%) 888 Alnylam Pharmaceuticals,
Inc. (a) . . . . . . . . . . . . . . 83,596 2,102 Intrexon Corp. (a)(b) . . . . . . 63,375 1,120 Seattle Genetics, Inc. (a) . . 50,266 197,237
Communications Equipment (0.9%) 855 Palo Alto Networks, Inc. (a) . 150,600
Consumer Finance (2.0%) 29,244 LendingClub Corp. (a) . . . . 323,146
Diversified Financial Services (5.4%) 4,803 McGraw Hill Financial, Inc. . 473,479 5,498 MSCI, Inc. . . . . . . . . . . . . . 396,571 870,050
Electrical Equipment (0.5%) 1,689 SolarCity Corp. (a)(b) . . . . . 86,173
Food Products (5.0%) 3,704 Keurig Green Mountain,
Inc. . . . . . . . . . . . . . . . . . . 333,286 5,825 Mead Johnson Nutrition Co. . 459,884 793,170
Health Care Equipment & Supplies (5.4%) 2,036 DexCom, Inc. (a) . . . . . . . . 166,748 1,288 Intuitive Surgical, Inc. (a) . . 703,454 870,202
Health Care Technology (4.3%) 4,250 athenahealth, Inc. (a) . . . . . 684,122
Merrill Corp - MS Select Dimensions Annual Report [Funds] 033-54047 12-31-2015 ED [AUX] | pweakly | 18-Feb-16 15:51 | 16-1344-2.ea | Sequence: 1CHKSUM Content: 51155 Layout: 62778 Graphics: No Graphics CLEAN
JOB: 16-1344-2 CYCLE#;BL#: 8; 0 TRIM: 7.5" x 8.75" AS: Merrill New York: 212-620-5600 COMPOSITECOLORS: Black, ~note-color 2, ~note-color 3 GRAPHICS: none V1.5
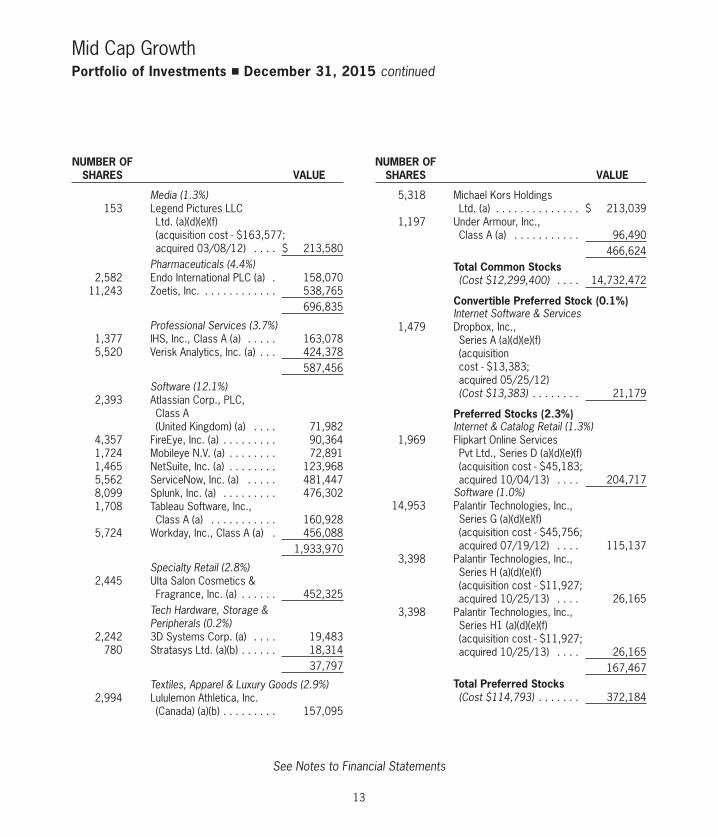
13
See Notes to Financial Statements
NUMBER OF SHARES VALUE
Mid Cap GrowthPortfolio of Investments n December 31, 2015 continued
5,318 Michael Kors Holdings Ltd. (a) . . . . . . . . . . . . . . $ 213,039
1,197 Under Armour, Inc., Class A (a) . . . . . . . . . . . 96,490
466,624 Total Common Stocks
(Cost $12,299,400) . . . . 14,732,472
Convertible Preferred Stock (0.1%)Internet Software & Services
1,479 Dropbox, Inc., Series A (a)(d)(e)(f)(acquisition cost - $13,383; acquired 05/25/12)(Cost $13,383) . . . . . . . . 21,179
Preferred Stocks (2.3%)Internet & Catalog Retail (1.3%)
1,969 Flipkart Online Services Pvt Ltd., Series D (a)(d)(e)(f)(acquisition cost - $45,183; acquired 10/04/13) . . . . 204,717
Software (1.0%) 14,953 Palantir Technologies, Inc.,
Series G (a)(d)(e)(f)(acquisition cost - $45,756; acquired 07/19/12) . . . . 115,137
3,398 Palantir Technologies, Inc., Series H (a)(d)(e)(f)(acquisition cost - $11,927; acquired 10/25/13) . . . . 26,165
3,398 Palantir Technologies, Inc., Series H1 (a)(d)(e)(f)(acquisition cost - $11,927; acquired 10/25/13) . . . . 26,165
167,467 Total Preferred Stocks
(Cost $114,793) . . . . . . . 372,184
NUMBER OF SHARES VALUE
Media (1.3%) 153 Legend Pictures LLC
Ltd. (a)(d)(e)(f)(acquisition cost - $163,577; acquired 03/08/12) . . . . $ 213,580
Pharmaceuticals (4.4%) 2,582 Endo International PLC (a) . 158,070 11,243 Zoetis, Inc. . . . . . . . . . . . . 538,765 696,835
Professional Services (3.7%) 1,377 IHS, Inc., Class A (a) . . . . . 163,078 5,520 Verisk Analytics, Inc. (a) . . . 424,378 587,456
Software (12.1%) 2,393 Atlassian Corp., PLC,
Class A (United Kingdom) (a) . . . . 71,982
4,357 FireEye, Inc. (a) . . . . . . . . . 90,364 1,724 Mobileye N.V. (a) . . . . . . . . 72,891 1,465 NetSuite, Inc. (a) . . . . . . . . 123,968 5,562 ServiceNow, Inc. (a) . . . . . 481,447 8,099 Splunk, Inc. (a) . . . . . . . . . 476,302 1,708 Tableau Software, Inc.,
Class A (a) . . . . . . . . . . . 160,928 5,724 Workday, Inc., Class A (a) . 456,088 1,933,970
Specialty Retail (2.8%) 2,445 Ulta Salon Cosmetics &
Fragrance, Inc. (a) . . . . . . 452,325Tech Hardware, Storage & Peripherals (0.2%)
2,242 3D Systems Corp. (a) . . . . 19,483 780 Stratasys Ltd. (a)(b) . . . . . . 18,314 37,797
Textiles, Apparel & Luxury Goods (2.9%) 2,994 Lululemon Athletica, Inc.
(Canada) (a)(b) . . . . . . . . . 157,095
Merrill Corp - MS Select Dimensions Annual Report [Funds] 033-54047 12-31-2015 ED [AUX] | pweakly | 18-Feb-16 15:51 | 16-1344-2.ea | Sequence: 2CHKSUM Content: 41076 Layout: 44351 Graphics: No Graphics CLEAN
JOB: 16-1344-2 CYCLE#;BL#: 8; 0 TRIM: 7.5" x 8.75" AS: Merrill New York: 212-620-5600 COMPOSITECOLORS: Black, ~note-color 2, ~note-color 3 GRAPHICS: none V1.5

14
See Notes to Financial Statements
NUMBER OF SHARES (000) VALUE
Mid Cap GrowthPortfolio of Investments n December 31, 2015 continued
Investment Company (5.1%) 810 Morgan Stanley Institutional
Liquidity Funds - Money Market Portfolio - Institutional Class (See Note 6) (Cost $810,208) . . . . . . . $ 810,208
Total Short-Term Investments (Cost $1,559,286) . . . . . 1,559,286
Total Investments (Cost $13,986,862) (g)(h) . . . . 104.2% 16,685,121
Liabilities in Excess of Other Assets . . . . . . . . . . . . (4.2) (678,551)
Net Assets . . . . . . . . . . . . . . . 100.0% $16,006,570
ADR American Depositary Receipt. (a) Non-income producing security. (b) All or a portion of this security was on loan at
December 31, 2015. (c) 144A security - Certain conditions for public sale
may exist. Unless otherwise noted, these securitiesare deemed to be liquid.
(d) Illiquid security. (e) Security cannot be offered for public resale without
first being registered under the Securities Act of1933 and related rules (“restricted security”).Acquisition date represents the day on which anenforceable right to acquire such security isobtained and is presented along with related cost inthe security description. The Portfolio hasregistration rights for certain restricted securities.Any costs related to such registration are borne bythe issuer. The aggregate value of restrictedsecurities (excluding 144A holdings) atDecember 31, 2015 amounts to $825,022 andrepresents 5.2% of net assets.
NUMBER OF SHARES (000) VALUE
Short-Term Investments (9.8%)Securities held as Collateral on Loaned Securities (4.7%)Investment Company (4.0%)
641 Morgan Stanley Institutional Liquidity Funds - Treasury Securities Portfolio - Institutional Class (See Note 6) . . . . . $ 641,099
PRINCIPAL AMOUNT (000)
Repurchase Agreements (0.7%)$ 28 Barclays Capital, Inc.
(0.32%, dated 12/31/15, due 01/04/16; proceeds $27,644; fully collateralized by a U.S. Government obligation; 2.00% due 11/30/22; valued at $28,195) . . . . . . . . . . 27,643
80 Merrill Lynch & Co., Inc. (0.31%, dated 12/31/15, due 01/04/16; proceeds $80,339; fully collateralized by a U.S. Government agency security; 4.00% due 11/20/45; valued at $81,943) . . . . . . . . . . 80,336
107,979 Total Securities held
as Collateral on Loaned Securities (Cost $749,078) . . . . . . . 749,078
Merrill Corp - MS Select Dimensions Annual Report [Funds] 033-54047 12-31-2015 ED [AUX] | pweakly | 18-Feb-16 15:51 | 16-1344-2.ea | Sequence: 3CHKSUM Content: 57575 Layout: 27594 Graphics: No Graphics CLEAN
JOB: 16-1344-2 CYCLE#;BL#: 8; 0 TRIM: 7.5" x 8.75" AS: Merrill New York: 212-620-5600 COMPOSITECOLORS: Black, ~note-color 2, ~note-color 3 GRAPHICS: none V1.5

15
See Notes to Financial Statements
SUMMARY OF INVESTMENTS PERCENT OF TOTALINDUSTRY VALUE INVESTMENTS
Mid Cap GrowthPortfolio of Investments n December 31, 2015 continued
Internet Software & Services . . . . . . . . . . . . $ 2,382,151 15.0%
Software . . . . . . . . . . . . . 2,101,437 13.2Hotels, Restaurants &
Leisure . . . . . . . . . . . . . 898,726 5.6Health Care Equipment &
Supplies . . . . . . . . . . . . 870,202 5.5Diversified Financial
Services . . . . . . . . . . . . 870,050 5.5Life Sciences Tools &
Services . . . . . . . . . . . . 846,094 5.3Investment Company . . . . 810,208 5.1Food Products . . . . . . . . . 793,170 5.0Automobiles . . . . . . . . . . . 718,350 4.5Pharmaceuticals . . . . . . . . 696,835 4.4Health Care Technology . . . 684,122 4.3Professional Services . . . . 587,456 3.7Beverages . . . . . . . . . . . . 530,596 3.3Information Technology
Services . . . . . . . . . . . . 521,960 3.3Textiles, Apparel &
Luxury Goods . . . . . . . . 466,624 2.9Specialty Retail . . . . . . . . . 452,325 2.8Internet & Catalog Retail . . 442,731 2.8Consumer Finance . . . . . . 323,146 2.0Media . . . . . . . . . . . . . . . 213,580 1.3Biotechnology . . . . . . . . . 197,237 1.2Aerospace & Defense . . . . 176,592 1.1Communications
Equipment . . . . . . . . . . . 150,600 1.0Electrical Equipment . . . . . 86,173 0.5Air Freight & Logistics . . . . 77,881 0.5Tech Hardware, Storage &
Peripherals . . . . . . . . . . 37,797 0.2 $15,936,043+ 100.0%
+ Does not reflect the value of securities held as collateralon loaned securities.
(f) At December 31, 2015, the Portfolio held fairvalued securities valued at $825,022, representing5.2% of net assets. These securities have been fairvalued as determined in good faith underprocedures established by and under the generalsupervision of the Fund’s Trustees.
(g) The fair value and percentage of net assets,$136,052 and 0.9%, respectively, represent thesecurities that have been fair valued under the fairvaluation policy for international investments asdescribed in Note 1A within the Notes to theFinancial Statements.
(h) At December 31, 2015, the aggregate cost forFederal income tax purposes is $14,157,163. Theaggregate gross unrealized appreciation is$4,116,255 and the aggregate gross unrealizeddepreciation is $1,588,297 resulting in netunrealized appreciation of $2,527,958.
Merrill Corp - MS Select Dimensions Annual Report [Funds] 033-54047 12-31-2015 ED [AUX] | pweakly | 18-Feb-16 15:51 | 16-1344-2.ea | Sequence: 4CHKSUM Content: 19461 Layout: 40580 Graphics: No Graphics CLEAN
JOB: 16-1344-2 CYCLE#;BL#: 8; 0 TRIM: 7.5" x 8.75" AS: Merrill New York: 212-620-5600 COMPOSITECOLORS: Black, ~note-color 2, ~note-color 3 GRAPHICS: none V1.5

Morgan Stanley Select Dimensions Investment SeriesFinancial Statements
Statements of Assets and LiabilitiesDecember 31, 2015
Assets:Investments in securities, at value* . . . . . . . . . . . . . . . . . . . . . . . . . . . . . . . . . . . . . . . . . . . . . . . $36,549,555(1) $15,233,814(2)
Investment in affiliate, at value** . . . . . . . . . . . . . . . . . . . . . . . . . . . . . . . . . . . . . . . . . . . . . . . . . — 1,451,307 Total investments in securities, at value . . . . . . . . . . . . . . . . . . . . . . . . . . . . . . . . . . . . . . . . . . . . 36,549,555 16,685,121Cash . . . . . . . . . . . . . . . . . . . . . . . . . . . . . . . . . . . . . . . . . . . . . . . . . . . . . . . . . . . . . . . . . . . . . 7,788 —Receivable for:
Investments sold . . . . . . . . . . . . . . . . . . . . . . . . . . . . . . . . . . . . . . . . . . . . . . . . . . . . . . . . . . . — 93,538Interest . . . . . . . . . . . . . . . . . . . . . . . . . . . . . . . . . . . . . . . . . . . . . . . . . . . . . . . . . . . . . . . . . . 2,928 —Dividends . . . . . . . . . . . . . . . . . . . . . . . . . . . . . . . . . . . . . . . . . . . . . . . . . . . . . . . . . . . . . . . . — 2,565Dividends from affiliate . . . . . . . . . . . . . . . . . . . . . . . . . . . . . . . . . . . . . . . . . . . . . . . . . . . . . . — 219Due from Adviser . . . . . . . . . . . . . . . . . . . . . . . . . . . . . . . . . . . . . . . . . . . . . . . . . . . . . . . . . . 25,232 —
Prepaid expenses and other assets . . . . . . . . . . . . . . . . . . . . . . . . . . . . . . . . . . . . . . . . . . . . . . . 6,172 4,728 Total Assets . . . . . . . . . . . . . . . . . . . . . . . . . . . . . . . . . . . . . . . . . . . . . . . . . . . . . . . . . . . . 36,591,675 16,786,171
Liabilities:Collateral on securities loaned, at value . . . . . . . . . . . . . . . . . . . . . . . . . . . . . . . . . . . . . . . . . . . . — 749,078Payable for:
Shares of beneficial interest redeemed . . . . . . . . . . . . . . . . . . . . . . . . . . . . . . . . . . . . . . . . . . . 25,947 1,018Advisory fee . . . . . . . . . . . . . . . . . . . . . . . . . . . . . . . . . . . . . . . . . . . . . . . . . . . . . . . . . . . . . . — 5,647Administration fee . . . . . . . . . . . . . . . . . . . . . . . . . . . . . . . . . . . . . . . . . . . . . . . . . . . . . . . . . . — 1,090Transfer agent fee . . . . . . . . . . . . . . . . . . . . . . . . . . . . . . . . . . . . . . . . . . . . . . . . . . . . . . . . . . 501 470Distribution fee (Class Y) . . . . . . . . . . . . . . . . . . . . . . . . . . . . . . . . . . . . . . . . . . . . . . . . . . . . . — 782
Accrued expenses and other payables . . . . . . . . . . . . . . . . . . . . . . . . . . . . . . . . . . . . . . . . . . . . . 41,107 21,516 Total Liabilities . . . . . . . . . . . . . . . . . . . . . . . . . . . . . . . . . . . . . . . . . . . . . . . . . . . . . . . . . 67,555 779,601 Net Assets . . . . . . . . . . . . . . . . . . . . . . . . . . . . . . . . . . . . . . . . . . . . . . . . . . . . . . . . . . . . . $36,524,120 $16,006,570
Composition of Net Assets:Paid-in-capital . . . . . . . . . . . . . . . . . . . . . . . . . . . . . . . . . . . . . . . . . . . . . . . . . . . . . . . . . . . . . . . $36,526,834 $12,954,359Net unrealized appreciation (depreciation) . . . . . . . . . . . . . . . . . . . . . . . . . . . . . . . . . . . . . . . . . . . — 2,698,259Accumulated net investment loss . . . . . . . . . . . . . . . . . . . . . . . . . . . . . . . . . . . . . . . . . . . . . . . . . (1,897) (875)Accumulated net realized gain (loss) . . . . . . . . . . . . . . . . . . . . . . . . . . . . . . . . . . . . . . . . . . . . . . . (817) 354,827
Net Assets . . . . . . . . . . . . . . . . . . . . . . . . . . . . . . . . . . . . . . . . . . . . . . . . . . . . . . . . . . . . . $36,524,120 $16,006,570 * Cost . . . . . . . . . . . . . . . . . . . . . . . . . . . . . . . . . . . . . . . . . . . . . . . . . . . . . . . . . . . . . . . . . . $36,549,555 $12,535,555 **Affiliated Cost . . . . . . . . . . . . . . . . . . . . . . . . . . . . . . . . . . . . . . . . . . . . . . . . . . . . . . . . . . $ — $ 1,451,307 Class X Shares:Net Assets . . . . . . . . . . . . . . . . . . . . . . . . . . . . . . . . . . . . . . . . . . . . . . . . . . . . . . . . . . . . . . . . . $13,068,207 $12,329,253Shares Outstanding (unlimited shares authorized, $0.01 par value) . . . . . . . . . . . . . . . . . . . . . . . . . 13,069,052 400,241
Net Asset Value Per Share . . . . . . . . . . . . . . . . . . . . . . . . . . . . . . . . . . . . . . . . . . . . . . . . $1.00 $30.80 Class Y Shares:Net Assets . . . . . . . . . . . . . . . . . . . . . . . . . . . . . . . . . . . . . . . . . . . . . . . . . . . . . . . . . . . . . . . . . $23,455,913 $ 3,677,317Shares Outstanding (unlimited shares authorized, $0.01 par value) . . . . . . . . . . . . . . . . . . . . . . . . . 23,456,609 124,227
Net Asset Value Per Share . . . . . . . . . . . . . . . . . . . . . . . . . . . . . . . . . . . . . . . . . . . . . . . . $1.00 $29.60 (1) Including repurchase agreements of $28,500,000.(2) Including securities loaned at value of $1,449,902.
16
See Notes to Financial Statements
Money Market Mid Cap Growth
Merrill Corp - MS Select Dimensions Annual Report [Funds] 033-54047 12-31-2015 ED [AUX] | pweakly | 18-Feb-16 15:51 | 16-1344-2.fa | Sequence: 1CHKSUM Content: 11332 Layout: 48925 Graphics: No Graphics CLEAN
JOB: 16-1344-2 CYCLE#;BL#: 8; 0 TRIM: 7.5" x 8.75" AS: Merrill New York: 212-620-5600 COMPOSITECOLORS: Black, ~note-color 2 GRAPHICS: none V1.5

Morgan Stanley Select Dimensions Investment SeriesFinancial Statements continued
Statements of OperationsFor the year ended December 31, 2015
Net Investment Income:IncomeInterest . . . . . . . . . . . . . . . . . . . . . . . . . . . . . . . . . . . . . . . . . . . . . . . . . . . . . . . . . . . . . . . . . . . $ 88,383 $ —Dividends . . . . . . . . . . . . . . . . . . . . . . . . . . . . . . . . . . . . . . . . . . . . . . . . . . . . . . . . . . . . . . . . . . — 44,065Income from securities loaned - net . . . . . . . . . . . . . . . . . . . . . . . . . . . . . . . . . . . . . . . . . . . . . . . — 25,415Interest and dividends from affiliates (Note 6) . . . . . . . . . . . . . . . . . . . . . . . . . . . . . . . . . . . . . . . . — 1,242
Total Income . . . . . . . . . . . . . . . . . . . . . . . . . . . . . . . . . . . . . . . . . . . . . . . . . . . . . . . . . . . 88,383 70,722 ExpensesAdvisory fee (Note 3) . . . . . . . . . . . . . . . . . . . . . . . . . . . . . . . . . . . . . . . . . . . . . . . . . . . . . . . . . 181,630 78,373Professional fees . . . . . . . . . . . . . . . . . . . . . . . . . . . . . . . . . . . . . . . . . . . . . . . . . . . . . . . . . . . . 90,075 86,528Distribution fee (Class Y shares) (Note 4) . . . . . . . . . . . . . . . . . . . . . . . . . . . . . . . . . . . . . . . . . . . 63,503 11,160Custodian fees . . . . . . . . . . . . . . . . . . . . . . . . . . . . . . . . . . . . . . . . . . . . . . . . . . . . . . . . . . . . . . 25,895 20,915Administration fee (Note 3) . . . . . . . . . . . . . . . . . . . . . . . . . . . . . . . . . . . . . . . . . . . . . . . . . . . . . 20,181 14,928Shareholder reports and notices . . . . . . . . . . . . . . . . . . . . . . . . . . . . . . . . . . . . . . . . . . . . . . . . . 14,291 11,984Transfer agent fees and expenses (Note 5) . . . . . . . . . . . . . . . . . . . . . . . . . . . . . . . . . . . . . . . . . . 3,565 3,444Trustees’ fees and expenses . . . . . . . . . . . . . . . . . . . . . . . . . . . . . . . . . . . . . . . . . . . . . . . . . . . . 1,259 953Other . . . . . . . . . . . . . . . . . . . . . . . . . . . . . . . . . . . . . . . . . . . . . . . . . . . . . . . . . . . . . . . . . . . . . 32,383 23,280
Expenses Before Non Operating Expenses . . . . . . . . . . . . . . . . . . . . . . . . . . . . . . . . . . . 432,782 251,565 Reorganization expenses . . . . . . . . . . . . . . . . . . . . . . . . . . . . . . . . . . . . . . . . . . . . . . . . . . . . . . . 18,248 —
Total Expenses . . . . . . . . . . . . . . . . . . . . . . . . . . . . . . . . . . . . . . . . . . . . . . . . . . . . . . . . . 451,030 251,565 Less: amounts waived/reimbursed (Note 4) . . . . . . . . . . . . . . . . . . . . . . . . . . . . . . . . . . . . . . . . . (366,687) —Less: rebate from Morgan Stanley affiliated cash sweep (Note 6) . . . . . . . . . . . . . . . . . . . . . . . . . . — (686)
Net Expenses . . . . . . . . . . . . . . . . . . . . . . . . . . . . . . . . . . . . . . . . . . . . . . . . . . . . . . . . . . 84,343 250,879 Net Investment Income (Loss) . . . . . . . . . . . . . . . . . . . . . . . . . . . . . . . . . . . . . . . . . . . . . 4,040 (180,157)
Realized and Unrealized Gain (Loss):Realized Gain on:Investments . . . . . . . . . . . . . . . . . . . . . . . . . . . . . . . . . . . . . . . . . . . . . . . . . . . . . . . . . . . . . . . . 93 382,939Foreign currency translation . . . . . . . . . . . . . . . . . . . . . . . . . . . . . . . . . . . . . . . . . . . . . . . . . . . . — 9
Net Realized Gain . . . . . . . . . . . . . . . . . . . . . . . . . . . . . . . . . . . . . . . . . . . . . . . . . . . . . 93 382,948 Change in Unrealized Appreciation (Depreciation) on:Investments . . . . . . . . . . . . . . . . . . . . . . . . . . . . . . . . . . . . . . . . . . . . . . . . . . . . . . . . . . . . . . . . — (1,298,561)
Net Gain (Loss) . . . . . . . . . . . . . . . . . . . . . . . . . . . . . . . . . . . . . . . . . . . . . . . . . . . . . . . 93 (915,613) Net Increase (Decrease) . . . . . . . . . . . . . . . . . . . . . . . . . . . . . . . . . . . . . . . . . . . . . . . . . . . . . $ 4,133 $(1,095,770)
17
See Notes to Financial Statements
Money Market Mid Cap Growth
Merrill Corp - MS Select Dimensions Annual Report [Funds] 033-54047 12-31-2015 ED [AUX] | pweakly | 18-Feb-16 15:51 | 16-1344-2.fa | Sequence: 2CHKSUM Content: 59864 Layout: 27455 Graphics: No Graphics CLEAN
JOB: 16-1344-2 CYCLE#;BL#: 8; 0 TRIM: 7.5" x 8.75" AS: Merrill New York: 212-620-5600 COMPOSITECOLORS: Black, ~note-color 2 GRAPHICS: none V1.5
Morgan Stanley Select Dimensions Investment SeriesFinancial Statements continued
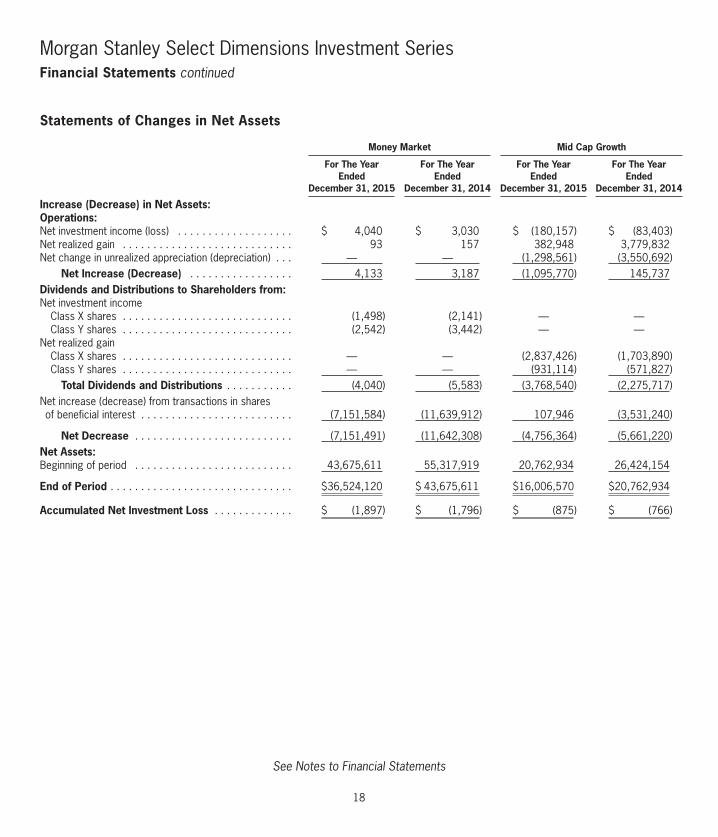
Statements of Changes in Net Assets
Increase (Decrease) in Net Assets:Operations:Net investment income (loss) . . . . . . . . . . . . . . . . . . . $ 4,040 $ 3,030 $ (180,157) $ (83,403)Net realized gain . . . . . . . . . . . . . . . . . . . . . . . . . . . . 93 157 382,948 3,779,832Net change in unrealized appreciation (depreciation) . . . — — (1,298,561) (3,550,692)
Net Increase (Decrease) . . . . . . . . . . . . . . . . . 4,133 3,187 (1,095,770) 145,737 Dividends and Distributions to Shareholders from:Net investment income
Class X shares . . . . . . . . . . . . . . . . . . . . . . . . . . . . (1,498) (2,141) — —Class Y shares . . . . . . . . . . . . . . . . . . . . . . . . . . . . (2,542) (3,442) — —
Net realized gainClass X shares . . . . . . . . . . . . . . . . . . . . . . . . . . . . — — (2,837,426) (1,703,890)Class Y shares . . . . . . . . . . . . . . . . . . . . . . . . . . . . — — (931,114) (571,827)
Total Dividends and Distributions . . . . . . . . . . . (4,040) (5,583) (3,768,540) (2,275,717) Net increase (decrease) from transactions in shares of beneficial interest . . . . . . . . . . . . . . . . . . . . . . . . . (7,151,584) (11,639,912) 107,946 (3,531,240)
Net Decrease . . . . . . . . . . . . . . . . . . . . . . . . . . (7,151,491) (11,642,308) (4,756,364) (5,661,220) Net Assets:Beginning of period . . . . . . . . . . . . . . . . . . . . . . . . . . 43,675,611 55,317,919 20,762,934 26,424,154
End of Period . . . . . . . . . . . . . . . . . . . . . . . . . . . . . . $36,524,120 $ 43,675,611 $16,006,570 $20,762,934
Accumulated Net Investment Loss . . . . . . . . . . . . . $ (1,897) $ (1,796) $ (875) $ (766)
18
See Notes to Financial Statements
Money Market Mid Cap Growth For The Year For The Year For The Year For The Year Ended Ended Ended Ended December 31, 2015 December 31, 2014 December 31, 2015 December 31, 2014
Merrill Corp - MS Select Dimensions Annual Report [Funds] 033-54047 12-31-2015 ED [AUX] | pweakly | 18-Feb-16 15:51 | 16-1344-2.fa | Sequence: 3CHKSUM Content: 6513 Layout: 3617 Graphics: No Graphics CLEAN
JOB: 16-1344-2 CYCLE#;BL#: 8; 0 TRIM: 7.5" x 8.75" AS: Merrill New York: 212-620-5600 COMPOSITECOLORS: Black, ~note-color 2 GRAPHICS: none V1.5

Morgan Stanley Select Dimensions Investment SeriesFinancial Statements continued
Statements of Changes in Net Assets continuedSummary of Transactions in Shares of Beneficial Interest
Class X SharesSharesSold . . . . . . . . . . . . . . . . . . . . . . . . . . . . . . . . . . . . . . 2,539,935 6,484,695 2,555 7,210Reinvestment of dividends and distributions . . . . . . . . . 1,498 2,141 84,548 41,906Redeemed . . . . . . . . . . . . . . . . . . . . . . . . . . . . . . . . . (6,482,022) (10,564,382) (66,741) (101,288) Net Increase (Decrease) - Class X . . . . . . . . . . . . . . (3,940,589) (4,077,546) 20,362 (52,172) AmountSold . . . . . . . . . . . . . . . . . . . . . . . . . . . . . . . . . . . . . . $ 2,539,935 $ 6,484,695 $ 105,716 $ 318,183Reinvestment of dividends and distributions . . . . . . . . . 1,498 2,141 2,837,426 1,703,890Redeemed . . . . . . . . . . . . . . . . . . . . . . . . . . . . . . . . . (6,482,022) (10,564,382) (2,546,939) (4,289,499) Net Increase (Decrease) - Class X . . . . . . . . . . . . . . $ (3,940,589) $ (4,077,546) $ 396,203 $(2,267,426)
Class Y SharesSharesSold . . . . . . . . . . . . . . . . . . . . . . . . . . . . . . . . . . . . . . 13,628,106 11,744,583 1,252 8,029Reinvestment of dividends and distributions . . . . . . . . . 2,542 3,442 28,836 14,469Redeemed . . . . . . . . . . . . . . . . . . . . . . . . . . . . . . . . . (16,841,643) (19,310,391) (34,960) (52,046) Net Decrease - Class Y . . . . . . . . . . . . . . . . . . . . . . (3,210,995) (7,562,366) (4,872) (29,548) AmountSold . . . . . . . . . . . . . . . . . . . . . . . . . . . . . . . . . . . . . . $ 13,628,106 $ 11,744,583 $ 38,404 $ 354,926Reinvestment of dividends and distributions . . . . . . . . . 2,542 3,442 931,114 571,827Redeemed . . . . . . . . . . . . . . . . . . . . . . . . . . . . . . . . . (16,841,643) (19,310,391) (1,257,775) (2,190,567) Net Decrease - Class Y . . . . . . . . . . . . . . . . . . . . . . $ (3,210,995) $ (7,562,366) $ (288,257) $(1,263,814)
19
See Notes to Financial Statements
Money Market Mid Cap Growth For The Year For The Year For The Year For The Year Ended Ended Ended Ended December 31, 2015 December 31, 2014 December 31, 2015 December 31, 2014
Merrill Corp - MS Select Dimensions Annual Report [Funds] 033-54047 12-31-2015 ED [AUX] | pweakly | 18-Feb-16 15:51 | 16-1344-2.fa | Sequence: 4CHKSUM Content: 38123 Layout: 32531 Graphics: No Graphics CLEAN
JOB: 16-1344-2 CYCLE#;BL#: 8; 0 TRIM: 7.5" x 8.75" AS: Merrill New York: 212-620-5600 COMPOSITECOLORS: Black, ~note-color 2 GRAPHICS: none V1.5

Morgan Stanley Select Dimensions Investment SeriesNotes to Financial Statements n December 31, 2015
20
1. Organization and Accounting PoliciesMorgan Stanley Select Dimensions Investment Series (the “Fund”) is registered under the InvestmentCompany Act of 1940, as amended (the “Act”), as an open-end management investment company. TheFund is offered exclusively to life insurance companies in connection with particular life insurance and/orannuity contracts they offer. The Fund applies investment company accounting and reporting guidance.
The Fund consists of two separate portfolios, the Money Market Portolio and the Mid Cap Growth Portfolio(“Portfolios”). The Fund was organized on June 2, 1994 as a Massachusetts business trust and commencedoperations on November 9, 1994. Each Portfolio is classified as diversified.
On July 24, 2000, the Fund commenced offering one additional class of shares (Class Y shares). EachPortfolio currently offers two share classes — Class X shares and Class Y shares. The two classes areidentical except that Class Y shares incur distribution expenses. Class X shares are generally available toholders of contracts offered before May 1, 2000. Class Y shares are available to holders of contracts offeredon or after July 24, 2000.
Effective at the close of business on May 30, 2014, the Fund suspended offering Class X and Class Y sharesof the Mid Cap Growth Portfolio to new investors. The Fund will continue to offer each class to existingshareholders and may recommence offering to new investors in the future. Any such offerings of thePortfolio’s Class X and Class Y shares may be limited in amount and may commence and terminate withoutany prior notice.
The investment objectives of each Portfolio are as follows:
The following is a summary of significant accounting policies:
A. Valuation of Investments — Money Market: Portfolio securities are valued at amortized cost, whichapproximates fair value, in accordance with Rule 2a-7 under the Act. The amortized cost of an instrument isdetermined by valuing it at its original cost and thereafter amortizing any discount or premium from its facevalue at a constant rate until maturity. The remaining Portfolio: (1) an equity portfolio security listed ortraded on an exchange is valued at its latest reported sales price (or at the exchange official closing price ifsuch exchange reports an official closing price), if there were no sales on a given day, the security is valued at
PORTFOLIO INVESTMENT OBJECTIVE
Money Market Seeks high current income, preservation of capital and liquidity. Mid Cap Growth Seeks long-term capital growth.
Merrill Corp - MS Select Dimensions Annual Report [Funds] 033-54047 12-31-2015 ED [AUX] | thunt | 19-Feb-16 14:26 | 16-1344-2.ha | Sequence: 1CHKSUM Content: 50114 Layout: 24884 Graphics: No Graphics CLEAN
JOB: 16-1344-2 CYCLE#;BL#: 9; 0 TRIM: 7.5" x 8.75" AS: Merrill New York: 212-620-5600 COMPOSITECOLORS: Black, ~note-color 2, ~note-color 3 GRAPHICS: none V1.5

Morgan Stanley Select Dimensions Investment SeriesNotes to Financial Statements n December 31, 2015 continued
21
the mean between the last reported bid and asked prices; (2) all other equity portfolio securities for whichover-the-counter (“OTC”) market quotations are readily available are valued at its latest reported sales price.In cases where a security is traded on more than one exchange, the security is valued on the exchangedesignated as the primary market; (3) quotations of foreign portfolio securities, other assets and liabilitiesand forward contracts stated in foreign currency are translated into U.S. dollar equivalents at the prevailingmarket rates prior to the close of the New York Stock Exchange (“NYSE”); (4) when market quotations arenot readily available, including circumstances under which Morgan Stanley Investment Management Inc.(the “Adviser”), a wholly owned subsidiary of Morgan Stanley, determines that the closing price, last saleprice or the mean between the last reported bid and asked prices are not reflective of a security’s marketvalue, portfolio securities are valued at their fair value as determined in good faith under proceduresestablished by and under the general supervision of the Fund’s Board of Trustees (the “Trustees”).Occasionally, developments affecting the closing prices of securities and other assets may occur between thetimes at which valuations of such securities are determined (that is, close of the foreign market on which thesecurities trade) and the close of business on the NYSE. If developments occur during such periods that areexpected to materially affect the value of such securities, such valuations may be adjusted to reflect theestimated fair value of such securities as of the close of the NYSE, as determined in good faith by theTrustees or by the Adviser using a pricing service and/or procedures approved by the Trustees;(5) investments in mutual funds, including the Morgan Stanley Institutional Liquidity Funds, are valued atthe NAV as of the close of each business day; and (6) short-term debt securities with remaining maturities of60 days or less at the time of purchase may be valued at amortized cost, unless the Adviser determines suchvaluation does not reflect the securities’ market value, in which case these securities will be valued at theirfair market value determined by the Adviser.
The Trustees have responsibility for determining in good faith the fair value of the investments, and theTrustees may appoint others, such as the Fund’s Adviser or a valuation committee, to assist the Trustees indetermining fair value and to make the actual calculations pursuant to the fair valuation methodologiespreviously approved by the Trustees. Under procedures approved by the Trustees, the Fund’s Adviser hasformed a Valuation Committee whose members are approved by the Trustees. The Valuation Committeeprovides administration and oversight of the Fund’s valuation policies and procedures, which are reviewed atleast annually by the Trustees. These procedures allow the Fund to utilize independent pricing services,quotations from securities and financial instrument dealers, and other market sources to determine fair value.
The Fund has procedures to determine the fair value of securities and other financial instruments for whichmarket prices are not readily available. Under these procedures, the Valuation Committee convenes on a
Merrill Corp - MS Select Dimensions Annual Report [Funds] 033-54047 12-31-2015 ED [AUX] | thunt | 19-Feb-16 14:26 | 16-1344-2.ha | Sequence: 2CHKSUM Content: 3458 Layout: 58128 Graphics: No Graphics CLEAN
JOB: 16-1344-2 CYCLE#;BL#: 9; 0 TRIM: 7.5" x 8.75" AS: Merrill New York: 212-620-5600 COMPOSITECOLORS: Black, ~note-color 2, ~note-color 3 GRAPHICS: none V1.5

Morgan Stanley Select Dimensions Investment SeriesNotes to Financial Statements n December 31, 2015 continued
22
regular and ad hoc basis to review such securities and considers a number of factors, including valuationmethodologies and significant unobservable valuation inputs, when arriving at fair value. The ValuationCommittee may employ a market-based approach which may use related or comparable assets or liabilities,recent transactions, market multiples, book values, and other relevant information for the investment todetermine the fair value of the investment. An income-based valuation approach may also be used in whichthe anticipated future cash flows of the investment are discounted to calculate fair value. Discounts may alsobe applied due to the nature or duration of any restrictions on the disposition of the investments. Due to theinherent uncertainty of valuations of such investments, the fair values may differ significantly from thevalues that would have been used had an active market existed. The Valuation Committee employs variousmethods for calibrating these valuation approaches including a regular review of valuation methodologies,key inputs and assumptions, transactional back-testing or disposition analysis, and reviews of any relatedmarket activity.
B. Accounting for Investments — Security transactions are accounted for on the trade date (date theorder to buy or sell is executed). Realized gains and losses on security transactions are determined by theidentified cost method. Dividend income and other distributions are recorded on the ex-dividend date,except for certain dividends on foreign securities which are recorded as soon as the Fund is informed afterthe ex-dividend date. Interest income is accrued daily as earned except where collection is not expected.Discounts are accreted and premiums are amortized over the life of the respective securities and areincluded in interest income.
C. Repurchase Agreements — The Fund invests directly with institutions in repurchase agreements.The Fund’s custodian receives the collateral, which is marked-to-market daily to determine that the value ofthe collateral does not decrease below the repurchase price plus accrued interest as earned. If such a decreaseoccurs, additional collateral will be requested and, when received, will be added to the account to maintainfull collateralization.
Certain Portfolios may enter into repurchase agreements in which eligible securities are transferred intojoint trading accounts maintained by the custodian for investment companies advised by the Fund’s Adviser.The Portfolio will participate on a pro rata basis with the other investment companies in its share of thesecurities transferred under such repurchase agreements and in its share of proceeds from any repurchase orother disposition of such securities.
Repurchase agreements are subject to Master Repurchase Agreements, which are agreements between theFund and its counterparties that typically include provisions which provide for the net settlement of all
Merrill Corp - MS Select Dimensions Annual Report [Funds] 033-54047 12-31-2015 ED [AUX] | thunt | 19-Feb-16 14:26 | 16-1344-2.ha | Sequence: 3CHKSUM Content: 1696 Layout: 44608 Graphics: No Graphics CLEAN
JOB: 16-1344-2 CYCLE#;BL#: 9; 0 TRIM: 7.5" x 8.75" AS: Merrill New York: 212-620-5600 COMPOSITECOLORS: Black, ~note-color 2, ~note-color 3 GRAPHICS: none V1.5

Morgan Stanley Select Dimensions Investment SeriesNotes to Financial Statements n December 31, 2015 continued
23
transactions and collateral with the Fund, through a single payment, in the event of default or termination.Amounts presented on the Portfolio of Investments and Statements of Assets and Liabilities are not netsettlement amounts but gross. As indicated on the Portfolio of Investments, the cash or securities to berepurchased exceeds the repurchase price to be paid under the agreement reducing the net settlementamount to zero.
D. Multiple Class Allocations — Investment income, expenses (other than distribution fees), and realizedand unrealized gains and losses are allocated to each class of shares based upon the relative net asset value onthe date such items are recognized. Distribution fees are charged directly to the respective class.
E. Foreign Currency Translation and Foreign Investments — The books and records of the Portfoliosare maintained in U.S. dollars. Foreign currency amounts are translated into U.S. dollars as follows:
— investments, other assets and liabilities at the prevailing rate of exchange on the valuation date;
— investment transactions and investment income at the prevailing rates of exchange on the dates ofsuch transactions.
Although the net assets of the Portfolios are presented at the foreign exchange rates and market values at theclose of the period, the Portfolios do not isolate that portion of the results of operations arising as a result ofchanges in the foreign exchange rates from the fluctuations arising from changes in the market prices ofsecurities held at period end. Similarly, the Portfolios do not isolate the effect of changes in foreign exchangerates from the fluctuations arising from changes in the market prices of securities sold during the period.Accordingly, realized and unrealized foreign currency gains (losses) on investments in securities are includedin the reported net realized and unrealized gains (losses) on investment transactions and balances. However,pursuant to U.S. Federal income tax regulations, gains and losses from certain foreign currency transactionsand the foreign currency portion of gains and losses realized on sales and maturities of foreign denominateddebt securities are treated as ordinary income for U.S. Federal income tax purposes.
Net realized gains (losses) on foreign currency transactions represent net foreign exchange gains (losses)from foreign currency forward exchange contracts, disposition of foreign currencies, currency gains (losses)realized between the trade and settlement dates on securities transactions, and the difference between theamount of investment income and foreign withholding taxes recorded on the Portfolios’ books and theU.S. dollar equivalent amounts actually received or paid. Net unrealized currency gains (losses) fromvaluing foreign currency denominated assets and liabilities at period end exchange rates are reflected as a
Merrill Corp - MS Select Dimensions Annual Report [Funds] 033-54047 12-31-2015 ED [AUX] | thunt | 19-Feb-16 14:26 | 16-1344-2.ha | Sequence: 4CHKSUM Content: 47048 Layout: 15404 Graphics: No Graphics CLEAN
JOB: 16-1344-2 CYCLE#;BL#: 9; 0 TRIM: 7.5" x 8.75" AS: Merrill New York: 212-620-5600 COMPOSITECOLORS: Black, ~note-color 2, ~note-color 3 GRAPHICS: none V1.5
Morgan Stanley Select Dimensions Investment SeriesNotes to Financial Statements n December 31, 2015 continued
24
component of unrealized appreciation (depreciation) in the Statements of Assets and Liabilities. The changein unrealized currency gains (losses) on foreign currency translations for the period is reflected in theStatements of Operations.
F. Restricted Securities — Certain Portfolios may invest in unregistered or otherwise restrictedsecurities. The term “restricted securities” refers to securities that are unregistered or are held by controlpersons of the issuer and securities that are subject to contractual restrictions on their resale. As a result,restricted securities may be more difficult to value and the Portfolio may have difficulty disposing of suchassets either in a timely manner or for a reasonable price. In order to dispose of an unregistered security, thePortfolio, where it has contractual rights to do so, may have to cause such security to be registered. Aconsiderable period may elapse between the time the decision is made to sell the security and the time thesecurity is registered so that the Portfolio could sell it. Contractual restrictions on the resale of securities varyin length and scope and are generally the result of a negotiation between the issuer and acquirer of thesecurities. The Portfolio would, in either case, bear market risks during that period. Restricted securities, ifany, are identified in the Portfolio of Investments.
G. Securities Lending — Certain Portfolios may lend securities to qualified financial institutions, such asbroker-dealers, to earn additional income. Any increase or decrease in the fair value of the securities loanedthat might occur and any interest earned or dividends declared on those securities during the term of theloan would remain in the Portfolio. The Portfolio receives cash or securities as collateral in an amount equalto or exceeding 100% of the current fair value of the loaned securities. The collateral is marked-to-marketdaily by State Street Bank and Trust Company (“State Street”), the securities lending agent, to ensure that aminimum of 100% collateral coverage is maintained.
Based on pre-established guidelines, the securities lending agent invests any cash collateral that is received inan affiliated money market portfolio and repurchase agreements. Securities lending income is generatedfrom the earnings on the invested collateral and borrowing fees, less any rebates owed to the borrowers andcompensation to the lending agent, and is recorded as “Income from Securities Loaned-Net” in thePortfolio’s Statement of Operations.
A Portfolio has the right under the lending agreement to recover the securities from the borrower ondemand.
Merrill Corp - MS Select Dimensions Annual Report [Funds] 033-54047 12-31-2015 ED [AUX] | thunt | 19-Feb-16 14:26 | 16-1344-2.ha | Sequence: 5CHKSUM Content: 5733 Layout: 44608 Graphics: No Graphics CLEAN
JOB: 16-1344-2 CYCLE#;BL#: 9; 0 TRIM: 7.5" x 8.75" AS: Merrill New York: 212-620-5600 COMPOSITECOLORS: Black, ~note-color 2, ~note-color 3 GRAPHICS: none V1.5

Morgan Stanley Select Dimensions Investment SeriesNotes to Financial Statements n December 31, 2015 continued
25
The following table presents financial instruments that are subject to enforceable netting arrangements as ofDecember 31, 2015.
GROSS AMOUNTS NOT OFFSET IN THE STATEMENTS OF ASSETS AND LIABILITIES GROSS ASSET AMOUNTS PRESENTED IN STATEMENTS FINANCIAL COLLATERAL NET AMOUNTPORTFOLIO OF ASSETS AND LIABILITIES INSTRUMENT RECEIVED (NOT LESS THAN $0) Mid Cap Growth . . . $1,449,902(a) $— $(1,449,902)(b)(c) $0
(a) Represents market value of loaned securities at period end.(b) The Portfolio received cash collateral of $749,078, which was subsequently invested in Repurchase Agreements and Morgan
Stanley Institutional Liquidity Funds as reported in the Portfolio of Investments. In addition, the Portfolio received non-cash collateral of $735,723 in the form of U.S. Government obligations, which the Portfolio cannot sell or repledge, and accordinglyare not reflected in the Portfolio of Investments.
(c) The actual collateral received is greater than the amount shown here due to overcollateralization.
The Portfolio has adopted the disclosure provisions of FASB Accounting Standards Update No. 2014-11(“ASU No. 2014-11”), “Transfers & Servicing (Topic 860): Repurchase-to-Maturity Transactions, RepurchaseFinancings, and Disclosures”. ASU No. 2014-11 is intended to provide increased transparency about thetypes of collateral pledged in securities lending transactions and other similar transactions that are accountedfor as secured borrowing.
The following table displays a breakdown of transactions accounted for as secured borrowings, the grossobligations by class of collateral pledged, and the remaining contractual maturity of those transactions as ofDecember 31, 2015.
REMAINING CONTRACTUAL MATURITY OF THE AGREEMENTS AS OF DECEMBER 31, 2015 OVERNIGHT AND BETWEEN PORTFOLIO CONTINUOUS <30 DAYS 30 & 90 DAYS >90 DAYS TOTAL Mid Cap GrowthSecurities Lending Transactions
Common Stocks . . . . . . . . . . . . . . $749,078 $— $— $— $749,078Total Borrowings . . . . . . . . . . . . . . . $749,078 $— $— $— $749,078Gross amount of recognized liabilities for securities lending transactions $749,078
Merrill Corp - MS Select Dimensions Annual Report [Funds] 033-54047 12-31-2015 ED [AUX] | thunt | 19-Feb-16 14:26 | 16-1344-2.ha | Sequence: 6CHKSUM Content: 5825 Layout: 26631 Graphics: No Graphics CLEAN
JOB: 16-1344-2 CYCLE#;BL#: 9; 0 TRIM: 7.5" x 8.75" AS: Merrill New York: 212-620-5600 COMPOSITECOLORS: Black, ~note-color 2, ~note-color 3 GRAPHICS: none V1.5

Morgan Stanley Select Dimensions Investment SeriesNotes to Financial Statements n December 31, 2015 continued
26
H. Dividends and Distributions to Shareholders — Dividends and distributions to shareholders arerecorded on the ex-dividend date. Dividends from net investment income, if any, are declared and paidannually (except for Money Market, which declares and pays daily). Net realized capital gains, if any, aredistributed at least annually.
I. Expenses — Direct expenses are charged to the respective Portfolio and general Fund expenses areallocated on the basis of relative net assets or equally among the Portfolios.
J. Use of Estimates — The preparation of financial statements in accordance with generally acceptedaccounting principles in the United States (“GAAP”) requires management to make estimates andassumptions that affect the reported amounts and disclosures. Actual results could differ from those estimates.
K. Indemnifications — The Fund enters into contracts that contain a variety of indemnifications. TheFund’s maximum exposure under these arrangements is unknown. However, the Fund has not had priorclaims or losses pursuant to these contracts and expects the risk of loss to be remote.
2. Fair Valuation MeasurementsFinancial Accounting Standards Board (“FASB”) Accounting Standards CodificationTM (“ASC”) 820, “FairValue Measurement” (“ASC 820”), defines fair value as the value that the Fund would receive to sell aninvestment or pay to transfer a liability in a timely transaction with an independent buyer in the principalmarket, or in the absence of a principal market the most advantageous market for the investment or liability.ASC 820 establishes a three-tier hierarchy to distinguish between (1) inputs that reflect the assumptionsmarket participants would use in valuing an asset or liability developed based on market data obtained fromsources independent of the reporting entity (observable inputs); and (2) inputs that reflect the reportingentity’s own assumptions about the assumptions market participants would use in valuing an asset or liabilitydeveloped based on the best information available in the circumstances (unobservable inputs) and to establishclassification of fair value measurements for disclosure purposes. Various inputs are used in determining thevalue of the Fund’s investments. The inputs are summarized in the three broad levels listed below.
• Level 1 — unadjusted quoted prices in active markets for identical investments
• Level 2 — other significant observable inputs (including quoted prices for similarinvestments, interest rates, prepayment speeds, credit risk, etc.)
• Level 3 — significant unobservable inputs including the Fund’s own assumptions indetermining the fair value of investments. Factors considered in making this
Merrill Corp - MS Select Dimensions Annual Report [Funds] 033-54047 12-31-2015 ED [AUX] | thunt | 19-Feb-16 14:26 | 16-1344-2.ha | Sequence: 7CHKSUM Content: 4485 Layout: 44608 Graphics: No Graphics CLEAN
JOB: 16-1344-2 CYCLE#;BL#: 9; 0 TRIM: 7.5" x 8.75" AS: Merrill New York: 212-620-5600 COMPOSITECOLORS: Black, ~note-color 2, ~note-color 3 GRAPHICS: none V1.5

Morgan Stanley Select Dimensions Investment SeriesNotes to Financial Statements n December 31, 2015 continued
27
determination may include, but are not limited to, information obtained by contacting theissuer, analysts, or the appropriate stock exchange (for exchange-traded securities), analysisof the issuer’s financial statements or other available documents and, if necessary, availableinformation concerning other securities in similar circumstances
The inputs or methodology used for valuing securities are not necessarily an indication of the risk associatedwith investing in those securities and the determination of the significance of a particular input to the fairvalue measurement in its entirety requires judgment and considers factors specific to each security.
The following is a summary of the inputs used to value each Portfolio’s investments as of December 31, 2015.
Level 2 Other Level 3 Level 1 Significant Significant Unadjusted Observable Unobservable Investment Type Quoted Prices Inputs Inputs Total
Money MarketAssets:Repurchase Agreements . . . . . . . . . . . . . . . . . . . . . . $ — $20,500,000 $ — $20,500,000Other Repurchase Agreement . . . . . . . . . . . . . . . . . . — 8,000,000 — 8,000,000Floating Rate Notes . . . . . . . . . . . . . . . . . . . . . . . . . . — 4,249,984 — 4,249,984Time Deposits . . . . . . . . . . . . . . . . . . . . . . . . . . . . . . . — 2,000,000 — 2,000,000Extendible Floating Rate Note . . . . . . . . . . . . . . . . . — 1,000,000 — 1,000,000Commercial Paper . . . . . . . . . . . . . . . . . . . . . . . . . . . — 499,851 — 499,851U.S. Agency Security . . . . . . . . . . . . . . . . . . . . . . . . . — 299,720 — 299,720
Total Assets . . . . . . . . . . . . . . . . . . . . . . . . . . . . . . . . . $ — $36,549,555 $ — $36,549,555
Mid Cap GrowthAssets:Common Stocks
Aerospace & Defense . . . . . . . . . . . . . . . . . . . . . . . . $ 176,592 $ — $ — $ 176,592Air Freight & Logistics . . . . . . . . . . . . . . . . . . . . . . 77,881 — — 77,881Automobiles . . . . . . . . . . . . . . . . . . . . . . . . . . . . . . . 718,350 — — 718,350Beverages . . . . . . . . . . . . . . . . . . . . . . . . . . . . . . . . . . 530,596 — — 530,596Biotechnology . . . . . . . . . . . . . . . . . . . . . . . . . . . . . . 197,237 — — 197,237Communications Equipment . . . . . . . . . . . . . . . . . 150,600 — — 150,600Consumer Finance . . . . . . . . . . . . . . . . . . . . . . . . . . 323,146 — — 323,146Diversified Financial Services . . . . . . . . . . . . . . . . 870,050 — — 870,050Electrical Equipment . . . . . . . . . . . . . . . . . . . . . . . . 86,173 — — 86,173Food Products . . . . . . . . . . . . . . . . . . . . . . . . . . . . . 793,170 — — 793,170Health Care Equipment & Supplies . . . . . . . . . . . 870,202 — — 870,202
Merrill Corp - MS Select Dimensions Annual Report [Funds] 033-54047 12-31-2015 ED [AUX] | thunt | 19-Feb-16 14:26 | 16-1344-2.ha | Sequence: 8CHKSUM Content: 63321 Layout: 58128 Graphics: No Graphics CLEAN
JOB: 16-1344-2 CYCLE#;BL#: 9; 0 TRIM: 7.5" x 8.75" AS: Merrill New York: 212-620-5600 COMPOSITECOLORS: Black, ~note-color 2, ~note-color 3 GRAPHICS: none V1.5

Morgan Stanley Select Dimensions Investment SeriesNotes to Financial Statements n December 31, 2015 continued
28
Level 2 Other Level 3 Level 1 Significant Significant Unadjusted Observable Unobservable Investment Type Quoted Prices Inputs Inputs Total
Health Care Technology . . . . . . . . . . . . . . . . . . . . . $ 684,122 $ — $ — $ 684,122Hotels, Restaurants & Leisure . . . . . . . . . . . . . . . . 898,726 — — 898,726Information Technology Services . . . . . . . . . . . . . 521,960 — — 521,960Internet & Catalog Retail . . . . . . . . . . . . . . . . . . . . 101,962 136,052 — 238,014Internet Software & Services . . . . . . . . . . . . . . . . . . 2,142,893 — 218,079 2,360,972Life Sciences Tools & Services . . . . . . . . . . . . . . . . 846,094 — — 846,094Media . . . . . . . . . . . . . . . . . . . . . . . . . . . . . . . . . . . . . — — 213,580 213,580Pharmaceuticals . . . . . . . . . . . . . . . . . . . . . . . . . . . . 696,835 — — 696,835Professional Services . . . . . . . . . . . . . . . . . . . . . . . . 587,456 — — 587,456Software . . . . . . . . . . . . . . . . . . . . . . . . . . . . . . . . . . . 1,933,970 — — 1,933,970Specialty Retail . . . . . . . . . . . . . . . . . . . . . . . . . . . . . 452,325 — — 452,325Tech Hardware, Storage & Peripherals . . . . . . . . . 37,797 — — 37,797Textiles, Apparel & Luxury Goods . . . . . . . . . . . . 466,624 — — 466,624
Total Common Stocks . . . . . . . . . . . . . . . . . . . . . . . . 14,164,761 136,052 431,659 14,732,472
Convertible Preferred Stock . . . . . . . . . . . . . . . . . . . — — 21,179 21,179Preferred Stocks . . . . . . . . . . . . . . . . . . . . . . . . . . . . . — — 372,184 372,184Short-Term Investments
Investment Company . . . . . . . . . . . . . . . . . . . . . . . 1,451,307 — — 1,451,307Repurchase Agreements . . . . . . . . . . . . . . . . . . . . . — 107,979 — 107,979
Total Short-Term Investments . . . . . . . . . . . . . . . . . 1,451,307 107,979 — 1,559,286
Total Assets . . . . . . . . . . . . . . . . . . . . . . . . . . . . . . . . . $15,616,068 $ 244,031 $825,022 $16,685,121
Transfers between investment levels may occur as the markets fluctuate and/or the availability of data usedin an investment’s valuation changes. The Fund recognizes transfers between the levels as of the end of theperiod. As of December 31, 2015, the Fund did not have any investments transfer between investment levels.At December 31, 2015, the fair value of certain securities were adjusted due to developments which occurredbetween the time of the close of the foreign markets on which they trade and the close of business on theNYSE which resulted in their Level 2 classification.
Merrill Corp - MS Select Dimensions Annual Report [Funds] 033-54047 12-31-2015 ED [AUX] | thunt | 19-Feb-16 14:26 | 16-1344-2.ha | Sequence: 9CHKSUM Content: 53098 Layout: 44608 Graphics: No Graphics CLEAN
JOB: 16-1344-2 CYCLE#;BL#: 9; 0 TRIM: 7.5" x 8.75" AS: Merrill New York: 212-620-5600 COMPOSITECOLORS: Black, ~note-color 2, ~note-color 3 GRAPHICS: none V1.5

Morgan Stanley Select Dimensions Investment SeriesNotes to Financial Statements n December 31, 2015 continued
29
Following is a reconciliation of investments in which significant unobservable inputs (Level 3) were used indetermining fair value:
Mid Cap Growth
Common Convertible PreferredStocks Preferred Stocks Stocks
Beginning Balance . . . . . . . . . . . . . . . . . . . . . . . . . . . . . . . . . . . . . . . $ 610,957 $ 29,299 $410,235Purchases . . . . . . . . . . . . . . . . . . . . . . . . . . . . . . . . . . . . . . . . . . . . . . — — —Sales . . . . . . . . . . . . . . . . . . . . . . . . . . . . . . . . . . . . . . . . . . . . . . . . . . — — —Amortization of discount . . . . . . . . . . . . . . . . . . . . . . . . . . . . . . . . — — —Transfers in . . . . . . . . . . . . . . . . . . . . . . . . . . . . . . . . . . . . . . . . . . . . — — —Transfers out . . . . . . . . . . . . . . . . . . . . . . . . . . . . . . . . . . . . . . . . . . . — — —Corporate actions . . . . . . . . . . . . . . . . . . . . . . . . . . . . . . . . . . . . . . . — (80,261) —Change in unrealized appreciation (depreciation) . . . . . . . . . . . . (179,298) 72,141 (38,051)Realized gains (losses) . . . . . . . . . . . . . . . . . . . . . . . . . . . . . . . . . . . — — —
Ending Balance . . . . . . . . . . . . . . . . . . . . . . . . . . . . . . . . . . . . . . . . . . $ 431,659 $ 21,179 $372,184 Net change in unrealized appreciation (depreciation)
from investments still held as of December 31, 2015 . . . . . . . . . . $(179,298) $ (7,071) $ (38,051)
The following table presents additional information about valuation techniques and inputs used forinvestments that are measured at fair value and categorized within Level 3 as of December 31, 2015. Variousvaluation techniques were used in the valuation of certain investments and weighted based on the level ofsignificance.
Mid Cap Growth Impact to Valuation Fair Value at from an December 31, Selected Increase 2015 Valuation Technique Unobservable Input Range Value in Input Internet & Catalog RetailPreferred $204,717 Discounted Cash Weighted Stock Flow Average Cost of
Capital 17.0% 19.0% 18.0% Decrease Perpetual Growth Rate 3.5% 4.5% 4.0% Increase
Merrill Corp - MS Select Dimensions Annual Report [Funds] 033-54047 12-31-2015 ED [AUX] | thunt | 19-Feb-16 14:26 | 16-1344-2.ha | Sequence: 10CHKSUM Content: 32213 Layout: 45306 Graphics: No Graphics CLEAN
JOB: 16-1344-2 CYCLE#;BL#: 9; 0 TRIM: 7.5" x 8.75" AS: Merrill New York: 212-620-5600 COMPOSITECOLORS: Black, ~note-color 2, ~note-color 3 GRAPHICS: none V1.5
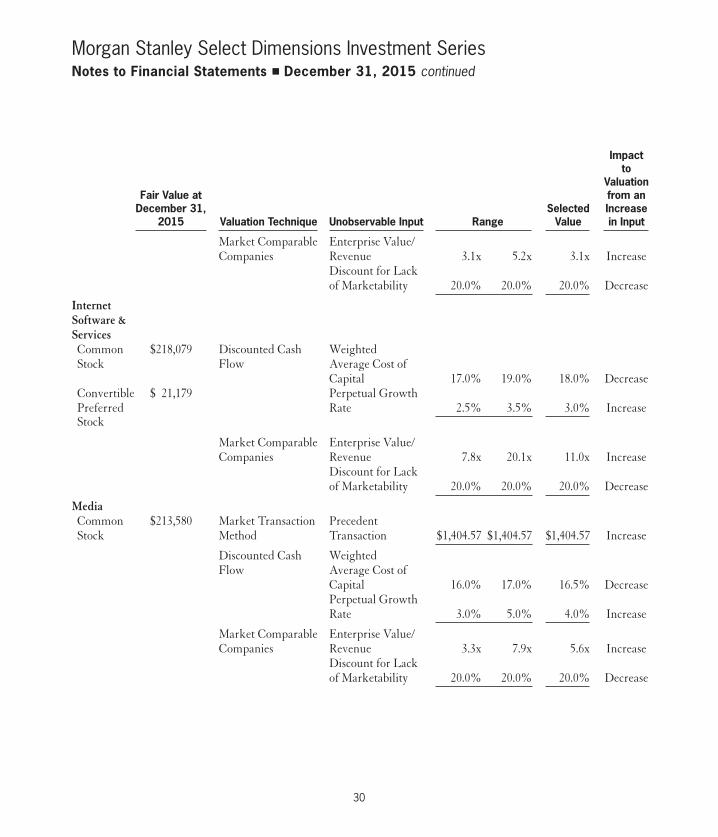
Morgan Stanley Select Dimensions Investment SeriesNotes to Financial Statements n December 31, 2015 continued
30
Impact to Valuation Fair Value at from an December 31, Selected Increase 2015 Valuation Technique Unobservable Input Range Value in Input
Market Comparable Enterprise Value/ Companies Revenue 3.1x 5.2x 3.1x Increase Discount for Lack of Marketability 20.0% 20.0% 20.0% Decrease
Internet Software & ServicesCommon $218,079 Discounted Cash Weighted Stock Flow Average Cost of
Capital 17.0% 19.0% 18.0% DecreaseConvertible $ 21,179 Perpetual Growth Preferred Rate 2.5% 3.5% 3.0% Increase Stock
Market Comparable Enterprise Value/ Companies Revenue 7.8x 20.1x 11.0x Increase Discount for Lack of Marketability 20.0% 20.0% 20.0% Decrease
MediaCommon $213,580 Market Transaction Precedent Stock Method Transaction $1,404.57 $1,404.57 $1,404.57 Increase
Discounted Cash Weighted Flow Average Cost of Capital 16.0% 17.0% 16.5% Decrease Perpetual Growth Rate 3.0% 5.0% 4.0% Increase Market Comparable Enterprise Value/ Companies Revenue 3.3x 7.9x 5.6x Increase Discount for Lack of Marketability 20.0% 20.0% 20.0% Decrease
Merrill Corp - MS Select Dimensions Annual Report [Funds] 033-54047 12-31-2015 ED [AUX] | thunt | 19-Feb-16 14:26 | 16-1344-2.ha | Sequence: 11CHKSUM Content: 36734 Layout: 56281 Graphics: No Graphics CLEAN
JOB: 16-1344-2 CYCLE#;BL#: 9; 0 TRIM: 7.5" x 8.75" AS: Merrill New York: 212-620-5600 COMPOSITECOLORS: Black, ~note-color 2, ~note-color 3 GRAPHICS: none V1.5
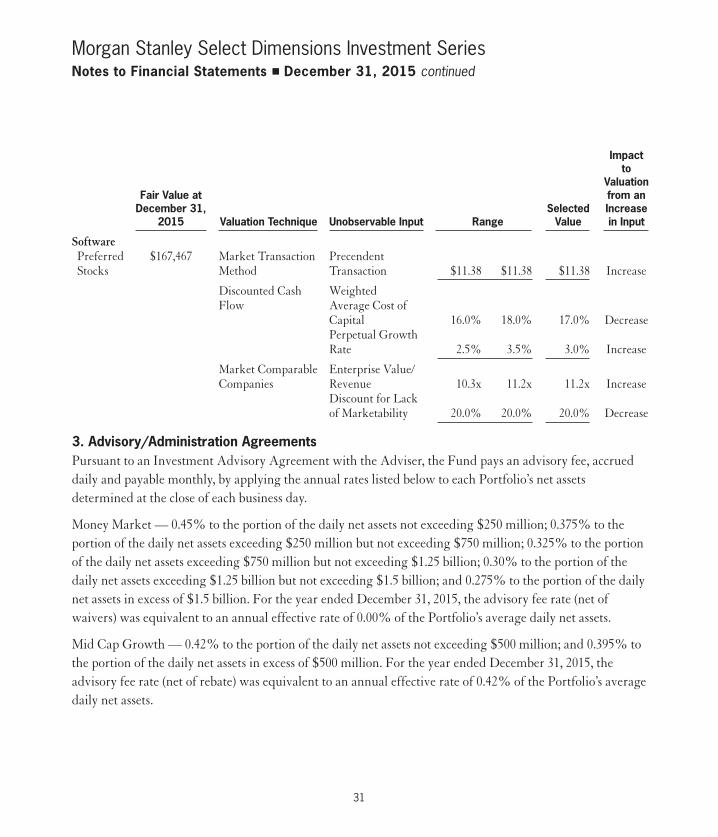
Morgan Stanley Select Dimensions Investment SeriesNotes to Financial Statements n December 31, 2015 continued
31
Impact to Valuation Fair Value at from an December 31, Selected Increase 2015 Valuation Technique Unobservable Input Range Value in Input SoftwarePreferred $167,467 Market Transaction Precendent Stocks Method Transaction $11.38 $11.38 $11.38 Increase
Discounted Cash Weighted Flow Average Cost of Capital 16.0% 18.0% 17.0% Decrease Perpetual Growth Rate 2.5% 3.5% 3.0% Increase Market Comparable Enterprise Value/ Companies Revenue 10.3x 11.2x 11.2x Increase Discount for Lack of Marketability 20.0% 20.0% 20.0% Decrease
3. Advisory/Administration AgreementsPursuant to an Investment Advisory Agreement with the Adviser, the Fund pays an advisory fee, accrueddaily and payable monthly, by applying the annual rates listed below to each Portfolio’s net assetsdetermined at the close of each business day.
Money Market — 0.45% to the portion of the daily net assets not exceeding $250 million; 0.375% to theportion of the daily net assets exceeding $250 million but not exceeding $750 million; 0.325% to the portionof the daily net assets exceeding $750 million but not exceeding $1.25 billion; 0.30% to the portion of thedaily net assets exceeding $1.25 billion but not exceeding $1.5 billion; and 0.275% to the portion of the dailynet assets in excess of $1.5 billion. For the year ended December 31, 2015, the advisory fee rate (net ofwaivers) was equivalent to an annual effective rate of 0.00% of the Portfolio’s average daily net assets.
Mid Cap Growth — 0.42% to the portion of the daily net assets not exceeding $500 million; and 0.395% tothe portion of the daily net assets in excess of $500 million. For the year ended December 31, 2015, theadvisory fee rate (net of rebate) was equivalent to an annual effective rate of 0.42% of the Portfolio’s averagedaily net assets.
Merrill Corp - MS Select Dimensions Annual Report [Funds] 033-54047 12-31-2015 ED [AUX] | thunt | 19-Feb-16 14:26 | 16-1344-2.ha | Sequence: 12CHKSUM Content: 41783 Layout: 62885 Graphics: No Graphics CLEAN
JOB: 16-1344-2 CYCLE#;BL#: 9; 0 TRIM: 7.5" x 8.75" AS: Merrill New York: 212-620-5600 COMPOSITECOLORS: Black, ~note-color 2, ~note-color 3 GRAPHICS: none V1.5

Morgan Stanley Select Dimensions Investment SeriesNotes to Financial Statements n December 31, 2015 continued
32
The Adviser also serves as the Administrator to the Fund and provides administrative services pursuant toan Administration Agreement for an annual fee, accrued daily and payable monthly, of 0.08% and 0.05% tothe Mid Cap Growth Portfolio and Money Market Portfolio, respectively.
Under a Sub-Administration agreement between the Administrator and State Street, State Street providescertain administrative services to the Fund. For such services, the Administrator pays State Street a portionof the fee the Administrator receives from each Portfolio.
4. Plan of DistributionShares of the Fund are distributed by Morgan Stanley Distribution, Inc. (the “Distributor”), an affiliate ofthe Adviser/Administrator. The Fund has adopted a Plan of Distribution (the “Plan”) pursuant toRule 12b-1 under the Act. Under the Plan, Class Y shares of each Portfolio bear a distribution fee which isaccrued daily and paid monthly at the annual rate of 0.25% of the average daily net assets of the class.
The Distributor and Adviser/Administrator have agreed to waive/reimburse all or a portion of the MoneyMarket Portfolio’s distribution fee, advisory fee and administration fee, respectively, to the extent that totalexpenses exceed total income of the Money Market Portfolio on a daily basis. For the year endedDecember 31, 2015, the Distributor waived $63,503, the Adviser waived $181,630 and the Administratorwaived $20,181. For the same period, the Adviser reimbursed additional expenses to the extent thePortfolio’s total expenses exceeded total income on a daily basis in the amount of $101,373. These fee waiversand/or expense reimbursements will continue for at least one year from the date of the Portfolio’sprospectus(es) or until such time that the Trustees act to discontinue all or a portion of such waivers and/orexpense reimbursements when they deem such action is appropriate.
5. Dividend Disbursing and Transfer AgentThe Fund’s dividend disbursing and transfer agent is Boston Financial Data Services, Inc. (“BFDS”).Pursuant to a Transfer Agency Agreement, the Fund pays BFDS a fee based on the number of classes,accounts and transactions relating to the Portfolios of the Fund.
Merrill Corp - MS Select Dimensions Annual Report [Funds] 033-54047 12-31-2015 ED [AUX] | thunt | 19-Feb-16 14:26 | 16-1344-2.ha | Sequence: 13CHKSUM Content: 49677 Layout: 44608 Graphics: No Graphics CLEAN
JOB: 16-1344-2 CYCLE#;BL#: 9; 0 TRIM: 7.5" x 8.75" AS: Merrill New York: 212-620-5600 COMPOSITECOLORS: Black, ~note-color 2, ~note-color 3 GRAPHICS: none V1.5

Morgan Stanley Select Dimensions Investment SeriesNotes to Financial Statements n December 31, 2015 continued
33
6. Security Transactions and Transactions with AffiliatesFor the year ended December 31, 2015, purchases and sales of investment securities, excluding short-terminvestments, were as follows:
U.S. GOVERNMENT SECURITIES OTHER PORTFOLIO PURCHASES SALES PURCHASES SALES Mid Cap Growth . . . . . . . . . . . . . — — $4,195,296 $8,049,906
The Mid Cap Growth Portfolio invests in the Institutional Class of the Morgan Stanley InstitutionalLiquidity Funds (the “Liquidity Funds”), an open-end management investment company managed by theAdviser, both directly and as a portion of the securities held as collateral on loaned securities. Advisory feespaid by the Portfolio are reduced by an amount equal to its pro-rata share of advisory and administrativefees paid by the Portfolio due to its investment in the Liquidity Funds.
A summary of the Mid Cap Growth Portfolio’s transactions in shares of the Liquidity Funds during the yearended December 31, 2015 is as follows:
VALUE PURCHASES DIVIDEND VALUE DECEMBER 31, 2014 AT COST SALES INCOME DECEMBER 31, 2015 $1,649,116 $5,848,575 $6,046,384 $1,242 $1,451,307
For the year ended December 31, 2015, advisory fees paid were reduced by $686 for the Mid Cap GrowthPortfolio’s investment in the Liquidity Funds.
The Fund has an unfunded Deferred Compensation Plan (the “Compensation Plan”), which allows eachindependent Trustee to defer payment of all, or a portion, of the fees he or she receives for serving on theBoard of Trustees. Each eligible Trustee generally may elect to have the deferred amounts credited with areturn equal to the total return on one or more of the Morgan Stanley funds that are offered as investmentoptions under the Compensation Plan. Appreciation/depreciation and distributions received from theseinvestments are recorded with an offsetting increase/decrease in the deferred compensation obligation anddo not affect the NAV of the Fund.
7. Purposes of and Risks Relating to Certain Financial InstrumentsCertain Portfolios may lend securities to qualified financial institutions, such as broker-dealers, to earnadditional income. Risks in securities lending transactions are that a borrower may not provide additionalcollateral when required or return the securities when due, and that the value of the short-term investmentswill be less than the amount of cash collateral plus any rebate that is required to be returned to the borrower.
Merrill Corp - MS Select Dimensions Annual Report [Funds] 033-54047 12-31-2015 ED [AUX] | thunt | 19-Feb-16 14:26 | 16-1344-2.ha | Sequence: 14CHKSUM Content: 26604 Layout: 39757 Graphics: No Graphics CLEAN
JOB: 16-1344-2 CYCLE#;BL#: 9; 0 TRIM: 7.5" x 8.75" AS: Merrill New York: 212-620-5600 COMPOSITECOLORS: Black, ~note-color 2, ~note-color 3 GRAPHICS: none V1.5
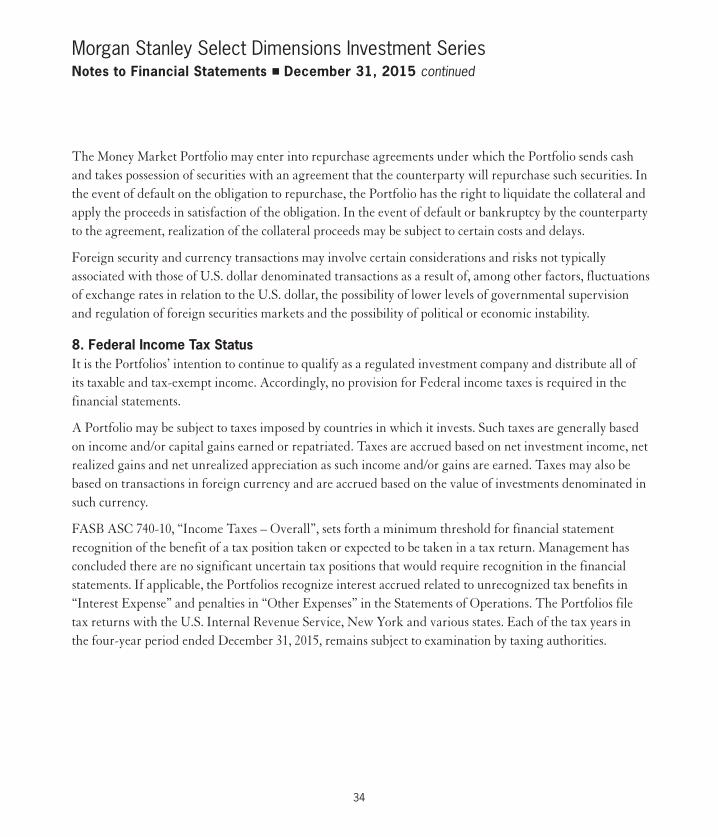
Morgan Stanley Select Dimensions Investment SeriesNotes to Financial Statements n December 31, 2015 continued
34
The Money Market Portfolio may enter into repurchase agreements under which the Portfolio sends cashand takes possession of securities with an agreement that the counterparty will repurchase such securities. Inthe event of default on the obligation to repurchase, the Portfolio has the right to liquidate the collateral andapply the proceeds in satisfaction of the obligation. In the event of default or bankruptcy by the counterpartyto the agreement, realization of the collateral proceeds may be subject to certain costs and delays.
Foreign security and currency transactions may involve certain considerations and risks not typicallyassociated with those of U.S. dollar denominated transactions as a result of, among other factors, fluctuationsof exchange rates in relation to the U.S. dollar, the possibility of lower levels of governmental supervisionand regulation of foreign securities markets and the possibility of political or economic instability.
8. Federal Income Tax StatusIt is the Portfolios’ intention to continue to qualify as a regulated investment company and distribute all ofits taxable and tax-exempt income. Accordingly, no provision for Federal income taxes is required in thefinancial statements.
A Portfolio may be subject to taxes imposed by countries in which it invests. Such taxes are generally basedon income and/or capital gains earned or repatriated. Taxes are accrued based on net investment income, netrealized gains and net unrealized appreciation as such income and/or gains are earned. Taxes may also bebased on transactions in foreign currency and are accrued based on the value of investments denominated insuch currency.
FASB ASC 740-10, “Income Taxes – Overall”, sets forth a minimum threshold for financial statementrecognition of the benefit of a tax position taken or expected to be taken in a tax return. Management hasconcluded there are no significant uncertain tax positions that would require recognition in the financialstatements. If applicable, the Portfolios recognize interest accrued related to unrecognized tax benefits in“Interest Expense” and penalties in “Other Expenses” in the Statements of Operations. The Portfolios filetax returns with the U.S. Internal Revenue Service, New York and various states. Each of the tax years inthe four-year period ended December 31, 2015, remains subject to examination by taxing authorities.
Merrill Corp - MS Select Dimensions Annual Report [Funds] 033-54047 12-31-2015 ED [AUX] | thunt | 19-Feb-16 14:26 | 16-1344-2.ha | Sequence: 15CHKSUM Content: 4244 Layout: 44608 Graphics: No Graphics CLEAN
JOB: 16-1344-2 CYCLE#;BL#: 9; 0 TRIM: 7.5" x 8.75" AS: Merrill New York: 212-620-5600 COMPOSITECOLORS: Black, ~note-color 2, ~note-color 3 GRAPHICS: none V1.5
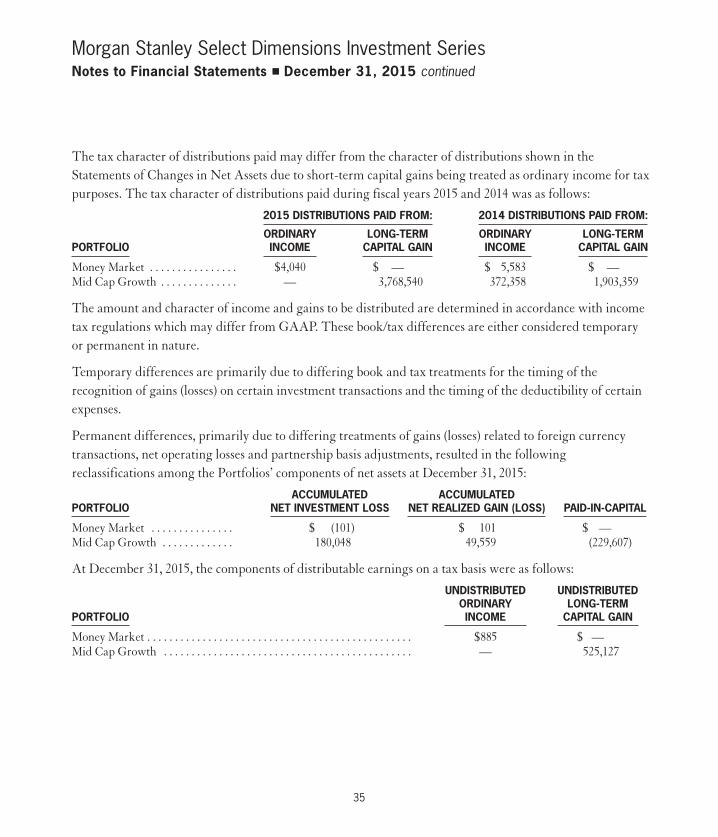
Morgan Stanley Select Dimensions Investment SeriesNotes to Financial Statements n December 31, 2015 continued
35
The tax character of distributions paid may differ from the character of distributions shown in theStatements of Changes in Net Assets due to short-term capital gains being treated as ordinary income for taxpurposes. The tax character of distributions paid during fiscal years 2015 and 2014 was as follows:
2015 DISTRIBUTIONS PAID FROM: 2014 DISTRIBUTIONS PAID FROM: ORDINARY LONG-TERM ORDINARY LONG-TERMPORTFOLIO INCOME CAPITAL GAIN INCOME CAPITAL GAIN Money Market . . . . . . . . . . . . . . . . $4,040 $ — $ 5,583 $ —Mid Cap Growth . . . . . . . . . . . . . . — 3,768,540 372,358 1,903,359
The amount and character of income and gains to be distributed are determined in accordance with incometax regulations which may differ from GAAP. These book/tax differences are either considered temporaryor permanent in nature.
Temporary differences are primarily due to differing book and tax treatments for the timing of therecognition of gains (losses) on certain investment transactions and the timing of the deductibility of certainexpenses.
Permanent differences, primarily due to differing treatments of gains (losses) related to foreign currencytransactions, net operating losses and partnership basis adjustments, resulted in the followingreclassifications among the Portfolios’ components of net assets at December 31, 2015:
ACCUMULATED ACCUMULATED PORTFOLIO NET INVESTMENT LOSS NET REALIZED GAIN (LOSS) PAID-IN-CAPITAL Money Market . . . . . . . . . . . . . . . $ (101) $ 101 $ —Mid Cap Growth . . . . . . . . . . . . . 180,048 49,559 (229,607)
At December 31, 2015, the components of distributable earnings on a tax basis were as follows:
UNDISTRIBUTED UNDISTRIBUTED ORDINARY LONG-TERMPORTFOLIO INCOME CAPITAL GAIN Money Market . . . . . . . . . . . . . . . . . . . . . . . . . . . . . . . . . . . . . . . . . . . . . . . . $885 $ —Mid Cap Growth . . . . . . . . . . . . . . . . . . . . . . . . . . . . . . . . . . . . . . . . . . . . . — 525,127
Merrill Corp - MS Select Dimensions Annual Report [Funds] 033-54047 12-31-2015 ED [AUX] | thunt | 19-Feb-16 14:26 | 16-1344-2.ha | Sequence: 16CHKSUM Content: 33237 Layout: 45802 Graphics: No Graphics CLEAN
JOB: 16-1344-2 CYCLE#;BL#: 9; 0 TRIM: 7.5" x 8.75" AS: Merrill New York: 212-620-5600 COMPOSITECOLORS: Black, ~note-color 2, ~note-color 3 GRAPHICS: none V1.5

Morgan Stanley Select Dimensions Investment SeriesNotes to Financial Statements n December 31, 2015 continued
36
At December 31, 2015, the following Portfolios had available for Federal income tax purposes unused shortterm capital losses that will not expire:
SHORT TERM LOSSESPORTFOLIO NO EXPIRATION Money Market . . . . . . . . . . . . . . . . . . . . . . . . . . . . . . . . . . . . . . . . . . . . . . . . . . . . . . . . . . . . $817
To the extent that capital loss carryforwards are used to offset any future capital gains realized, no capitalgains tax liability will be incurred by a Portfolio for gains realized and not distributed. To the extent thatcapital gains are offset, such gains will not be distributed to the shareholders.
During the year ended December 31, 2015, the following Portfolios utilized capital loss carryforwards forU.S. Federal income tax purposes of:
UTILIZED CAPITALPORTFOLIO LOSS CARRYFORWARDS Money Market . . . . . . . . . . . . . . . . . . . . . . . . . . . . . . . . . . . . . . . . . . . . . . . . . . . . . . . . . . . . $194
9. OtherAt December 31, 2015, certain Portfolios had record owners of 10% or greater. Investment activities of theseshareholders could have a material impact on these Portfolios. These Portfolios and the aggregatepercentage of such owners were as follows:
PERCENTAGE OF OWNERSHIP Money Market . . . . . . . . . . . . . . . . . . . . . . . . . . . . . . . . . . . . . . . . . . . . . . . . . . . . . . . . . . . . 92.7%Mid Cap Growth . . . . . . . . . . . . . . . . . . . . . . . . . . . . . . . . . . . . . . . . . . . . . . . . . . . . . . . . . . 97.1%
10. Money Market Fund RegulationThe SEC has adopted changes to the rules that govern money market funds. These changes have a phase-inperiod ranging from mid-2015 (primarily for certain new disclosure-related requirements) to the latter halfof 2016 (for the most significant changes, such as the possible imposition of redemption fees and/or thetemporary suspension of redemption privileges if a fund’s portfolio liquidity falls below certain requiredminimum levels because of market conditions or other factors). At this time, management is evaluating theimplications of these amendments and their impact to the Money Market Portfolio’s operations, financialstatements and accompanying notes.
Merrill Corp - MS Select Dimensions Annual Report [Funds] 033-54047 12-31-2015 ED [AUX] | thunt | 19-Feb-16 14:26 | 16-1344-2.ha | Sequence: 17CHKSUM Content: 43869 Layout: 31048 Graphics: No Graphics CLEAN
JOB: 16-1344-2 CYCLE#;BL#: 9; 0 TRIM: 7.5" x 8.75" AS: Merrill New York: 212-620-5600 COMPOSITECOLORS: Black, ~note-color 2, ~note-color 3 GRAPHICS: none V1.5

Morgan Stanley Select Dimensions Investment SeriesNotes to Financial Statements n December 31, 2015 continued
37
11. Subsequent EventThe Board of Trustees of the Fund approved a Plan of Liquidation with respect to the Money MarketPortfolio, a series of the Fund. Subject to shareholder approval, pursuant to the Plan of Liquidation,substantially all of the assets of the Money Market Portfolio will be liquidated, known liabilities will besatisfied, the remaining proceeds will be distributed to the shareholders, and all of the issued andoutstanding shares will be redeemed (the “Liquidation”). The Liquidation is expected to occur on or aboutApril 29, 2016.
Merrill Corp - MS Select Dimensions Annual Report [Funds] 033-54047 12-31-2015 ED [AUX] | thunt | 19-Feb-16 14:26 | 16-1344-2.ha | Sequence: 18CHKSUM Content: 33952 Layout: 58128 Graphics: No Graphics CLEAN
JOB: 16-1344-2 CYCLE#;BL#: 9; 0 TRIM: 7.5" x 8.75" AS: Merrill New York: 212-620-5600 COMPOSITECOLORS: Black, ~note-color 2, ~note-color 3 GRAPHICS: none V1.5

Morgan Stanley Select Dimensions Investment SeriesFinancial Highlights
38
See Notes to Financial Statements
MONEY MARKETCLASS X SHARES2011 . . . . . . . . . . . . . . . $ 1.00 $0.000(c) $(0.000)(c) $0.000(c) $(0.000)(c) —2012 . . . . . . . . . . . . . . . 1.00 0.000(c) 0.000(c) 0.000(c) (0.000)(c) — 2013 . . . . . . . . . . . . . . . 1.00 0.000(c) 0.000(c) 0.000(c) (0.000)(c) — 2014 . . . . . . . . . . . . . . . 1.00 0.000(c) 0.000(c) 0.000(c) (0.000)(c) — 2015 . . . . . . . . . . . . . . . 1.00 0.000(c) 0.000(c) 0.000(c) (0.000)(c) — CLASS Y SHARES2011 . . . . . . . . . . . . . . . 1.00 0.000(c) (0.000)(c) 0.000(c) (0.000)(c) — 2012 . . . . . . . . . . . . . . . 1.00 0.000(c) 0.000(c) 0.000(c) (0.000)(c) — 2013 . . . . . . . . . . . . . . . 1.00 0.000(c) 0.000(c) 0.000(c) (0.000)(c) — 2014 . . . . . . . . . . . . . . . 1.00 0.000(c) 0.000(c) 0.000(c) (0.000)(c) — 2015 . . . . . . . . . . . . . . . 1.00 0.000(c) 0.000(c) 0.000(c) (0.000)(c) —
NET ASSET NET REALIZED FOR THE YEAR VALUE NET AND TOTAL FROM DIVIDENDS DISTRIBUTIONS ENDED BEGINNING INVESTMENT UNREALIZED INVESTMENT TO TO DECEMBER 31 OF PERIOD INCOME(a) GAIN (LOSS) OPERATIONS SHAREHOLDERS SHAREHOLDERS
Merrill Corp - MS Select Dimensions Annual Report [Funds] 033-54047 12-31-2015 ED [AUX] | pweakly | 18-Feb-16 15:51 | 16-1344-2.ia | Sequence: 1CHKSUM Content: 33682 Layout: 11408 Graphics: No Graphics CLEAN
JOB: 16-1344-2 CYCLE#;BL#: 8; 0 TRIM: 7.5" x 8.75" AS: Merrill New York: 212-620-5600 COMPOSITECOLORS: Black, ~HTML color, ~note-color 2, ~watermark GRAPHICS: none V1.5

39
$(0.000)(c) $ 1.00 0.01% $27,555 0.23%(d) 0.01%(d) — N/A (0.000)(c) 1.00 0.01 23,245 0.28(d) 0.01(d) — N/A (0.000)(c) 1.00 0.01 21,087 0.19(d) 0.01(d) — N/A (0.000)(c) 1.00 0.01 17,009 0.19(d) 0.01(d) — N/A (0.000)(c) 1.00 0.01 13,068 0.16(d) 0.06(d) — N/A
(0.000)(c) 1.00 0.01 56,081 0.23(d) 0.01(d) — N/A (0.000)(c) 1.00 0.01 47,618 0.28(d) 0.01(d) — N/A (0.000)(c) 1.00 0.01 34,231 0.19(d) 0.01(d) — N/A (0.000)(c) 1.00 0.01 26,667 0.19(d) 0.01(d) — N/A (0.000)(c) 1.00 0.01 23,456 0.16(d) 0.06(d) — N/A
RATIO TO AVERAGE NET ASSETS TOTAL NET ASSET NET ASSETS DIVIDENDS VALUE END OF NET REBATE FROM PORTFOLIO AND END OF TOTAL PERIOD INVESTMENT MORGAN STANLEY TURNOVER DISTRIBUTIONS PERIOD RETURN(b) (000’S) EXPENSES INCOME AFFILIATE RATE
Merrill Corp - MS Select Dimensions Annual Report [Funds] 033-54047 12-31-2015 ED [AUX] | pweakly | 18-Feb-16 15:51 | 16-1344-2.ia | Sequence: 2CHKSUM Content: 34305 Layout: 824 Graphics: No Graphics CLEAN
JOB: 16-1344-2 CYCLE#;BL#: 8; 0 TRIM: 7.5" x 8.75" AS: Merrill New York: 212-620-5600 COMPOSITECOLORS: Black, ~note-color 2 GRAPHICS: none V1.5

Morgan Stanley Select Dimensions Investment SeriesFinancial Highlights continued
40
See Notes to Financial Statements
MID CAP GROWTHCLASS X SHARES2011 . . . . . . . . . . . . . . . $35.34 $ (0.07) $ (2.37) $ (2.44) $ (0.13) —2012 . . . . . . . . . . . . . . . 32.77 0.12 2.62 2.74 — $(2.61) 2013 . . . . . . . . . . . . . . . 32.90 (0.12) 12.47 12.35 (0.13) (0.10) 2014 . . . . . . . . . . . . . . . 45.02 (0.13) 0.55 0.42 — (4.34) 2015 . . . . . . . . . . . . . . . 41.10 (0.33) (1.70) (2.03) — (8.27) CLASS Y SHARES2011 . . . . . . . . . . . . . . . 34.64 (0.16) (2.32) (2.48) (0.05) — 2012 . . . . . . . . . . . . . . . 32.11 0.03 2.57 2.60 — (2.61) 2013 . . . . . . . . . . . . . . . 32.10 (0.21) 12.17 11.96 (0.02) (0.10) 2014 . . . . . . . . . . . . . . . 43.94 (0.23) 0.53 0.30 — (4.34) 2015 . . . . . . . . . . . . . . . 39.90 (0.41) (1.62) (2.03) — (8.27)
NET ASSET NET NET REALIZED FOR THE YEAR VALUE INVESTMENT AND TOTAL FROM DIVIDENDS DISTRIBUTIONS ENDED BEGINNING INCOME UNREALIZED INVESTMENT TO TO DECEMBER 31 OF PERIOD (LOSS)(a) GAIN (LOSS) OPERATIONS SHAREHOLDERS SHAREHOLDERS
(a) The per share amounts were computed using an average number of shares outstanding during the period.
(b) Calculated based on the net asset value as of the last business day of the period. Performance shown does not reflect fees and expensesimposed by your insurance company. If performance information included the effect of these charges, the total returns would be lower.
(c) Amount is less than $0.001.
Merrill Corp - MS Select Dimensions Annual Report [Funds] 033-54047 12-31-2015 ED [AUX] | pweakly | 18-Feb-16 15:51 | 16-1344-2.ia | Sequence: 3CHKSUM Content: 49813 Layout: 15319 Graphics: No Graphics CLEAN
JOB: 16-1344-2 CYCLE#;BL#: 8; 0 TRIM: 7.5" x 8.75" AS: Merrill New York: 212-620-5600 COMPOSITECOLORS: Black, ~note-color 2 GRAPHICS: none V1.5

41
(d) If the Portfolio had borne all of its expenses that were reimbursed or waived by the Distributor and Adviser/Administrator, the annualizedexpense and net investment loss ratios, would have been as follows:
EXPENSE NET INVESTMENT LOSS PERIOD ENDED RATIO RATIO December 31, 2015 Class X 0.96%* (0.74)%* Class Y 1.21* (0.99)* December 31, 2014 Class X 0.84 (0.64) Class Y 1.09 (0.89) December 31, 2013 Class X 0.71 (0.51) Class Y 0.96 (0.76) December 31, 2012 Class X 0.65 (0.36) Class Y 0.90 (0.61) December 31, 2011 Class X 0.61 (0.37) Class Y 0.86 (0.62)
* Includes non-operating expenses of 0.05%.
(e) Amount is less than 0.005%.
(f) The ratios reflect the rebate of certain Portfolio expenses in connection with investments in a Morgan Stanley affiliate during the period. Theeffect of the rebate on the ratios is disclosed in the above table as “Rebate from Morgan Stanley affiliate.”
$ (0.13) $32.77 (6.97)% $19,186 0.81%(f) (0.19)%(f) 0.00%(e) 33% (2.61) 32.90 8.51 17,016 1.02(f) 0.35(f) 0.00(e) 31 (0.23) 45.02 37.69 19,453 0.99(f) (0.33)(f) 0.00(e) 47 (4.34) 41.10 1.04 15,612 1.20(f) (0.30)(f) 0.00(e) 43 (8.27) 30.80 (6.59) 12,329 1.28(f) (0.91)(f) 0.00(e) 23
(0.05) 32.11 (7.18) 7,812 1.06(f) (0.44)(f) 0.00(e) 33 (2.61) 32.10 8.24 6,425 1.27(f) 0.10(f) 0.00(e) 31 (0.12) 43.94 37.36 6,971 1.24(f) (0.58)(f) 0.00(e) 47 (4.34) 39.90 0.78 5,151 1.45(f) (0.55)(f) 0.00(e) 43 (8.27) 29.60 (6.81) 3,677 1.53(f) (1.16)(f) 0.00(e) 23
RATIO TO AVERAGE NET ASSETS TOTAL NET ASSET NET ASSETS DIVIDENDS VALUE END OF NET REBATE FROM PORTFOLIO AND END OF TOTAL PERIOD INVESTMENT MORGAN STANLEY TURNOVER DISTRIBUTIONS PERIOD RETURN(b) (000’S) EXPENSES INCOME (LOSS) AFFILIATE RATE
Merrill Corp - MS Select Dimensions Annual Report [Funds] 033-54047 12-31-2015 ED [AUX] | pweakly | 18-Feb-16 15:51 | 16-1344-2.ia | Sequence: 4CHKSUM Content: 32461 Layout: 36798 Graphics: No Graphics CLEAN
JOB: 16-1344-2 CYCLE#;BL#: 8; 0 TRIM: 7.5" x 8.75" AS: Merrill New York: 212-620-5600 COMPOSITECOLORS: Black, ~note-color 2 GRAPHICS: none V1.5

Morgan Stanley Select Dimensions Investment SeriesReport of Independent Registered Public Accounting Firm
42
To the Shareholders and Board of Trustees ofMorgan Stanley Select Dimensions Investment Series:
We have audited the accompanying statements of assets and liabilities, including the portfolios of investments,of Morgan Stanley Select Dimensions Investment Series (comprising, respectively, Money Market and Mid CapGrowth Portfolios) (collectively, the “Portfolios”) as of December 31, 2015, and the related statements ofoperations for the year then ended, the statements of changes in net assets for each of the two years in the periodthen ended and the financial highlights for each of the five years in the period then ended. These financialstatements and financial highlights are the responsibility of the Portfolios’ management. Our responsibility is toexpress an opinion on these financial statements and financial highlights based on our audits.
We conducted our audits in accordance with the standards of the Public Company Accounting OversightBoard (United States). Those standards require that we plan and perform the audit to obtain reasonableassurance about whether the financial statements and financial highlights are free of material misstatement.We were not engaged to perform an audit of the Portfolios’ internal control over financial reporting. Ouraudits included consideration of internal control over financial reporting as a basis for designing auditprocedures that are appropriate in the circumstances, but not for the purpose of expressing an opinion onthe effectiveness of the Portfolios’ internal control over financial reporting. Accordingly, we express no suchopinion. An audit also includes examining, on a test basis, evidence supporting the amounts and disclosuresin the financial statements and financial highlights, assessing the accounting principles used and significantestimates made by management, and evaluating the overall financial statement presentation. Ourprocedures included confirmation of securities owned as of December 31, 2015, by correspondence with thecustodian and others or by other appropriate auditing procedures where replies from others were notreceived. We believe that our audits provide a reasonable basis for our opinion.
In our opinion, the financial statements and financial highlights referred to above present fairly, in all materialrespects, the financial position of each of the respective portfolios constituting the Morgan Stanley SelectDimensions Investment Series at December 31, 2015, the results of their operations for the year then ended, thechanges in their net assets for each of the two years in the period then ended and the financial highlights for eachof the five years in the period then ended, in conformity with U.S. generally accepted accounting principles.
Boston, MassachusettsFebruary 19, 2016
Merrill Corp - MS Select Dimensions Annual Report [Funds] 033-54047 12-31-2015 ED [AUX] | eperez | 19-Feb-16 16:18 | 16-1344-2.ja | Sequence: 1CHKSUM Content: 53874 Layout: 13513 Graphics: 63324 CLEAN
JOB: 16-1344-2 CYCLE#;BL#: 10; 0 TRIM: 7.5" x 8.75" AS: Merrill New York: 212-620-5600 COMPOSITECOLORS: Black, ~note-color 2, ~note-color 3 GRAPHICS: Ernst_Young_sig.eps V1.5

Independent Trustees: Number of Portfolios Principal Occupation(s) in Fund Positions(s) During Past 5 Years and Complex Name, Age and Address of Held with Length of Other Relevant Overseen by Other Directorships Independent Trustee Registrant Time Served* Professional Experience Trustee** Held by Independent Trustee***
Frank L. Bowman (71)c/o Kramer Levin Naftalis & Frankel LLPCounsel to the Independent Trustees1177 Avenue of the AmericasNew York, NY 10036
Trustee SinceAugust 2006
President, Strategic Decisions, LLC(consulting) (since February 2009);Director or Trustee of various MorganStanley Funds (since August 2006);Chairperson of the Compliance andInsurance Committee (since October2015); Formerly, Chairperson of theInsurance Sub-Committee of theCompliance and Insurance Committee(February 2007-December 2015);served as President and ChiefExecutive Officer of the Nuclear EnergyInstitute (policy organization) (February2005-November 2008); retired asAdmiral, U.S. Navy after serving over38 years on active duty including8 years as Director of the Naval NuclearPropulsion Program in the Departmentof the Navy and the U.S. Department ofEnergy (1996-2004); served as Chief ofNaval Personnel (July 1994-September1996); and on the Joint Staff asDirector of Political Military Affairs(June 1992-July1994); knighted asHonorary Knight Commander of theMost Excellent Order of the BritishEmpire; awarded the Officier de l‘OrdeNational du Mérite by the FrenchGovernment; elected to the NationalAcademy of Engineering (2009).
98 Director of BP p.l.c.; Director of Navaland Nuclear Technologies LLP; DirectorEmeritus of the Armed Services YMCA;Director of the U.S. Naval SubmarineLeague; Member of the National SecurityAdvisory Council of the Center for U.S.Global Engagement and a member of theCNA Military Advisory Board; Chairman ofthe charity, J Street Cup Golf; Trustee ofFairhaven United Methodist Church; andDirector of other various non-profitorganizations.
Morgan Stanley Select Dimensions Investment SeriesTrustee and Officer Information (unaudited)
43
Merrill Corp - MS Select Dimensions Annual Report [Funds] 033-54047 12-31-2015 ED [AUX] | eperez | 19-Feb-16 16:18 | 16-1344-2.ja | Sequence: 2CHKSUM Content: 52634 Layout: 46193 Graphics: No Graphics CLEAN
JOB: 16-1344-2 CYCLE#;BL#: 10; 0 TRIM: 7.5" x 8.75" AS: Merrill New York: 212-620-5600 COMPOSITECOLORS: Black, Black2, ~note-color 2 GRAPHICS: none V1.5
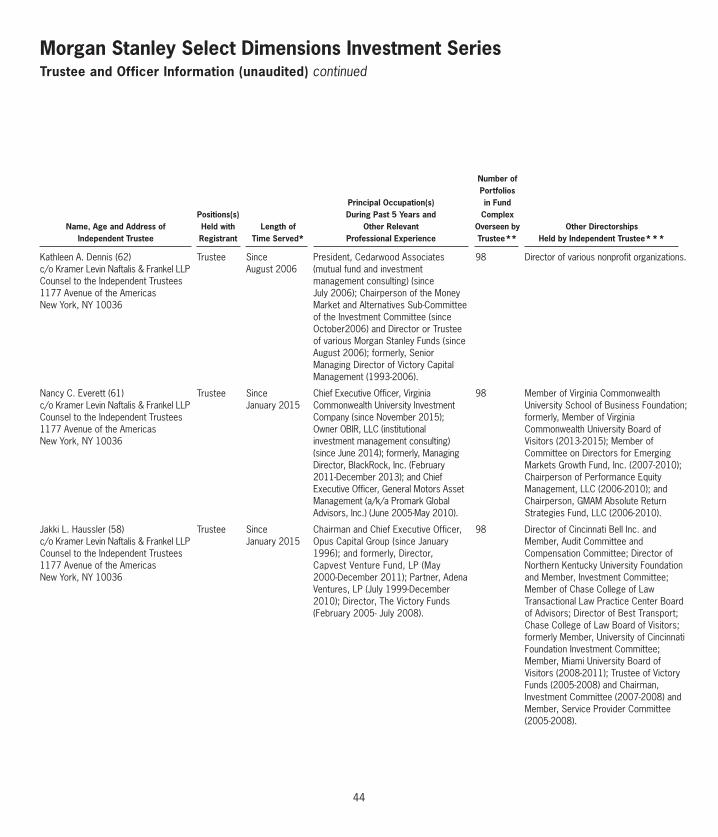
Number of Portfolios Principal Occupation(s) in Fund Positions(s) During Past 5 Years and Complex Name, Age and Address of Held with Length of Other Relevant Overseen by Other Directorships Independent Trustee Registrant Time Served* Professional Experience Trustee** Held by Independent Trustee***
Kathleen A. Dennis (62) c/o Kramer Levin Naftalis & Frankel LLPCounsel to the Independent Trustees1177 Avenue of the Americas New York, NY 10036
Trustee SinceAugust 2006
President, Cedarwood Associates(mutual fund and investmentmanagement consulting) (sinceJuly 2006); Chairperson of the MoneyMarket and Alternatives Sub-Committeeof the Investment Committee (sinceOctober2006) and Director or Trusteeof various Morgan Stanley Funds (sinceAugust 2006); formerly, SeniorManaging Director of Victory CapitalManagement (1993-2006).
98 Director of various nonprofit organizations.
Nancy C. Everett (61)c/o Kramer Levin Naftalis & Frankel LLPCounsel to the Independent Trustees1177 Avenue of the AmericasNew York, NY 10036
Trustee SinceJanuary 2015
Chief Executive Officer, VirginiaCommonwealth University InvestmentCompany (since November 2015);Owner OBIR, LLC (institutionalinvestment management consulting)(since June 2014); formerly, ManagingDirector, BlackRock, Inc. (February2011-December 2013); and ChiefExecutive Officer, General Motors AssetManagement (a/k/a Promark GlobalAdvisors, Inc.) (June 2005-May 2010).
98 Member of Virginia CommonwealthUniversity School of Business Foundation;formerly, Member of VirginiaCommonwealth University Board ofVisitors (2013-2015); Member ofCommittee on Directors for EmergingMarkets Growth Fund, Inc. (2007-2010);Chairperson of Performance EquityManagement, LLC (2006-2010); andChairperson, GMAM Absolute ReturnStrategies Fund, LLC (2006-2010).
Jakki L. Haussler (58)c/o Kramer Levin Naftalis & Frankel LLPCounsel to the Independent Trustees1177 Avenue of the AmericasNew York, NY 10036
Trustee SinceJanuary 2015
Chairman and Chief Executive Officer,Opus Capital Group (since January1996); and formerly, Director,Capvest Venture Fund, LP (May2000-December 2011); Partner, AdenaVentures, LP (July 1999-December2010); Director, The Victory Funds(February 2005- July 2008).
98 Director of Cincinnati Bell Inc. andMember, Audit Committee andCompensation Committee; Director ofNorthern Kentucky University Foundationand Member, Investment Committee;Member of Chase College of LawTransactional Law Practice Center Boardof Advisors; Director of Best Transport;Chase College of Law Board of Visitors;formerly Member, University of CincinnatiFoundation Investment Committee;Member, Miami University Board ofVisitors (2008-2011); Trustee of VictoryFunds (2005-2008) and Chairman,Investment Committee (2007-2008) andMember, Service Provider Committee(2005-2008).
Morgan Stanley Select Dimensions Investment SeriesTrustee and Officer Information (unaudited) continued
44
Merrill Corp - MS Select Dimensions Annual Report [Funds] 033-54047 12-31-2015 ED [AUX] | eperez | 19-Feb-16 16:18 | 16-1344-2.ja | Sequence: 3CHKSUM Content: 27742 Layout: 39107 Graphics: No Graphics CLEAN
JOB: 16-1344-2 CYCLE#;BL#: 10; 0 TRIM: 7.5" x 8.75" AS: Merrill New York: 212-620-5600 COMPOSITECOLORS: Black, Black2, ~note-color 2 GRAPHICS: none V1.5
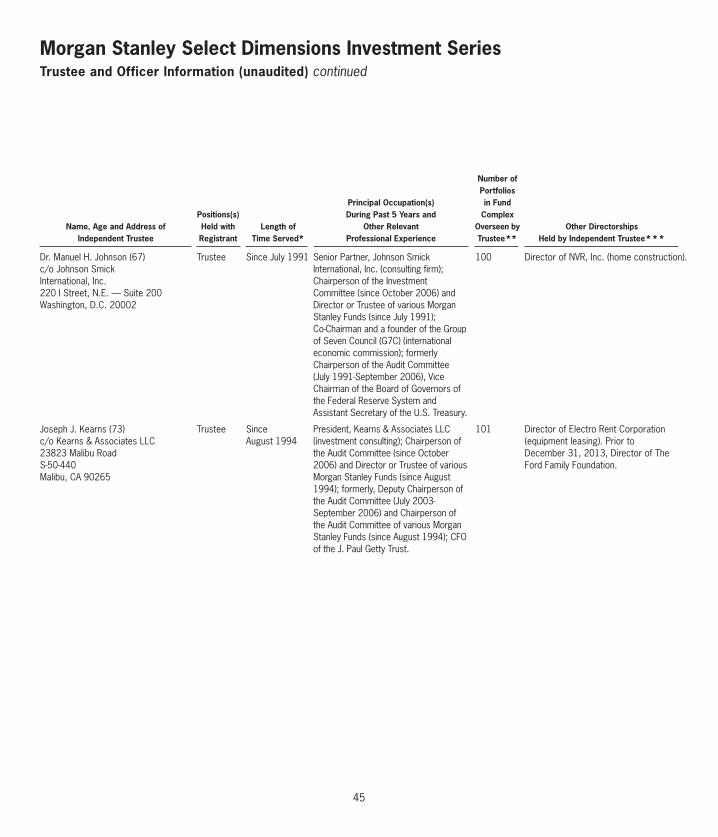
Number of Portfolios Principal Occupation(s) in Fund Positions(s) During Past 5 Years and Complex Name, Age and Address of Held with Length of Other Relevant Overseen by Other Directorships Independent Trustee Registrant Time Served* Professional Experience Trustee** Held by Independent Trustee***
Dr. Manuel H. Johnson (67)c/o Johnson SmickInternational, Inc.220 I Street, N.E. — Suite 200Washington, D.C. 20002
Trustee Since July 1991 Senior Partner, Johnson SmickInternational, Inc. (consulting firm);Chairperson of the InvestmentCommittee (since October 2006) andDirector or Trustee of various MorganStanley Funds (since July 1991);Co-Chairman and a founder of the Groupof Seven Council (G7C) (internationaleconomic commission); formerlyChairperson of the Audit Committee(July 1991-September 2006), ViceChairman of the Board of Governors ofthe Federal Reserve System andAssistant Secretary of the U.S. Treasury.
100 Director of NVR, Inc. (home construction).
Joseph J. Kearns (73)c/o Kearns & Associates LLC23823 Malibu RoadS-50-440Malibu, CA 90265
Trustee SinceAugust 1994
President, Kearns & Associates LLC(investment consulting); Chairperson ofthe Audit Committee (since October2006) and Director or Trustee of variousMorgan Stanley Funds (since August1994); formerly, Deputy Chairperson ofthe Audit Committee (July 2003-September 2006) and Chairperson ofthe Audit Committee of various MorganStanley Funds (since August 1994); CFOof the J. Paul Getty Trust.
101 Director of Electro Rent Corporation(equipment leasing). Prior toDecember 31, 2013, Director of TheFord Family Foundation.
Morgan Stanley Select Dimensions Investment SeriesTrustee and Officer Information (unaudited) continued
45
Merrill Corp - MS Select Dimensions Annual Report [Funds] 033-54047 12-31-2015 ED [AUX] | eperez | 19-Feb-16 16:18 | 16-1344-2.ja | Sequence: 4CHKSUM Content: 63689 Layout: 49693 Graphics: No Graphics CLEAN
JOB: 16-1344-2 CYCLE#;BL#: 10; 0 TRIM: 7.5" x 8.75" AS: Merrill New York: 212-620-5600 COMPOSITECOLORS: Black, Black2, ~note-color 2 GRAPHICS: none V1.5
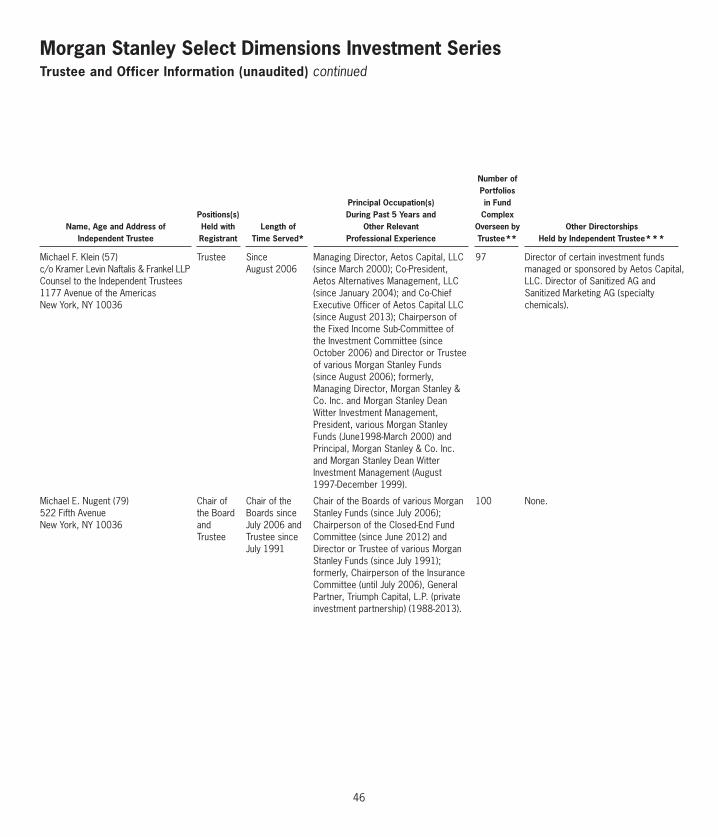
Number of Portfolios Principal Occupation(s) in Fund Positions(s) During Past 5 Years and Complex Name, Age and Address of Held with Length of Other Relevant Overseen by Other Directorships Independent Trustee Registrant Time Served* Professional Experience Trustee** Held by Independent Trustee***
Michael F. Klein (57)c/o Kramer Levin Naftalis & Frankel LLPCounsel to the Independent Trustees1177 Avenue of the AmericasNew York, NY 10036
Trustee SinceAugust 2006
Managing Director, Aetos Capital, LLC(since March 2000); Co-President,Aetos Alternatives Management, LLC(since January 2004); and Co-ChiefExecutive Officer of Aetos Capital LLC(since August 2013); Chairperson ofthe Fixed Income Sub-Committee ofthe Investment Committee (sinceOctober 2006) and Director or Trusteeof various Morgan Stanley Funds(since August 2006); formerly,Managing Director, Morgan Stanley &Co. Inc. and Morgan Stanley DeanWitter Investment Management,President, various Morgan StanleyFunds (June1998-March 2000) andPrincipal, Morgan Stanley & Co. Inc.and Morgan Stanley Dean WitterInvestment Management (August1997-December 1999).
97 Director of certain investment fundsmanaged or sponsored by Aetos Capital,LLC. Director of Sanitized AG andSanitized Marketing AG (specialtychemicals).
Michael E. Nugent (79)522 Fifth AvenueNew York, NY 10036
Chair ofthe BoardandTrustee
Chair of theBoards sinceJuly 2006 andTrustee sinceJuly 1991
Chair of the Boards of various MorganStanley Funds (since July 2006);Chairperson of the Closed-End FundCommittee (since June 2012) andDirector or Trustee of various MorganStanley Funds (since July 1991);formerly, Chairperson of the InsuranceCommittee (until July 2006), GeneralPartner, Triumph Capital, L.P. (privateinvestment partnership) (1988-2013).
100 None.
Morgan Stanley Select Dimensions Investment SeriesTrustee and Officer Information (unaudited) continued
46
Merrill Corp - MS Select Dimensions Annual Report [Funds] 033-54047 12-31-2015 ED [AUX] | eperez | 19-Feb-16 16:18 | 16-1344-2.ja | Sequence: 5CHKSUM Content: 14334 Layout: 39227 Graphics: No Graphics CLEAN
JOB: 16-1344-2 CYCLE#;BL#: 10; 0 TRIM: 7.5" x 8.75" AS: Merrill New York: 212-620-5600 COMPOSITECOLORS: Black, Black2, ~HTML color, ~note-color 2, ~watermark GRAPHICS: none V1.5

Number of Portfolios Principal Occupation(s) in Fund Positions(s) During Past 5 Years and Complex Name, Age and Address of Held with Length of Other Relevant Overseen by Other Directorships Independent Trustee Registrant Time Served* Professional Experience Trustee** Held by Independent Trustee***
Interested Trustee: Number of Portfolios in Fund Complex Positions(s) Overseen by Name, Age and Address of Held with Length of Principal Occupation(s) Interested Other Directorships Interested Trustee Registrant Time Served* During Past 5 Years Trustee** Held by Interested Trustee***
* This is the earliest date the Trustee began serving the Morgan Stanley Funds. Each Trustee serves an indefinite term, until his or her successor is elected. ** The Fund Complex includes (as of December 31, 2015) all open-end and closed-end funds (including all of their portfolios) advised by Morgan Stanley Investment
Management Inc. (the “Adviser”) and any funds that have an adviser that is an affiliated person of the Adviser (including, but not limited to, Morgan Stanley AIP GP LP). *** This includes any directorships at public companies and registered investment companies held by the Trustee at any time during the past five years.
W. Allen Reed (68)c/o Kramer Levin Naftalis & Frankel LLPCounsel to the Independent Trustees1177 Avenue of the Americas New York, NY 10036
Trustee SinceAugust 2006
Chairperson of the Equity Sub-Committee of the Investment Committee(since October 2006) and Director orTrustee of various Morgan StanleyFunds (since August 2006); formerly,President and CEO of General MotorsAsset Management; Chairman and ChiefExecutive Officer of the GM Trust Bankand Corporate Vice President of GeneralMotors Corporation (August 1994-December 2005).
98 Director of Legg Mason, Inc.; formerlyDirector of the Auburn UniversityFoundation (2010-2015).
Fergus Reid (83)c/o Joe Pietryka, Inc.85 Charles Colman Blvd.Pawling, NY 12564
Trustee SinceJune 1992
Chairman, Joe Pietryka, Inc.;Chairperson of the GovernanceCommittee and Director or Trustee ofvarious Morgan Stanley Funds (sinceJune 1992).
100 Formerly, Trustee and Director of certaininvestment companies in the JP MorganFund Complex managed by JP MorganInvestment Management Inc. (1987-2012).
James F. Higgins (68)One New York Plaza,New York, NY 10004
Director SinceJune 2000
Director or Trustee of various MorganStanley Funds (since June 2000);Senior Advisor of Morgan Stanley(since August 2000).
99 Formerly, Director of AXA Financial,Inc. and AXA Equitable Life InsuranceCompany (2002-2011) and Director ofAXA MONY Life Insurance Companyand AXA MONY Life InsuranceCompany of America (2004-2011).
Morgan Stanley Select Dimensions Investment SeriesTrustee and Officer Information (unaudited) continued
47
Merrill Corp - MS Select Dimensions Annual Report [Funds] 033-54047 12-31-2015 ED [AUX] | eperez | 19-Feb-16 16:18 | 16-1344-2.ja | Sequence: 6CHKSUM Content: 18482 Layout: 22991 Graphics: No Graphics CLEAN
JOB: 16-1344-2 CYCLE#;BL#: 10; 0 TRIM: 7.5" x 8.75" AS: Merrill New York: 212-620-5600 COMPOSITECOLORS: Black, Black2, ~note-color 2 GRAPHICS: none V1.5

Position(s) Name, Age and Address of Held with Length of Executive Officer Registrant Time Served* Principal Occupation(s) During Past 5 Years
* This is the earliest date the officer began serving the Morgan Stanley Funds. Each officer serves a one-year term, until his or her successor is elected and has qualified.
John H. Gernon (52) 522 Fifth AvenueNew York, NY 10036
President andPrincipalExecutiveOfficer
SinceSeptember 2013
President and Principal Executive Officer of the Equity and Fixed Income Funds and theMorgan Stanley AIP Funds (since September 2013) and the Liquidity Funds and variousmoney market funds (since May 2014) in the Fund Complex, Managing Director of theAdviser; Head of Product (since 2006).
Stefanie V. Chang Yu (49)522 Fifth AvenueNew York, NY 10036
ChiefComplianceOfficer
SinceDecember 1997
Managing Director of the Adviser and various entities affiliated with the Adviser; ChiefCompliance Officer of various Morgan Stanley Funds and the Adviser (since January 2014);formerly, Vice President of various Morgan Stanley Funds (December 1997-January 2014).
Joseph C. Benedetti (50)522 Fifth AvenueNew York, NY 10036
Vice President SinceJanuary 2014
Managing Director of the Adviser and various entities affiliated with the Adviser; VicePresident of various Morgan Stanley Funds (since January 2014); formerly, AssistantSecretary of various Morgan Stanley Funds (October 2004-January 2014).
Francis J. Smith (50)522 Fifth AvenueNew York, NY 10036
Treasurer andPrincipalFinancialOfficer
Treasurer sinceJuly 2003 andPrincipal FinancialOfficer sinceSeptember 2002
Executive Director of the Adviser and various entities affiliated with the Adviser; Treasurer(since July 2003) and Principal Financial Officer of various Morgan Stanley Funds (sinceSeptember 2002).
Mary E. Mullin (48)522 Fifth AvenueNew York, NY 10036
Secretary SinceJune 1999
Executive Director of the Adviser; Secretary of various Morgan Stanley Funds (sinceJune 1999).
Morgan Stanley Select Dimensions Investment SeriesTrustee and Officer Information (unaudited) continued
48
Executive Officers:
Merrill Corp - MS Select Dimensions Annual Report [Funds] 033-54047 12-31-2015 ED [AUX] | eperez | 19-Feb-16 16:18 | 16-1344-2.ja | Sequence: 7CHKSUM Content: 15594 Layout: 6913 Graphics: No Graphics CLEAN
JOB: 16-1344-2 CYCLE#;BL#: 10; 0 TRIM: 7.5" x 8.75" AS: Merrill New York: 212-620-5600 COMPOSITECOLORS: Black, Black2, ~note-color 2 GRAPHICS: none V1.5

Morgan Stanley Select Dimensions Investment SeriesFederal Tax Notice n December 31, 2015 (unaudited)
49
For Federal Income tax purposes, the following information is furnished with respect to the distributions paid by eachapplicable Portfolio during the taxable year ended December 31, 2015.
The following Portfolio designated and paid the following amount as a long-term capital gain distribution:
PORTFOLIO AMOUNT Mid Cap Growth . . . . . . . . . . . . . . . . . . . . . . . . . . . . . . . . . . . . . . . . . . . . . . . . . . . . . . . . . . . . . . . . . . . . . . . . . . $3,768,540
Merrill Corp - MS Select Dimensions Annual Report [Funds] 033-54047 12-31-2015 ED [AUX] | eperez | 19-Feb-16 16:18 | 16-1344-2.ja | Sequence: 8CHKSUM Content: 13372 Layout: 30999 Graphics: No Graphics CLEAN
JOB: 16-1344-2 CYCLE#;BL#: 10; 0 TRIM: 7.5" x 8.75" AS: Merrill New York: 212-620-5600 COMPOSITECOLORS: Black, ~note-color 2, ~note-color 3 GRAPHICS: none V1.5

(This page has been intentionally left blank.)
Merrill Corp - MS Select Dimensions Annual Report [Funds] 033-54047 12-31-2015 ED [AUX] | eperez | 19-Feb-16 16:18 | 16-1344-2.ja | Sequence: 9CHKSUM Content: 53125 Layout: 514 Graphics: No Graphics CLEAN
JOB: 16-1344-2 CYCLE#;BL#: 10; 0 TRIM: 7.5" x 8.75" AS: Merrill New York: 212-620-5600 COMPOSITECOLORS: Black, ~note-color 2 GRAPHICS: none V1.5

(This page has been intentionally left blank.)
Merrill Corp - MS Select Dimensions Annual Report [Funds] 033-54047 12-31-2015 ED [AUX] | eperez | 19-Feb-16 16:18 | 16-1344-2.ja | Sequence: 10CHKSUM Content: 53125 Layout: 36575 Graphics: No Graphics CLEAN
JOB: 16-1344-2 CYCLE#;BL#: 10; 0 TRIM: 7.5" x 8.75" AS: Merrill New York: 212-620-5600 COMPOSITECOLORS: Black, ~note-color 2 GRAPHICS: none V1.5

(This page has been intentionally left blank.)
Merrill Corp - MS Select Dimensions Annual Report [Funds] 033-54047 12-31-2015 ED [AUX] | eperez | 19-Feb-16 16:18 | 16-1344-2.ja | Sequence: 11CHKSUM Content: 53125 Layout: 45584 Graphics: No Graphics CLEAN
JOB: 16-1344-2 CYCLE#;BL#: 10; 0 TRIM: 7.5" x 8.75" AS: Merrill New York: 212-620-5600 COMPOSITECOLORS: Black, ~note-color 2 GRAPHICS: none V1.5
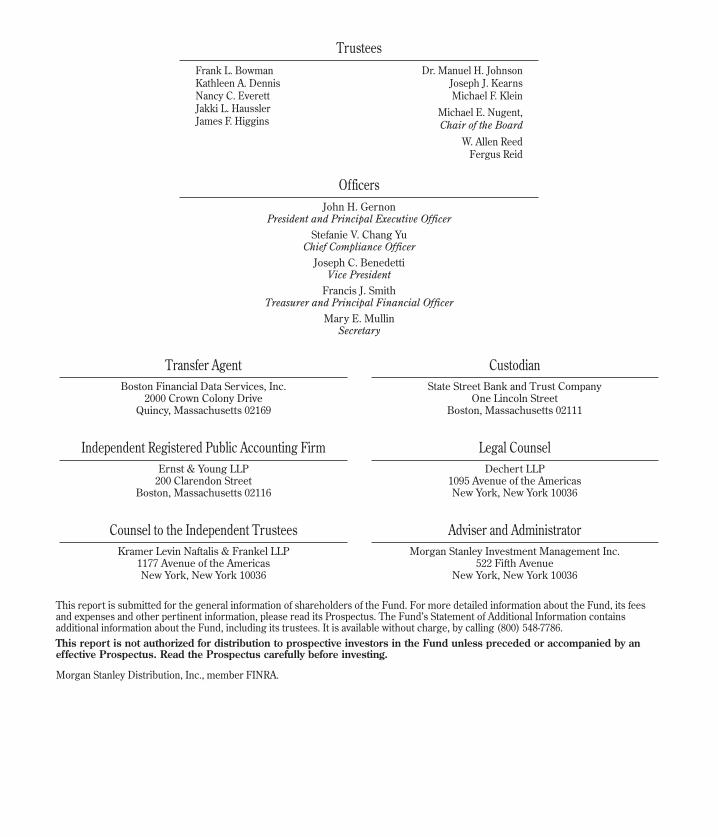
Trustees Frank L. Bowman Dr. Manuel H. Johnson Kathleen A. Dennis Joseph J. Kearns Nancy C. Everett Michael F. Klein Jakki L. Haussler Michael E. Nugent, James F. Higgins Chair of the Board W. Allen Reed Fergus Reid
OfficersJohn H. Gernon
President and Principal Executive OfficerStefanie V. Chang Yu
Chief Compliance OfficerJoseph C. Benedetti
Vice PresidentFrancis J. Smith
Treasurer and Principal Financial OfficerMary E. Mullin
Secretary
Transfer Agent Custodian Boston Financial Data Services, Inc. State Street Bank and Trust Company 2000 Crown Colony Drive One Lincoln Street Quincy, Massachusetts 02169 Boston, Massachusetts 02111
Independent Registered Public Accounting Firm Legal Counsel Ernst & Young LLP Dechert LLP 200 Clarendon Street 1095 Avenue of the Americas Boston, Massachusetts 02116 New York, New York 10036
Counsel to the Independent Trustees Adviser and Administrator Kramer Levin Naftalis & Frankel LLP Morgan Stanley Investment Management Inc. 1177 Avenue of the Americas 522 Fifth Avenue New York, New York 10036 New York, New York 10036
This report is submitted for the general information of shareholders of the Fund. For more detailed information about the Fund, its feesand expenses and other pertinent information, please read its Prospectus. The Fund’s Statement of Additional Information containsadditional information about the Fund, including its trustees. It is available without charge, by calling (800) 548-7786.This report is not authorized for distribution to prospective investors in the Fund unless preceded or accompanied by aneffective Prospectus. Read the Prospectus carefully before investing.
Morgan Stanley Distribution, Inc., member FINRA.
Merrill Corp - MS Select Dimensions Annual Report [Funds] 033-54047 12-31-2015 ED [AUX] | pweakly | 18-Feb-16 15:51 | 16-1344-2.za | Sequence: 1CHKSUM Content: 36 Layout: 28225 Graphics: No Graphics CLEAN
JOB: 16-1344-2 CYCLE#;BL#: 8; 0 TRIM: 7.5" x 8.75" AS: Merrill New York: 212-620-5600 COMPOSITECOLORS: Black, ~note-color 2 GRAPHICS: none V1.5

# 4 0 4 7 4
SEL
DIM
AN
N
1404323E
XP
2.28.17
Merrill Corp - MS Select Dimensions Annual Report [Funds] 033-54047 12-31-2015 ED [AUX] | pweakly | 18-Feb-16 15:51 | 16-1344-2.za | Sequence: 2CHKSUM Content: 22991 Layout: 17443 Graphics: No Graphics CLEAN
JOB: 16-1344-2 CYCLE#;BL#: 8; 0 TRIM: 7.5" x 8.75" AS: Merrill New York: 212-620-5600 COMPOSITECOLORS: Black, ~HTML color, ~note-color 2, ~watermark GRAPHICS: none V1.5