Embed Size (px)
Citation preview
A N N U A L R E P O R T 1 9 9 9
C O N T E N T S
Information for shareholders 1
Lemminkäinen in brief 2
Review by the Managing Director 3
Parent company Board of Directors 4
Board of Directors’ report for the
accounting period 1st Jan. 1999 – 31st Dec. 1999 5
Economic trends and financial indicators 10
Consolidated income statement 12
Consolidated balance sheet 13
Consolidated statement of source
and application of funds 14
Parent company income statement 15
Parent company balance sheet 16
Parent company statement of source
and application of funds 17
Accounting principles 18
Notes to the financial statements 19
Board of Directors’ proposal for
appropriation of retained earnings 31
Auditors’ Report 31
Business sector reviews 32
Contact information 40
L E M M I N K Ä I N E N C O R P O R A T I O N A N N U A L R E P O R T 1 9 9 91
Financial reportingDuring the course of the year 2000 Lem-minkäinen Corporation will publish abulletin on the year 2000 financial state-ments, an annual report and three inter-im financial reviews. The latter willappear on the 17th May, 16th August and8th November.
The annual report and interim finan-cial reviews will be published in Finnishand English. The publications will bemailed to the Company’s registeredshareholders. The publications may also
be ordered from the Company's informa-tion services by phone: + 358 9 159 9511,or by e-mail: [email protected]
Currencies used in the annual reportAll the monetary amounts in the Boardof Directors’ report, the table of eco-nomic trends and financial indicators,the income statements, the balancesheets, the statements of source andapplication of funds, and the notes tothe financial statements are in euro. For
comparison, the 1999 figures in thetable of economic trends and financialindicators, the income statements, thebalance sheets and the statements ofsource of application of funds are alsogiven in Finnish marks.
The monetary amounts reported inthe business sector reviews are inFinnish marks.
EUR 1 = FIM 5.94573
I N F O R M A T I O N F O R S H A R E H O L D E R S
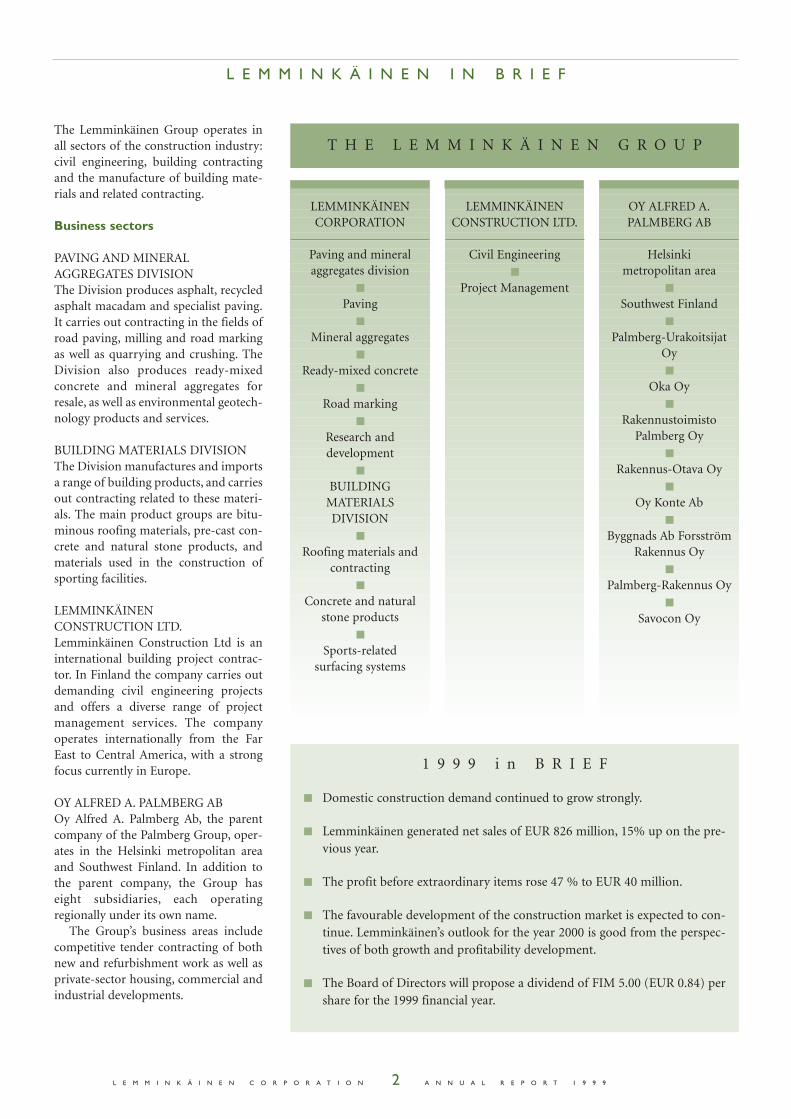
■ The Pikipoika roofing shingle is animpressive roofing material. HaukilahtiMarina in Espoo.
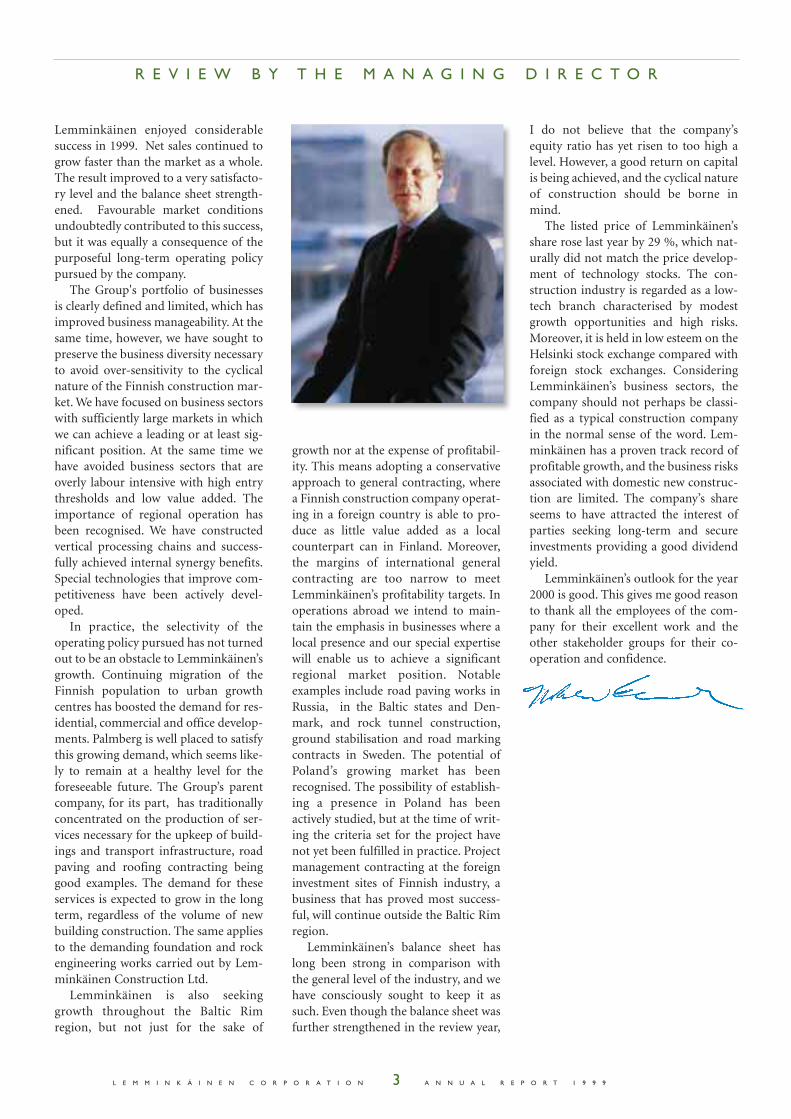
■ Street Print, a new product designedto liven up different asphalt applica-tions.
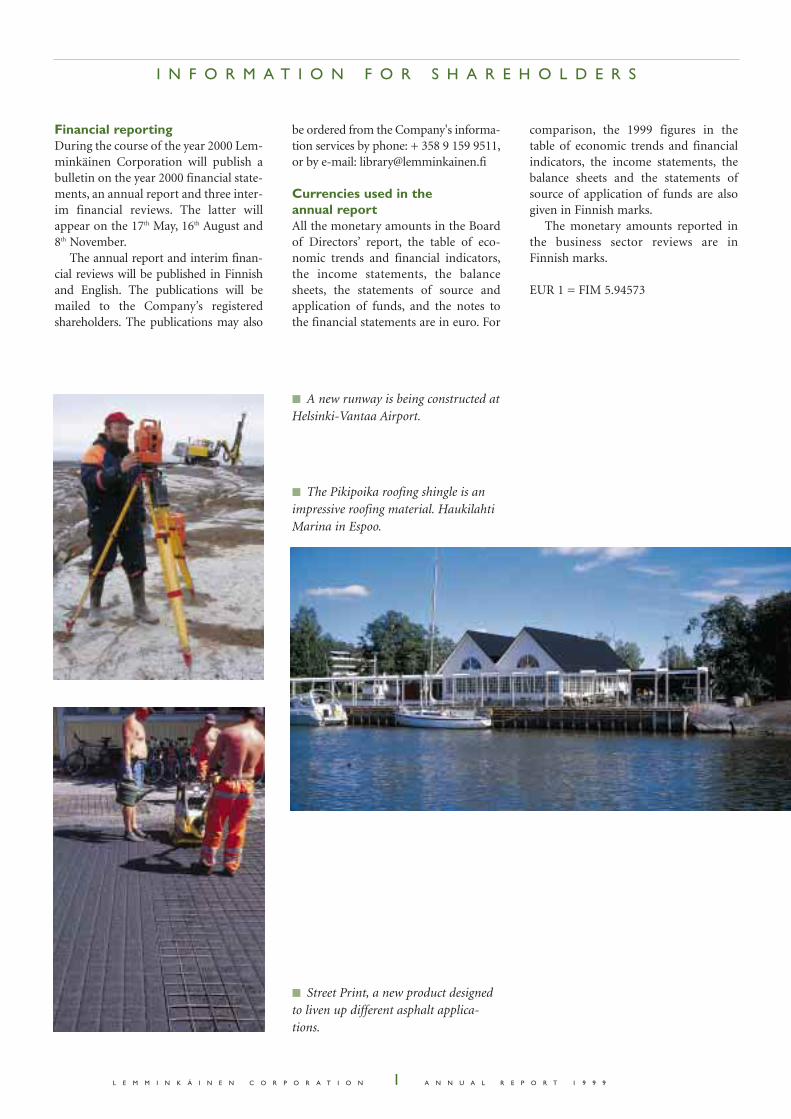
■ A new runway is being constructed atHelsinki-Vantaa Airport.
L E M M I N K Ä I N E N C O R P O R A T I O N A N N U A L R E P O R T 1 9 9 92
The Lemminkäinen Group operates inall sectors of the construction industry:civil engineering, building contractingand the manufacture of building mate-rials and related contracting.
Business sectors
PAVING AND MINERAL AGGREGATES DIVISIONThe Division produces asphalt, recycledasphalt macadam and specialist paving.It carries out contracting in the fields ofroad paving, milling and road markingas well as quarrying and crushing. TheDivision also produces ready-mixedconcrete and mineral aggregates forresale, as well as environmental geotech-nology products and services.
BUILDING MATERIALS DIVISIONThe Division manufactures and importsa range of building products, and carriesout contracting related to these materi-als. The main product groups are bitu-minous roofing materials, pre-cast con-crete and natural stone products, andmaterials used in the construction ofsporting facilities.
LEMMINKÄINEN CONSTRUCTION LTD.Lemminkäinen Construction Ltd is aninternational building project contrac-tor. In Finland the company carries outdemanding civil engineering projectsand offers a diverse range of projectmanagement services. The companyoperates internationally from the FarEast to Central America, with a strongfocus currently in Europe.
OY ALFRED A. PALMBERG ABOy Alfred A. Palmberg Ab, the parentcompany of the Palmberg Group, oper-ates in the Helsinki metropolitan areaand Southwest Finland. In addition tothe parent company, the Group haseight subsidiaries, each operatingregionally under its own name.
The Group’s business areas includecompetitive tender contracting of bothnew and refurbishment work as well asprivate-sector housing, commercial andindustrial developments.
L E M M I N K Ä I N E N I N B R I E F
T H E L E M M I N K Ä I N E N G R O U P
LEMMINKÄINENCORPORATION
Paving and mineralaggregates division
■
Paving■
Mineral aggregates■
Ready-mixed concrete■
Road marking■
Research and development
■
BUILDING MATERIALS DIVISION
■
Roofing materials andcontracting
■
Concrete and naturalstone products
■
Sports-related surfacing systems
LEMMINKÄINENCONSTRUCTION LTD.
Civil Engineering■
Project Management
OY ALFRED A.PALMBERG AB
Helsinki metropolitan area
■
Southwest Finland■
Palmberg-UrakoitsijatOy■
Oka Oy■
RakennustoimistoPalmberg Oy
■
Rakennus-Otava Oy■
Oy Konte Ab■
Byggnads Ab ForsströmRakennus Oy
■
Palmberg-Rakennus Oy■
Savocon Oy
1 9 9 9 i n B R I E F
■ Domestic construction demand continued to grow strongly.
■ Lemminkäinen generated net sales of EUR 826 million, 15% up on the pre-vious year.
■ The profit before extraordinary items rose 47 % to EUR 40 million.
■ The favourable development of the construction market is expected to con-tinue. Lemminkäinen’s outlook for the year 2000 is good from the perspec-tives of both growth and profitability development.
■ The Board of Directors will propose a dividend of FIM 5.00 (EUR 0.84) pershare for the 1999 financial year.
L E M M I N K Ä I N E N C O R P O R A T I O N A N N U A L R E P O R T 1 9 9 93
Lemminkäinen enjoyed considerablesuccess in 1999. Net sales continued togrow faster than the market as a whole.The result improved to a very satisfacto-ry level and the balance sheet strength-ened. Favourable market conditionsundoubtedly contributed to this success,but it was equally a consequence of thepurposeful long-term operating policypursued by the company.
The Group's portfolio of businessesis clearly defined and limited, which hasimproved business manageability. At thesame time, however, we have sought topreserve the business diversity necessaryto avoid over-sensitivity to the cyclicalnature of the Finnish construction mar-ket. We have focused on business sectorswith sufficiently large markets in whichwe can achieve a leading or at least sig-nificant position. At the same time wehave avoided business sectors that areoverly labour intensive with high entrythresholds and low value added. Theimportance of regional operation hasbeen recognised. We have constructedvertical processing chains and success-fully achieved internal synergy benefits.Special technologies that improve com-petitiveness have been actively devel-oped.
In practice, the selectivity of theoperating policy pursued has not turnedout to be an obstacle to Lemminkäinen’sgrowth. Continuing migration of theFinnish population to urban growthcentres has boosted the demand for res-idential, commercial and office develop-ments. Palmberg is well placed to satisfythis growing demand, which seems like-ly to remain at a healthy level for theforeseeable future. The Group’s parentcompany, for its part, has traditionallyconcentrated on the production of ser-vices necessary for the upkeep of build-ings and transport infrastructure, roadpaving and roofing contracting beinggood examples. The demand for theseservices is expected to grow in the longterm, regardless of the volume of newbuilding construction. The same appliesto the demanding foundation and rockengineering works carried out by Lem-minkäinen Construction Ltd.
Lemminkäinen is also seekinggrowth throughout the Baltic Rimregion, but not just for the sake of
R E V I E W B Y T H E M A N A G I N G D I R E C T O R
growth nor at the expense of profitabil-ity. This means adopting a conservativeapproach to general contracting, wherea Finnish construction company operat-ing in a foreign country is able to pro-duce as little value added as a localcounterpart can in Finland. Moreover,the margins of international generalcontracting are too narrow to meetLemminkäinen’s profitability targets. Inoperations abroad we intend to main-tain the emphasis in businesses where alocal presence and our special expertisewill enable us to achieve a significantregional market position. Notableexamples include road paving works inRussia, in the Baltic states and Den-mark, and rock tunnel construction,ground stabilisation and road markingcontracts in Sweden. The potential ofPoland’s growing market has beenrecognised. The possibility of establish-ing a presence in Poland has beenactively studied, but at the time of writ-ing the criteria set for the project havenot yet been fulfilled in practice. Projectmanagement contracting at the foreigninvestment sites of Finnish industry, abusiness that has proved most success-ful, will continue outside the Baltic Rimregion.
Lemminkäinen’s balance sheet haslong been strong in comparison withthe general level of the industry, and wehave consciously sought to keep it assuch. Even though the balance sheet wasfurther strengthened in the review year,
I do not believe that the company’sequity ratio has yet risen to too high alevel. However, a good return on capitalis being achieved, and the cyclical natureof construction should be borne inmind.
The listed price of Lemminkäinen’sshare rose last year by 29 %, which nat-urally did not match the price develop-ment of technology stocks. The con-struction industry is regarded as a low-tech branch characterised by modestgrowth opportunities and high risks.Moreover, it is held in low esteem on theHelsinki stock exchange compared withforeign stock exchanges. ConsideringLemminkäinen’s business sectors, thecompany should not perhaps be classi-fied as a typical construction companyin the normal sense of the word. Lem-minkäinen has a proven track record ofprofitable growth, and the business risksassociated with domestic new construc-tion are limited. The company’s shareseems to have attracted the interest ofparties seeking long-term and secureinvestments providing a good dividendyield.
Lemminkäinen’s outlook for the year2000 is good. This gives me good reasonto thank all the employees of the com-pany for their excellent work and theother stakeholder groups for their co-operation and confidence.
L E M M I N K Ä I N E N C O R P O R A T I O N A N N U A L R E P O R T 1 9 9 94
P A R E N T C O M P A N Y B O A R D O F D I R E C T O R S
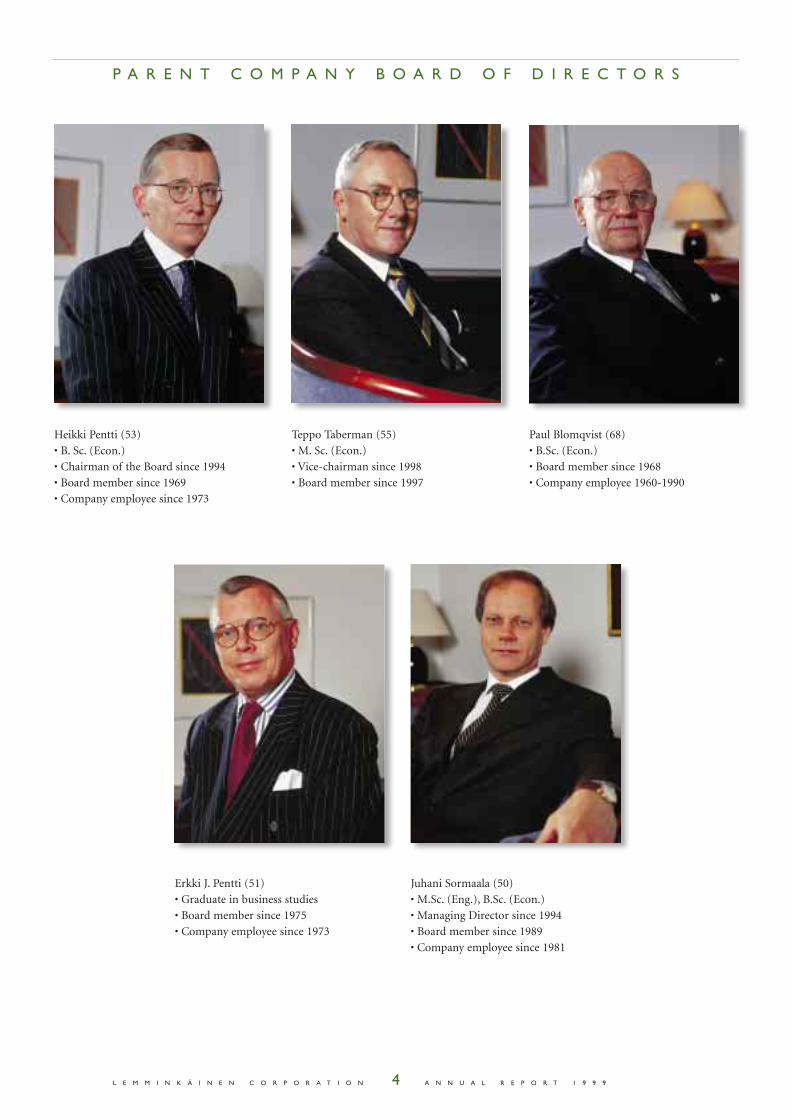
Heikki Pentti (53)
• B. Sc. (Econ.)
• Chairman of the Board since 1994
• Board member since 1969
• Company employee since 1973
Teppo Taberman (55)
• M. Sc. (Econ.)
• Vice-chairman since 1998
• Board member since 1997
Paul Blomqvist (68)
• B.Sc. (Econ.)
• Board member since 1968
• Company employee 1960-1990
Erkki J. Pentti (51)
• Graduate in business studies
• Board member since 1975
• Company employee since 1973
Juhani Sormaala (50)
• M.Sc. (Eng.), B.Sc. (Econ.)
• Managing Director since 1994
• Board member since 1989
• Company employee since 1981
L E M M I N K Ä I N E N C O R P O R A T I O N A N N U A L R E P O R T 1 9 9 95
Construction marketDomestic construction demand contin-ued to grow, albeit at a slower rate ofapproximately 5 % (11).
The fastest growth was once again innew building at about 6 % (20). Thenumber of new housing starts wasapproximately 34 000 housing units (32 000). The total volume of residen-tial, office and commercial develop-ments exceeded the level of the mid-1980s, but still fell well short of the peaklevel achieved towards the end of thatdecade. The volume of industrial con-struction fell slightly as a consequenceof the slack demand in export markets.
The growth in refurbishment workand civil engineering contracting con-tinued to grow steadily in line withexpectations: 4 % (6) and 3 % (2),respectively. The value of civil engineer-ing contracting in 1999 was approxi-mately EUR 3.4 billion, of which invest-ments accounted for EUR 2.2 billion andupkeep for EUR 1.2 billion. The volumeof asphalt paving contracting remainedat the previous year’s level of approxi-mately 3.7 million tonnes. The demandfor crushed aggregates rose by about 3%and the volume of rock engineering con-tracting remained unchanged.
The share of Russian contracts in theFinnish construction companies' inter-national operations fell to below 50 %.
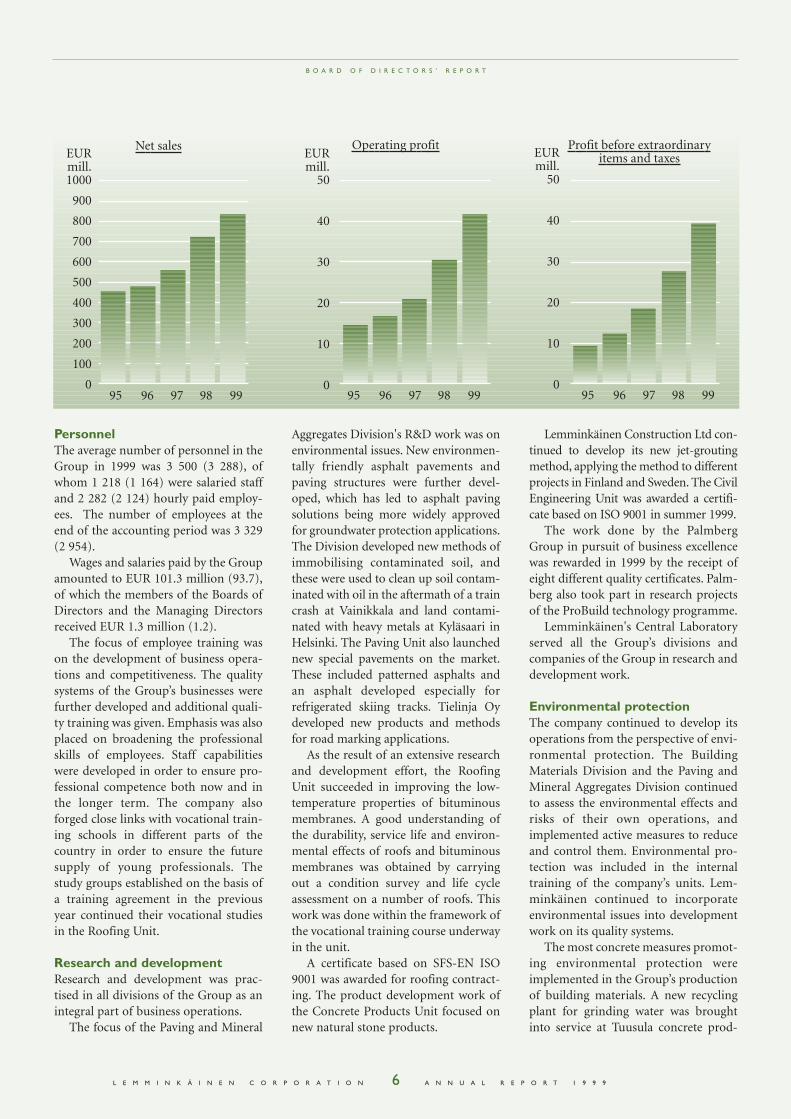
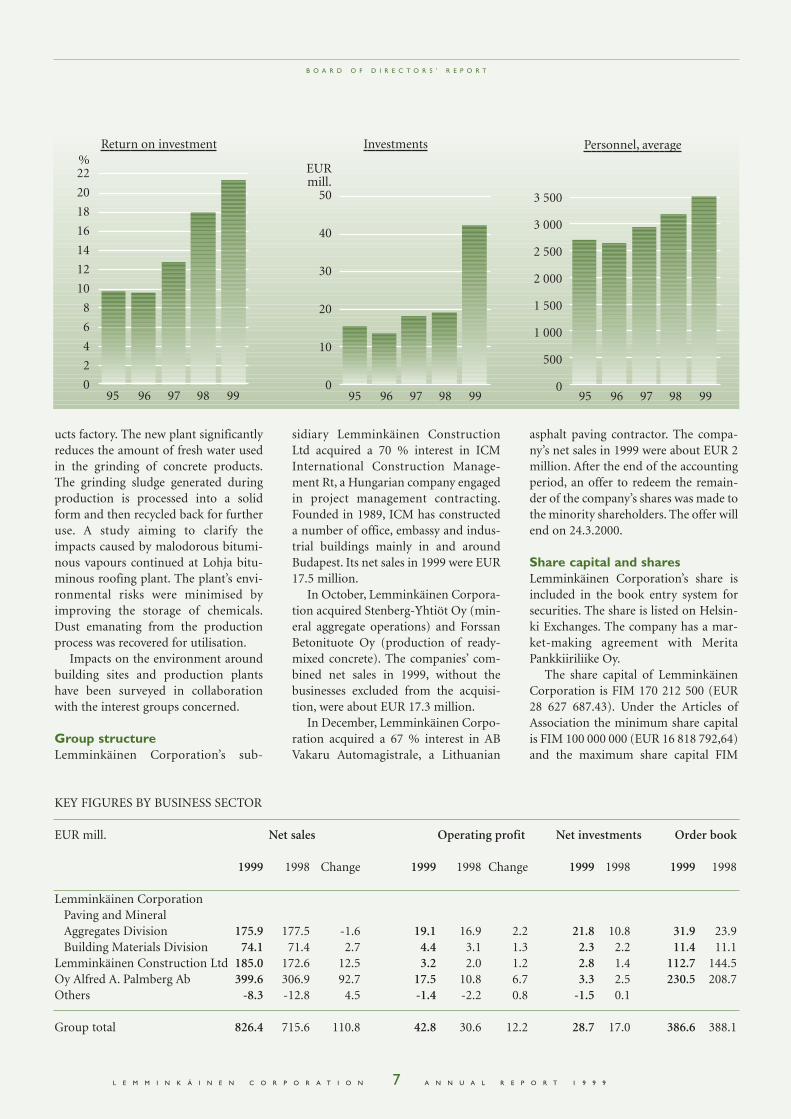
Net sales and profitsThe net sales of the LemminkäinenGroup rose 15 % and were EUR 826.4million (715.6), of which operationsabroad accounted for EUR 139.6 mil-lion or 17 % (22). The improvement inthe Group’s result continued. The oper-ating profit was EUR 42.8 million(30.6), the profit before extraordinaryitems EUR 39.9 million (27.1), the prof-it before taxes EUR 39.9 million (38.9)and the profit for the accounting periodEUR 26.4 million (14.2). The return oninvestment was 21.7 % (18.0), thereturn on equity 20.6 % (5.6) and earn-ings per share EUR 1.55 (0.34).
The net sales of the Paving and Min-eral Aggregates Division were EUR175.9 million (177.5). The Division’soperating profit improved and was EUR19.1 million (16.9), even though thetotal production of asphalt declined.
B O A R D O F D I R E C T O R S ’ R E P O R T
The favourable trend in profitability wasbased on improved cost effectivenessand continued growth of demand bothfor specialty products and in the privatesector. Net sales from exports and oper-ations abroad fell as a consequence ofthe subdued Russian market and wereEUR 23.1 million (35.8).
The net sales of the Building Materi-als Division rose and were EUR 74.1million (71.4). The Division’s operatingprofit improved and was EUR 4.4 mil-lion (3.1). The growth of the construc-tion market had a positive effect on thevolume and result of the whole Divi-sion. Full utilisation of investments andmore favourable weather conditionsthan in the previous year also con-tributed to the Division’s improved per-formance.
The net sales of Lemminkäinen Con-struction Ltd rose 7 % and were EUR185.0 million (172.6). The company’soperating profit improved and was EUR3.2 million (2.0). The performanceimprovement is based on the company’sconsidered policy of focusing on its tra-ditional strengths of civil engineeringand project management contracting.The regional emphasis of Lemminkäi-nen Construction Ltd’s operationsswitched from Russia and the Balticstates to Finland and Western Europe.
The net sales of Oy Alfred A. Palm-berg Ab, which specialises in buildingcontracting on the Finnish market, rose30 % and were EUR 399.6 million(306.9). Palmberg’s operating profitimproved by as much as 62 % and wasEUR 17.5 million (10.8). This favourabledevelopment was based on the compa-ny’s improved competitiveness and thecontinued healthy demand for residen-tial and commercial properties. Thenumber of own residential developmentapartments completed by the companywas 481 units (389). New apartmentscompleted under competitive tendercontracting totalled 888 (1 011).
InvestmentsThe Group’s gross investments wereEUR 42.2 million (18.8). Net invest-ments were EUR 28.7 million (17) aftera financial leasing agreement worthEUR 12.6 million was made in respect ofequipment.
The investments of the Paving andMineral Aggregates Division werereplacement investments in asphaltbatching, laying and transport equip-ment and in quarrying, crushing andloading plant for mineral aggregate pro-duction. The Division’s investments alsoincluded the mineral aggregate opera-tions and plant acquired from TaunoValo Oy, the asphalt production andrelated fixed assets of JJ-Asfaltti Oy, theacquisitions of Stenberg-Yhtiöt Oy andForssan Betonituote Oy, and the 67 %interest acquired in the Lithuanian com-pany AB Vakaru Automagistrale.
The investments of the BuildingMaterials Division were replacementinvestments in material productionplant and site installation equipment. Anew recycling plant for grinding waterwas completed at Tuusula concreteproducts factory.
The investments of LemminkäinenConstruction Ltd were replacementinvestment in civil engineering plant fortunnelling and foundation building.The company’s investments also includ-ed the 70 % interest acquired in theHungarian company ICM InternationalConstruction Management Rt.
Oy Alfred A. Palmberg Ab acquiredsite equipment to meet the needs of itsincreased building production.
Order bookThe value of the Group’s uninvoicedorders at the end of the accounting peri-od was EUR 386.6 million (388.1), ofwhich operations abroad accounted forEUR 56.5 million (86.8).
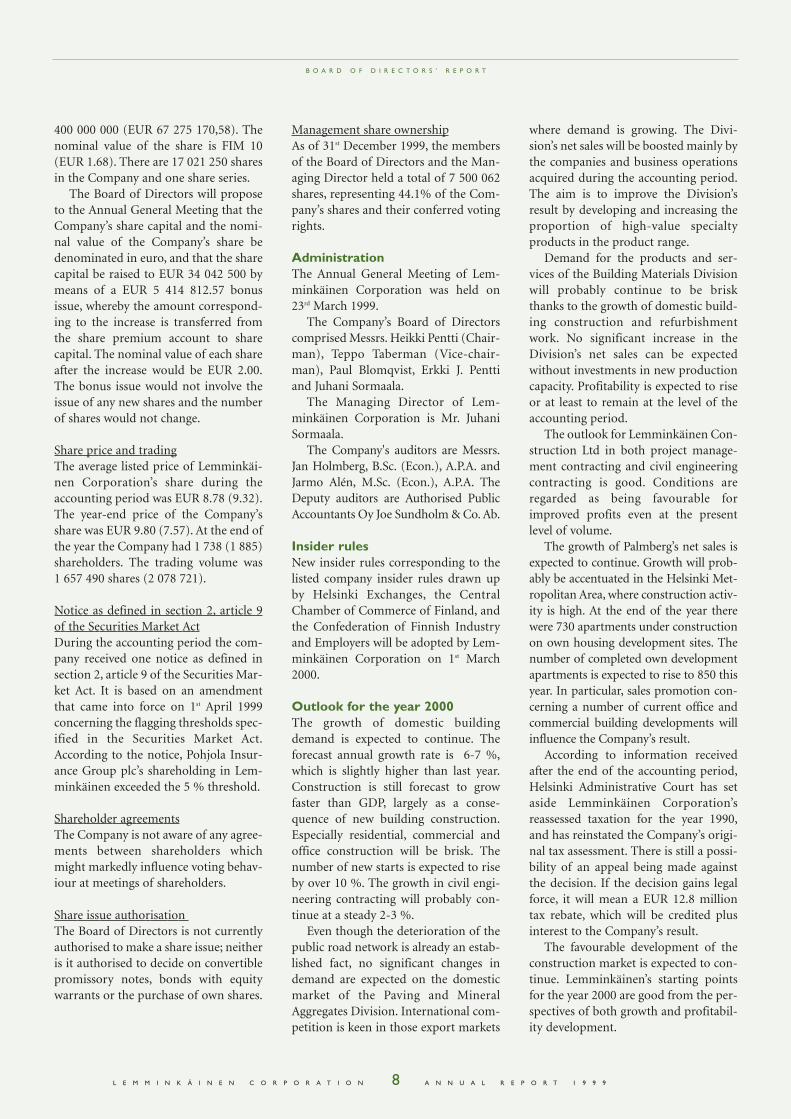
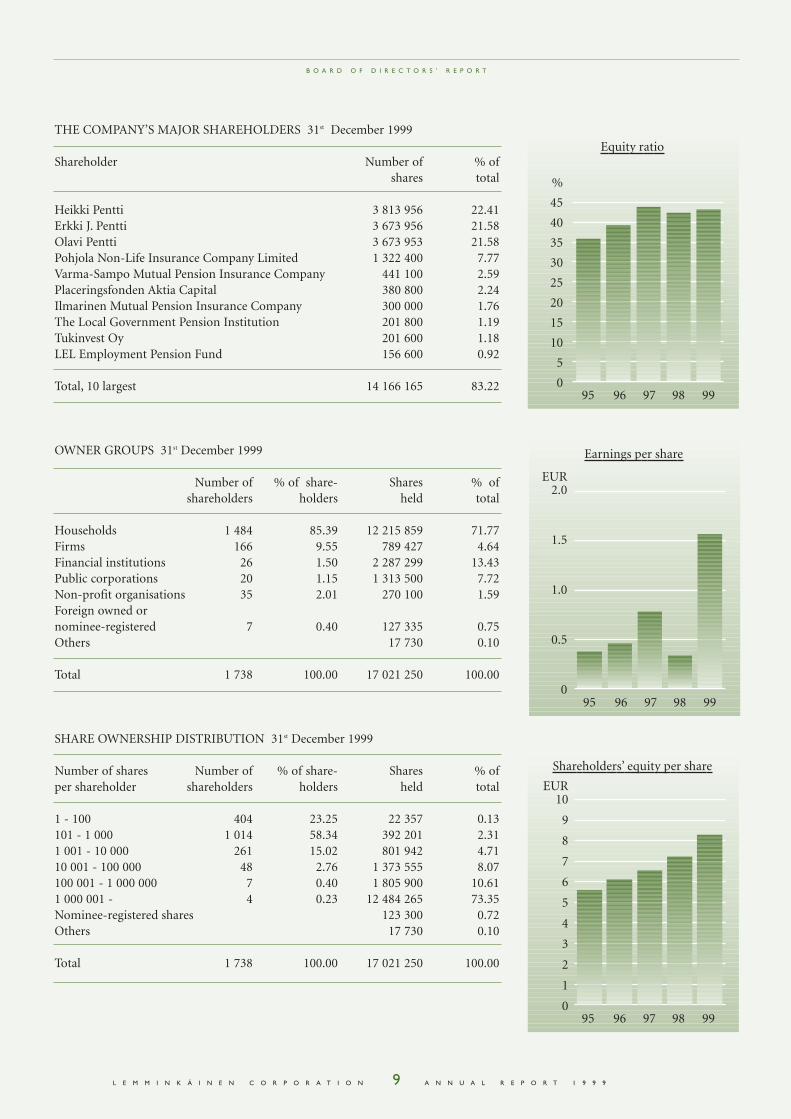
FinancingNet financing expenses were EUR 2.9million (3.5), representing 0.4 % (0.5)of net sales. According to the source andapplication of funds statement, the cashflow from business operations was EUR26.8 million (17.2). The net increase inoutstanding loans was EUR 10.0 million(2.2). The equity ratio was 43.5 % (42.6)and the equity per share EUR 8.20(7.16). Dividends totalling EUR 8.6 mil-lion were paid. Interest-bearing liabili-ties were EUR 73.3 million (63.4). Therewere no outstanding foreign currencyloans. The interest-bearing net debt wasEUR 47.3 million (37.6).
L E M M I N K Ä I N E N C O R P O R A T I O N A N N U A L R E P O R T 1 9 9 96
PersonnelThe average number of personnel in theGroup in 1999 was 3 500 (3 288), ofwhom 1 218 (1 164) were salaried staffand 2 282 (2 124) hourly paid employ-ees. The number of employees at theend of the accounting period was 3 329(2 954).
Wages and salaries paid by the Groupamounted to EUR 101.3 million (93.7),of which the members of the Boards ofDirectors and the Managing Directorsreceived EUR 1.3 million (1.2).
The focus of employee training wason the development of business opera-tions and competitiveness. The qualitysystems of the Group’s businesses werefurther developed and additional quali-ty training was given. Emphasis was alsoplaced on broadening the professionalskills of employees. Staff capabilitieswere developed in order to ensure pro-fessional competence both now and inthe longer term. The company alsoforged close links with vocational train-ing schools in different parts of thecountry in order to ensure the futuresupply of young professionals. Thestudy groups established on the basis ofa training agreement in the previousyear continued their vocational studiesin the Roofing Unit.
Research and developmentResearch and development was prac-tised in all divisions of the Group as anintegral part of business operations.
The focus of the Paving and Mineral
Lemminkäinen Construction Ltd con-tinued to develop its new jet-groutingmethod, applying the method to differentprojects in Finland and Sweden. The CivilEngineering Unit was awarded a certifi-cate based on ISO 9001 in summer 1999.
The work done by the PalmbergGroup in pursuit of business excellencewas rewarded in 1999 by the receipt ofeight different quality certificates. Palm-berg also took part in research projectsof the ProBuild technology programme.
Lemminkäinen's Central Laboratoryserved all the Group’s divisions andcompanies of the Group in research anddevelopment work.
Environmental protectionThe company continued to develop itsoperations from the perspective of envi-ronmental protection. The BuildingMaterials Division and the Paving andMineral Aggregates Division continuedto assess the environmental effects andrisks of their own operations, andimplemented active measures to reduceand control them. Environmental pro-tection was included in the internaltraining of the company’s units. Lem-minkäinen continued to incorporateenvironmental issues into developmentwork on its quality systems.
The most concrete measures promot-ing environmental protection wereimplemented in the Group’s productionof building materials. A new recyclingplant for grinding water was broughtinto service at Tuusula concrete prod-
Aggregates Division's R&D work was onenvironmental issues. New environmen-tally friendly asphalt pavements andpaving structures were further devel-oped, which has led to asphalt pavingsolutions being more widely approvedfor groundwater protection applications.The Division developed new methods ofimmobilising contaminated soil, andthese were used to clean up soil contam-inated with oil in the aftermath of a traincrash at Vainikkala and land contami-nated with heavy metals at Kyläsaari inHelsinki. The Paving Unit also launchednew special pavements on the market.These included patterned asphalts andan asphalt developed especially forrefrigerated skiing tracks. Tielinja Oydeveloped new products and methodsfor road marking applications.
As the result of an extensive researchand development effort, the RoofingUnit succeeded in improving the low-temperature properties of bituminousmembranes. A good understanding ofthe durability, service life and environ-mental effects of roofs and bituminousmembranes was obtained by carryingout a condition survey and life cycleassessment on a number of roofs. Thiswork was done within the framework ofthe vocational training course underwayin the unit.
A certificate based on SFS-EN ISO9001 was awarded for roofing contract-ing. The product development work ofthe Concrete Products Unit focused onnew natural stone products.
B O A R D O F D I R E C T O R S ’ R E P O R T
95 96 97 98 99 95 96 97 98 99 95 96 97 98 99
Net sales Operating profit Profit before extraordinaryitems and taxesEUR
mill.1000
900
800
700
600
500
400
300
200
100
0
EURmill.
50
40
30
20
10
0
EURmill.
50
40
30
20
10
0
L E M M I N K Ä I N E N C O R P O R A T I O N A N N U A L R E P O R T 1 9 9 97
ucts factory. The new plant significantlyreduces the amount of fresh water usedin the grinding of concrete products.The grinding sludge generated duringproduction is processed into a solidform and then recycled back for furtheruse. A study aiming to clarify theimpacts caused by malodorous bitumi-nous vapours continued at Lohja bitu-minous roofing plant. The plant’s envi-ronmental risks were minimised byimproving the storage of chemicals.Dust emanating from the productionprocess was recovered for utilisation.
Impacts on the environment aroundbuilding sites and production plantshave been surveyed in collaborationwith the interest groups concerned.
Group structureLemminkäinen Corporation’s sub-
sidiary Lemminkäinen ConstructionLtd acquired a 70 % interest in ICMInternational Construction Manage-ment Rt, a Hungarian company engagedin project management contracting.Founded in 1989, ICM has constructeda number of office, embassy and indus-trial buildings mainly in and aroundBudapest. Its net sales in 1999 were EUR17.5 million.
In October, Lemminkäinen Corpora-tion acquired Stenberg-Yhtiöt Oy (min-eral aggregate operations) and ForssanBetonituote Oy (production of ready-mixed concrete). The companies’ com-bined net sales in 1999, without thebusinesses excluded from the acquisi-tion, were about EUR 17.3 million.
In December, Lemminkäinen Corpo-ration acquired a 67 % interest in ABVakaru Automagistrale, a Lithuanian
asphalt paving contractor. The compa-ny’s net sales in 1999 were about EUR 2million. After the end of the accountingperiod, an offer to redeem the remain-der of the company’s shares was made tothe minority shareholders. The offer willend on 24.3.2000.
Share capital and sharesLemminkäinen Corporation’s share isincluded in the book entry system forsecurities. The share is listed on Helsin-ki Exchanges. The company has a mar-ket-making agreement with MeritaPankkiiriliike Oy.
The share capital of LemminkäinenCorporation is FIM 170 212 500 (EUR28 627 687.43). Under the Articles ofAssociation the minimum share capitalis FIM 100 000 000 (EUR 16 818 792,64)and the maximum share capital FIM
B O A R D O F D I R E C T O R S ’ R E P O R T
KEY FIGURES BY BUSINESS SECTOR
EUR mill. Net sales Operating profit Net investments Order book
1999 1998 Change 1999 1998 Change 1999 1998 1999 1998
Lemminkäinen CorporationPaving and Mineral Aggregates Division 175.9 177.5 -1.6 19.1 16.9 2.2 21.8 10.8 31.9 23.9Building Materials Division 74.1 71.4 2.7 4.4 3.1 1.3 2.3 2.2 11.4 11.1
Lemminkäinen Construction Ltd 185.0 172.6 12.5 3.2 2.0 1.2 2.8 1.4 112.7 144.5Oy Alfred A. Palmberg Ab 399.6 306.9 92.7 17.5 10.8 6.7 3.3 2.5 230.5 208.7Others -8.3 -12.8 4.5 -1.4 -2.2 0.8 -1.5 0.1
Group total 826.4 715.6 110.8 42.8 30.6 12.2 28.7 17.0 386.6 388.1
95 96 97 98 9995 96 97 98 9995 96 97 98 99
%22
20
18
16
14
12
10
8
6
4
2
0
Return on investment Investments Personnel, average
EURmill.
50
40
30
20
10
0
3 500
3 000
2 500
2 000
1 500
1 000
500
0
L E M M I N K Ä I N E N C O R P O R A T I O N A N N U A L R E P O R T 1 9 9 98
400 000 000 (EUR 67 275 170,58). Thenominal value of the share is FIM 10(EUR 1.68). There are 17 021 250 sharesin the Company and one share series.
The Board of Directors will proposeto the Annual General Meeting that theCompany’s share capital and the nomi-nal value of the Company’s share bedenominated in euro, and that the sharecapital be raised to EUR 34 042 500 bymeans of a EUR 5 414 812.57 bonusissue, whereby the amount correspond-ing to the increase is transferred fromthe share premium account to sharecapital. The nominal value of each shareafter the increase would be EUR 2.00.The bonus issue would not involve theissue of any new shares and the numberof shares would not change.
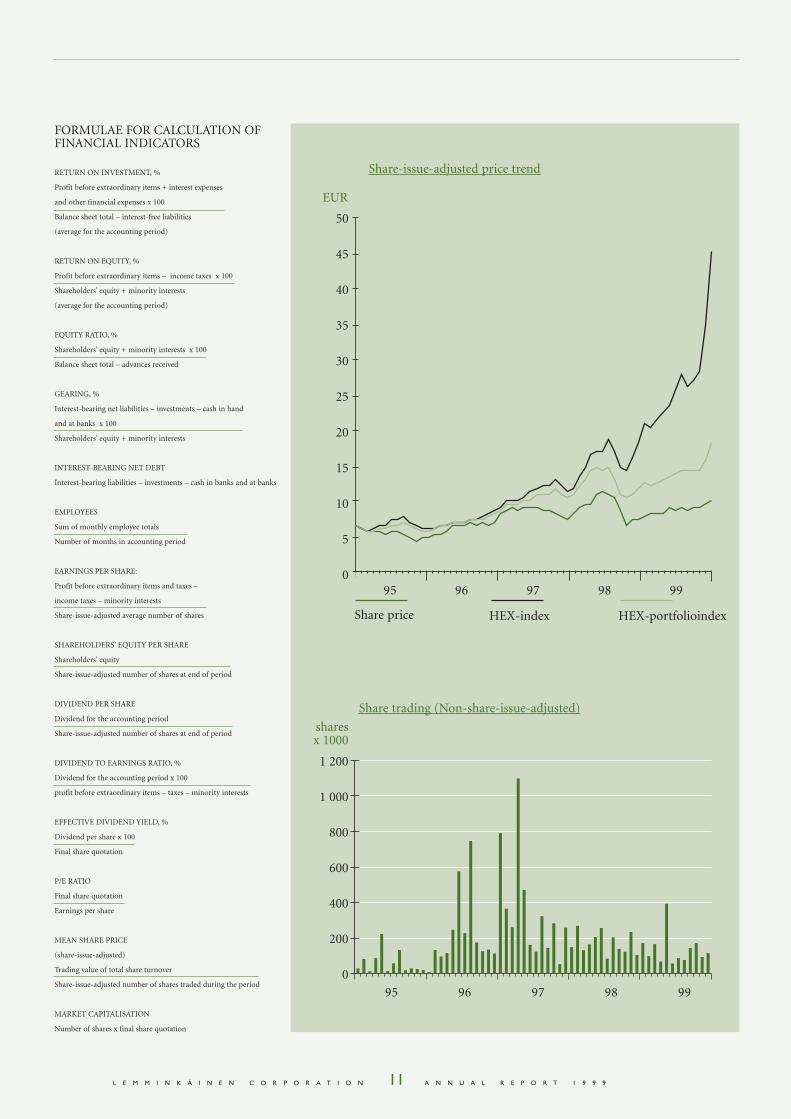
Share price and tradingThe average listed price of Lemminkäi-nen Corporation’s share during theaccounting period was EUR 8.78 (9.32).The year-end price of the Company’sshare was EUR 9.80 (7.57). At the end ofthe year the Company had 1 738 (1 885)shareholders. The trading volume was 1 657 490 shares (2 078 721).
Notice as defined in section 2, article 9of the Securities Market ActDuring the accounting period the com-pany received one notice as defined insection 2, article 9 of the Securities Mar-ket Act. It is based on an amendmentthat came into force on 1st April 1999concerning the flagging thresholds spec-ified in the Securities Market Act.According to the notice, Pohjola Insur-ance Group plc’s shareholding in Lem-minkäinen exceeded the 5 % threshold.
Shareholder agreementsThe Company is not aware of any agree-ments between shareholders whichmight markedly influence voting behav-iour at meetings of shareholders.
Share issue authorisation The Board of Directors is not currentlyauthorised to make a share issue; neitheris it authorised to decide on convertiblepromissory notes, bonds with equitywarrants or the purchase of own shares.
Management share ownershipAs of 31st December 1999, the membersof the Board of Directors and the Man-aging Director held a total of 7 500 062shares, representing 44.1% of the Com-pany’s shares and their conferred votingrights.
AdministrationThe Annual General Meeting of Lem-minkäinen Corporation was held on23rd March 1999.
The Company’s Board of Directorscomprised Messrs. Heikki Pentti (Chair-man), Teppo Taberman (Vice-chair-man), Paul Blomqvist, Erkki J. Penttiand Juhani Sormaala.
The Managing Director of Lem-minkäinen Corporation is Mr. JuhaniSormaala.
The Company's auditors are Messrs.Jan Holmberg, B.Sc. (Econ.), A.P.A. andJarmo Alén, M.Sc. (Econ.), A.P.A. TheDeputy auditors are Authorised PublicAccountants Oy Joe Sundholm & Co. Ab.
Insider rulesNew insider rules corresponding to thelisted company insider rules drawn upby Helsinki Exchanges, the CentralChamber of Commerce of Finland, andthe Confederation of Finnish Industryand Employers will be adopted by Lem-minkäinen Corporation on 1st March2000.
Outlook for the year 2000The growth of domestic buildingdemand is expected to continue. Theforecast annual growth rate is 6-7 %,which is slightly higher than last year.Construction is still forecast to growfaster than GDP, largely as a conse-quence of new building construction.Especially residential, commercial andoffice construction will be brisk. Thenumber of new starts is expected to riseby over 10 %. The growth in civil engi-neering contracting will probably con-tinue at a steady 2-3 %.
Even though the deterioration of thepublic road network is already an estab-lished fact, no significant changes indemand are expected on the domesticmarket of the Paving and MineralAggregates Division. International com-petition is keen in those export markets
where demand is growing. The Divi-sion’s net sales will be boosted mainly bythe companies and business operationsacquired during the accounting period.The aim is to improve the Division’sresult by developing and increasing theproportion of high-value specialtyproducts in the product range.
Demand for the products and ser-vices of the Building Materials Divisionwill probably continue to be briskthanks to the growth of domestic build-ing construction and refurbishmentwork. No significant increase in theDivision’s net sales can be expectedwithout investments in new productioncapacity. Profitability is expected to riseor at least to remain at the level of theaccounting period.
The outlook for Lemminkäinen Con-struction Ltd in both project manage-ment contracting and civil engineeringcontracting is good. Conditions areregarded as being favourable forimproved profits even at the presentlevel of volume.
The growth of Palmberg’s net sales isexpected to continue. Growth will prob-ably be accentuated in the Helsinki Met-ropolitan Area, where construction activ-ity is high. At the end of the year therewere 730 apartments under constructionon own housing development sites. Thenumber of completed own developmentapartments is expected to rise to 850 thisyear. In particular, sales promotion con-cerning a number of current office andcommercial building developments willinfluence the Company’s result.
According to information receivedafter the end of the accounting period,Helsinki Administrative Court has setaside Lemminkäinen Corporation’sreassessed taxation for the year 1990,and has reinstated the Company’s origi-nal tax assessment. There is still a possi-bility of an appeal being made againstthe decision. If the decision gains legalforce, it will mean a EUR 12.8 milliontax rebate, which will be credited plusinterest to the Company’s result.
The favourable development of theconstruction market is expected to con-tinue. Lemminkäinen’s starting pointsfor the year 2000 are good from the per-spectives of both growth and profitabil-ity development.
B O A R D O F D I R E C T O R S ’ R E P O R T
L E M M I N K Ä I N E N C O R P O R A T I O N A N N U A L R E P O R T 1 9 9 99
B O A R D O F D I R E C T O R S ’ R E P O R T
95 96 97 98 99
Equity ratio
%
45
40
35
30
25
20
15
10
5
0
95 96 97 98 99
Earnings per share
EUR2.0
1.5
1.0
0.5
0
95 96 97 98 99
Shareholders’ equity per share
EUR10
9
8
7
6
5
4
3
2
1
0
THE COMPANY’S MAJOR SHAREHOLDERS 31st December 1999
Shareholder Number of % ofshares total
Heikki Pentti 3 813 956 22.41Erkki J. Pentti 3 673 956 21.58Olavi Pentti 3 673 953 21.58Pohjola Non-Life Insurance Company Limited 1 322 400 7.77Varma-Sampo Mutual Pension Insurance Company 441 100 2.59Placeringsfonden Aktia Capital 380 800 2.24Ilmarinen Mutual Pension Insurance Company 300 000 1.76The Local Government Pension Institution 201 800 1.19Tukinvest Oy 201 600 1.18LEL Employment Pension Fund 156 600 0.92
Total, 10 largest 14 166 165 83.22
OWNER GROUPS 31st December 1999
Number of % of share- Shares % ofshareholders holders held total
Households 1 484 85.39 12 215 859 71.77Firms 166 9.55 789 427 4.64Financial institutions 26 1.50 2 287 299 13.43Public corporations 20 1.15 1 313 500 7.72Non-profit organisations 35 2.01 270 100 1.59Foreign owned or nominee-registered 7 0.40 127 335 0.75Others 17 730 0.10
Total 1 738 100.00 17 021 250 100.00
SHARE OWNERSHIP DISTRIBUTION 31st December 1999
Number of shares Number of % of share- Shares % ofper shareholder shareholders holders held total
1 - 100 404 23.25 22 357 0.13101 - 1 000 1 014 58.34 392 201 2.311 001 - 10 000 261 15.02 801 942 4.7110 001 - 100 000 48 2.76 1 373 555 8.07100 001 - 1 000 000 7 0.40 1 805 900 10.611 000 001 - 4 0.23 12 484 265 73.35Nominee-registered shares 123 300 0.72Others 17 730 0.10
Total 1 738 100.00 17 021 250 100.00
L E M M I N K Ä I N E N C O R P O R A T I O N A N N U A L R E P O R T 1 9 9 910
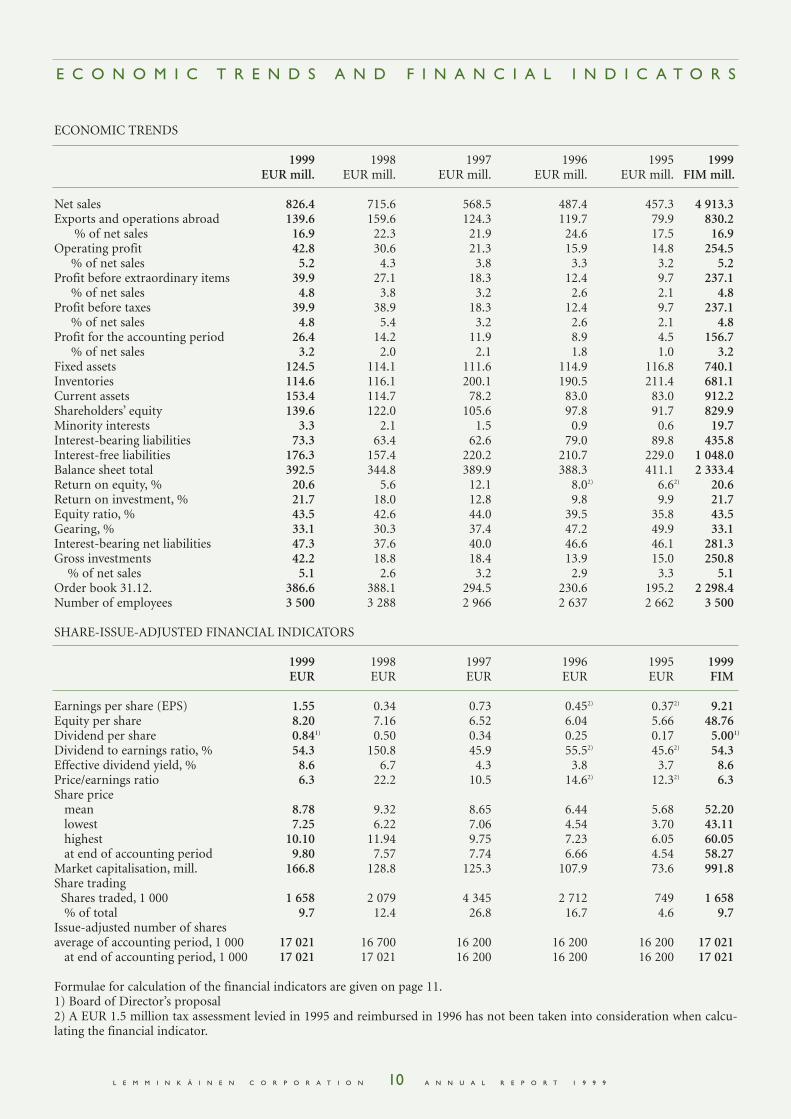
ECONOMIC TRENDS
1999 1998 1997 1996 1995 1999EUR mill. EUR mill. EUR mill. EUR mill. EUR mill. FIM mill.
Net sales 826.4 715.6 568.5 487.4 457.3 4 913.3Exports and operations abroad 139.6 159.6 124.3 119.7 79.9 830.2
% of net sales 16.9 22.3 21.9 24.6 17.5 16.9Operating profit 42.8 30.6 21.3 15.9 14.8 254.5
% of net sales 5.2 4.3 3.8 3.3 3.2 5.2Profit before extraordinary items 39.9 27.1 18.3 12.4 9.7 237.1
% of net sales 4.8 3.8 3.2 2.6 2.1 4.8Profit before taxes 39.9 38.9 18.3 12.4 9.7 237.1
% of net sales 4.8 5.4 3.2 2.6 2.1 4.8Profit for the accounting period 26.4 14.2 11.9 8.9 4.5 156.7
% of net sales 3.2 2.0 2.1 1.8 1.0 3.2Fixed assets 124.5 114.1 111.6 114.9 116.8 740.1Inventories 114.6 116.1 200.1 190.5 211.4 681.1Current assets 153.4 114.7 78.2 83.0 83.0 912.2Shareholders’ equity 139.6 122.0 105.6 97.8 91.7 829.9Minority interests 3.3 2.1 1.5 0.9 0.6 19.7Interest-bearing liabilities 73.3 63.4 62.6 79.0 89.8 435.8Interest-free liabilities 176.3 157.4 220.2 210.7 229.0 1 048.0Balance sheet total 392.5 344.8 389.9 388.3 411.1 2 333.4Return on equity, % 20.6 5.6 12.1 8.02) 6.62) 20.6Return on investment, % 21.7 18.0 12.8 9.8 9.9 21.7Equity ratio, % 43.5 42.6 44.0 39.5 35.8 43.5Gearing, % 33.1 30.3 37.4 47.2 49.9 33.1Interest-bearing net liabilities 47.3 37.6 40.0 46.6 46.1 281.3Gross investments 42.2 18.8 18.4 13.9 15.0 250.8
% of net sales 5.1 2.6 3.2 2.9 3.3 5.1Order book 31.12. 386.6 388.1 294.5 230.6 195.2 2 298.4Number of employees 3 500 3 288 2 966 2 637 2 662 3 500
SHARE-ISSUE-ADJUSTED FINANCIAL INDICATORS
1999 1998 1997 1996 1995 1999EUR EUR EUR EUR EUR FIM
Earnings per share (EPS) 1.55 0.34 0.73 0.452) 0.372) 9.21Equity per share 8.20 7.16 6.52 6.04 5.66 48.76Dividend per share 0.841) 0.50 0.34 0.25 0.17 5.001)
Dividend to earnings ratio, % 54.3 150.8 45.9 55.52) 45.62) 54.3Effective dividend yield, % 8.6 6.7 4.3 3.8 3.7 8.6Price/earnings ratio 6.3 22.2 10.5 14.62) 12.32) 6.3Share price
mean 8.78 9.32 8.65 6.44 5.68 52.20lowest 7.25 6.22 7.06 4.54 3.70 43.11highest 10.10 11.94 9.75 7.23 6.05 60.05at end of accounting period 9.80 7.57 7.74 6.66 4.54 58.27
Market capitalisation, mill. 166.8 128.8 125.3 107.9 73.6 991.8Share trading
Shares traded, 1 000 1 658 2 079 4 345 2 712 749 1 658% of total 9.7 12.4 26.8 16.7 4.6 9.7
Issue-adjusted number of sharesaverage of accounting period, 1 000 17 021 16 700 16 200 16 200 16 200 17 021
at end of accounting period, 1 000 17 021 17 021 16 200 16 200 16 200 17 021
Formulae for calculation of the financial indicators are given on page 11.1) Board of Director’s proposal
E C O N O M I C T R E N D S A N D F I N A N C I A L I N D I C A T O R S
2) A EUR 1.5 million tax assessment levied in 1995 and reimbursed in 1996 has not been taken into consideration when calcu-lating the financial indicator.
FORMULAE FOR CALCULATION OF FINANCIAL INDICATORS
RETURN ON INVESTMENT, %
Profit before extraordinary items + interest expenses
and other financial expenses x 100
Balance sheet total – interest-free liabilities
(average for the accounting period)
RETURN ON EQUITY, %
Profit before extraordinary items – income taxes x 100
Shareholders’ equity + minority interests
(average for the accounting period)
EQUITY RATIO, %
Shareholders’ equity + minority interests x 100
Balance sheet total – advances received
GEARING, %
Interest-bearing net liabilities – investments – cash in hand
and at banks x 100
Shareholders’ equity + minority interests
INTEREST-BEARING NET DEBT
Interest-bearing liabilities – investments – cash in banks and at banks
EMPLOYEES
Sum of monthly employee totals
Number of months in accounting period
EARNINGS PER SHARE:
Profit before extraordinary items and taxes –
income taxes – minority interests
Share-issue-adjusted average number of shares
SHAREHOLDERS’ EQUITY PER SHARE
Shareholders’ equity
Share-issue-adjusted number of shares at end of period
DIVIDEND PER SHARE
Dividend for the accounting period
Share-issue-adjusted number of shares at end of period
DIVIDEND TO EARNINGS RATIO, %
Dividend for the accounting period x 100
profit before extraordinary items – taxes – minority interests
EFFECTIVE DIVIDEND YIELD, %
Dividend per share x 100
Final share quotation
P/E RATIO
Final share quotation
Earnings per share
MEAN SHARE PRICE
(share-issue-adjusted)
Trading value of total share turnover
Share-issue-adjusted number of shares traded during the period
MARKET CAPITALISATION
Number of shares x final share quotation
L E M M I N K Ä I N E N C O R P O R A T I O N A N N U A L R E P O R T 1 9 9 911
Share price HEX-index HEX-portfolioindex
Share trading (Non-share-issue-adjusted)
Share-issue-adjusted price trend
sharesx 1000
1 200
1 000
800
600
400
200
0
50
45
40
35
30
25
20
15
10
5
0
95 96 97 98 99
95 96 97 98 99
EUR
L E M M I N K Ä I N E N C O R P O R A T I O N A N N U A L R E P O R T 1 9 9 912
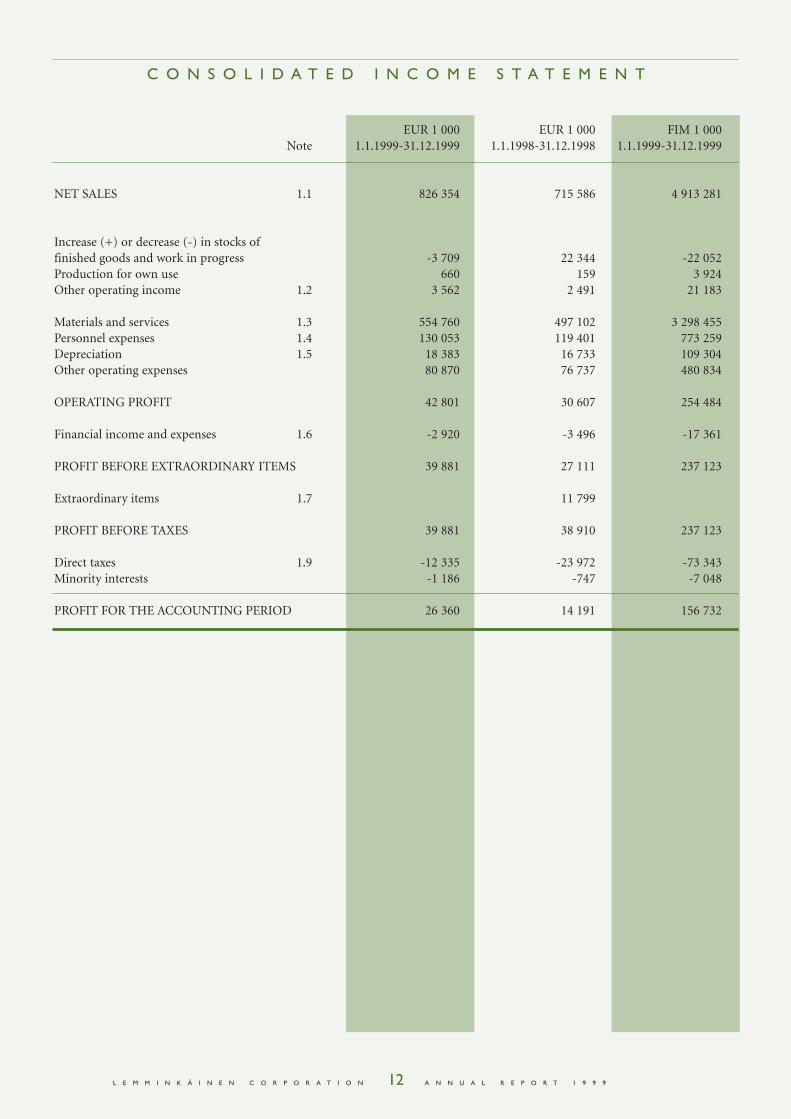
EUR 1 000 EUR 1 000 FIM 1 000Note 1.1.1999-31.12.1999 1.1.1998-31.12.1998 1.1.1999-31.12.1999
NET SALES 1.1 826 354 715 586 4 913 281
Increase (+) or decrease (-) in stocks offinished goods and work in progress -3 709 22 344 -22 052Production for own use 660 159 3 924Other operating income 1.2 3 562 2 491 21 183
Materials and services 1.3 554 760 497 102 3 298 455Personnel expenses 1.4 130 053 119 401 773 259Depreciation 1.5 18 383 16 733 109 304Other operating expenses 80 870 76 737 480 834
OPERATING PROFIT 42 801 30 607 254 484
Financial income and expenses 1.6 -2 920 -3 496 -17 361
PROFIT BEFORE EXTRAORDINARY ITEMS 39 881 27 111 237 123
Extraordinary items 1.7 11 799
PROFIT BEFORE TAXES 39 881 38 910 237 123
Direct taxes 1.9 -12 335 -23 972 -73 343Minority interests -1 186 -747 -7 048
PROFIT FOR THE ACCOUNTING PERIOD 26 360 14 191 156 732
C O N S O L I D A T E D I N C O M E S T A T E M E N T
L E M M I N K Ä I N E N C O R P O R A T I O N A N N U A L R E P O R T 1 9 9 913
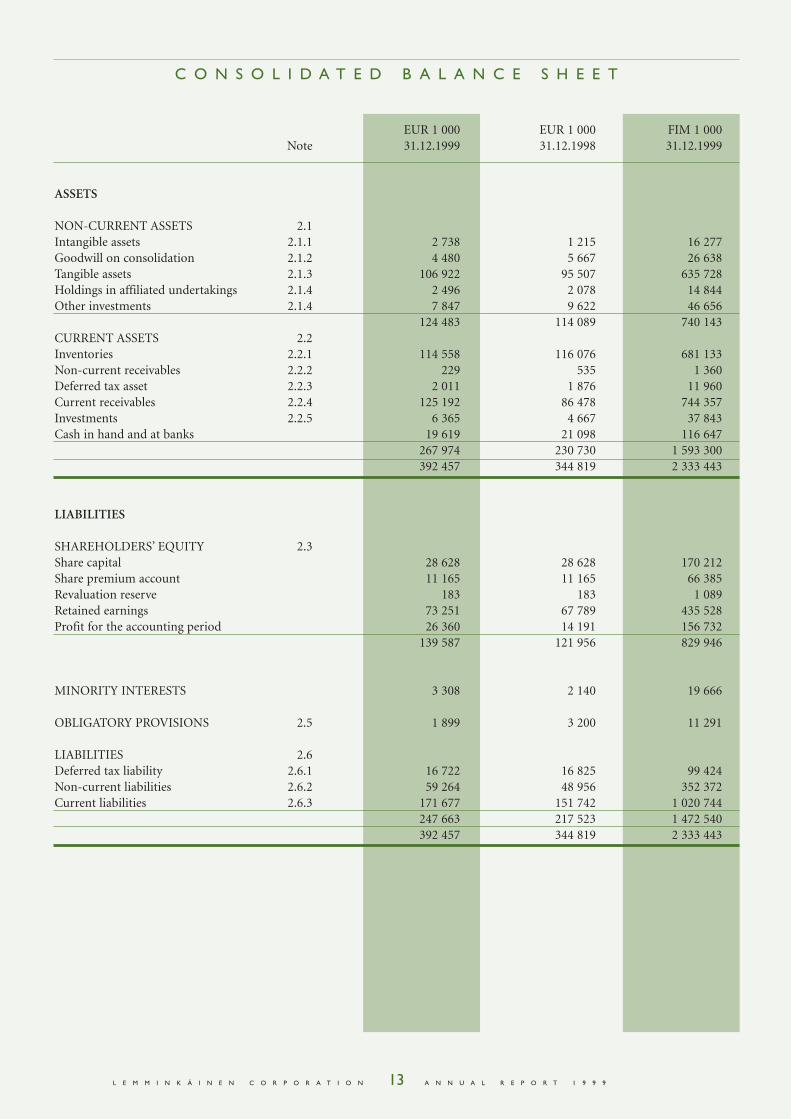
EUR 1 000 EUR 1 000 FIM 1 000Note 31.12.1999 31.12.1998 31.12.1999
ASSETS
NON-CURRENT ASSETS 2.1Intangible assets 2.1.1 2 738 1 215 16 277Goodwill on consolidation 2.1.2 4 480 5 667 26 638Tangible assets 2.1.3 106 922 95 507 635 728Holdings in affiliated undertakings 2.1.4 2 496 2 078 14 844Other investments 2.1.4 7 847 9 622 46 656
124 483 114 089 740 143CURRENT ASSETS 2.2Inventories 2.2.1 114 558 116 076 681 133Non-current receivables 2.2.2 229 535 1 360Deferred tax asset 2.2.3 2 011 1 876 11 960Current receivables 2.2.4 125 192 86 478 744 357Investments 2.2.5 6 365 4 667 37 843Cash in hand and at banks 19 619 21 098 116 647
267 974 230 730 1 593 300392 457 344 819 2 333 443
LIABILITIES
SHAREHOLDERS’ EQUITY 2.3Share capital 28 628 28 628 170 212Share premium account 11 165 11 165 66 385Revaluation reserve 183 183 1 089Retained earnings 73 251 67 789 435 528Profit for the accounting period 26 360 14 191 156 732
139 587 121 956 829 946
MINORITY INTERESTS 3 308 2 140 19 666
OBLIGATORY PROVISIONS 2.5 1 899 3 200 11 291
LIABILITIES 2.6Deferred tax liability 2.6.1 16 722 16 825 99 424Non-current liabilities 2.6.2 59 264 48 956 352 372Current liabilities 2.6.3 171 677 151 742 1 020 744
247 663 217 523 1 472 540392 457 344 819 2 333 443
C O N S O L I D A T E D B A L A N C E S H E E T
L E M M I N K Ä I N E N C O R P O R A T I O N A N N U A L R E P O R T 1 9 9 914
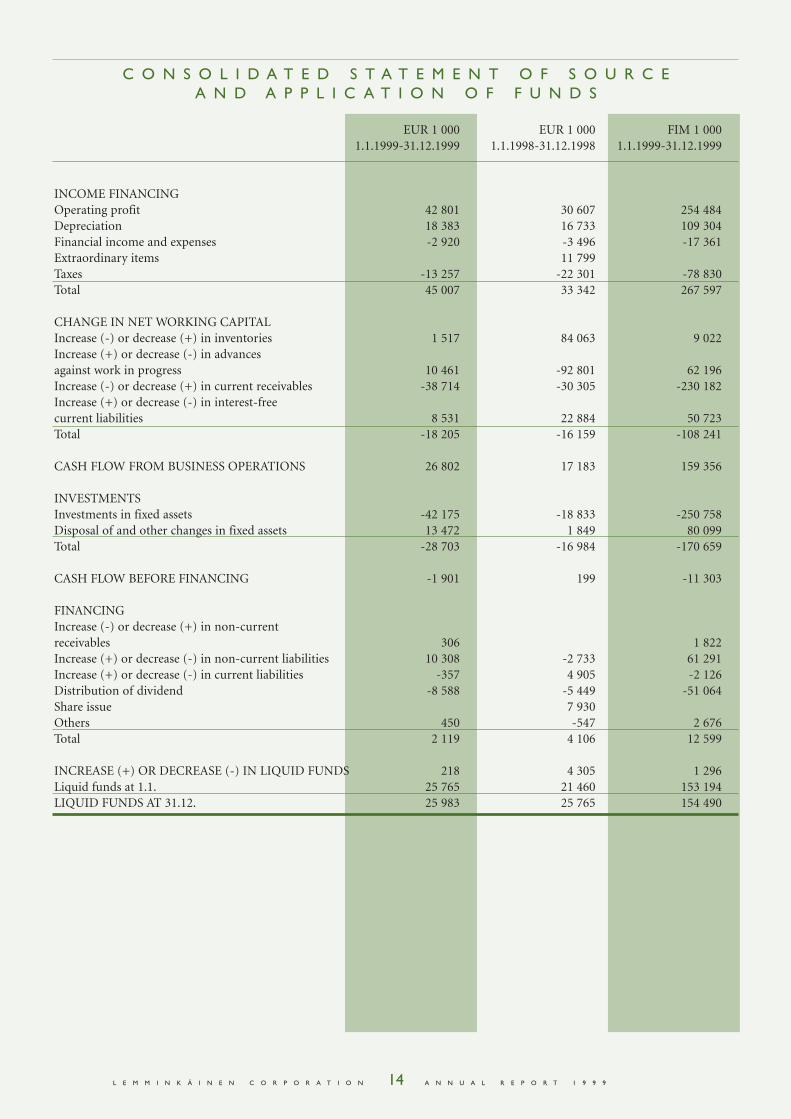
EUR 1 000 EUR 1 000 FIM 1 0001.1.1999-31.12.1999 1.1.1998-31.12.1998 1.1.1999-31.12.1999
INCOME FINANCINGOperating profit 42 801 30 607 254 484Depreciation 18 383 16 733 109 304Financial income and expenses -2 920 -3 496 -17 361Extraordinary items 11 799Taxes -13 257 -22 301 -78 830Total 45 007 33 342 267 597
CHANGE IN NET WORKING CAPITALIncrease (-) or decrease (+) in inventories 1 517 84 063 9 022Increase (+) or decrease (-) in advancesagainst work in progress 10 461 -92 801 62 196Increase (-) or decrease (+) in current receivables -38 714 -30 305 -230 182Increase (+) or decrease (-) in interest-free current liabilities 8 531 22 884 50 723Total -18 205 -16 159 -108 241
CASH FLOW FROM BUSINESS OPERATIONS 26 802 17 183 159 356
INVESTMENTSInvestments in fixed assets -42 175 -18 833 -250 758Disposal of and other changes in fixed assets 13 472 1 849 80 099Total -28 703 -16 984 -170 659
CASH FLOW BEFORE FINANCING -1 901 199 -11 303
FINANCINGIncrease (-) or decrease (+) in non-current receivables 306 1 822Increase (+) or decrease (-) in non-current liabilities 10 308 -2 733 61 291Increase (+) or decrease (-) in current liabilities -357 4 905 -2 126Distribution of dividend -8 588 -5 449 -51 064Share issue 7 930Others 450 -547 2 676Total 2 119 4 106 12 599
INCREASE (+) OR DECREASE (-) IN LIQUID FUNDS 218 4 305 1 296Liquid funds at 1.1. 25 765 21 460 153 194LIQUID FUNDS AT 31.12. 25 983 25 765 154 490
C O N S O L I D A T E D S T A T E M E N T O F S O U R C E A N D A P P L I C A T I O N O F F U N D S
L E M M I N K Ä I N E N C O R P O R A T I O N A N N U A L R E P O R T 1 9 9 915
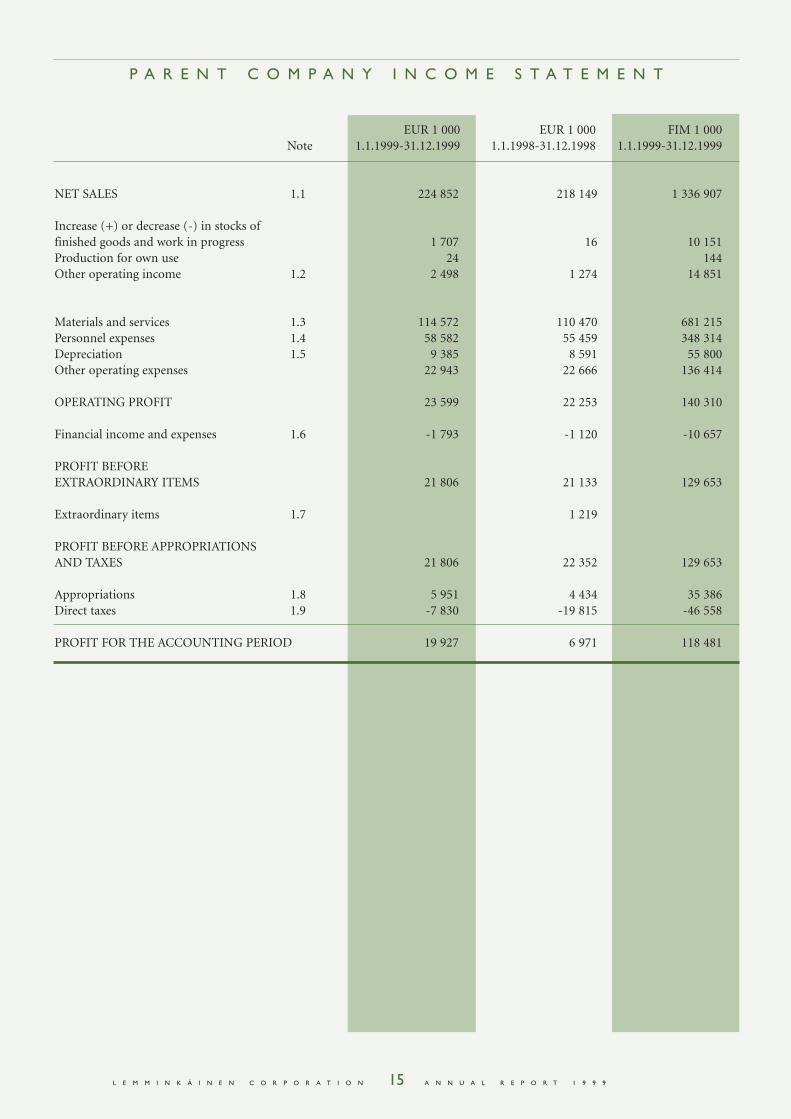
EUR 1 000 EUR 1 000 FIM 1 000Note 1.1.1999-31.12.1999 1.1.1998-31.12.1998 1.1.1999-31.12.1999
NET SALES 1.1 224 852 218 149 1 336 907
Increase (+) or decrease (-) in stocks offinished goods and work in progress 1 707 16 10 151Production for own use 24 144Other operating income 1.2 2 498 1 274 14 851
Materials and services 1.3 114 572 110 470 681 215Personnel expenses 1.4 58 582 55 459 348 314Depreciation 1.5 9 385 8 591 55 800Other operating expenses 22 943 22 666 136 414
OPERATING PROFIT 23 599 22 253 140 310
Financial income and expenses 1.6 -1 793 -1 120 -10 657
PROFIT BEFORE EXTRAORDINARY ITEMS 21 806 21 133 129 653
Extraordinary items 1.7 1 219
PROFIT BEFORE APPROPRIATIONS AND TAXES 21 806 22 352 129 653
Appropriations 1.8 5 951 4 434 35 386Direct taxes 1.9 -7 830 -19 815 -46 558
PROFIT FOR THE ACCOUNTING PERIOD 19 927 6 971 118 481
P A R E N T C O M P A N Y I N C O M E S T A T E M E N T
L E M M I N K Ä I N E N C O R P O R A T I O N A N N U A L R E P O R T 1 9 9 916
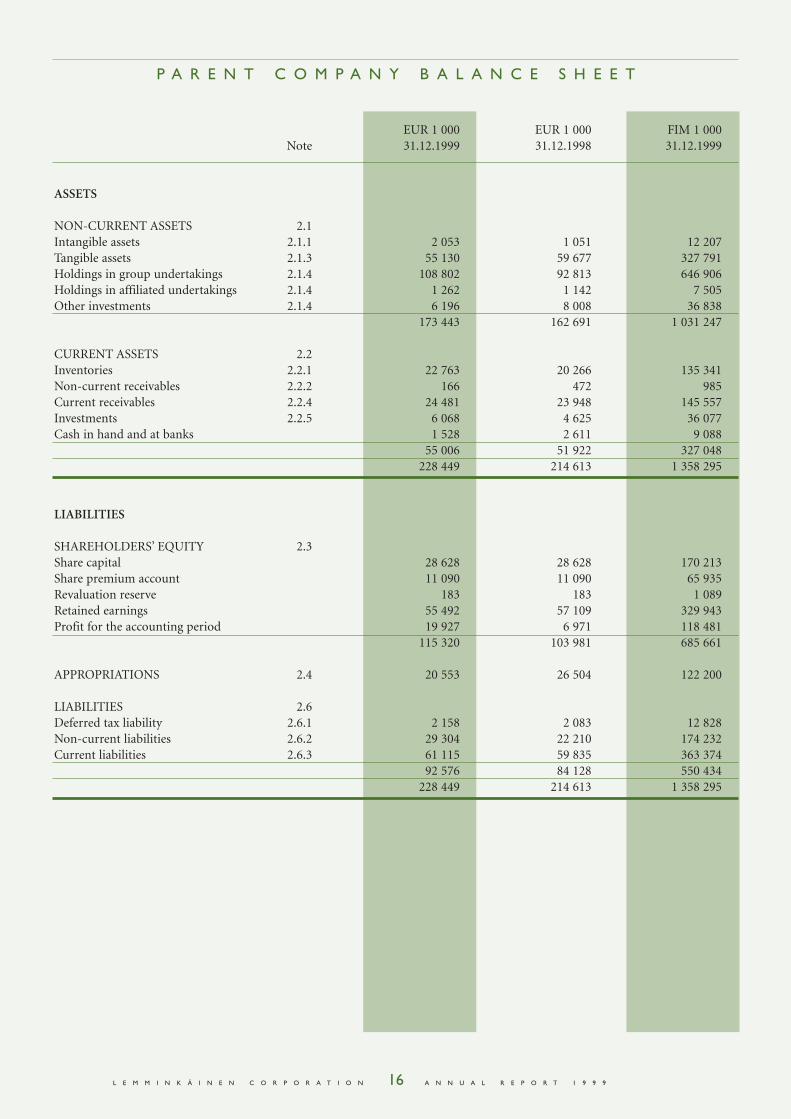
EUR 1 000 EUR 1 000 FIM 1 000Note 31.12.1999 31.12.1998 31.12.1999
ASSETS
NON-CURRENT ASSETS 2.1Intangible assets 2.1.1 2 053 1 051 12 207Tangible assets 2.1.3 55 130 59 677 327 791Holdings in group undertakings 2.1.4 108 802 92 813 646 906Holdings in affiliated undertakings 2.1.4 1 262 1 142 7 505Other investments 2.1.4 6 196 8 008 36 838
173 443 162 691 1 031 247
CURRENT ASSETS 2.2Inventories 2.2.1 22 763 20 266 135 341Non-current receivables 2.2.2 166 472 985Current receivables 2.2.4 24 481 23 948 145 557Investments 2.2.5 6 068 4 625 36 077Cash in hand and at banks 1 528 2 611 9 088
55 006 51 922 327 048228 449 214 613 1 358 295
LIABILITIES
SHAREHOLDERS’ EQUITY 2.3Share capital 28 628 28 628 170 213Share premium account 11 090 11 090 65 935Revaluation reserve 183 183 1 089Retained earnings 55 492 57 109 329 943Profit for the accounting period 19 927 6 971 118 481
115 320 103 981 685 661
APPROPRIATIONS 2.4 20 553 26 504 122 200
LIABILITIES 2.6Deferred tax liability 2.6.1 2 158 2 083 12 828Non-current liabilities 2.6.2 29 304 22 210 174 232Current liabilities 2.6.3 61 115 59 835 363 374
92 576 84 128 550 434228 449 214 613 1 358 295
P A R E N T C O M P A N Y B A L A N C E S H E E T
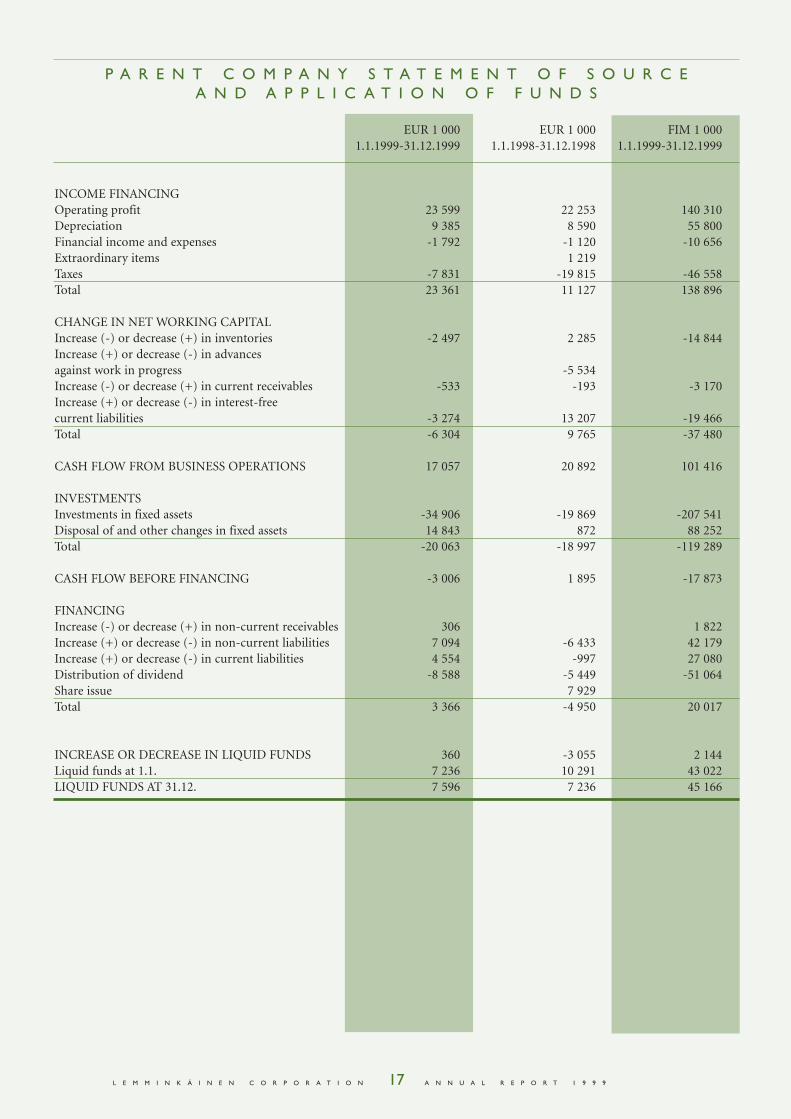
L E M M I N K Ä I N E N C O R P O R A T I O N A N N U A L R E P O R T 1 9 9 917
EUR 1 000 EUR 1 000 FIM 1 0001.1.1999-31.12.1999 1.1.1998-31.12.1998 1.1.1999-31.12.1999
INCOME FINANCINGOperating profit 23 599 22 253 140 310Depreciation 9 385 8 590 55 800Financial income and expenses -1 792 -1 120 -10 656Extraordinary items 1 219Taxes -7 831 -19 815 -46 558Total 23 361 11 127 138 896
CHANGE IN NET WORKING CAPITALIncrease (-) or decrease (+) in inventories -2 497 2 285 -14 844Increase (+) or decrease (-) in advances against work in progress -5 534Increase (-) or decrease (+) in current receivables -533 -193 -3 170Increase (+) or decrease (-) in interest-free current liabilities -3 274 13 207 -19 466Total -6 304 9 765 -37 480
CASH FLOW FROM BUSINESS OPERATIONS 17 057 20 892 101 416
INVESTMENTSInvestments in fixed assets -34 906 -19 869 -207 541Disposal of and other changes in fixed assets 14 843 872 88 252Total -20 063 -18 997 -119 289
CASH FLOW BEFORE FINANCING -3 006 1 895 -17 873
FINANCINGIncrease (-) or decrease (+) in non-current receivables 306 1 822Increase (+) or decrease (-) in non-current liabilities 7 094 -6 433 42 179Increase (+) or decrease (-) in current liabilities 4 554 -997 27 080Distribution of dividend -8 588 -5 449 -51 064Share issue 7 929Total 3 366 -4 950 20 017
INCREASE OR DECREASE IN LIQUID FUNDS 360 -3 055 2 144Liquid funds at 1.1. 7 236 10 291 43 022LIQUID FUNDS AT 31.12. 7 596 7 236 45 166
P A R E N T C O M P A N Y S T A T E M E N T O F S O U R C E A N D A P P L I C A T I O N O F F U N D S
L E M M I N K Ä I N E N C O R P O R A T I O N A N N U A L R E P O R T 1 9 9 918
Consolidated financial statementsAll the group and affiliated undertak-ings classified as fixed assets are includ-ed in the consolidated financial state-ments.
Intra-group shareholdings have beeneliminated using the past equitymethod, whereby the acquisition cost ofshares in subsidiary undertakings hasbeen eliminated against the sharehold-ers’ equity of the subsidiary undertak-ings at the time of acquisition. The pro-visions of subsidiary undertakings at thetime of acquisition less the deferred taxliability are included in shareholders’equity. Where the cost of acquiringshares in a subsidiary undertakingexceeds the corresponding value of itsshareholders’ equity, the excess isassigned to fixed assets and/or goodwill.Goodwill accrued prior to 1st September1993 is written off over ten years, andafter that date over five years.
Intra-group transactions and theinternal margin included in inventorieshave been eliminated in the consolidat-ed income statement, as have intra-group receivables, liabilities and divi-dend payments.
Minority interests have been deduct-ed from the Group’s profit and share-holders’ equity and entered as a separateitem in the consolidated income state-ment and balance sheet.
Figures from the final accounts offoreign subsidiary undertakings havebeen converted into Finnish marks atthe rates of exchange quoted by theBank of Finland on the last day of theaccounting period. Translation differ-ences arising from eliminations of theshareholders’ equity in foreign sub-sidiary undertakings have been recordedin shareholders’ equity.
The accounts of affiliated undertak-ings have been consolidated using theequity method. The Group's share of theprofit/loss of affiliated undertakings onthe basis of proportional ownership isentered in the consolidated incomestatement under other operatingincome/expenses.
Recognition of income from construction projectsSince 1st January 1998 the consolidatedand parent company financial state-
A C C O U N T I N G P R I N C I P L E S
ments have been prepared in accordancewith the percentage-of-completionmethod, whereby income from con-struction projects is recognised accord-ing to the degree of project completion.Although the completed contractmethod of income recognition has stillbeen used in the official financial state-ments of subsidiary undertakings, theyhave prepared additional financial state-ments based on the percentage-of-com-pletion method. The degree of projectcompletion is calculated as the ratio ofactually incurred expenses to estimatedtotal expenses. Anticipated losses fromunprofitable projects on the order bookare recorded in total as expenses.
Valuation and depreciation offixed assetsFixed assets are shown on the balancesheet at their original acquisition costsless accumulated annual planned depre-ciation. In addition, the values of someland, buildings and shareholdingsinclude re-valuation increases, whichare based on professional market valua-tions of the assets in question.
Depreciation according to plan iscomputed using the straight-linemethod and is based on the economiclifetimes of the assets.
The depreciation periods are as follows:
Intangible assets- goodwill 5 or 10 years- others 5 or 10 yearsOffice buildings 40 yearsOther buildings 15-25 yearsMachinery and equipment 4-10 yearsOther tangible assets- mineral deposits depreciation for
decrease ofsubstance
- others 10 years
Depreciation has not been charged tothe revaluation increases. The revalua-tion increase applying to any item soldin connection with the disposal of fixedassets has been cancelled.
Valuation of inventoriesInventories have been valued accordingto the FIFO principle at their acquisi-tion cost or, if lower, their new acquisi-
tion price or probable selling price. Thevalue of inventories includes the vari-able expenditure arising from theiracquisition and production.
Valuation of financial assetsInvestments are valued at their acquisi-tion cost or, if lower, their market value.
Foreign currency itemsReceivables and liabilities denominatedin foreign currencies have been convert-ed into Finnish marks at the rates ofexchange quoted by the Bank of Finlandon the last day of the accounting period.Foreign currency receivables and liabili-ties protected by forward rate agree-ments are valued at the forward rate,and the interest share is periodised onthe basis of the duration of the agree-ments.
Pension liabilityPension security for employees of theGroup, inclusive of additional benefits,is covered by policies with pensioninsurance companies.
Research and developmentexpenses R&D expenses are recorded in the yearduring which they are incurred.
Financial leasingFinancial leasing payments are recordedas annual expenses. The remainingrental payments of financial leasing con-tracts are presented in the notes to thefinancial statements under liabilities.
Direct taxesTaxes calculated on the basis of theresults of group undertakings for theaccounting period, adjustments to thetaxes of earlier accounting periods, andthe change in the deferred tax liabilityand asset are recorded as direct taxes onthe consolidated income statement. Thedeferred tax liability or asset is calculat-ed for the timing differences betweentaxation and accounting using the taxrate in force at the closing of theaccounts. Confirmed losses that aredeductible against taxation are treatedas a tax asset to the extent that the Com-pany will likely be able to utilise them inthe near future.
L E M M I N K Ä I N E N C O R P O R A T I O N A N N U A L R E P O R T 1 9 9 919
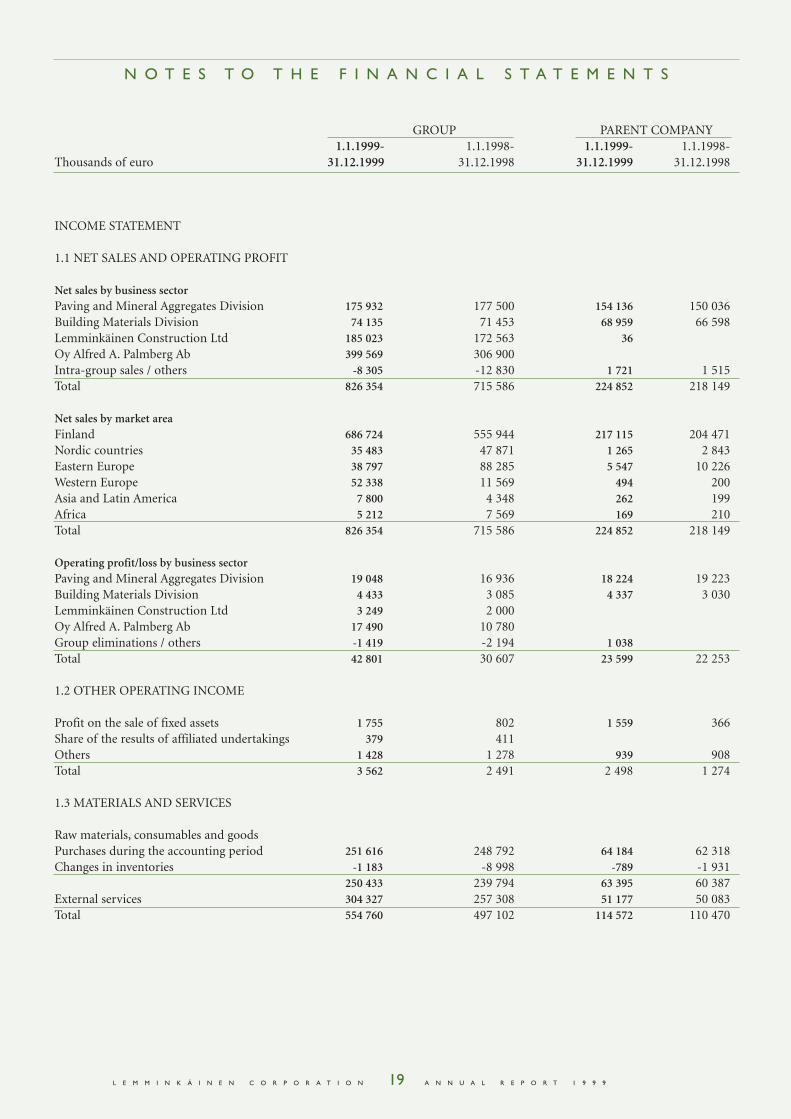
INCOME STATEMENT
1.1 NET SALES AND OPERATING PROFIT
Net sales by business sectorPaving and Mineral Aggregates Division 175 932 177 500 154 136 150 036Building Materials Division 74 135 71 453 68 959 66 598Lemminkäinen Construction Ltd 185 023 172 563 36Oy Alfred A. Palmberg Ab 399 569 306 900Intra-group sales / others -8 305 -12 830 1 721 1 515Total 826 354 715 586 224 852 218 149
Net sales by market areaFinland 686 724 555 944 217 115 204 471Nordic countries 35 483 47 871 1 265 2 843Eastern Europe 38 797 88 285 5 547 10 226Western Europe 52 338 11 569 494 200Asia and Latin America 7 800 4 348 262 199Africa 5 212 7 569 169 210Total 826 354 715 586 224 852 218 149
Operating profit/loss by business sectorPaving and Mineral Aggregates Division 19 048 16 936 18 224 19 223Building Materials Division 4 433 3 085 4 337 3 030Lemminkäinen Construction Ltd 3 249 2 000Oy Alfred A. Palmberg Ab 17 490 10 780Group eliminations / others -1 419 -2 194 1 038Total 42 801 30 607 23 599 22 253
1.2 OTHER OPERATING INCOME
Profit on the sale of fixed assets 1 755 802 1 559 366Share of the results of affiliated undertakings 379 411Others 1 428 1 278 939 908Total 3 562 2 491 2 498 1 274
1.3 MATERIALS AND SERVICES
Raw materials, consumables and goodsPurchases during the accounting period 251 616 248 792 64 184 62 318Changes in inventories -1 183 -8 998 -789 -1 931
250 433 239 794 63 395 60 387External services 304 327 257 308 51 177 50 083Total 554 760 497 102 114 572 110 470
N O T E S T O T H E F I N A N C I A L S T A T E M E N T S
GROUP PARENT COMPANY1.1.1999- 1.1.1998- 1.1.1999- 1.1.1998-
Thousands of euro 31.12.1999 31.12.1998 31.12.1999 31.12.1998
L E M M I N K Ä I N E N C O R P O R A T I O N A N N U A L R E P O R T 1 9 9 920
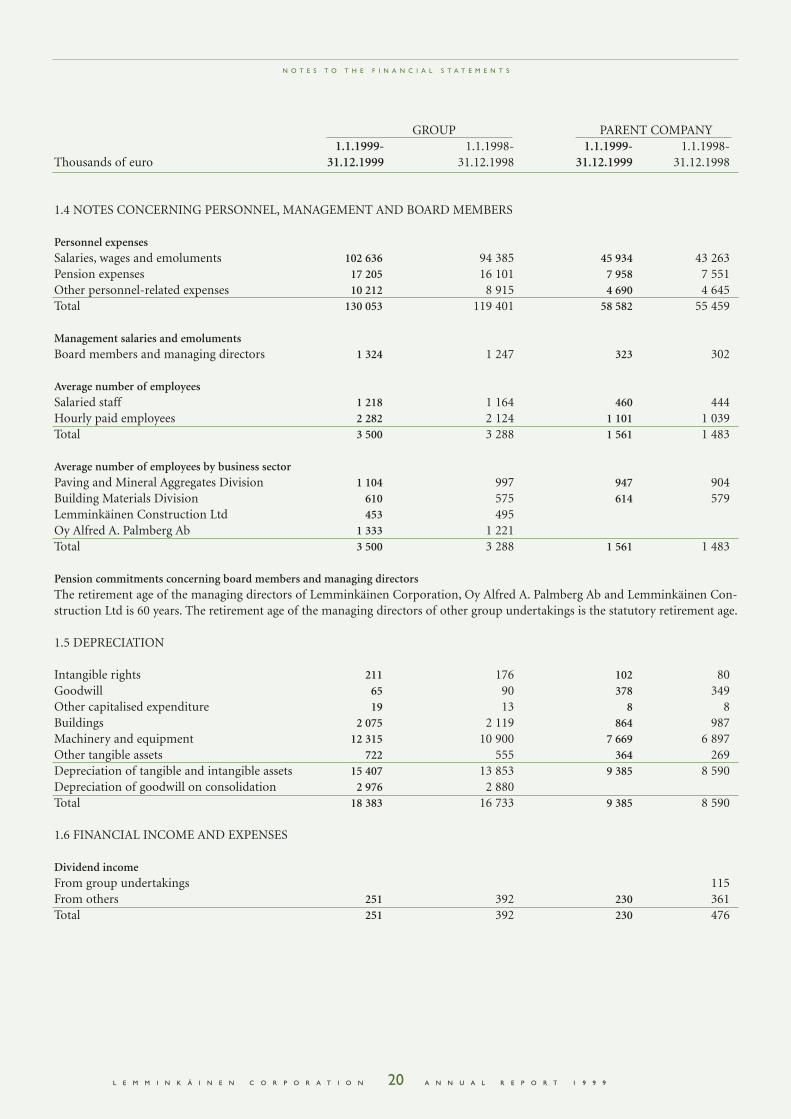
1.4 NOTES CONCERNING PERSONNEL, MANAGEMENT AND BOARD MEMBERS
Personnel expensesSalaries, wages and emoluments 102 636 94 385 45 934 43 263Pension expenses 17 205 16 101 7 958 7 551Other personnel-related expenses 10 212 8 915 4 690 4 645Total 130 053 119 401 58 582 55 459
Management salaries and emolumentsBoard members and managing directors 1 324 1 247 323 302
Average number of employeesSalaried staff 1 218 1 164 460 444Hourly paid employees 2 282 2 124 1 101 1 039Total 3 500 3 288 1 561 1 483
Average number of employees by business sectorPaving and Mineral Aggregates Division 1 104 997 947 904Building Materials Division 610 575 614 579Lemminkäinen Construction Ltd 453 495Oy Alfred A. Palmberg Ab 1 333 1 221Total 3 500 3 288 1 561 1 483
Pension commitments concerning board members and managing directorsThe retirement age of the managing directors of Lemminkäinen Corporation, Oy Alfred A. Palmberg Ab and Lemminkäinen Con-struction Ltd is 60 years. The retirement age of the managing directors of other group undertakings is the statutory retirement age.
1.5 DEPRECIATION
Intangible rights 211 176 102 80Goodwill 65 90 378 349Other capitalised expenditure 19 13 8 8Buildings 2 075 2 119 864 987Machinery and equipment 12 315 10 900 7 669 6 897Other tangible assets 722 555 364 269Depreciation of tangible and intangible assets 15 407 13 853 9 385 8 590Depreciation of goodwill on consolidation 2 976 2 880Total 18 383 16 733 9 385 8 590
1.6 FINANCIAL INCOME AND EXPENSES
Dividend incomeFrom group undertakings 115From others 251 392 230 361Total 251 392 230 476
N O T E S T O T H E F I N A N C I A L S T A T E M E N T S
GROUP PARENT COMPANY1.1.1999- 1.1.1998- 1.1.1999- 1.1.1998-
Thousands of euro 31.12.1999 31.12.1998 31.12.1999 31.12.1998
L E M M I N K Ä I N E N C O R P O R A T I O N A N N U A L R E P O R T 1 9 9 921
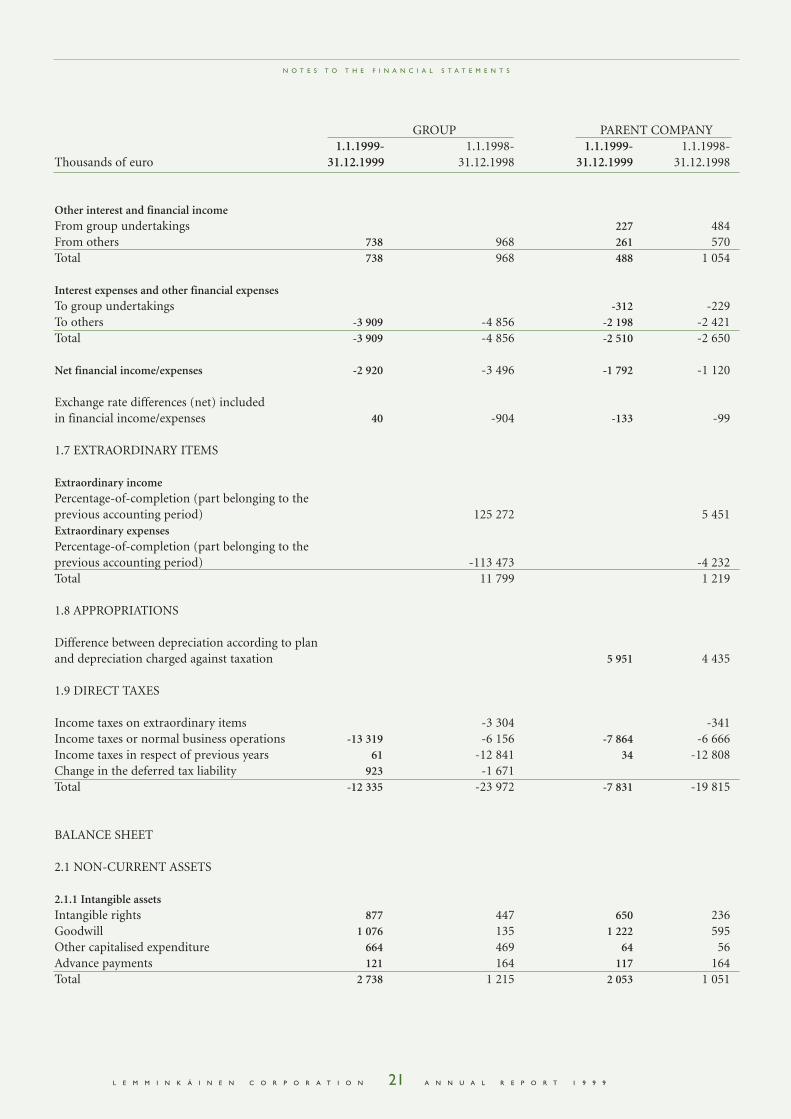
Other interest and financial income From group undertakings 227 484From others 738 968 261 570Total 738 968 488 1 054
Interest expenses and other financial expensesTo group undertakings -312 -229To others -3 909 -4 856 -2 198 -2 421Total -3 909 -4 856 -2 510 -2 650
Net financial income/expenses -2 920 -3 496 -1 792 -1 120
Exchange rate differences (net) included in financial income/expenses 40 -904 -133 -99
1.7 EXTRAORDINARY ITEMS
Extraordinary incomePercentage-of-completion (part belonging to the previous accounting period) 125 272 5 451Extraordinary expensesPercentage-of-completion (part belonging to the previous accounting period) -113 473 -4 232Total 11 799 1 219
1.8 APPROPRIATIONS
Difference between depreciation according to plan and depreciation charged against taxation 5 951 4 435
1.9 DIRECT TAXES
Income taxes on extraordinary items -3 304 -341Income taxes or normal business operations -13 319 -6 156 -7 864 -6 666Income taxes in respect of previous years 61 -12 841 34 -12 808Change in the deferred tax liability 923 -1 671Total -12 335 -23 972 -7 831 -19 815
BALANCE SHEET
2.1 NON-CURRENT ASSETS
2.1.1 Intangible assetsIntangible rights 877 447 650 236Goodwill 1 076 135 1 222 595Other capitalised expenditure 664 469 64 56Advance payments 121 164 117 164Total 2 738 1 215 2 053 1 051
N O T E S T O T H E F I N A N C I A L S T A T E M E N T S
GROUP PARENT COMPANY1.1.1999- 1.1.1998- 1.1.1999- 1.1.1998-
Thousands of euro 31.12.1999 31.12.1998 31.12.1999 31.12.1998
L E M M I N K Ä I N E N C O R P O R A T I O N A N N U A L R E P O R T 1 9 9 922
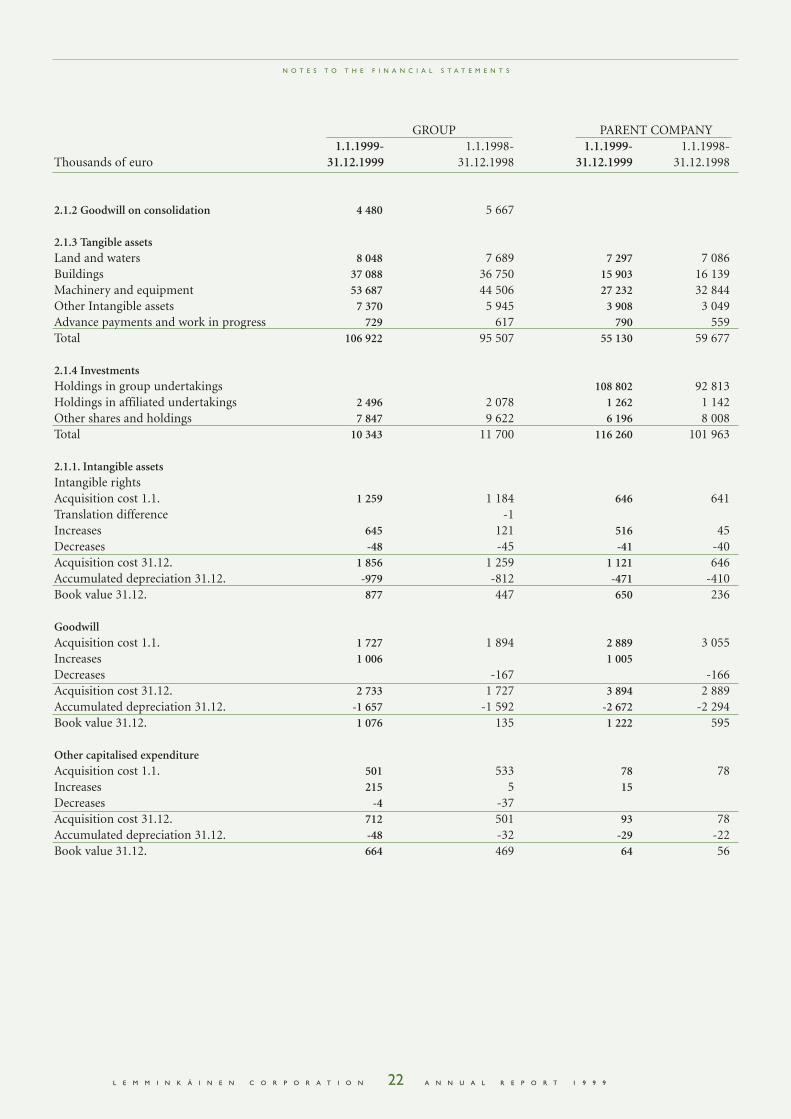
2.1.2 Goodwill on consolidation 4 480 5 667
2.1.3 Tangible assetsLand and waters 8 048 7 689 7 297 7 086Buildings 37 088 36 750 15 903 16 139Machinery and equipment 53 687 44 506 27 232 32 844Other Intangible assets 7 370 5 945 3 908 3 049Advance payments and work in progress 729 617 790 559Total 106 922 95 507 55 130 59 677
2.1.4 InvestmentsHoldings in group undertakings 108 802 92 813Holdings in affiliated undertakings 2 496 2 078 1 262 1 142Other shares and holdings 7 847 9 622 6 196 8 008Total 10 343 11 700 116 260 101 963
2.1.1. Intangible assetsIntangible rightsAcquisition cost 1.1. 1 259 1 184 646 641Translation difference -1Increases 645 121 516 45Decreases -48 -45 -41 -40Acquisition cost 31.12. 1 856 1 259 1 121 646Accumulated depreciation 31.12. -979 -812 -471 -410Book value 31.12. 877 447 650 236
GoodwillAcquisition cost 1.1. 1 727 1 894 2 889 3 055Increases 1 006 1 005Decreases -167 -166Acquisition cost 31.12. 2 733 1 727 3 894 2 889Accumulated depreciation 31.12. -1 657 -1 592 -2 672 -2 294Book value 31.12. 1 076 135 1 222 595
Other capitalised expenditureAcquisition cost 1.1. 501 533 78 78Increases 215 5 15Decreases -4 -37Acquisition cost 31.12. 712 501 93 78Accumulated depreciation 31.12. -48 -32 -29 -22Book value 31.12. 664 469 64 56
N O T E S T O T H E F I N A N C I A L S T A T E M E N T S
GROUP PARENT COMPANY1.1.1999- 1.1.1998- 1.1.1999- 1.1.1998-
Thousands of euro 31.12.1999 31.12.1998 31.12.1999 31.12.1998
L E M M I N K Ä I N E N C O R P O R A T I O N A N N U A L R E P O R T 1 9 9 923
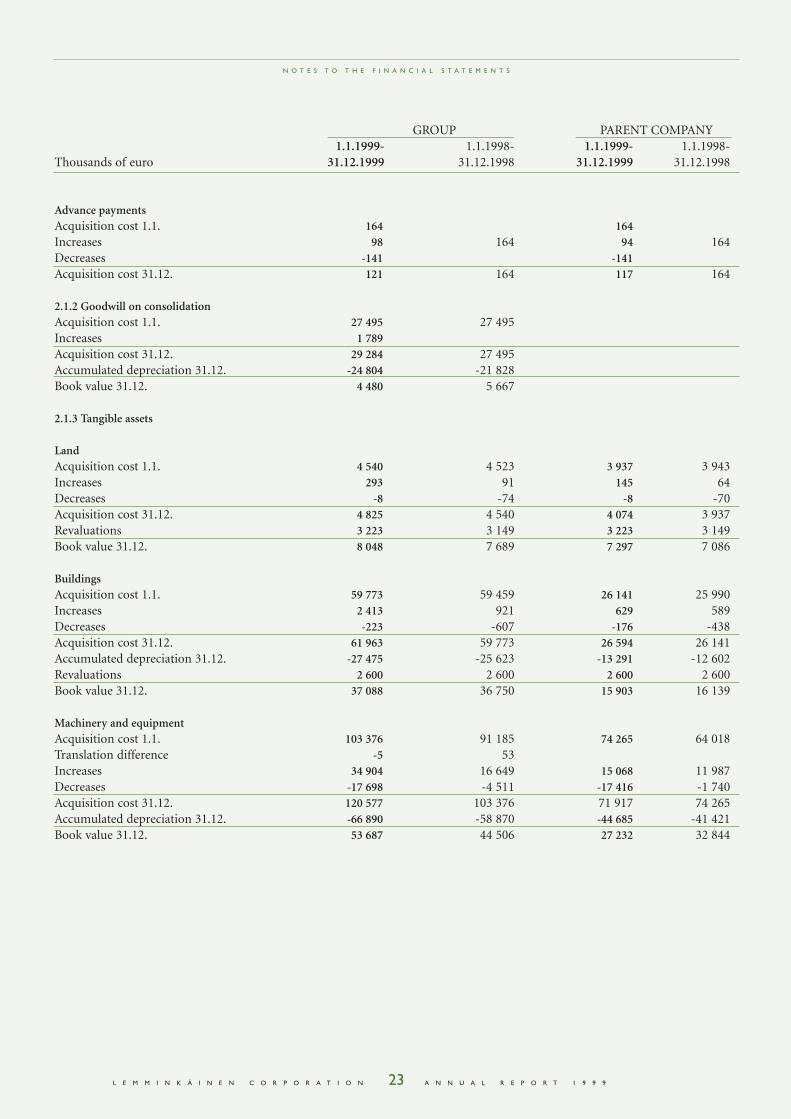
Advance paymentsAcquisition cost 1.1. 164 164Increases 98 164 94 164Decreases -141 -141Acquisition cost 31.12. 121 164 117 164
2.1.2 Goodwill on consolidationAcquisition cost 1.1. 27 495 27 495Increases 1 789Acquisition cost 31.12. 29 284 27 495Accumulated depreciation 31.12. -24 804 -21 828Book value 31.12. 4 480 5 667
2.1.3 Tangible assets
LandAcquisition cost 1.1. 4 540 4 523 3 937 3 943Increases 293 91 145 64Decreases -8 -74 -8 -70Acquisition cost 31.12. 4 825 4 540 4 074 3 937Revaluations 3 223 3 149 3 223 3 149Book value 31.12. 8 048 7 689 7 297 7 086
BuildingsAcquisition cost 1.1. 59 773 59 459 26 141 25 990Increases 2 413 921 629 589Decreases -223 -607 -176 -438Acquisition cost 31.12. 61 963 59 773 26 594 26 141Accumulated depreciation 31.12. -27 475 -25 623 -13 291 -12 602Revaluations 2 600 2 600 2 600 2 600Book value 31.12. 37 088 36 750 15 903 16 139
Machinery and equipmentAcquisition cost 1.1. 103 376 91 185 74 265 64 018Translation difference -5 53Increases 34 904 16 649 15 068 11 987Decreases -17 698 -4 511 -17 416 -1 740Acquisition cost 31.12. 120 577 103 376 71 917 74 265Accumulated depreciation 31.12. -66 890 -58 870 -44 685 -41 421Book value 31.12. 53 687 44 506 27 232 32 844
N O T E S T O T H E F I N A N C I A L S T A T E M E N T S
GROUP PARENT COMPANY1.1.1999- 1.1.1998- 1.1.1999- 1.1.1998-
Thousands of euro 31.12.1999 31.12.1998 31.12.1999 31.12.1998
L E M M I N K Ä I N E N C O R P O R A T I O N A N N U A L R E P O R T 1 9 9 924
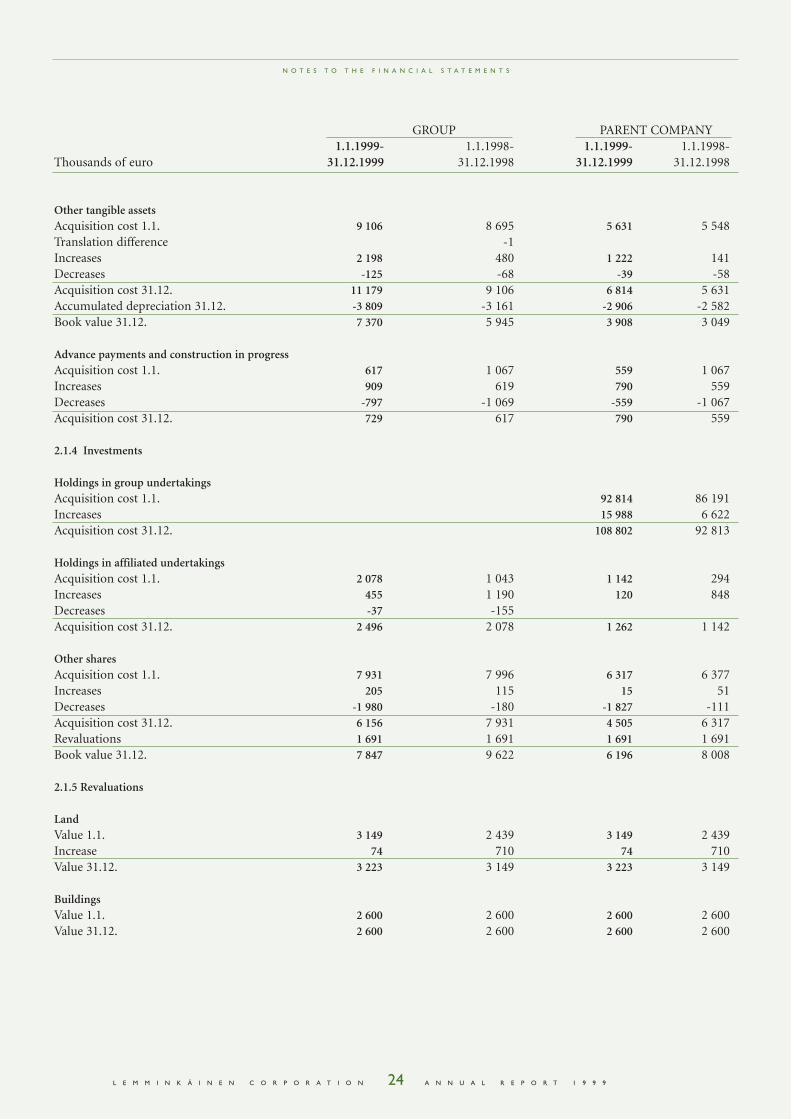
Other tangible assetsAcquisition cost 1.1. 9 106 8 695 5 631 5 548Translation difference -1Increases 2 198 480 1 222 141Decreases -125 -68 -39 -58Acquisition cost 31.12. 11 179 9 106 6 814 5 631Accumulated depreciation 31.12. -3 809 -3 161 -2 906 -2 582Book value 31.12. 7 370 5 945 3 908 3 049
Advance payments and construction in progressAcquisition cost 1.1. 617 1 067 559 1 067Increases 909 619 790 559Decreases -797 -1 069 -559 -1 067Acquisition cost 31.12. 729 617 790 559
2.1.4 Investments
Holdings in group undertakingsAcquisition cost 1.1. 92 814 86 191Increases 15 988 6 622Acquisition cost 31.12. 108 802 92 813
Holdings in affiliated undertakingsAcquisition cost 1.1. 2 078 1 043 1 142 294Increases 455 1 190 120 848Decreases -37 -155Acquisition cost 31.12. 2 496 2 078 1 262 1 142
Other sharesAcquisition cost 1.1. 7 931 7 996 6 317 6 377Increases 205 115 15 51Decreases -1 980 -180 -1 827 -111Acquisition cost 31.12. 6 156 7 931 4 505 6 317Revaluations 1 691 1 691 1 691 1 691Book value 31.12. 7 847 9 622 6 196 8 008
2.1.5 Revaluations
LandValue 1.1. 3 149 2 439 3 149 2 439Increase 74 710 74 710Value 31.12. 3 223 3 149 3 223 3 149
BuildingsValue 1.1. 2 600 2 600 2 600 2 600Value 31.12. 2 600 2 600 2 600 2 600
N O T E S T O T H E F I N A N C I A L S T A T E M E N T S
GROUP PARENT COMPANY1.1.1999- 1.1.1998- 1.1.1999- 1.1.1998-
Thousands of euro 31.12.1999 31.12.1998 31.12.1999 31.12.1998
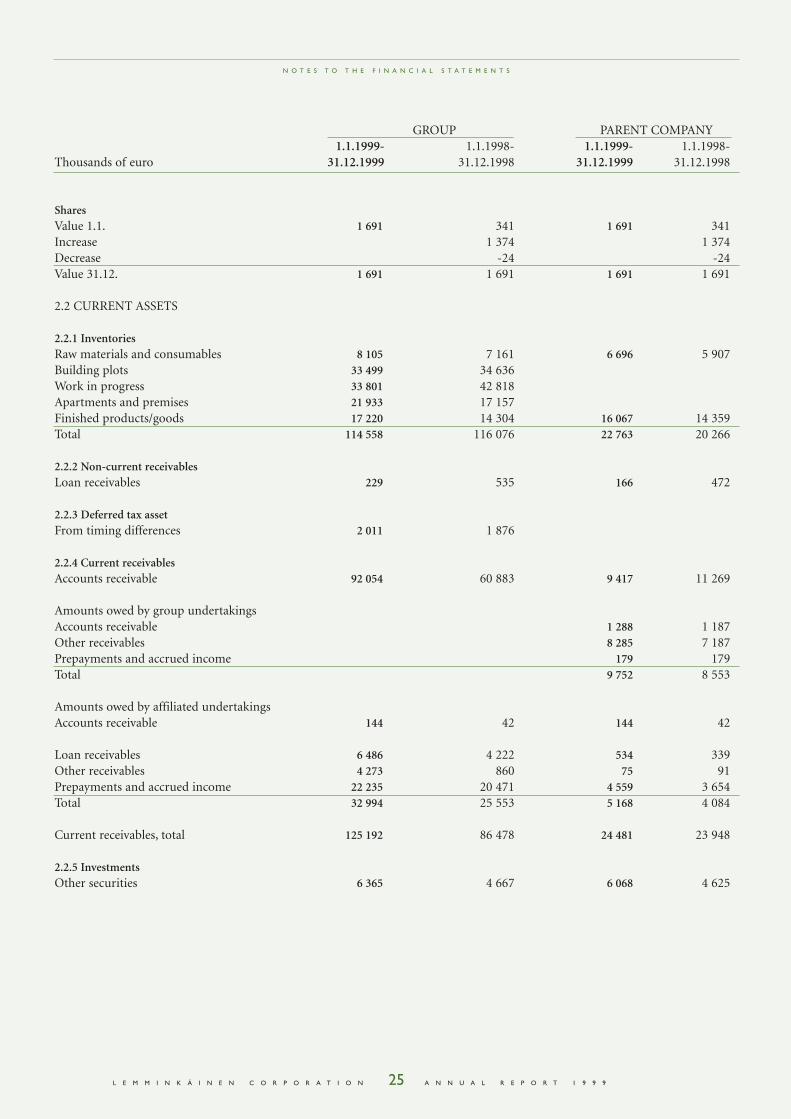
L E M M I N K Ä I N E N C O R P O R A T I O N A N N U A L R E P O R T 1 9 9 925
SharesValue 1.1. 1 691 341 1 691 341Increase 1 374 1 374Decrease -24 -24Value 31.12. 1 691 1 691 1 691 1 691
2.2 CURRENT ASSETS
2.2.1 InventoriesRaw materials and consumables 8 105 7 161 6 696 5 907Building plots 33 499 34 636Work in progress 33 801 42 818Apartments and premises 21 933 17 157Finished products/goods 17 220 14 304 16 067 14 359Total 114 558 116 076 22 763 20 266
2.2.2 Non-current receivablesLoan receivables 229 535 166 472
2.2.3 Deferred tax assetFrom timing differences 2 011 1 876
2.2.4 Current receivablesAccounts receivable 92 054 60 883 9 417 11 269
Amounts owed by group undertakingsAccounts receivable 1 288 1 187Other receivables 8 285 7 187Prepayments and accrued income 179 179Total 9 752 8 553
Amounts owed by affiliated undertakingsAccounts receivable 144 42 144 42
Loan receivables 6 486 4 222 534 339Other receivables 4 273 860 75 91Prepayments and accrued income 22 235 20 471 4 559 3 654Total 32 994 25 553 5 168 4 084
Current receivables, total 125 192 86 478 24 481 23 948
2.2.5 InvestmentsOther securities 6 365 4 667 6 068 4 625
N O T E S T O T H E F I N A N C I A L S T A T E M E N T S
GROUP PARENT COMPANY1.1.1999- 1.1.1998- 1.1.1999- 1.1.1998-
Thousands of euro 31.12.1999 31.12.1998 31.12.1999 31.12.1998
L E M M I N K Ä I N E N C O R P O R A T I O N A N N U A L R E P O R T 1 9 9 926
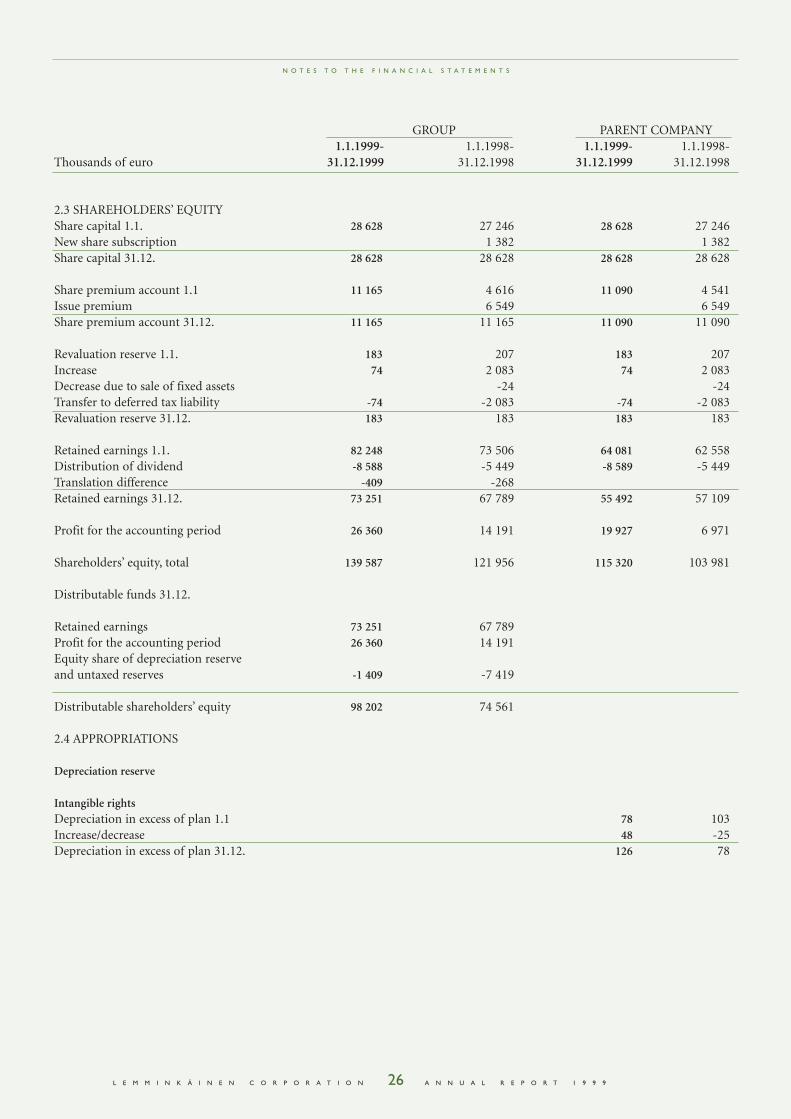
2.3 SHAREHOLDERS’ EQUITYShare capital 1.1. 28 628 27 246 28 628 27 246New share subscription 1 382 1 382Share capital 31.12. 28 628 28 628 28 628 28 628
Share premium account 1.1 11 165 4 616 11 090 4 541Issue premium 6 549 6 549Share premium account 31.12. 11 165 11 165 11 090 11 090
Revaluation reserve 1.1. 183 207 183 207Increase 74 2 083 74 2 083Decrease due to sale of fixed assets -24 -24Transfer to deferred tax liability -74 -2 083 -74 -2 083Revaluation reserve 31.12. 183 183 183 183
Retained earnings 1.1. 82 248 73 506 64 081 62 558Distribution of dividend -8 588 -5 449 -8 589 -5 449Translation difference -409 -268Retained earnings 31.12. 73 251 67 789 55 492 57 109
Profit for the accounting period 26 360 14 191 19 927 6 971
Shareholders’ equity, total 139 587 121 956 115 320 103 981
Distributable funds 31.12.
Retained earnings 73 251 67 789Profit for the accounting period 26 360 14 191Equity share of depreciation reserve and untaxed reserves -1 409 -7 419
Distributable shareholders’ equity 98 202 74 561
2.4 APPROPRIATIONS
Depreciation reserve
Intangible rightsDepreciation in excess of plan 1.1 78 103Increase/decrease 48 -25Depreciation in excess of plan 31.12. 126 78
N O T E S T O T H E F I N A N C I A L S T A T E M E N T S
GROUP PARENT COMPANY1.1.1999- 1.1.1998- 1.1.1999- 1.1.1998-
Thousands of euro 31.12.1999 31.12.1998 31.12.1999 31.12.1998
L E M M I N K Ä I N E N C O R P O R A T I O N A N N U A L R E P O R T 1 9 9 927
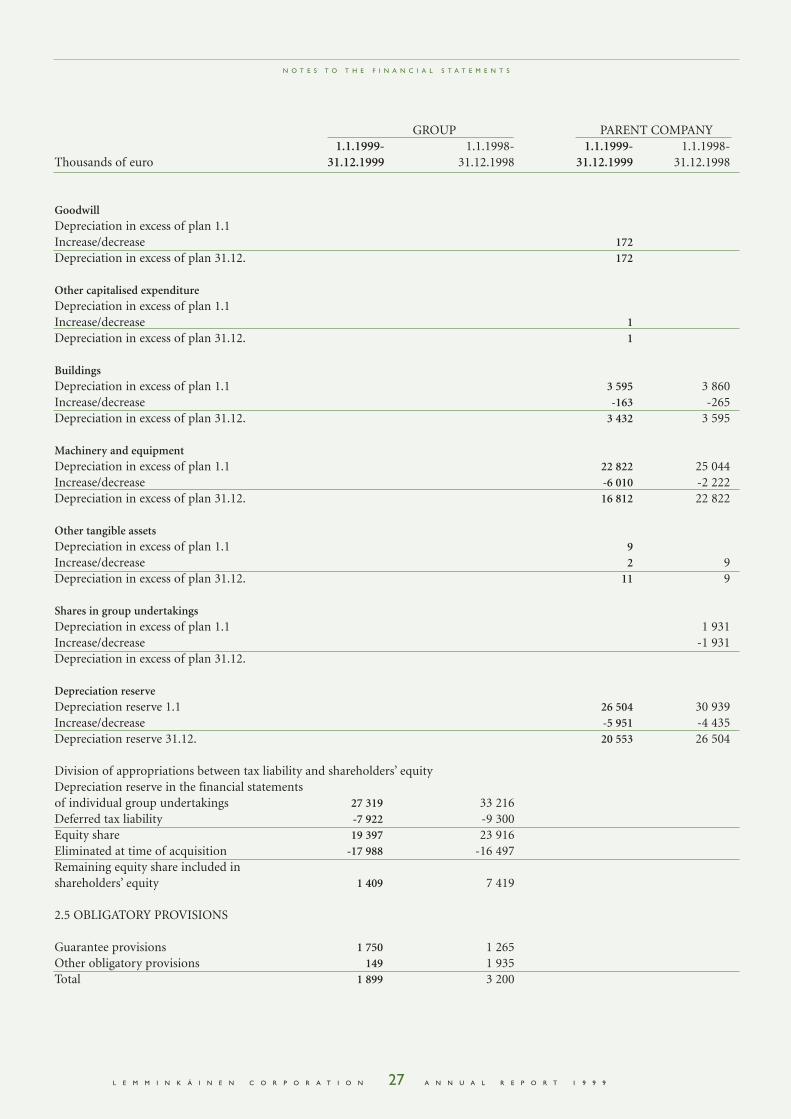
GoodwillDepreciation in excess of plan 1.1Increase/decrease 172Depreciation in excess of plan 31.12. 172
Other capitalised expenditureDepreciation in excess of plan 1.1Increase/decrease 1Depreciation in excess of plan 31.12. 1
BuildingsDepreciation in excess of plan 1.1 3 595 3 860Increase/decrease -163 -265Depreciation in excess of plan 31.12. 3 432 3 595
Machinery and equipmentDepreciation in excess of plan 1.1 22 822 25 044Increase/decrease -6 010 -2 222Depreciation in excess of plan 31.12. 16 812 22 822
Other tangible assetsDepreciation in excess of plan 1.1 9Increase/decrease 2 9Depreciation in excess of plan 31.12. 11 9
Shares in group undertakingsDepreciation in excess of plan 1.1 1 931Increase/decrease -1 931Depreciation in excess of plan 31.12.
Depreciation reserveDepreciation reserve 1.1 26 504 30 939Increase/decrease -5 951 -4 435Depreciation reserve 31.12. 20 553 26 504
Division of appropriations between tax liability and shareholders’ equityDepreciation reserve in the financial statements of individual group undertakings 27 319 33 216Deferred tax liability -7 922 -9 300Equity share 19 397 23 916Eliminated at time of acquisition -17 988 -16 497Remaining equity share included inshareholders’ equity 1 409 7 419
2.5 OBLIGATORY PROVISIONS
Guarantee provisions 1 750 1 265Other obligatory provisions 149 1 935Total 1 899 3 200
N O T E S T O T H E F I N A N C I A L S T A T E M E N T S
GROUP PARENT COMPANY1.1.1999- 1.1.1998- 1.1.1999- 1.1.1998-
Thousands of euro 31.12.1999 31.12.1998 31.12.1999 31.12.1998
L E M M I N K Ä I N E N C O R P O R A T I O N A N N U A L R E P O R T 1 9 9 928
2.6. LIABILITIES
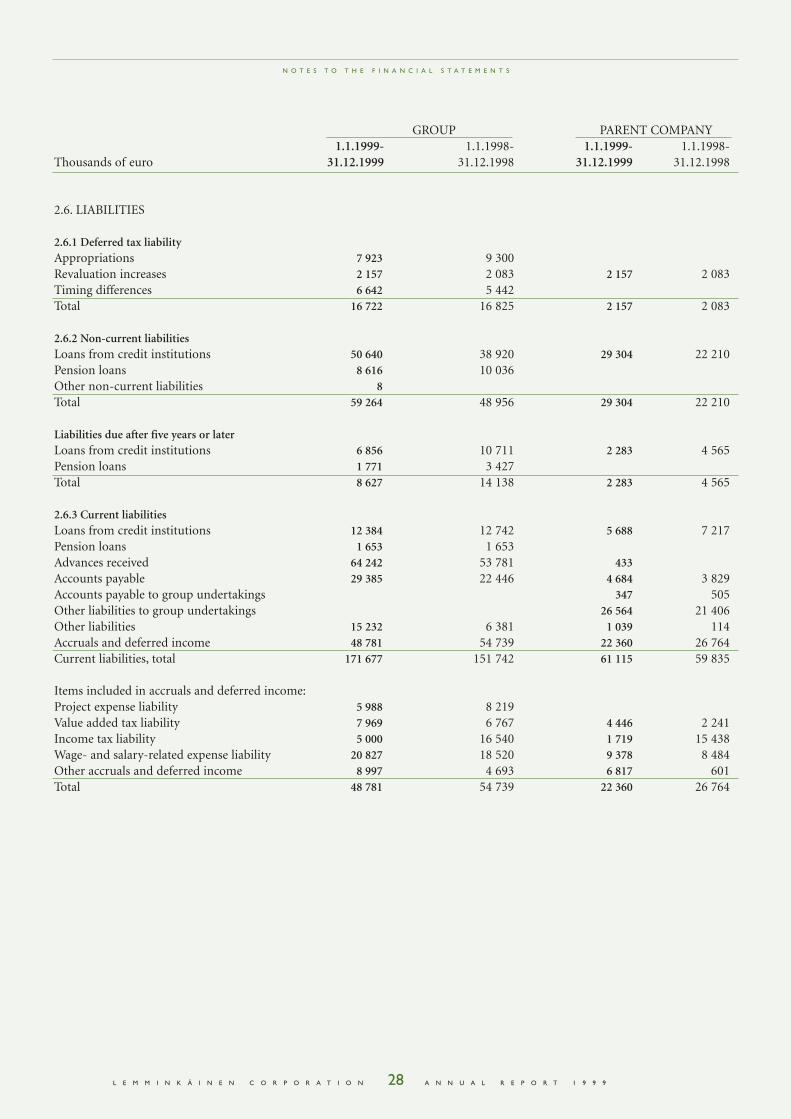
2.6.1 Deferred tax liabilityAppropriations 7 923 9 300Revaluation increases 2 157 2 083 2 157 2 083Timing differences 6 642 5 442Total 16 722 16 825 2 157 2 083
2.6.2 Non-current liabilitiesLoans from credit institutions 50 640 38 920 29 304 22 210Pension loans 8 616 10 036Other non-current liabilities 8Total 59 264 48 956 29 304 22 210
Liabilities due after five years or laterLoans from credit institutions 6 856 10 711 2 283 4 565Pension loans 1 771 3 427Total 8 627 14 138 2 283 4 565
2.6.3 Current liabilitiesLoans from credit institutions 12 384 12 742 5 688 7 217Pension loans 1 653 1 653Advances received 64 242 53 781 433Accounts payable 29 385 22 446 4 684 3 829Accounts payable to group undertakings 347 505Other liabilities to group undertakings 26 564 21 406Other liabilities 15 232 6 381 1 039 114Accruals and deferred income 48 781 54 739 22 360 26 764Current liabilities, total 171 677 151 742 61 115 59 835
Items included in accruals and deferred income:Project expense liability 5 988 8 219Value added tax liability 7 969 6 767 4 446 2 241Income tax liability 5 000 16 540 1 719 15 438Wage- and salary-related expense liability 20 827 18 520 9 378 8 484Other accruals and deferred income 8 997 4 693 6 817 601Total 48 781 54 739 22 360 26 764
N O T E S T O T H E F I N A N C I A L S T A T E M E N T S
GROUP PARENT COMPANY1.1.1999- 1.1.1998- 1.1.1999- 1.1.1998-
Thousands of euro 31.12.1999 31.12.1998 31.12.1999 31.12.1998
L E M M I N K Ä I N E N C O R P O R A T I O N A N N U A L R E P O R T 1 9 9 929
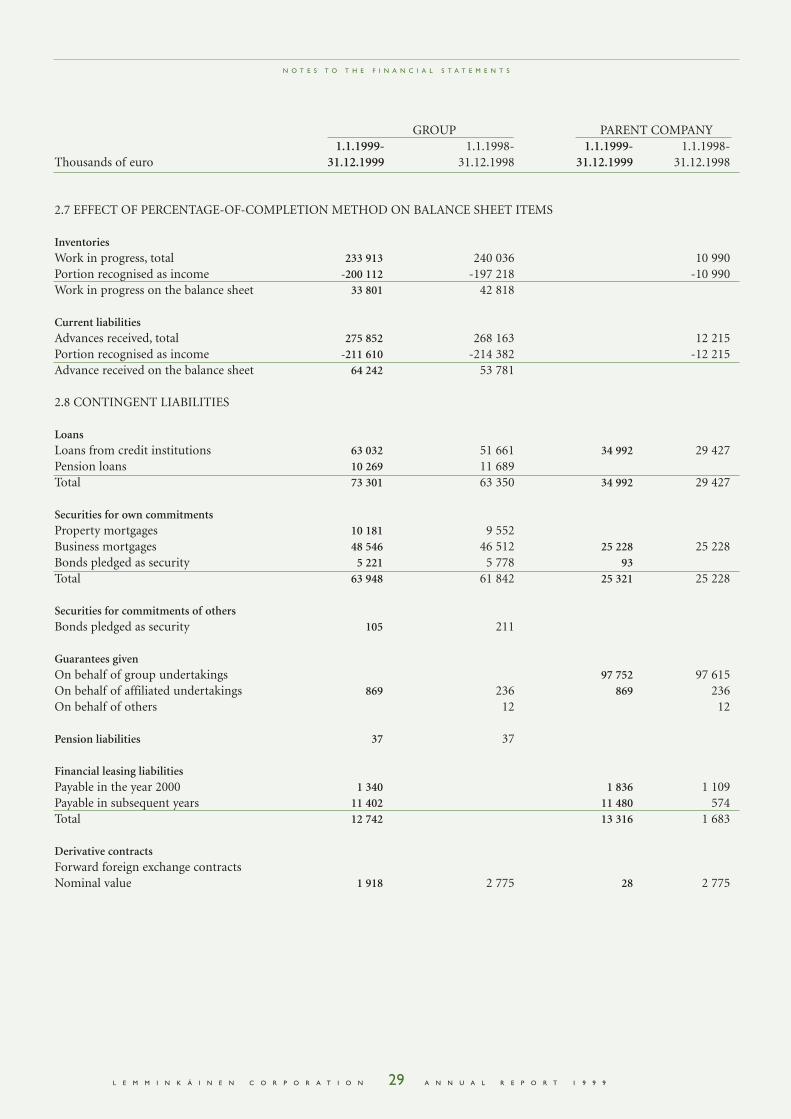
2.7 EFFECT OF PERCENTAGE-OF-COMPLETION METHOD ON BALANCE SHEET ITEMS
InventoriesWork in progress, total 233 913 240 036 10 990Portion recognised as income -200 112 -197 218 -10 990Work in progress on the balance sheet 33 801 42 818
Current liabilitiesAdvances received, total 275 852 268 163 12 215Portion recognised as income -211 610 -214 382 -12 215Advance received on the balance sheet 64 242 53 781
2.8 CONTINGENT LIABILITIES
LoansLoans from credit institutions 63 032 51 661 34 992 29 427Pension loans 10 269 11 689Total 73 301 63 350 34 992 29 427
Securities for own commitmentsProperty mortgages 10 181 9 552Business mortgages 48 546 46 512 25 228 25 228Bonds pledged as security 5 221 5 778 93Total 63 948 61 842 25 321 25 228
Securities for commitments of othersBonds pledged as security 105 211
Guarantees givenOn behalf of group undertakings 97 752 97 615On behalf of affiliated undertakings 869 236 869 236On behalf of others 12 12
Pension liabilities 37 37
Financial leasing liabilitiesPayable in the year 2000 1 340 1 836 1 109Payable in subsequent years 11 402 11 480 574Total 12 742 13 316 1 683
Derivative contractsForward foreign exchange contractsNominal value 1 918 2 775 28 2 775
N O T E S T O T H E F I N A N C I A L S T A T E M E N T S
GROUP PARENT COMPANY1.1.1999- 1.1.1998- 1.1.1999- 1.1.1998-
Thousands of euro 31.12.1999 31.12.1998 31.12.1999 31.12.1998
L E M M I N K Ä I N E N C O R P O R A T I O N A N N U A L R E P O R T 1 9 9 930
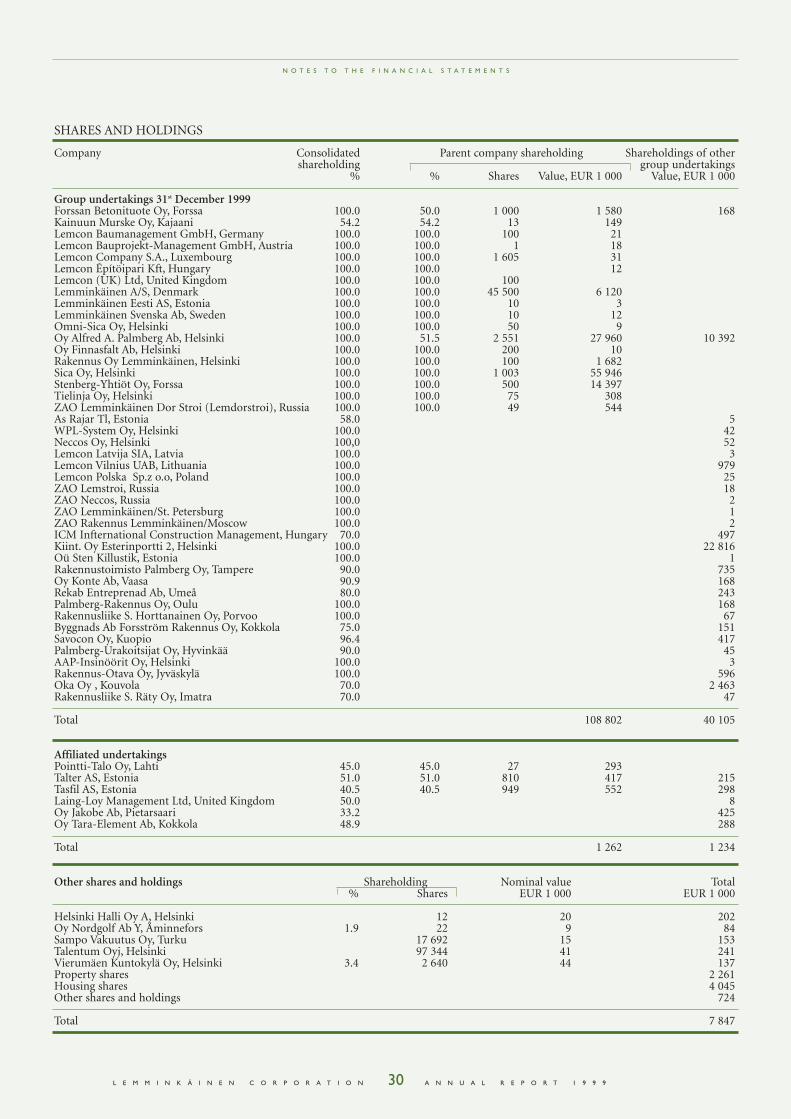
SHARES AND HOLDINGS
Company Consolidated Parent company shareholding Shareholdings of othershareholding group undertakings
% % Shares Value, EUR 1 000 Value, EUR 1 000
Group undertakings 31st December 1999Forssan Betonituote Oy, Forssa 100.0 50.0 1 000 1 580 168Kainuun Murske Oy, Kajaani 54.2 54.2 13 149Lemcon Baumanagement GmbH, Germany 100.0 100.0 100 21Lemcon Bauprojekt-Management GmbH, Austria 100.0 100.0 1 18Lemcon Company S.A., Luxembourg 100.0 100.0 1 605 31Lemcon Építöipari Kft, Hungary 100.0 100.0 12Lemcon (UK) Ltd, United Kingdom 100.0 100.0 100Lemminkäinen A/S, Denmark 100.0 100.0 45 500 6 120Lemminkäinen Eesti AS, Estonia 100.0 100.0 10 3Lemminkäinen Svenska Ab, Sweden 100.0 100.0 10 12Omni-Sica Oy, Helsinki 100.0 100.0 50 9Oy Alfred A. Palmberg Ab, Helsinki 100.0 51.5 2 551 27 960 10 392Oy Finnasfalt Ab, Helsinki 100.0 100.0 200 10Rakennus Oy Lemminkäinen, Helsinki 100.0 100.0 100 1 682Sica Oy, Helsinki 100.0 100.0 1 003 55 946Stenberg-Yhtiöt Oy, Forssa 100.0 100.0 500 14 397Tielinja Oy, Helsinki 100.0 100.0 75 308ZAO Lemminkäinen Dor Stroi (Lemdorstroi), Russia 100.0 100.0 49 544As Rajar Tl, Estonia 58.0 5WPL-System Oy, Helsinki 100.0 42Neccos Oy, Helsinki 100,0 52Lemcon Latvija SIA, Latvia 100.0 3Lemcon Vilnius UAB, Lithuania 100.0 979Lemcon Polska Sp.z o.o, Poland 100.0 25ZAO Lemstroi, Russia 100.0 18ZAO Neccos, Russia 100.0 2ZAO Lemminkäinen/St. Petersburg 100.0 1ZAO Rakennus Lemminkäinen/Moscow 100.0 2ICM Infternational Construction Management, Hungary 70.0 497Kiint. Oy Esterinportti 2, Helsinki 100.0 22 816Oü Sten Killustik, Estonia 100.0 1Rakennustoimisto Palmberg Oy, Tampere 90.0 735Oy Konte Ab, Vaasa 90.9 168Rekab Entreprenad Ab, Umeå 80.0 243Palmberg-Rakennus Oy, Oulu 100.0 168Rakennusliike S. Horttanainen Oy, Porvoo 100.0 67Byggnads Ab Forsström Rakennus Oy, Kokkola 75.0 151Savocon Oy, Kuopio 96.4 417Palmberg-Urakoitsijat Oy, Hyvinkää 90.0 45AAP-Insinöörit Oy, Helsinki 100.0 3Rakennus-Otava Oy, Jyväskylä 100.0 596Oka Oy , Kouvola 70.0 2 463Rakennusliike S. Räty Oy, Imatra 70.0 47
Total 108 802 40 105
Affiliated undertakingsPointti-Talo Oy, Lahti 45.0 45.0 27 293Talter AS, Estonia 51.0 51.0 810 417 215Tasfil AS, Estonia 40.5 40.5 949 552 298Laing-Loy Management Ltd, United Kingdom 50.0 8Oy Jakobe Ab, Pietarsaari 33.2 425Oy Tara-Element Ab, Kokkola 48.9 288
Total 1 262 1 234
Other shares and holdings Shareholding Nominal value Total% Shares EUR 1 000 EUR 1 000
Helsinki Halli Oy A, Helsinki 12 20 202Oy Nordgolf Ab Y, Åminnefors 1.9 22 9 84Sampo Vakuutus Oy, Turku 17 692 15 153Talentum Oyj, Helsinki 97 344 41 241Vierumäen Kuntokylä Oy, Helsinki 3.4 2 640 44 137Property shares 2 261Housing shares 4 045Other shares and holdings 724
Total 7 847
N O T E S T O T H E F I N A N C I A L S T A T E M E N T S
L E M M I N K Ä I N E N C O R P O R A T I O N A N N U A L R E P O R T 1 9 9 931
To the shareholders of Lemminkäinen Corporation
We have audited the accounting, the financial statements and the corporate governance of Lemminkäinen Corporationfor the financial year ended December 31, 1999. The financial statements, which include the Board of Directors’ report,consolidated and parent company income statements, balance sheets and notes to the financial statements, have beenprepared by the Board of Directors and the Managing Director. Based on our audit we express an opinion on thesefinancial statements and on corporate governance.
We have conducted the audit in accordance with Finnish Standards on Auditing. Those standards require that we per-form the audit to obtain reasonable assurance about whether the financial statements are free of material misstatement.An audit includes examining on a test basis evidence supporting the amounts and disclosures in the financial statements,assessing the accounting principles used and significant estimates made by the management as well as evaluating theoverall financial statement presentation. The purpose of our audit of corporate governance is to examine that the mem-bers of the Board of Directors and the Managing Director have legally complied with the rules of the Companies Act.
In our opinion the financial statements have been prepared in accordance with the Accounting Act and other rulesand regulations governing the preparation of financial statements. The financial statements give a true and fair view, asdefined in the Accounting Act, of both the consolidated and parent company's result of operations as well as of thefinancial position. The financial statements with the consolidated financial statements can be adopted and the membersof the Board of Directors and the Managing Director can be discharged from liability for the financial year audited byus. The proposal by the Board of Directors regarding distributable funds is in compliance with the Companies Act.
Helsinki, 7 March 2000
Jan Holmberg Jarmo AlénAuthorised Public Accountant Authorised Public Accountant
A U D I T O R ' S R E P O R T
B O A R D O F D I R E C T O R S ' P R O P O S A L F O R A P P R O P R I A T I O N O F R E T A I N E D E A R N I N G S
Distributable funds shown on the consolidated balance sheet at the end of the accounting period amount to EUR 98 202 258.57 (FIM 583 884 114.87). The Parent Company’s retained earnings from previous years are EUR 55 492 427.45 (FIM 329 942 990.65), the Parent Company’s profit for the accounting period is EUR 19 927 152.10 (FIM118 481 466.04) and the Parent Company’s total retained earnings at the end of the accounting period are EUR 75 419 579.55 (FIM 448 424 456.69). The Board of Directors will propose to the Annual General Meeting that a totaldividend of EUR 14 313 843.72 (FIM 85 106 250.00) be paid to shareholders, after which retained earnings would standat EUR 61 105 735.83 (FIM 363 318 206.69).
Helsinki, 16th February 2000
Heikki Pentti Teppo Taberman Paul Blomqvist
Erkki J. Pentti Juhani SormaalaManaging Director
95 96 97 98 99
Net sales
FIMmill.1200
1000
800
600
400
200
0
L E M M I N K Ä I N E N C O R P O R A T I O N A N N U A L R E P O R T 1 9 9 932
The Division produces asphalt, recycledasphalt macadam and specialist paving.It carries out contracting in the fields ofroad paving, milling and road markingas well as quarrying and crushing. TheDivision also produces ready-mixedconcrete and mineral aggregates forresale, as well as environmental geotech-nology products and services.
The production of ready-mixed con-crete was added to the Division’s businessportfolio with the acquisition of ForssanBetonituote Oy in October. Stenberg-Yhtiöt Oy, which was acquired at thesame time, significantly strengthensLemminkäinen’s position in the mineralaggregates market.
The acquisition of JJ-Asfaltti Oy’sasphalt production operations in Novem-ber broadens Lemminkäinen Corpora-tion’s range of environmentally friendlyand recyclable asphalt paving products.
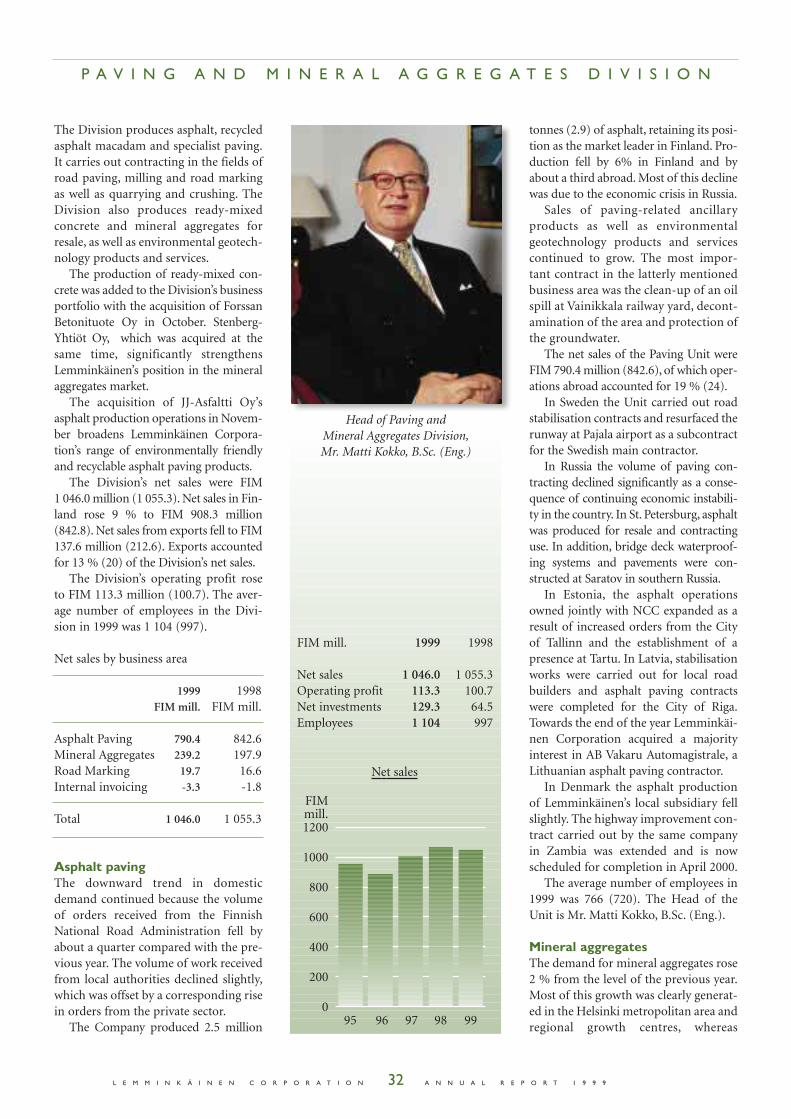
The Division’s net sales were FIM 1 046.0 million (1 055.3). Net sales in Fin-land rose 9 % to FIM 908.3 million(842.8). Net sales from exports fell to FIM137.6 million (212.6). Exports accountedfor 13 % (20) of the Division’s net sales.
The Division’s operating profit roseto FIM 113.3 million (100.7). The aver-age number of employees in the Divi-sion in 1999 was 1 104 (997).
Net sales by business area
1999 1998FIM mill. FIM mill.
Asphalt Paving 790.4 842.6Mineral Aggregates 239.2 197.9Road Marking 19.7 16.6Internal invoicing -3.3 -1.8
Total 1 046.0 1 055.3
Asphalt pavingThe downward trend in domesticdemand continued because the volumeof orders received from the FinnishNational Road Administration fell byabout a quarter compared with the pre-vious year. The volume of work receivedfrom local authorities declined slightly,which was offset by a corresponding risein orders from the private sector.
The Company produced 2.5 million
tonnes (2.9) of asphalt, retaining its posi-tion as the market leader in Finland. Pro-duction fell by 6% in Finland and byabout a third abroad. Most of this declinewas due to the economic crisis in Russia.
Sales of paving-related ancillaryproducts as well as environmentalgeotechnology products and servicescontinued to grow. The most impor-tant contract in the latterly mentionedbusiness area was the clean-up of an oilspill at Vainikkala railway yard, decont-amination of the area and protection ofthe groundwater.
The net sales of the Paving Unit wereFIM 790.4 million (842.6), of which oper-ations abroad accounted for 19 % (24).
In Sweden the Unit carried out roadstabilisation contracts and resurfaced therunway at Pajala airport as a subcontractfor the Swedish main contractor.
In Russia the volume of paving con-tracting declined significantly as a conse-quence of continuing economic instabili-ty in the country. In St. Petersburg, asphaltwas produced for resale and contractinguse. In addition, bridge deck waterproof-ing systems and pavements were con-structed at Saratov in southern Russia.
In Estonia, the asphalt operationsowned jointly with NCC expanded as aresult of increased orders from the Cityof Tallinn and the establishment of apresence at Tartu. In Latvia, stabilisationworks were carried out for local roadbuilders and asphalt paving contractswere completed for the City of Riga.Towards the end of the year Lemminkäi-nen Corporation acquired a majorityinterest in AB Vakaru Automagistrale, aLithuanian asphalt paving contractor.
In Denmark the asphalt productionof Lemminkäinen’s local subsidiary fellslightly. The highway improvement con-tract carried out by the same companyin Zambia was extended and is nowscheduled for completion in April 2000.
The average number of employees in1999 was 766 (720). The Head of theUnit is Mr. Matti Kokko, B.Sc. (Eng.).
Mineral aggregatesThe demand for mineral aggregates rose2 % from the level of the previous year.Most of this growth was clearly generat-ed in the Helsinki metropolitan area andregional growth centres, whereas
P A V I N G A N D M I N E R A L A G G R E G A T E S D I V I S I O N
FIM mill. 1999 1998
Net sales 1 046.0 1 055.3Operating profit 113.3 100.7Net investments 129.3 64.5Employees 1 104 997
Head of Paving and Mineral Aggregates Division,Mr. Matti Kokko, B.Sc. (Eng.)
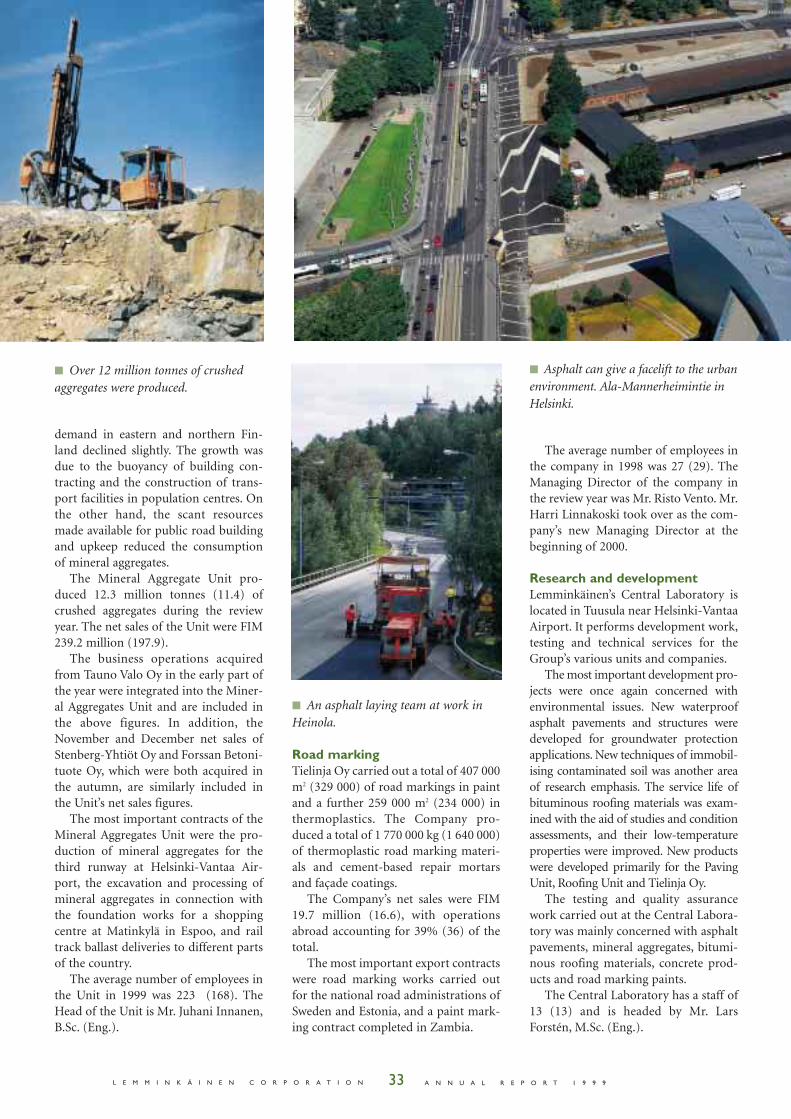
A N N U A L R E P O R T 1 9 9 933
demand in eastern and northern Fin-land declined slightly. The growth wasdue to the buoyancy of building con-tracting and the construction of trans-port facilities in population centres. Onthe other hand, the scant resourcesmade available for public road buildingand upkeep reduced the consumptionof mineral aggregates.
The Mineral Aggregate Unit pro-duced 12.3 million tonnes (11.4) ofcrushed aggregates during the reviewyear. The net sales of the Unit were FIM239.2 million (197.9).
The business operations acquiredfrom Tauno Valo Oy in the early part ofthe year were integrated into the Miner-al Aggregates Unit and are included inthe above figures. In addition, theNovember and December net sales ofStenberg-Yhtiöt Oy and Forssan Betoni-tuote Oy, which were both acquired inthe autumn, are similarly included inthe Unit’s net sales figures.
The most important contracts of theMineral Aggregates Unit were the pro-duction of mineral aggregates for thethird runway at Helsinki-Vantaa Air-port, the excavation and processing ofmineral aggregates in connection withthe foundation works for a shoppingcentre at Matinkylä in Espoo, and railtrack ballast deliveries to different partsof the country.
The average number of employees inthe Unit in 1999 was 223 (168). TheHead of the Unit is Mr. Juhani Innanen,B.Sc. (Eng.).
Road markingTielinja Oy carried out a total of 407 000m2 (329 000) of road markings in paintand a further 259 000 m2 (234 000) inthermoplastics. The Company pro-duced a total of 1 770 000 kg (1 640 000)of thermoplastic road marking materi-als and cement-based repair mortarsand façade coatings.
The Company’s net sales were FIM19.7 million (16.6), with operationsabroad accounting for 39% (36) of thetotal.
The most important export contractswere road marking works carried outfor the national road administrations ofSweden and Estonia, and a paint mark-ing contract completed in Zambia.
The average number of employees inthe company in 1998 was 27 (29). TheManaging Director of the company inthe review year was Mr. Risto Vento. Mr.Harri Linnakoski took over as the com-pany’s new Managing Director at thebeginning of 2000.
Research and developmentLemminkäinen’s Central Laboratory islocated in Tuusula near Helsinki-VantaaAirport. It performs development work,testing and technical services for theGroup’s various units and companies.
The most important development pro-jects were once again concerned withenvironmental issues. New waterproofasphalt pavements and structures weredeveloped for groundwater protectionapplications. New techniques of immobil-ising contaminated soil was another areaof research emphasis. The service life ofbituminous roofing materials was exam-ined with the aid of studies and conditionassessments, and their low-temperatureproperties were improved. New productswere developed primarily for the PavingUnit, Roofing Unit and Tielinja Oy.
The testing and quality assurancework carried out at the Central Labora-tory was mainly concerned with asphaltpavements, mineral aggregates, bitumi-nous roofing materials, concrete prod-ucts and road marking paints.
The Central Laboratory has a staff of13 (13) and is headed by Mr. LarsForstén, M.Sc. (Eng.).
■ Asphalt can give a facelift to the urbanenvironment. Ala-Mannerheimintie inHelsinki.
■ Over 12 million tonnes of crushedaggregates were produced.
■ An asphalt laying team at work inHeinola.
L E M M I N K Ä I N E N C O R P O R A T I O N
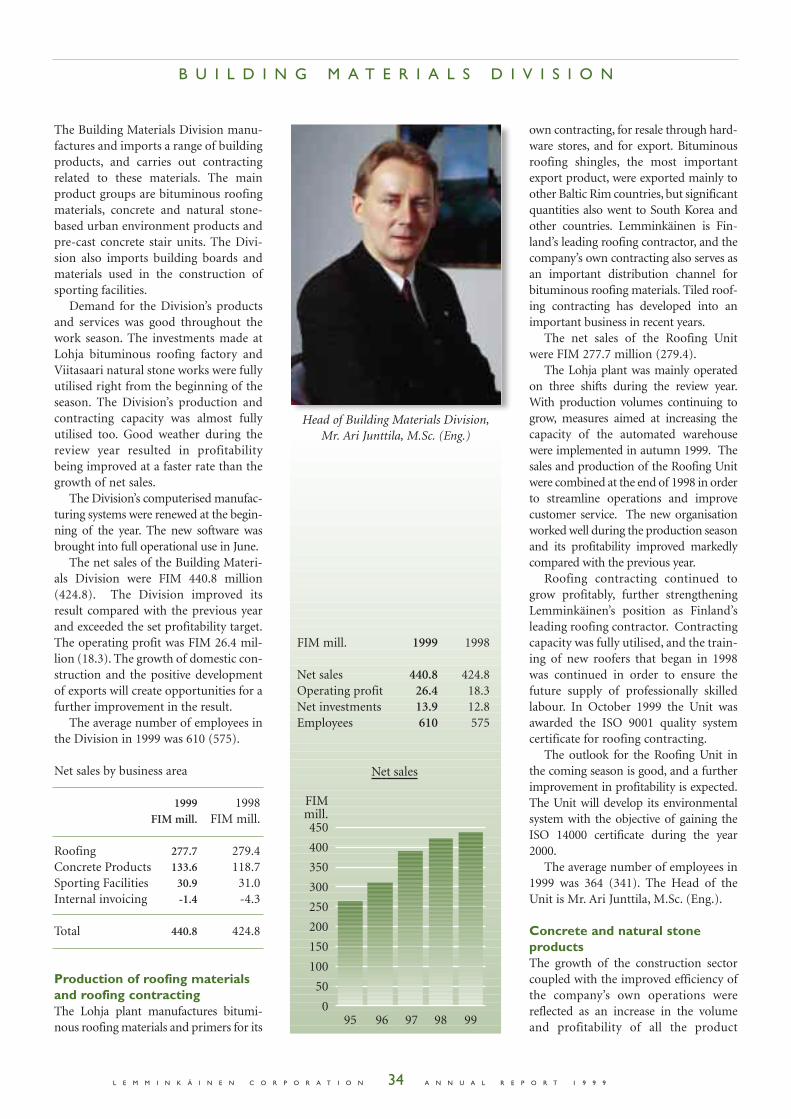
95 96 97 98 99
Net sales
FIMmill.450
400
350
300
250
200
150
100
50
0
L E M M I N K Ä I N E N C O R P O R A T I O N A N N U A L R E P O R T 1 9 9 934
FIM mill. 1999 1998
Net sales 440.8 424.8Operating profit 26.4 18.3Net investments 13.9 12.8Employees 610 575
Head of Building Materials Division,Mr. Ari Junttila, M.Sc. (Eng.)
The Building Materials Division manu-factures and imports a range of buildingproducts, and carries out contractingrelated to these materials. The mainproduct groups are bituminous roofingmaterials, concrete and natural stone-based urban environment products andpre-cast concrete stair units. The Divi-sion also imports building boards andmaterials used in the construction ofsporting facilities.
Demand for the Division’s productsand services was good throughout thework season. The investments made atLohja bituminous roofing factory andViitasaari natural stone works were fullyutilised right from the beginning of theseason. The Division’s production andcontracting capacity was almost fullyutilised too. Good weather during thereview year resulted in profitabilitybeing improved at a faster rate than thegrowth of net sales.
The Division’s computerised manufac-turing systems were renewed at the begin-ning of the year. The new software wasbrought into full operational use in June.
The net sales of the Building Materi-als Division were FIM 440.8 million(424.8). The Division improved itsresult compared with the previous yearand exceeded the set profitability target.The operating profit was FIM 26.4 mil-lion (18.3). The growth of domestic con-struction and the positive developmentof exports will create opportunities for afurther improvement in the result.
The average number of employees inthe Division in 1999 was 610 (575).
Net sales by business area
1999 1998FIM mill. FIM mill.
Roofing 277.7 279.4Concrete Products 133.6 118.7Sporting Facilities 30.9 31.0Internal invoicing -1.4 -4.3
Total 440.8 424.8
Production of roofing materialsand roofing contractingThe Lohja plant manufactures bitumi-nous roofing materials and primers for its
own contracting, for resale through hard-ware stores, and for export. Bituminousroofing shingles, the most importantexport product, were exported mainly toother Baltic Rim countries, but significantquantities also went to South Korea andother countries. Lemminkäinen is Fin-land’s leading roofing contractor, and thecompany’s own contracting also serves asan important distribution channel forbituminous roofing materials. Tiled roof-ing contracting has developed into animportant business in recent years.
The net sales of the Roofing Unitwere FIM 277.7 million (279.4).
The Lohja plant was mainly operatedon three shifts during the review year.With production volumes continuing togrow, measures aimed at increasing thecapacity of the automated warehousewere implemented in autumn 1999. Thesales and production of the Roofing Unitwere combined at the end of 1998 in orderto streamline operations and improvecustomer service. The new organisationworked well during the production seasonand its profitability improved markedlycompared with the previous year.
Roofing contracting continued togrow profitably, further strengtheningLemminkäinen’s position as Finland’sleading roofing contractor. Contractingcapacity was fully utilised, and the train-ing of new roofers that began in 1998was continued in order to ensure thefuture supply of professionally skilledlabour. In October 1999 the Unit wasawarded the ISO 9001 quality systemcertificate for roofing contracting.
The outlook for the Roofing Unit inthe coming season is good, and a furtherimprovement in profitability is expected.The Unit will develop its environmentalsystem with the objective of gaining theISO 14000 certificate during the year2000.
The average number of employees in1999 was 364 (341). The Head of theUnit is Mr. Ari Junttila, M.Sc. (Eng.).
Concrete and natural stoneproductsThe growth of the construction sectorcoupled with the improved efficiency ofthe company’s own operations werereflected as an increase in the volumeand profitability of all the product
B U I L D I N G M A T E R I A L S D I V I S I O N
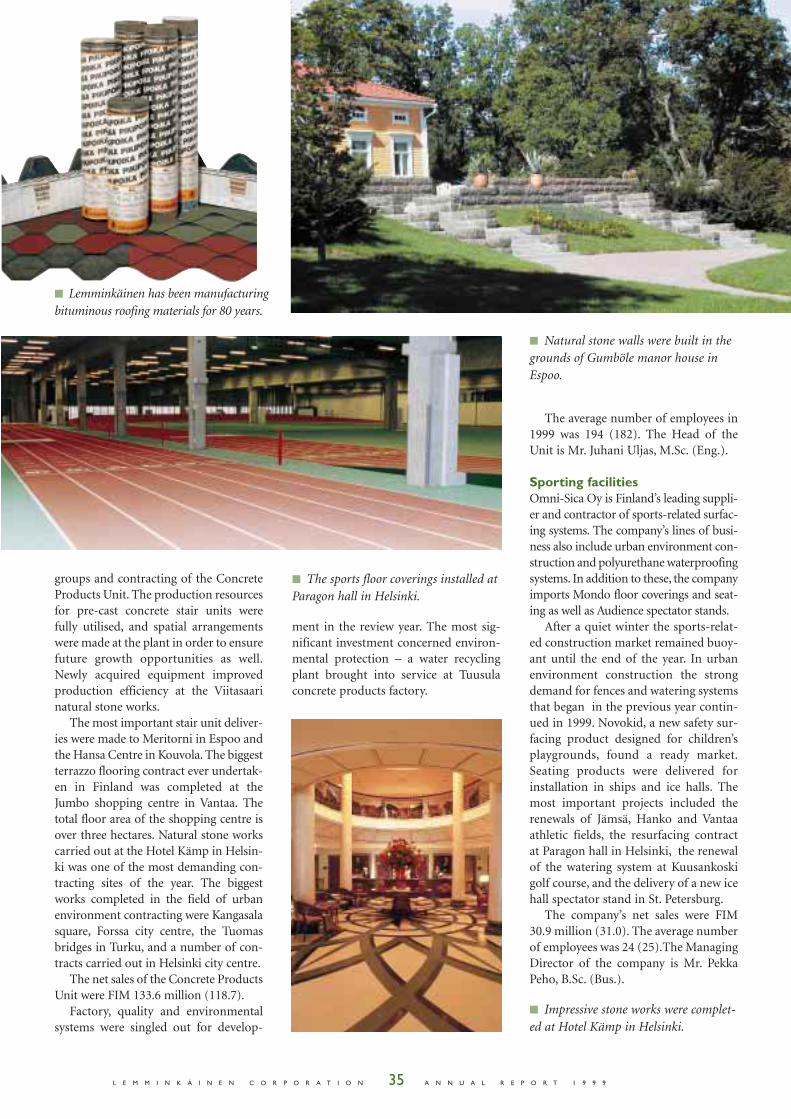
L E M M I N K Ä I N E N C O R P O R A T I O N A N N U A L R E P O R T 1 9 9 935
groups and contracting of the ConcreteProducts Unit. The production resourcesfor pre-cast concrete stair units werefully utilised, and spatial arrangementswere made at the plant in order to ensurefuture growth opportunities as well.Newly acquired equipment improvedproduction efficiency at the Viitasaarinatural stone works.
The most important stair unit deliver-ies were made to Meritorni in Espoo andthe Hansa Centre in Kouvola. The biggestterrazzo flooring contract ever undertak-en in Finland was completed at theJumbo shopping centre in Vantaa. Thetotal floor area of the shopping centre isover three hectares. Natural stone workscarried out at the Hotel Kämp in Helsin-ki was one of the most demanding con-tracting sites of the year. The biggestworks completed in the field of urbanenvironment contracting were Kangasalasquare, Forssa city centre, the Tuomasbridges in Turku, and a number of con-tracts carried out in Helsinki city centre.
The net sales of the Concrete ProductsUnit were FIM 133.6 million (118.7).
Factory, quality and environmentalsystems were singled out for develop-
The average number of employees in1999 was 194 (182). The Head of theUnit is Mr. Juhani Uljas, M.Sc. (Eng.).
Sporting facilitiesOmni-Sica Oy is Finland’s leading suppli-er and contractor of sports-related surfac-ing systems. The company’s lines of busi-ness also include urban environment con-struction and polyurethane waterproofingsystems. In addition to these, the companyimports Mondo floor coverings and seat-ing as well as Audience spectator stands.
After a quiet winter the sports-relat-ed construction market remained buoy-ant until the end of the year. In urbanenvironment construction the strongdemand for fences and watering systemsthat began in the previous year contin-ued in 1999. Novokid, a new safety sur-facing product designed for children’splaygrounds, found a ready market.Seating products were delivered forinstallation in ships and ice halls. Themost important projects included therenewals of Jämsä, Hanko and Vantaaathletic fields, the resurfacing contractat Paragon hall in Helsinki, the renewalof the watering system at Kuusankoskigolf course, and the delivery of a new icehall spectator stand in St. Petersburg.
The company’s net sales were FIM30.9 million (31.0). The average numberof employees was 24 (25).The ManagingDirector of the company is Mr. PekkaPeho, B.Sc. (Bus.).
■ Natural stone walls were built in thegrounds of Gumböle manor house inEspoo.
■ The sports floor coverings installed atParagon hall in Helsinki.
■ Lemminkäinen has been manufacturingbituminous roofing materials for 80 years.
■ Impressive stone works were complet-ed at Hotel Kämp in Helsinki.
ment in the review year. The most sig-nificant investment concerned environ-mental protection – a water recyclingplant brought into service at Tuusulaconcrete products factory.
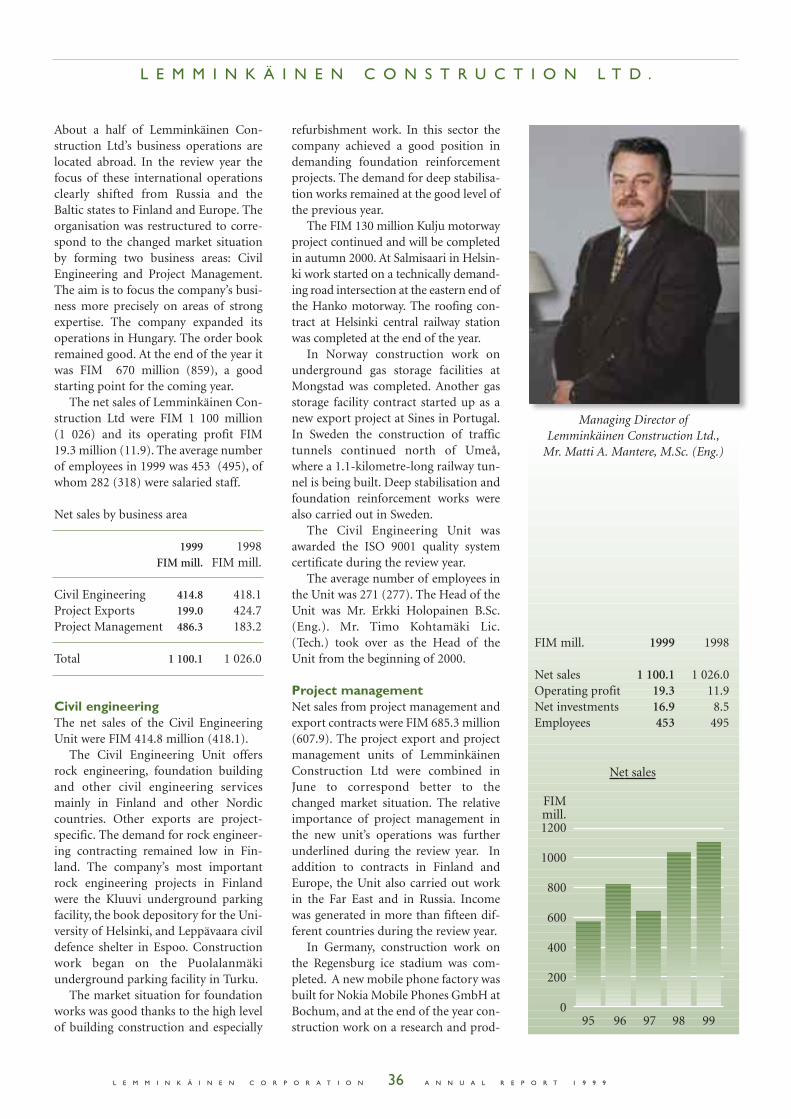
95 96 97 98 99
Net sales
FIMmill.1200
1000
800
600
400
200
0
L E M M I N K Ä I N E N C O R P O R A T I O N A N N U A L R E P O R T 1 9 9 936
FIM mill. 1999 1998
Net sales 1 100.1 1 026.0Operating profit 19.3 11.9Net investments 16.9 8.5Employees 453 495
Managing Director ofLemminkäinen Construction Ltd.,
Mr. Matti A. Mantere, M.Sc. (Eng.)
About a half of Lemminkäinen Con-struction Ltd’s business operations arelocated abroad. In the review year thefocus of these international operationsclearly shifted from Russia and theBaltic states to Finland and Europe. Theorganisation was restructured to corre-spond to the changed market situationby forming two business areas: CivilEngineering and Project Management.The aim is to focus the company’s busi-ness more precisely on areas of strongexpertise. The company expanded itsoperations in Hungary. The order bookremained good. At the end of the year itwas FIM 670 million (859), a goodstarting point for the coming year.
The net sales of Lemminkäinen Con-struction Ltd were FIM 1 100 million (1 026) and its operating profit FIM19.3 million (11.9). The average numberof employees in 1999 was 453 (495), ofwhom 282 (318) were salaried staff.
Net sales by business area
1999 1998FIM mill. FIM mill.
Civil Engineering 414.8 418.1Project Exports 199.0 424.7Project Management 486.3 183.2
Total 1 100.1 1 026.0
Civil engineeringThe net sales of the Civil EngineeringUnit were FIM 414.8 million (418.1).
The Civil Engineering Unit offersrock engineering, foundation buildingand other civil engineering servicesmainly in Finland and other Nordiccountries. Other exports are project-specific. The demand for rock engineer-ing contracting remained low in Fin-land. The company’s most importantrock engineering projects in Finlandwere the Kluuvi underground parkingfacility, the book depository for the Uni-versity of Helsinki, and Leppävaara civildefence shelter in Espoo. Constructionwork began on the Puolalanmäkiunderground parking facility in Turku.
The market situation for foundationworks was good thanks to the high levelof building construction and especially
L E M M I N K Ä I N E N C O N S T R U C T I O N L T D .
refurbishment work. In this sector thecompany achieved a good position indemanding foundation reinforcementprojects. The demand for deep stabilisa-tion works remained at the good level ofthe previous year.
The FIM 130 million Kulju motorwayproject continued and will be completedin autumn 2000. At Salmisaari in Helsin-ki work started on a technically demand-ing road intersection at the eastern end ofthe Hanko motorway. The roofing con-tract at Helsinki central railway stationwas completed at the end of the year.
In Norway construction work onunderground gas storage facilities atMongstad was completed. Another gasstorage facility contract started up as anew export project at Sines in Portugal.In Sweden the construction of traffictunnels continued north of Umeå,where a 1.1-kilometre-long railway tun-nel is being built. Deep stabilisation andfoundation reinforcement works werealso carried out in Sweden.
The Civil Engineering Unit wasawarded the ISO 9001 quality systemcertificate during the review year.
The average number of employees inthe Unit was 271 (277). The Head of theUnit was Mr. Erkki Holopainen B.Sc.(Eng.). Mr. Timo Kohtamäki Lic.(Tech.) took over as the Head of theUnit from the beginning of 2000.
Project managementNet sales from project management andexport contracts were FIM 685.3 million(607.9). The project export and projectmanagement units of LemminkäinenConstruction Ltd were combined inJune to correspond better to thechanged market situation. The relativeimportance of project management inthe new unit’s operations was furtherunderlined during the review year. Inaddition to contracts in Finland andEurope, the Unit also carried out workin the Far East and in Russia. Incomewas generated in more than fifteen dif-ferent countries during the review year.
In Germany, construction work onthe Regensburg ice stadium was com-pleted. A new mobile phone factory wasbuilt for Nokia Mobile Phones GmbH atBochum, and at the end of the year con-struction work on a research and prod-
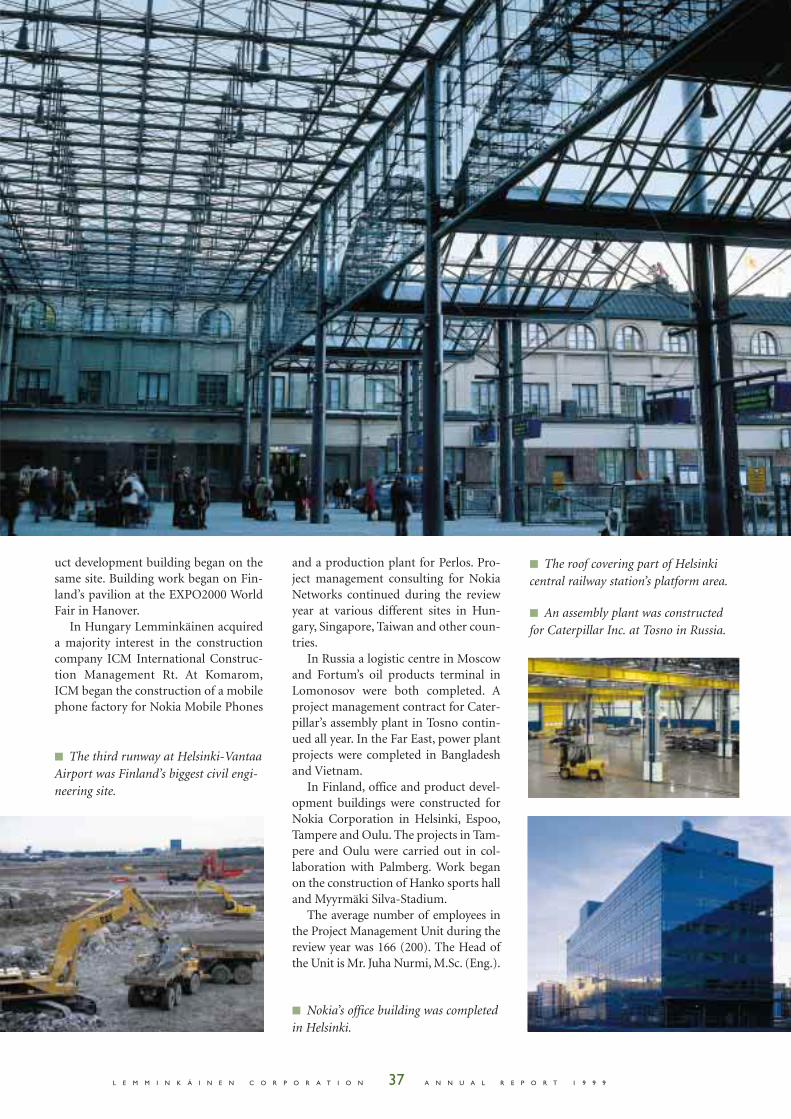
L E M M I N K Ä I N E N C O R P O R A T I O N A N N U A L R E P O R T 1 9 9 937
uct development building began on thesame site. Building work began on Fin-land’s pavilion at the EXPO2000 WorldFair in Hanover.
In Hungary Lemminkäinen acquireda majority interest in the constructioncompany ICM International Construc-tion Management Rt. At Komarom,ICM began the construction of a mobilephone factory for Nokia Mobile Phones
and a production plant for Perlos. Pro-ject management consulting for NokiaNetworks continued during the reviewyear at various different sites in Hun-gary, Singapore, Taiwan and other coun-tries.
In Russia a logistic centre in Moscowand Fortum’s oil products terminal inLomonosov were both completed. Aproject management contract for Cater-pillar’s assembly plant in Tosno contin-ued all year. In the Far East, power plantprojects were completed in Bangladeshand Vietnam.
In Finland, office and product devel-opment buildings were constructed forNokia Corporation in Helsinki, Espoo,Tampere and Oulu. The projects in Tam-pere and Oulu were carried out in col-laboration with Palmberg. Work beganon the construction of Hanko sports halland Myyrmäki Silva-Stadium.
The average number of employees inthe Project Management Unit during thereview year was 166 (200). The Head ofthe Unit is Mr. Juha Nurmi, M.Sc. (Eng.).
■ Nokia’s office building was completedin Helsinki.
■ The roof covering part of Helsinkicentral railway station’s platform area.
■ An assembly plant was constructedfor Caterpillar Inc. at Tosno in Russia.
■ The third runway at Helsinki-VantaaAirport was Finland’s biggest civil engi-neering site.
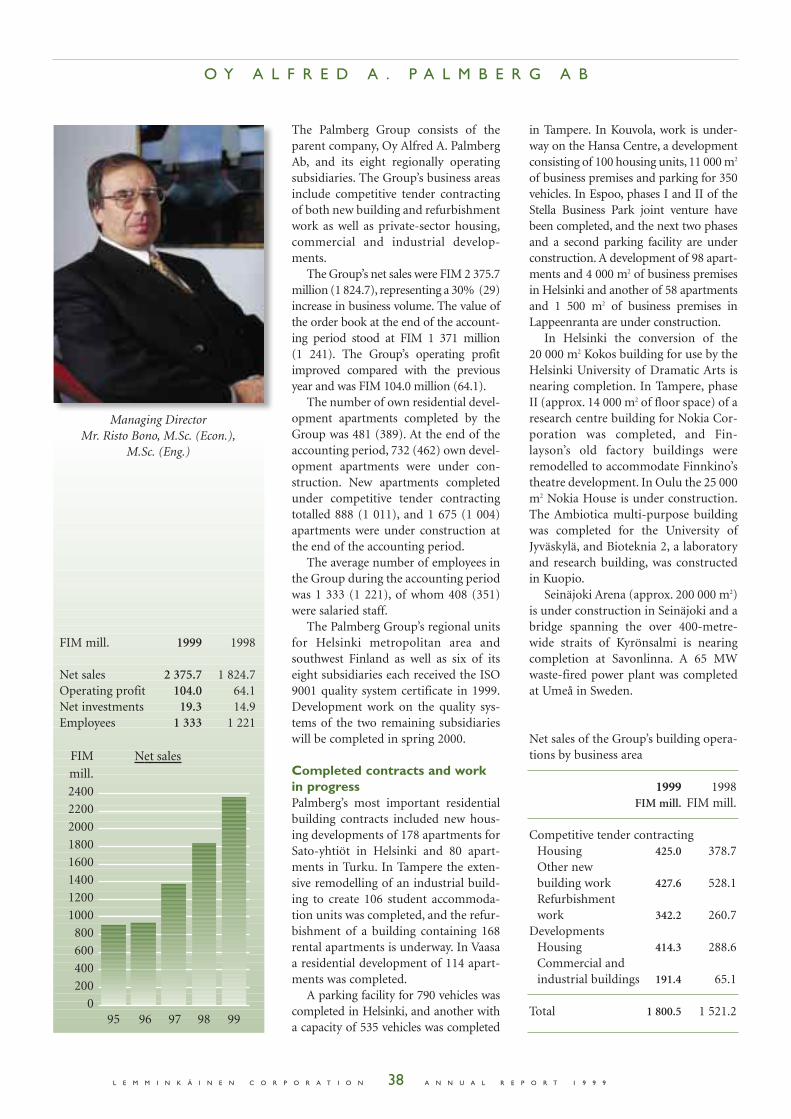
95 96 97 98 99
Net salesFIM
mill.
2400
2200
2000
1800
1600
1400
1200
1000
800
600
400
200
0
L E M M I N K Ä I N E N C O R P O R A T I O N A N N U A L R E P O R T 1 9 9 938
FIM mill. 1999 1998
Net sales 2 375.7 1 824.7Operating profit 104.0 64.1Net investments 19.3 14.9Employees 1 333 1 221
Managing Director Mr. Risto Bono, M.Sc. (Econ.),
M.Sc. (Eng.)
The Palmberg Group consists of theparent company, Oy Alfred A. PalmbergAb, and its eight regionally operatingsubsidiaries. The Group’s business areasinclude competitive tender contractingof both new building and refurbishmentwork as well as private-sector housing,commercial and industrial develop-ments.
The Group’s net sales were FIM 2 375.7million (1 824.7), representing a 30% (29)increase in business volume. The value ofthe order book at the end of the account-ing period stood at FIM 1 371 million (1 241). The Group’s operating profitimproved compared with the previousyear and was FIM 104.0 million (64.1).
The number of own residential devel-opment apartments completed by theGroup was 481 (389). At the end of theaccounting period, 732 (462) own devel-opment apartments were under con-struction. New apartments completedunder competitive tender contractingtotalled 888 (1 011), and 1 675 (1 004)apartments were under construction atthe end of the accounting period.
The average number of employees inthe Group during the accounting periodwas 1 333 (1 221), of whom 408 (351)were salaried staff.
The Palmberg Group’s regional unitsfor Helsinki metropolitan area andsouthwest Finland as well as six of itseight subsidiaries each received the ISO9001 quality system certificate in 1999.Development work on the quality sys-tems of the two remaining subsidiarieswill be completed in spring 2000.
Completed contracts and workin progressPalmberg’s most important residentialbuilding contracts included new hous-ing developments of 178 apartments forSato-yhtiöt in Helsinki and 80 apart-ments in Turku. In Tampere the exten-sive remodelling of an industrial build-ing to create 106 student accommoda-tion units was completed, and the refur-bishment of a building containing 168rental apartments is underway. In Vaasaa residential development of 114 apart-ments was completed.
A parking facility for 790 vehicles wascompleted in Helsinki, and another witha capacity of 535 vehicles was completed
O Y A L F R E D A . P A L M B E R G A B
in Tampere. In Kouvola, work is under-way on the Hansa Centre, a developmentconsisting of 100 housing units, 11 000 m2
of business premises and parking for 350vehicles. In Espoo, phases I and II of theStella Business Park joint venture havebeen completed, and the next two phasesand a second parking facility are underconstruction. A development of 98 apart-ments and 4 000 m2 of business premisesin Helsinki and another of 58 apartmentsand 1 500 m2 of business premises inLappeenranta are under construction.
In Helsinki the conversion of the 20 000 m2 Kokos building for use by theHelsinki University of Dramatic Arts isnearing completion. In Tampere, phaseII (approx. 14 000 m2 of floor space) of aresearch centre building for Nokia Cor-poration was completed, and Fin-layson’s old factory buildings wereremodelled to accommodate Finnkino’stheatre development. In Oulu the 25 000m2 Nokia House is under construction.The Ambiotica multi-purpose buildingwas completed for the University ofJyväskylä, and Bioteknia 2, a laboratoryand research building, was constructedin Kuopio.
Seinäjoki Arena (approx. 200 000 m2)is under construction in Seinäjoki and abridge spanning the over 400-metre-wide straits of Kyrönsalmi is nearingcompletion at Savonlinna. A 65 MWwaste-fired power plant was completedat Umeå in Sweden.
Net sales of the Group’s building opera-tions by business area
1999 1998FIM mill. FIM mill.
Competitive tender contractingHousing 425.0 378.7Other new building work 427.6 528.1Refurbishment work 342.2 260.7
DevelopmentsHousing 414.3 288.6Commercial and industrial buildings 191.4 65.1
Total 1 800.5 1 521.2
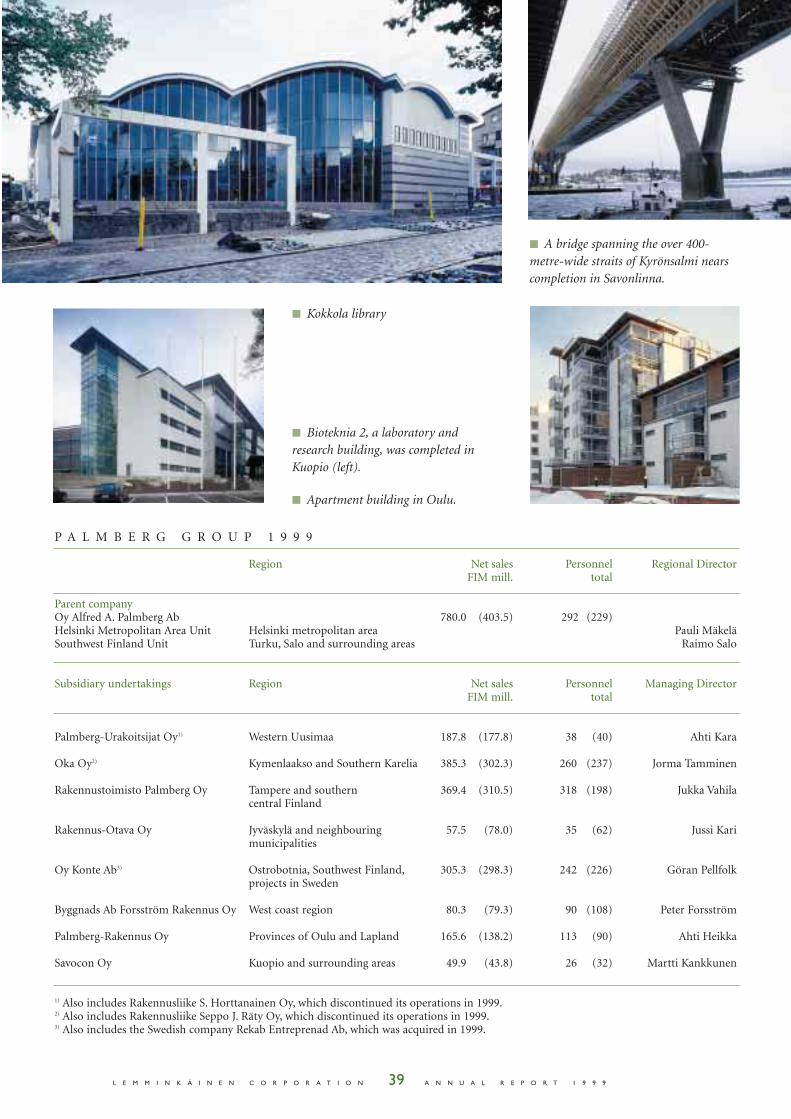
P A L M B E R G G R O U P 1 9 9 9
Region Net sales Personnel Regional DirectorFIM mill. total
Parent companyOy Alfred A. Palmberg Ab 780.0 (403.5) 292 (229)Helsinki Metropolitan Area Unit Helsinki metropolitan area Pauli MäkeläSouthwest Finland Unit Turku, Salo and surrounding areas Raimo Salo
Subsidiary undertakings Region Net sales Personnel Managing DirectorFIM mill. total
Palmberg-Urakoitsijat Oy1) Western Uusimaa 187.8 (177.8) 38 (40) Ahti Kara
Oka Oy2) Kymenlaakso and Southern Karelia 385.3 (302.3) 260 (237) Jorma Tamminen
Rakennustoimisto Palmberg Oy Tampere and southern 369.4 (310.5) 318 (198) Jukka Vahilacentral Finland
Rakennus-Otava Oy Jyväskylä and neighbouring 57.5 (78.0) 35 (62) Jussi Karimunicipalities
Oy Konte Ab3) Ostrobotnia, Southwest Finland, 305.3 (298.3) 242 (226) Göran Pellfolkprojects in Sweden
Byggnads Ab Forsström Rakennus Oy West coast region 80.3 (79.3) 90 (108) Peter Forsström
Palmberg-Rakennus Oy Provinces of Oulu and Lapland 165.6 (138.2) 113 (90) Ahti Heikka
Savocon Oy Kuopio and surrounding areas 49.9 (43.8) 26 (32) Martti Kankkunen
1) Also includes Rakennusliike S. Horttanainen Oy, which discontinued its operations in 1999.2) Also includes Rakennusliike Seppo J. Räty Oy, which discontinued its operations in 1999.3) Also includes the Swedish company Rekab Entreprenad Ab, which was acquired in 1999.
L E M M I N K Ä I N E N C O R P O R A T I O N A N N U A L R E P O R T 1 9 9 939
■ A bridge spanning the over 400-metre-wide straits of Kyrönsalmi nearscompletion in Savonlinna.
■ Kokkola library
■ Bioteknia 2, a laboratory andresearch building, was completed inKuopio (left).
■ Apartment building in Oulu.
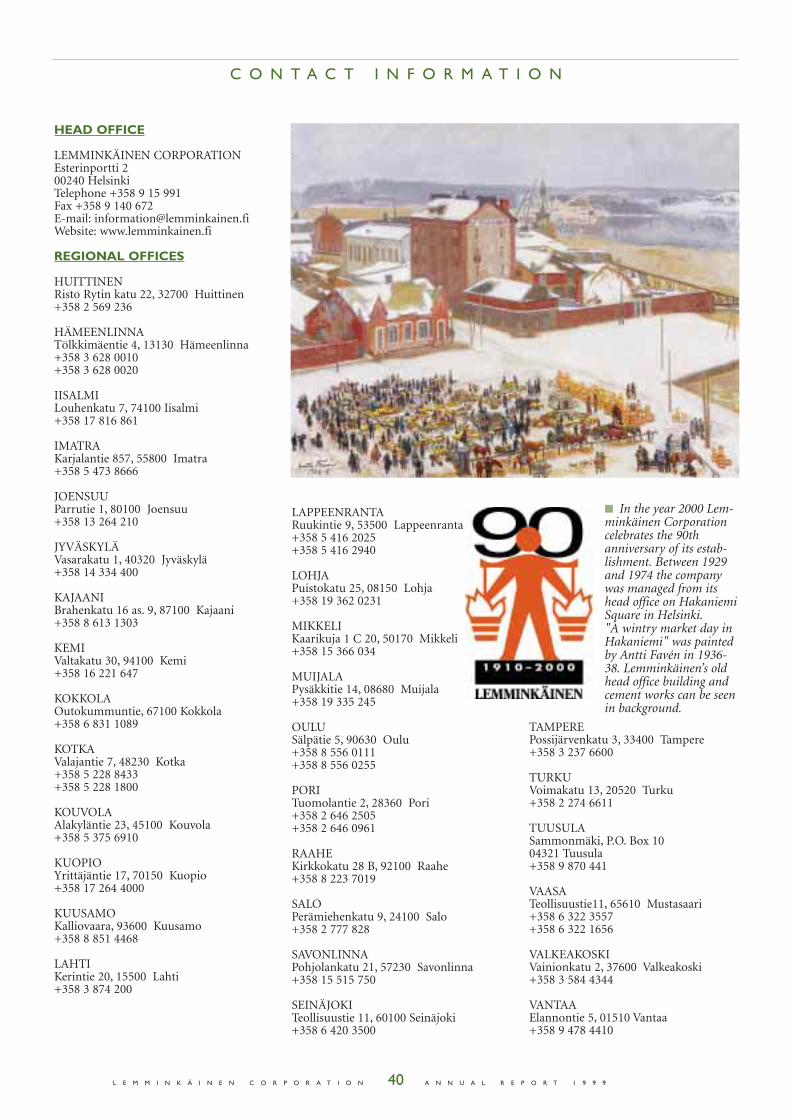
L E M M I N K Ä I N E N C O R P O R A T I O N A N N U A L R E P O R T 1 9 9 940
HEAD OFFICE
LEMMINKÄINEN CORPORATIONEsterinportti 200240 HelsinkiTelephone +358 9 15 991Fax +358 9 140 672E-mail: [email protected]: www.lemminkainen.fi
REGIONAL OFFICES
HUITTINENRisto Rytin katu 22, 32700 Huittinen+358 2 569 236
HÄMEENLINNATölkkimäentie 4, 13130 Hämeenlinna+358 3 628 0010+358 3 628 0020
IISALMILouhenkatu 7, 74100 Iisalmi+358 17 816 861
IMATRAKarjalantie 857, 55800 Imatra+358 5 473 8666
JOENSUUParrutie 1, 80100 Joensuu+358 13 264 210
JYVÄSKYLÄVasarakatu 1, 40320 Jyväskylä+358 14 334 400
KAJAANIBrahenkatu 16 as. 9, 87100 Kajaani+358 8 613 1303
KEMIValtakatu 30, 94100 Kemi+358 16 221 647
KOKKOLAOutokummuntie, 67100 Kokkola+358 6 831 1089
KOTKAValajantie 7, 48230 Kotka+358 5 228 8433+358 5 228 1800
KOUVOLAAlakyläntie 23, 45100 Kouvola+358 5 375 6910
KUOPIOYrittäjäntie 17, 70150 Kuopio+358 17 264 4000
KUUSAMOKalliovaara, 93600 Kuusamo+358 8 851 4468
LAHTIKerintie 20, 15500 Lahti+358 3 874 200
LAPPEENRANTARuukintie 9, 53500 Lappeenranta+358 5 416 2025+358 5 416 2940
LOHJAPuistokatu 25, 08150 Lohja+358 19 362 0231
MIKKELIKaarikuja 1 C 20, 50170 Mikkeli+358 15 366 034
MUIJALAPysäkkitie 14, 08680 Muijala+358 19 335 245
OULUSälpätie 5, 90630 Oulu+358 8 556 0111+358 8 556 0255
PORITuomolantie 2, 28360 Pori+358 2 646 2505+358 2 646 0961
RAAHEKirkkokatu 28 B, 92100 Raahe+358 8 223 7019
SALOPerämiehenkatu 9, 24100 Salo+358 2 777 828
SAVONLINNAPohjolankatu 21, 57230 Savonlinna+358 15 515 750
SEINÄJOKITeollisuustie 11, 60100 Seinäjoki+358 6 420 3500
TAMPEREPossijärvenkatu 3, 33400 Tampere+358 3 237 6600
TURKUVoimakatu 13, 20520 Turku+358 2 274 6611
TUUSULASammonmäki, P.O. Box 10 04321 Tuusula+358 9 870 441
VAASATeollisuustie11, 65610 Mustasaari+358 6 322 3557+358 6 322 1656
VALKEAKOSKIVainionkatu 2, 37600 Valkeakoski+358 3 584 4344
VANTAAElannontie 5, 01510 Vantaa+358 9 478 4410
C O N T A C T I N F O R M A T I O N
■ In the year 2000 Lem-minkäinen Corporationcelebrates the 90thanniversary of its estab-lishment. Between 1929and 1974 the companywas managed from itshead office on HakaniemiSquare in Helsinki."A wintry market day inHakaniemi" was paintedby Antti Favén in 1936-38. Lemminkäinen’s oldhead office building andcement works can be seenin background.
FACTORIES
CONCRETE PRODUCTS FACTORIES
Sammonmäki, P.O. Box 10 04321 Tuusula+358 9 870 441
16300 Orimattila+358 3 887 450
NATURAL STONE WORKS
07600 Myrskylä+358 19 677 0650
Kölkynvuorentie 6, 44500 Viitasaari+358 14 570 010
BITUMINOUS PRODUCTS FACTORY(ROOFING)
Puistokatu 25-27, 08150 Lohja+358 19 362 0201
DOMESTIC SUBSIDIARIES
LEMMINKÄINEN CONSTRUCTION LTD.Esterinportti 2, 00240 Helsinki+358 9 15 991Managing Director Matti A. Mantere
OY ALFRED A. PALMBERG ABEsterinportti 2, 00240 Helsinki+358 9 15 991Managing Director Risto Bono
S.W. Finland regional unitLinnankatu 3 a B, 20100 Turku+358 2 274 5800Area Manager Kari Mäkelä
Palmberg-Urakoitsijat OyUudenmaankatu 32-34, 05800 Hyvinkää+358 19 475 9100Managing Director Ahti Kara
Oka OyIlmarinkuja 3, 45100 Kouvola+358 5 741 8100Managing Director Jorma Tamminen
Rakennustoimisto Palmberg OySatakunnankatu 22 E, 33210 Tampere+358 3 3397 1100Managing Director Jukka Vahila
Rakennus-Otava OyPajatie 8, 40630 Jyväskylä+358 14 339 3800Managing Director Jussi Kari
Oy Konte AbOlympiakatu 16, 65100 Vaasa+358 6 323 0311Managing Director Göran Pellfolk
Byggnads Ab Forsström Rakennus OyÅströminkuja, 67100 Kokkola+358 6 823 2200Managing Director Peter Forsström
Palmberg-Rakennus OyValtatie 21, 90500 Oulu+358 8 514 4600Managing Director Ahti Heikka
Savocon OyPuijonkatu 29 A, 70100 Kuopio+358 17 261 3400Managing Director Martti Kankkunen
TIELINJA OYPäiviöntie 3, 12400 Tervakoski+358 19 754 600Managing Director Harri Linnakoski
OMNI-SICA OYEsterinportti 2, 00240 Helsinki+358 9 148 1144Managing Director Pekka Peho
FOREIGN SUBSIDIARIES
DenmarkLEMMINKÄINEN A/SDamhaven 5 C, 7100 Vejle+45 75 725 722
EstoniaLEMMINKÄINEN EESTI ASLiivalaia 14, 10118 Tallinn+372 6 461 125
AS TALTERBetooni 26, 11415 Tallinn+372 6 380 578
AS RAJAR TLLagedi. Rae vald, 75303 Harju Maakond+372 6 766 141
AS TASFILBetooni 28, 11415 Tallinn+372 6 057 550
HungaryICM INTERNATIONAL CONSTRUCTION MANAGEMENT Rt.H-1063 Budapest, Bajnok u. 13+36 1 3120 484
LatviaLEMCON LATVIJA SIA.E. Birznieka Upisa 10-2, LV-1050 Riga+371 72 87 010
LithuaniaUAB LEMCON VILNIUSA. Juozapaviciaus 9/k. 308, 2686 Vilnius+370 2 728 413
PolandLEMCON POLSKA Sp. z o.o.ul. Marconich 9 m 4, 02-954 Warsaw+48 22 8589 837
RussiaZAO LEMMINKÄINEN DORSTROIZAO LEMSTROIZAO RAKENNUS LEMMINKÄINENUl. Narodnaja 12, 109172 Moscow+7 095 2340 647, +7 095 956 04 71/72
ZAO LEMMINKÄINENZAO LEMMINKÄINEN DORSTROIPr. Kosmonavtov 1,196105 St. Petersburg+7 812 298 8700
SwedenLEMMINKÄINEN CONSTRUCTION LTD.Torsgatan 12, 11123 Stockholm+46 8 247 850
L E M M I N K Ä I N E N G R O U P W E B S I T E S
Lemminkäinen Group www.lemminkainen.fiBuilding Materials Division www.insinoori.netOy Alfred A. Palmberg Ab www.palmberg.comPaving Unit www.lemminkainen.fi/paallystysMineral Aggregates Unit www.lemminkainen.fi/kiviainesTielinja Oy www.tielinja.fiCentral Laboratory www.lemminkainen.fi/laboratorioStenberg-Yhtiöt Oy www.stenbergyhtiot.comForssan Betonituote Oy www.forssanbetoni.fiICM InternationalConstruction Management Rt. www.icm.hu
LEMMINKÄINEN CORPORATIONEsterinportti 2, 00240 HelsinkiP.O.Box 23, 00241 HelsinkiTelephone +358 9 15 991Fax +358 9 140 672Website: www.lemminkainen.fi