Embed Size (px)
Citation preview
“To be a World Class Modern Central Bank”
C E N T R A L B A N K O F K E N Y AANNUAL REPORT & FINANCIAL STATEMENTS 2016/17
I
A N N U A L R E P O R TA N D F I N A N C I A L S TAT E M E N T S
2016/2017
“To be a World Class Modern Central Bank”
C E N T R A L B A N K O F K E N Y AANNUAL REPORT & FINANCIAL STATEMENTS 2016/17
II
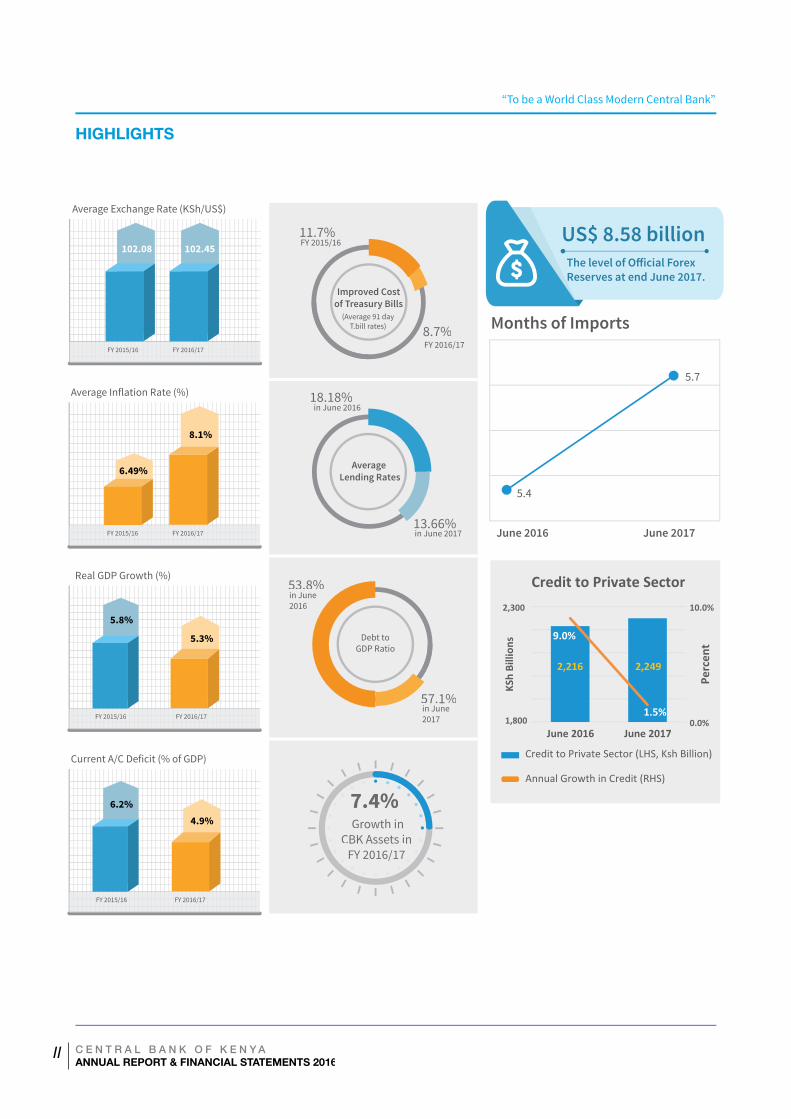
Average Exchange Rate (KSh/US$)
102.08 102.45
FY 2015/16 FY 2016/17
Average Inflation Rate (%)
6.49%
8.1%
FY 2015/16 FY 2016/17
Real GDP Growth (%)
5.3%
FY 2016/17FY 2015/16
5.8%
Current A/C Deficit (% of GDP)
4.9%
FY 2016/17FY 2015/16
6.2%
Months of Imports
June 2017June 2016
5.4
5.7
57.1%
53.8%in June2016
in June 2017
Debt toGDP Ratio
8.7%
11.7%FY 2015/16
(Average 91 dayT.bill rates)
FY 2016/17
Improved Cost of Treasury Bills
13.66%
18.18%in June 2016
in June 2017
Average Lending Rates
7.4%Growth in
CBK Assets in FY 2016/17
2,216 2,249
9.0%
1.5%0.0%
10.0%
1,800
2,300
June 2016 June 2017
Perc
ent
KSh
Billi
ons
Credit to Private Sector
Credit to Private Sector (LHS, Ksh Billion)
Annual Growth in Credit (RHS)
US$ 8.58 billionThe level of Official Forex Reserves at end June 2017.
HIGHLIGHTS

“To be a World Class Modern Central Bank”
C E N T R A L B A N K O F K E N Y AANNUAL REPORT & FINANCIAL STATEMENTS 2016/17
III
“To be a World Class Modern Central Bank”
C E N T R A L B A N K O F K E N Y AANNUAL REPORT & FINANCIAL STATEMENTS 2016
III
OUR VALUES
OUR MISSION
OUR VISION
CommitmentProfessionalism and Relevance
Innovativeness
Mutual Respect and Teamwork: Diversity and Inclusiveness:
The Vision of the Bank is “To be a World Class Modern Central Bank.”
The Board and staff are committed to implementing the Bank’s mandate as
stipulated in the Constitution of Kenya and the CBK Act.
Efficiency & Effectiveness
Transparency,Accountability and Integrity:
The Bank will at all times undertake its operations in the most cost efficient
and effective manner while maintaining high standards of performance in
execution of its mandate.
The Board and staff will always act in a transparent and accountable manner
when handling all the affairs of the Bank both internally and with external
parties so as to uphold the Bank’s image at all times. In addition, the Bank
will uphold high standards of ethics, integrity and honesty as guided by the
Constitution, act in an ethical manner as guided by the Leadership and Integrity Act and the Public Officers’ Ethics Act,
and observe high moral standards.
The Board and staff will always endeavour to offer quality services to its internal and external customers, diligently observing high professional standards at all times and respecting the rules and regulations set by the Bank. All initiatives and activities undertaken remain relevant to the Bank’s strategic objectives in pursuit of its core mandate.
The Bank will encourage, nurture and support creativity and the development of new ideas and processes for the continued improvement of organisational performance.
Mutual respect shall at all times be observed internally amongst colleagues and when dealing with the Bank’s external clients. In addition, the Board and staff will cooperate and collaborate to enhance performance and create a healthy work environment.
The Bank appreciates and embraces the differences in its employees’ skills sets and abilities and encourages consultations and inclusiveness in pursuit of its mandate across departments. This is aimed at maximising productivity and enhancing the Bank’s overall performance.
To formulate and implement monetary policy for price stability, foster a stable market-based financial system and ensure a sound national payment system.
MANDATES Article 231 of the Constitution of Kenya and Sections 4 and 4A of the Central Bank of Kenya Act outline key mandates of Central Bank of Kenya (CBK) as to:
i). Formulate and implement monetary policy directed to achieving and maintaining stability in the general level of prices.
ii). Foster the liquidity, solvency and proper functioning, efficient, sound and stable market-based financial system.
iii). Formulate and implement such policies as best to promote the establishment, regulation and supervision of efficient and effective payment, clearing and settlement systems.
iv). Design, issue and manage efficient distribution of quality currency (notes and coins) that are easily accepted and secure against counterfeiting.
v). Support the Government’s economic and financial policies including its objectives for growth and employment.
The other mandates of the Bank include: – formulating and implementing foreign exchange policy; effective management of the nation’s foreign exchange reserves; licensing and supervising authorized dealers; act as banker and adviser to, and fiscal agent of the Government.
“To be a World Class Modern Central Bank”
C E N T R A L B A N K O F K E N Y AANNUAL REPORT & FINANCIAL STATEMENTS 2016/17
IV
FOREWORD BY THE GOVERNOR ..............................................................................................iii
STATEMENT BY THE CHAIRMAN OF THE BOARD ..........................................................................v
OVERVIEW .......................................................................................................................... vii
CBK@50 CELEBRATIONS ........................................................................................................ ix
1.0 WORLD ECONOMY .........................................................................................................2
2.0 DOMESTIC ECONOMY .....................................................................................................8
2.1 Real Sector .......................................................................................................................... 8
2.2 Inflation ............................................................................................................................ 16
2.3 Government Budgetary Operations ..................................................................................... 21
2.4 Public Debt ........................................................................................................................ 26
2.5 Developments in Balance of Payments ................................................................................ 32
3.0 CENTRAL BANK OPERATIONS ........................................................................................ 40
3.1 Monetary Policy Management ............................................................................................. 40
3.2 Interest Rates .................................................................................................................... 48
3.3 Exchange Rates .................................................................................................................. 50
3.4 Banking Sector .................................................................................................................. 52
3.5 Currency and Banking Services ........................................................................................... 60
3.6 National Payments ............................................................................................................ 62
4.0 REGIONAL INTEGRATION DEVELOPMENTS ...................................................................... 69
5.0 FINANCIAL PERFORMANCE OF THE CENTRAL BANK OF KENYA FOR THE YEAR ENDED JUNE 2017 .... 77
TABLE OF CONTENT
“To be a World Class Modern Central Bank”
C E N T R A L B A N K O F K E N Y AANNUAL REPORT & FINANCIAL STATEMENTS 2016/17
V
LETTER OF TRANSMITTAL
“To be a World Class Modern Central Bank”
C E N T R A L B A N K O F K E N Y AANNUAL REPORT & FINANCIAL STATEMENTS 2016/17
VI
FOREWORD BY THE GOVERNOR
Steering the Central Bank of Kenya to be a Global Leader in Central Banking and Financial Sector Innovations
I am pleased to present the Central Bank of Kenya Annual Report for Financial Year 2016/2017. The year marked a momentous period in the history of the Central Bank of Kenya (CBK). The Bank celebrated its 50th anniversary on September 14, 2016, marked by a series of events involving the youth, sponsorship of National Music Festival, a high level international Central Banking Symposium, introduction of an Internship programme, CBK@50 Book Project, CBK Numismatic Exhibition, support to St. Kizito School of the Blind, and issuance of a commemorative coin. The Bank has also enhanced health related activities that include weekly athletics, sports and mountain climbing, with the epic event being conquering the highest Mountain in Africa – Mt. Kilimanjaro. These events have resulted in enhanced team building, and cohesiveness in the Bank. The Bank jointly with the EuroMoney successfully hosted the International EuroMoney Conference on Financial Inclusion with the theme of expanding Kenya’s Digital Financial Ecosystem. The conference brought together global and national experts to share lessons and experiences. I am delighted to report that modernization of the Central Bank website to enhance information dissemination resulted in the Bank wining the central bank of the Year Award for 2016, just behind the Bank of England and Bank of Canada.
In the year under review, the Bank pursued its primary objectives of achieving and maintaining monetary and financial stability. The CBK largely achieved its inflation target, except on occasions where it exceeded the upper band of 7.5 percent because of increases in food prices due to the prolonged drought in the first quarter of 2017. On the exchange rate, the Kenya Shilling remained relatively stable against the U.S dollar despite short-term global volatilities. The stability of the Shilling was partly due to a narrower current account deficit, enhanced flows from tea and horticultural exports, recovery of the tourism industry and resilience of diaspora remittances. The inflation and exchange rate outcomes reflected pursuit of appropriate monetary policy stance by the Monetary Policy Committee (MPC). In addition, the Bank continues to improve its monetary policy framework including adoption of forward-looking tools such as Forecasting and Policy Analysis System for predicting inflation. Modernization of the National Payments System has improved the efficiency and effectiveness of the monetary policy instruments. Furthermore, the MPC has enhanced the transparency and confidence in monetary policy decisions, thereby anchoring expectations around the policy direction and actions supported by effective communication.
“To be a World Class Modern Central Bank”
C E N T R A L B A N K O F K E N Y AANNUAL REPORT & FINANCIAL STATEMENTS 2016/17
VII
FOREWORD BY THE GOVERNOR
The financial sector remained sound and resilient in the year under review, with a banking sector adequately capitalized despite spillover of vulnerabilities from 2015 and early 2016. The Bank took bold transformative reforms dubbed ‘New Normal’ based on three pillars – enhanced governance and integrity, greater transparency, and business models re-engineering and innovations by banks. In addition, the Bank took measures to strengthen its supervisory standards and capacity. These reforms will strengthen the entire financial sector in the long term.
On the downside, significant slowdown in credit to the private sector and the implementation of interest rate capping law in September 2016, posed challenges to the banking and financial sector. This has underscored the need to continuously monitor and assess underlying developments, in respect of which the Monetary Policy Committee commissioned respective studies to inform options for effective monetary policy.
Kenya’s banking sector continues to grow in terms of inclusiveness, efficiency and stability on the backdrop of legal, regulatory and supervisory reforms and standards. The key developments during the year are issuance of guidance note on Internal Capital Adequacy Assessment Process (ICAAP) in November 2016 to banks; implementation of the IFRS 9; the interest rates capping law; issuance of cyber security guidelines; and promoting transparency in pricing of credit.
On the outlook, we continue to monitor global developments and the Bank will appropriately respond to any shock that may create instability in the Kenyan economy.
Dr. Patrick NjorogeGovernor, Central Bank of Kenya
“To be a World Class Modern Central Bank”
C E N T R A L B A N K O F K E N Y AANNUAL REPORT & FINANCIAL STATEMENTS 2016/17
VIII
STATEMENT BY THE CHAIRMAN OF THE BOARD
Laying the Foundation for World Class Central Bank to foster Inclusive Growth and Stability
The Central Bank of Kenya achieved significant milestones in the Financial Year (FY) 2016/17. The Government fully constituted the Bank’s Board of Directors, paving way for effective oversight and policy direction. The Board established two committees – Human Resources Committee and the Audit Committee - to support the discharge of its mandates. It also reviewed the Bank’s Strategic Plan and aligned the strategic focus areas to the Bank’s mandates. In order to enhance operational efficiency, the Board laid the foundation to strengthen the Bank’s organizational structure and human resource including staff alignment.
The CBK Board of Directors identified key strategic areas for implementation in FY 2017/2018. The priorities include fostering stability and integrity of the financial sector; stabilizing and enhancing core banking systems infrastructure; raising standards of premises, security infrastructure and systems; roll out of Phase II and III of the staff Re-visioning Plan; enhancing National Payments Systems Oversight and Risk Management Function. Further strategic initiatives will entail developing an impactful communication function; upgrading currency centres and branch premises, equipment and machines; enhancing operations in domestic debt management and promoting market development; re-aligning the procurement function and its systems; and improving provision of accurate, timely, relevant and sufficient data to support decision making.
The Bank has prioritized the establishment of a timely access to reliable and accurate data to aid analytical capability. In this regard, the Board has approved investment in an Enterprise Data Warehouse System and the modernization of the Bank’s Libraries.
The Board adheres to best corporate governance standards and practices in performing its duties and responsibilities. It has established a monitoring and evaluation framework to track the implementation of the strategic plan 2015-18 on a quarterly basis in order to achieve the set goals. As an institution aspiring to be a modern world-class in line with global practice, we shall endeavor to establish and maintain productive working relationships with our key stakeholders. Against this background, the Board will engage and forge partnerships with relevant stakeholders in the implementation of the Bank’s strategic plan.
The Board will continue to work closely with the Bank Management and other key stakeholders to ensure realization of the Vision and Mission of the Bank.
Mr. Mohamed NyaogaChairman, CBK Board of Directors
“To be a World Class Modern Central Bank”
C E N T R A L B A N K O F K E N Y AANNUAL REPORT & FINANCIAL STATEMENTS 2016/17
IX
BOARD OF DIRECTORS
“To be a World Class Modern Central Bank”
C E N T R A L B A N K O F K E N Y AANNUAL REPORT & FINANCIAL STATEMENTS 2016/17
X
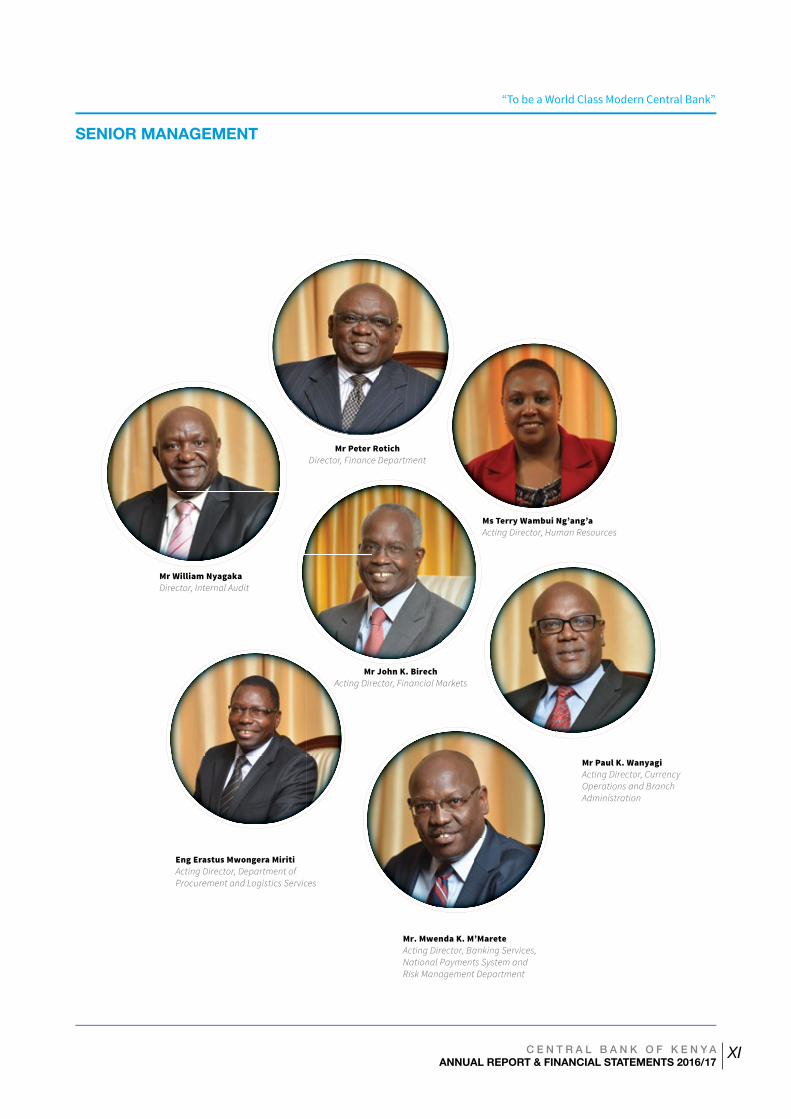
SENIOR MANAGEMENT
Dr Patrick Njoroge (Ph.D.)
Governor
Mrs Sheila M’MbijjeweDeputy Governor
Mr Gerald Arita NyaomaDirector, Bank Supervision Department
Ms Rose A. DethoDirector, Strategic Management Department
Mr Kennedy Kaunda AbugaDirector, Governors’ Office
Prof Kinandu Muragu (PhD)Executive Director, Kenya School of Monetary Studies (KSMS)
Mr Charles Gitari KooriDirector, Research
“To be a World Class Modern Central Bank”
C E N T R A L B A N K O F K E N Y AANNUAL REPORT & FINANCIAL STATEMENTS 2016/17
XI
SENIOR MANAGEMENT
Eng Erastus Mwongera MiritiActing Director, Department of Procurement and Logistics Services
Mr. Mwenda K. M’MareteActing Director, Banking Services, National Payments System and Risk Management Department
Mr Peter RotichDirector, Finance Department
Mr John K. BirechActing Director, Financial Markets
Mr Paul K. WanyagiActing Director, Currency Operations and Branch Administration
Ms Terry Wambui Ng’ang’aActing Director, Human Resources
Mr William NyagakaDirector, Internal Audit
“To be a World Class Modern Central Bank”
C E N T R A L B A N K O F K E N Y AANNUAL REPORT & FINANCIAL STATEMENTS 2016/17
XII
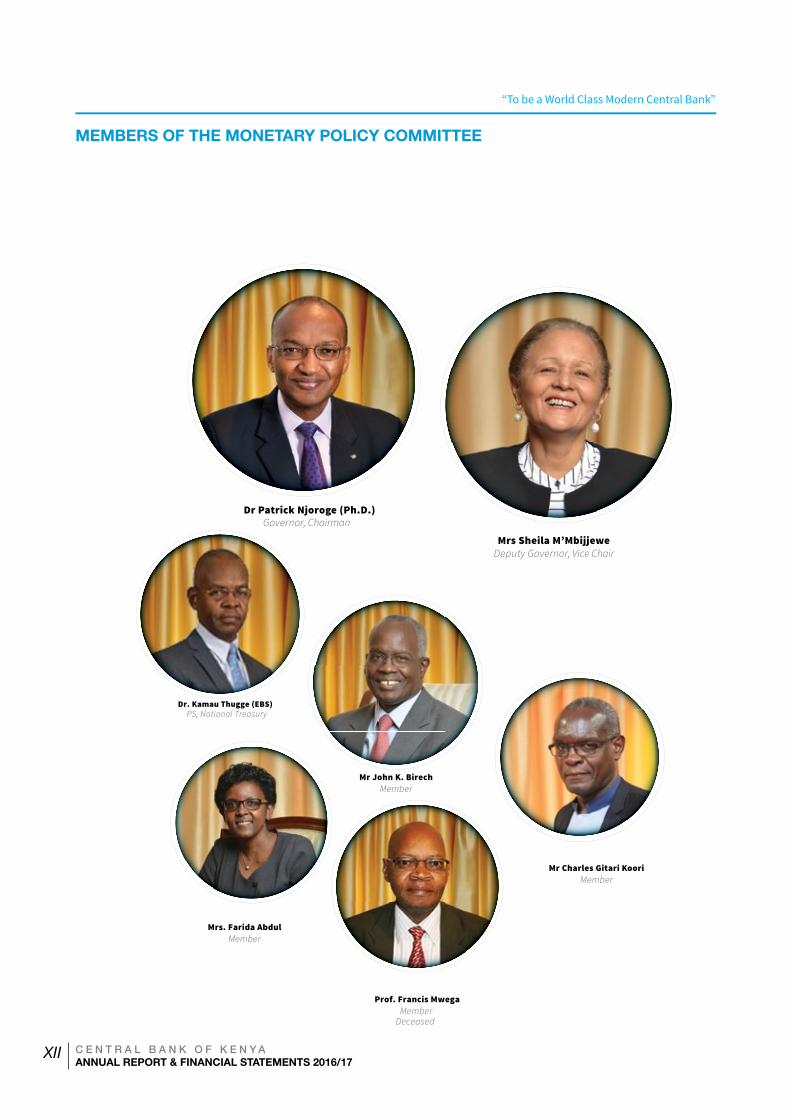
MEMBERS OF THE MONETARY POLICY COMMITTEE
Dr Patrick Njoroge (Ph.D.)Governor, Chairman
Mrs Sheila M’MbijjeweDeputy Governor, Vice Chair
Mrs. Farida AbdulMember
Mr Charles Gitari KooriMember
Mr John K. BirechMember
Prof. Francis MwegaMember
Deceased
Dr. Kamau Thugge (EBS)PS, National Treasury
“To be a World Class Modern Central Bank”
C E N T R A L B A N K O F K E N Y AANNUAL REPORT & FINANCIAL STATEMENTS 2016/17
XIII
OVERVIEW
Central Bank of Kenya @50 CelebrationsThe Central Bank of Kenya (CBK) turned 50 on Wednesday, September 14, 2016, a ripe age for its golden jubilee. The Bank celebrated its achievements in support of the nation’s development. To commemorate its 50th Anniversary, CBK lined up a series of events targeted to encourage public ownership and participation in the golden jubilee celebrations. Several initiatives targeted the youth, in part, to respond to the growing demands of providing inspiration and opportunities to the future leaders of this nation. The celebrations had begun a year earlier, on September 14, 2015.
The culmination of the CBK@50 celebrations was the Epic Event, on September 14, 2016 at the Nairobi National Museum, with participants including Government officials, domestic and international stakeholders as well as development and strategic partners. The event was graced by His Excellency, the President of the Republic of Kenya, Hon. Uhuru Kenyatta, CGH. During the Epic celebration, H.E. the President launched the CBK Numismatic Exhibition. The Exhibition which was developed in collaboration with the National Museums of Kenya, featured various historical and current currencies and provided information on other significant developments over the past 50 years of central banking in Kenya. As part of the celebrations, CBK also minted a commemorative coin with a face value of KSh 50.
Global Economic PerformanceGlobal economic activity is gaining momentum from a broad-based recovery in investment, trade, and industrial production both in advanced economies and emerging market and developing economies. Global growth will strengthen to 3.6 per cent in 2017 and 3.7 per cent in 2018, from 3.2 per cent in 2016 (IMF, World Economic Outlook, dated October 2017). Growth in advanced economies will increase to 2.2 per cent in 2017 from 1.7 per cent in 2016, following contributions from both domestic and external demand, as continued recovery in global investment
spur stronger manufacturing activity. Among emerging markets and developing economies, growth is projected to increase to 4.6 per cent in 2017 and 4.9 per cent in 2018, from 4.3 per cent in 2016, anchored on higher domestic demand in China and continued recovery in key emerging market economies.
Growth in Sub-Saharan Africa (SSA) is expected to rise 2.6 per cent in 2017 and 3.5 per cent in 2018 from 1.4 percent in 2016, with sizeable differences across countries. The recovery reflects improved performance of the two large economies, Nigeria and South Africa, attributed to the impact of improvement in commodity prices and favorable weather conditions.
While risks around the global growth forecast appear broadly balanced in the near term, they remain skewed to the downside over the medium term with protracted policy uncertainty, adverse weather conditions and financial sector vulnerabilities affecting market confidence and asset valuations, and thus weighing down on global growth.
Kenya Economic PerformanceThe Kenyan economy remained strong in 2016, growing by 5.8 per cent compared to 5.7 per cent in 2015. The resilience emanated from favourable weather conditions that boosted agricultural production, public investment spending, lower global oil prices and strong recovery in tourism. In the first quarter of 2017, however, growth decelerated to 4.7 per cent mainly due to prolonged drought conditions, which prevailed from late 2016, adversely affecting agriculture production. Nevertheless, the economy recovered in the second quarter of 2017 and recorded an improved growth of 5.0 per cent, which was supported by a modest recovery of the agriculture sector and robust growth of other sectors such as real estate, and transport and storage. These non-agriculture sectors have continued to support growth even when agriculture had declined.
“To be a World Class Modern Central Bank”
C E N T R A L B A N K O F K E N Y AANNUAL REPORT & FINANCIAL STATEMENTS 2016/17
XIV
OVERVIEW
InflationAnnual average inflation increased to 8.1 per cent in June 2017 from 6.5 per cent in June 2016, largely driven by increases in food prices since February 2017 following prolonged drought conditions experienced in the last quarter of 2016 and first quarter of 2017. The 12-month overall inflation, accelerated from 7.0 per cent in January 2017 to 11.7 per cent in May 2017, and breached the 7.5 per cent upper bound on its target range from February. The drought adversely affected production of key food crops, resulting in food shortages. However, the Monetary Policy Committee (MPC) considered the surge in overall inflation in the first half of 2017 as temporary phenomenon that did not require changing the stance of monetary policy as indicators of demand pressures remained subdued. The surge in the 12-month inflation turned around in June 2017, supported by improved weather conditions in the second quarter of 2017, which resulted in increased supply of vegetables and other fast growing foods. The Government interventions also helped to stabilise prices of key food items.
Monetary Policy ManagementThe Central Bank of Kenya conducted monetary policy focused on achieving and maintaining stability in the general level of prices. The MPC had retained the CBR at 10.5 per cent in July 2016 given moderate inflationary pressures. Furthermore, the effects of the fuel tax increase imposed in December 2015 exerted temporary upward pressure on consumer prices. The MPC eased the policy rate (CBR) to 10 per cent in September 2016 on the back of favourable inflation outlook in the short term, and persistent slowdown in private sector credit growth. The MPC retained the CBR at 10 percent through June 2017 signalling absence of significant demand pressures in the economy and the need to continue anchoring inflationary expectations. The MPC noted with concern the continued slowdown in credit to the private sector, and the implementation of interest rate caps in September 2016. Underscoring the need to assess the impact of the interest rate capping law
on the banking sector, the MPC also noted that banks were reviewing their business models aimed at enhancing the resilience of their operations in the new environment.
The enactment of the interest rate capping law is against the government’s commitment to a market based economy. The post-independence era controls, which were abolished in the early 1990’s caused financial repression resulting in low savings rate in the economy, systemic weaknesses, heavy burden on the exchequer and slow economic growth. The liberalised environment has supported achievement of great strides in the development of the financial sector and the economy since the 1990s. There is no reason to believe that a new era of interest controls would not bring these negative consequences to the Kenyan economy.
Kenya’s foreign exchange market remained relatively stable despite global volatilities arising from uncertain economic and trade policies in the US and the Brexit negotiations during the year to June 2017. This stability was derived from the narrowing of the current account deficit reflecting a lower import bill, enhanced flows from tea and horticultural export, recovery of the tourism industry and resilience of diaspora remittances. Oil prices in the international markets will remain relatively low, resulting in a moderately lower import bill. Foreign exchange earnings from key commodities such as tea and horticulture and inflows from diaspora remittances remain resilient. Consequently, these developments may put less pressure on the current account deficit. Receipts from tourism are also on a recovery path reflecting Government’s focus on new regions to cushion against the volatility of the European Market; lifting of travel bans by governments in key source markets in Europe and America; global increase in awareness of Kenya as a tourist destination; and recovery of Kenya’s cruise tourism business. The stock of international reserves at USD 8.58 billion as at June 2017, equivalent to 5.7 months of imports, reflects an adequate buffer in relation to the 4.5 months of import cover target floor. In addition, the
“To be a World Class Modern Central Bank”
C E N T R A L B A N K O F K E N Y AANNUAL REPORT & FINANCIAL STATEMENTS 2016/17
XV
OVERVIEW
precautionary arrangements with the IMF amounting to USD 1.5 billion continue to provide an additional buffer against short term external and domestic shocks.
Government Budgetary OperationsGovernment budgetary operations in the Fiscal Year (FY) 2016/17 resulted in a deficit of 8.9 per cent of GDP on a commitment basis, compared to 7.7 per cent of GDP in the FY 2015/16. The deficit was, however, within the target 10.9 per cent of GDP. Government expenditure increased steadily, against constrained revenue growth despite tax reform measures. The domestic financing of the deficit decreased to 44.7 per cent from 53.9 per cent in the FY 2014/15. Over the last 5 years, the domestic financing component has been coming down as the government continues to have more access to the cheaper external financing options.
Kenya’s public and publicly guaranteed debt increased by 22.0 per cent during FY 2016/17. In both the domestic and external debt components. Public debt portfolio comprised 47.9 per cent and 52.1 per cent of domestic and external debt, respectively by the end of FY 2016/17. This was reflective of the financing mix in recent financial years with external financing preferred over domestic financing owing to lower financing costs. The ratio of public debt to GDP rose to 57.1 per cent in nominal terms, but at 49.2 per cent in present value terms remained within the EAC convergence criterion.
Banking Sector DevelopmentsKenya banking sector continued to grow in terms of inclusiveness, efficiency and stability on the backdrop of legal, regulatory and supervisory reforms and initiatives. The main developments include issuance of guidance note on Internal Capital Adequacy Assessment Process (ICAAP) in November 2016 to all commercial banks and mortgage finance companies; setting out the general rules to govern an institution’s ICAAP, its key features and disclosure requirements. Two new commercial banks; DIB Bank Kenya Ltd and Mayfair Bank Limited were licensed in April 2017 and June 2017, respectively. DIB Bank Kenya Ltd is the third fully sharia compliant bank in Kenya after Gulf African Bank Ltd in 2007 and First Community Bank Limited in 2008.
Several commercial banks introduced a payment system product, PESALINK, to provide a secure and efficient platform for money transfer across accounts held with banks. The platform, managed by Kenya Bankers Association (KBA) through its subsidiary, the Integrated Payment Services Limited, will complement the existing payment system infrastructure and provide customers with more choice. In order to promote transparency in pricing of credit, the Central Bank of Kenya jointly with the Kenya Bankers Association launched an on-line portal on cost of credit on June 22, 2017 to provide information on lending rates and charges offered by licensed banks. The portal aims at enabling users compare the price of credit from various banks. Central Bank of Kenya also issued for comments a Guidance Note on Cyber Risk, outlining the minimum requirements for banks to enhance cyber security.
“To be a World Class Modern Central Bank”
C E N T R A L B A N K O F K E N Y AANNUAL REPORT & FINANCIAL STATEMENTS 2016/17
XVI
The Central Bank of Kenya (CBK) officially opened its doors to the public on September 14, 1966. On Wednesday, September 14, 2016, the Bank turned 50, its golden jubilee, and celebrated its achievements in support of the nation’s macroeconomic development.
The Cabinet Secretary to the National Treasury, Mr. Henry Rotich, set the stage for the CBK@50 celebrations by launching the commencement of a year of the public celebrations on September 25, 2015. The CBK staff also held Thanksgiving Ceremony on the same day at the Head Office, Branches and Currency Centers.
To commemorate the 50th anniversary, CBK lined up a series of public events and activities that were targeted to encourage public ownership and participation in the Bank’s Golden Jubilee celebrations. Several initiatives deliberately targeted the youth to respond, in part, to the growing demands of providing inspiration and opportunities to the youth as the future leaders of the nation. The initiatives and activities that marked the CBK’s 50th anniversary celebrations included the following:
1. The Internship ProgramThe Central Bank of Kenya Internship Program (CBKIP) launched on July 1, 2016. Currently in its third cohort, the CBKIP is a six-month programme that aims to expose talented youth to the work of central banking, improve financial sector literacy and generate a pool of skilled graduates for the broader financial sector.
2. The Kenya School of Monetary Studies Support Initiatives
(i) Mathare Youth Empowerment Programme: KSMS and the CBK jointly organized and delivered the Mathare Youth Empowerment Programme. The Governor launched the programme on May 31, 2016 at KSMS. The objectives of the programme included imparting financial management skills to youth groups from the Mathare area and providing them with
strategic linkages with the corporate sector. Over three hundred youths attended the three-day event.
(ii) Financial Literacy Program for Athletes: This program sought to identify economic challenges faced by former, current and upcoming sports and athletics champions in Kenya. The objective was to assist in enhancing their financial literacy and capacity to resolve financial challenges that may inhibit their ability to invest in viable business ventures and manage their wealth. The event took place on October 28, 2016 in Eldoret.
3. The Kenya Music FestivalThe Bank collaborated with the Ministry of Education’s Kenya Music Festival Committee (KMF), under the Ministry of Education Science and Technology, as the Title and Thematic Sponsor of the 2016 Primary and Secondary Schools Music Festival. CBK used the KMF platform to demonstrate the value it places on nurturing and developing youth talent as the next crop of leaders. In particular, CBK’s sponsorship of the festival provided the opportunity for the youth to grow their financial literacy and artistic talents through music and poetry as well as connect with the public. This initiative registered great impact resulting in the Bank sponsoring, again, the Kenya Music Festival, 2017.
4. Documentaries CBK produced a documentary featuring the staff behind the Bank. This documentary featured in different media beginning the first week of September 2016.
5. Publications T h e B a n k p r o d u ce d t h e f o l l o w i n g t w o commemorative publications:
CBK@50 CELEBRATIONS
“To be a World Class Modern Central Bank”
C E N T R A L B A N K O F K E N Y AANNUAL REPORT & FINANCIAL STATEMENTS 2016/17
XVII
(i) History and Development of Money in Kenya This book chronicles the development of money as an important instrument in facilitation of trade in Kenya and the East Africa region. The book’s pictorial nature gives an aesthetic appeal to every reader while sharing a piece of history. The Governor presented the book to His Excellency the President during the epic celebrations on September 14, 2016.
(ii) The People of Central BankA separate book produced to capture and celebrate CBK staff. In particular, the book tells captivating stories by staff that highlight the contribution of CBK staff to the society.
6. Commemorative Coins/Memorabilia The Bank minted a commemorative coin that depicts the CBK@50 celebrations. The coin, with a face value of KES.50, is available in both gold and gold plated nickel brass. The gold plated nickel brass coin is embedded in an acrylic block as a paperweight. The Governor presented the gold commemorative coin to His Excellency the President during the epic celebrations on September 14, 2016. The Bank issued the coins as memorabilia to staff, CBK guests and key stakeholders.
7. Painting/Art Competition CBK, in conjunction with the National Museums of Kenya (NMK), organized a painting competition for primary and high school students, sponsored by the Kenya Bankers Association (KBA). The competition entailed students representing the CBK@50 theme through creative and artistic forms such as paintings, collage, mosaic and other creative works of art. Forty-one children aged between 6 - 18 years from more than 18 schools took part in the competition. The paintings submitted were assessed and the winning art
works put on display at the Nairobi National Museum throughout the CBK celebratory period.
8. Central Banking Symposium CBK hosted an International Central Banking
Symposium on September 13, 2016. This was a high level scholars’ Symposium that brought together senior local and international economists, researchers, academia and other stakeholders to engage on emerging issues in central banking. Over 195 delegates attended the symposium.
The Cabinet Secretary to the National Treasury, Mr. Henry Rotich officially opened the Symposium while Mr. Mitsuhiro Furusawa, Deputy Managing Director, IMF, gave the keynote address.
9. Numismatic Museum The National Museums of Kenya (NMK) collaborated with the CBK to host a temporary Numismatic Central Bank Exhibition at the National Museum. The Exhibition provides a platform for the Bank to educate the public on the evolution of the Kenya currency and other important artefacts and memorabilia of historic significance to the CBK and its mandate.
10. Epic CelebrationCBK’s Golden Jubilee was marked with an Epic celebration, graced by His Excellency, the President of the Republic of Kenya, Hon. Uhuru Kenyatta, CGH, on September 14, 2016 at the Nairobi National Museum. During the auspicious occasion, the President officially launched the CBK Numismatic Exhibition.
Over 280 delegates (including high rank Government officials, local and international stakeholders as well as development and strategic partners) attended the Epic event. During this historic celebration, CBK reflected on its milestones over the auspicious 50-year journey as well as its future goals.
CBK@50 CELEBRATIONS
“To be a World Class Modern Central Bank”
C E N T R A L B A N K O F K E N Y AANNUAL REPORT & FINANCIAL STATEMENTS 2016/17
XVIII
To conclude the Epic celebrations, CBK hosted a number of dignitaries to a game drive and a bush dinner at the Nairobi National Park.
11. Other Events
(i) Beyond Zero First Lady’s Half Marathon held on March 6, 2016 over 500 staff drawn from the Head Office, Branches and Currency Centres supported the First Lady’s “Beyond Zero Campaign” half marathon.
CBK@50 CELEBRATIONS
(ii) Financial sector chief executive officers (CEO’s) run held on October 1, 2016: The Kenya Institute of Bankers 32nd Edition of the Inter-Bank Games saw the inaugural of the CEO’s run with the Bank emerging the overall winner.
(iii) CBK Staff Party: The CBK staff in Nairobi, the Branches and Currency Centers commemorated the 50th anniversary in celebrated parties, attended by their guests, CBK retirees and graced by the Governor.

“To be a World Class Modern Central Bank”
C E N T R A L B A N K O F K E N Y AANNUAL REPORT & FINANCIAL STATEMENTS 2016/17
XIX
“To be a World Class Modern Central Bank”
C E N T R A L B A N K O F K E N Y AANNUAL REPORT & FINANCIAL STATEMENTS 2016/17
1
1.0 WORLDECONOMY
1 C E N T R A L B A N K O F K E N Y AANNUAL REPORT & FINANCIAL STATEMENTS 2016/17
“To be a World Class Modern Central Bank”
C E N T R A L B A N K O F K E N Y AANNUAL REPORT & FINANCIAL STATEMENTS 2016/17
2
WORLD ECONOMY
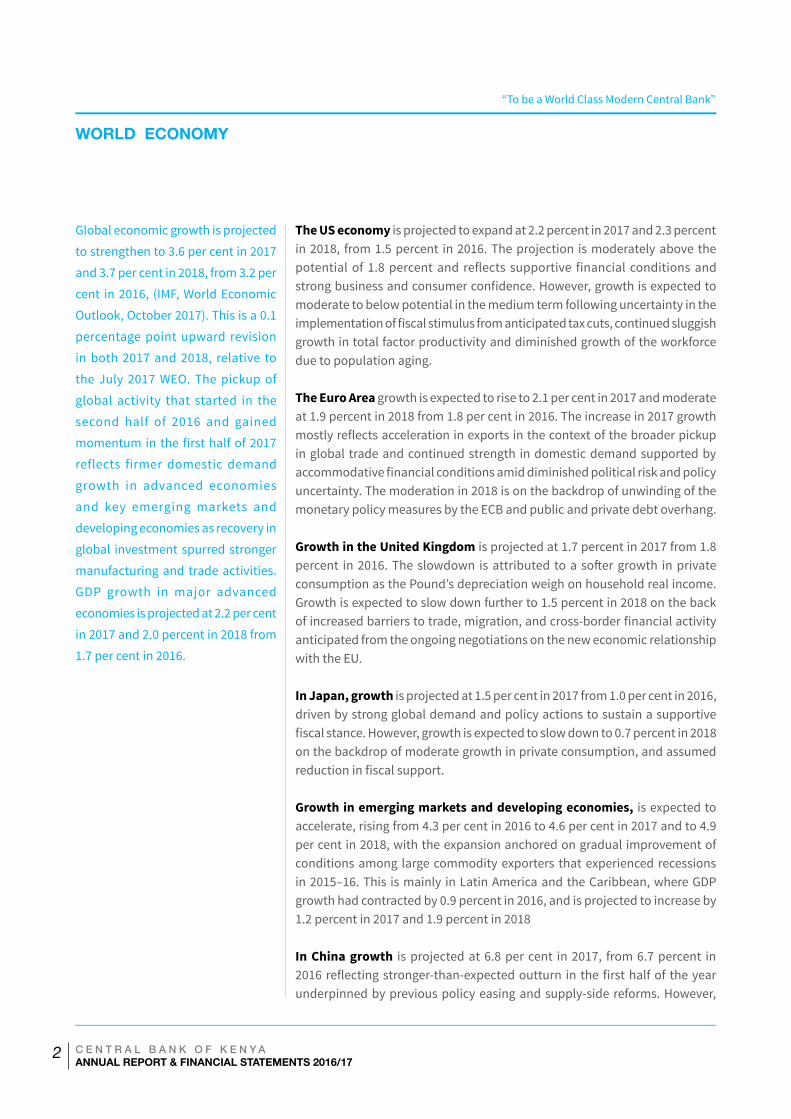
Global economic growth is projected
to strengthen to 3.6 per cent in 2017
and 3.7 per cent in 2018, from 3.2 per
cent in 2016, (IMF, World Economic
Outlook, October 2017). This is a 0.1
percentage point upward revision
in both 2017 and 2018, relative to
the July 2017 WEO. The pickup of
global activity that started in the
second half of 2016 and gained
momentum in the first half of 2017
reflects firmer domestic demand
growth in advanced economies
and key emerging markets and
developing economies as recovery in
global investment spurred stronger
manufacturing and trade activities.
GDP growth in major advanced
economies is projected at 2.2 per cent
in 2017 and 2.0 percent in 2018 from
1.7 per cent in 2016.
The US economy is projected to expand at 2.2 percent in 2017 and 2.3 percent in 2018, from 1.5 percent in 2016. The projection is moderately above the potential of 1.8 percent and reflects supportive financial conditions and strong business and consumer confidence. However, growth is expected to moderate to below potential in the medium term following uncertainty in the implementation of fiscal stimulus from anticipated tax cuts, continued sluggish growth in total factor productivity and diminished growth of the workforce due to population aging.
The Euro Area growth is expected to rise to 2.1 per cent in 2017 and moderate at 1.9 percent in 2018 from 1.8 per cent in 2016. The increase in 2017 growth mostly reflects acceleration in exports in the context of the broader pickup in global trade and continued strength in domestic demand supported by accommodative financial conditions amid diminished political risk and policy uncertainty. The moderation in 2018 is on the backdrop of unwinding of the monetary policy measures by the ECB and public and private debt overhang.
Growth in the United Kingdom is projected at 1.7 percent in 2017 from 1.8 percent in 2016. The slowdown is attributed to a softer growth in private consumption as the Pound’s depreciation weigh on household real income. Growth is expected to slow down further to 1.5 percent in 2018 on the back of increased barriers to trade, migration, and cross-border financial activity anticipated from the ongoing negotiations on the new economic relationship with the EU.
In Japan, growth is projected at 1.5 per cent in 2017 from 1.0 per cent in 2016, driven by strong global demand and policy actions to sustain a supportive fiscal stance. However, growth is expected to slow down to 0.7 percent in 2018 on the backdrop of moderate growth in private consumption, and assumed reduction in fiscal support.
Growth in emerging markets and developing economies, is expected to accelerate, rising from 4.3 per cent in 2016 to 4.6 per cent in 2017 and to 4.9 per cent in 2018, with the expansion anchored on gradual improvement of conditions among large commodity exporters that experienced recessions in 2015–16. This is mainly in Latin America and the Caribbean, where GDP growth had contracted by 0.9 percent in 2016, and is projected to increase by 1.2 percent in 2017 and 1.9 percent in 2018
In China growth is projected at 6.8 per cent in 2017, from 6.7 percent in 2016 reflecting stronger-than-expected outturn in the first half of the year underpinned by previous policy easing and supply-side reforms. However,
“To be a World Class Modern Central Bank”
C E N T R A L B A N K O F K E N Y AANNUAL REPORT & FINANCIAL STATEMENTS 2016/17
3
WORLD ECONOMY
growth is expected to moderate to 6.5 per cent in 2018 as supportive policies including strong credit growth and reliance on public investment to achieve growth targets are withdrawn.
In India growth is expected to increase from 7.1 per cent in 2016 to 6.7 per cent in 2017 reflecting persistent disruptions associated with the currency exchange initiative introduced in November 2016. However, growth is expected to pick up to 7.4 per cent in 2018 boosted by implementation of numerous structural reforms.
Growth in Sub-Saharan Africa (SSA) is expected to rise from 1.4 percent in 2016 to 2.6 per cent in 2017 and 3.5 per cent in 2018, with sizeable differences across countries. Nigeria is projected to grow by 0.8 per cent in 2017 and 1.9 percent in 2018 from a contraction of 1.6 per cent in 2016 anchored on recovery in oil production, continued growth in agriculture, and higher public investment. In South Africa, modest recovery is expected, with growth forecast at 0.7 per cent in 2017 from 0.3 per cent in 2016 after experiencing bumper harvest due to better rainfall and an increase in mining output prompted by a moderate rebound in commodity prices.
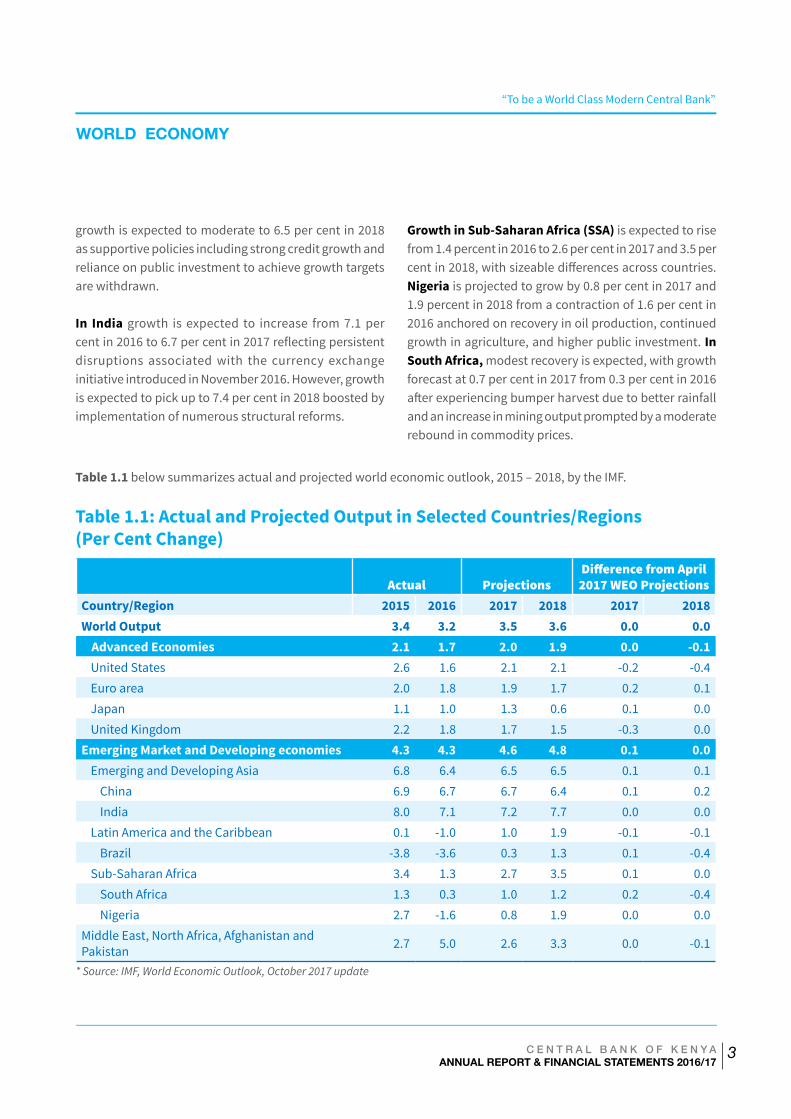
Table 1.1 below summarizes actual and projected world economic outlook, 2015 – 2018, by the IMF.
Table 1.1: Actual and Projected Output in Selected Countries/Regions (Per Cent Change)
Actual ProjectionsDifference from April 2017 WEO Projections
Country/Region 2015 2016 2017 2018 2017 2018World Output 3.4 3.2 3.5 3.6 0.0 0.0
Advanced Economies 2.1 1.7 2.0 1.9 0.0 -0.1United States 2.6 1.6 2.1 2.1 -0.2 -0.4Euro area 2.0 1.8 1.9 1.7 0.2 0.1Japan 1.1 1.0 1.3 0.6 0.1 0.0United Kingdom 2.2 1.8 1.7 1.5 -0.3 0.0
Emerging Market and Developing economies 4.3 4.3 4.6 4.8 0.1 0.0Emerging and Developing Asia 6.8 6.4 6.5 6.5 0.1 0.1
China 6.9 6.7 6.7 6.4 0.1 0.2India 8.0 7.1 7.2 7.7 0.0 0.0
Latin America and the Caribbean 0.1 -1.0 1.0 1.9 -0.1 -0.1Brazil -3.8 -3.6 0.3 1.3 0.1 -0.4
Sub-Saharan Africa 3.4 1.3 2.7 3.5 0.1 0.0South Africa 1.3 0.3 1.0 1.2 0.2 -0.4Nigeria 2.7 -1.6 0.8 1.9 0.0 0.0
Middle East, North Africa, Afghanistan and Pakistan 2.7 5.0 2.6 3.3 0.0 -0.1
* Source: IMF, World Economic Outlook, October 2017 update
“To be a World Class Modern Central Bank”
C E N T R A L B A N K O F K E N Y AANNUAL REPORT & FINANCIAL STATEMENTS 2016/17
4
WORLD ECONOMY
Risks to the global growth outlook are broadly balanced. On the upside, momentum could prove to be more durable than expected amid strong consumer and business confidence, in especially the Euro Area and in East Asia. On the downside: -
• Prolonged period of policy uncertainty, would make it difficult to predict certain outcomes (for example U.S regulatory and fiscal policies; negotiations of post-Brexit arrangements, and rising geopolitical risks), and this could impact negatively on confidence, deter private investment and weaken growth.
• Perceived likelihood of more inward-looking policies could trigger a correction in asset valuations and higher financial market volatility, which will affect spending and confidence, especially in countries with financial vulnerabilities.
• Adverse weather conditions affect key sectors of the economy and the supporting infrastructure (including communication, port activity, and transport) and creates uncertainties for the affected
economies in the near term; the net effect on GDP depends on how quickly economic activity in the affected sector and region recovers.
• Rising geopolitical tensions, domestic political discord, and shocks arising from weak governance and corruption can all weigh on economic activity.
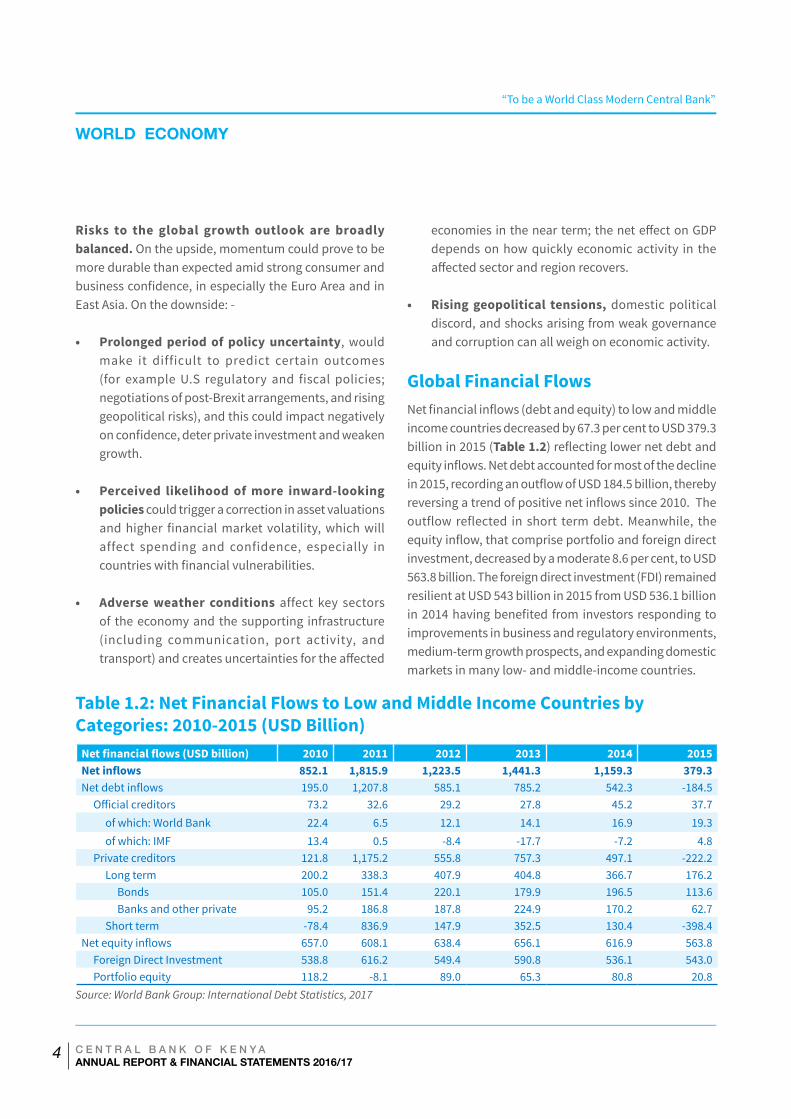
Global Financial FlowsNet financial inflows (debt and equity) to low and middle income countries decreased by 67.3 per cent to USD 379.3 billion in 2015 (Table 1.2) reflecting lower net debt and equity inflows. Net debt accounted for most of the decline in 2015, recording an outflow of USD 184.5 billion, thereby reversing a trend of positive net inflows since 2010. The outflow reflected in short term debt. Meanwhile, the equity inflow, that comprise portfolio and foreign direct investment, decreased by a moderate 8.6 per cent, to USD 563.8 billion. The foreign direct investment (FDI) remained resilient at USD 543 billion in 2015 from USD 536.1 billion in 2014 having benefited from investors responding to improvements in business and regulatory environments, medium-term growth prospects, and expanding domestic markets in many low- and middle-income countries.
Table 1.2: Net Financial Flows to Low and Middle Income Countries by Categories: 2010-2015 (USD Billion)
Net financial flows (USD billion) 2010 2011 2012 2013 2014 2015Net inflows 852.1 1,815.9 1,223.5 1,441.3 1,159.3 379.3Net debt inflows 195.0 1,207.8 585.1 785.2 542.3 -184.5
Official creditors 73.2 32.6 29.2 27.8 45.2 37.7of which: World Bank 22.4 6.5 12.1 14.1 16.9 19.3of which: IMF 13.4 0.5 -8.4 -17.7 -7.2 4.8
Private creditors 121.8 1,175.2 555.8 757.3 497.1 -222.2Long term 200.2 338.3 407.9 404.8 366.7 176.2
Bonds 105.0 151.4 220.1 179.9 196.5 113.6Banks and other private 95.2 186.8 187.8 224.9 170.2 62.7
Short term -78.4 836.9 147.9 352.5 130.4 -398.4Net equity inflows 657.0 608.1 638.4 656.1 616.9 563.8
Foreign Direct Investment 538.8 616.2 549.4 590.8 536.1 543.0Portfolio equity 118.2 -8.1 89.0 65.3 80.8 20.8
Source: World Bank Group: International Debt Statistics, 2017
“To be a World Class Modern Central Bank”
C E N T R A L B A N K O F K E N Y AANNUAL REPORT & FINANCIAL STATEMENTS 2016/17
5
WORLD ECONOMY
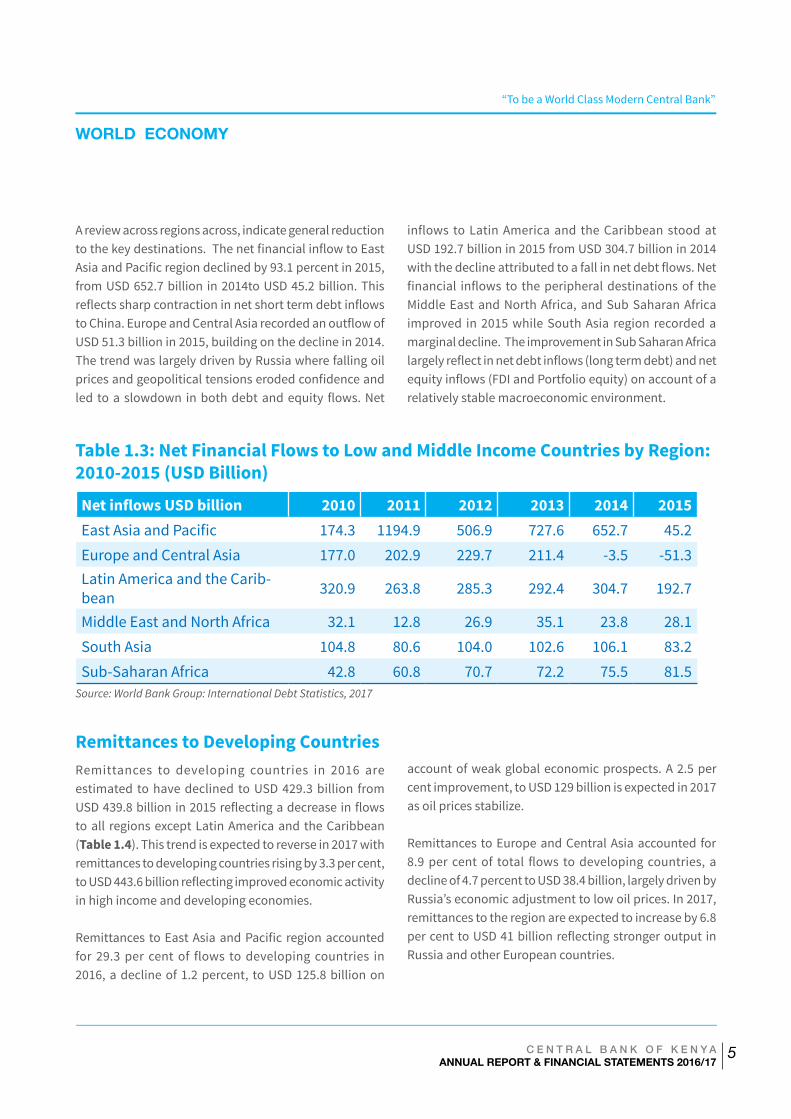
A review across regions across, indicate general reduction to the key destinations. The net financial inflow to East Asia and Pacific region declined by 93.1 percent in 2015, from USD 652.7 billion in 2014to USD 45.2 billion. This reflects sharp contraction in net short term debt inflows to China. Europe and Central Asia recorded an outflow of USD 51.3 billion in 2015, building on the decline in 2014. The trend was largely driven by Russia where falling oil prices and geopolitical tensions eroded confidence and led to a slowdown in both debt and equity flows. Net
inflows to Latin America and the Caribbean stood at USD 192.7 billion in 2015 from USD 304.7 billion in 2014 with the decline attributed to a fall in net debt flows. Net financial inflows to the peripheral destinations of the Middle East and North Africa, and Sub Saharan Africa improved in 2015 while South Asia region recorded a marginal decline. The improvement in Sub Saharan Africa largely reflect in net debt inflows (long term debt) and net equity inflows (FDI and Portfolio equity) on account of a relatively stable macroeconomic environment.
Table 1.3: Net Financial Flows to Low and Middle Income Countries by Region: 2010-2015 (USD Billion)
Net inflows USD billion 2010 2011 2012 2013 2014 2015East Asia and Pacific 174.3 1194.9 506.9 727.6 652.7 45.2Europe and Central Asia 177.0 202.9 229.7 211.4 -3.5 -51.3Latin America and the Carib-bean 320.9 263.8 285.3 292.4 304.7 192.7
Middle East and North Africa 32.1 12.8 26.9 35.1 23.8 28.1South Asia 104.8 80.6 104.0 102.6 106.1 83.2Sub-Saharan Africa 42.8 60.8 70.7 72.2 75.5 81.5
Source: World Bank Group: International Debt Statistics, 2017
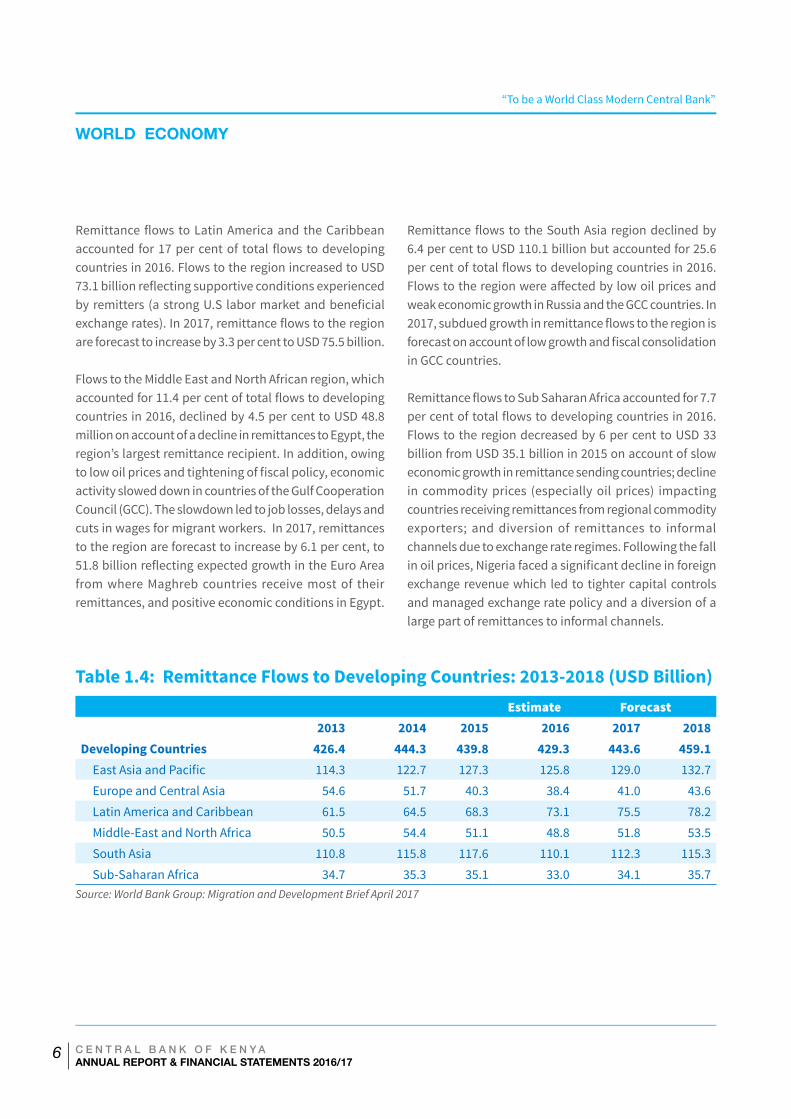
Remittances to Developing CountriesRemittances to developing countries in 2016 are estimated to have declined to USD 429.3 billion from USD 439.8 billion in 2015 reflecting a decrease in flows to all regions except Latin America and the Caribbean (Table 1.4). This trend is expected to reverse in 2017 with remittances to developing countries rising by 3.3 per cent, to USD 443.6 billion reflecting improved economic activity in high income and developing economies.
Remittances to East Asia and Pacific region accounted for 29.3 per cent of flows to developing countries in 2016, a decline of 1.2 percent, to USD 125.8 billion on
account of weak global economic prospects. A 2.5 per cent improvement, to USD 129 billion is expected in 2017 as oil prices stabilize.
Remittances to Europe and Central Asia accounted for 8.9 per cent of total flows to developing countries, a decline of 4.7 percent to USD 38.4 billion, largely driven by Russia’s economic adjustment to low oil prices. In 2017, remittances to the region are expected to increase by 6.8 per cent to USD 41 billion reflecting stronger output in Russia and other European countries.
“To be a World Class Modern Central Bank”
C E N T R A L B A N K O F K E N Y AANNUAL REPORT & FINANCIAL STATEMENTS 2016/17
6
WORLD ECONOMY
Remittance flows to Latin America and the Caribbean accounted for 17 per cent of total flows to developing countries in 2016. Flows to the region increased to USD 73.1 billion reflecting supportive conditions experienced by remitters (a strong U.S labor market and beneficial exchange rates). In 2017, remittance flows to the region are forecast to increase by 3.3 per cent to USD 75.5 billion.
Flows to the Middle East and North African region, which accounted for 11.4 per cent of total flows to developing countries in 2016, declined by 4.5 per cent to USD 48.8 million on account of a decline in remittances to Egypt, the region’s largest remittance recipient. In addition, owing to low oil prices and tightening of fiscal policy, economic activity slowed down in countries of the Gulf Cooperation Council (GCC). The slowdown led to job losses, delays and cuts in wages for migrant workers. In 2017, remittances to the region are forecast to increase by 6.1 per cent, to 51.8 billion reflecting expected growth in the Euro Area from where Maghreb countries receive most of their remittances, and positive economic conditions in Egypt.
Remittance flows to the South Asia region declined by 6.4 per cent to USD 110.1 billion but accounted for 25.6 per cent of total flows to developing countries in 2016. Flows to the region were affected by low oil prices and weak economic growth in Russia and the GCC countries. In 2017, subdued growth in remittance flows to the region is forecast on account of low growth and fiscal consolidation in GCC countries.
Remittance flows to Sub Saharan Africa accounted for 7.7 per cent of total flows to developing countries in 2016. Flows to the region decreased by 6 per cent to USD 33 billion from USD 35.1 billion in 2015 on account of slow economic growth in remittance sending countries; decline in commodity prices (especially oil prices) impacting countries receiving remittances from regional commodity exporters; and diversion of remittances to informal channels due to exchange rate regimes. Following the fall in oil prices, Nigeria faced a significant decline in foreign exchange revenue which led to tighter capital controls and managed exchange rate policy and a diversion of a large part of remittances to informal channels.
Table 1.4: Remittance Flows to Developing Countries: 2013-2018 (USD Billion)
Estimate Forecast 2013 2014 2015 2016 2017 2018Developing Countries 426.4 444.3 439.8 429.3 443.6 459.1
East Asia and Pacific 114.3 122.7 127.3 125.8 129.0 132.7Europe and Central Asia 54.6 51.7 40.3 38.4 41.0 43.6Latin America and Caribbean 61.5 64.5 68.3 73.1 75.5 78.2Middle-East and North Africa 50.5 54.4 51.1 48.8 51.8 53.5South Asia 110.8 115.8 117.6 110.1 112.3 115.3Sub-Saharan Africa 34.7 35.3 35.1 33.0 34.1 35.7
Source: World Bank Group: Migration and Development Brief April 2017
“To be a World Class Modern Central Bank”
C E N T R A L B A N K O F K E N Y AANNUAL REPORT & FINANCIAL STATEMENTS 2016/17
7
2.0 DOMESTICECONOMY
7 C E N T R A L B A N K O F K E N Y AANNUAL REPORT & FINANCIAL STATEMENTS 2016/17
“To be a World Class Modern Central Bank”
C E N T R A L B A N K O F K E N Y AANNUAL REPORT & FINANCIAL STATEMENTS 2016/17
8
DOMESTIC ECONOMY
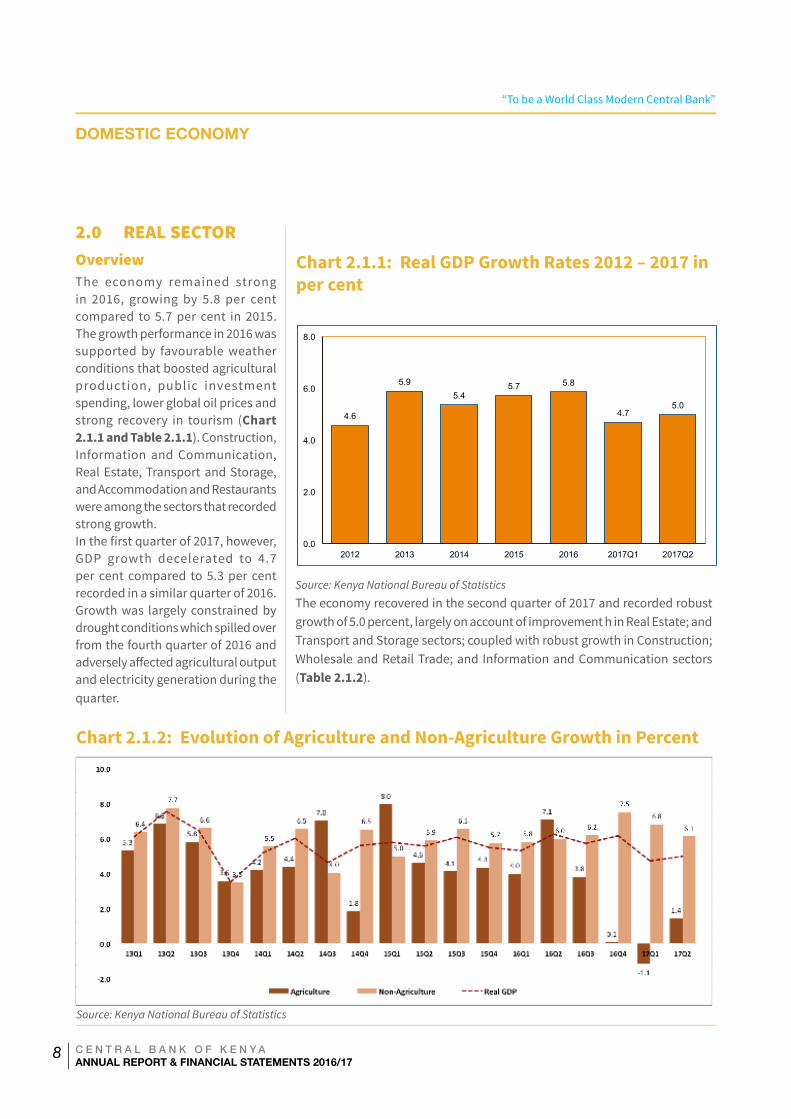
2.0 REAL SECTOROverviewThe economy remained strong in 2016, growing by 5.8 per cent compared to 5.7 per cent in 2015. The growth performance in 2016 was supported by favourable weather conditions that boosted agricultural production, public investment spending, lower global oil prices and strong recovery in tourism (Chart 2.1.1 and Table 2.1.1). Construction, Information and Communication, Real Estate, Transport and Storage, and Accommodation and Restaurants were among the sectors that recorded strong growth. In the first quarter of 2017, however, GDP growth decelerated to 4.7 per cent compared to 5.3 per cent recorded in a similar quarter of 2016. Growth was largely constrained by drought conditions which spilled over from the fourth quarter of 2016 and adversely affected agricultural output and electricity generation during the quarter.
Chart 2.1.1: Real GDP Growth Rates 2012 – 2017 in per cent
4.6
5.9 5.4
5.7 5.8
4.7 5.0
0.0
2.0
4.0
6.0
8.0
2012 2013 2014 2015 2016 2017Q1 2017Q2
Chart 2.1.2: Evolution of Agriculture and Non-Agriculture Growth in Percent
Source: Kenya National Bureau of Statistics
Source: Kenya National Bureau of Statistics
The economy recovered in the second quarter of 2017 and recorded robust growth of 5.0 percent, largely on account of improvement h in Real Estate; and Transport and Storage sectors; coupled with robust growth in Construction; Wholesale and Retail Trade; and Information and Communication sectors (Table 2.1.2).
“To be a World Class Modern Central Bank”
C E N T R A L B A N K O F K E N Y AANNUAL REPORT & FINANCIAL STATEMENTS 2016/17
9
DOMESTIC ECONOMY
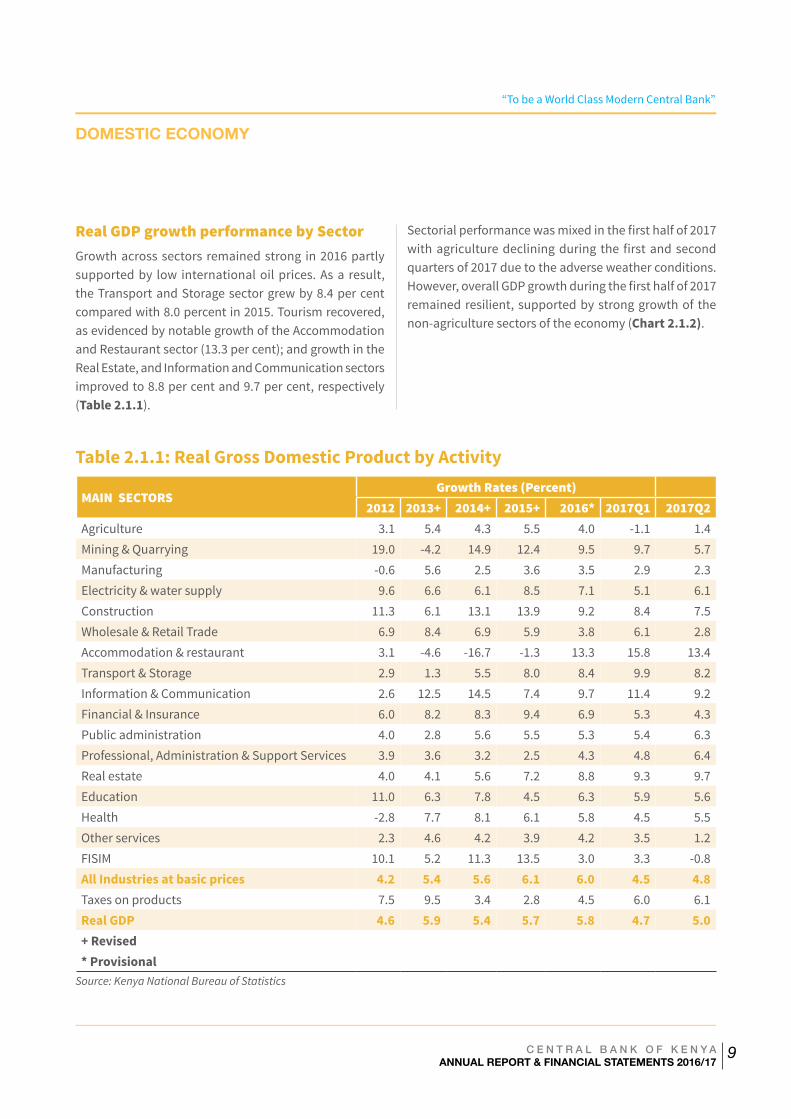
Real GDP growth performance by SectorGrowth across sectors remained strong in 2016 partly supported by low international oil prices. As a result, the Transport and Storage sector grew by 8.4 per cent compared with 8.0 percent in 2015. Tourism recovered, as evidenced by notable growth of the Accommodation and Restaurant sector (13.3 per cent); and growth in the Real Estate, and Information and Communication sectors improved to 8.8 per cent and 9.7 per cent, respectively (Table 2.1.1).
Sectorial performance was mixed in the first half of 2017 with agriculture declining during the first and second quarters of 2017 due to the adverse weather conditions. However, overall GDP growth during the first half of 2017 remained resilient, supported by strong growth of the non-agriculture sectors of the economy (Chart 2.1.2).
Table 2.1.1: Real Gross Domestic Product by Activity
MAIN SECTORSGrowth Rates (Percent)
2012 2013+ 2014+ 2015+ 2016* 2017Q1 2017Q2Agriculture 3.1 5.4 4.3 5.5 4.0 -1.1 1.4Mining & Quarrying 19.0 -4.2 14.9 12.4 9.5 9.7 5.7Manufacturing -0.6 5.6 2.5 3.6 3.5 2.9 2.3Electricity & water supply 9.6 6.6 6.1 8.5 7.1 5.1 6.1Construction 11.3 6.1 13.1 13.9 9.2 8.4 7.5Wholesale & Retail Trade 6.9 8.4 6.9 5.9 3.8 6.1 2.8Accommodation & restaurant 3.1 -4.6 -16.7 -1.3 13.3 15.8 13.4Transport & Storage 2.9 1.3 5.5 8.0 8.4 9.9 8.2Information & Communication 2.6 12.5 14.5 7.4 9.7 11.4 9.2Financial & Insurance 6.0 8.2 8.3 9.4 6.9 5.3 4.3Public administration 4.0 2.8 5.6 5.5 5.3 5.4 6.3Professional, Administration & Support Services 3.9 3.6 3.2 2.5 4.3 4.8 6.4Real estate 4.0 4.1 5.6 7.2 8.8 9.3 9.7Education 11.0 6.3 7.8 4.5 6.3 5.9 5.6Health -2.8 7.7 8.1 6.1 5.8 4.5 5.5Other services 2.3 4.6 4.2 3.9 4.2 3.5 1.2FISIM 10.1 5.2 11.3 13.5 3.0 3.3 -0.8All Industries at basic prices 4.2 5.4 5.6 6.1 6.0 4.5 4.8Taxes on products 7.5 9.5 3.4 2.8 4.5 6.0 6.1Real GDP 4.6 5.9 5.4 5.7 5.8 4.7 5.0+ Revised * Provisional
Source: Kenya National Bureau of Statistics
“To be a World Class Modern Central Bank”
C E N T R A L B A N K O F K E N Y AANNUAL REPORT & FINANCIAL STATEMENTS 2016/17
10
DOMESTIC ECONOMY
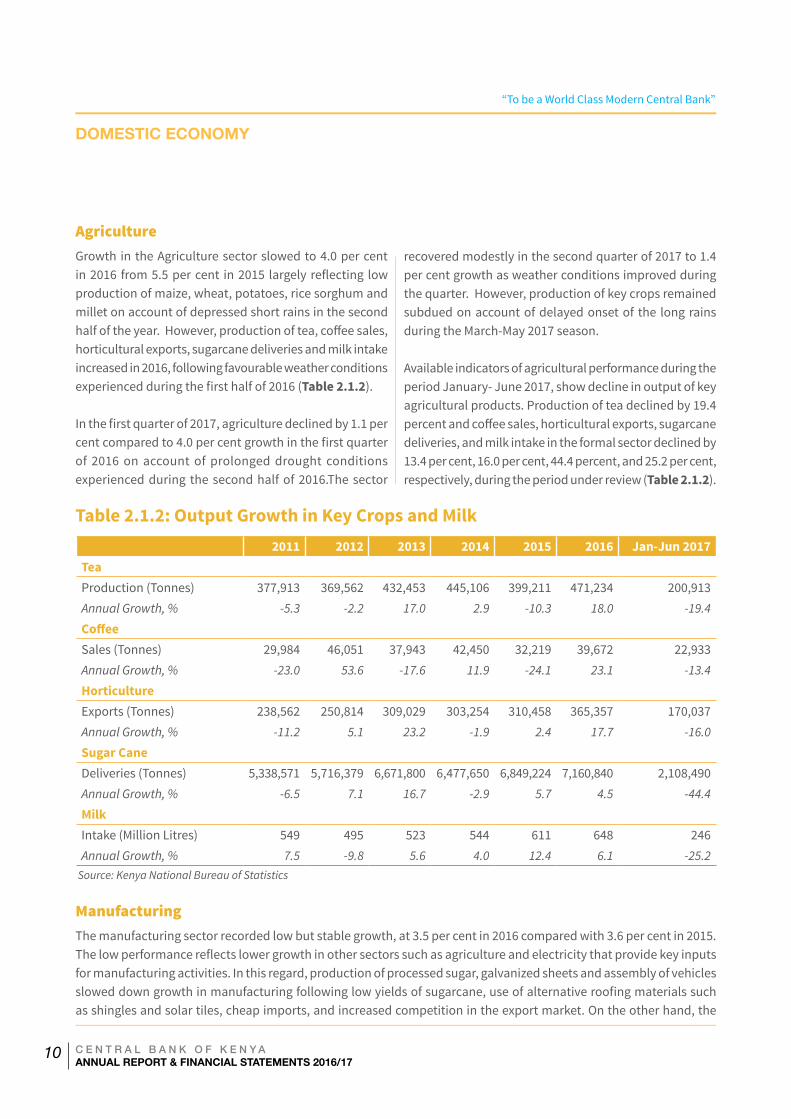
AgricultureGrowth in the Agriculture sector slowed to 4.0 per cent in 2016 from 5.5 per cent in 2015 largely reflecting low production of maize, wheat, potatoes, rice sorghum and millet on account of depressed short rains in the second half of the year. However, production of tea, coffee sales, horticultural exports, sugarcane deliveries and milk intake increased in 2016, following favourable weather conditions experienced during the first half of 2016 (Table 2.1.2).
In the first quarter of 2017, agriculture declined by 1.1 per cent compared to 4.0 per cent growth in the first quarter of 2016 on account of prolonged drought conditions experienced during the second half of 2016.The sector
recovered modestly in the second quarter of 2017 to 1.4 per cent growth as weather conditions improved during the quarter. However, production of key crops remained subdued on account of delayed onset of the long rains during the March-May 2017 season.
Available indicators of agricultural performance during the period January- June 2017, show decline in output of key agricultural products. Production of tea declined by 19.4 percent and coffee sales, horticultural exports, sugarcane deliveries, and milk intake in the formal sector declined by 13.4 per cent, 16.0 per cent, 44.4 percent, and 25.2 per cent, respectively, during the period under review (Table 2.1.2).
Table 2.1.2: Output Growth in Key Crops and Milk 2011 2012 2013 2014 2015 2016 Jan-Jun 2017
Tea Production (Tonnes) 377,913 369,562 432,453 445,106 399,211 471,234 200,913 Annual Growth, % -5.3 -2.2 17.0 2.9 -10.3 18.0 -19.4
Coffee Sales (Tonnes) 29,984 46,051 37,943 42,450 32,219 39,672 22,933 Annual Growth, % -23.0 53.6 -17.6 11.9 -24.1 23.1 -13.4
Horticulture Exports (Tonnes) 238,562 250,814 309,029 303,254 310,458 365,357 170,037 Annual Growth, % -11.2 5.1 23.2 -1.9 2.4 17.7 -16.0
Sugar Cane Deliveries (Tonnes) 5,338,571 5,716,379 6,671,800 6,477,650 6,849,224 7,160,840 2,108,490 Annual Growth, % -6.5 7.1 16.7 -2.9 5.7 4.5 -44.4
Milk Intake (Million Litres) 549 495 523 544 611 648 246 Annual Growth, % 7.5 -9.8 5.6 4.0 12.4 6.1 -25.2
Source: Kenya National Bureau of Statistics
ManufacturingThe manufacturing sector recorded low but stable growth, at 3.5 per cent in 2016 compared with 3.6 per cent in 2015. The low performance reflects lower growth in other sectors such as agriculture and electricity that provide key inputs for manufacturing activities. In this regard, production of processed sugar, galvanized sheets and assembly of vehicles slowed down growth in manufacturing following low yields of sugarcane, use of alternative roofing materials such as shingles and solar tiles, cheap imports, and increased competition in the export market. On the other hand, the
“To be a World Class Modern Central Bank”
C E N T R A L B A N K O F K E N Y AANNUAL REPORT & FINANCIAL STATEMENTS 2016/17
11
DOMESTIC ECONOMY
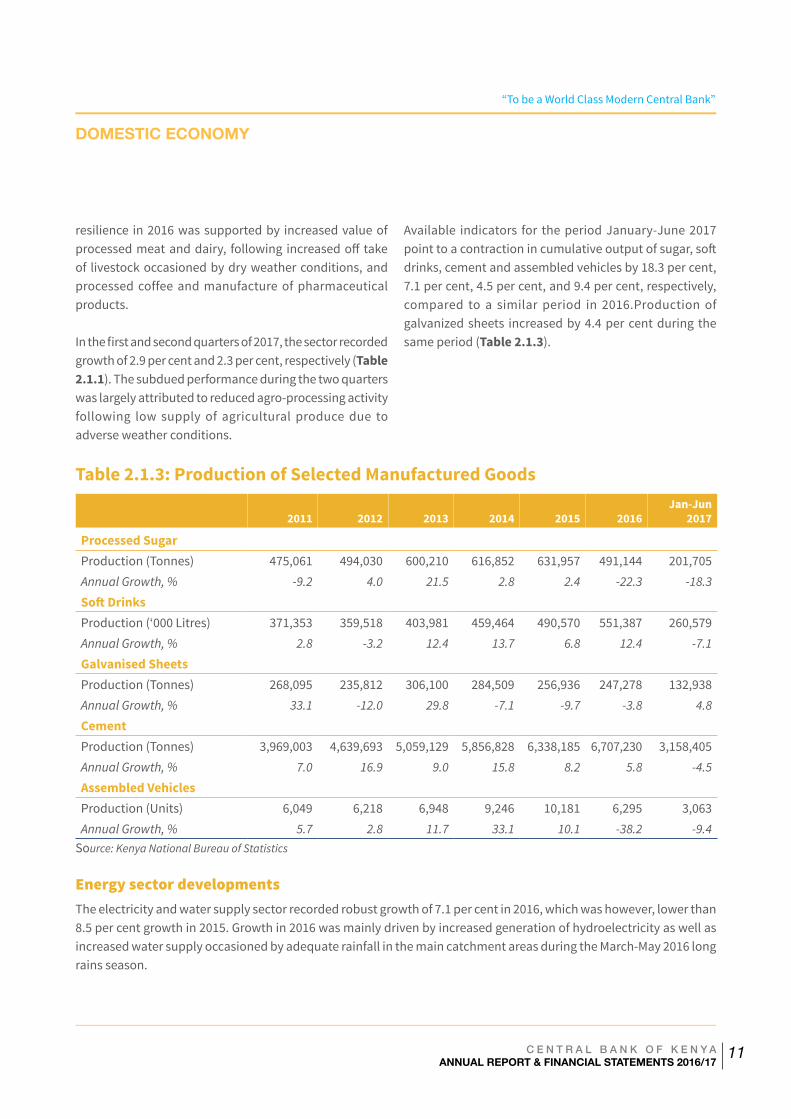
resilience in 2016 was supported by increased value of processed meat and dairy, following increased off take of livestock occasioned by dry weather conditions, and processed coffee and manufacture of pharmaceutical products.
In the first and second quarters of 2017, the sector recorded growth of 2.9 per cent and 2.3 per cent, respectively (Table 2.1.1). The subdued performance during the two quarters was largely attributed to reduced agro-processing activity following low supply of agricultural produce due to adverse weather conditions.
Available indicators for the period January-June 2017 point to a contraction in cumulative output of sugar, soft drinks, cement and assembled vehicles by 18.3 per cent, 7.1 per cent, 4.5 per cent, and 9.4 per cent, respectively, compared to a similar period in 2016.Production of galvanized sheets increased by 4.4 per cent during the same period (Table 2.1.3).
Table 2.1.3: Production of Selected Manufactured Goods
2011 2012 2013 2014 2015 2016Jan-Jun
2017
Processed Sugar Production (Tonnes) 475,061 494,030 600,210 616,852 631,957 491,144 201,705Annual Growth, % -9.2 4.0 21.5 2.8 2.4 -22.3 -18.3
Soft Drinks Production (‘000 Litres) 371,353 359,518 403,981 459,464 490,570 551,387 260,579Annual Growth, % 2.8 -3.2 12.4 13.7 6.8 12.4 -7.1
Galvanised Sheets Production (Tonnes) 268,095 235,812 306,100 284,509 256,936 247,278 132,938Annual Growth, % 33.1 -12.0 29.8 -7.1 -9.7 -3.8 4.8
Cement Production (Tonnes) 3,969,003 4,639,693 5,059,129 5,856,828 6,338,185 6,707,230 3,158,405Annual Growth, % 7.0 16.9 9.0 15.8 8.2 5.8 -4.5
Assembled Vehicles Production (Units) 6,049 6,218 6,948 9,246 10,181 6,295 3,063Annual Growth, % 5.7 2.8 11.7 33.1 10.1 -38.2 -9.4
Source: Kenya National Bureau of Statistics
Energy sector developmentsThe electricity and water supply sector recorded robust growth of 7.1 per cent in 2016, which was however, lower than 8.5 per cent growth in 2015. Growth in 2016 was mainly driven by increased generation of hydroelectricity as well as increased water supply occasioned by adequate rainfall in the main catchment areas during the March-May 2016 long rains season.
“To be a World Class Modern Central Bank”
C E N T R A L B A N K O F K E N Y AANNUAL REPORT & FINANCIAL STATEMENTS 2016/17
12
DOMESTIC ECONOMY
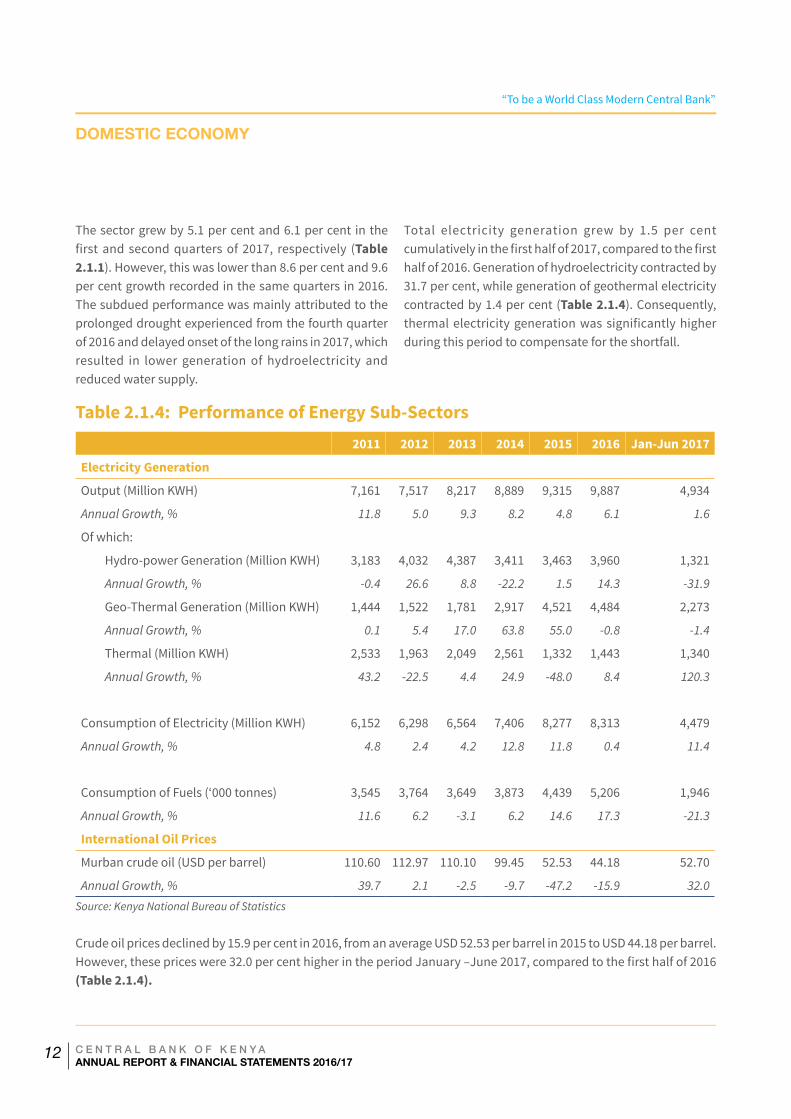
The sector grew by 5.1 per cent and 6.1 per cent in the first and second quarters of 2017, respectively (Table 2.1.1). However, this was lower than 8.6 per cent and 9.6 per cent growth recorded in the same quarters in 2016. The subdued performance was mainly attributed to the prolonged drought experienced from the fourth quarter of 2016 and delayed onset of the long rains in 2017, which resulted in lower generation of hydroelectricity and reduced water supply.
Total electricity generation grew by 1.5 per cent cumulatively in the first half of 2017, compared to the first half of 2016. Generation of hydroelectricity contracted by 31.7 per cent, while generation of geothermal electricity contracted by 1.4 per cent (Table 2.1.4). Consequently, thermal electricity generation was significantly higher during this period to compensate for the shortfall.
Table 2.1.4: Performance of Energy Sub-Sectors 2011 2012 2013 2014 2015 2016 Jan-Jun 2017
Electricity Generation
Output (Million KWH) 7,161 7,517 8,217 8,889 9,315 9,887 4,934
Annual Growth, % 11.8 5.0 9.3 8.2 4.8 6.1 1.6
Of which:
Hydro-power Generation (Million KWH) 3,183 4,032 4,387 3,411 3,463 3,960 1,321
Annual Growth, % -0.4 26.6 8.8 -22.2 1.5 14.3 -31.9
Geo-Thermal Generation (Million KWH) 1,444 1,522 1,781 2,917 4,521 4,484 2,273
Annual Growth, % 0.1 5.4 17.0 63.8 55.0 -0.8 -1.4
Thermal (Million KWH) 2,533 1,963 2,049 2,561 1,332 1,443 1,340
Annual Growth, % 43.2 -22.5 4.4 24.9 -48.0 8.4 120.3
Consumption of Electricity (Million KWH) 6,152 6,298 6,564 7,406 8,277 8,313 4,479
Annual Growth, % 4.8 2.4 4.2 12.8 11.8 0.4 11.4
Consumption of Fuels (‘000 tonnes) 3,545 3,764 3,649 3,873 4,439 5,206 1,946
Annual Growth, % 11.6 6.2 -3.1 6.2 14.6 17.3 -21.3
International Oil Prices
Murban crude oil (USD per barrel) 110.60 112.97 110.10 99.45 52.53 44.18 52.70
Annual Growth, % 39.7 2.1 -2.5 -9.7 -47.2 -15.9 32.0Source: Kenya National Bureau of Statistics
Crude oil prices declined by 15.9 per cent in 2016, from an average USD 52.53 per barrel in 2015 to USD 44.18 per barrel. However, these prices were 32.0 per cent higher in the period January –June 2017, compared to the first half of 2016 (Table 2.1.4).
“To be a World Class Modern Central Bank”
C E N T R A L B A N K O F K E N Y AANNUAL REPORT & FINANCIAL STATEMENTS 2016/17
13
DOMESTIC ECONOMY
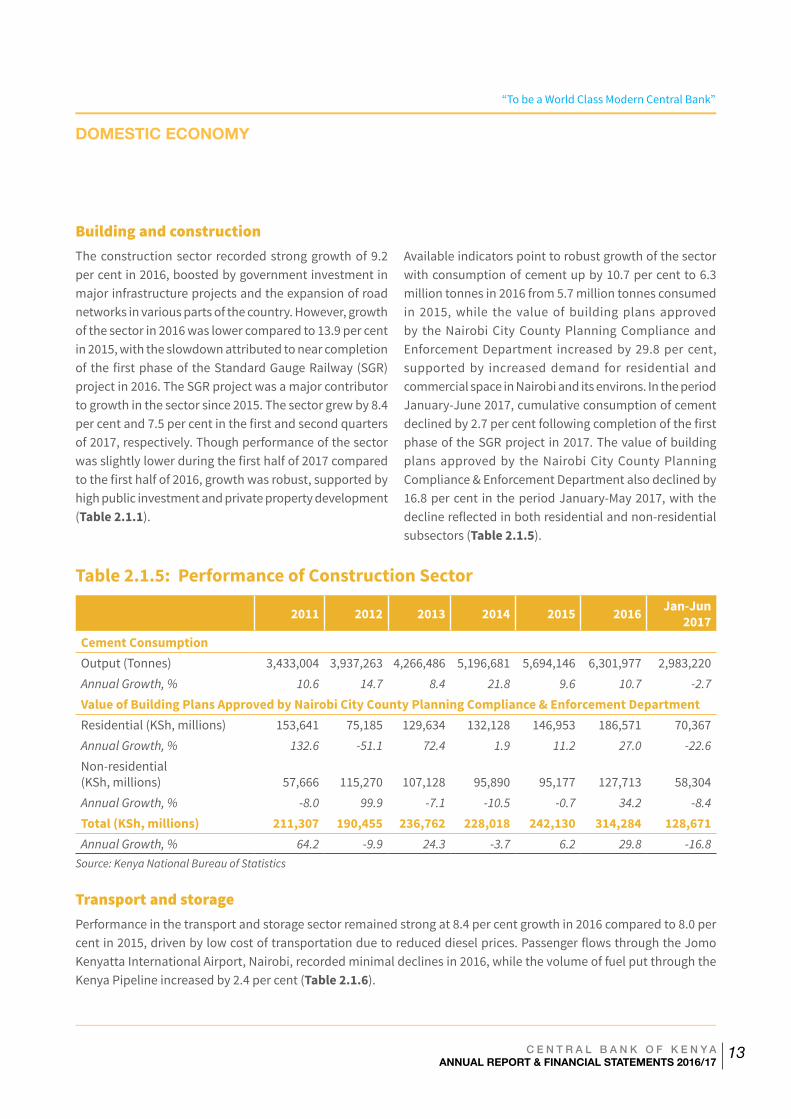
Building and constructionThe construction sector recorded strong growth of 9.2 per cent in 2016, boosted by government investment in major infrastructure projects and the expansion of road networks in various parts of the country. However, growth of the sector in 2016 was lower compared to 13.9 per cent in 2015, with the slowdown attributed to near completion of the first phase of the Standard Gauge Railway (SGR) project in 2016. The SGR project was a major contributor to growth in the sector since 2015. The sector grew by 8.4 per cent and 7.5 per cent in the first and second quarters of 2017, respectively. Though performance of the sector was slightly lower during the first half of 2017 compared to the first half of 2016, growth was robust, supported by high public investment and private property development (Table 2.1.1).
Available indicators point to robust growth of the sector with consumption of cement up by 10.7 per cent to 6.3 million tonnes in 2016 from 5.7 million tonnes consumed in 2015, while the value of building plans approved by the Nairobi City County Planning Compliance and Enforcement Department increased by 29.8 per cent, supported by increased demand for residential and commercial space in Nairobi and its environs. In the period January-June 2017, cumulative consumption of cement declined by 2.7 per cent following completion of the first phase of the SGR project in 2017. The value of building plans approved by the Nairobi City County Planning Compliance & Enforcement Department also declined by 16.8 per cent in the period January-May 2017, with the decline reflected in both residential and non-residential subsectors (Table 2.1.5).
Table 2.1.5: Performance of Construction Sector
2011 2012 2013 2014 2015 2016 Jan-Jun 2017
Cement Consumption Output (Tonnes) 3,433,004 3,937,263 4,266,486 5,196,681 5,694,146 6,301,977 2,983,220 Annual Growth, % 10.6 14.7 8.4 21.8 9.6 10.7 -2.7
Value of Building Plans Approved by Nairobi City County Planning Compliance & Enforcement Department Residential (KSh, millions) 153,641 75,185 129,634 132,128 146,953 186,571 70,367 Annual Growth, % 132.6 -51.1 72.4 1.9 11.2 27.0 -22.6
Non-residential (KSh, millions)
57,666
115,270
107,128
95,890
95,177
127,713
58,304
Annual Growth, % -8.0 99.9 -7.1 -10.5 -0.7 34.2 -8.4
Total (KSh, millions) 211,307 190,455 236,762 228,018 242,130 314,284 128,671 Annual Growth, % 64.2 -9.9 24.3 -3.7 6.2 29.8 -16.8
Source: Kenya National Bureau of Statistics
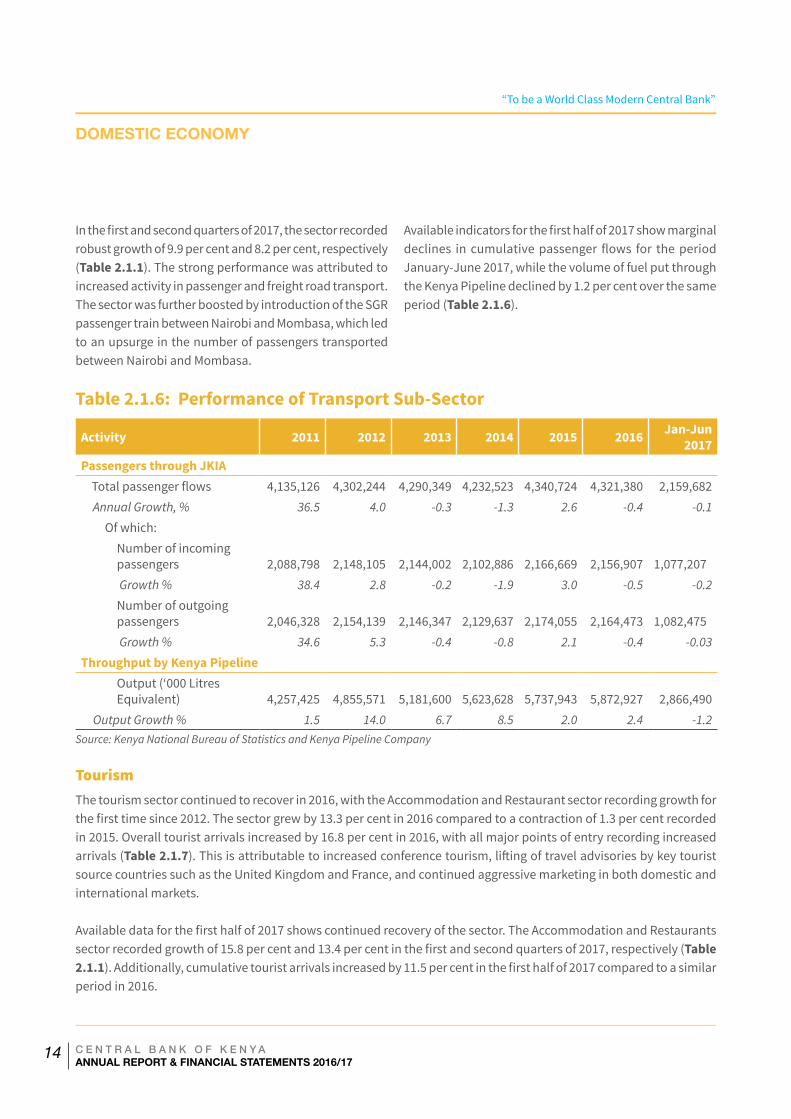
Transport and storagePerformance in the transport and storage sector remained strong at 8.4 per cent growth in 2016 compared to 8.0 per cent in 2015, driven by low cost of transportation due to reduced diesel prices. Passenger flows through the Jomo Kenyatta International Airport, Nairobi, recorded minimal declines in 2016, while the volume of fuel put through the Kenya Pipeline increased by 2.4 per cent (Table 2.1.6).
“To be a World Class Modern Central Bank”
C E N T R A L B A N K O F K E N Y AANNUAL REPORT & FINANCIAL STATEMENTS 2016/17
14
DOMESTIC ECONOMY
In the first and second quarters of 2017, the sector recorded robust growth of 9.9 per cent and 8.2 per cent, respectively (Table 2.1.1). The strong performance was attributed to increased activity in passenger and freight road transport. The sector was further boosted by introduction of the SGR passenger train between Nairobi and Mombasa, which led to an upsurge in the number of passengers transported between Nairobi and Mombasa.
Available indicators for the first half of 2017 show marginal declines in cumulative passenger flows for the period January-June 2017, while the volume of fuel put through the Kenya Pipeline declined by 1.2 per cent over the same period (Table 2.1.6).
Table 2.1.6: Performance of Transport Sub-Sector
Activity 2011 2012 2013 2014 2015 2016 Jan-Jun 2017
Passengers through JKIA Total passenger flows 4,135,126 4,302,244 4,290,349 4,232,523 4,340,724 4,321,380 2,159,682
Annual Growth, % 36.5 4.0 -0.3 -1.3 2.6 -0.4 -0.1
Of which: Number of incoming passengers
2,088,798
2,148,105
2,144,002
2,102,886
2,166,669
2,156,907
1,077,207
Growth % 38.4 2.8 -0.2 -1.9 3.0 -0.5 -0.2
Number of outgoing passengers
2,046,328
2,154,139
2,146,347
2,129,637
2,174,055
2,164,473
1,082,475
Growth % 34.6 5.3 -0.4 -0.8 2.1 -0.4 -0.03
Throughput by Kenya Pipeline Output (‘000 Litres Equivalent)
4,257,425
4,855,571
5,181,600
5,623,628
5,737,943
5,872,927
2,866,490
Output Growth % 1.5 14.0 6.7 8.5 2.0 2.4 -1.2Source: Kenya National Bureau of Statistics and Kenya Pipeline Company
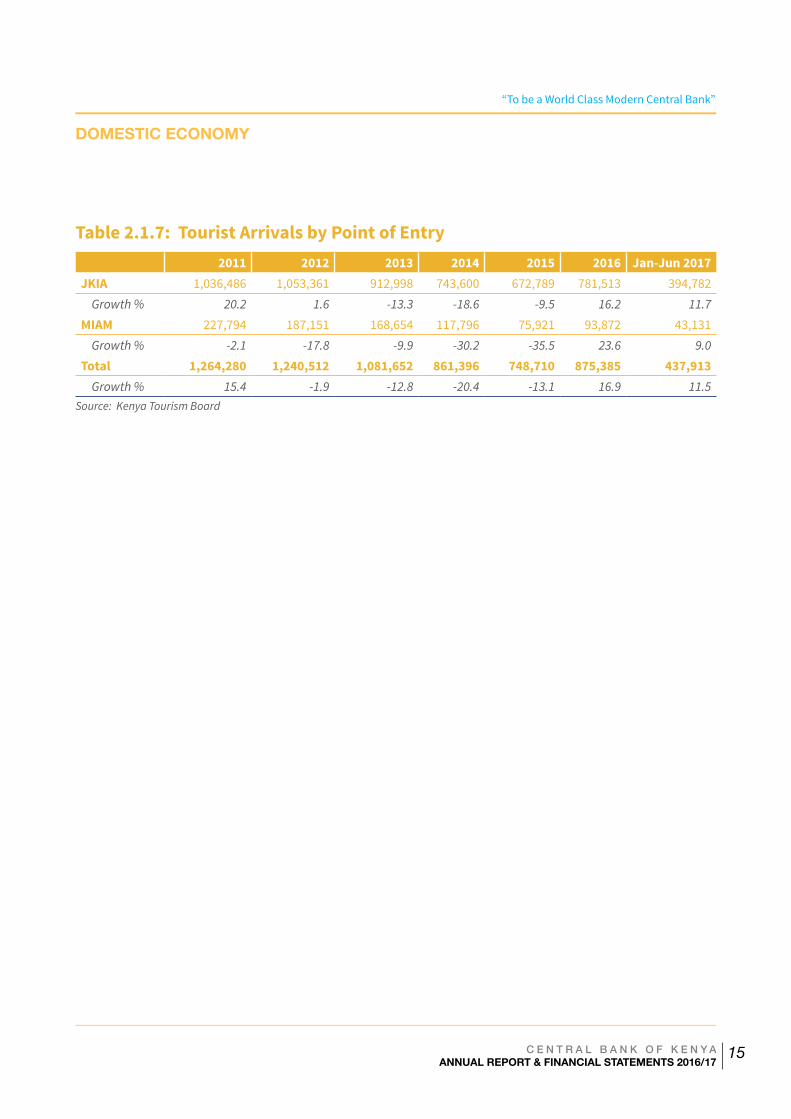
TourismThe tourism sector continued to recover in 2016, with the Accommodation and Restaurant sector recording growth for the first time since 2012. The sector grew by 13.3 per cent in 2016 compared to a contraction of 1.3 per cent recorded in 2015. Overall tourist arrivals increased by 16.8 per cent in 2016, with all major points of entry recording increased arrivals (Table 2.1.7). This is attributable to increased conference tourism, lifting of travel advisories by key tourist source countries such as the United Kingdom and France, and continued aggressive marketing in both domestic and international markets.
Available data for the first half of 2017 shows continued recovery of the sector. The Accommodation and Restaurants sector recorded growth of 15.8 per cent and 13.4 per cent in the first and second quarters of 2017, respectively (Table 2.1.1). Additionally, cumulative tourist arrivals increased by 11.5 per cent in the first half of 2017 compared to a similar period in 2016.
“To be a World Class Modern Central Bank”
C E N T R A L B A N K O F K E N Y AANNUAL REPORT & FINANCIAL STATEMENTS 2016/17
15
Table 2.1.7: Tourist Arrivals by Point of Entry 2011 2012 2013 2014 2015 2016 Jan-Jun 2017JKIA 1,036,486 1,053,361 912,998 743,600 672,789 781,513 394,782
Growth % 20.2 1.6 -13.3 -18.6 -9.5 16.2 11.7
MIAM 227,794 187,151 168,654 117,796 75,921 93,872 43,131 Growth % -2.1 -17.8 -9.9 -30.2 -35.5 23.6 9.0
Total 1,264,280 1,240,512 1,081,652 861,396 748,710 875,385 437,913 Growth % 15.4 -1.9 -12.8 -20.4 -13.1 16.9 11.5
Source: Kenya Tourism Board
DOMESTIC ECONOMY
“To be a World Class Modern Central Bank”
C E N T R A L B A N K O F K E N Y AANNUAL REPORT & FINANCIAL STATEMENTS 2016/17
16
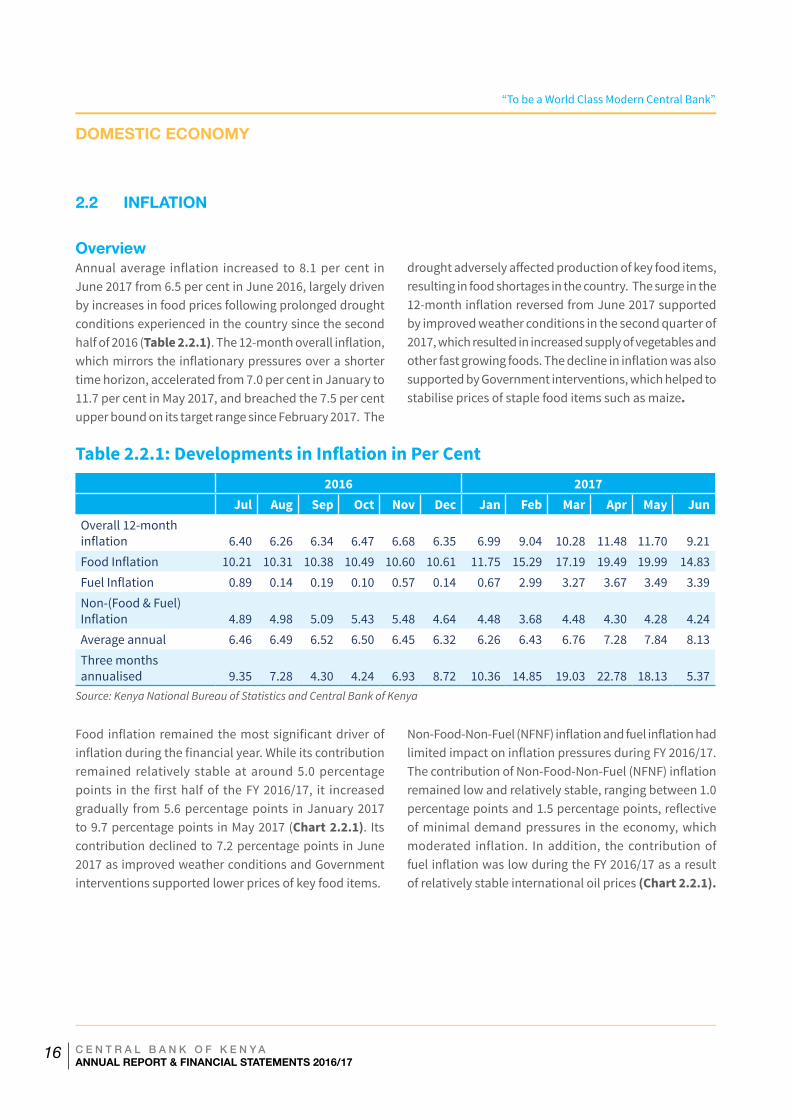
OverviewAnnual average inflation increased to 8.1 per cent in June 2017 from 6.5 per cent in June 2016, largely driven by increases in food prices following prolonged drought conditions experienced in the country since the second half of 2016 (Table 2.2.1). The 12-month overall inflation, which mirrors the inflationary pressures over a shorter time horizon, accelerated from 7.0 per cent in January to 11.7 per cent in May 2017, and breached the 7.5 per cent upper bound on its target range since February 2017. The
drought adversely affected production of key food items, resulting in food shortages in the country. The surge in the 12-month inflation reversed from June 2017 supported by improved weather conditions in the second quarter of 2017, which resulted in increased supply of vegetables and other fast growing foods. The decline in inflation was also supported by Government interventions, which helped to stabilise prices of staple food items such as maize.
Table 2.2.1: Developments in Inflation in Per Cent
2016 2017 Jul Aug Sep Oct Nov Dec Jan Feb Mar Apr May Jun
Overall 12-month inflation 6.40 6.26 6.34 6.47 6.68 6.35 6.99 9.04 10.28 11.48 11.70 9.21Food Inflation 10.21 10.31 10.38 10.49 10.60 10.61 11.75 15.29 17.19 19.49 19.99 14.83Fuel Inflation 0.89 0.14 0.19 0.10 0.57 0.14 0.67 2.99 3.27 3.67 3.49 3.39Non-(Food & Fuel) Inflation 4.89 4.98 5.09 5.43 5.48 4.64 4.48 3.68 4.48 4.30 4.28 4.24Average annual 6.46 6.49 6.52 6.50 6.45 6.32 6.26 6.43 6.76 7.28 7.84 8.13Three months annualised 9.35 7.28 4.30 4.24 6.93 8.72 10.36 14.85 19.03 22.78 18.13 5.37
Source: Kenya National Bureau of Statistics and Central Bank of Kenya
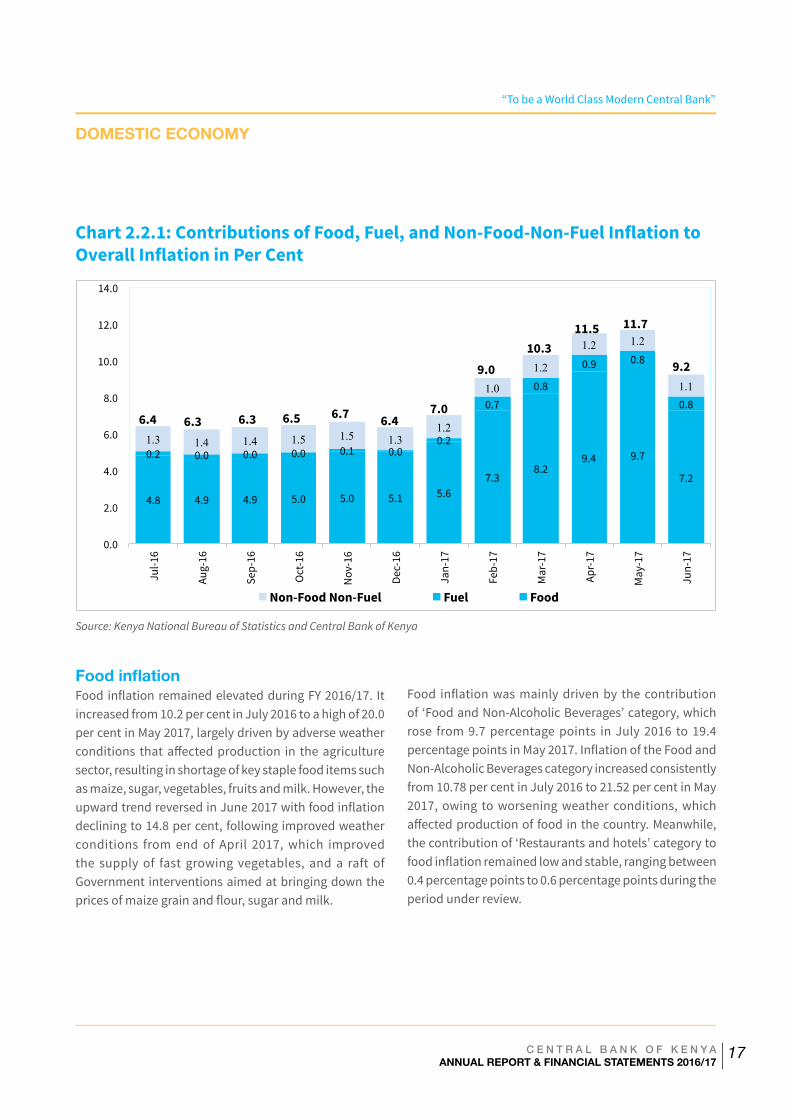
Food inflation remained the most significant driver of inflation during the financial year. While its contribution remained relatively stable at around 5.0 percentage points in the first half of the FY 2016/17, it increased gradually from 5.6 percentage points in January 2017 to 9.7 percentage points in May 2017 (Chart 2.2.1). Its contribution declined to 7.2 percentage points in June 2017 as improved weather conditions and Government interventions supported lower prices of key food items.
Non-Food-Non-Fuel (NFNF) inflation and fuel inflation had limited impact on inflation pressures during FY 2016/17. The contribution of Non-Food-Non-Fuel (NFNF) inflation remained low and relatively stable, ranging between 1.0 percentage points and 1.5 percentage points, reflective of minimal demand pressures in the economy, which moderated inflation. In addition, the contribution of fuel inflation was low during the FY 2016/17 as a result of relatively stable international oil prices (Chart 2.2.1).
DOMESTIC ECONOMY
2.2 INFLATION
“To be a World Class Modern Central Bank”
C E N T R A L B A N K O F K E N Y AANNUAL REPORT & FINANCIAL STATEMENTS 2016/17
17
Chart 2.2.1: Contributions of Food, Fuel, and Non-Food-Non-Fuel Inflation to Overall Inflation in Per Cent
Source: Kenya National Bureau of Statistics and Central Bank of Kenya
4.8 4.9 4.9 5.0 5.0 5.1 5.6 7.3
8.2 9.4 9.7
7.2
0.2 0.0 0.0 0.0 0.1 0.0 0.2
0.7
0.8
0.9 0.8
0.8
1.3 1.4 1.4 1.5 1.5 1.3 1.2
1.0
1.2
1.2 1.2
1.1
0.0
2.0
4.0
6.0
8.0
10.0
12.0
14.0
Jul-16
Aug-16
Sep-16
Oct-16
Nov-16
Dec-16
Jan-17
Feb-17
Mar-17
Apr-17
May-17
Jun-17
Non-Food Non-Fuel Fuel Food
6.4 6.3 6.3 6.5 6.7 6.4 7.0
9.0 10.3
11.5 11.7
9.2
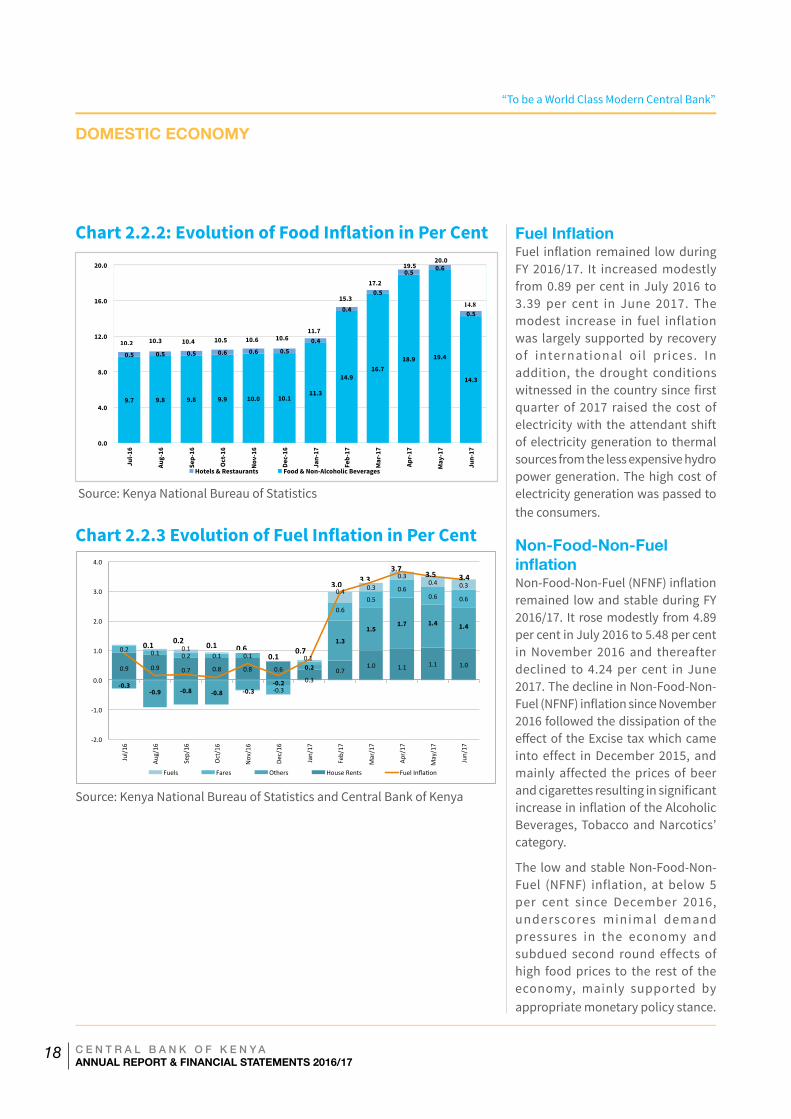
Food inflationFood inflation remained elevated during FY 2016/17. It increased from 10.2 per cent in July 2016 to a high of 20.0 per cent in May 2017, largely driven by adverse weather conditions that affected production in the agriculture sector, resulting in shortage of key staple food items such as maize, sugar, vegetables, fruits and milk. However, the upward trend reversed in June 2017 with food inflation declining to 14.8 per cent, following improved weather conditions from end of April 2017, which improved the supply of fast growing vegetables, and a raft of Government interventions aimed at bringing down the prices of maize grain and flour, sugar and milk.
Food inflation was mainly driven by the contribution of ‘Food and Non-Alcoholic Beverages’ category, which rose from 9.7 percentage points in July 2016 to 19.4 percentage points in May 2017. Inflation of the Food and Non-Alcoholic Beverages category increased consistently from 10.78 per cent in July 2016 to 21.52 per cent in May 2017, owing to worsening weather conditions, which affected production of food in the country. Meanwhile, the contribution of ‘Restaurants and hotels’ category to food inflation remained low and stable, ranging between 0.4 percentage points to 0.6 percentage points during the period under review.
DOMESTIC ECONOMY
“To be a World Class Modern Central Bank”
C E N T R A L B A N K O F K E N Y AANNUAL REPORT & FINANCIAL STATEMENTS 2016/17
18
Chart 2.2.2: Evolution of Food Inflation in Per Cent
9.7 9.8 9.8 9.9 10.0 10.1 11.3
14.9 16.7
18.9 19.4
14.3
0.5 0.5 0.5 0.6 0.6 0.5 0.4
0.4
0.5
0.5 0.6
0.5
0.0
4.0
8.0
12.0
16.0
20.0
Jul-1
6
Aug-
16
Sep-
16
Oct
-16
Nov-
16
Dec-
16
Jan-
17
Feb-
17
Mar
-17
Apr-
17
May
-17
Jun-
17
Hotels & Restaurants Food & Non-Alcoholic Beverages
10.2 10.3 10.4 10.5 10.6 10.6 11.7
15.3
17.2
19.5 20.0
14.8
Source: Kenya National Bureau of Statistics
Fuel InflationFuel inflation remained low during FY 2016/17. It increased modestly from 0.89 per cent in July 2016 to 3.39 per cent in June 2017. The modest increase in fuel inflation was largely supported by recovery of international oi l prices. In addition, the drought conditions witnessed in the country since first quarter of 2017 raised the cost of electricity with the attendant shift of electricity generation to thermal sources from the less expensive hydro power generation. The high cost of electricity generation was passed to the consumers.
Chart 2.2.3 Evolution of Fuel Inflation in Per Cent
0.9 0.9 0.7 0.8 0.8 0.6 0.3
0.7 1.0 1.1 1.1 1.0
-0.3 -0.9 -0.8 -0.8 -0.3
-0.2
0.2
1.3
1.5 1.7 1.4 1.4
0.2 0.1 0.2 0.1 0.1
-‐0.3
0.1
0.6 0.5
0.6 0.6 0.6
0.1
0.4 0.3
0.3 0.4 0.3
-‐2.0
-‐1.0
0.0
1.0
2.0
3.0
4.0
Jul/1
6
Aug/
16
Sep/
16
Oct
/16
Nov
/16
Dec/
16
Jan/
17
Feb/
17
Mar
/17
Apr/
17
May
/17
Jun/
17
Fuels Fares Others House Rents Fuel InflaKon
0.1 0.2 0.1 0.6 0.1
0.7
3.0 3.3
3.7 3.5 3.4
Source: Kenya National Bureau of Statistics and Central Bank of Kenya
Non-Food-Non-Fuel inflationNon-Food-Non-Fuel (NFNF) inflation remained low and stable during FY 2016/17. It rose modestly from 4.89 per cent in July 2016 to 5.48 per cent in November 2016 and thereafter declined to 4.24 per cent in June 2017. The decline in Non-Food-Non-Fuel (NFNF) inflation since November 2016 followed the dissipation of the effect of the Excise tax which came into effect in December 2015, and mainly affected the prices of beer and cigarettes resulting in significant increase in inflation of the Alcoholic Beverages, Tobacco and Narcotics’ category.
The low and stable Non-Food-Non-Fuel (NFNF) inflation, at below 5 per cent since December 2016, underscores minimal demand pressures in the economy and subdued second round effects of high food prices to the rest of the economy, mainly supported by appropriate monetary policy stance.
DOMESTIC ECONOMY
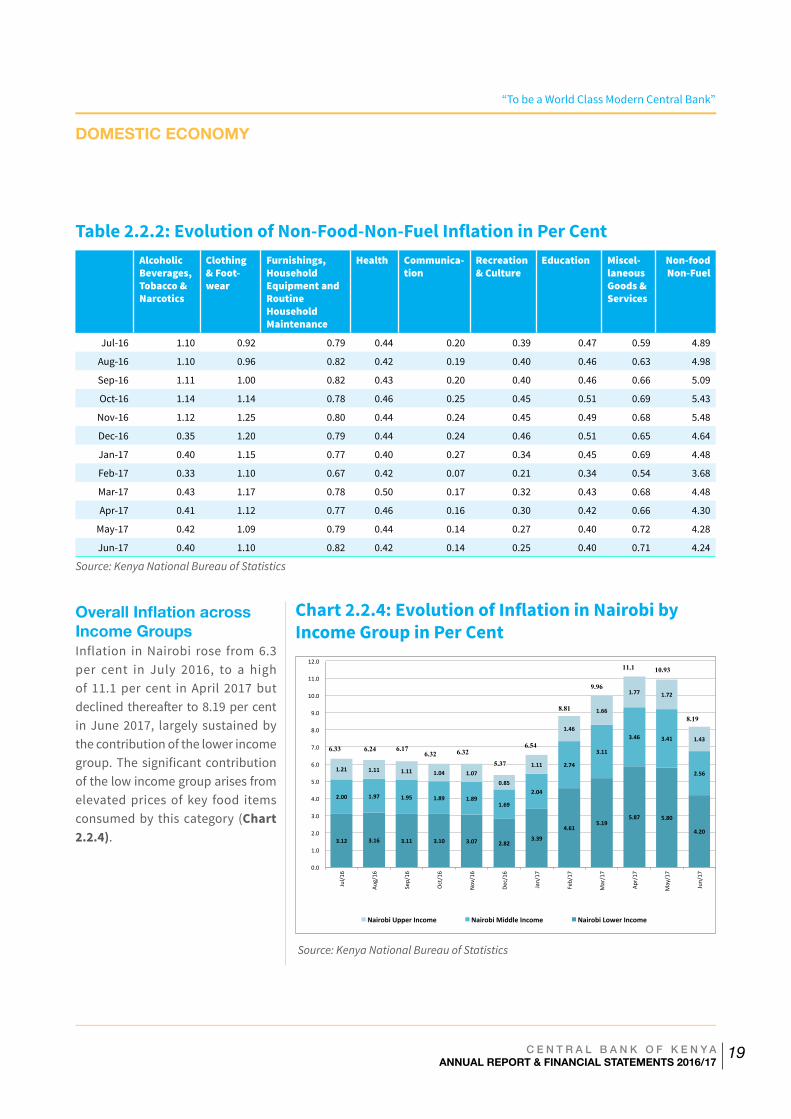
“To be a World Class Modern Central Bank”
C E N T R A L B A N K O F K E N Y AANNUAL REPORT & FINANCIAL STATEMENTS 2016/17
19
Table 2.2.2: Evolution of Non-Food-Non-Fuel Inflation in Per Cent
Alcoholic Beverages, Tobacco & Narcotics
Clothing & Foot-wear
Furnishings, Household Equipment and Routine Household Maintenance
Health Communica-tion
Recreation & Culture
Education Miscel-laneous Goods & Services
Non-food Non-Fuel
Jul-16 1.10 0.92 0.79 0.44 0.20 0.39 0.47 0.59 4.89
Aug-16 1.10 0.96 0.82 0.42 0.19 0.40 0.46 0.63 4.98
Sep-16 1.11 1.00 0.82 0.43 0.20 0.40 0.46 0.66 5.09
Oct-16 1.14 1.14 0.78 0.46 0.25 0.45 0.51 0.69 5.43
Nov-16 1.12 1.25 0.80 0.44 0.24 0.45 0.49 0.68 5.48
Dec-16 0.35 1.20 0.79 0.44 0.24 0.46 0.51 0.65 4.64
Jan-17 0.40 1.15 0.77 0.40 0.27 0.34 0.45 0.69 4.48
Feb-17 0.33 1.10 0.67 0.42 0.07 0.21 0.34 0.54 3.68
Mar-17 0.43 1.17 0.78 0.50 0.17 0.32 0.43 0.68 4.48
Apr-17 0.41 1.12 0.77 0.46 0.16 0.30 0.42 0.66 4.30
May-17 0.42 1.09 0.79 0.44 0.14 0.27 0.40 0.72 4.28
Jun-17 0.40 1.10 0.82 0.42 0.14 0.25 0.40 0.71 4.24
Source: Kenya National Bureau of Statistics
Overall Inflation across Income GroupsInflation in Nairobi rose from 6.3 per cent in July 2016, to a high of 11.1 per cent in April 2017 but declined thereafter to 8.19 per cent in June 2017, largely sustained by the contribution of the lower income group. The significant contribution of the low income group arises from elevated prices of key food items consumed by this category (Chart 2.2.4).
Chart 2.2.4: Evolution of Inflation in Nairobi by Income Group in Per Cent
3.12 3.16 3.11 3.10 3.07 2.82 3.39
4.61 5.19
5.87 5.80
4.20
2.00 1.97 1.95 1.89 1.89 1.69
2.04
2.74
3.11
3.46 3.41
2.56 1.21 1.11 1.11 1.04 1.07
0.85
1.11
1.46
1.66
1.77 1.72
1.43
0.0
1.0
2.0
3.0
4.0
5.0
6.0
7.0
8.0
9.0
10.0
11.0
12.0
Jul/1
6
Aug/16
Sep/16
Oct/16
Nov/16
Dec/16
Jan/17
Feb/17
Mar/17
Apr/17
May/17
Jun/17
Nairobi Upper Income Nairobi Middle Income Nairobi Lower Income
6.33 6.24 6.17 6.32 6.32
5.37
6.54
8.81
9.96
11.1 10.93
8.19
Source: Kenya National Bureau of Statistics
DOMESTIC ECONOMY
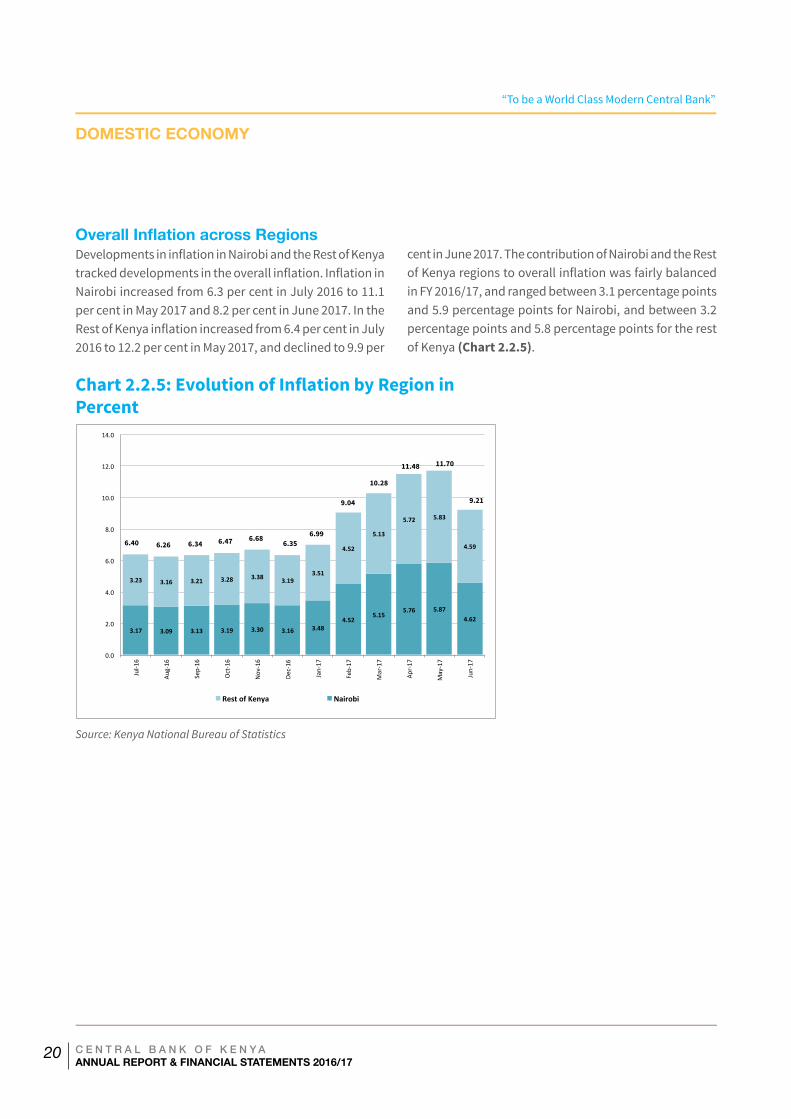
“To be a World Class Modern Central Bank”
C E N T R A L B A N K O F K E N Y AANNUAL REPORT & FINANCIAL STATEMENTS 2016/17
20
Overall Inflation across RegionsDevelopments in inflation in Nairobi and the Rest of Kenya tracked developments in the overall inflation. Inflation in Nairobi increased from 6.3 per cent in July 2016 to 11.1 per cent in May 2017 and 8.2 per cent in June 2017. In the Rest of Kenya inflation increased from 6.4 per cent in July 2016 to 12.2 per cent in May 2017, and declined to 9.9 per
cent in June 2017. The contribution of Nairobi and the Rest of Kenya regions to overall inflation was fairly balanced in FY 2016/17, and ranged between 3.1 percentage points and 5.9 percentage points for Nairobi, and between 3.2 percentage points and 5.8 percentage points for the rest of Kenya (Chart 2.2.5).
Chart 2.2.5: Evolution of Inflation by Region in Percent
3.17 3.09 3.13 3.19 3.30 3.16 3.48 4.52
5.15 5.76 5.87
4.62
3.23 3.16 3.21 3.28 3.38 3.19 3.51
4.52
5.13
5.72 5.83
4.59
0.0
2.0
4.0
6.0
8.0
10.0
12.0
14.0
Jul-‐1
6
Aug-‐16
Sep-‐16
Oct-‐16
Nov-‐16
Dec-‐16
Jan-‐17
Feb-‐17
Mar-‐17
Apr-‐17
May-‐17
Jun-‐17
Rest of Kenya Nairobi
6.40 6.26 6.34 6.47 6.68 6.35
6.99
9.04
10.28
11.48 11.70
9.21
Source: Kenya National Bureau of Statistics
DOMESTIC ECONOMY
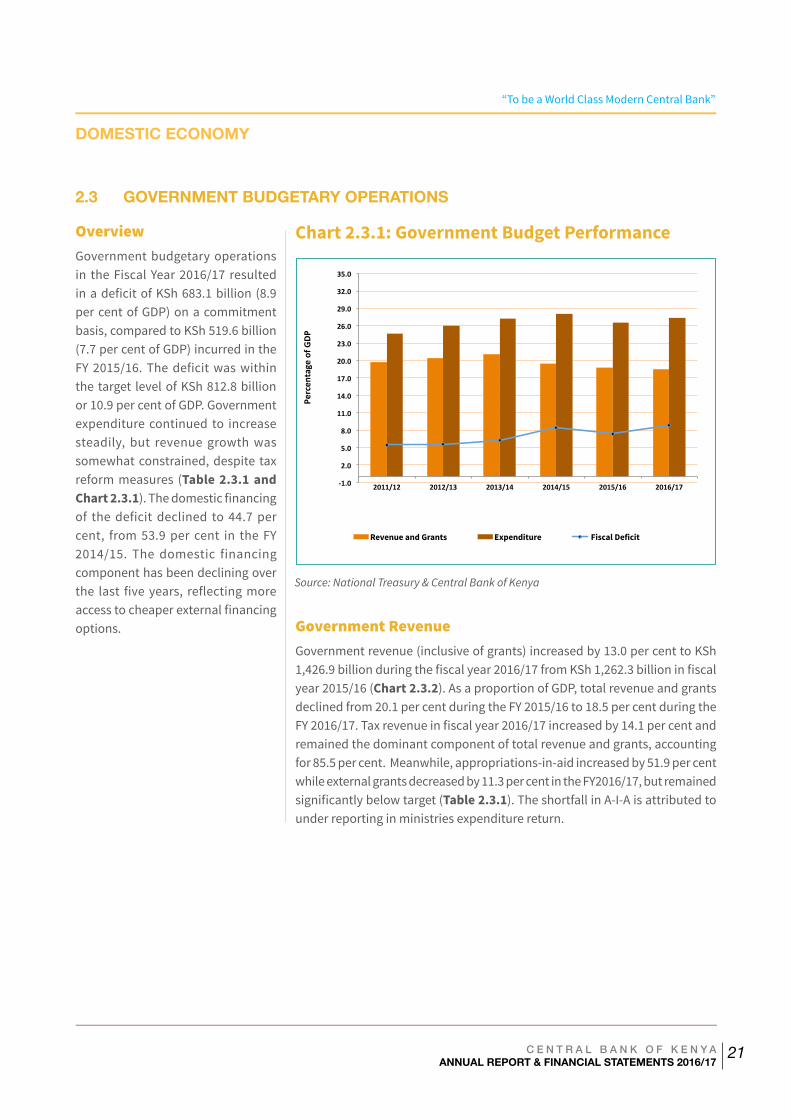
“To be a World Class Modern Central Bank”
C E N T R A L B A N K O F K E N Y AANNUAL REPORT & FINANCIAL STATEMENTS 2016/17
21
2.3 GOVERNMENT BUDGETARY OPERATIONS
OverviewGovernment budgetary operations in the Fiscal Year 2016/17 resulted in a deficit of KSh 683.1 billion (8.9 per cent of GDP) on a commitment basis, compared to KSh 519.6 billion (7.7 per cent of GDP) incurred in the FY 2015/16. The deficit was within the target level of KSh 812.8 billion or 10.9 per cent of GDP. Government expenditure continued to increase steadily, but revenue growth was somewhat constrained, despite tax reform measures (Table 2.3.1 and Chart 2.3.1). The domestic financing of the deficit declined to 44.7 per cent, from 53.9 per cent in the FY 2014/15. The domestic financing component has been declining over the last five years, reflecting more access to cheaper external financing options.
-‐1.0
2.0
5.0
8.0
11.0
14.0
17.0
20.0
23.0
26.0
29.0
32.0
35.0
2011/12 2012/13 2013/14 2014/15 2015/16 2016/17
Percen
tage of G
DP
Revenue and Grants Expenditure Fiscal Deficit
Chart 2.3.1: Government Budget Performance
Source: National Treasury & Central Bank of Kenya
DOMESTIC ECONOMY
Government RevenueGovernment revenue (inclusive of grants) increased by 13.0 per cent to KSh 1,426.9 billion during the fiscal year 2016/17 from KSh 1,262.3 billion in fiscal year 2015/16 (Chart 2.3.2). As a proportion of GDP, total revenue and grants declined from 20.1 per cent during the FY 2015/16 to 18.5 per cent during the FY 2016/17. Tax revenue in fiscal year 2016/17 increased by 14.1 per cent and remained the dominant component of total revenue and grants, accounting for 85.5 per cent. Meanwhile, appropriations-in-aid increased by 51.9 per cent while external grants decreased by 11.3 per cent in the FY2016/17, but remained significantly below target (Table 2.3.1). The shortfall in A-I-A is attributed to under reporting in ministries expenditure return.
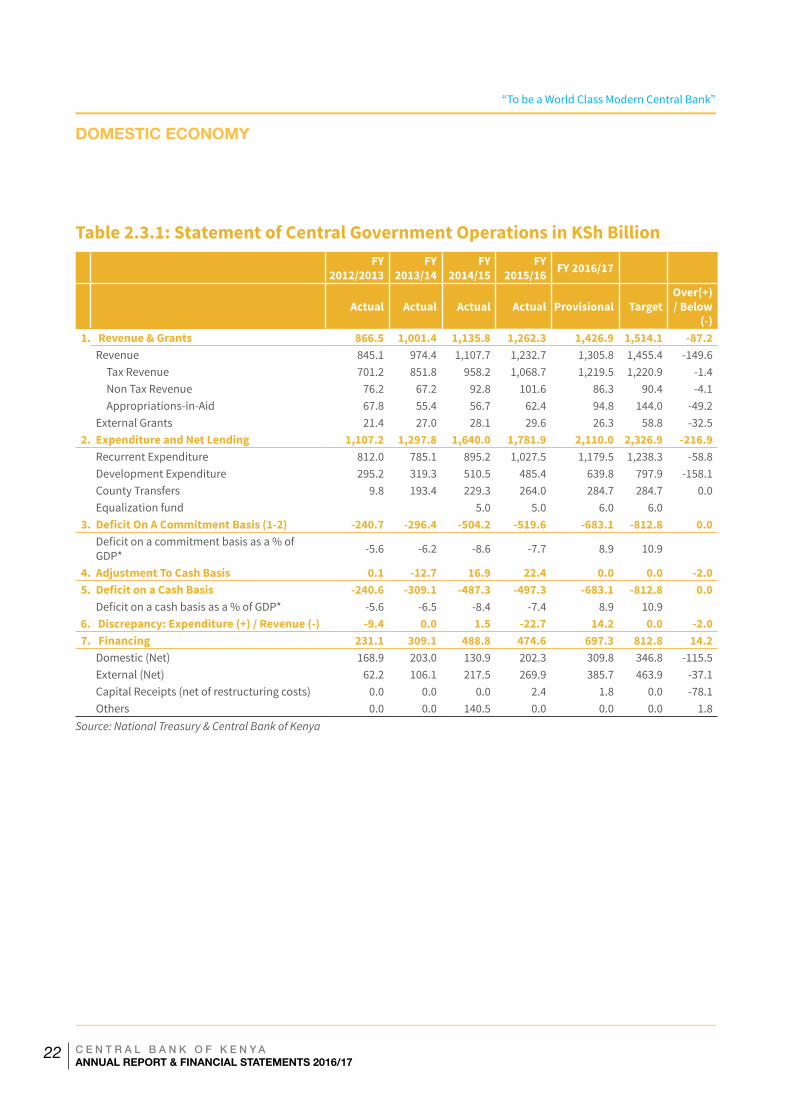
“To be a World Class Modern Central Bank”
C E N T R A L B A N K O F K E N Y AANNUAL REPORT & FINANCIAL STATEMENTS 2016/17
22
Table 2.3.1: Statement of Central Government Operations in KSh Billion
FY 2012/2013
FY 2013/14
FY 2014/15
FY 2015/16 FY 2016/17
Actual Actual Actual Actual Provisional TargetOver(+) / Below
(-)1. Revenue & Grants 866.5 1,001.4 1,135.8 1,262.3 1,426.9 1,514.1 -87.2 Revenue 845.1 974.4 1,107.7 1,232.7 1,305.8 1,455.4 -149.6
Tax Revenue 701.2 851.8 958.2 1,068.7 1,219.5 1,220.9 -1.4 Non Tax Revenue 76.2 67.2 92.8 101.6 86.3 90.4 -4.1 Appropriations-in-Aid 67.8 55.4 56.7 62.4 94.8 144.0 -49.2 External Grants 21.4 27.0 28.1 29.6 26.3 58.8 -32.52. Expenditure and Net Lending 1,107.2 1,297.8 1,640.0 1,781.9 2,110.0 2,326.9 -216.9 Recurrent Expenditure 812.0 785.1 895.2 1,027.5 1,179.5 1,238.3 -58.8 Development Expenditure 295.2 319.3 510.5 485.4 639.8 797.9 -158.1
County Transfers 9.8 193.4 229.3 264.0 284.7 284.7 0.0Equalization fund 5.0 5.0 6.0 6.0
3. Deficit On A Commitment Basis (1-2) -240.7 -296.4 -504.2 -519.6 -683.1 -812.8 0.0Deficit on a commitment basis as a % of GDP* -5.6 -6.2 -8.6 -7.7 8.9 10.9
4. Adjustment To Cash Basis 0.1 -12.7 16.9 22.4 0.0 0.0 -2.05. Deficit on a Cash Basis -240.6 -309.1 -487.3 -497.3 -683.1 -812.8 0.0
Deficit on a cash basis as a % of GDP* -5.6 -6.5 -8.4 -7.4 8.9 10.9 6. Discrepancy: Expenditure (+) / Revenue (-) -9.4 0.0 1.5 -22.7 14.2 0.0 -2.0
7. Financing 231.1 309.1 488.8 474.6 697.3 812.8 14.2 Domestic (Net) 168.9 203.0 130.9 202.3 309.8 346.8 -115.5
External (Net) 62.2 106.1 217.5 269.9 385.7 463.9 -37.1Capital Receipts (net of restructuring costs) 0.0 0.0 0.0 2.4 1.8 0.0 -78.1
Others 0.0 0.0 140.5 0.0 0.0 0.0 1.8Source: National Treasury & Central Bank of Kenya
DOMESTIC ECONOMY
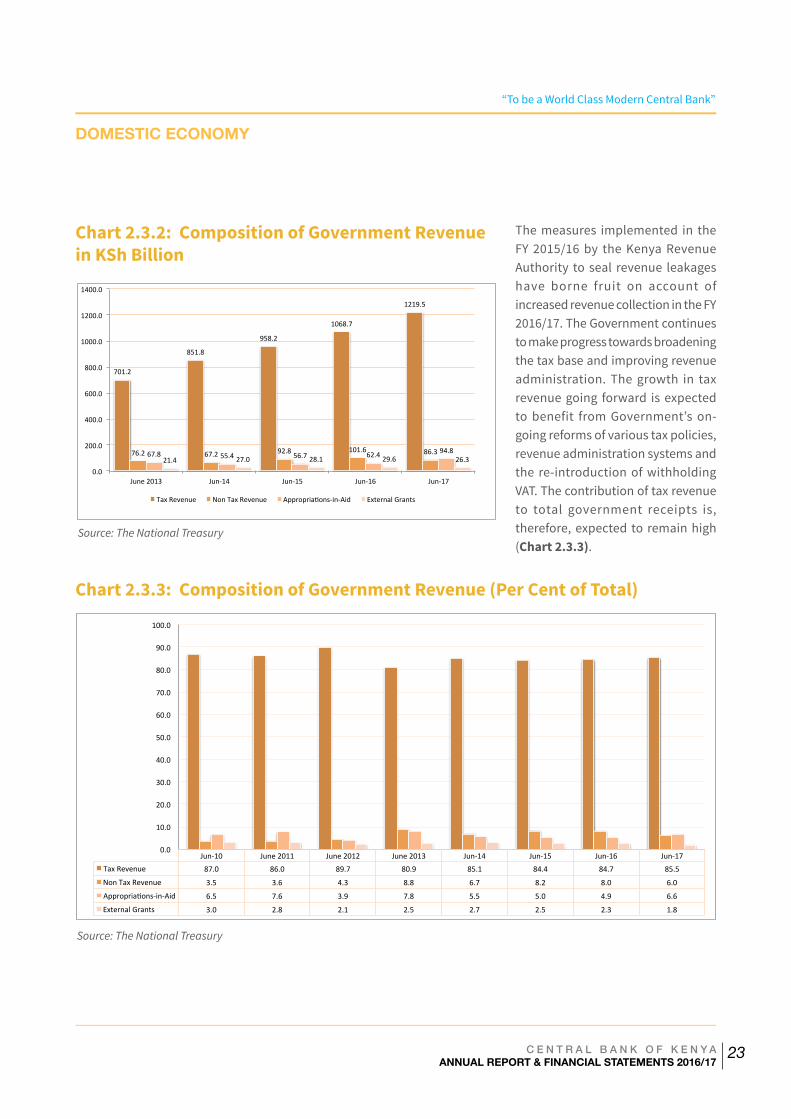
“To be a World Class Modern Central Bank”
C E N T R A L B A N K O F K E N Y AANNUAL REPORT & FINANCIAL STATEMENTS 2016/17
23
Chart 2.3.2: Composition of Government Revenue in KSh Billion
Source: The National Treasury
The measures implemented in the FY 2015/16 by the Kenya Revenue Authority to seal revenue leakages have borne fruit on account of increased revenue collection in the FY 2016/17. The Government continues to make progress towards broadening the tax base and improving revenue administration. The growth in tax revenue going forward is expected to benefit from Government’s on-going reforms of various tax policies, revenue administration systems and the re-introduction of withholding VAT. The contribution of tax revenue to total government receipts is, therefore, expected to remain high (Chart 2.3.3).
Chart 2.3.3: Composition of Government Revenue (Per Cent of Total)
701.2
851.8
958.2
1068.7
1219.5
76.2 67.2 92.8 101.6 86.3 67.8 55.4 56.7 62.4 94.8 21.4 27.0 28.1 29.6 26.3
0.0
200.0
400.0
600.0
800.0
1000.0
1200.0
1400.0
June 2013 Jun-‐14 Jun-‐15 Jun-‐16 Jun-‐17
Tax Revenue Non Tax Revenue Appropria=ons-‐in-‐Aid External Grants
Source: The National Treasury
DOMESTIC ECONOMY
Jun-‐10 June 2011 June 2012 June 2013 Jun-‐14 Jun-‐15 Jun-‐16 Jun-‐17 Tax Revenue 87.0 86.0 89.7 80.9 85.1 84.4 84.7 85.5
Non Tax Revenue 3.5 3.6 4.3 8.8 6.7 8.2 8.0 6.0
Appropria=ons-‐in-‐Aid 6.5 7.6 3.9 7.8 5.5 5.0 4.9 6.6
External Grants 3.0 2.8 2.1 2.5 2.7 2.5 2.3 1.8
0.0
10.0
20.0
30.0
40.0
50.0
60.0
70.0
80.0
90.0
100.0
Axis Title
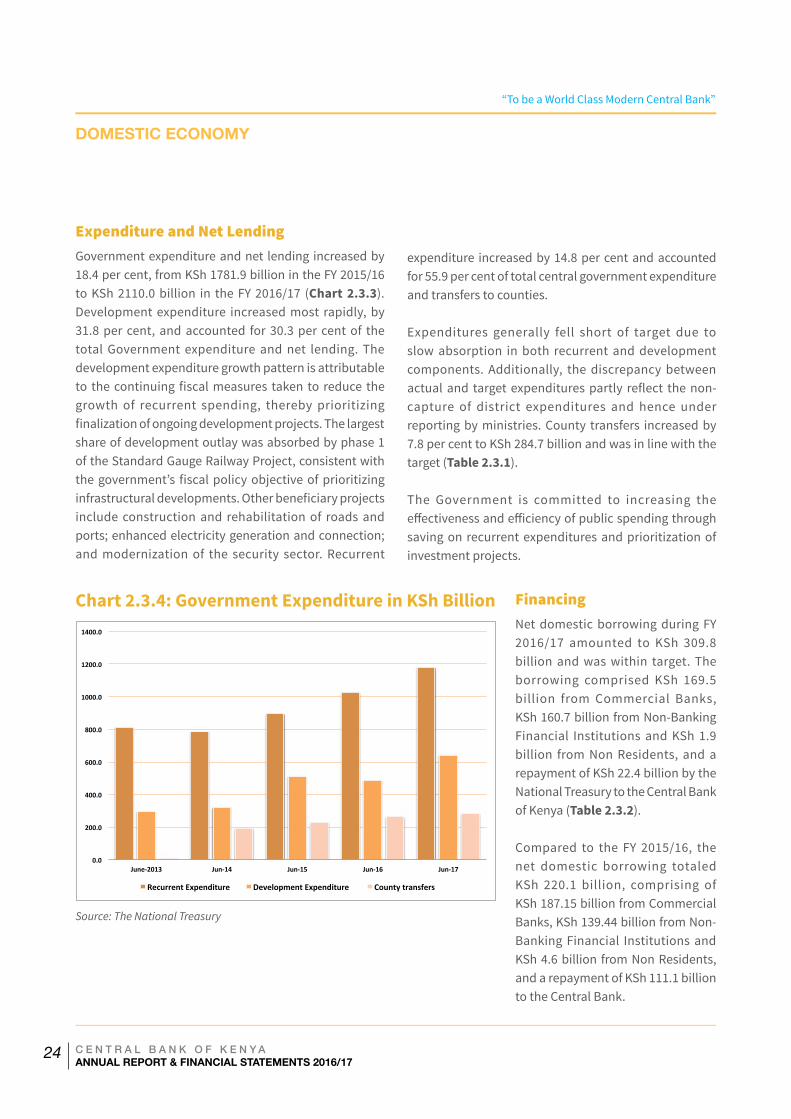
“To be a World Class Modern Central Bank”
C E N T R A L B A N K O F K E N Y AANNUAL REPORT & FINANCIAL STATEMENTS 2016/17
24
Expenditure and Net LendingGovernment expenditure and net lending increased by 18.4 per cent, from KSh 1781.9 billion in the FY 2015/16 to KSh 2110.0 billion in the FY 2016/17 (Chart 2.3.3). Development expenditure increased most rapidly, by 31.8 per cent, and accounted for 30.3 per cent of the total Government expenditure and net lending. The development expenditure growth pattern is attributable to the continuing fiscal measures taken to reduce the growth of recurrent spending, thereby prioritizing finalization of ongoing development projects. The largest share of development outlay was absorbed by phase 1 of the Standard Gauge Railway Project, consistent with the government’s fiscal policy objective of prioritizing infrastructural developments. Other beneficiary projects include construction and rehabilitation of roads and ports; enhanced electricity generation and connection; and modernization of the security sector. Recurrent
expenditure increased by 14.8 per cent and accounted for 55.9 per cent of total central government expenditure and transfers to counties.
Expenditures generally fell short of target due to slow absorption in both recurrent and development components. Additionally, the discrepancy between actual and target expenditures partly reflect the non-capture of district expenditures and hence under reporting by ministries. County transfers increased by 7.8 per cent to KSh 284.7 billion and was in line with the target (Table 2.3.1).
The Government is committed to increasing the effectiveness and efficiency of public spending through saving on recurrent expenditures and prioritization of investment projects.
Chart 2.3.4: Government Expenditure in KSh Billion
0.0
200.0
400.0
600.0
800.0
1000.0
1200.0
1400.0
June-‐2013 Jun-‐14 Jun-‐15 Jun-‐16 Jun-‐17
Recurrent Expenditure Development Expenditure County transfers
Source: The National Treasury
FinancingNet domestic borrowing during FY 2016/17 amounted to KSh 309.8 billion and was within target. The borrowing comprised KSh 169.5 billion from Commercial Banks, KSh 160.7 billion from Non-Banking Financial Institutions and KSh 1.9 billion from Non Residents, and a repayment of KSh 22.4 billion by the National Treasury to the Central Bank of Kenya (Table 2.3.2).
Compared to the FY 2015/16, the net domestic borrowing totaled KSh 220.1 billion, comprising of KSh 187.15 billion from Commercial Banks, KSh 139.44 billion from Non-Banking Financial Institutions and KSh 4.6 billion from Non Residents, and a repayment of KSh 111.1 billion to the Central Bank.
DOMESTIC ECONOMY
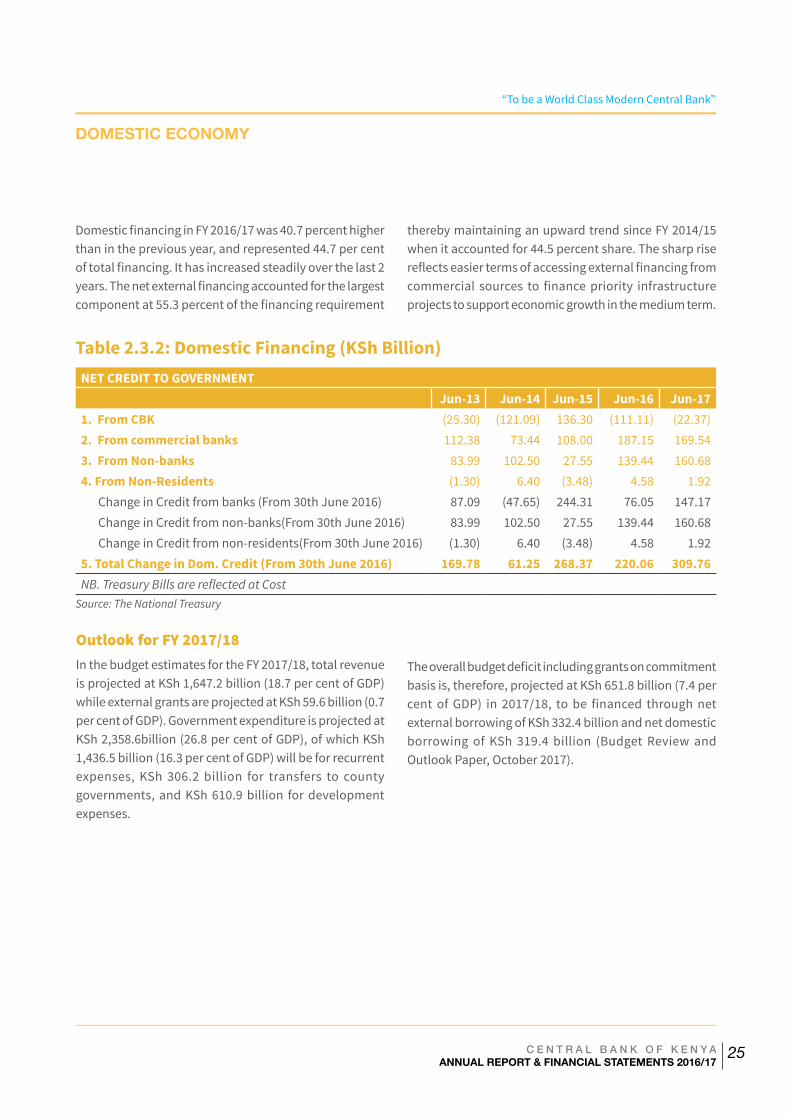
“To be a World Class Modern Central Bank”
C E N T R A L B A N K O F K E N Y AANNUAL REPORT & FINANCIAL STATEMENTS 2016/17
25
Domestic financing in FY 2016/17 was 40.7 percent higher than in the previous year, and represented 44.7 per cent of total financing. It has increased steadily over the last 2 years. The net external financing accounted for the largest component at 55.3 percent of the financing requirement
thereby maintaining an upward trend since FY 2014/15 when it accounted for 44.5 percent share. The sharp rise reflects easier terms of accessing external financing from commercial sources to finance priority infrastructure projects to support economic growth in the medium term.
Table 2.3.2: Domestic Financing (KSh Billion)NET CREDIT TO GOVERNMENT Jun-13 Jun-14 Jun-15 Jun-16 Jun-171. From CBK (25.30) (121.09) 136.30 (111.11) (22.37)2. From commercial banks 112.38 73.44 108.00 187.15 169.54 3. From Non-banks 83.99 102.50 27.55 139.44 160.68 4. From Non-Residents (1.30) 6.40 (3.48) 4.58 1.92
Change in Credit from banks (From 30th June 2016) 87.09 (47.65) 244.31 76.05 147.17 Change in Credit from non-banks(From 30th June 2016) 83.99 102.50 27.55 139.44 160.68 Change in Credit from non-residents(From 30th June 2016) (1.30) 6.40 (3.48) 4.58 1.92
5. Total Change in Dom. Credit (From 30th June 2016) 169.78 61.25 268.37 220.06 309.76NB. Treasury Bills are reflected at Cost
Source: The National Treasury
Outlook for FY 2017/18In the budget estimates for the FY 2017/18, total revenue is projected at KSh 1,647.2 billion (18.7 per cent of GDP) while external grants are projected at KSh 59.6 billion (0.7 per cent of GDP). Government expenditure is projected at KSh 2,358.6billion (26.8 per cent of GDP), of which KSh 1,436.5 billion (16.3 per cent of GDP) will be for recurrent expenses, KSh 306.2 billion for transfers to county governments, and KSh 610.9 billion for development expenses.
The overall budget deficit including grants on commitment basis is, therefore, projected at KSh 651.8 billion (7.4 per cent of GDP) in 2017/18, to be financed through net external borrowing of KSh 332.4 billion and net domestic borrowing of KSh 319.4 billion (Budget Review and Outlook Paper, October 2017).
DOMESTIC ECONOMY
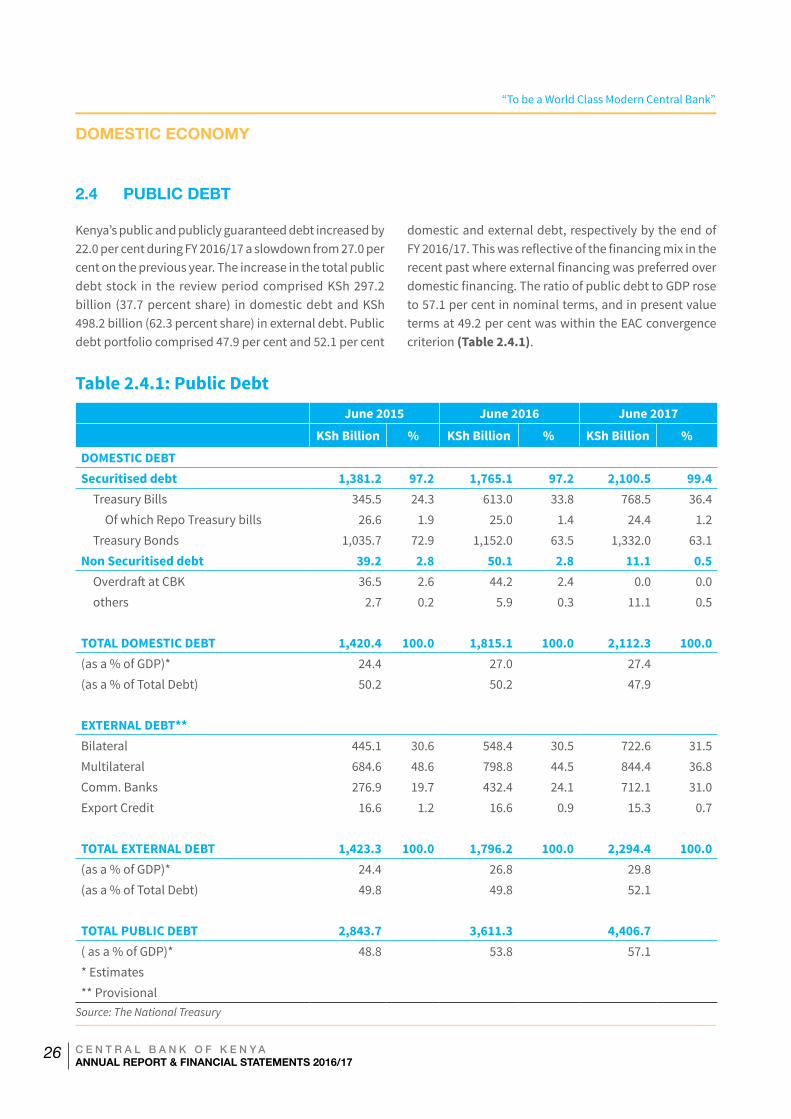
“To be a World Class Modern Central Bank”
C E N T R A L B A N K O F K E N Y AANNUAL REPORT & FINANCIAL STATEMENTS 2016/17
26
2.4 PUBLIC DEBT
Kenya’s public and publicly guaranteed debt increased by 22.0 per cent during FY 2016/17 a slowdown from 27.0 per cent on the previous year. The increase in the total public debt stock in the review period comprised KSh 297.2 billion (37.7 percent share) in domestic debt and KSh 498.2 billion (62.3 percent share) in external debt. Public debt portfolio comprised 47.9 per cent and 52.1 per cent
domestic and external debt, respectively by the end of FY 2016/17. This was reflective of the financing mix in the recent past where external financing was preferred over domestic financing. The ratio of public debt to GDP rose to 57.1 per cent in nominal terms, and in present value terms at 49.2 per cent was within the EAC convergence criterion (Table 2.4.1).
Table 2.4.1: Public Debt June 2015 June 2016 June 2017
KSh Billion % KSh Billion % KSh Billion %
DOMESTIC DEBT Securitised debt 1,381.2 97.2 1,765.1 97.2 2,100.5 99.4
Treasury Bills 345.5 24.3 613.0 33.8 768.5 36.4Of which Repo Treasury bills 26.6 1.9 25.0 1.4 24.4 1.2
Treasury Bonds 1,035.7 72.9 1,152.0 63.5 1,332.0 63.1Non Securitised debt 39.2 2.8 50.1 2.8 11.1 0.5
Overdraft at CBK 36.5 2.6 44.2 2.4 0.0 0.0others 2.7 0.2 5.9 0.3 11.1 0.5
TOTAL DOMESTIC DEBT 1,420.4 100.0 1,815.1 100.0 2,112.3 100.0(as a % of GDP)* 24.4 27.0 27.4 (as a % of Total Debt) 50.2 50.2 47.9 EXTERNAL DEBT** Bilateral 445.1 30.6 548.4 30.5 722.6 31.5Multilateral 684.6 48.6 798.8 44.5 844.4 36.8Comm. Banks 276.9 19.7 432.4 24.1 712.1 31.0Export Credit 16.6 1.2 16.6 0.9 15.3 0.7 TOTAL EXTERNAL DEBT 1,423.3 100.0 1,796.2 100.0 2,294.4 100.0(as a % of GDP)* 24.4 26.8 29.8 (as a % of Total Debt) 49.8 49.8 52.1 TOTAL PUBLIC DEBT 2,843.7 3,611.3 4,406.7 ( as a % of GDP)* 48.8 53.8 57.1 * Estimates ** Provisional
Source: The National Treasury
DOMESTIC ECONOMY
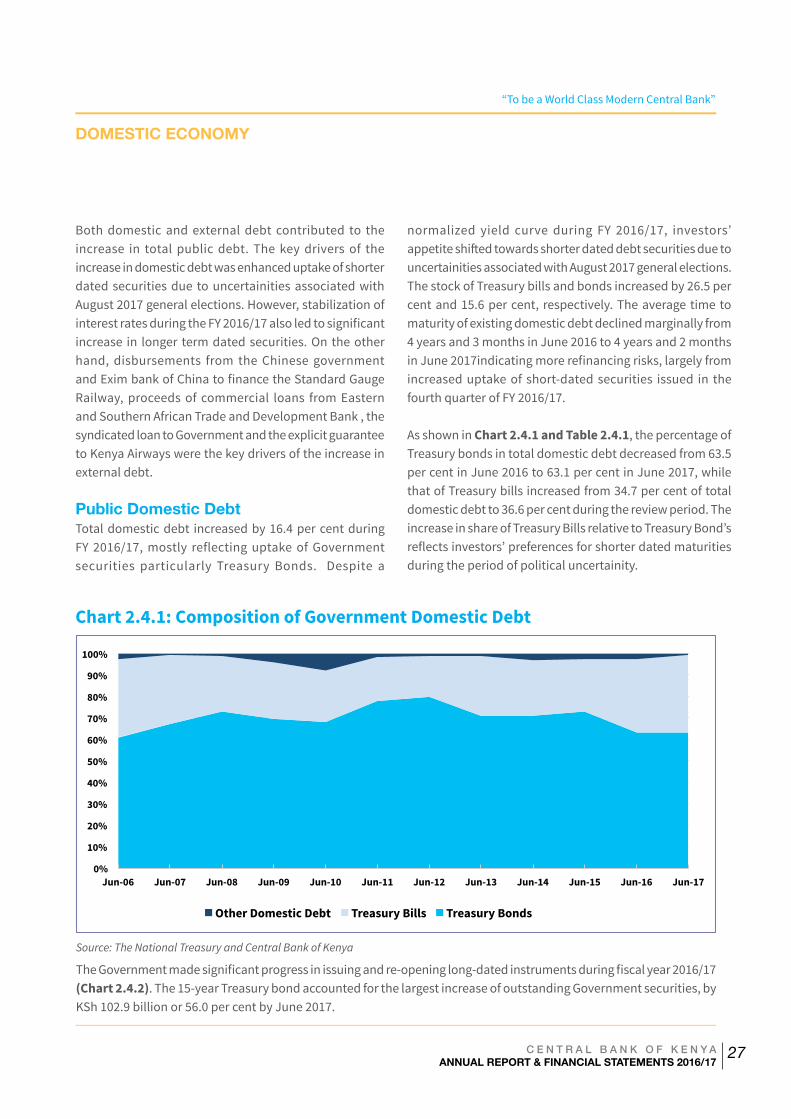
“To be a World Class Modern Central Bank”
C E N T R A L B A N K O F K E N Y AANNUAL REPORT & FINANCIAL STATEMENTS 2016/17
27
Both domestic and external debt contributed to the increase in total public debt. The key drivers of the increase in domestic debt was enhanced uptake of shorter dated securities due to uncertainities associated with August 2017 general elections. However, stabilization of interest rates during the FY 2016/17 also led to significant increase in longer term dated securities. On the other hand, disbursements from the Chinese government and Exim bank of China to finance the Standard Gauge Railway, proceeds of commercial loans from Eastern and Southern African Trade and Development Bank , the syndicated loan to Government and the explicit guarantee to Kenya Airways were the key drivers of the increase in external debt.
Public Domestic DebtTotal domestic debt increased by 16.4 per cent during FY 2016/17, mostly reflecting uptake of Government securities particularly Treasury Bonds. Despite a
normalized yield curve during FY 2016/17, investors’ appetite shifted towards shorter dated debt securities due to uncertainities associated with August 2017 general elections. The stock of Treasury bills and bonds increased by 26.5 per cent and 15.6 per cent, respectively. The average time to maturity of existing domestic debt declined marginally from 4 years and 3 months in June 2016 to 4 years and 2 months in June 2017indicating more refinancing risks, largely from increased uptake of short-dated securities issued in the fourth quarter of FY 2016/17.
As shown in Chart 2.4.1 and Table 2.4.1, the percentage of Treasury bonds in total domestic debt decreased from 63.5 per cent in June 2016 to 63.1 per cent in June 2017, while that of Treasury bills increased from 34.7 per cent of total domestic debt to 36.6 per cent during the review period. The increase in share of Treasury Bills relative to Treasury Bond’s reflects investors’ preferences for shorter dated maturities during the period of political uncertainity.
Chart 2.4.1: Composition of Government Domestic Debt
0%
10%
20%
30%
40%
50%
60%
70%
80%
90%
100%
Jun-06 Jun-07 Jun-08 Jun-09 Jun-10 Jun-11 Jun-12 Jun-13 Jun-14 Jun-15 Jun-16 Jun-17
Other Domestic Debt Treasury Bills Treasury Bonds
Source: The National Treasury and Central Bank of Kenya
The Government made significant progress in issuing and re-opening long-dated instruments during fiscal year 2016/17 (Chart 2.4.2). The 15-year Treasury bond accounted for the largest increase of outstanding Government securities, by KSh 102.9 billion or 56.0 per cent by June 2017.
DOMESTIC ECONOMY
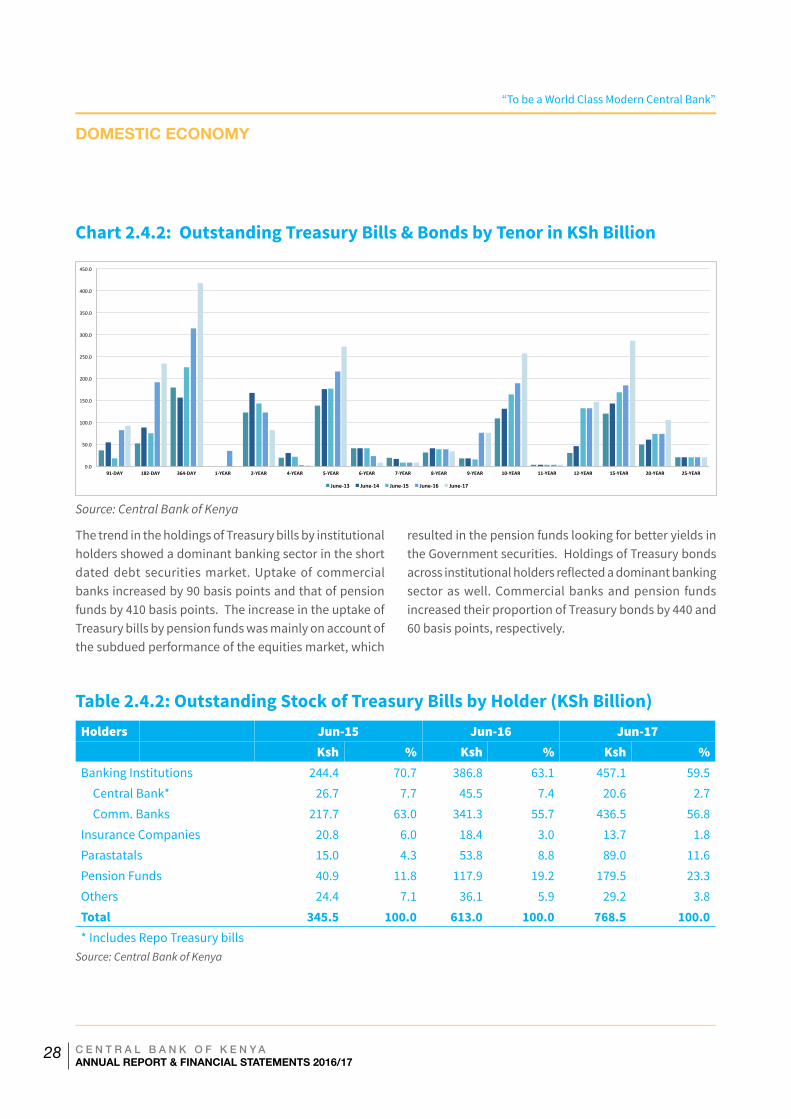
“To be a World Class Modern Central Bank”
C E N T R A L B A N K O F K E N Y AANNUAL REPORT & FINANCIAL STATEMENTS 2016/17
28
Chart 2.4.2: Outstanding Treasury Bills & Bonds by Tenor in KSh Billion
Source: Central Bank of Kenya
0.0
50.0
100.0
150.0
200.0
250.0
300.0
350.0
400.0
450.0
91-‐DAY 182-‐DAY 364-‐DAY 1-‐YEAR 2-‐YEAR 4-‐YEAR 5-‐YEAR 6-‐YEAR 7-‐YEAR 8-‐YEAR 9-‐YEAR 10-‐YEAR 11-‐YEAR 12-‐YEAR 15-‐YEAR 20-‐YEAR 25-‐YEAR
June-‐13 June-‐14 June-‐15 June-‐16 June-‐17
resulted in the pension funds looking for better yields in the Government securities. Holdings of Treasury bonds across institutional holders reflected a dominant banking sector as well. Commercial banks and pension funds increased their proportion of Treasury bonds by 440 and 60 basis points, respectively.
The trend in the holdings of Treasury bills by institutional holders showed a dominant banking sector in the short dated debt securities market. Uptake of commercial banks increased by 90 basis points and that of pension funds by 410 basis points. The increase in the uptake of Treasury bills by pension funds was mainly on account of the subdued performance of the equities market, which
Table 2.4.2: Outstanding Stock of Treasury Bills by Holder (KSh Billion)Holders Jun-15 Jun-16 Jun-17 Ksh % Ksh % Ksh %Banking Institutions 244.4 70.7 386.8 63.1 457.1 59.5
Central Bank* 26.7 7.7 45.5 7.4 20.6 2.7Comm. Banks 217.7 63.0 341.3 55.7 436.5 56.8
Insurance Companies 20.8 6.0 18.4 3.0 13.7 1.8Parastatals 15.0 4.3 53.8 8.8 89.0 11.6Pension Funds 40.9 11.8 117.9 19.2 179.5 23.3Others 24.4 7.1 36.1 5.9 29.2 3.8Total 345.5 100.0 613.0 100.0 768.5 100.0* Includes Repo Treasury bills
Source: Central Bank of Kenya
DOMESTIC ECONOMY
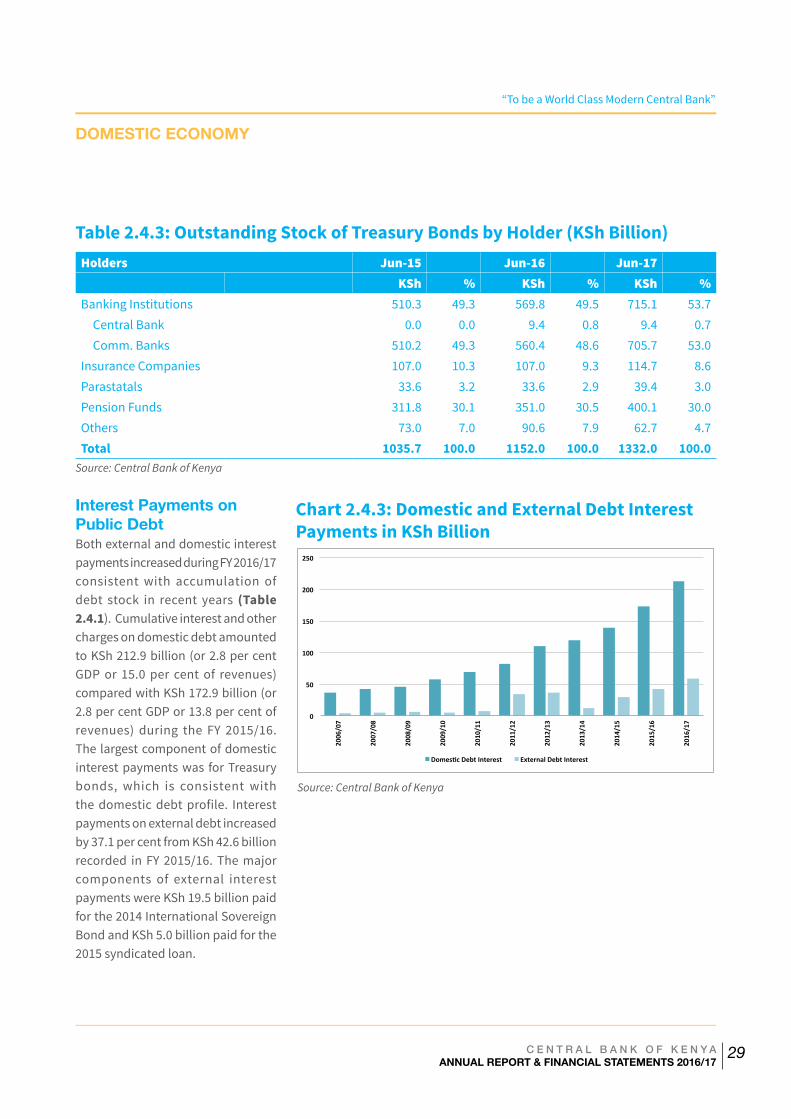
“To be a World Class Modern Central Bank”
C E N T R A L B A N K O F K E N Y AANNUAL REPORT & FINANCIAL STATEMENTS 2016/17
29
Table 2.4.3: Outstanding Stock of Treasury Bonds by Holder (KSh Billion)Holders Jun-15 Jun-16 Jun-17 KSh % KSh % KSh %Banking Institutions 510.3 49.3 569.8 49.5 715.1 53.7
Central Bank 0.0 0.0 9.4 0.8 9.4 0.7Comm. Banks 510.2 49.3 560.4 48.6 705.7 53.0
Insurance Companies 107.0 10.3 107.0 9.3 114.7 8.6Parastatals 33.6 3.2 33.6 2.9 39.4 3.0Pension Funds 311.8 30.1 351.0 30.5 400.1 30.0Others 73.0 7.0 90.6 7.9 62.7 4.7Total 1035.7 100.0 1152.0 100.0 1332.0 100.0
Source: Central Bank of Kenya
Interest Payments on Public DebtBoth external and domestic interest payments increased during FY 2016/17 consistent with accumulation of debt stock in recent years (Table 2.4.1). Cumulative interest and other charges on domestic debt amounted to KSh 212.9 billion (or 2.8 per cent GDP or 15.0 per cent of revenues) compared with KSh 172.9 billion (or 2.8 per cent GDP or 13.8 per cent of revenues) during the FY 2015/16. The largest component of domestic interest payments was for Treasury bonds, which is consistent with the domestic debt profile. Interest payments on external debt increased by 37.1 per cent from KSh 42.6 billion recorded in FY 2015/16. The major components of external interest payments were KSh 19.5 billion paid for the 2014 International Sovereign Bond and KSh 5.0 billion paid for the 2015 syndicated loan.
0
50
100
150
200
250
2006
/07
2007
/08
2008
/09
2009
/10
2010
/11
2011
/12
2012
/13
2013
/14
2014
/15
2015
/16
2016
/17
Domes2c Debt Interest External Debt Interest
Chart 2.4.3: Domestic and External Debt Interest Payments in KSh Billion
Source: Central Bank of Kenya
DOMESTIC ECONOMY
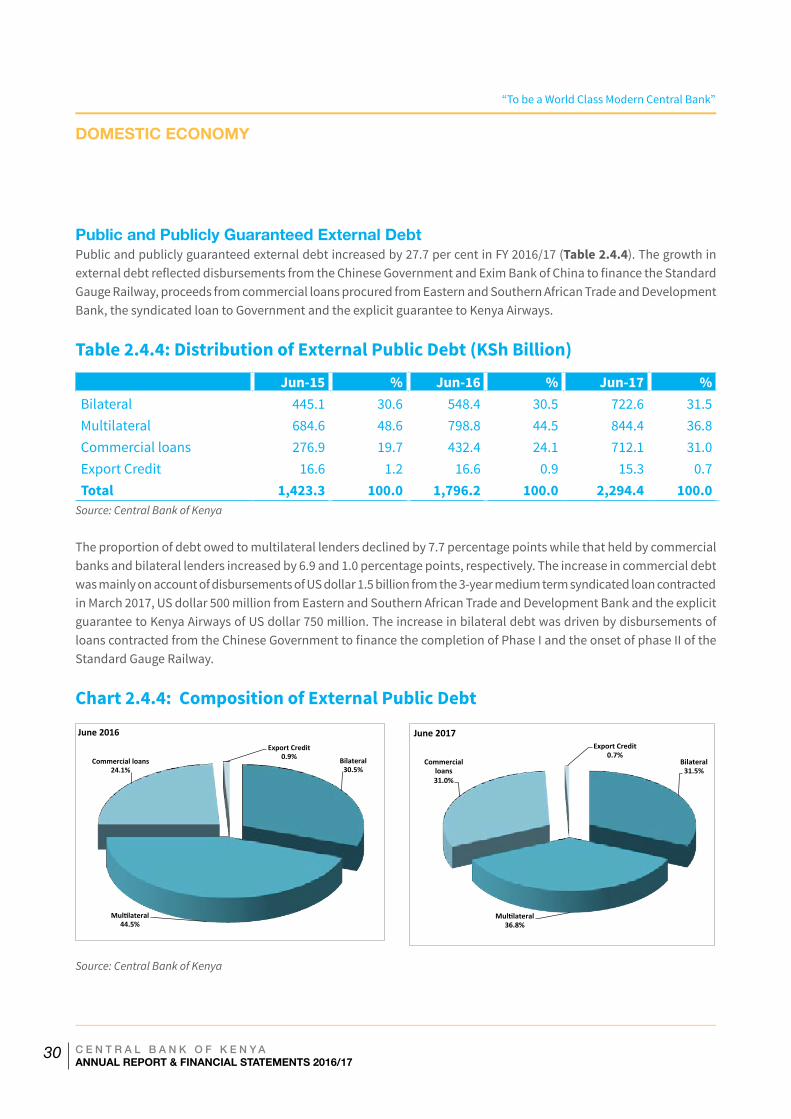
“To be a World Class Modern Central Bank”
C E N T R A L B A N K O F K E N Y AANNUAL REPORT & FINANCIAL STATEMENTS 2016/17
30
Public and Publicly Guaranteed External DebtPublic and publicly guaranteed external debt increased by 27.7 per cent in FY 2016/17 (Table 2.4.4). The growth in external debt reflected disbursements from the Chinese Government and Exim Bank of China to finance the Standard Gauge Railway, proceeds from commercial loans procured from Eastern and Southern African Trade and Development Bank, the syndicated loan to Government and the explicit guarantee to Kenya Airways.
Table 2.4.4: Distribution of External Public Debt (KSh Billion)
Jun-15 % Jun-16 % Jun-17 %Bilateral 445.1 30.6 548.4 30.5 722.6 31.5Multilateral 684.6 48.6 798.8 44.5 844.4 36.8Commercial loans 276.9 19.7 432.4 24.1 712.1 31.0Export Credit 16.6 1.2 16.6 0.9 15.3 0.7Total 1,423.3 100.0 1,796.2 100.0 2,294.4 100.0
Source: Central Bank of Kenya
The proportion of debt owed to multilateral lenders declined by 7.7 percentage points while that held by commercial banks and bilateral lenders increased by 6.9 and 1.0 percentage points, respectively. The increase in commercial debt was mainly on account of disbursements of US dollar 1.5 billion from the 3-year medium term syndicated loan contracted in March 2017, US dollar 500 million from Eastern and Southern African Trade and Development Bank and the explicit guarantee to Kenya Airways of US dollar 750 million. The increase in bilateral debt was driven by disbursements of loans contracted from the Chinese Government to finance the completion of Phase I and the onset of phase II of the Standard Gauge Railway.
Chart 2.4.4: Composition of External Public Debt
Bilateral 30.5%
Mul0lateral 44.5%
Commercial loans 24.1%
Export Credit 0.9%
June 2016
Bilateral 31.5%
Mul0lateral 36.8%
Commercial loans 31.0%
Export Credit 0.7%
June 2017
Source: Central Bank of Kenya
DOMESTIC ECONOMY
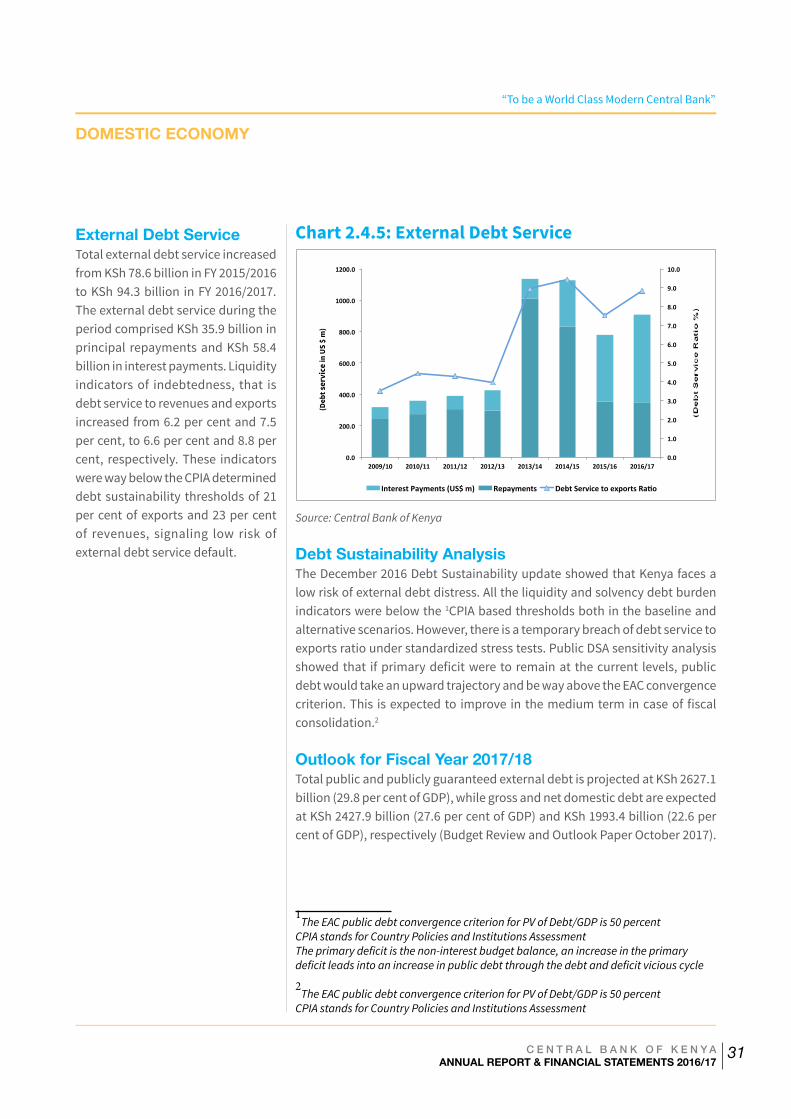
“To be a World Class Modern Central Bank”
C E N T R A L B A N K O F K E N Y AANNUAL REPORT & FINANCIAL STATEMENTS 2016/17
31
External Debt ServiceTotal external debt service increased from KSh 78.6 billion in FY 2015/2016 to KSh 94.3 billion in FY 2016/2017. The external debt service during the period comprised KSh 35.9 billion in principal repayments and KSh 58.4 billion in interest payments. Liquidity indicators of indebtedness, that is debt service to revenues and exports increased from 6.2 per cent and 7.5 per cent, to 6.6 per cent and 8.8 per cent, respectively. These indicators were way below the CPIA determined debt sustainability thresholds of 21 per cent of exports and 23 per cent of revenues, signaling low risk of external debt service default.
Chart 2.4.5: External Debt Service
0.0
1.0
2.0
3.0
4.0
5.0
6.0
7.0
8.0
9.0
10.0
0.0
200.0
400.0
600.0
800.0
1000.0
1200.0
2009/10 2010/11 2011/12 2012/13 2013/14 2014/15 2015/16 2016/17
Interest Payments (US$ m) Repayments Debt Service to exports RaFo
(Deb
t ser
vice
in U
S $
m)
Source: Central Bank of Kenya
Debt Sustainability Analysis The December 2016 Debt Sustainability update showed that Kenya faces a low risk of external debt distress. All the liquidity and solvency debt burden indicators were below the 1CPIA based thresholds both in the baseline and alternative scenarios. However, there is a temporary breach of debt service to exports ratio under standardized stress tests. Public DSA sensitivity analysis showed that if primary deficit were to remain at the current levels, public debt would take an upward trajectory and be way above the EAC convergence criterion. This is expected to improve in the medium term in case of fiscal consolidation.2
Outlook for Fiscal Year 2017/18Total public and publicly guaranteed external debt is projected at KSh 2627.1 billion (29.8 per cent of GDP), while gross and net domestic debt are expected at KSh 2427.9 billion (27.6 per cent of GDP) and KSh 1993.4 billion (22.6 per cent of GDP), respectively (Budget Review and Outlook Paper October 2017).
1The EAC public debt convergence criterion for PV of Debt/GDP is 50 percent
CPIA stands for Country Policies and Institutions AssessmentThe primary deficit is the non-interest budget balance, an increase in the primary deficit leads into an increase in public debt through the debt and deficit vicious cycle
2The EAC public debt convergence criterion for PV of Debt/GDP is 50 percent
CPIA stands for Country Policies and Institutions Assessment
DOMESTIC ECONOMY
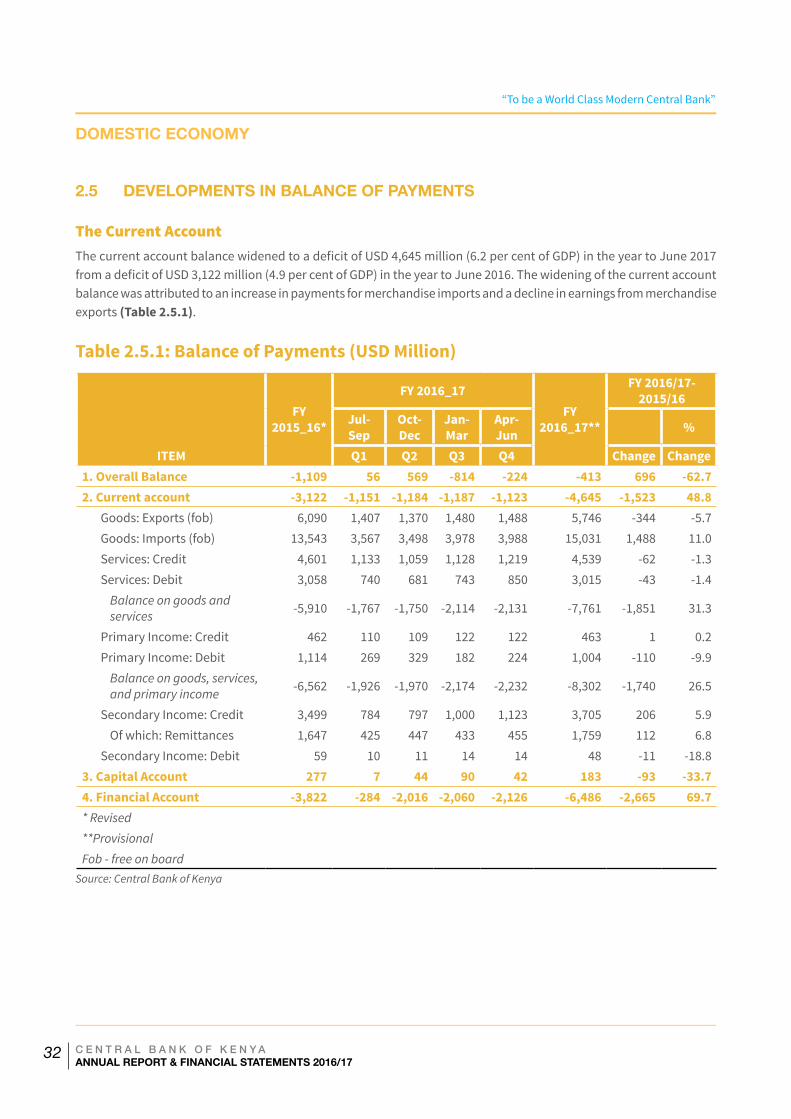
“To be a World Class Modern Central Bank”
C E N T R A L B A N K O F K E N Y AANNUAL REPORT & FINANCIAL STATEMENTS 2016/17
32
The Current Account
The current account balance widened to a deficit of USD 4,645 million (6.2 per cent of GDP) in the year to June 2017 from a deficit of USD 3,122 million (4.9 per cent of GDP) in the year to June 2016. The widening of the current account balance was attributed to an increase in payments for merchandise imports and a decline in earnings from merchandise exports (Table 2.5.1).
Table 2.5.1: Balance of Payments (USD Million)
FY
2015_16*
FY 2016_17FY
2016_17**
FY 2016/17-2015/16
Jul-Sep
Oct-Dec
Jan-Mar
Apr-Jun %
ITEM Q1 Q2 Q3 Q4 Change Change1. Overall Balance -1,109 56 569 -814 -224 -413 696 -62.72. Current account -3,122 -1,151 -1,184 -1,187 -1,123 -4,645 -1,523 48.8
Goods: Exports (fob) 6,090 1,407 1,370 1,480 1,488 5,746 -344 -5.7Goods: Imports (fob) 13,543 3,567 3,498 3,978 3,988 15,031 1,488 11.0Services: Credit 4,601 1,133 1,059 1,128 1,219 4,539 -62 -1.3Services: Debit 3,058 740 681 743 850 3,015 -43 -1.4
Balance on goods and services -5,910 -1,767 -1,750 -2,114 -2,131 -7,761 -1,851 31.3
Primary Income: Credit 462 110 109 122 122 463 1 0.2Primary Income: Debit 1,114 269 329 182 224 1,004 -110 -9.9
Balance on goods, services, and primary income -6,562 -1,926 -1,970 -2,174 -2,232 -8,302 -1,740 26.5
Secondary Income: Credit 3,499 784 797 1,000 1,123 3,705 206 5.9Of which: Remittances 1,647 425 447 433 455 1,759 112 6.8
Secondary Income: Debit 59 10 11 14 14 48 -11 -18.83. Capital Account 277 7 44 90 42 183 -93 -33.74. Financial Account -3,822 -284 -2,016 -2,060 -2,126 -6,486 -2,665 69.7* Revised **Provisional Fob - free on board
Source: Central Bank of Kenya
2.5 DEVELOPMENTS IN BALANCE OF PAYMENTS
DOMESTIC ECONOMY
“To be a World Class Modern Central Bank”
C E N T R A L B A N K O F K E N Y AANNUAL REPORT & FINANCIAL STATEMENTS 2016/17
33
The value of merchandise imports increased by USD 1,488 million (11 per cent) to USD 15,031 million in the year to June 2017, largely reflecting imports of: transport and office equipment related to the Standard Gauge Railway (SGR) project, food and oil. Food imports rose by USD 405 million to USD 1,492 million on account of increased importation of cereals and sugar during the first half of 2017 driven by prolonged drought conditions experienced from the last quarter of 2016 through early 2017. The increase in oil imports, by USD 270 million, reflected relatively higher oil prices on the international market, while the rise of payment for importation of machinery equipment, by USD 268 million, was mainly attributed to increased importation of office equipment related to the SGR project. Upward pressure on the import bill experienced during the first half of 2017 was as a result of importation of wagons and locomotives related to phase 1 of the SGR project.
The value of merchandise exports declined by USD 344 million (5.7 per cent) to USD 5,746 million in the year to June 2017, largely reflecting the effects of dry weather conditions on key commodity exports and relatively weaker global demand. The value of tea exports declined by 5 per cent to USD 1,268 million, while horticulture exports declined by 3.6 per cent to USD 805 million on the
back of lower export volumes. The production of fresh vegetables, fruits and nuts (horticulture) and tea were affected by the dry weather spell which begun during the last quarter of 2016. Furthermore, there were declines in earnings from other exports including manufactured goods (14.1 per cent), chemicals (13 per cent) and re-exports (17.6 per cent) reflecting lower regional demand for Kenya’s exports due to increased competition from other markets (Table 2.5.2). Net Services recorded lower net inflows of USD 1,524 million during the year to June 2017 compared to USD 1,543 million on account of lower receipts from transport services and lower flows of other net services. Receipts from travel services, however, increased by USD 343 million to USD 1,065 million, boosted by recovery in tourist arrivals (Table 2.5.2).
The primary income balance narrowed to USD 540 million in June 2017 from USD 651 in June 2016 occasioned mainly by lower payments of dividends and interest to non-residents, while improvement in the secondary income balance to USD 3,657 million in June 2017 from USD 3,440 million reflected increased workers’ remittances and inflows to Non-Governmental Organizations (Table 2.5.2).
DOMESTIC ECONOMY
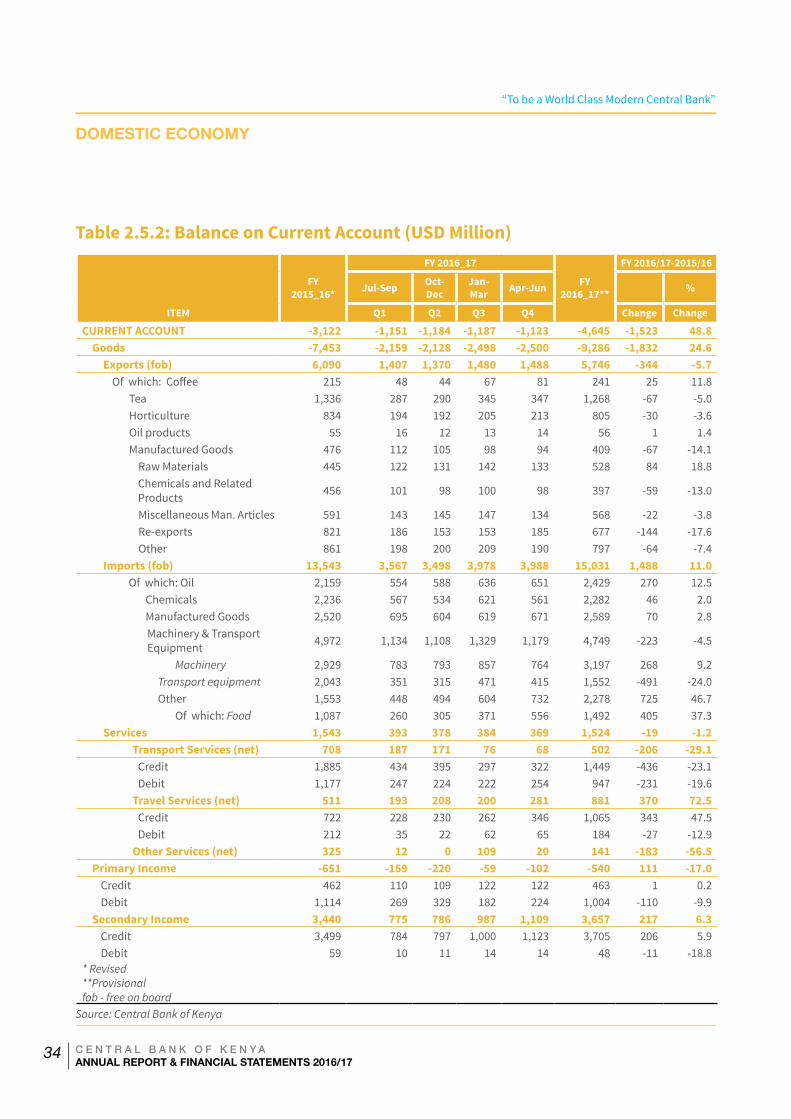
“To be a World Class Modern Central Bank”
C E N T R A L B A N K O F K E N Y AANNUAL REPORT & FINANCIAL STATEMENTS 2016/17
34
Table 2.5.2: Balance on Current Account (USD Million)
FY 2015_16*
FY 2016_17
FY 2016_17**
FY 2016/17-2015/16
Jul-Sep Oct-Dec
Jan-Mar Apr-Jun %
ITEM Q1 Q2 Q3 Q4 Change Change
CURRENT ACCOUNT -3,122 -1,151 -1,184 -1,187 -1,123 -4,645 -1,523 48.8Goods -7,453 -2,159 -2,128 -2,498 -2,500 -9,286 -1,832 24.6
Exports (fob) 6,090 1,407 1,370 1,480 1,488 5,746 -344 -5.7Of which: Coffee 215 48 44 67 81 241 25 11.8 Tea 1,336 287 290 345 347 1,268 -67 -5.0 Horticulture 834 194 192 205 213 805 -30 -3.6 Oil products 55 16 12 13 14 56 1 1.4 Manufactured Goods 476 112 105 98 94 409 -67 -14.1
Raw Materials 445 122 131 142 133 528 84 18.8Chemicals and Related Products 456 101 98 100 98 397 -59 -13.0
Miscellaneous Man. Articles 591 143 145 147 134 568 -22 -3.8Re-exports 821 186 153 153 185 677 -144 -17.6Other 861 198 200 209 190 797 -64 -7.4
Imports (fob) 13,543 3,567 3,498 3,978 3,988 15,031 1,488 11.0Of which: Oil 2,159 554 588 636 651 2,429 270 12.5 Chemicals 2,236 567 534 621 561 2,282 46 2.0 Manufactured Goods 2,520 695 604 619 671 2,589 70 2.8
Machinery & Transport Equipment 4,972 1,134 1,108 1,329 1,179 4,749 -223 -4.5
Machinery 2,929 783 793 857 764 3,197 268 9.2Transport equipment 2,043 351 315 471 415 1,552 -491 -24.0Other 1,553 448 494 604 732 2,278 725 46.7
Of which: Food 1,087 260 305 371 556 1,492 405 37.3Services 1,543 393 378 384 369 1,524 -19 -1.2
Transport Services (net) 708 187 171 76 68 502 -206 -29.1Credit 1,885 434 395 297 322 1,449 -436 -23.1Debit 1,177 247 224 222 254 947 -231 -19.6
Travel Services (net) 511 193 208 200 281 881 370 72.5Credit 722 228 230 262 346 1,065 343 47.5Debit 212 35 22 62 65 184 -27 -12.9
Other Services (net) 325 12 0 109 20 141 -183 -56.5Primary Income -651 -159 -220 -59 -102 -540 111 -17.0
Credit 462 110 109 122 122 463 1 0.2Debit 1,114 269 329 182 224 1,004 -110 -9.9
Secondary Income 3,440 775 786 987 1,109 3,657 217 6.3Credit 3,499 784 797 1,000 1,123 3,705 206 5.9Debit 59 10 11 14 14 48 -11 -18.8
* Revised**Provisionalfob - free on board
Source: Central Bank of Kenya
DOMESTIC ECONOMY
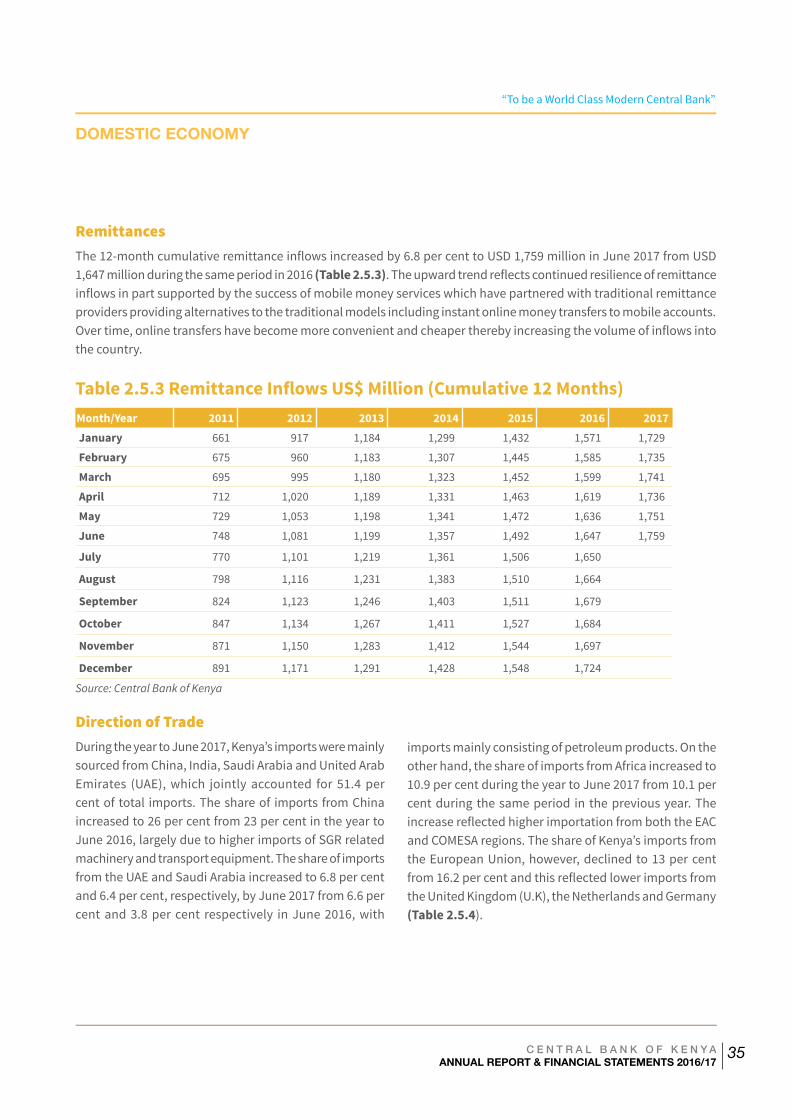
“To be a World Class Modern Central Bank”
C E N T R A L B A N K O F K E N Y AANNUAL REPORT & FINANCIAL STATEMENTS 2016/17
35
RemittancesThe 12-month cumulative remittance inflows increased by 6.8 per cent to USD 1,759 million in June 2017 from USD 1,647 million during the same period in 2016 (Table 2.5.3). The upward trend reflects continued resilience of remittance inflows in part supported by the success of mobile money services which have partnered with traditional remittance providers providing alternatives to the traditional models including instant online money transfers to mobile accounts. Over time, online transfers have become more convenient and cheaper thereby increasing the volume of inflows into the country.
Table 2.5.3 Remittance Inflows US$ Million (Cumulative 12 Months)Month/Year 2011 2012 2013 2014 2015 2016 2017 January 661 917 1,184 1,299 1,432 1,571 1,729
February 675 960 1,183 1,307 1,445 1,585 1,735
March 695 995 1,180 1,323 1,452 1,599 1,741
April 712 1,020 1,189 1,331 1,463 1,619 1,736
May 729 1,053 1,198 1,341 1,472 1,636 1,751
June 748 1,081 1,199 1,357 1,492 1,647 1,759
July 770 1,101 1,219 1,361 1,506 1,650 August 798 1,116 1,231 1,383 1,510 1,664 September 824 1,123 1,246 1,403 1,511 1,679 October 847 1,134 1,267 1,411 1,527 1,684 November 871 1,150 1,283 1,412 1,544 1,697 December 891 1,171 1,291 1,428 1,548 1,724 Source: Central Bank of Kenya
Direction of Trade
During the year to June 2017, Kenya’s imports were mainly sourced from China, India, Saudi Arabia and United Arab Emirates (UAE), which jointly accounted for 51.4 per cent of total imports. The share of imports from China increased to 26 per cent from 23 per cent in the year to June 2016, largely due to higher imports of SGR related machinery and transport equipment. The share of imports from the UAE and Saudi Arabia increased to 6.8 per cent and 6.4 per cent, respectively, by June 2017 from 6.6 per cent and 3.8 per cent respectively in June 2016, with
imports mainly consisting of petroleum products. On the other hand, the share of imports from Africa increased to 10.9 per cent during the year to June 2017 from 10.1 per cent during the same period in the previous year. The increase reflected higher importation from both the EAC and COMESA regions. The share of Kenya’s imports from the European Union, however, declined to 13 per cent from 16.2 per cent and this reflected lower imports from the United Kingdom (U.K), the Netherlands and Germany (Table 2.5.4).
DOMESTIC ECONOMY
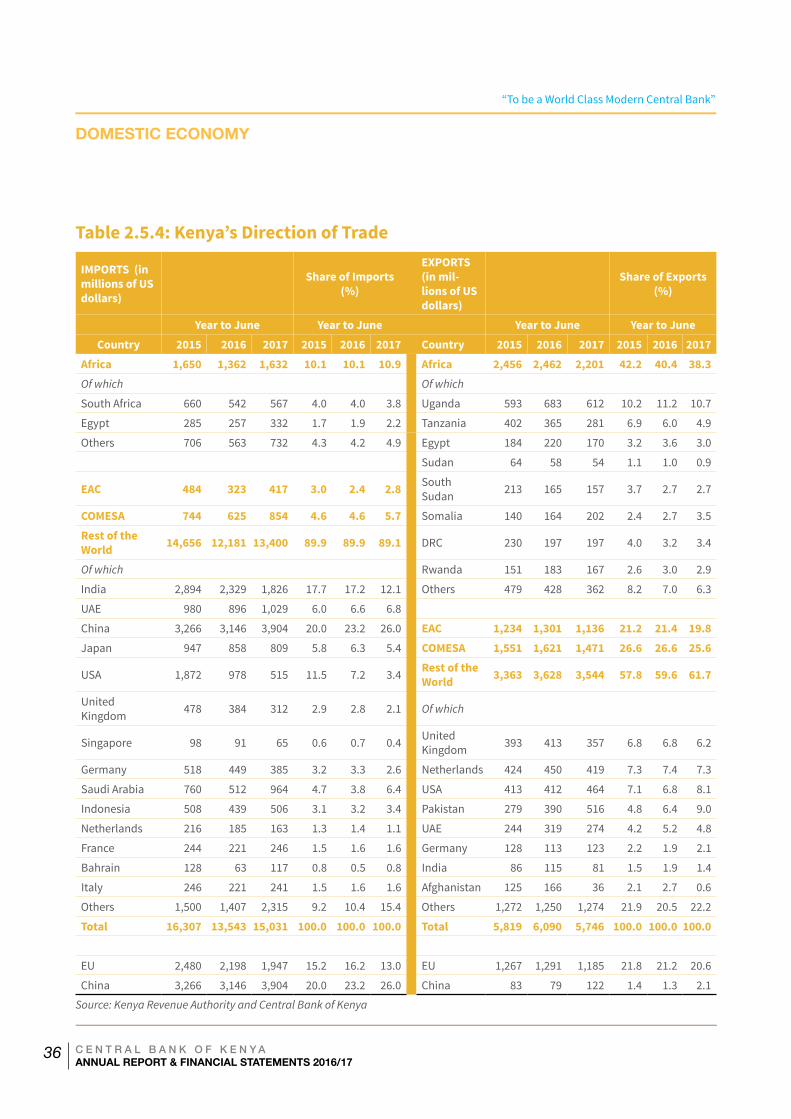
“To be a World Class Modern Central Bank”
C E N T R A L B A N K O F K E N Y AANNUAL REPORT & FINANCIAL STATEMENTS 2016/17
36
Table 2.5.4: Kenya’s Direction of Trade
IMPORTS (in millions of US dollars)
Share of Imports (%)
EXPORTS (in mil-lions of US dollars)
Share of Exports (%)
Year to June Year to June Year to June Year to JuneCountry 2015 2016 2017 2015 2016 2017 Country 2015 2016 2017 2015 2016 2017
Africa 1,650 1,362 1,632 10.1 10.1 10.9 Africa 2,456 2,462 2,201 42.2 40.4 38.3Of which Of which South Africa 660 542 567 4.0 4.0 3.8 Uganda 593 683 612 10.2 11.2 10.7
Egypt 285 257 332 1.7 1.9 2.2 Tanzania 402 365 281 6.9 6.0 4.9
Others 706 563 732 4.3 4.2 4.9 Egypt 184 220 170 3.2 3.6 3.0
Sudan 64 58 54 1.1 1.0 0.9
EAC 484 323 417 3.0 2.4 2.8 South Sudan 213 165 157 3.7 2.7 2.7
COMESA 744 625 854 4.6 4.6 5.7 Somalia 140 164 202 2.4 2.7 3.5
Rest of the World 14,656 12,181 13,400 89.9 89.9 89.1 DRC 230 197 197 4.0 3.2 3.4
Of which Rwanda 151 183 167 2.6 3.0 2.9
India 2,894 2,329 1,826 17.7 17.2 12.1 Others 479 428 362 8.2 7.0 6.3
UAE 980 896 1,029 6.0 6.6 6.8 China 3,266 3,146 3,904 20.0 23.2 26.0 EAC 1,234 1,301 1,136 21.2 21.4 19.8Japan 947 858 809 5.8 6.3 5.4 COMESA 1,551 1,621 1,471 26.6 26.6 25.6
USA 1,872 978 515 11.5 7.2 3.4 Rest of the World 3,363 3,628 3,544 57.8 59.6 61.7
United Kingdom 478 384 312 2.9 2.8 2.1 Of which
Singapore 98 91 65 0.6 0.7 0.4 United Kingdom 393 413 357 6.8 6.8 6.2
Germany 518 449 385 3.2 3.3 2.6 Netherlands 424 450 419 7.3 7.4 7.3
Saudi Arabia 760 512 964 4.7 3.8 6.4 USA 413 412 464 7.1 6.8 8.1
Indonesia 508 439 506 3.1 3.2 3.4 Pakistan 279 390 516 4.8 6.4 9.0
Netherlands 216 185 163 1.3 1.4 1.1 UAE 244 319 274 4.2 5.2 4.8
France 244 221 246 1.5 1.6 1.6 Germany 128 113 123 2.2 1.9 2.1
Bahrain 128 63 117 0.8 0.5 0.8 India 86 115 81 1.5 1.9 1.4
Italy 246 221 241 1.5 1.6 1.6 Afghanistan 125 166 36 2.1 2.7 0.6
Others 1,500 1,407 2,315 9.2 10.4 15.4 Others 1,272 1,250 1,274 21.9 20.5 22.2
Total 16,307 13,543 15,031 100.0 100.0 100.0 Total 5,819 6,090 5,746 100.0 100.0 100.0
EU 2,480 2,198 1,947 15.2 16.2 13.0 EU 1,267 1,291 1,185 21.8 21.2 20.6
China 3,266 3,146 3,904 20.0 23.2 26.0 China 83 79 122 1.4 1.3 2.1
Source: Kenya Revenue Authority and Central Bank of Kenya
DOMESTIC ECONOMY
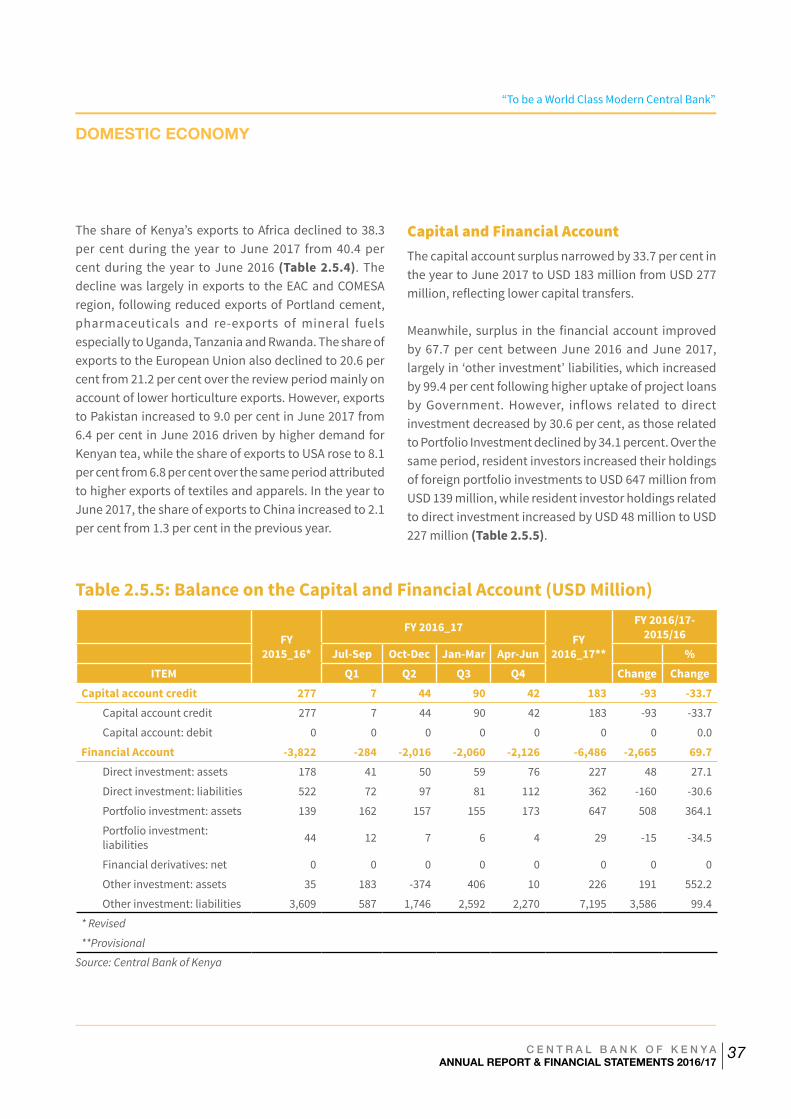
“To be a World Class Modern Central Bank”
C E N T R A L B A N K O F K E N Y AANNUAL REPORT & FINANCIAL STATEMENTS 2016/17
37
The share of Kenya’s exports to Africa declined to 38.3 per cent during the year to June 2017 from 40.4 per cent during the year to June 2016 (Table 2.5.4). The decline was largely in exports to the EAC and COMESA region, following reduced exports of Portland cement, pharmaceuticals and re-exports of mineral fuels especially to Uganda, Tanzania and Rwanda. The share of exports to the European Union also declined to 20.6 per cent from 21.2 per cent over the review period mainly on account of lower horticulture exports. However, exports to Pakistan increased to 9.0 per cent in June 2017 from 6.4 per cent in June 2016 driven by higher demand for Kenyan tea, while the share of exports to USA rose to 8.1 per cent from 6.8 per cent over the same period attributed to higher exports of textiles and apparels. In the year to June 2017, the share of exports to China increased to 2.1 per cent from 1.3 per cent in the previous year.
Capital and Financial AccountThe capital account surplus narrowed by 33.7 per cent in the year to June 2017 to USD 183 million from USD 277 million, reflecting lower capital transfers.
Meanwhile, surplus in the financial account improved by 67.7 per cent between June 2016 and June 2017, largely in ‘other investment’ liabilities, which increased by 99.4 per cent following higher uptake of project loans by Government. However, inflows related to direct investment decreased by 30.6 per cent, as those related to Portfolio Investment declined by 34.1 percent. Over the same period, resident investors increased their holdings of foreign portfolio investments to USD 647 million from USD 139 million, while resident investor holdings related to direct investment increased by USD 48 million to USD 227 million (Table 2.5.5).
Table 2.5.5: Balance on the Capital and Financial Account (USD Million)
FY
2015_16*
FY 2016_17FY
2016_17**
FY 2016/17-2015/16
Jul-Sep Oct-Dec Jan-Mar Apr-Jun %ITEM Q1 Q2 Q3 Q4 Change Change
Capital account credit 277 7 44 90 42 183 -93 -33.7Capital account credit 277 7 44 90 42 183 -93 -33.7
Capital account: debit 0 0 0 0 0 0 0 0.0
Financial Account -3,822 -284 -2,016 -2,060 -2,126 -6,486 -2,665 69.7Direct investment: assets 178 41 50 59 76 227 48 27.1
Direct investment: liabilities 522 72 97 81 112 362 -160 -30.6
Portfolio investment: assets 139 162 157 155 173 647 508 364.1
Portfolio investment: liabilities 44 12 7 6 4 29 -15 -34.5
Financial derivatives: net 0 0 0 0 0 0 0 0
Other investment: assets 35 183 -374 406 10 226 191 552.2
Other investment: liabilities 3,609 587 1,746 2,592 2,270 7,195 3,586 99.4
* Revised
**Provisional
Source: Central Bank of Kenya
DOMESTIC ECONOMY
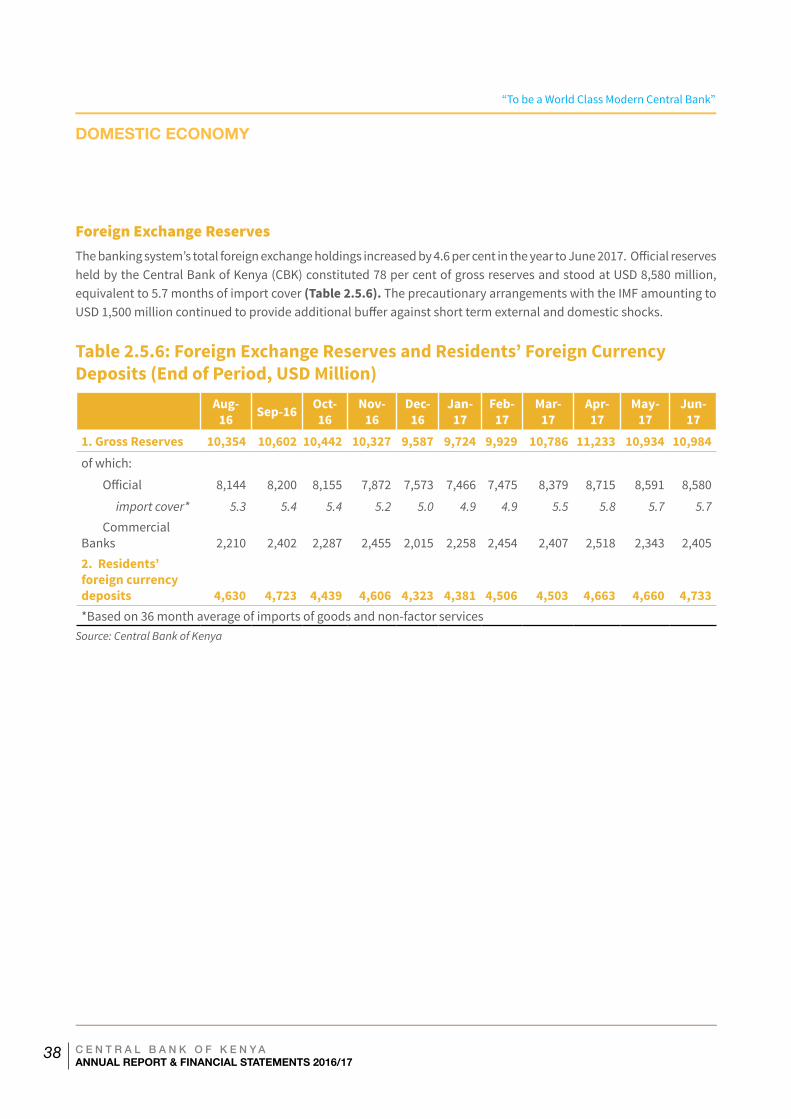
“To be a World Class Modern Central Bank”
C E N T R A L B A N K O F K E N Y AANNUAL REPORT & FINANCIAL STATEMENTS 2016/17
38
Foreign Exchange ReservesThe banking system’s total foreign exchange holdings increased by 4.6 per cent in the year to June 2017. Official reserves held by the Central Bank of Kenya (CBK) constituted 78 per cent of gross reserves and stood at USD 8,580 million, equivalent to 5.7 months of import cover (Table 2.5.6). The precautionary arrangements with the IMF amounting to USD 1,500 million continued to provide additional buffer against short term external and domestic shocks.
Table 2.5.6: Foreign Exchange Reserves and Residents’ Foreign Currency Deposits (End of Period, USD Million)
Aug-
16 Sep-16 Oct-16
Nov-16
Dec-16
Jan-17
Feb-17
Mar-17
Apr-17
May-17
Jun-17
1. Gross Reserves 10,354 10,602 10,442 10,327 9,587 9,724 9,929 10,786 11,233 10,934 10,984of which:
Official 8,144 8,200 8,155 7,872 7,573 7,466 7,475 8,379 8,715 8,591 8,580
import cover* 5.3 5.4 5.4 5.2 5.0 4.9 4.9 5.5 5.8 5.7 5.7
Commercial Banks 2,210 2,402 2,287 2,455 2,015 2,258 2,454 2,407 2,518 2,343 2,4052. Residents’ foreign currency deposits 4,630 4,723 4,439 4,606 4,323 4,381 4,506 4,503 4,663 4,660 4,733*Based on 36 month average of imports of goods and non-factor services
Source: Central Bank of Kenya
DOMESTIC ECONOMY
“To be a World Class Modern Central Bank”
C E N T R A L B A N K O F K E N Y AANNUAL REPORT & FINANCIAL STATEMENTS 2016/17
39
3.0 CENTRAL BANK OPERATIONS
39 C E N T R A L B A N K O F K E N Y AANNUAL REPORT & FINANCIAL STATEMENTS 2016/17
“To be a World Class Modern Central Bank”
C E N T R A L B A N K O F K E N Y AANNUAL REPORT & FINANCIAL STATEMENTS 2016/17
40
The Central Bank of Kenya conducted monetary policy focused on achieving and maintaining stability in the general level of prices in the economy. In this regard, monetary policy aimed to achieve the inflation target of 5.0 per cent set by the Cabinet Secretary at The National Treasury, during fiscal year 2016/17.
CENTRAL BANK OPERATIONS
In the first half of the fiscal year 2016/17 the Monetary Policy Committee (MPC) held three meetings in July, September, and November 2016. The MPC retained the CBR at 10.5 per cent in the July 2016 meeting given moderate inflationary pressures, but observed that the effects of fuel tax increases in the same month was expected to exert temporary upward pressure on consumer prices. The month on month inflation had risen to 6.4 per cent in July 2016 from 5.8 per cent in June 2016 and 5.0 per cent in May 2016, respectively. The foreign exchange market had remained stable, reflecting a narrower current account deficit due to a lower import bill, improved tea and horticulture exports, and stronger diaspora remittances. In the September 2016 meeting, the MPC eased the policy rate (CBR) to 10.0 per cent on the back of favorable inflation outlook in the short term and persistent slowdown in private sector credit growth. In the subsequent meeting of November 2016, the Monetary Policy Committee retained the CBR at 10.0 per cent. Overall inflation stabilized at 6.4 per cent in December 2016 from a high of 6.5 per cent and 6.7 per cent in the months of October 2016 and November 2016, respectively. The marginal decline in December was due in part to the waning effect of the excise tax implemented in December 2015 and improvement in the current account due to lower imports of petroleum products, machinery and transport equipment. In the second half of fiscal year 2016/17 the MPC retained the CBR at 10.0 per cent to continue anchoring inflation expectations. While observing that inflation was expected to remain within the Government target range in the short term, the Committee at the January 2017 meeting noted increased uncertainties with regard to the prevailing drought conditions and risks in the global markets. Furthermore, the Committee observed that available data was inconclusive for assessing the impact of the capping of interest rates that came into effect in September 2016. Underscoring the impact of the interest rate capping law on the banking sector, the MPC noted banks were geared towards reviewing their business models aimed at enhancing the resilience of their operations in the new environment. In March 2017 meeting, the MPC noted onset of inflationary pressures due to delayed long rains that resulted in shortage of key basic food items.
The month on month inflation rose to a high of 11.7 per cent in May from 10.3 per cent in March 2017, on account of the severe drought conditions. Nevertheless, onset of the long rains and interventions by the Government provided some relief resulting in overall inflation turning around to 9.2 per cent in June 2017, supported by a fall in the prices of key food items. In a complementary role, the foreign exchange market had stabilized despite uncertainties in the global economy, particularly with regard to the direction of U.S. economic and trade policies, normalization of monetary policies in the advanced economies and the Brexit outcome.
3.1 MONETARY POLICY MANAGEMENT
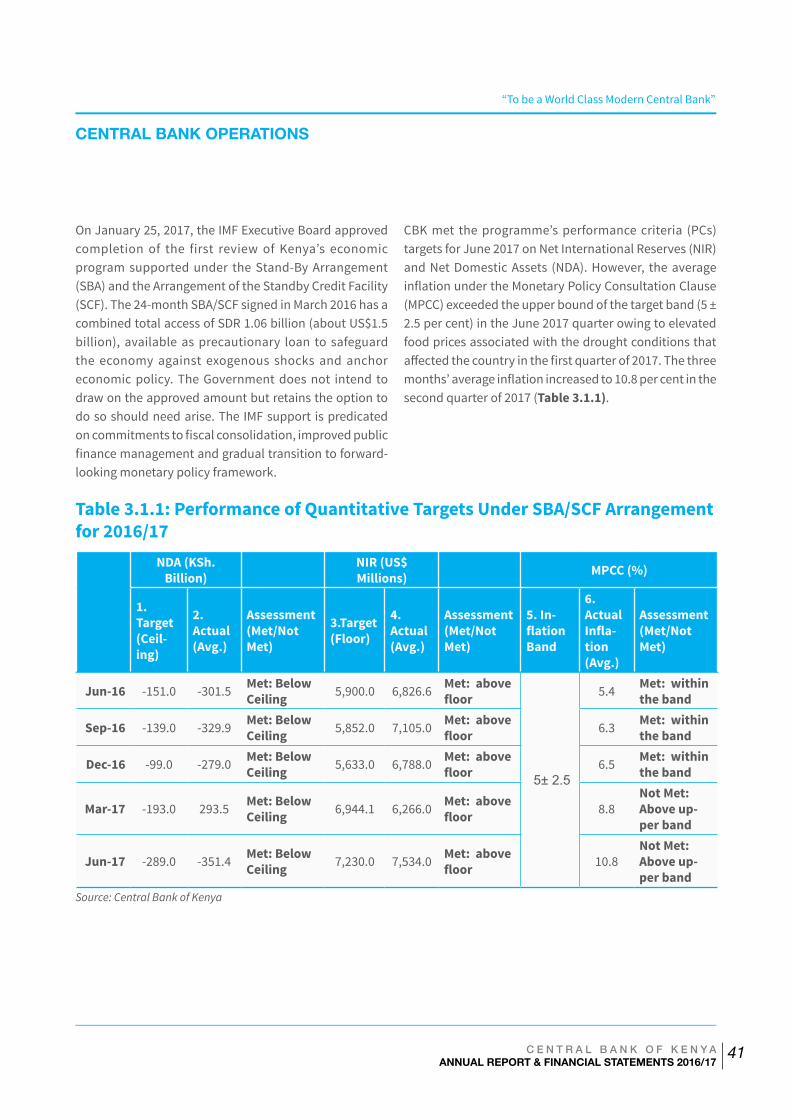
“To be a World Class Modern Central Bank”
C E N T R A L B A N K O F K E N Y AANNUAL REPORT & FINANCIAL STATEMENTS 2016/17
41
CENTRAL BANK OPERATIONS
On January 25, 2017, the IMF Executive Board approved completion of the first review of Kenya’s economic program supported under the Stand-By Arrangement (SBA) and the Arrangement of the Standby Credit Facility (SCF). The 24-month SBA/SCF signed in March 2016 has a combined total access of SDR 1.06 billion (about US$1.5 billion), available as precautionary loan to safeguard the economy against exogenous shocks and anchor economic policy. The Government does not intend to draw on the approved amount but retains the option to do so should need arise. The IMF support is predicated on commitments to fiscal consolidation, improved public finance management and gradual transition to forward-looking monetary policy framework.
CBK met the programme’s performance criteria (PCs) targets for June 2017 on Net International Reserves (NIR) and Net Domestic Assets (NDA). However, the average inflation under the Monetary Policy Consultation Clause (MPCC) exceeded the upper bound of the target band (5 ± 2.5 per cent) in the June 2017 quarter owing to elevated food prices associated with the drought conditions that affected the country in the first quarter of 2017. The three months’ average inflation increased to 10.8 per cent in the second quarter of 2017 (Table 3.1.1).
Table 3.1.1: Performance of Quantitative Targets Under SBA/SCF Arrangement for 2016/17
NDA (KSh. Billion) NIR (US$
Millions) MPCC (%)
1. Target (Ceil-ing)
2. Actual (Avg.)
Assessment (Met/Not Met)
3.Target (Floor)
4. Actual (Avg.)
Assessment (Met/Not Met)
5. In-flation Band
6. Actual Infla-tion (Avg.)
Assessment (Met/Not Met)
Jun-16 -151.0 -301.5 Met: Below Ceiling 5,900.0 6,826.6 Met: above
floor
5± 2.5
5.4 Met: within the band
Sep-16 -139.0 -329.9 Met: Below Ceiling 5,852.0 7,105.0 Met: above
floor 6.3 Met: within the band
Dec-16 -99.0 -279.0 Met: Below Ceiling 5,633.0 6,788.0 Met: above
floor 6.5 Met: within the band
Mar-17 -193.0 293.5 Met: Below Ceiling 6,944.1 6,266.0 Met: above
floor 8.8Not Met: Above up-per band
Jun-17 -289.0 -351.4 Met: Below Ceiling 7,230.0 7,534.0 Met: above
floor 10.8Not Met: Above up-per band
Source: Central Bank of Kenya
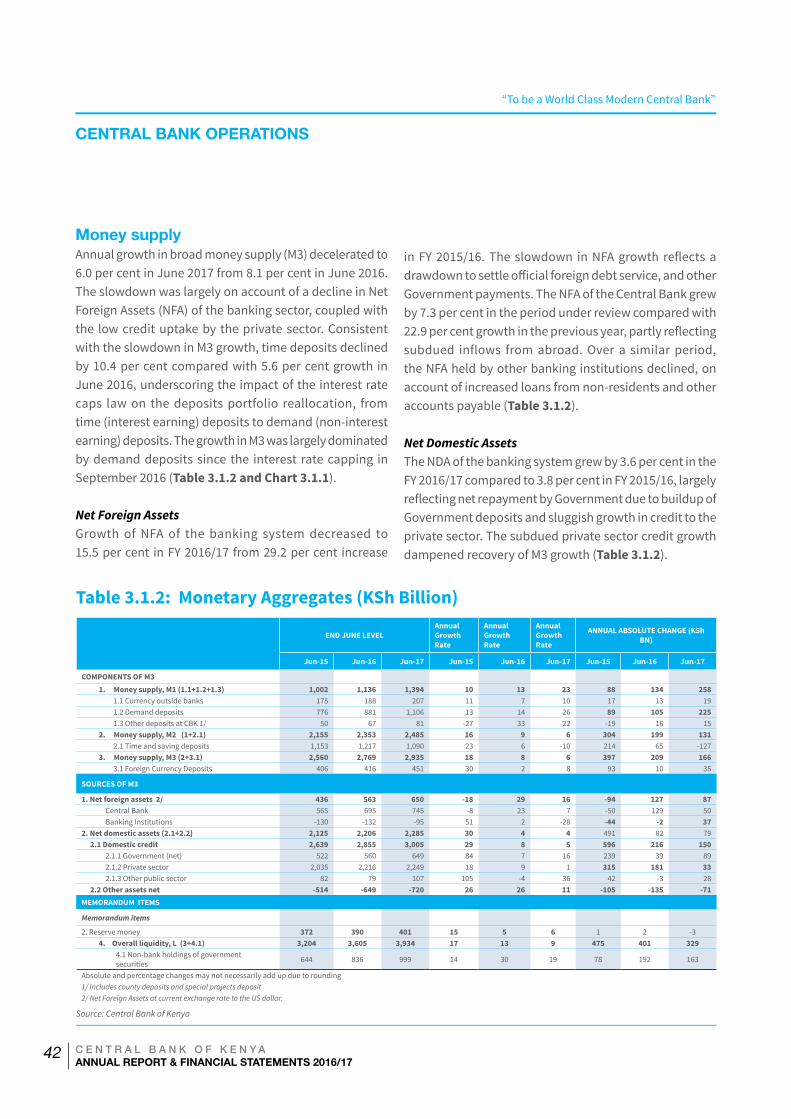
“To be a World Class Modern Central Bank”
C E N T R A L B A N K O F K E N Y AANNUAL REPORT & FINANCIAL STATEMENTS 2016/17
42
Money supplyAnnual growth in broad money supply (M3) decelerated to 6.0 per cent in June 2017 from 8.1 per cent in June 2016. The slowdown was largely on account of a decline in Net Foreign Assets (NFA) of the banking sector, coupled with the low credit uptake by the private sector. Consistent with the slowdown in M3 growth, time deposits declined by 10.4 per cent compared with 5.6 per cent growth in June 2016, underscoring the impact of the interest rate caps law on the deposits portfolio reallocation, from time (interest earning) deposits to demand (non-interest earning) deposits. The growth in M3 was largely dominated by demand deposits since the interest rate capping in September 2016 (Table 3.1.2 and Chart 3.1.1).
Net Foreign AssetsGrowth of NFA of the banking system decreased to 15.5 per cent in FY 2016/17 from 29.2 per cent increase
in FY 2015/16. The slowdown in NFA growth reflects a drawdown to settle official foreign debt service, and other Government payments. The NFA of the Central Bank grew by 7.3 per cent in the period under review compared with 22.9 per cent growth in the previous year, partly reflecting subdued inflows from abroad. Over a similar period, the NFA held by other banking institutions declined, on account of increased loans from non-residents and other accounts payable (Table 3.1.2).
Net Domestic AssetsThe NDA of the banking system grew by 3.6 per cent in the FY 2016/17 compared to 3.8 per cent in FY 2015/16, largely reflecting net repayment by Government due to buildup of Government deposits and sluggish growth in credit to the private sector. The subdued private sector credit growth dampened recovery of M3 growth (Table 3.1.2).
Table 3.1.2: Monetary Aggregates (KSh Billion)
END JUNE LEVEL
Annual Growth Rate
Annual Growth Rate
Annual Growth Rate
ANNUAL ABSOLUTE CHANGE (KSh BN)
Jun-15 Jun-16 Jun-17 Jun-15 Jun-16 Jun-17 Jun-15 Jun-16 Jun-17
COMPONENTS OF M3 1. Money supply, M1 (1.1+1.2+1.3) 1,002 1,136 1,394 10 13 23 88 134 258
1.1 Currency outside banks 175 188 207 11 7 10 17 13 191.2 Demand deposits 776 881 1,106 13 14 26 89 105 2251.3 Other deposits at CBK 1/ 50 67 81 -27 33 22 -19 16 15
2. Money supply, M2 (1+2.1) 2,155 2,353 2,485 16 9 6 304 199 1312.1 Time and saving deposits 1,153 1,217 1,090 23 6 -10 214 65 -127
3. Money supply, M3 (2+3.1) 2,560 2,769 2,935 18 8 6 397 209 1663.1 Foreign Currency Deposits 406 416 451 30 2 8 93 10 35
SOURCES OF M3 1. Net foreign assets 2/ 436 563 650 -18 29 16 -94 127 87
Central Bank 565 695 745 -8 23 7 -50 129 50Banking Institutions -130 -132 -95 51 2 -28 -44 -2 37
2. Net domestic assets (2.1+2.2) 2,125 2,206 2,285 30 4 4 491 82 792.1 Domestic credit 2,639 2,855 3,005 29 8 5 596 216 150
2.1.1 Government (net) 522 560 649 84 7 16 239 39 892.1.2 Private sector 2,035 2,216 2,249 18 9 1 315 181 332.1.3 Other public sector 82 79 107 105 -4 36 42 -3 28
2.2 Other assets net -514 -649 -720 26 26 11 -105 -135 -71MEMORANDUM ITEMS Memorandum items 2. Reserve money 372 390 401 15 5 6 1 2 -3
4. Overall liquidity, L (3+4.1) 3,204 3,605 3,934 17 13 9 475 401 3294.1 Non-bank holdings of government securities 644 836 999 14 30 19 78 192 163
Absolute and percentage changes may not necessarily add up due to rounding1/ Includes county deposits and special projects deposit2/ Net Foreign Assets at current exchange rate to the US dollar.
Source: Central Bank of Kenya
CENTRAL BANK OPERATIONS
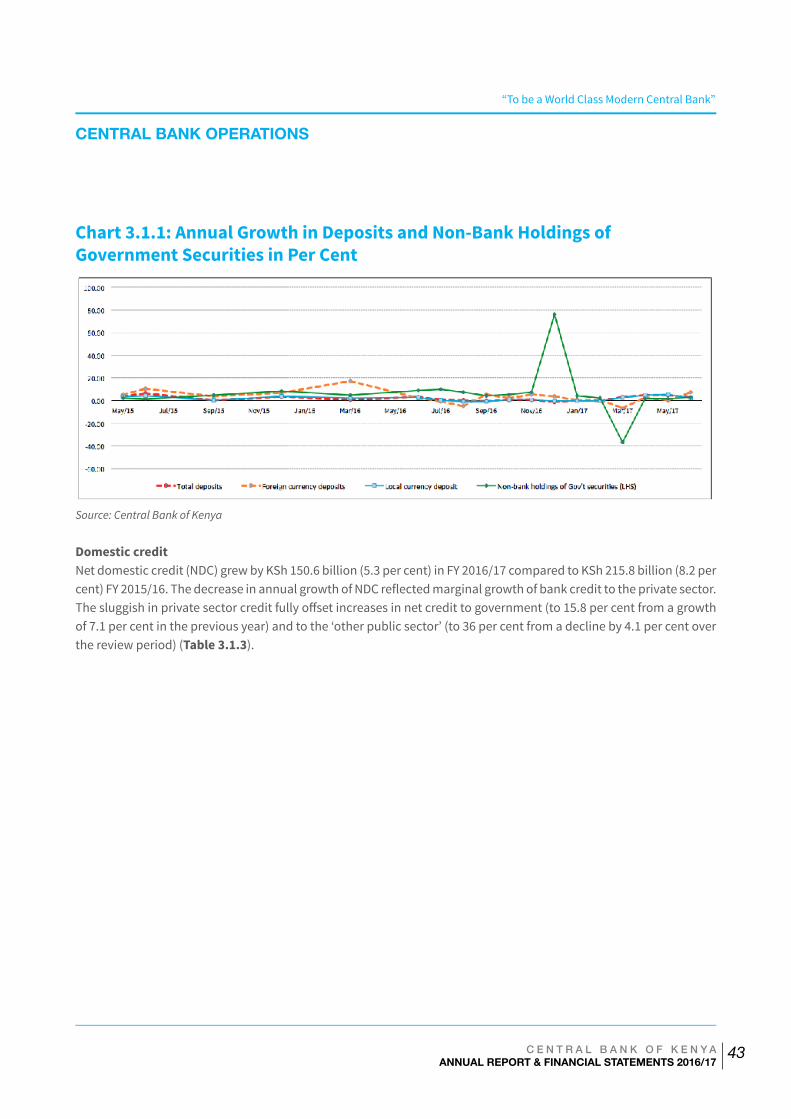
“To be a World Class Modern Central Bank”
C E N T R A L B A N K O F K E N Y AANNUAL REPORT & FINANCIAL STATEMENTS 2016/17
43
Chart 3.1.1: Annual Growth in Deposits and Non-Bank Holdings of Government Securities in Per Cent
Source: Central Bank of Kenya
Domestic creditNet domestic credit (NDC) grew by KSh 150.6 billion (5.3 per cent) in FY 2016/17 compared to KSh 215.8 billion (8.2 per cent) FY 2015/16. The decrease in annual growth of NDC reflected marginal growth of bank credit to the private sector. The sluggish in private sector credit fully offset increases in net credit to government (to 15.8 per cent from a growth of 7.1 per cent in the previous year) and to the ‘other public sector’ (to 36 per cent from a decline by 4.1 per cent over the review period) (Table 3.1.3).
CENTRAL BANK OPERATIONS
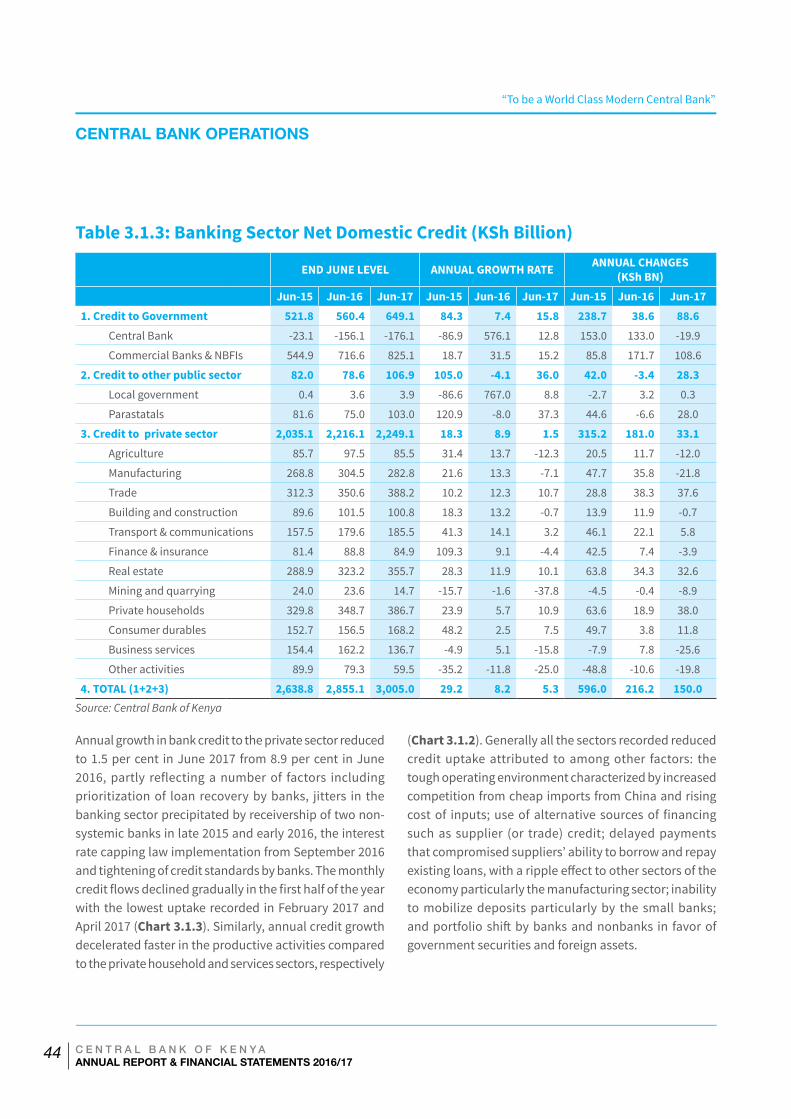
“To be a World Class Modern Central Bank”
C E N T R A L B A N K O F K E N Y AANNUAL REPORT & FINANCIAL STATEMENTS 2016/17
44
Table 3.1.3: Banking Sector Net Domestic Credit (KSh Billion) END JUNE LEVEL ANNUAL GROWTH RATE ANNUAL CHANGES
(KSh BN) Jun-15 Jun-16 Jun-17 Jun-15 Jun-16 Jun-17 Jun-15 Jun-16 Jun-17
1. Credit to Government 521.8 560.4 649.1 84.3 7.4 15.8 238.7 38.6 88.6Central Bank -23.1 -156.1 -176.1 -86.9 576.1 12.8 153.0 133.0 -19.9
Commercial Banks & NBFIs 544.9 716.6 825.1 18.7 31.5 15.2 85.8 171.7 108.6
2. Credit to other public sector 82.0 78.6 106.9 105.0 -4.1 36.0 42.0 -3.4 28.3Local government 0.4 3.6 3.9 -86.6 767.0 8.8 -2.7 3.2 0.3
Parastatals 81.6 75.0 103.0 120.9 -8.0 37.3 44.6 -6.6 28.0
3. Credit to private sector 2,035.1 2,216.1 2,249.1 18.3 8.9 1.5 315.2 181.0 33.1Agriculture 85.7 97.5 85.5 31.4 13.7 -12.3 20.5 11.7 -12.0
Manufacturing 268.8 304.5 282.8 21.6 13.3 -7.1 47.7 35.8 -21.8
Trade 312.3 350.6 388.2 10.2 12.3 10.7 28.8 38.3 37.6
Building and construction 89.6 101.5 100.8 18.3 13.2 -0.7 13.9 11.9 -0.7
Transport & communications 157.5 179.6 185.5 41.3 14.1 3.2 46.1 22.1 5.8
Finance & insurance 81.4 88.8 84.9 109.3 9.1 -4.4 42.5 7.4 -3.9
Real estate 288.9 323.2 355.7 28.3 11.9 10.1 63.8 34.3 32.6
Mining and quarrying 24.0 23.6 14.7 -15.7 -1.6 -37.8 -4.5 -0.4 -8.9
Private households 329.8 348.7 386.7 23.9 5.7 10.9 63.6 18.9 38.0
Consumer durables 152.7 156.5 168.2 48.2 2.5 7.5 49.7 3.8 11.8
Business services 154.4 162.2 136.7 -4.9 5.1 -15.8 -7.9 7.8 -25.6
Other activities 89.9 79.3 59.5 -35.2 -11.8 -25.0 -48.8 -10.6 -19.8
4. TOTAL (1+2+3) 2,638.8 2,855.1 3,005.0 29.2 8.2 5.3 596.0 216.2 150.0Source: Central Bank of Kenya
Annual growth in bank credit to the private sector reduced to 1.5 per cent in June 2017 from 8.9 per cent in June 2016, partly reflecting a number of factors including prioritization of loan recovery by banks, jitters in the banking sector precipitated by receivership of two non-systemic banks in late 2015 and early 2016, the interest rate capping law implementation from September 2016 and tightening of credit standards by banks. The monthly credit flows declined gradually in the first half of the year with the lowest uptake recorded in February 2017 and April 2017 (Chart 3.1.3). Similarly, annual credit growth decelerated faster in the productive activities compared to the private household and services sectors, respectively
(Chart 3.1.2). Generally all the sectors recorded reduced credit uptake attributed to among other factors: the tough operating environment characterized by increased competition from cheap imports from China and rising cost of inputs; use of alternative sources of financing such as supplier (or trade) credit; delayed payments that compromised suppliers’ ability to borrow and repay existing loans, with a ripple effect to other sectors of the economy particularly the manufacturing sector; inability to mobilize deposits particularly by the small banks; and portfolio shift by banks and nonbanks in favor of government securities and foreign assets.
CENTRAL BANK OPERATIONS
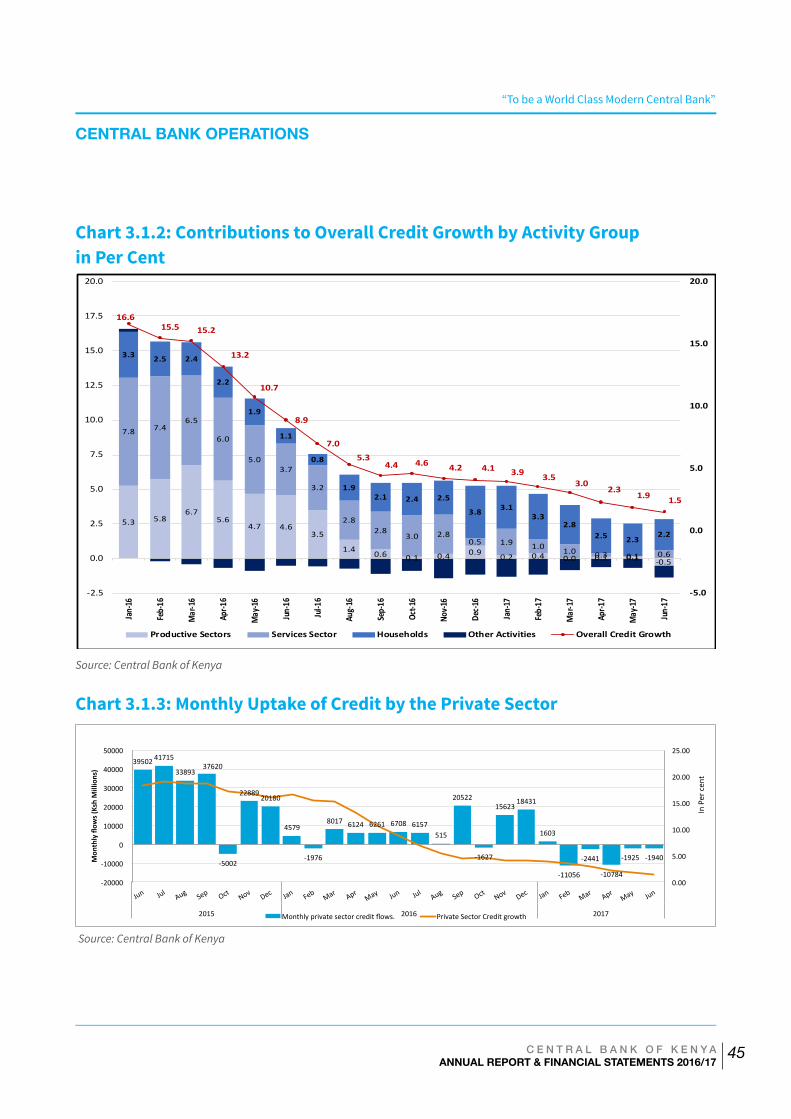
“To be a World Class Modern Central Bank”
C E N T R A L B A N K O F K E N Y AANNUAL REPORT & FINANCIAL STATEMENTS 2016/17
45
5.3 5.86.7
5.64.7 4.6
3.5
1.4 0.6 0.1 0.4 0.9 0.2 0.4 0.0 0.1 0.1 -0.5
7.8 7.46.5
6.0
5.03.7
3.2
2.82.8
3.0 2.80.5 1.9 1.0 1.0 0.3 0.1 0.6
3.3 2.5 2.4
2.2
1.9
1.1
0.8
1.92.1 2.4 2.5
3.8 3.13.3
2.82.5 2.3
2.2
16.615.5 15.2
13.2
10.7
8.9
7.05.3
4.4 4.6 4.2 4.1 3.9 3.53.0
2.31.9 1.5
-5.0
0.0
5.0
10.0
15.0
20.0
-2.5
0.0
2.5
5.0
7.5
10.0
12.5
15.0
17.5
20.0
Jan-
16
Feb-
16
Mar
-16
Apr-1
6
May
-16
Jun-
16
Jul-1
6
Aug-
16
Sep-
16
Oct-1
6
Nov-1
6
Dec-1
6
Jan-
17
Feb-
17
Mar
-17
Apr-1
7
May
-17
Jun-
17
Productive Sectors Services Sector Households Other Activities Overall Credit Growth
Chart 3.1.2: Contributions to Overall Credit Growth by Activity Group in Per Cent
Source: Central Bank of Kenya
Chart 3.1.3: Monthly Uptake of Credit by the Private Sector
39502 41715
33893 37620
-‐5002
22889 20180
4579
-‐1976
8017 6124 6261 6708 6157 515
20522
-‐1627
15623 18431
1603
-‐11056
-‐2441
-‐10784
-‐1925 -‐1940
0.00
5.00
10.00
15.00
20.00
25.00
-‐20000
-‐10000
0
10000
20000
30000
40000
50000
Jun Jul Aug
Sep
Oct
Nov
Dec
Jan
Feb
Mar Apr
May Jun
Jul Aug
Sep
Oct
Nov
Dec
Jan
Feb
Mar Apr
May Jun
2015 2016 2017
Mon
thly flow
s (Ksh Millions)
Monthly private sector credit flows. Private Sector Credit growth
In Per cen
t
Source: Central Bank of Kenya
CENTRAL BANK OPERATIONS
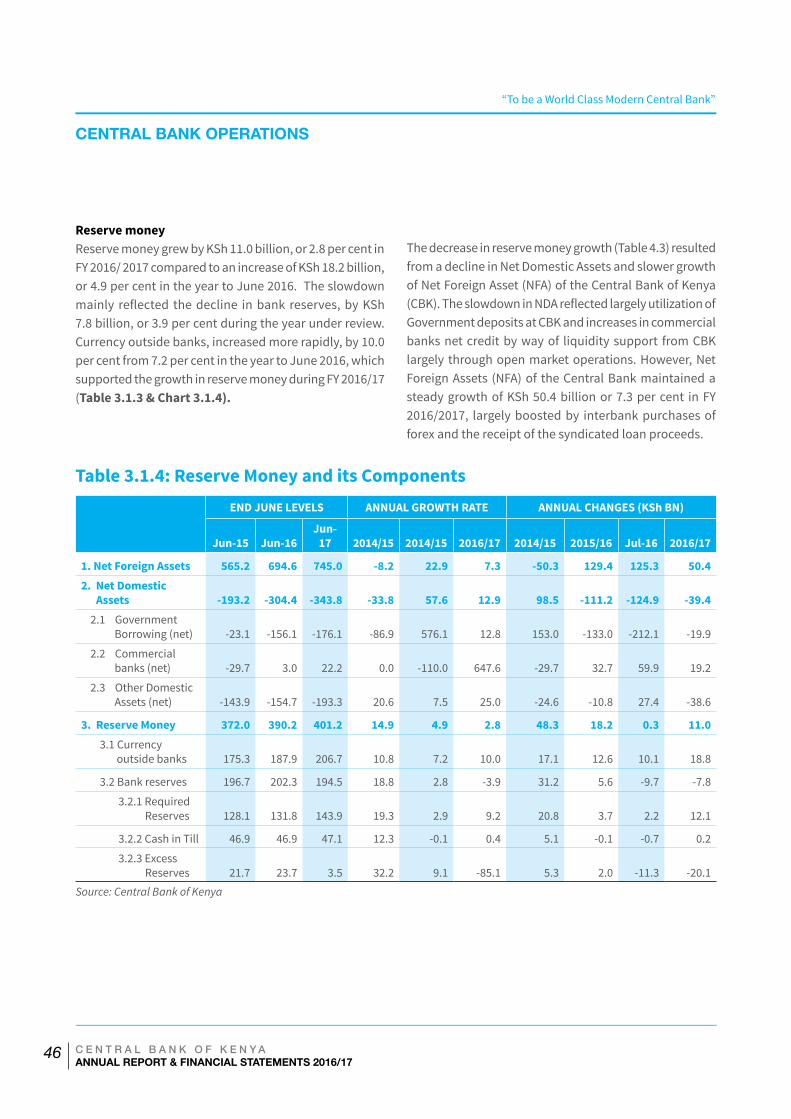
“To be a World Class Modern Central Bank”
C E N T R A L B A N K O F K E N Y AANNUAL REPORT & FINANCIAL STATEMENTS 2016/17
46
Reserve moneyReserve money grew by KSh 11.0 billion, or 2.8 per cent in FY 2016/ 2017 compared to an increase of KSh 18.2 billion, or 4.9 per cent in the year to June 2016. The slowdown mainly reflected the decline in bank reserves, by KSh 7.8 billion, or 3.9 per cent during the year under review. Currency outside banks, increased more rapidly, by 10.0 per cent from 7.2 per cent in the year to June 2016, which supported the growth in reserve money during FY 2016/17 (Table 3.1.3 & Chart 3.1.4).
The decrease in reserve money growth (Table 4.3) resulted from a decline in Net Domestic Assets and slower growth of Net Foreign Asset (NFA) of the Central Bank of Kenya (CBK). The slowdown in NDA reflected largely utilization of Government deposits at CBK and increases in commercial banks net credit by way of liquidity support from CBK largely through open market operations. However, Net Foreign Assets (NFA) of the Central Bank maintained a steady growth of KSh 50.4 billion or 7.3 per cent in FY 2016/2017, largely boosted by interbank purchases of forex and the receipt of the syndicated loan proceeds.
Table 3.1.4: Reserve Money and its Components
END JUNE LEVELS ANNUAL GROWTH RATE ANNUAL CHANGES (KSh BN)
Jun-15 Jun-16Jun-
17 2014/15 2014/15 2016/17 2014/15 2015/16 Jul-16 2016/17
1. Net Foreign Assets 565.2 694.6 745.0 -8.2 22.9 7.3 -50.3 129.4 125.3 50.42. Net Domestic Assets -193.2 -304.4 -343.8 -33.8 57.6 12.9 98.5 -111.2 -124.9 -39.4
2.1 Government Borrowing (net) -23.1 -156.1 -176.1 -86.9 576.1 12.8 153.0 -133.0 -212.1 -19.9
2.2 Commercial banks (net) -29.7 3.0 22.2 0.0 -110.0 647.6 -29.7 32.7 59.9 19.2
2.3 Other Domestic Assets (net) -143.9 -154.7 -193.3 20.6 7.5 25.0 -24.6 -10.8 27.4 -38.6
3. Reserve Money 372.0 390.2 401.2 14.9 4.9 2.8 48.3 18.2 0.3 11.03.1 Currency outside banks 175.3 187.9 206.7 10.8 7.2 10.0 17.1 12.6 10.1 18.8
3.2 Bank reserves 196.7 202.3 194.5 18.8 2.8 -3.9 31.2 5.6 -9.7 -7.8
3.2.1 Required Reserves 128.1 131.8 143.9 19.3 2.9 9.2 20.8 3.7 2.2 12.1
3.2.2 Cash in Till 46.9 46.9 47.1 12.3 -0.1 0.4 5.1 -0.1 -0.7 0.2
3.2.3 Excess Reserves 21.7 23.7 3.5 32.2 9.1 -85.1 5.3 2.0 -11.3 -20.1
Source: Central Bank of Kenya
CENTRAL BANK OPERATIONS
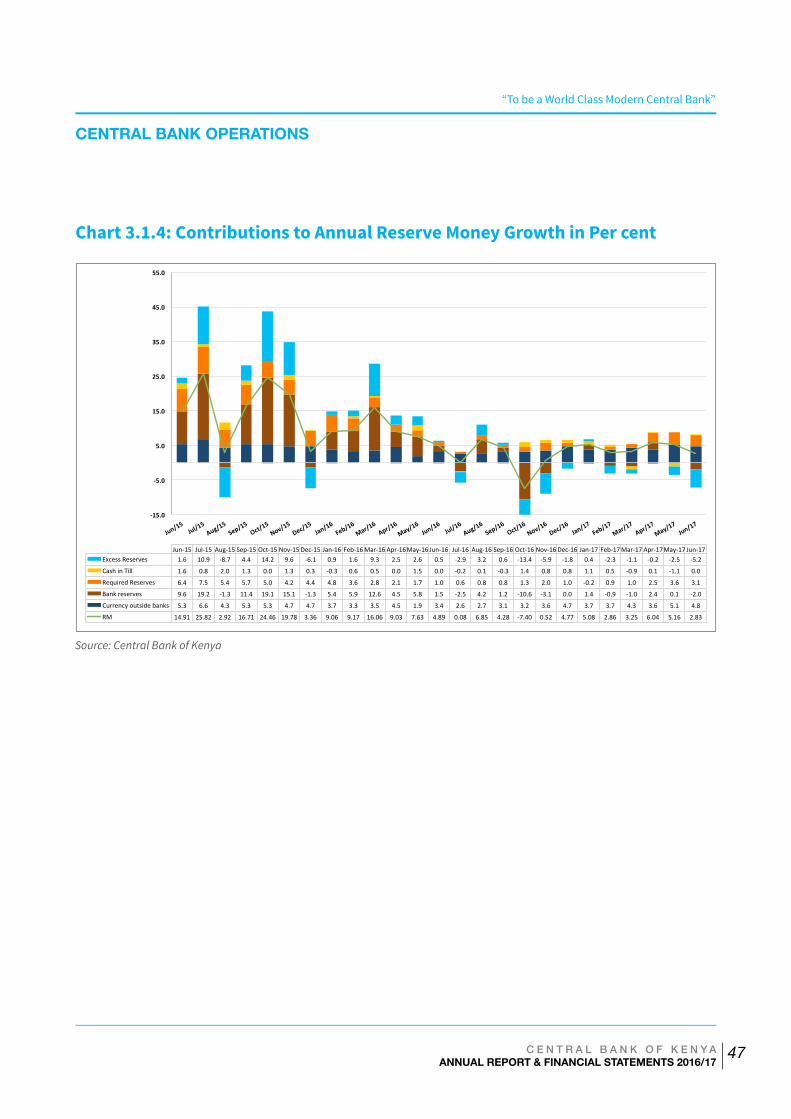
“To be a World Class Modern Central Bank”
C E N T R A L B A N K O F K E N Y AANNUAL REPORT & FINANCIAL STATEMENTS 2016/17
47
Source: Central Bank of Kenya
CENTRAL BANK OPERATIONS
Chart 3.1.4: Contributions to Annual Reserve Money Growth in Per cent
-‐15.0
-‐5.0
5.0
15.0
25.0
35.0
45.0
55.0
Jun/15
Jul/
15 Aug
/15 Sep
/15 Oct
/15 Nov
/15 Dec
/15 Jan
/16 Feb
/16
Mar/1
6 Apr
/16
May/1
6 Jun
/16 Jul/
16 Aug
/16 Sep
/16 Oct
/16 Nov
/16 Dec
/16 Jan
/17 Feb
/17
Mar/1
7 Apr
/17
May/1
7 Jun
/17
Axis Title
Jun-‐15 Jul-‐15 Aug-‐15 Sep-‐15 Oct-‐15 Nov-‐15 Dec-‐15 Jan-‐16 Feb-‐16 Mar-‐16 Apr-‐16 May-‐16 Jun-‐16 Jul-‐16 Aug-‐16 Sep-‐16 Oct-‐16 Nov-‐16 Dec-‐16 Jan-‐17 Feb-‐17 Mar-‐17 Apr-‐17 May-‐17 Jun-‐17 Excess Reserves 1.6 10.9 -‐8.7 4.4 14.2 9.6 -‐6.1 0.9 1.6 9.3 2.5 2.6 0.5 -‐2.9 3.2 0.6 -‐13.4 -‐5.9 -‐1.8 0.4 -‐2.3 -‐1.1 -‐0.2 -‐2.5 -‐5.2
Cash in Till 1.6 0.8 2.0 1.3 0.0 1.3 0.3 -‐0.3 0.6 0.5 0.0 1.5 0.0 -‐0.2 0.1 -‐0.3 1.4 0.8 0.8 1.1 0.5 -‐0.9 0.1 -‐1.1 0.0
Required Reserves 6.4 7.5 5.4 5.7 5.0 4.2 4.4 4.8 3.6 2.8 2.1 1.7 1.0 0.6 0.8 0.8 1.3 2.0 1.0 -‐0.2 0.9 1.0 2.5 3.6 3.1
Bank reserves 9.6 19.2 -‐1.3 11.4 19.1 15.1 -‐1.3 5.4 5.9 12.6 4.5 5.8 1.5 -‐2.5 4.2 1.2 -‐10.6 -‐3.1 0.0 1.4 -‐0.9 -‐1.0 2.4 0.1 -‐2.0
Currency outside banks 5.3 6.6 4.3 5.3 5.3 4.7 4.7 3.7 3.3 3.5 4.5 1.9 3.4 2.6 2.7 3.1 3.2 3.6 4.7 3.7 3.7 4.3 3.6 5.1 4.8
RM 14.91 25.82 2.92 16.71 24.46 19.78 3.36 9.06 9.17 16.06 9.03 7.63 4.89 0.08 6.85 4.28 -‐7.40 0.52 4.77 5.08 2.86 3.25 6.04 5.16 2.83
“To be a World Class Modern Central Bank”
C E N T R A L B A N K O F K E N Y AANNUAL REPORT & FINANCIAL STATEMENTS 2016/17
48
3.2 INTEREST RATES
OverviewA key development during the year was the enactment of legislation setting the maximum lending rate at no more than four per cent above the Central Bank base rate, and the minimum interest rate granted on a deposit held in interest earning account to at least seventy per cent of the same rate. Consequently, the CBK set the Central Bank Rate (CBR) as the base rate. It is too early to confirm the impact of the interest caps. However, the move undermines the independence of the Central Bank of Kenya, as anchored in Article 231 of the Constitution, which stipulates that the Bank shall not be under the direction or control of any person or authority in the exercise of its powers or in the performance of its functions. In the execution of its core mandate of formulating and implementing monetary policy directed at achieving and maintaining stability in the general level of prices, the Central Bank uses the Central Bank Rate (CBR) to achieve monetary policy objectives.
The interest rate capping law is likely to complicate the conduct and implementation of monetary policy, for example, a decrease in the CBR to stimulate the economy will require the banks to lower their lending rates. In the process, the banks will be forced to avoid lending to perceived risky borrowers and the resulting reduced lending will have the reverse of the intended effect. An ongoing study by the Central Bank will reveal the impact of the law but the emerging evidence shows that it will have negative consequences for both borrowers and lenders and eventually for the whole economy.
Central Bank RateThe MPC reduced the Central Bank Rate, the rate that signals the stance of monetary policy, to 10.0 per cent in September 2016 from 10.5 per cent since May 2016, following stability of domestic prices, improved current account position and resilient economic growth on the back of improved weather conditions in the first two quarters of 2016.
Kenya Bankers Reference rate (KBRR)During the MPC meeting held on July 25, 2016 the committee revised the Kenya Bankers Reference rate to 9.87 per cent from 8.54 per cent maintained since January 2015. This was consistent with the increase in the CBR rate to curb inflationary pressures arising from the pass through effects of the exchange rate. At the January 2017 meeting, the MPC considered the Kenya Banks’ Reference Rate (KBRR), which was introduced to provide a transparent credit pricing framework. In view of the adoption of the new law capping interest rates in September 2016 the CBK suspended the KBRR framework.
Short Term RatesShort term interest rates depicted mixed performance in the year to June 2017 (Table 3.2.1). The weighted average interbank interest rate remained stable at 3.99 per cent in the FY 2016/17 per cent compared with 4.56 per cent in FY 2015/16, reflecting improved liquidity conditions in the interbank market. However, the gap between the interbank rate and CBR continue to underscore the segmentation of the interbank market which was amplified by the jitters in the banking sector precipitated by receivership of two non-systemic banks in October 2015 and April 2016, respectively. The reverse repo rate was stable at 10.05 per cent in the FY 2016/17 compared with 10.59 per cent in the previous fiscal year. The 91-day Treasury bill rate, which largely reflects the government’s borrowing profile rose to 8.42 per cent in the year to June 2017 from 7.25 per cent in the year to June 2016, while the 182-day Treasury bill rate increased to 10.38 per cent from 9.56 per cent (Table 3.2.1).
CENTRAL BANK OPERATIONS
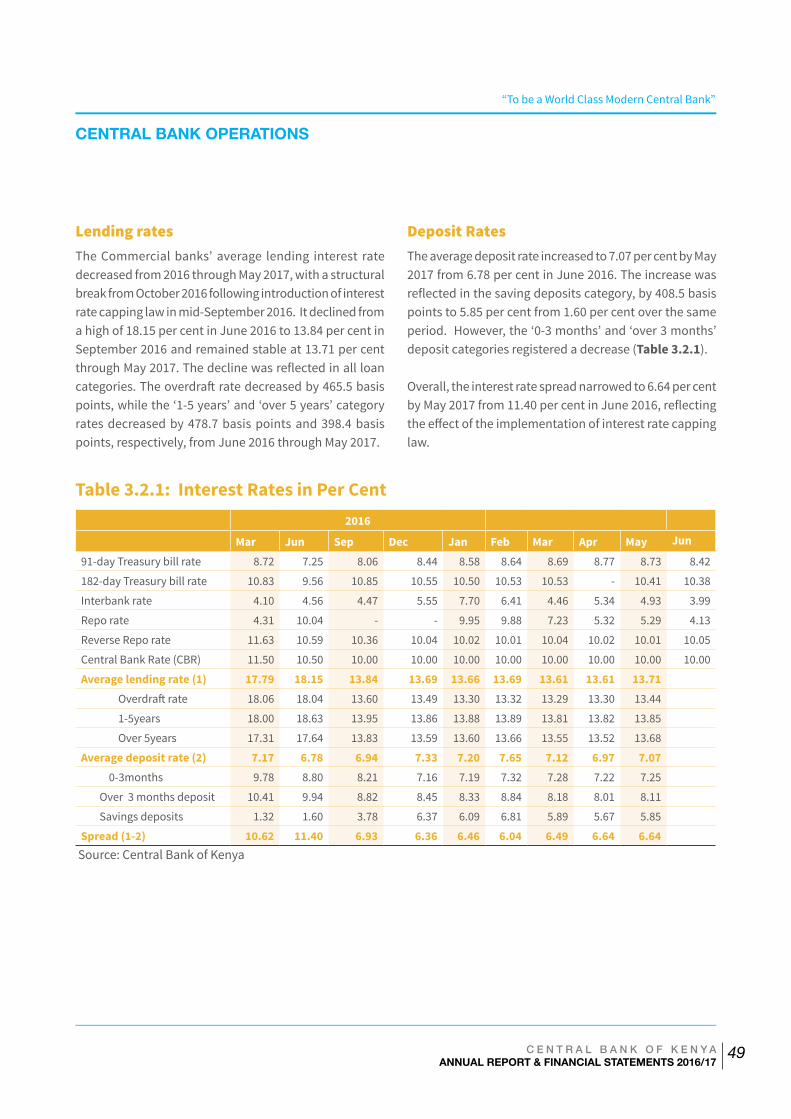
“To be a World Class Modern Central Bank”
C E N T R A L B A N K O F K E N Y AANNUAL REPORT & FINANCIAL STATEMENTS 2016/17
49
Lending ratesThe Commercial banks’ average lending interest rate decreased from 2016 through May 2017, with a structural break from October 2016 following introduction of interest rate capping law in mid-September 2016. It declined from a high of 18.15 per cent in June 2016 to 13.84 per cent in September 2016 and remained stable at 13.71 per cent through May 2017. The decline was reflected in all loan categories. The overdraft rate decreased by 465.5 basis points, while the ‘1-5 years’ and ‘over 5 years’ category rates decreased by 478.7 basis points and 398.4 basis points, respectively, from June 2016 through May 2017.
Deposit RatesThe average deposit rate increased to 7.07 per cent by May 2017 from 6.78 per cent in June 2016. The increase was reflected in the saving deposits category, by 408.5 basis points to 5.85 per cent from 1.60 per cent over the same period. However, the ‘0-3 months’ and ‘over 3 months’ deposit categories registered a decrease (Table 3.2.1).
Overall, the interest rate spread narrowed to 6.64 per cent by May 2017 from 11.40 per cent in June 2016, reflecting the effect of the implementation of interest rate capping law.
Table 3.2.1: Interest Rates in Per Cent 2016
Mar Jun Sep Dec Jan Feb Mar Apr May Jun
91-day Treasury bill rate 8.72 7.25 8.06 8.44 8.58 8.64 8.69 8.77 8.73 8.42
182-day Treasury bill rate 10.83 9.56 10.85 10.55 10.50 10.53 10.53 - 10.41 10.38
Interbank rate 4.10 4.56 4.47 5.55 7.70 6.41 4.46 5.34 4.93 3.99
Repo rate 4.31 10.04 - - 9.95 9.88 7.23 5.32 5.29 4.13
Reverse Repo rate 11.63 10.59 10.36 10.04 10.02 10.01 10.04 10.02 10.01 10.05
Central Bank Rate (CBR) 11.50 10.50 10.00 10.00 10.00 10.00 10.00 10.00 10.00 10.00
Average lending rate (1) 17.79 18.15 13.84 13.69 13.66 13.69 13.61 13.61 13.71Overdraft rate 18.06 18.04 13.60 13.49 13.30 13.32 13.29 13.30 13.44
1-5years 18.00 18.63 13.95 13.86 13.88 13.89 13.81 13.82 13.85
Over 5years 17.31 17.64 13.83 13.59 13.60 13.66 13.55 13.52 13.68
Average deposit rate (2) 7.17 6.78 6.94 7.33 7.20 7.65 7.12 6.97 7.070-3months 9.78 8.80 8.21 7.16 7.19 7.32 7.28 7.22 7.25
Over 3 months deposit 10.41 9.94 8.82 8.45 8.33 8.84 8.18 8.01 8.11
Savings deposits 1.32 1.60 3.78 6.37 6.09 6.81 5.89 5.67 5.85
Spread (1-2) 10.62 11.40 6.93 6.36 6.46 6.04 6.49 6.64 6.64 Source: Central Bank of Kenya
CENTRAL BANK OPERATIONS
“To be a World Class Modern Central Bank”
C E N T R A L B A N K O F K E N Y AANNUAL REPORT & FINANCIAL STATEMENTS 2016/17
50
TABLE 7.1: STATEMENT OF CENTRAL GOVERNMENT OPERATIONS (Ksh Billion)
Kenya’s foreign exchange market remained relatively stable despite short term global volatilities arising from uncertain economic and trade policies in the US and Brexit negotiations during the 2016/17 fiscal year. This stability was supported by a narrower current account deficit on account of lower import bill, enhanced flows from tea and horticultural export, recovery of the tourism industry and resilience of diaspora remittances over the review period.
The foreign exchange market remained relatively stable during FY 2016/17 supported by a generally narrowing current account deficit due to a lower import bill; and resilient inflows from exports of tea and horticulture, recovery in tourism, and diaspora remittances. Central Bank market operations mitigated exchange rate volatility following developments in international financial markets arising from US Fed rate hikes and geopolitical tensions.
Relative to internationally traded currencies, the Kenya Shilling strengthened against the Pound Sterling and the Euro by 14.3 per cent and 1.4 per cent, respectively, following general weakening of the two currencies on the international markets during the third and fourth quarters of FY 2016/2017. Against the US Dollar and the Japanese Yen, however, the shilling ended the financial year weaker by 0.4 per cent and 7.5 per cent respectively. The weakening of the Kenya Shilling against the US Dollar over the FY 2016/17 when compared to its performance during the FY 2015/16 was a reflection of a relatively strong US Dollar supported by positive US economic data in the second and third quarters of the year.
However, dynamics in the performance of the Kenya Shilling varied during the year with the shilling weakening in the second and third quarters of FY 2016/17, following strengthening of the US Dollar on the back of expectations of an increase in the US Federal Funds rate and the eventual increase of the rate in December 2016 and March 2017. However, during the fourth quarter of FY 2016/17 the shilling ended stronger against the US Dollar relative to the third quarter of FY 2016/17 on account of a weakening US Dollar arising from uncertainties regarding the direction of US economic and trade policies.
The weakening of the Kenya Shilling against the Pound Sterling and the Euro during the third and fourth quarters of 2017 was occasioned by the strengthening of the two currencies against the US Dollar during the first half of 2017 on account of positive sentiment surrounding the two currencies on the international market.
In the EAC region, the Kenya Shilling strengthened against all regional currencies based on economic fundamentals but weakened against the South African Rand (Table 3.3.1). The strengthening of the South African Rand was boosted by global demand for high yielding assets in the emerging markets and a rise in commodity prices that generally supported emerging market currencies especially during the third and fourth quarters of FY 2016/17.
CENTRAL BANK OPERATIONS
3.3 EXCHANGE RATE
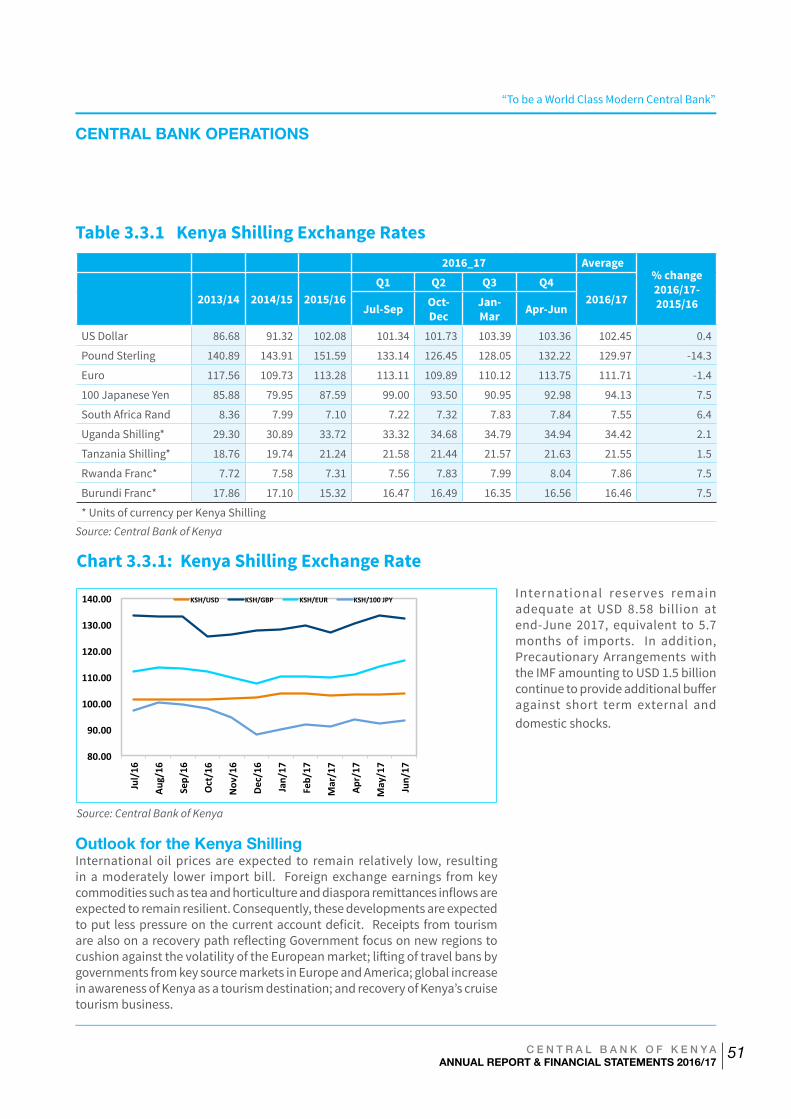
“To be a World Class Modern Central Bank”
C E N T R A L B A N K O F K E N Y AANNUAL REPORT & FINANCIAL STATEMENTS 2016/17
51
TABLE 7.1: STATEMENT OF CENTRAL GOVERNMENT OPERATIONS (Ksh Billion)
Table 3.3.1 Kenya Shilling Exchange Rates 2016_17 Average
% change 2016/17-2015/16
2013/14 2014/15 2015/16
Q1 Q2 Q3 Q42016/17
Jul-Sep Oct-Dec
Jan-Mar Apr-Jun
US Dollar 86.68 91.32 102.08 101.34 101.73 103.39 103.36 102.45 0.4
Pound Sterling 140.89 143.91 151.59 133.14 126.45 128.05 132.22 129.97 -14.3
Euro 117.56 109.73 113.28 113.11 109.89 110.12 113.75 111.71 -1.4
100 Japanese Yen 85.88 79.95 87.59 99.00 93.50 90.95 92.98 94.13 7.5
South Africa Rand 8.36 7.99 7.10 7.22 7.32 7.83 7.84 7.55 6.4
Uganda Shilling* 29.30 30.89 33.72 33.32 34.68 34.79 34.94 34.42 2.1
Tanzania Shilling* 18.76 19.74 21.24 21.58 21.44 21.57 21.63 21.55 1.5
Rwanda Franc* 7.72 7.58 7.31 7.56 7.83 7.99 8.04 7.86 7.5
Burundi Franc* 17.86 17.10 15.32 16.47 16.49 16.35 16.56 16.46 7.5
* Units of currency per Kenya ShillingSource: Central Bank of Kenya
80.00
90.00
100.00
110.00
120.00
130.00
140.00
Jul/16
Aug/16
Sep/
16
Oct/16
Nov
/16
Dec/16
Jan/
17
Feb/
17
Mar/17
Apr/17
May
/17
Jun/
17
KSH/USD KSH/GBP KSH/EUR KSH/100 JPY
Chart 3.3.1: Kenya Shilling Exchange Rate
Source: Central Bank of Kenya
Outlook for the Kenya ShillingInternational oil prices are expected to remain relatively low, resulting in a moderately lower import bill. Foreign exchange earnings from key commodities such as tea and horticulture and diaspora remittances inflows are expected to remain resilient. Consequently, these developments are expected to put less pressure on the current account deficit. Receipts from tourism are also on a recovery path reflecting Government focus on new regions to cushion against the volatility of the European market; lifting of travel bans by governments from key source markets in Europe and America; global increase in awareness of Kenya as a tourism destination; and recovery of Kenya’s cruise tourism business.
International reser ves remain adequate at USD 8.58 billion at end-June 2017, equivalent to 5.7 months of imports. In addition, Precautionary Arrangements with the IMF amounting to USD 1.5 billion continue to provide additional buffer against short term external and domestic shocks.
CENTRAL BANK OPERATIONS
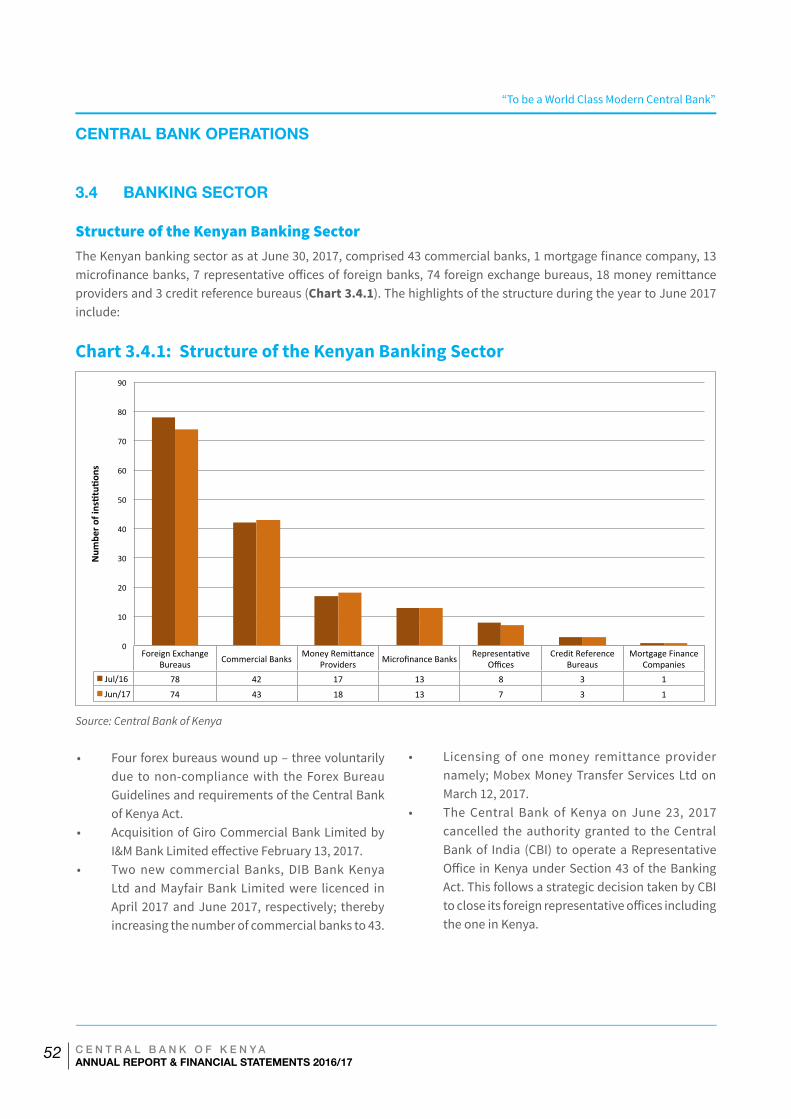
“To be a World Class Modern Central Bank”
C E N T R A L B A N K O F K E N Y AANNUAL REPORT & FINANCIAL STATEMENTS 2016/17
52
Structure of the Kenyan Banking SectorThe Kenyan banking sector as at June 30, 2017, comprised 43 commercial banks, 1 mortgage finance company, 13 microfinance banks, 7 representative offices of foreign banks, 74 foreign exchange bureaus, 18 money remittance providers and 3 credit reference bureaus (Chart 3.4.1). The highlights of the structure during the year to June 2017 include:
Chart 3.4.1: Structure of the Kenyan Banking Sector
3.4 BANKING SECTOR
Source: Central Bank of Kenya
• Four forex bureaus wound up – three voluntarily due to non-compliance with the Forex Bureau Guidelines and requirements of the Central Bank of Kenya Act.
• Acquisition of Giro Commercial Bank Limited by I&M Bank Limited effective February 13, 2017.
• Two new commercial Banks, DIB Bank Kenya Ltd and Mayfair Bank Limited were licenced in April 2017 and June 2017, respectively; thereby increasing the number of commercial banks to 43.
• Licensing of one money remittance provider namely; Mobex Money Transfer Services Ltd on March 12, 2017.
• The Central Bank of Kenya on June 23, 2017 cancelled the authority granted to the Central Bank of India (CBI) to operate a Representative Office in Kenya under Section 43 of the Banking Act. This follows a strategic decision taken by CBI to close its foreign representative offices including the one in Kenya.
CENTRAL BANK OPERATIONS
Foreign Exchange Bureaus Commercial Banks Money Remi8ance
Providers Microfinance Banks Representa?ve Offices
Credit Reference Bureaus
Mortgage Finance Companies
Jul/16 78 42 17 13 8 3 1
Jun/17 74 43 18 13 7 3 1
0
10
20
30
40
50
60
70
80
90
Num
ber o
f ins-tu-
ons
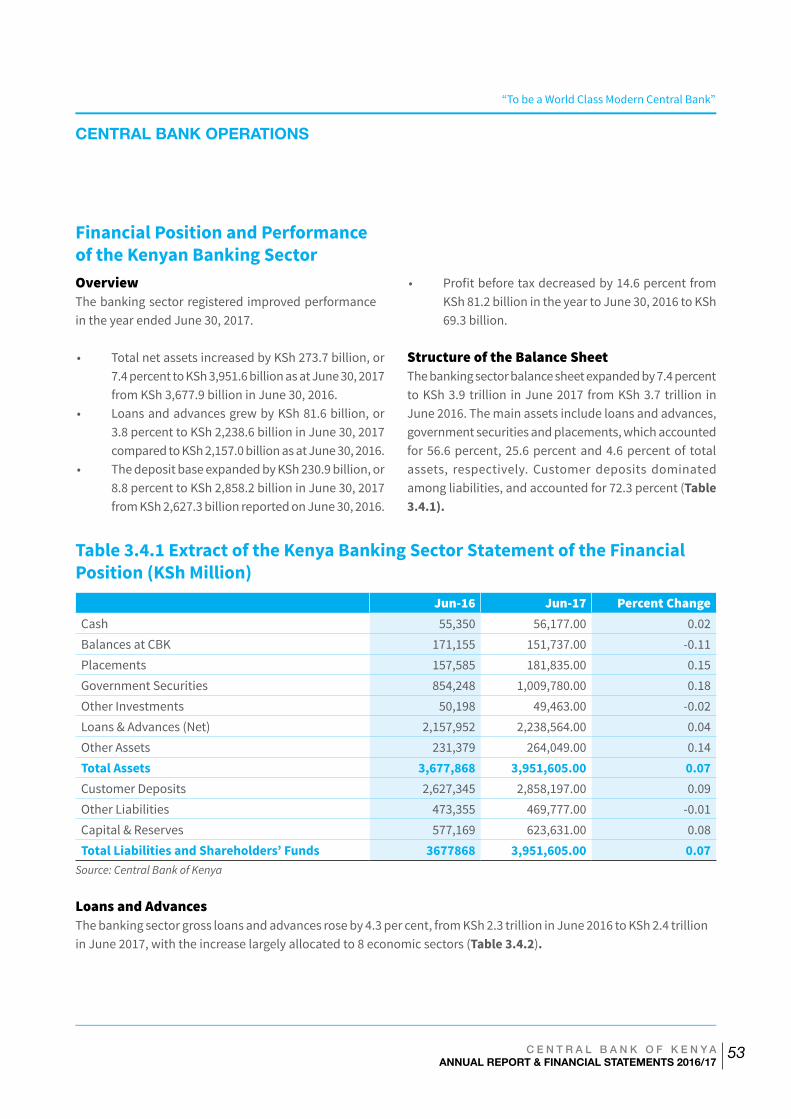
“To be a World Class Modern Central Bank”
C E N T R A L B A N K O F K E N Y AANNUAL REPORT & FINANCIAL STATEMENTS 2016/17
53
Financial Position and Performance of the Kenyan Banking SectorOverviewThe banking sector registered improved performance in the year ended June 30, 2017.
• Total net assets increased by KSh 273.7 billion, or 7.4 percent to KSh 3,951.6 billion as at June 30, 2017 from KSh 3,677.9 billion in June 30, 2016.
• Loans and advances grew by KSh 81.6 billion, or 3.8 percent to KSh 2,238.6 billion in June 30, 2017 compared to KSh 2,157.0 billion as at June 30, 2016.
• The deposit base expanded by KSh 230.9 billion, or 8.8 percent to KSh 2,858.2 billion in June 30, 2017 from KSh 2,627.3 billion reported on June 30, 2016.
• Profit before tax decreased by 14.6 percent from KSh 81.2 billion in the year to June 30, 2016 to KSh 69.3 billion.
Structure of the Balance SheetThe banking sector balance sheet expanded by 7.4 percent to KSh 3.9 trillion in June 2017 from KSh 3.7 trillion in June 2016. The main assets include loans and advances, government securities and placements, which accounted for 56.6 percent, 25.6 percent and 4.6 percent of total assets, respectively. Customer deposits dominated among liabilities, and accounted for 72.3 percent (Table 3.4.1).
Table 3.4.1 Extract of the Kenya Banking Sector Statement of the Financial Position (KSh Million) Jun-16 Jun-17 Percent ChangeCash 55,350 56,177.00 0.02Balances at CBK 171,155 151,737.00 -0.11Placements 157,585 181,835.00 0.15Government Securities 854,248 1,009,780.00 0.18Other Investments 50,198 49,463.00 -0.02Loans & Advances (Net) 2,157,952 2,238,564.00 0.04Other Assets 231,379 264,049.00 0.14Total Assets 3,677,868 3,951,605.00 0.07Customer Deposits 2,627,345 2,858,197.00 0.09Other Liabilities 473,355 469,777.00 -0.01Capital & Reserves 577,169 623,631.00 0.08Total Liabilities and Shareholders’ Funds 3677868 3,951,605.00 0.07
Source: Central Bank of Kenya
Loans and Advances The banking sector gross loans and advances rose by 4.3 per cent, from KSh 2.3 trillion in June 2016 to KSh 2.4 trillion in June 2017, with the increase largely allocated to 8 economic sectors (Table 3.4.2).
CENTRAL BANK OPERATIONS
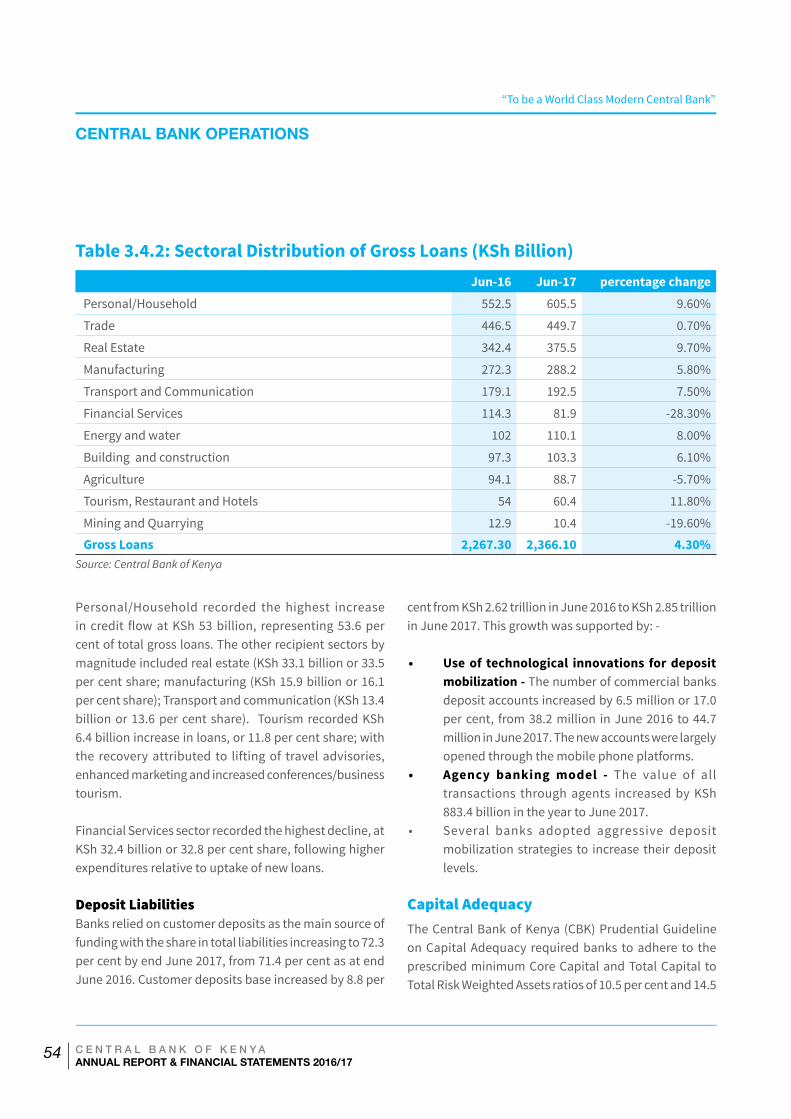
“To be a World Class Modern Central Bank”
C E N T R A L B A N K O F K E N Y AANNUAL REPORT & FINANCIAL STATEMENTS 2016/17
54
Table 3.4.2: Sectoral Distribution of Gross Loans (KSh Billion) Jun-16 Jun-17 percentage change Personal/Household 552.5 605.5 9.60%
Trade 446.5 449.7 0.70%
Real Estate 342.4 375.5 9.70%
Manufacturing 272.3 288.2 5.80%
Transport and Communication 179.1 192.5 7.50%
Financial Services 114.3 81.9 -28.30%
Energy and water 102 110.1 8.00%
Building and construction 97.3 103.3 6.10%
Agriculture 94.1 88.7 -5.70%
Tourism, Restaurant and Hotels 54 60.4 11.80%
Mining and Quarrying 12.9 10.4 -19.60%
Gross Loans 2,267.30 2,366.10 4.30%Source: Central Bank of Kenya
cent from KSh 2.62 trillion in June 2016 to KSh 2.85 trillion in June 2017. This growth was supported by: -
• Use of technological innovations for deposit mobilization - The number of commercial banks deposit accounts increased by 6.5 million or 17.0 per cent, from 38.2 million in June 2016 to 44.7 million in June 2017. The new accounts were largely opened through the mobile phone platforms.
• Agency banking model - The value of all transactions through agents increased by KSh 883.4 billion in the year to June 2017.
• Several banks adopted aggressive deposit mobilization strategies to increase their deposit levels.
Capital AdequacyThe Central Bank of Kenya (CBK) Prudential Guideline on Capital Adequacy required banks to adhere to the prescribed minimum Core Capital and Total Capital to Total Risk Weighted Assets ratios of 10.5 per cent and 14.5
Personal/Household recorded the highest increase in credit flow at KSh 53 billion, representing 53.6 per cent of total gross loans. The other recipient sectors by magnitude included real estate (KSh 33.1 billion or 33.5 per cent share; manufacturing (KSh 15.9 billion or 16.1 per cent share); Transport and communication (KSh 13.4 billion or 13.6 per cent share). Tourism recorded KSh 6.4 billion increase in loans, or 11.8 per cent share; with the recovery attributed to lifting of travel advisories, enhanced marketing and increased conferences/business tourism.
Financial Services sector recorded the highest decline, at KSh 32.4 billion or 32.8 per cent share, following higher expenditures relative to uptake of new loans.
Deposit LiabilitiesBanks relied on customer deposits as the main source of funding with the share in total liabilities increasing to 72.3 per cent by end June 2017, from 71.4 per cent as at end June 2016. Customer deposits base increased by 8.8 per
CENTRAL BANK OPERATIONS
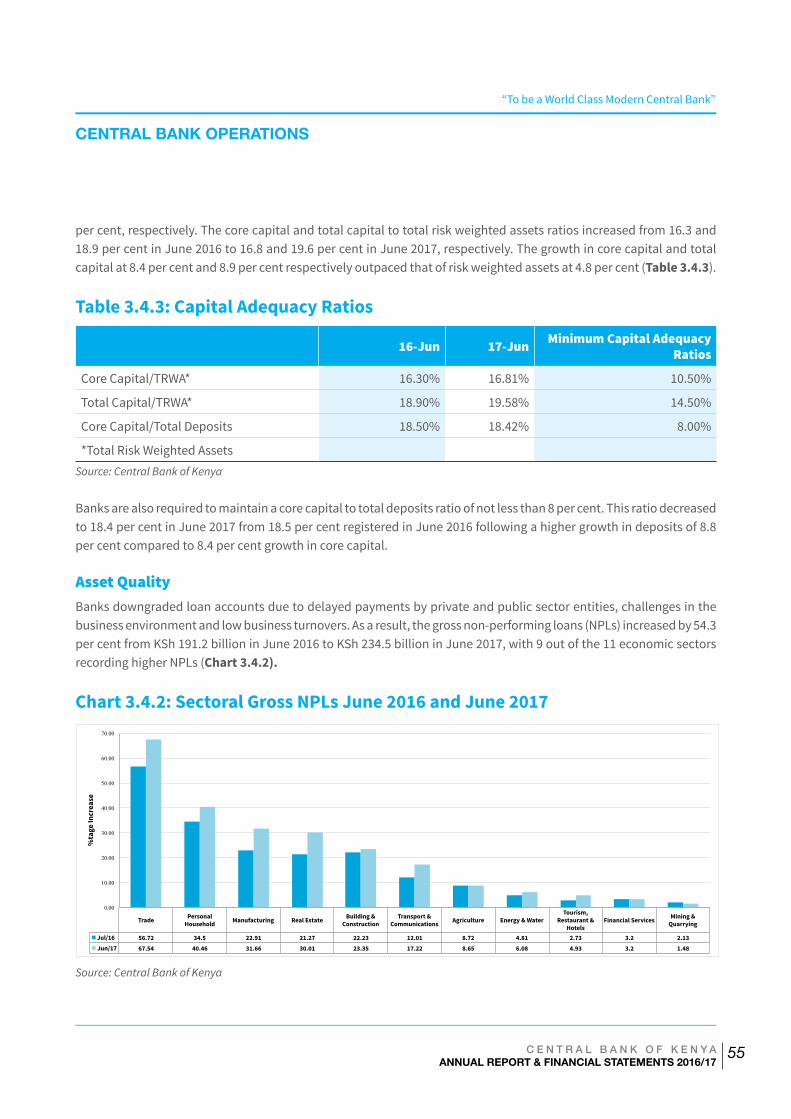
“To be a World Class Modern Central Bank”
C E N T R A L B A N K O F K E N Y AANNUAL REPORT & FINANCIAL STATEMENTS 2016/17
55
per cent, respectively. The core capital and total capital to total risk weighted assets ratios increased from 16.3 and 18.9 per cent in June 2016 to 16.8 and 19.6 per cent in June 2017, respectively. The growth in core capital and total capital at 8.4 per cent and 8.9 per cent respectively outpaced that of risk weighted assets at 4.8 per cent (Table 3.4.3).
Table 3.4.3: Capital Adequacy Ratios
16-Jun 17-Jun Minimum Capital Adequacy Ratios
Core Capital/TRWA* 16.30% 16.81% 10.50%
Total Capital/TRWA* 18.90% 19.58% 14.50%
Core Capital/Total Deposits 18.50% 18.42% 8.00%
*Total Risk Weighted AssetsSource: Central Bank of Kenya
Banks are also required to maintain a core capital to total deposits ratio of not less than 8 per cent. This ratio decreased to 18.4 per cent in June 2017 from 18.5 per cent registered in June 2016 following a higher growth in deposits of 8.8 per cent compared to 8.4 per cent growth in core capital.
Asset QualityBanks downgraded loan accounts due to delayed payments by private and public sector entities, challenges in the business environment and low business turnovers. As a result, the gross non-performing loans (NPLs) increased by 54.3 per cent from KSh 191.2 billion in June 2016 to KSh 234.5 billion in June 2017, with 9 out of the 11 economic sectors recording higher NPLs (Chart 3.4.2).
Chart 3.4.2: Sectoral Gross NPLs June 2016 and June 2017
Source: Central Bank of Kenya
CENTRAL BANK OPERATIONS
Trade Personal Household Manufacturing Real Estate Building &
Construction Transport &
Communications Agriculture Energy & Water Tourism,
Restaurant & Hotels
Financial Services Mining & Quarrying
Jul/16 56.72 34.5 22.91 21.27 22.23 12.01 8.72 4.81 2.73 3.2 2.13 Jun/17 67.54 40.46 31.66 30.01 23.35 17.22 8.65 6.08 4.93 3.2 1.48
0.00
10.00
20.00
30.00
40.00
50.00
60.00
70.00
%ta
ge In
crea
se
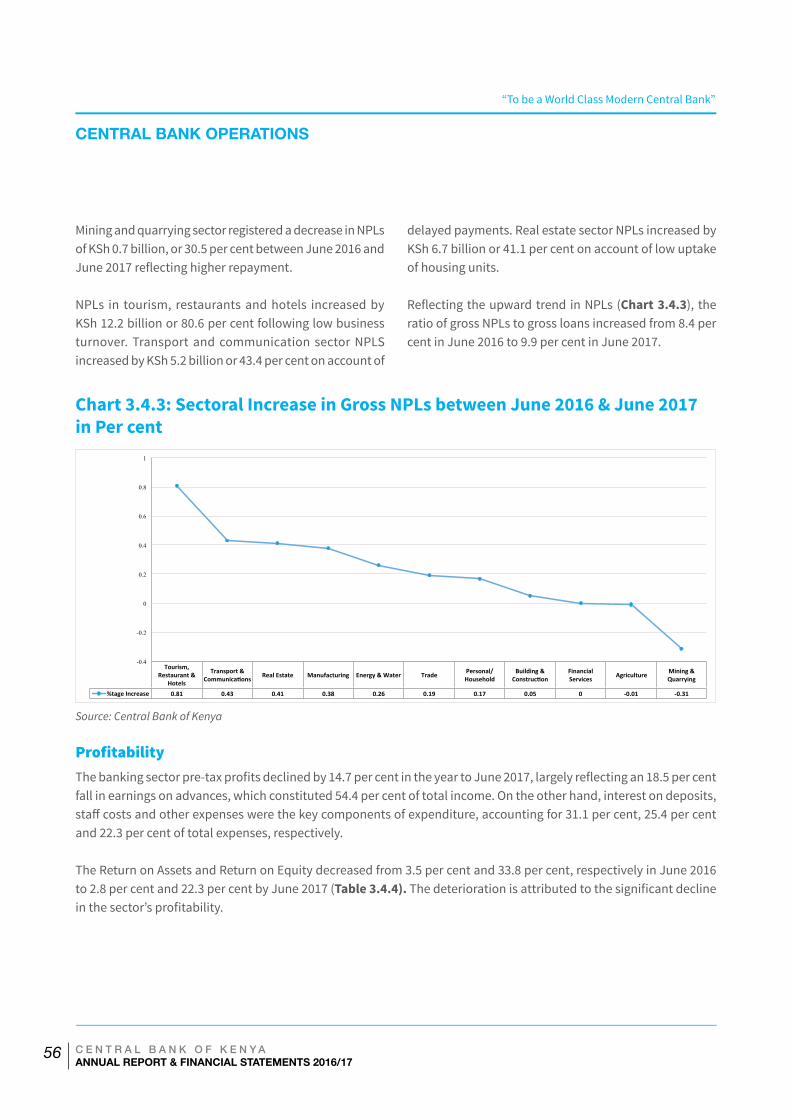
“To be a World Class Modern Central Bank”
C E N T R A L B A N K O F K E N Y AANNUAL REPORT & FINANCIAL STATEMENTS 2016/17
56
Mining and quarrying sector registered a decrease in NPLs of KSh 0.7 billion, or 30.5 per cent between June 2016 and June 2017 reflecting higher repayment.
NPLs in tourism, restaurants and hotels increased by KSh 12.2 billion or 80.6 per cent following low business turnover. Transport and communication sector NPLS increased by KSh 5.2 billion or 43.4 per cent on account of
delayed payments. Real estate sector NPLs increased by KSh 6.7 billion or 41.1 per cent on account of low uptake of housing units.
Reflecting the upward trend in NPLs (Chart 3.4.3), the ratio of gross NPLs to gross loans increased from 8.4 per cent in June 2016 to 9.9 per cent in June 2017.
Chart 3.4.3: Sectoral Increase in Gross NPLs between June 2016 & June 2017 in Per cent
Source: Central Bank of Kenya
ProfitabilityThe banking sector pre-tax profits declined by 14.7 per cent in the year to June 2017, largely reflecting an 18.5 per cent fall in earnings on advances, which constituted 54.4 per cent of total income. On the other hand, interest on deposits, staff costs and other expenses were the key components of expenditure, accounting for 31.1 per cent, 25.4 per cent and 22.3 per cent of total expenses, respectively.
The Return on Assets and Return on Equity decreased from 3.5 per cent and 33.8 per cent, respectively in June 2016 to 2.8 per cent and 22.3 per cent by June 2017 (Table 3.4.4). The deterioration is attributed to the significant decline in the sector’s profitability.
CENTRAL BANK OPERATIONS
Tourism, Restaurant &
Hotels
Transport & Communica5ons Real Estate Manufacturing Energy & Water Trade Personal/
Household Building & Construc5on
Financial Services Agriculture Mining &
Quarrying
%tage Increase 0.81 0.43 0.41 0.38 0.26 0.19 0.17 0.05 0 -‐0.01 -‐0.31
-0.4
-0.2
0
0.2
0.4
0.6
0.8
1
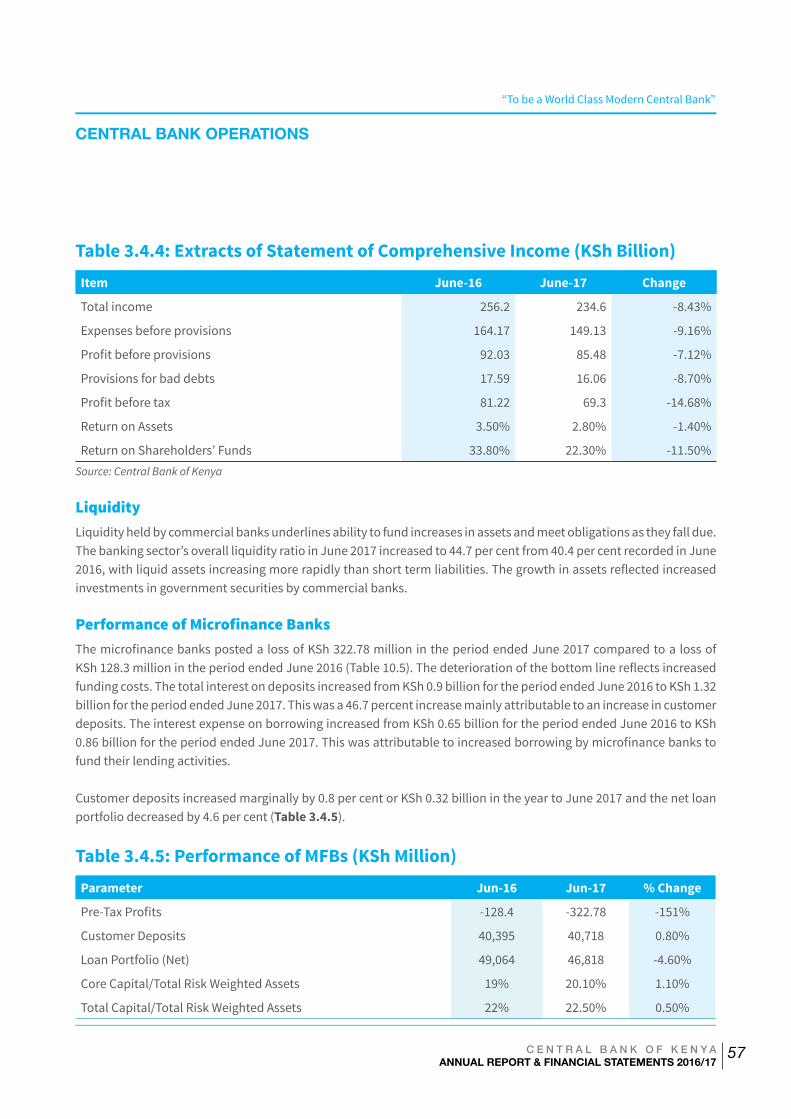
“To be a World Class Modern Central Bank”
C E N T R A L B A N K O F K E N Y AANNUAL REPORT & FINANCIAL STATEMENTS 2016/17
57
Table 3.4.4: Extracts of Statement of Comprehensive Income (KSh Billion)Item June-16 June-17 Change
Total income 256.2 234.6 -8.43%
Expenses before provisions 164.17 149.13 -9.16%
Profit before provisions 92.03 85.48 -7.12%
Provisions for bad debts 17.59 16.06 -8.70%
Profit before tax 81.22 69.3 -14.68%
Return on Assets 3.50% 2.80% -1.40%
Return on Shareholders’ Funds 33.80% 22.30% -11.50%Source: Central Bank of Kenya
LiquidityLiquidity held by commercial banks underlines ability to fund increases in assets and meet obligations as they fall due. The banking sector’s overall liquidity ratio in June 2017 increased to 44.7 per cent from 40.4 per cent recorded in June 2016, with liquid assets increasing more rapidly than short term liabilities. The growth in assets reflected increased investments in government securities by commercial banks. Performance of Microfinance BanksThe microfinance banks posted a loss of KSh 322.78 million in the period ended June 2017 compared to a loss of KSh 128.3 million in the period ended June 2016 (Table 10.5). The deterioration of the bottom line reflects increased funding costs. The total interest on deposits increased from KSh 0.9 billion for the period ended June 2016 to KSh 1.32 billion for the period ended June 2017. This was a 46.7 percent increase mainly attributable to an increase in customer deposits. The interest expense on borrowing increased from KSh 0.65 billion for the period ended June 2016 to KSh 0.86 billion for the period ended June 2017. This was attributable to increased borrowing by microfinance banks to fund their lending activities.
Customer deposits increased marginally by 0.8 per cent or KSh 0.32 billion in the year to June 2017 and the net loan portfolio decreased by 4.6 per cent (Table 3.4.5).
Table 3.4.5: Performance of MFBs (KSh Million)
Parameter Jun-16 Jun-17 % Change
Pre-Tax Profits -128.4 -322.78 -151%
Customer Deposits 40,395 40,718 0.80%
Loan Portfolio (Net) 49,064 46,818 -4.60%
Core Capital/Total Risk Weighted Assets 19% 20.10% 1.10%
Total Capital/Total Risk Weighted Assets 22% 22.50% 0.50%
CENTRAL BANK OPERATIONS
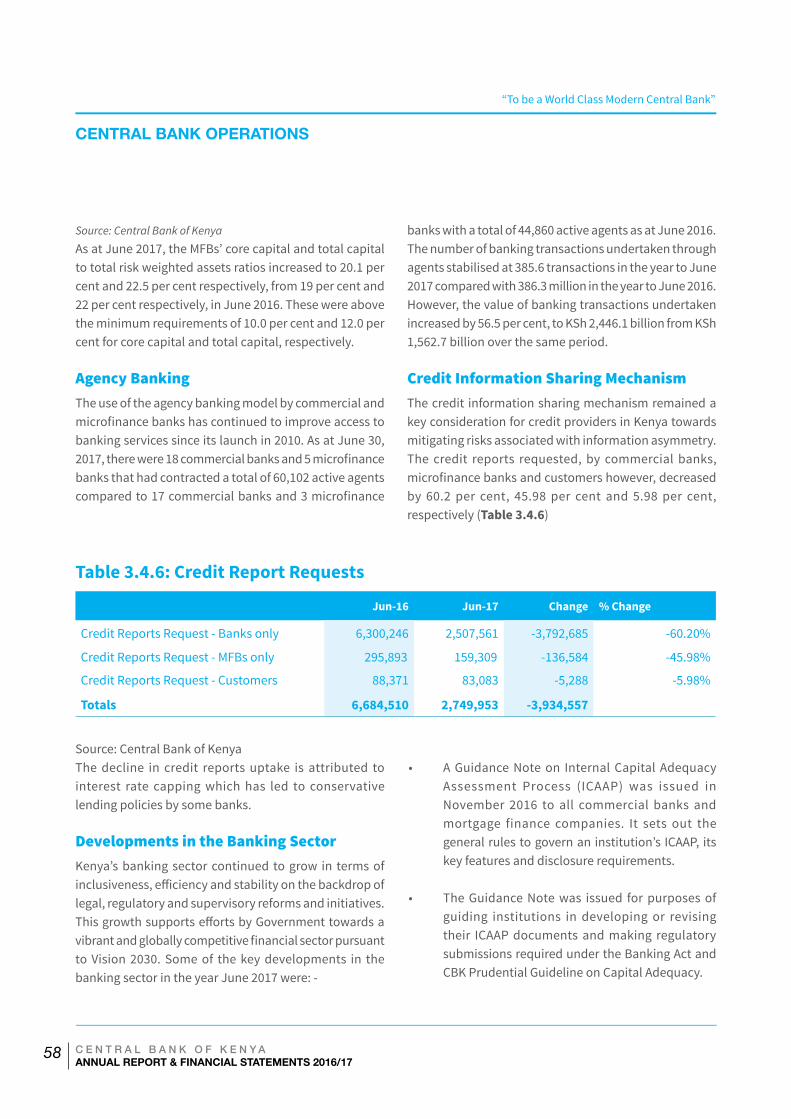
“To be a World Class Modern Central Bank”
C E N T R A L B A N K O F K E N Y AANNUAL REPORT & FINANCIAL STATEMENTS 2016/17
58
Source: Central Bank of Kenya
As at June 2017, the MFBs’ core capital and total capital to total risk weighted assets ratios increased to 20.1 per cent and 22.5 per cent respectively, from 19 per cent and 22 per cent respectively, in June 2016. These were above the minimum requirements of 10.0 per cent and 12.0 per cent for core capital and total capital, respectively.
Agency BankingThe use of the agency banking model by commercial and microfinance banks has continued to improve access to banking services since its launch in 2010. As at June 30, 2017, there were 18 commercial banks and 5 microfinance banks that had contracted a total of 60,102 active agents compared to 17 commercial banks and 3 microfinance
banks with a total of 44,860 active agents as at June 2016.The number of banking transactions undertaken through agents stabilised at 385.6 transactions in the year to June 2017 compared with 386.3 million in the year to June 2016. However, the value of banking transactions undertaken increased by 56.5 per cent, to KSh 2,446.1 billion from KSh 1,562.7 billion over the same period.
Credit Information Sharing MechanismThe credit information sharing mechanism remained a key consideration for credit providers in Kenya towards mitigating risks associated with information asymmetry. The credit reports requested, by commercial banks, microfinance banks and customers however, decreased by 60.2 per cent, 45.98 per cent and 5.98 per cent, respectively (Table 3.4.6)
Table 3.4.6: Credit Report Requests
Jun-16 Jun-17 Change % Change
Credit Reports Request - Banks only 6,300,246 2,507,561 -3,792,685 -60.20%
Credit Reports Request - MFBs only 295,893 159,309 -136,584 -45.98%
Credit Reports Request - Customers 88,371 83,083 -5,288 -5.98%
Totals 6,684,510 2,749,953 -3,934,557
Source: Central Bank of KenyaThe decline in credit reports uptake is attributed to interest rate capping which has led to conservative lending policies by some banks.
Developments in the Banking SectorKenya’s banking sector continued to grow in terms of inclusiveness, efficiency and stability on the backdrop of legal, regulatory and supervisory reforms and initiatives. This growth supports efforts by Government towards a vibrant and globally competitive financial sector pursuant to Vision 2030. Some of the key developments in the banking sector in the year June 2017 were: -
• A Guidance Note on Internal Capital Adequacy Assessment Process (ICAAP) was issued in November 2016 to all commercial banks and mortgage finance companies. It sets out the general rules to govern an institution’s ICAAP, its key features and disclosure requirements.
• The Guidance Note was issued for purposes of guiding institutions in developing or revising their ICAAP documents and making regulatory submissions required under the Banking Act and CBK Prudential Guideline on Capital Adequacy.
CENTRAL BANK OPERATIONS
“To be a World Class Modern Central Bank”
C E N T R A L B A N K O F K E N Y AANNUAL REPORT & FINANCIAL STATEMENTS 2016/17
59
• Two new commercial Banks; DIB Bank Kenya Ltd and Mayfair Bank Limited were licenced in April 2017 and June 2017 respectively.
o DIB Bank Kenya Ltd is a fully owned subsidiary of Dubai Islamic Bank PJSC (DIB PJSC) of the United Arab Emirates (UAE). DIB PJSC founded in 1975 is the first bank to have incorporated the principles of Islam in all its practices and is the largest Islamic Bank in the UAE. DIB intends to exclusively offer sharia compliant banking services in Kenya. It becomes the third fully sharia compliant bank to be licensed in Kenya after Gulf African Bank Ltd in 2007 and First Community Bank Limited in 2008.
o Mayfair Bank Ltd established by a group of local investors will provide banking services to both the retail and corporate market segments. The services will range from intermediation, credit extension, trade finance, liquidity management and custodial solutions to both individual and institutional clientele.
• Innovative Payment Systems Platform: Towards the end of 2016, several commercial banks submitted applications to CBK to introduce a payment system product, PESALINK. This is a secure and efficient platform for bank account to bank account money transfer. The platform which is managed by Kenya Bankers Association (KBA) through its subsidiary Integrated Payment Services Limited will complement the existing payment system infrastructure and provide customers with more choices.
• In order to promote transparency in pricing of credit, CBK jointly with the Kenya Bankers Association developed an on-line portal on cost of
credit that was successfully piloted among banks effective May 23, 2017 and launched on June 22, 2017. The online portal will provide information on lending rates and charges offered by licensed banks. The portal is aimed at enabling users compare the price of credit from various banks. The basis of comparison will be in terms of Annual Percentage Rate (APR) (computed as a ratio of all costs incurred in borrowing and servicing a loan against the principal amount borrowed); Total Cost of Credit (TCC) (list of all costs incurred in borrowing and servicing a loan); and Repayment Schedule (RS) (periodic instalments due on a loan for its entire tenor as split into principal and interest components).
• Draft CBK Guidance Note on Cyber Risk: The increased leveraging on technology by banks exposes them to increased cyber risk. Cybercrime is one of the risks targeting the financial sector which is expected to increase in sophistication and frequency. Understanding these risks and related mitigation is important for business continuity as well as promoting the development of sound financial systems and risk management frameworks. In this regard, CBK drafted a Guidance Note on Cyber Risk that outlines the minimum requirements for banks to enhance cyber security. As at June 2017, CBK had invited comments from the public on the draft Guidance Note.
Banking sector 2017 Outlook
The elevated credit and liquidity risks experienced in the Kenyan banking sector in 2016 began to ease off and stabilise in 2017. This is informed by on-going efforts by banks to reposition their business models to suit their desired market niches and risk profiles. The strengthened business models will enable the banks to effectively identify and manage all potential risks they are exposed to in their activities. Effective risk management is a prerequisite for the banks to profitably exploit business opportunities in their market niches.
CENTRAL BANK OPERATIONS
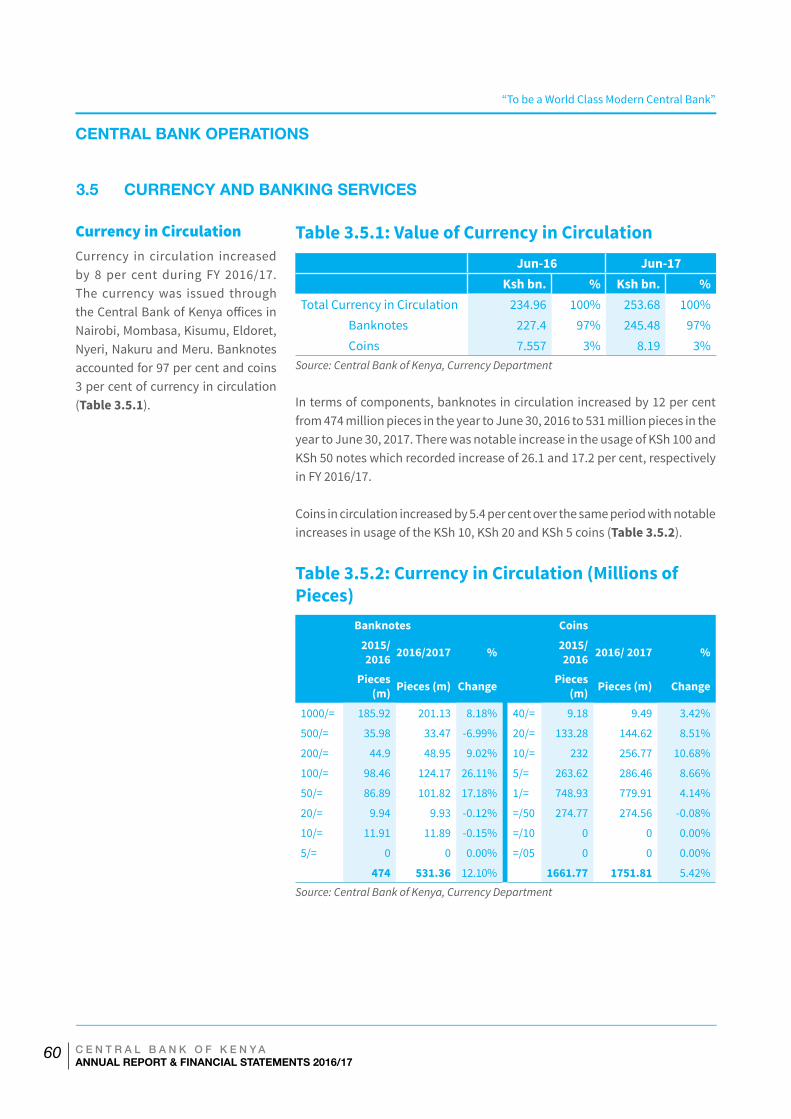
“To be a World Class Modern Central Bank”
C E N T R A L B A N K O F K E N Y AANNUAL REPORT & FINANCIAL STATEMENTS 2016/17
60
Currency in CirculationCurrency in circulation increased by 8 per cent during FY 2016/17. The currency was issued through the Central Bank of Kenya offices in Nairobi, Mombasa, Kisumu, Eldoret, Nyeri, Nakuru and Meru. Banknotes accounted for 97 per cent and coins 3 per cent of currency in circulation (Table 3.5.1).
Table 3.5.1: Value of Currency in Circulation
Jun-16 Jun-17 Ksh bn. % Ksh bn. %Total Currency in Circulation 234.96 100% 253.68 100%
Banknotes 227.4 97% 245.48 97%Coins 7.557 3% 8.19 3%
Source: Central Bank of Kenya, Currency Department
In terms of components, banknotes in circulation increased by 12 per cent from 474 million pieces in the year to June 30, 2016 to 531 million pieces in the year to June 30, 2017. There was notable increase in the usage of KSh 100 and KSh 50 notes which recorded increase of 26.1 and 17.2 per cent, respectively in FY 2016/17.
Coins in circulation increased by 5.4 per cent over the same period with notable increases in usage of the KSh 10, KSh 20 and KSh 5 coins (Table 3.5.2).
Table 3.5.2: Currency in Circulation (Millions of Pieces)
Banknotes
Coins 2015/ 2016 2016/2017 % 2015/
2016 2016/ 2017 %
Pieces (m) Pieces (m) Change Pieces
(m) Pieces (m) Change
1000/= 185.92 201.13 8.18% 40/= 9.18 9.49 3.42%
500/= 35.98 33.47 -6.99% 20/= 133.28 144.62 8.51%
200/= 44.9 48.95 9.02% 10/= 232 256.77 10.68%
100/= 98.46 124.17 26.11% 5/= 263.62 286.46 8.66%
50/= 86.89 101.82 17.18% 1/= 748.93 779.91 4.14%
20/= 9.94 9.93 -0.12% =/50 274.77 274.56 -0.08%
10/= 11.91 11.89 -0.15% =/10 0 0 0.00%
5/= 0 0 0.00% =/05 0 0 0.00%
474 531.36 12.10% 1661.77 1751.81 5.42%
Source: Central Bank of Kenya, Currency Department
CENTRAL BANK OPERATIONS
3.5 CURRENCY AND BANKING SERVICES
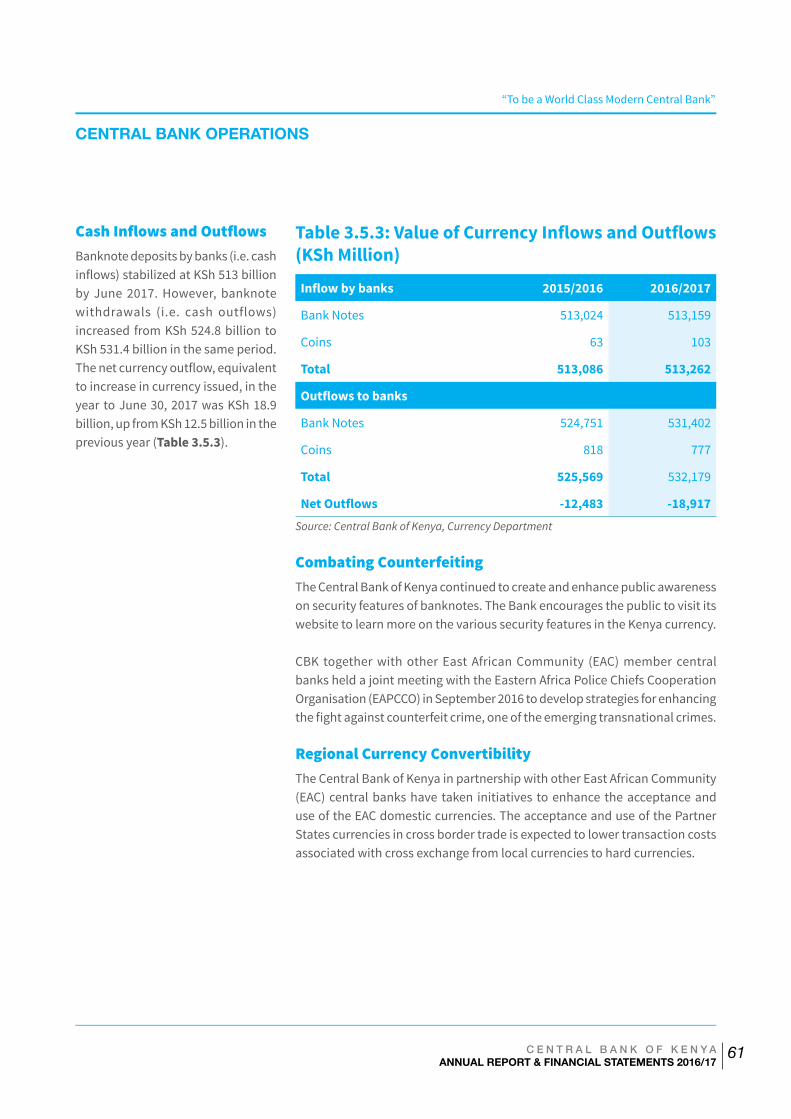
“To be a World Class Modern Central Bank”
C E N T R A L B A N K O F K E N Y AANNUAL REPORT & FINANCIAL STATEMENTS 2016/17
61
Cash Inflows and OutflowsBanknote deposits by banks (i.e. cash inflows) stabilized at KSh 513 billion by June 2017. However, banknote withdrawals (i.e. cash outflows) increased from KSh 524.8 billion to KSh 531.4 billion in the same period. The net currency outflow, equivalent to increase in currency issued, in the year to June 30, 2017 was KSh 18.9 billion, up from KSh 12.5 billion in the previous year (Table 3.5.3).
Table 3.5.3: Value of Currency Inflows and Outflows (KSh Million)
Inflow by banks 2015/2016 2016/2017
Bank Notes 513,024 513,159
Coins 63 103
Total 513,086 513,262
Outflows to banks
Bank Notes 524,751 531,402
Coins 818 777
Total 525,569 532,179
Net Outflows -12,483 -18,917
Source: Central Bank of Kenya, Currency Department
Combating CounterfeitingThe Central Bank of Kenya continued to create and enhance public awareness on security features of banknotes. The Bank encourages the public to visit its website to learn more on the various security features in the Kenya currency.
CBK together with other East African Community (EAC) member central banks held a joint meeting with the Eastern Africa Police Chiefs Cooperation Organisation (EAPCCO) in September 2016 to develop strategies for enhancing the fight against counterfeit crime, one of the emerging transnational crimes.
Regional Currency ConvertibilityThe Central Bank of Kenya in partnership with other East African Community (EAC) central banks have taken initiatives to enhance the acceptance and use of the EAC domestic currencies. The acceptance and use of the Partner States currencies in cross border trade is expected to lower transaction costs associated with cross exchange from local currencies to hard currencies.
CENTRAL BANK OPERATIONS
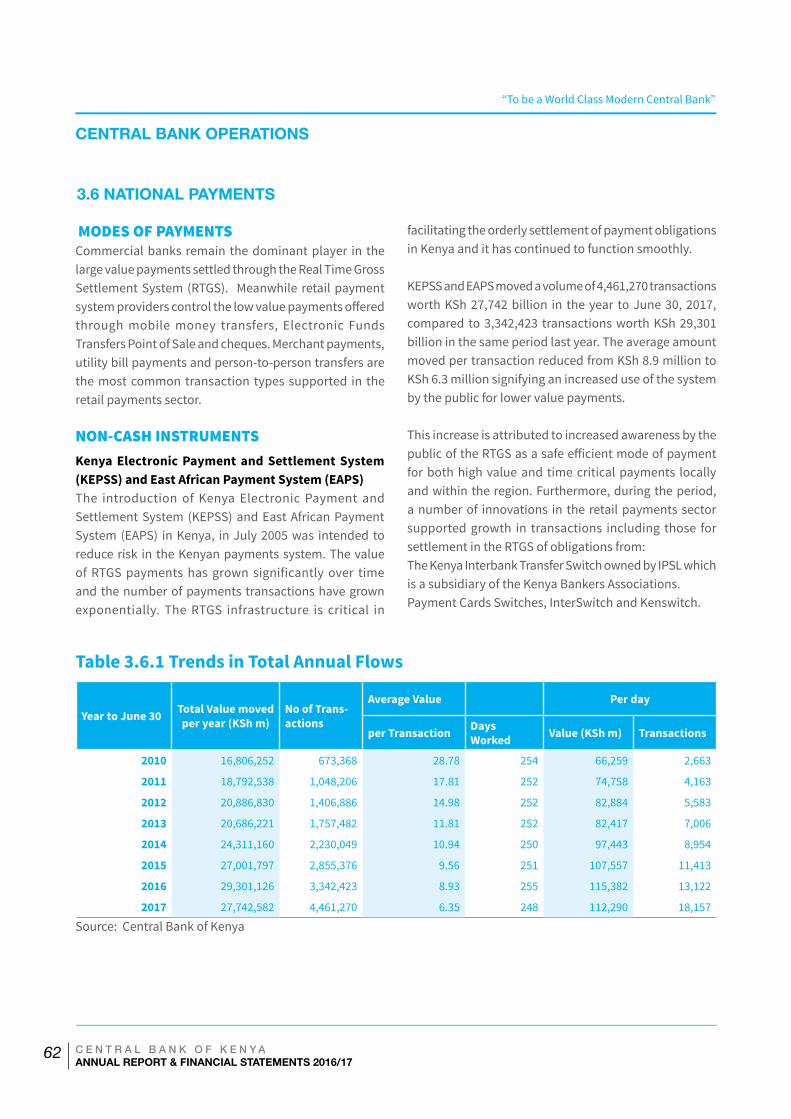
“To be a World Class Modern Central Bank”
C E N T R A L B A N K O F K E N Y AANNUAL REPORT & FINANCIAL STATEMENTS 2016/17
62
MODES OF PAYMENTSCommercial banks remain the dominant player in the large value payments settled through the Real Time Gross Settlement System (RTGS). Meanwhile retail payment system providers control the low value payments offered through mobile money transfers, Electronic Funds Transfers Point of Sale and cheques. Merchant payments, utility bill payments and person-to-person transfers are the most common transaction types supported in the retail payments sector.
NON-CASH INSTRUMENTSKenya Electronic Payment and Settlement System (KEPSS) and East African Payment System (EAPS)The introduction of Kenya Electronic Payment and Settlement System (KEPSS) and East African Payment System (EAPS) in Kenya, in July 2005 was intended to reduce risk in the Kenyan payments system. The value of RTGS payments has grown significantly over time and the number of payments transactions have grown exponentially. The RTGS infrastructure is critical in
facilitating the orderly settlement of payment obligations in Kenya and it has continued to function smoothly.
KEPSS and EAPS moved a volume of 4,461,270 transactions worth KSh 27,742 billion in the year to June 30, 2017, compared to 3,342,423 transactions worth KSh 29,301 billion in the same period last year. The average amount moved per transaction reduced from KSh 8.9 million to KSh 6.3 million signifying an increased use of the system by the public for lower value payments.
This increase is attributed to increased awareness by the public of the RTGS as a safe efficient mode of payment for both high value and time critical payments locally and within the region. Furthermore, during the period, a number of innovations in the retail payments sector supported growth in transactions including those for settlement in the RTGS of obligations from:The Kenya Interbank Transfer Switch owned by IPSL which is a subsidiary of the Kenya Bankers Associations.Payment Cards Switches, InterSwitch and Kenswitch.
Table 3.6.1 Trends in Total Annual Flows
Year to June 30 Total Value moved per year (KSh m)
No of Trans-actions
Average Value Per day
per Transaction Days Worked Value (KSh m) Transactions
2010 16,806,252 673,368 28.78 254 66,259 2,663
2011 18,792,538 1,048,206 17.81 252 74,758 4,163
2012 20,886,830 1,406,886 14.98 252 82,884 5,583
2013 20,686,221 1,757,482 11.81 252 82,417 7,006
2014 24,311,160 2,230,049 10.94 250 97,443 8,954
2015 27,001,797 2,855,376 9.56 251 107,557 11,413
2016 29,301,126 3,342,423 8.93 255 115,382 13,122
2017 27,742,582 4,461,270 6.35 248 112,290 18,157
Source: Central Bank of Kenya
CENTRAL BANK OPERATIONS
3.6 NATIONAL PAYMENTS
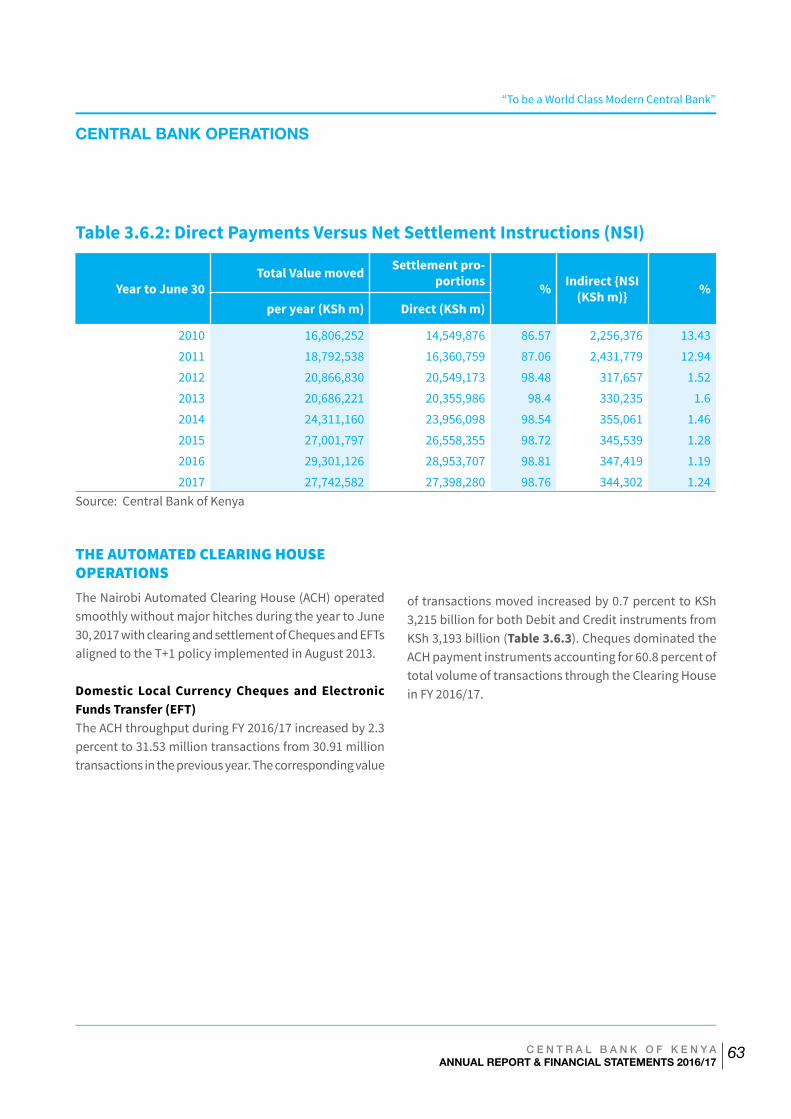
“To be a World Class Modern Central Bank”
C E N T R A L B A N K O F K E N Y AANNUAL REPORT & FINANCIAL STATEMENTS 2016/17
63
Table 3.6.2: Direct Payments Versus Net Settlement Instructions (NSI)
Year to June 30Total Value moved Settlement pro-
portions % Indirect {NSI (KSh m)} %
per year (KSh m) Direct (KSh m)
2010 16,806,252 14,549,876 86.57 2,256,376 13.432011 18,792,538 16,360,759 87.06 2,431,779 12.942012 20,866,830 20,549,173 98.48 317,657 1.522013 20,686,221 20,355,986 98.4 330,235 1.62014 24,311,160 23,956,098 98.54 355,061 1.462015 27,001,797 26,558,355 98.72 345,539 1.282016 29,301,126 28,953,707 98.81 347,419 1.192017 27,742,582 27,398,280 98.76 344,302 1.24
Source: Central Bank of Kenya
THE AUTOMATED CLEARING HOUSE OPERATIONSThe Nairobi Automated Clearing House (ACH) operated smoothly without major hitches during the year to June 30, 2017 with clearing and settlement of Cheques and EFTs aligned to the T+1 policy implemented in August 2013.
Domestic Local Currency Cheques and Electronic Funds Transfer (EFT) The ACH throughput during FY 2016/17 increased by 2.3 percent to 31.53 million transactions from 30.91 million transactions in the previous year. The corresponding value
of transactions moved increased by 0.7 percent to KSh 3,215 billion for both Debit and Credit instruments from KSh 3,193 billion (Table 3.6.3). Cheques dominated the ACH payment instruments accounting for 60.8 percent of total volume of transactions through the Clearing House in FY 2016/17.
CENTRAL BANK OPERATIONS
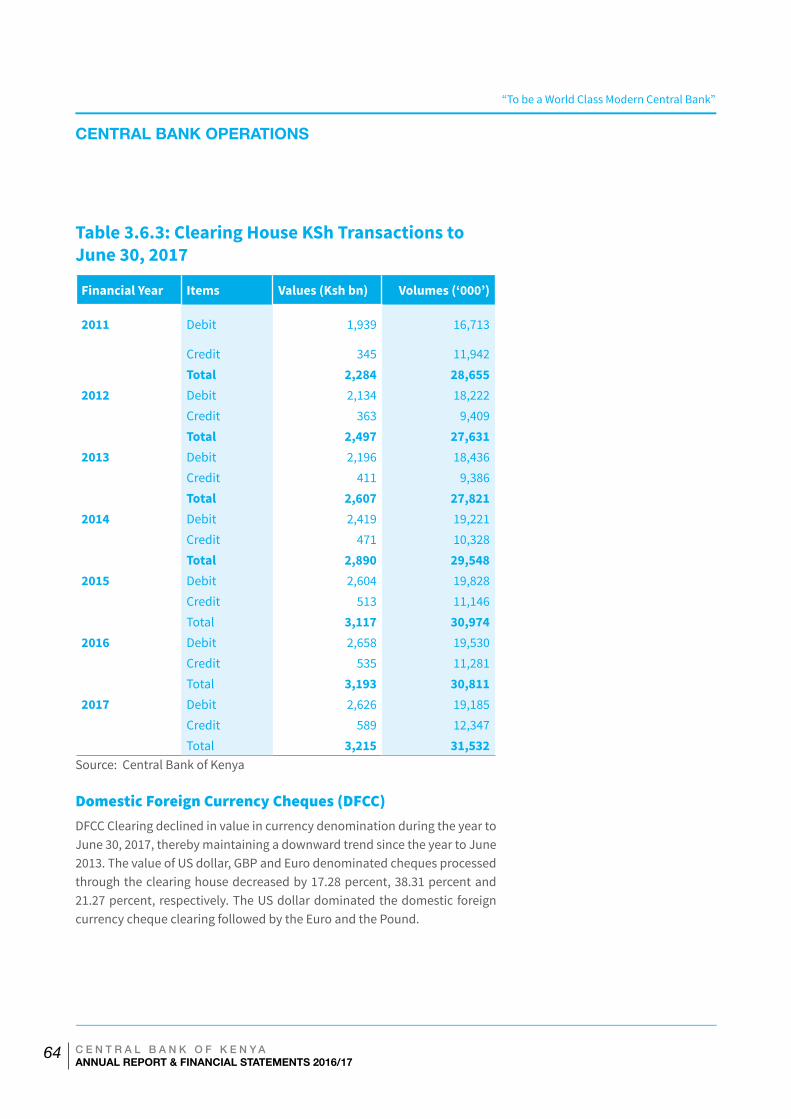
“To be a World Class Modern Central Bank”
C E N T R A L B A N K O F K E N Y AANNUAL REPORT & FINANCIAL STATEMENTS 2016/17
64
Table 3.6.3: Clearing House KSh Transactions to June 30, 2017
Financial Year Items Values (Ksh bn) Volumes (‘000’)
2011 Debit 1,939 16,713
Credit 345 11,942 Total 2,284 28,6552012 Debit 2,134 18,222 Credit 363 9,409 Total 2,497 27,6312013 Debit 2,196 18,436 Credit 411 9,386 Total 2,607 27,8212014 Debit 2,419 19,221 Credit 471 10,328 Total 2,890 29,5482015 Debit 2,604 19,828 Credit 513 11,146 Total 3,117 30,9742016 Debit 2,658 19,530 Credit 535 11,281 Total 3,193 30,8112017 Debit 2,626 19,185 Credit 589 12,347 Total 3,215 31,532
Source: Central Bank of Kenya
Domestic Foreign Currency Cheques (DFCC)DFCC Clearing declined in value in currency denomination during the year to June 30, 2017, thereby maintaining a downward trend since the year to June 2013. The value of US dollar, GBP and Euro denominated cheques processed through the clearing house decreased by 17.28 percent, 38.31 percent and 21.27 percent, respectively. The US dollar dominated the domestic foreign currency cheque clearing followed by the Euro and the Pound.
CENTRAL BANK OPERATIONS
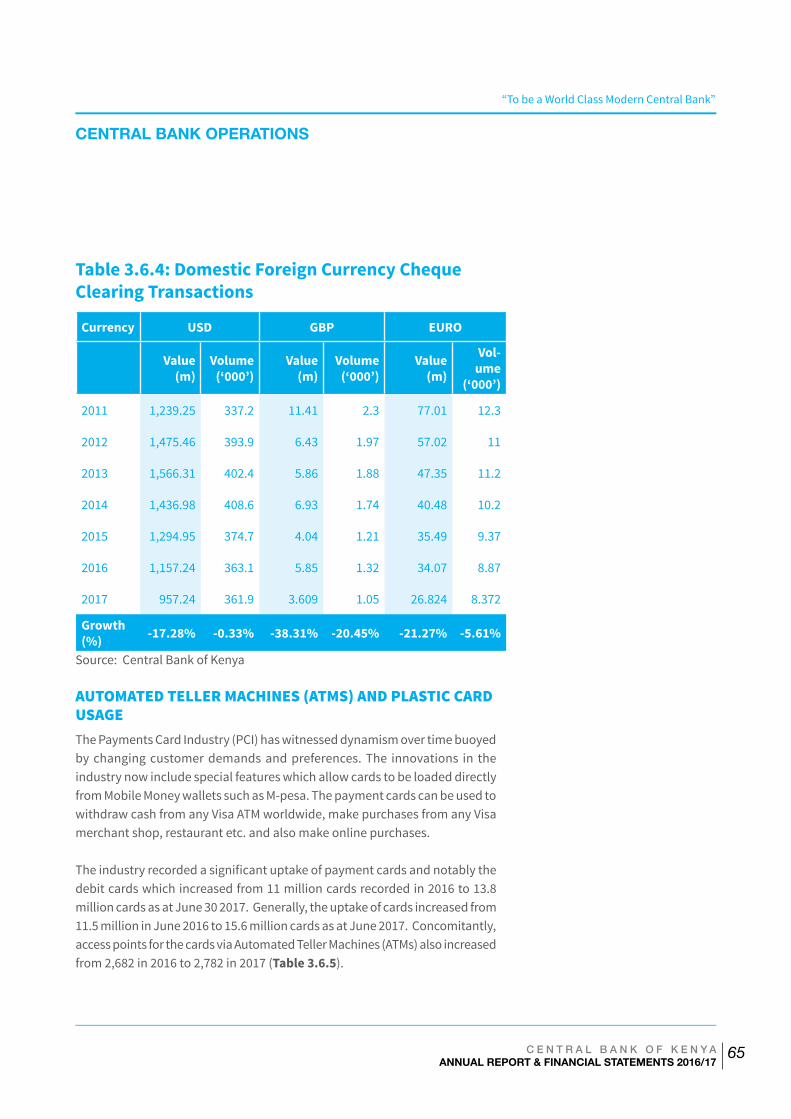
“To be a World Class Modern Central Bank”
C E N T R A L B A N K O F K E N Y AANNUAL REPORT & FINANCIAL STATEMENTS 2016/17
65
Table 3.6.4: Domestic Foreign Currency Cheque Clearing Transactions
Currency USD GBP EURO
Value (m)
Volume (‘000’)
Value (m)
Volume (‘000’)
Value (m)
Vol-ume
(‘000’)
2011 1,239.25 337.2 11.41 2.3 77.01 12.3
2012 1,475.46 393.9 6.43 1.97 57.02 11
2013 1,566.31 402.4 5.86 1.88 47.35 11.2
2014 1,436.98 408.6 6.93 1.74 40.48 10.2
2015 1,294.95 374.7 4.04 1.21 35.49 9.37
2016 1,157.24 363.1 5.85 1.32 34.07 8.87
2017 957.24 361.9 3.609 1.05 26.824 8.372
Growth (%) -17.28% -0.33% -38.31% -20.45% -21.27% -5.61%
Source: Central Bank of Kenya
AUTOMATED TELLER MACHINES (ATMS) AND PLASTIC CARD USAGEThe Payments Card Industry (PCI) has witnessed dynamism over time buoyed by changing customer demands and preferences. The innovations in the industry now include special features which allow cards to be loaded directly from Mobile Money wallets such as M-pesa. The payment cards can be used to withdraw cash from any Visa ATM worldwide, make purchases from any Visa merchant shop, restaurant etc. and also make online purchases.
The industry recorded a significant uptake of payment cards and notably the debit cards which increased from 11 million cards recorded in 2016 to 13.8 million cards as at June 30 2017. Generally, the uptake of cards increased from 11.5 million in June 2016 to 15.6 million cards as at June 2017. Concomitantly, access points for the cards via Automated Teller Machines (ATMs) also increased from 2,682 in 2016 to 2,782 in 2017 (Table 3.6.5).
CENTRAL BANK OPERATIONS
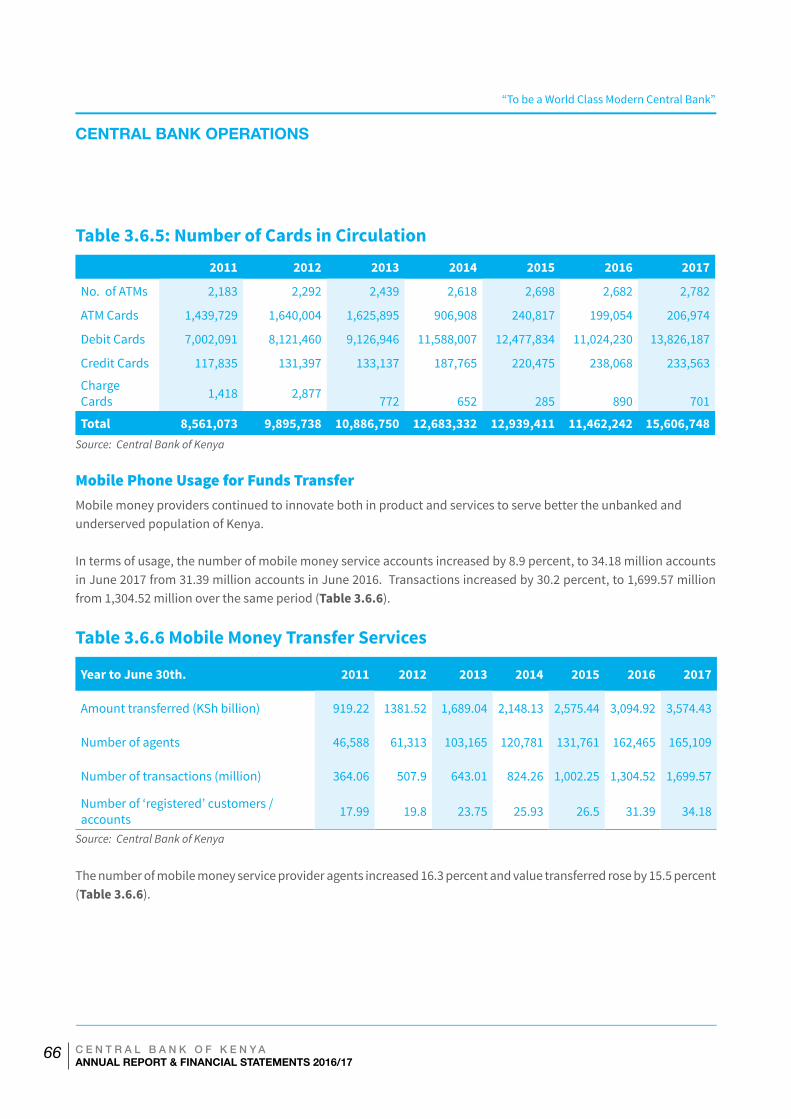
“To be a World Class Modern Central Bank”
C E N T R A L B A N K O F K E N Y AANNUAL REPORT & FINANCIAL STATEMENTS 2016/17
66
Table 3.6.5: Number of Cards in Circulation
2011 2012 2013 2014 2015 2016 2017
No. of ATMs 2,183 2,292 2,439 2,618 2,698 2,682 2,782
ATM Cards 1,439,729 1,640,004 1,625,895 906,908 240,817 199,054 206,974
Debit Cards 7,002,091 8,121,460 9,126,946 11,588,007 12,477,834 11,024,230 13,826,187
Credit Cards 117,835 131,397 133,137 187,765 220,475 238,068 233,563
Charge Cards 1,418 2,877
772
652
285
890
701
Total 8,561,073 9,895,738 10,886,750 12,683,332 12,939,411 11,462,242 15,606,748 Source: Central Bank of Kenya
Mobile Phone Usage for Funds TransferMobile money providers continued to innovate both in product and services to serve better the unbanked and underserved population of Kenya.
In terms of usage, the number of mobile money service accounts increased by 8.9 percent, to 34.18 million accounts in June 2017 from 31.39 million accounts in June 2016. Transactions increased by 30.2 percent, to 1,699.57 million from 1,304.52 million over the same period (Table 3.6.6).
Table 3.6.6 Mobile Money Transfer Services
Year to June 30th. 2011 2012 2013 2014 2015 2016 2017
Amount transferred (KSh billion) 919.22 1381.52 1,689.04 2,148.13 2,575.44 3,094.92 3,574.43
Number of agents 46,588 61,313 103,165 120,781 131,761 162,465 165,109
Number of transactions (million) 364.06 507.9 643.01 824.26 1,002.25 1,304.52 1,699.57
Number of ‘registered’ customers / accounts 17.99 19.8 23.75 25.93 26.5 31.39 34.18
Source: Central Bank of Kenya
The number of mobile money service provider agents increased 16.3 percent and value transferred rose by 15.5 percent (Table 3.6.6).
CENTRAL BANK OPERATIONS
“To be a World Class Modern Central Bank”
C E N T R A L B A N K O F K E N Y AANNUAL REPORT & FINANCIAL STATEMENTS 2016/17
67
CURRENT AND FUTURE DEVELOPMENTSLegal Framework
Subsequent to the enactment of the National Payment System Act (2011) and National Payment System Regulations (2014), CBK has continued to enhance compliance by Payment Service Providers (PSPs) with the legal framework. The Bank has authorized the existing PSPs that operated under a letter of no objection prior to the enactment of the Act. In addition, the Bank requires all PSPs to comply with the Anti-Money Laundering and Countering Financing of Terrorism Act 2009 requirements in line with CBK mandate of formulating and implementing such policies as best promote the establishment, regulation and supervision of efficient and effective payment, clearing and settlement systems that promote social and economic activities.
Interoperability has been a key issue in the National Payments System and notably the retail payments sector. In this regard;
CBK continues to actively participate in interoperability discussions between stakeholders aimed to improve the end-to-end efficiency and affordability while preserving market competition and incentives for investment and innovation.
The National Payment System Act 2011 and National Payment System Regulations 2014 make provisions for the formation of a Payment System Management Body (PSMB) to facilitate interoperability. To this end, the payment industry sector has formed an Association named the Payment Association of Kenya (PAK) which was registered at the Registrar of Societies on May 19, 2017. The PAK will be self-regulating and its governance structure will be managed by a PAK Council, representing the participants in the PSMB and the Bank’s role will be to ensure that the Association complies with the set rules, policies and procedures developed to govern it.
Internet Banking
Following the successful roll-out of Internet Banking (IB) to Ministries, Departments and Agencies (MDAs) in July 2015 and to County Governments (County Executives County Assemblies) in February 2016, the Central Bank of Kenya conducted refresher training to ensure that all IB users derived full benefits envisaged from use of the system.
The training also addressed emerging issues and received feedback from the users on their experience in using the Internet Banking system. Overall, the training was successful. Going forward, we have identified a need for regular refresher training particularly in the coming months, given the expected changes in County Governments after the General Elections.
CENTRAL BANK OPERATIONS
“To be a World Class Modern Central Bank”
C E N T R A L B A N K O F K E N Y AANNUAL REPORT & FINANCIAL STATEMENTS 2016/17
68
4.0 REGIONAL INTEGRATION DEVELOPMENTS
68 C E N T R A L B A N K O F K E N Y AANNUAL REPORT & FINANCIAL STATEMENTS 2016/17
“To be a World Class Modern Central Bank”
C E N T R A L B A N K O F K E N Y AANNUAL REPORT & FINANCIAL STATEMENTS 2016/17
69
REGIONAL INTEGRATION DEVELOPMENTS
THE EAC MONETARY COOPERATION PROGRAMME
Background
The Treaty for the establishment of the East African Community encapsulates the integration process of the EAC, commencing with a Customs Union which came into force in 2005 followed by the Common Market in 2010. The East African Monetary Union (EAMU) is the third stage in the process of East African Community (EAC) regional integration. The protocol on the establishment of the EAMU was signed on 30th November 2013 and lays groundwork for a Monetary Union within 10 years.
The EAMU Protocol sets out the scope of monetary and financial cooperation which includes harmonization and coordination of fiscal policy, formulation and implementation of a single monetary and exchange rate policy, development and integration of financial, payment and settlement systems and adoption of common principles and, rules for regulation and prudential supervision of the financial system amongst others. To facilitate the process towards the monetary union, the EAC Monetary Affairs Committee (MAC), which constitutes the Governors of the EAC Central Banks, developed an action plan to coordinate all areas of monetary and financial cooperation.
Republic of South Sudan became the sixth member of the East African Community after signing an accession treaty on April 15, 2016. South Sudan’s membership was approved by EAC Heads of State at a regional meeting in Dar-es-Salaam, Tanzania. With a combined population of 150 million people by 2016, the accession of South Sudan is a boost to the EAC’s GDP at current market prices to US$ 147.5 billion.
The Political Federation is the fourth stage and ultimate goal of EAC Regional Integration.
The EAC Common Market
The EAC Common Market provides a big opportunity for private sector growth and poverty reduction.
The EAC Common Market Protocol covers several commitments by Partner States – also known as four freedoms – on free movement of goods, labour, persons, services and capital, in its implementation. On services, Partner States committed to remove restrictions in 7 of 12 sectors. With regard to goods, Partner States committed to remove all internal tariffs, implement a common external tariff and remove non-tariff barriers to trade. Partner States made 20 commitments on the free movement of capital.
To monitor implementation of the Common Market Protocol, the EAC Partner States have adopted the EAC Common Market Scorecard to assess progress on country commitments. The report, which is published jointly by the EAC Secretariat and the World Bank, tracks EAC’s compliance in the movement of capital, services and goods. Since publication of the first scorecard in 2014, Partner States have undertaken reforms as reported in the second scorecard published in 2016. These reforms were in the area of capital, goods and services.
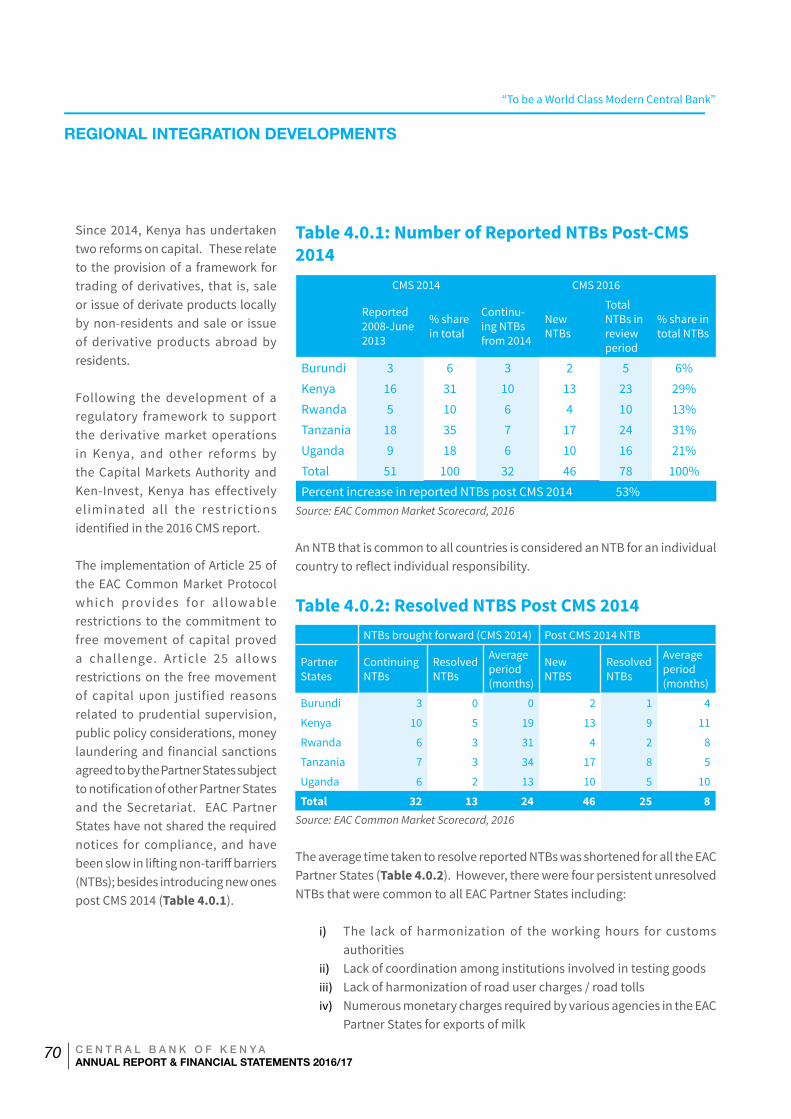
“To be a World Class Modern Central Bank”
C E N T R A L B A N K O F K E N Y AANNUAL REPORT & FINANCIAL STATEMENTS 2016/17
70
REGIONAL INTEGRATION DEVELOPMENTS
Since 2014, Kenya has undertaken two reforms on capital. These relate to the provision of a framework for trading of derivatives, that is, sale or issue of derivate products locally by non-residents and sale or issue of derivative products abroad by residents.
Following the development of a regulatory framework to support the derivative market operations in Kenya, and other reforms by the Capital Markets Authority and Ken-Invest, Kenya has effectively eliminated all the restrictions identified in the 2016 CMS report.
The implementation of Article 25 of the EAC Common Market Protocol which provides for al lowable restrictions to the commitment to free movement of capital proved a challenge. Article 25 allows restrictions on the free movement of capital upon justified reasons related to prudential supervision, public policy considerations, money laundering and financial sanctions agreed to by the Partner States subject to notification of other Partner States and the Secretariat. EAC Partner States have not shared the required notices for compliance, and have been slow in lifting non-tariff barriers (NTBs); besides introducing new ones post CMS 2014 (Table 4.0.1).
Table 4.0.1: Number of Reported NTBs Post-CMS 2014
CMS 2014 CMS 2016
Reported 2008-June 2013
% share in total
Continu-ing NTBs from 2014
New NTBs
Total NTBs in review period
% share in total NTBs
Burundi 3 6 3 2 5 6%Kenya 16 31 10 13 23 29%Rwanda 5 10 6 4 10 13%Tanzania 18 35 7 17 24 31%Uganda 9 18 6 10 16 21%Total 51 100 32 46 78 100%Percent increase in reported NTBs post CMS 2014 53%
Source: EAC Common Market Scorecard, 2016
An NTB that is common to all countries is considered an NTB for an individual country to reflect individual responsibility.
Table 4.0.2: Resolved NTBS Post CMS 2014 NTBs brought forward (CMS 2014) Post CMS 2014 NTB
Partner States
Continuing NTBs
Resolved NTBs
Average period (months)
New NTBS
Resolved NTBs
Average period (months)
Burundi 3 0 0 2 1 4
Kenya 10 5 19 13 9 11
Rwanda 6 3 31 4 2 8
Tanzania 7 3 34 17 8 5
Uganda 6 2 13 10 5 10
Total 32 13 24 46 25 8Source: EAC Common Market Scorecard, 2016
The average time taken to resolve reported NTBs was shortened for all the EAC Partner States (Table 4.0.2). However, there were four persistent unresolved NTBs that were common to all EAC Partner States including:
i) The lack of harmonization of the working hours for customs authorities
ii) Lack of coordination among institutions involved in testing goodsiii) Lack of harmonization of road user charges / road tollsiv) Numerous monetary charges required by various agencies in the EAC
Partner States for exports of milk
“To be a World Class Modern Central Bank”
C E N T R A L B A N K O F K E N Y AANNUAL REPORT & FINANCIAL STATEMENTS 2016/17
71
With regard to services, the EAC Common Market Scorecard 2016 identified 59 measures which were inconsistent with the liberalization of services compared with 63 previously. These measures were predominantly in professional services and specifically engineering, accounting and legal services.
The East African Monetary Union (EAMU)The EAMU is the third stage in the process of the EAC regional integration. The objective of the Monetary Union is to promote and maintain monetary and financial stability aimed at facilitating economic integration of the East African Community (EAC). The protocol on the establishment of the EAMU was signed on November 30, 2013 and lays groundwork for a Monetary Union within 10 years. The requirements of the Protocol apply to activities undertaken by Partner States, co-operating in monetary and financial matters.
In accordance with the roadmap for implementation of the EAMU Protocol, four institutions were scheduled to be established by 2018. These are the East African Monetary Institute (EAMI) – responsible for preparatory work for the Monetary Union, the East African Surveillance, Compliance and Enforcement Commission (EASCEC); East African Statistics Bureau (EASB); and East African Financial Services Commission (EAFSC). Significant progress has been made towards the establishment of institutions of EAMU as follows:
i). The bills for establishment of the East African Monetary Institute and East African Statistics Bureau were forwarded, in April 2017, to the East African Legislative Assembly for enactment.
ii). The bill for the establishment of the East African Surveillance, Compliance and Enforcement Commission was forwarded to the Sectoral Council for Legal and Judicial Affairs for legal input.
iii). A study on the Financial Sector Regulatory and Supervisory Architecture was conducted by
the IMF to inform the development of the bill for establishment of the East African Financial Services Commission.
During the FY 2016/17, Partner States’ Central Banks continued to harmonize monetary policy frameworks, thereby commissioning studies on the exchange rate in FY 2016/17, to inform the roadmap to a common exchange rate policy. Significant progress was also made on harmonizing economic statistics. For instance, all Partners States migrated compilation of balance of payments data to 6th Edition of the IMF’s Balance of Payments Manual.
Substantial progress was also made towards harmonizing Government Finance Statistics (GFS) in line with the 2014 GFS manual. Partner States’ Central Banks cooperated on the adoption of common principles and rules for the regulation and supervision of the financial system. In this area, supervisory frameworks were continuously updated in readiness for the envisaged East African Monetary Union.
Realization of the Monetary Union will require EAC Partner States to attain and maintain for at least three consecutive years the following macroeconomic performance convergence criteria:
i) A ceiling on headline inflation of 8 per cent.ii) A ceiling on fiscal deficit, including grants of 3 per
cent of GDP.iii) A ceiling on Gross Public Debt of 50 per cent of GDP
in Net Present Value terms.iv) A foreign exchange reserves cover of 4.5 months of
imports.
REGIONAL INTEGRATION DEVELOPMENTS
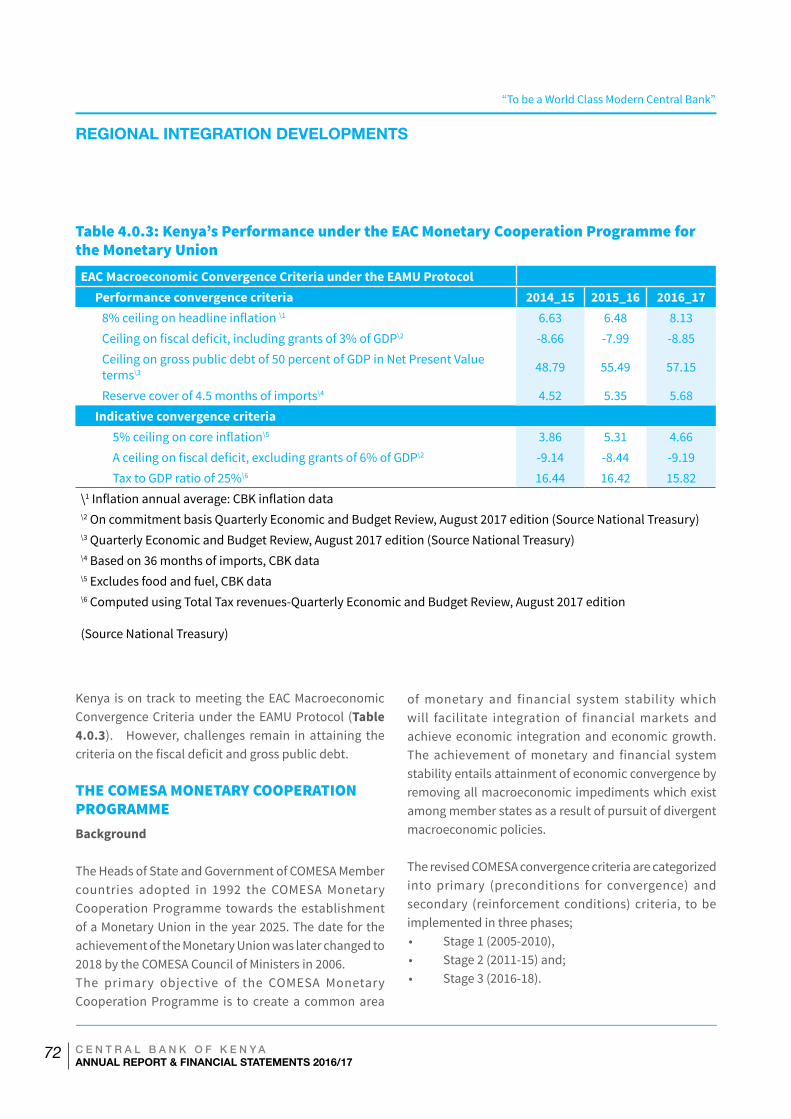
“To be a World Class Modern Central Bank”
C E N T R A L B A N K O F K E N Y AANNUAL REPORT & FINANCIAL STATEMENTS 2016/17
72
Table 4.0.3: Kenya’s Performance under the EAC Monetary Cooperation Programme for the Monetary Union EAC Macroeconomic Convergence Criteria under the EAMU Protocol
Performance convergence criteria 2014_15 2015_16 2016_178% ceiling on headline inflation \1 6.63 6.48 8.13Ceiling on fiscal deficit, including grants of 3% of GDP\2 -8.66 -7.99 -8.85Ceiling on gross public debt of 50 percent of GDP in Net Present Value terms\3 48.79 55.49 57.15
Reserve cover of 4.5 months of imports\4 4.52 5.35 5.68 Indicative convergence criteria
5% ceiling on core inflation\5 3.86 5.31 4.66A ceiling on fiscal deficit, excluding grants of 6% of GDP\2 -9.14 -8.44 -9.19Tax to GDP ratio of 25%\6 16.44 16.42 15.82
\1 Inflation annual average: CBK inflation data \2 On commitment basis Quarterly Economic and Budget Review, August 2017 edition (Source National Treasury)\3 Quarterly Economic and Budget Review, August 2017 edition (Source National Treasury)\4 Based on 36 months of imports, CBK data \5 Excludes food and fuel, CBK data \6 Computed using Total Tax revenues-Quarterly Economic and Budget Review, August 2017 edition
(Source National Treasury)
Kenya is on track to meeting the EAC Macroeconomic Convergence Criteria under the EAMU Protocol (Table 4.0.3). However, challenges remain in attaining the criteria on the fiscal deficit and gross public debt.
THE COMESA MONETARY COOPERATION PROGRAMMEBackground
The Heads of State and Government of COMESA Member countries adopted in 1992 the COMESA Monetary Cooperation Programme towards the establishment of a Monetary Union in the year 2025. The date for the achievement of the Monetary Union was later changed to 2018 by the COMESA Council of Ministers in 2006. The primary objective of the COMESA Monetary Cooperation Programme is to create a common area
of monetary and financial system stability which will facilitate integration of financial markets and achieve economic integration and economic growth. The achievement of monetary and financial system stability entails attainment of economic convergence by removing all macroeconomic impediments which exist among member states as a result of pursuit of divergent macroeconomic policies.
The revised COMESA convergence criteria are categorized into primary (preconditions for convergence) and secondary (reinforcement conditions) criteria, to be implemented in three phases; • Stage 1 (2005-2010),• Stage 2 (2011-15) and; • Stage 3 (2016-18).
REGIONAL INTEGRATION DEVELOPMENTS
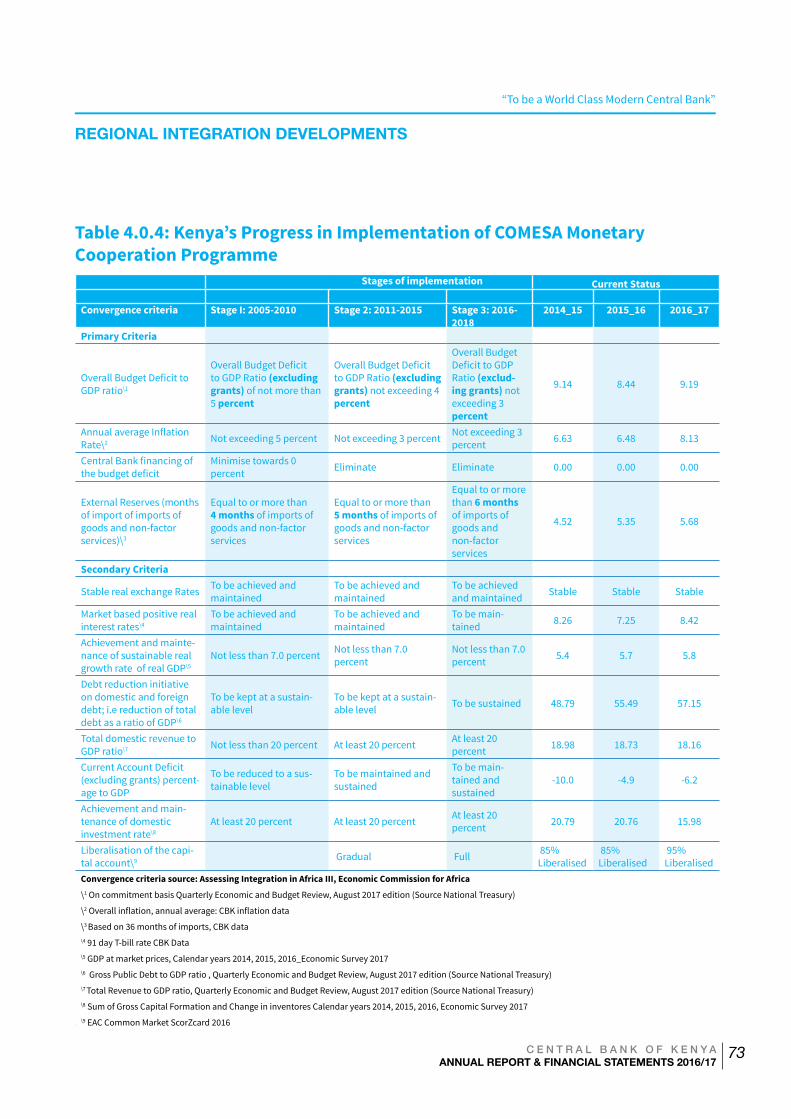
“To be a World Class Modern Central Bank”
C E N T R A L B A N K O F K E N Y AANNUAL REPORT & FINANCIAL STATEMENTS 2016/17
73
Table 4.0.4: Kenya’s Progress in Implementation of COMESA Monetary Cooperation Programme
Stages of implementation Current Status Convergence criteria Stage I: 2005-2010 Stage 2: 2011-2015 Stage 3: 2016-
20182014_15 2015_16 2016_17
Primary Criteria
Overall Budget Deficit to GDP ratio\1
Overall Budget Deficit to GDP Ratio (excluding grants) of not more than 5 percent
Overall Budget Deficit to GDP Ratio (excluding grants) not exceeding 4 percent
Overall Budget Deficit to GDP Ratio (exclud-ing grants) not exceeding 3 percent
9.14 8.44 9.19
Annual average Inflation Rate\2 Not exceeding 5 percent Not exceeding 3 percent Not exceeding 3
percent 6.63 6.48 8.13
Central Bank financing of the budget deficit
Minimise towards 0 percent Eliminate Eliminate 0.00 0.00 0.00
External Reserves (months of import of imports of goods and non-factor services)\3
Equal to or more than 4 months of imports of goods and non-factor services
Equal to or more than 5 months of imports of goods and non-factor services
Equal to or more than 6 months of imports of goods and non-factor services
4.52 5.35 5.68
Secondary Criteria
Stable real exchange Rates To be achieved and maintained
To be achieved and maintained
To be achieved and maintained Stable Stable Stable
Market based positive real interest rates\4
To be achieved and maintained
To be achieved and maintained
To be main-tained 8.26 7.25 8.42
Achievement and mainte-nance of sustainable real growth rate of real GDP\5
Not less than 7.0 percent Not less than 7.0 percent
Not less than 7.0 percent 5.4 5.7 5.8
Debt reduction initiative on domestic and foreign debt; i.e reduction of total debt as a ratio of GDP\6
To be kept at a sustain-able level
To be kept at a sustain-able level To be sustained 48.79 55.49 57.15
Total domestic revenue to GDP ratio\7 Not less than 20 percent At least 20 percent At least 20
percent 18.98 18.73 18.16
Current Account Deficit (excluding grants) percent-age to GDP
To be reduced to a sus-tainable level
To be maintained and sustained
To be main-tained and sustained
-10.0 -4.9 -6.2
Achievement and main-tenance of domestic investment rate\8
At least 20 percent At least 20 percent At least 20 percent 20.79 20.76 15.98
Liberalisation of the capi-tal account\9 Gradual Full 85%
Liberalised 85% Liberalised
95% Liberalised
Convergence criteria source: Assessing Integration in Africa III, Economic Commission for Africa
\1 On commitment basis Quarterly Economic and Budget Review, August 2017 edition (Source National Treasury)
\2 Overall inflation, annual average: CBK inflation data
\3 Based on 36 months of imports, CBK data\4 91 day T-bill rate CBK Data\5 GDP at market prices, Calendar years 2014, 2015, 2016_Economic Survey 2017\6 Gross Public Debt to GDP ratio , Quarterly Economic and Budget Review, August 2017 edition (Source National Treasury)\7 Total Revenue to GDP ratio, Quarterly Economic and Budget Review, August 2017 edition (Source National Treasury)\8 Sum of Gross Capital Formation and Change in inventores Calendar years 2014, 2015, 2016, Economic Survey 2017\9 EAC Common Market ScorZcard 2016
REGIONAL INTEGRATION DEVELOPMENTS
“To be a World Class Modern Central Bank”
C E N T R A L B A N K O F K E N Y AANNUAL REPORT & FINANCIAL STATEMENTS 2016/17
74
Kenya is on track to meeting the COMESA Macroeconomic Convergence Criteria under the COMESA Monetary Programme. However, challenges remain in attaining the criteria on fiscal deficit; annual average inflation; real GDP growth; debt reduction initiatives; and total domestic revenue to GDP ratio.
THE ASSOCIATION OF AFRICAN CENTRAL BANKSBackground
The Association of African Central Banks (AACB) was established at the Summit Conference of African Heads of State and Government in May 25, 1963 in Addis Ababa, Ethiopia. The AACB was charged to: promote co-operation in the monetary, banking and financial spheres in the African region and strengthen efforts aimed at bringing about and maintaining price and financial stability in the African region. Membership of the AACB is open to all African central banks. The Association comprises an assembly of African Central Bank Governors, which is the governing body, the Bureau and, sub-regional committees composed of Governors of Central Banks of the five (5) sub-regions as defined by the African Union. In addition, the AACB has a Secretariat, which is headed by an Executive Secretary to provide secretarial services to the Association.
• The Association adopted, in 2000, an African Monetary Cooperation Programme (AMCP) whose aim is to establish a harmonized monetary system with a view to setting up a common organ to work towards the creation of a single monetary zone by
2021. The AMCP spells out a hierarchy of primary and secondary criteria, with their relative target values and deadlines for compliance.
• To facilitate implementation of the AACB objectives, the Association provides for periodic meetings of Governors of central banks to promote exchange of ideas and experiences on monetary, financial and banking matters and co-operation in Africa and facilitate the collection, pooling and dissemination of information on monetary, banking, financial and other economic matters of interest to its members. To this end, the Association holds the Assembly of Governors meetings, a symposium for governors and a continental seminar for technical staff in member central banks on annual basis.
Status of Implementation of the AMCP for 2016The 40th ordinary meeting of the Assembly of Governors of the Association of African Central Banks (AACB) was held on the 16th August 2017, at the South African Reserve Bank (SARB).
The meeting reviewed the status of implementation of the African Monetary Cooperation Program (AMCP), among other issues, based on the targets set under stage III. Migration to Stage IV criteria has been delayed by weak country performance, largely on account of negative external shocks; and escalation of capital expenditures to address infrastructure gaps in most African States.
REGIONAL INTEGRATION DEVELOPMENTS
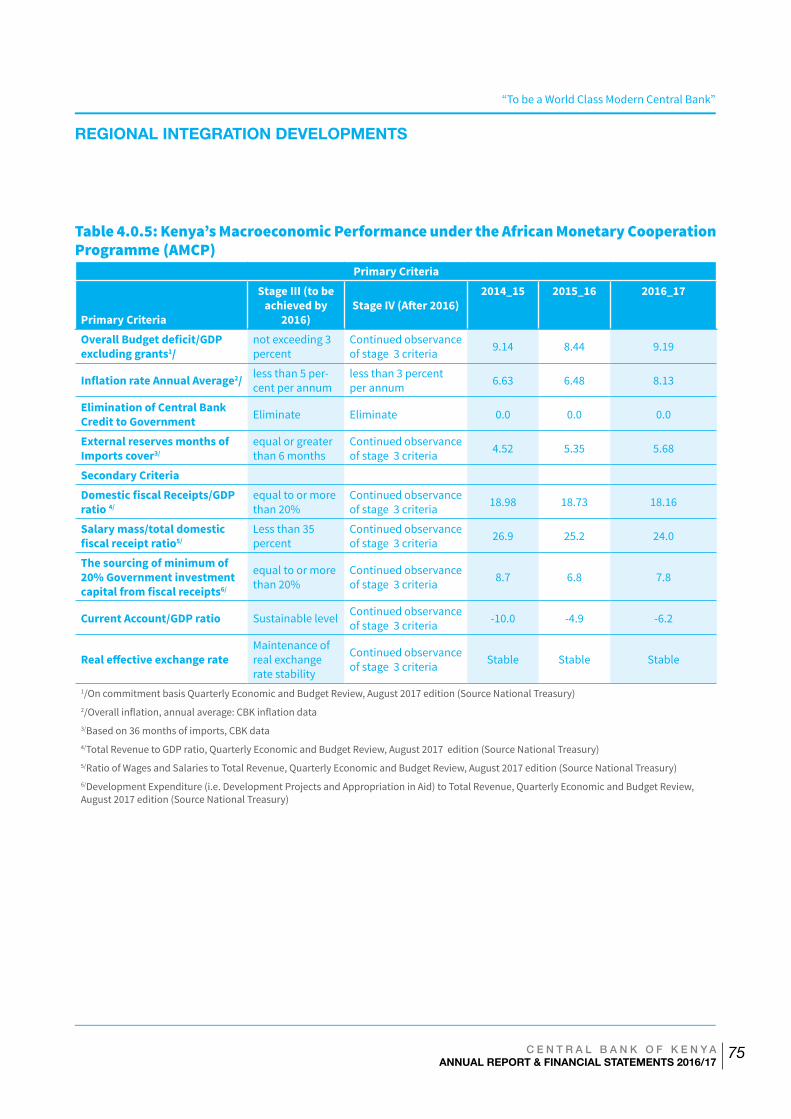
“To be a World Class Modern Central Bank”
C E N T R A L B A N K O F K E N Y AANNUAL REPORT & FINANCIAL STATEMENTS 2016/17
75
Table 4.0.5: Kenya’s Macroeconomic Performance under the African Monetary Cooperation Programme (AMCP)
Primary Criteria
Primary Criteria
Stage III (to be achieved by
2016)Stage IV (After 2016)
2014_15 2015_16 2016_17
Overall Budget deficit/GDP excluding grants1/
not exceeding 3 percent
Continued observance of stage 3 criteria 9.14 8.44 9.19
Inflation rate Annual Average2/ less than 5 per-cent per annum
less than 3 percent per annum 6.63 6.48 8.13
Elimination of Central Bank Credit to Government Eliminate Eliminate 0.0 0.0 0.0
External reserves months of Imports cover3/
equal or greater than 6 months
Continued observance of stage 3 criteria 4.52 5.35 5.68
Secondary Criteria Domestic fiscal Receipts/GDP ratio 4/
equal to or more than 20%
Continued observance of stage 3 criteria 18.98 18.73 18.16
Salary mass/total domestic fiscal receipt ratio5/
Less than 35 percent
Continued observance of stage 3 criteria 26.9 25.2 24.0
The sourcing of minimum of 20% Government investment capital from fiscal receipts6/
equal to or more than 20%
Continued observance of stage 3 criteria 8.7 6.8 7.8
Current Account/GDP ratio Sustainable level Continued observance of stage 3 criteria -10.0 -4.9 -6.2
Real effective exchange rateMaintenance of real exchange rate stability
Continued observance of stage 3 criteria Stable Stable Stable
1/On commitment basis Quarterly Economic and Budget Review, August 2017 edition (Source National Treasury)2/Overall inflation, annual average: CBK inflation data 3/Based on 36 months of imports, CBK data 4/Total Revenue to GDP ratio, Quarterly Economic and Budget Review, August 2017 edition (Source National Treasury)5/Ratio of Wages and Salaries to Total Revenue, Quarterly Economic and Budget Review, August 2017 edition (Source National Treasury)6/Development Expenditure (i.e. Development Projects and Appropriation in Aid) to Total Revenue, Quarterly Economic and Budget Review, August 2017 edition (Source National Treasury)
REGIONAL INTEGRATION DEVELOPMENTS
“To be a World Class Modern Central Bank”
C E N T R A L B A N K O F K E N Y AANNUAL REPORT & FINANCIAL STATEMENTS 2016/17
76
Kenya is on track to meeting the Macroeconomic Convergence Criteria under the AMCP. It however, did not meet most of the set targets under the primary criteria. The overall budget deficit (excluding grants) worsened during the FY 2016/17. The higher budget deficit was attributed to lower fiscal receipts. The overall annual average inflation increased to 8.13 per cent in 2016/17 from 6.48 per cent in 2015/16 and was above the government target range of (5+/-2.5 per cent) due to effects of prolonged drought that affected food prices. External reserves cover for imports of goods and services increased to 5.68 months in 2016/17 from 5.35 months in 2015/16 but remained below the target minimum of 6 months.
With regard to secondary criteria, challenges remain in attaining the domestic fiscal receipts to GDP ratio; and the sourcing of minimum of 20 per cent Government investment capital from fiscal receipts. The meeting of the Assembly of Governors took cognizance of the adverse impact of the international economic environment and,
regional as well as domestic factors on the African States, which made it difficult to meet the macro convergence criteria. It adopted the work by a group of experts on the harmonization of convergence criteria across the different regions in Africa. The study by the experts group recommended among other things:
• Harmonization of the primary macroeconomic convergence criteria in terms of thresholds, definitions, and measurements; revision of secondary criteria to include general government debt to GDP ratio;
• Revision of the timelines for the establishment of the Regional Central Banks and the African Central Bank; and
• Establishment of the African Monetary Institute by 2020.
REGIONAL INTEGRATION DEVELOPMENTS
“To be a World Class Modern Central Bank”
C E N T R A L B A N K O F K E N Y AANNUAL REPORT & FINANCIAL STATEMENTS 2016/17
77
77 C E N T R A L B A N K O F K E N Y AANNUAL REPORT & FINANCIAL STATEMENTS 2016/17
5.0 FINANCIAL PERFORMANCE
“To be a World Class Modern Central Bank”
C E N T R A L B A N K O F K E N Y AANNUAL REPORT & FINANCIAL STATEMENTS 2016/17
78
5.0 FINANCIAL PERFORMANCE OF THE CENTRAL BANK OF KENYA FOR THE YEAR ENDED JUNE 2017
“To be a World Class Modern Central Bank”
C E N T R A L B A N K O F K E N Y AANNUAL REPORT & FINANCIAL STATEMENTS 2016/17
79
CENTRAL BANK OF KENYAANNUAL REPORT AND
FINANCIAL STATEMENTSFOR THE YEAR ENDED
30 JUNE 2017
“To be a World Class Modern Central Bank”
C E N T R A L B A N K O F K E N Y AANNUAL REPORT & FINANCIAL STATEMENTS 2016/17
80
Table of contents Page No
Bank Information 81 - 82
Statement of Corporate Governance 84 - 89
Directors’ Report 90
Statement of Directors’ Responsibilities 91
Independent Auditor’s Report 92 - 97
Financial Statements:
Consolidated statement of comprehensive income 98
Consolidated statement of financial position 99
Consolidated statement of changes in equity 100
Consolidated statement of cash flows 101
Notes to the financial statements 102 - 140
FINANCIAL PERFORMANCE
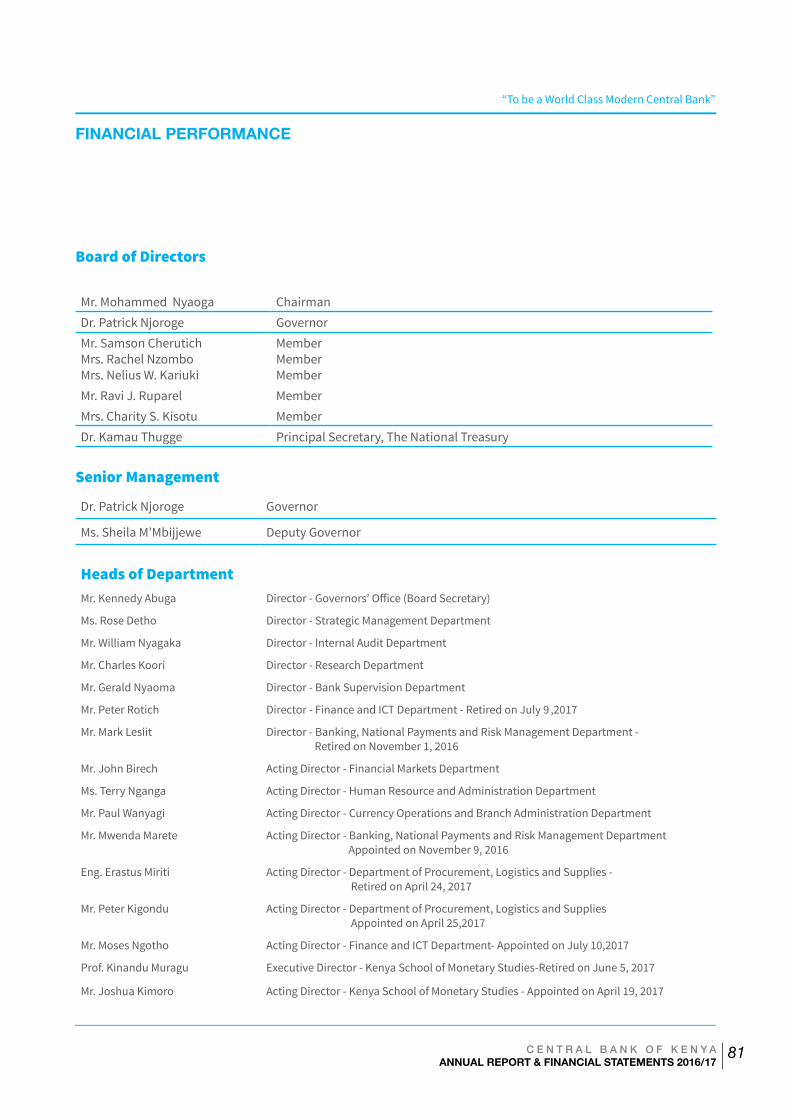
“To be a World Class Modern Central Bank”
C E N T R A L B A N K O F K E N Y AANNUAL REPORT & FINANCIAL STATEMENTS 2016/17
81
Board of Directors
Mr. Mohammed Nyaoga Chairman Dr. Patrick Njoroge GovernorMr. Samson CherutichMrs. Rachel NzomboMrs. Nelius W. Kariuki
MemberMemberMember
Mr. Ravi J. Ruparel MemberMrs. Charity S. Kisotu MemberDr. Kamau Thugge Principal Secretary, The National Treasury
Senior Management
Dr. Patrick Njoroge Governor
Ms. Sheila M’Mbijjewe Deputy Governor
Heads of DepartmentMr. Kennedy Abuga Director - Governors’ Office (Board Secretary)
Ms. Rose Detho Director - Strategic Management Department
Mr. William Nyagaka Director - Internal Audit Department
Mr. Charles Koori Director - Research Department
Mr. Gerald Nyaoma Director - Bank Supervision Department
Mr. Peter Rotich Director - Finance and ICT Department - Retired on July 9 ,2017
Mr. Mark Lesiit Director - Banking, National Payments and Risk Management Department - Retired on November 1, 2016
Mr. John Birech Acting Director - Financial Markets Department
Ms. Terry Nganga Acting Director - Human Resource and Administration Department
Mr. Paul Wanyagi Acting Director - Currency Operations and Branch Administration Department
Mr. Mwenda Marete Acting Director - Banking, National Payments and Risk Management Department Appointed on November 9, 2016
Eng. Erastus Miriti Acting Director - Department of Procurement, Logistics and Supplies - Retired on April 24, 2017
Mr. Peter Kigondu Acting Director - Department of Procurement, Logistics and Supplies Appointed on April 25,2017
Mr. Moses Ngotho Acting Director - Finance and ICT Department- Appointed on July 10,2017
Prof. Kinandu Muragu Executive Director - Kenya School of Monetary Studies-Retired on June 5, 2017
Mr. Joshua Kimoro Acting Director - Kenya School of Monetary Studies - Appointed on April 19, 2017
FINANCIAL PERFORMANCE
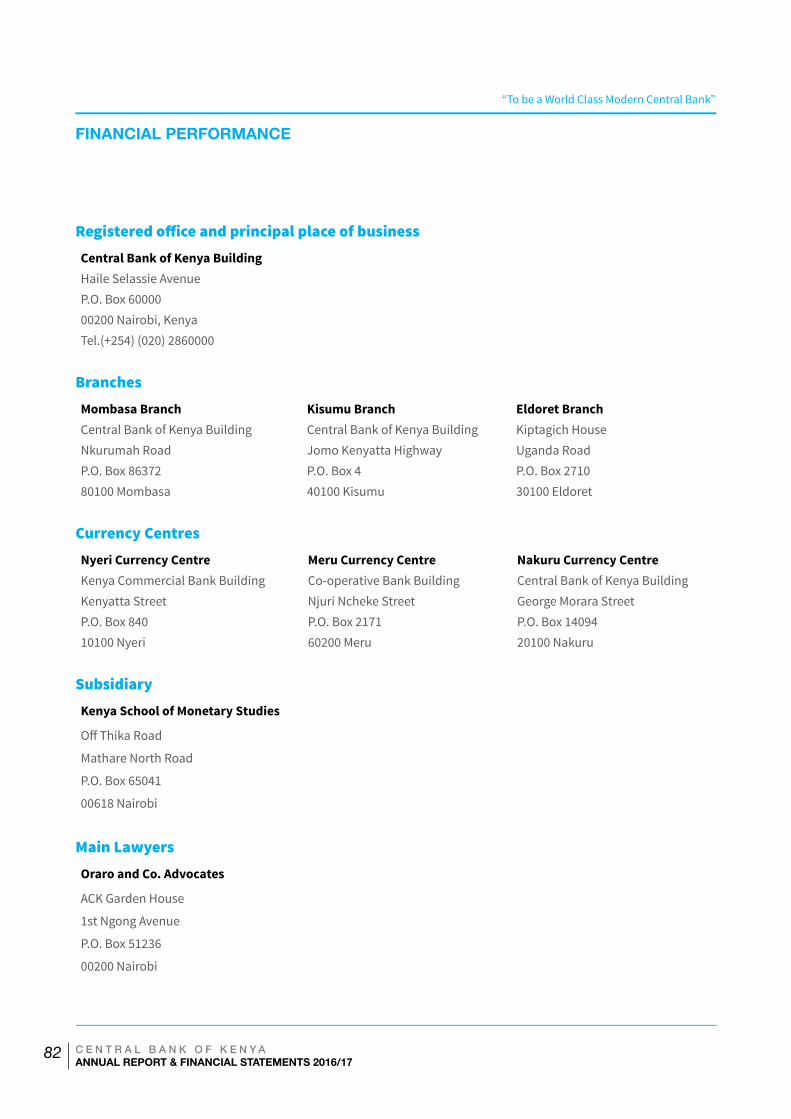
“To be a World Class Modern Central Bank”
C E N T R A L B A N K O F K E N Y AANNUAL REPORT & FINANCIAL STATEMENTS 2016/17
82
Registered office and principal place of businessCentral Bank of Kenya BuildingHaile Selassie AvenueP.O. Box 60000 00200 Nairobi, KenyaTel.(+254) (020) 2860000
BranchesMombasa Branch Kisumu Branch Eldoret BranchCentral Bank of Kenya Building Central Bank of Kenya Building Kiptagich HouseNkurumah Road Jomo Kenyatta Highway Uganda RoadP.O. Box 86372 P.O. Box 4 P.O. Box 271080100 Mombasa 40100 Kisumu 30100 Eldoret
Currency CentresNyeri Currency Centre Meru Currency Centre Nakuru Currency CentreKenya Commercial Bank Building Co-operative Bank Building Central Bank of Kenya BuildingKenyatta Street Njuri Ncheke Street George Morara StreetP.O. Box 840 P.O. Box 2171 P.O. Box 1409410100 Nyeri 60200 Meru 20100 Nakuru
Subsidiary Kenya School of Monetary Studies
Off Thika Road
Mathare North Road
P.O. Box 65041
00618 Nairobi
Main LawyersOraro and Co. Advocates
ACK Garden House
1st Ngong Avenue
P.O. Box 51236
00200 Nairobi
FINANCIAL PERFORMANCE
“To be a World Class Modern Central Bank”
C E N T R A L B A N K O F K E N Y AANNUAL REPORT & FINANCIAL STATEMENTS 2016/17
83
AuditorDeloitte & ToucheDeloitte PlaceWaiyaki Way, MuthangariP.O. Box 4009200100 Nairobi
On behalf of:-
The Auditor GeneralKenya National Audit OfficeAnniversary TowersP.O. Box 30084 00100 Nairobi
FINANCIAL PERFORMANCE
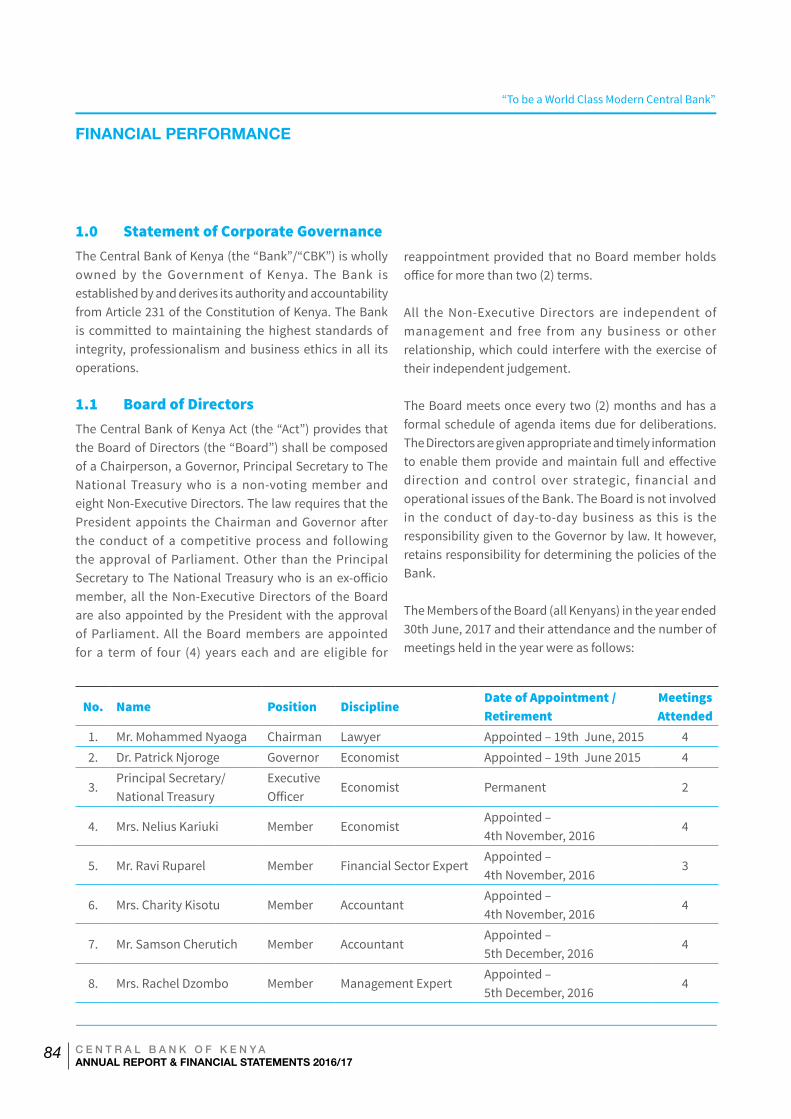
“To be a World Class Modern Central Bank”
C E N T R A L B A N K O F K E N Y AANNUAL REPORT & FINANCIAL STATEMENTS 2016/17
84
1.0 Statement of Corporate Governance
The Central Bank of Kenya (the “Bank”/“CBK”) is wholly owned by the Government of Kenya. The Bank is established by and derives its authority and accountability from Article 231 of the Constitution of Kenya. The Bank is committed to maintaining the highest standards of integrity, professionalism and business ethics in all its operations.
1.1 Board of DirectorsThe Central Bank of Kenya Act (the “Act”) provides that the Board of Directors (the “Board”) shall be composed of a Chairperson, a Governor, Principal Secretary to The National Treasury who is a non-voting member and eight Non-Executive Directors. The law requires that the President appoints the Chairman and Governor after the conduct of a competitive process and following the approval of Parliament. Other than the Principal Secretary to The National Treasury who is an ex-officio member, all the Non-Executive Directors of the Board are also appointed by the President with the approval of Parliament. All the Board members are appointed for a term of four (4) years each and are eligible for
reappointment provided that no Board member holds office for more than two (2) terms.
All the Non-Executive Directors are independent of management and free from any business or other relationship, which could interfere with the exercise of their independent judgement.
The Board meets once every two (2) months and has a formal schedule of agenda items due for deliberations. The Directors are given appropriate and timely information to enable them provide and maintain full and effective direction and control over strategic, financial and operational issues of the Bank. The Board is not involved in the conduct of day-to-day business as this is the responsibility given to the Governor by law. It however, retains responsibility for determining the policies of the Bank.
The Members of the Board (all Kenyans) in the year ended 30th June, 2017 and their attendance and the number of meetings held in the year were as follows:
No. Name Position DisciplineDate of Appointment / Retirement
Meetings Attended
1. Mr. Mohammed Nyaoga Chairman Lawyer Appointed – 19th June, 2015 42. Dr. Patrick Njoroge Governor Economist Appointed – 19th June 2015 4
3.Principal Secretary/ National Treasury
Executive Officer
Economist Permanent 2
4. Mrs. Nelius Kariuki Member EconomistAppointed – 4th November, 2016
4
5. Mr. Ravi Ruparel Member Financial Sector ExpertAppointed – 4th November, 2016
3
6. Mrs. Charity Kisotu Member AccountantAppointed – 4th November, 2016
4
7. Mr. Samson Cherutich Member AccountantAppointed – 5th December, 2016
4
8. Mrs. Rachel Dzombo Member Management ExpertAppointed – 5th December, 2016
4
FINANCIAL PERFORMANCE
“To be a World Class Modern Central Bank”
C E N T R A L B A N K O F K E N Y AANNUAL REPORT & FINANCIAL STATEMENTS 2016/17
85
The remuneration paid to the Directors for services rendered during the financial year 2016/2017 is disclosed in Note 28 to the financial statements. The Non-Executive Directors are paid a monthly retainer fee and a sitting allowance for every meeting attended. There were no loans to Non-Executive Directors during the year while Executive Directors are paid a monthly salary and are eligible for staff loans.
1.2 Secretary to the BoardThe Board Secretary provides technical and secretarial services as well as corporate governance and logistical support to the Board in order to facilitate efficient policy making interface with policy implementation. The Board Secretary also advises the Board on legal matters. In conjunction with the Chairman, the Board Secretary ensures good and timely information flow among the Board members, the Board Committees and Management. All members of the Board and Management have access to the Board Secretariat services.
1.3 Audit CommitteeThe members of the Audit Committee in the year ended 30th June, 2017 were Mr. Samson K. Cherutich (Chairman), Mr. Ravi J. Ruparel, Mrs. Charity S. Kisotu and Mrs. Nelius W. Kariuki. They were appointed to the Committee by the Board of Directors on 6th April, 2017. The members are all Non-Executive Directors with experience in Accounting, Auditing, Financial and Business Management. The Committee meets once every two (2) months and as necessary. The Terms of Reference of the Audit Committee cover five (5) major areas, namely; Internal Control System, Financial Reporting and Related Reporting Practices, External and Internal Audits.
The Audit Committee’s mandate, under Internal Control, includes ensuring that the importance of internal control and risk management is communicated effectively to staff and that they have a clear understanding of their roles and
responsibilities. It will also ensure that the Management has put in place adequate measures to ensure security of the bank’s information technology resources and that appropriate contingency plans for processing the Bank’s information in the event of unavailability of the IT resources are in existence. The Committee also ensures that internal and external audit recommendations are implemented.
The mandate relating to Financial Reporting and Related Reporting Practices requires the Audit Committee to review the annual financial statements of the Bank, the external auditor’s opinion and their comments on internal controls and other observations. The Committee also reviews significant accounting and reporting issues and their impact on financial reports and legal matters that could significantly impact on the financial statements, among other financial reporting responsibilities. With regard to External Audit, the Audit Committee reviews the external auditor’s proposed audit scope, approach and audit deliverables, and reviews the financial statements before submission to the Board for consideration and approval.
The Committee’s mandate on Internal Audit covers review of the activities and resources of the internal audit activity, including the effectiveness, standing and independence of the internal audit function within the Bank. It also covers review of the internal audit plan and follow up of the implementation of internal auditor findings and recommendations. The Audit Committee reports to the Board of Directors on the standing and independence of the internal audit function within the Bank. The Audit Committee also reports to the Board of Directors on internal audit scope, approach and deliverables.
The Committee Members’ positions, disciplines and number of meetings attended for the year ended 30th June 2017 were as follows:
FINANCIAL PERFORMANCE
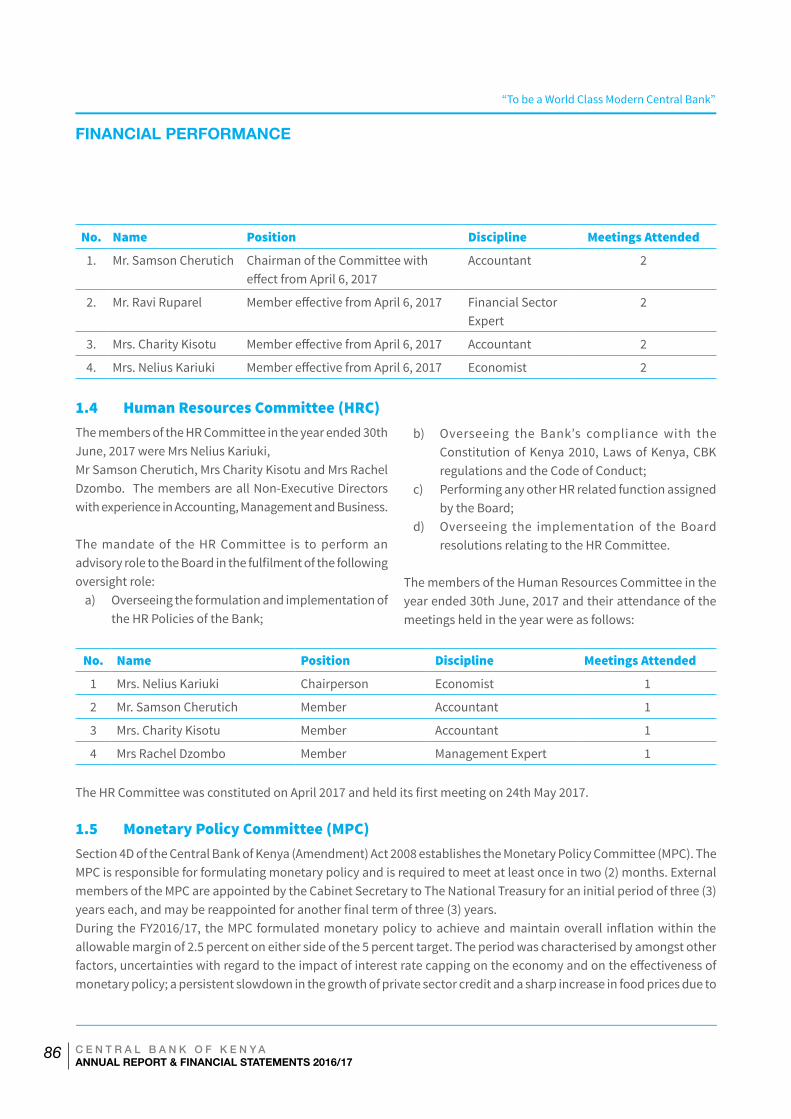
“To be a World Class Modern Central Bank”
C E N T R A L B A N K O F K E N Y AANNUAL REPORT & FINANCIAL STATEMENTS 2016/17
86
No. Name Position Discipline Meetings Attended
1. Mr. Samson Cherutich Chairman of the Committee with effect from April 6, 2017
Accountant 2
2. Mr. Ravi Ruparel Member effective from April 6, 2017 Financial Sector Expert
2
3. Mrs. Charity Kisotu Member effective from April 6, 2017 Accountant 2
4. Mrs. Nelius Kariuki Member effective from April 6, 2017 Economist 2
1.4 Human Resources Committee (HRC)The members of the HR Committee in the year ended 30th June, 2017 were Mrs Nelius Kariuki,Mr Samson Cherutich, Mrs Charity Kisotu and Mrs Rachel Dzombo. The members are all Non-Executive Directors with experience in Accounting, Management and Business.
The mandate of the HR Committee is to perform an advisory role to the Board in the fulfilment of the following oversight role:
a) Overseeing the formulation and implementation of the HR Policies of the Bank;
b) Overseeing the Bank’s compliance with the Constitution of Kenya 2010, Laws of Kenya, CBK regulations and the Code of Conduct;
c) Performing any other HR related function assigned by the Board;
d) Overseeing the implementation of the Board resolutions relating to the HR Committee.
The members of the Human Resources Committee in the year ended 30th June, 2017 and their attendance of the meetings held in the year were as follows:
No. Name Position Discipline Meetings Attended
1 Mrs. Nelius Kariuki Chairperson Economist 1
2 Mr. Samson Cherutich Member Accountant 1
3 Mrs. Charity Kisotu Member Accountant 1
4 Mrs Rachel Dzombo Member Management Expert 1
The HR Committee was constituted on April 2017 and held its first meeting on 24th May 2017.
1.5 Monetary Policy Committee (MPC)Section 4D of the Central Bank of Kenya (Amendment) Act 2008 establishes the Monetary Policy Committee (MPC). The MPC is responsible for formulating monetary policy and is required to meet at least once in two (2) months. External members of the MPC are appointed by the Cabinet Secretary to The National Treasury for an initial period of three (3) years each, and may be reappointed for another final term of three (3) years.During the FY2016/17, the MPC formulated monetary policy to achieve and maintain overall inflation within the allowable margin of 2.5 percent on either side of the 5 percent target. The period was characterised by amongst other factors, uncertainties with regard to the impact of interest rate capping on the economy and on the effectiveness of monetary policy; a persistent slowdown in the growth of private sector credit and a sharp increase in food prices due to
FINANCIAL PERFORMANCE
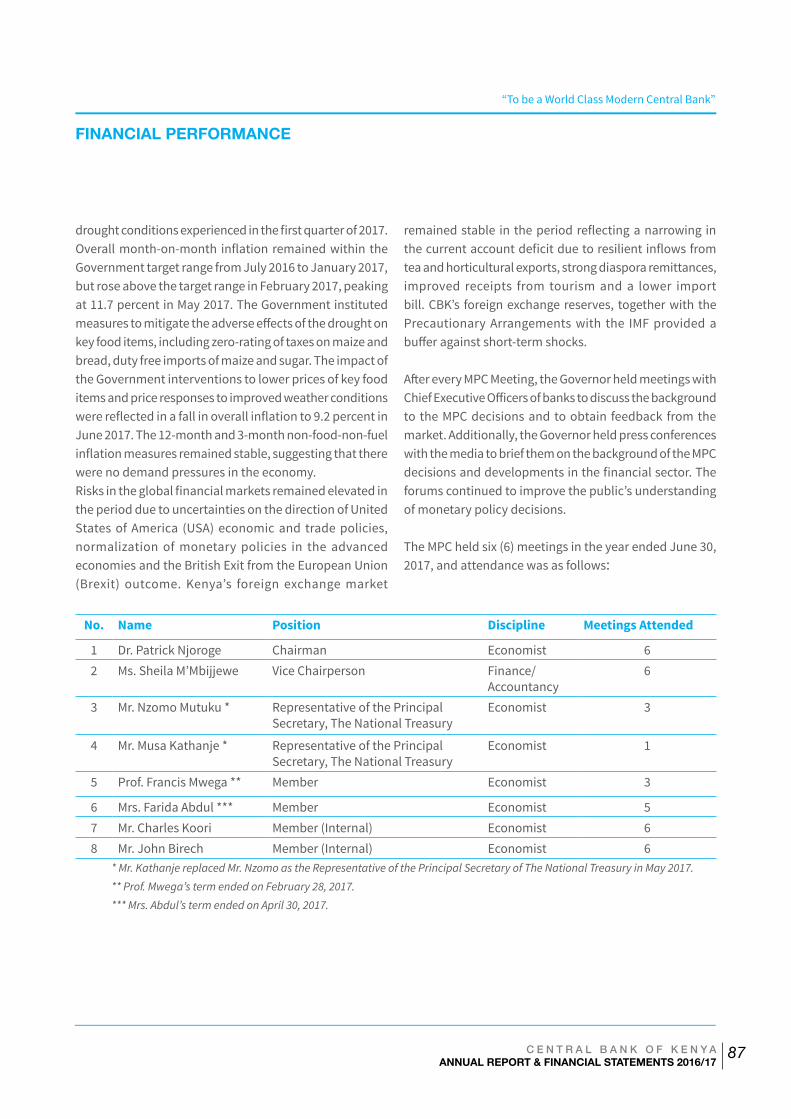
“To be a World Class Modern Central Bank”
C E N T R A L B A N K O F K E N Y AANNUAL REPORT & FINANCIAL STATEMENTS 2016/17
87
drought conditions experienced in the first quarter of 2017. Overall month-on-month inflation remained within the Government target range from July 2016 to January 2017, but rose above the target range in February 2017, peaking at 11.7 percent in May 2017. The Government instituted measures to mitigate the adverse effects of the drought on key food items, including zero-rating of taxes on maize and bread, duty free imports of maize and sugar. The impact of the Government interventions to lower prices of key food items and price responses to improved weather conditions were reflected in a fall in overall inflation to 9.2 percent in June 2017. The 12-month and 3-month non-food-non-fuel inflation measures remained stable, suggesting that there were no demand pressures in the economy.Risks in the global financial markets remained elevated in the period due to uncertainties on the direction of United States of America (USA) economic and trade policies, normalization of monetary policies in the advanced economies and the British Exit from the European Union (Brexit) outcome. Kenya’s foreign exchange market
remained stable in the period reflecting a narrowing in the current account deficit due to resilient inflows from tea and horticultural exports, strong diaspora remittances, improved receipts from tourism and a lower import bill. CBK’s foreign exchange reserves, together with the Precautionary Arrangements with the IMF provided a buffer against short-term shocks.
After every MPC Meeting, the Governor held meetings with Chief Executive Officers of banks to discuss the background to the MPC decisions and to obtain feedback from the market. Additionally, the Governor held press conferences with the media to brief them on the background of the MPC decisions and developments in the financial sector. The forums continued to improve the public’s understanding of monetary policy decisions.
The MPC held six (6) meetings in the year ended June 30, 2017, and attendance was as follows:
No. Name Position Discipline Meetings Attended
1 Dr. Patrick Njoroge Chairman Economist 62 Ms. Sheila M’Mbijjewe Vice Chairperson Finance/
Accountancy6
3 Mr. Nzomo Mutuku * Representative of the Principal Secretary, The National Treasury
Economist 3
4 Mr. Musa Kathanje * Representative of the Principal Secretary, The National Treasury
Economist 1
5 Prof. Francis Mwega ** Member Economist 3
6 Mrs. Farida Abdul *** Member Economist 57 Mr. Charles Koori Member (Internal) Economist 68 Mr. John Birech Member (Internal) Economist 6
* Mr. Kathanje replaced Mr. Nzomo as the Representative of the Principal Secretary of The National Treasury in May 2017.
** Prof. Mwega’s term ended on February 28, 2017.
*** Mrs. Abdul’s term ended on April 30, 2017.
FINANCIAL PERFORMANCE
“To be a World Class Modern Central Bank”
C E N T R A L B A N K O F K E N Y AANNUAL REPORT & FINANCIAL STATEMENTS 2016/17
88
1.6 Management StructureThe positions of Governor and Deputy Governor are set out in the CBK Act Cap 491 of the Laws of Kenya. The Governor and the Deputy Governor constitute the Central Bank’s Senior Management and meet regularly with the Heads of the Bank’s various departments indicated on page 82, to review the overall performance of the Bank.
There are several other Management Committees, which advise the Governor on specific issues to enable him discharge his responsibilities as the Chief Executive Officer of the Bank.
1.7 Code of EthicsThe Bank is committed to the highest standards of integrity, behaviour and ethics. A formal code of ethics for all employees has been approved by the Board and is fully implemented. All employees of the Bank are expected to avoid activities and financial interests, which could give rise to conflict of interest with their responsibilities in the Bank. Strict rules of conduct embedded in the Staff Rules and Regulations and the Employment Act 2007 apply to the entire Bank’s staff.
1.8 Internal ControlsThe Management of the Bank has put in place a systems of internal control mechanisms to ensure the reporting of complete and accurate accounting information. Procurement of goods and services is strictly done in accordance with the Public Procurement & Disposal Act, 2015. In all operational areas of the Bank, workflows have been structured in a manner that allows adequate segregation of duties.
1.9 Authorizations All the expenditure of the Bank must be authorized in accordance with a comprehensive set of the Bank policies and procedures. There is an annual Budget approved by the Board and a Procurement Plan approved by the Senior Management before commencement of the financial year. The Board of Directors receives regular management accounts comparing actual outcomes against budget as a means of monitoring actual financial performance of the Bank.
1.10 Internal Audit and Risk ManagementThe internal audit function is performed by Internal Audit Department. The Risk Management Unit is a separate function under Banking Department and is responsible for monitoring and providing advice on the Bank’s risk management framework. All reports of Internal Audit Department and Risk Management Unit are availed to the Audit Committee of the Board.
1.11 TransparencyThe Bank publishes an Annual Report, Monthly Economic Review, Weekly Releases, Statistical Bulletin and Bi-annual Monetary Policy Statement which explain current monetary policy and also, provide the expected monetary policy stance. In addition, the Bank issues policy briefs to The National Treasury on both the Monetary and Fiscal policies. On an annual basis, the Financial Statements of the Bank are published in the Kenya Gazette and are also placed in the Bank’s website.
FINANCIAL PERFORMANCE
“To be a World Class Modern Central Bank”
C E N T R A L B A N K O F K E N Y AANNUAL REPORT & FINANCIAL STATEMENTS 2016/17
89
2. Financial PerformanceThe Bank’s financial performance is affected by Monetary Policy undertaken, interest rates and exchange rate changes. The Bank’s financial performance is presented on page 82 of these financial statements.
During financial year ended 30 June, 2017, the Bank recorded a net surplus of Shs.17,050 million compared to a net deficit of Shs.4,640 million in financial year ended 30 June, 2016. The surplus has been added to the General Reserve Fund.
During the financial year ended 30 June, 2017, the Bank’s net interest income after impairment charge was Shs.12,747 million (2016: Shs.11,917 million) subject to the Loan impairment adjustment. Interest income was Shs.14,441 million (2016: Shs.15,933 million). Interest earnings on foreign reserves was Shs.7,070 million (2016: Shs.4,065 million). The increase is attributed to relatively higher interest rates on term deposits, foreign reserve build up partly from loan receipts by the Government and optimization of reserve currency mix. Interest earned on loans and advances was Shs.7,011 million(2016: Shs.10,858 million). The drop is due to reduced utilization of Government of Kenya overdraft facility and also, reduced advances to commercial banks due to a relatively more stable market during the year as compared to the previous year.
The interest expense was Shs.1,718 million (2016: Shs.3,957 million). The main contributor is the drop in Interest on monetary policy to Shs.1,445 million (2016: Shs.3,819 million) attributed to the monetary policy stance of relatively stable markets compared to previous year. The unrealized foreign exchange gain was Shs.8,516 million (2016 Loss Shs.19,969 million). This resulted from movement of the Kenya shilling to the USD between the two periods. In the previous year, the shilling had
strengthened against the British Pound and hence the loss recorded.
Trading income generated from sale of foreign currency is Shs.4,298 million (2016: Shs.6,496 million). The market was relatively stable compared to the previous year resulting in low volumes of sale of foreign currency during the period.
Operating expenses increased to Shs.11,137 million (2016: Shs.8,091 million) as a result of revaluation gains arising from retirement benefits assets of Shs.832 million (2016: Shs.1,835 million). In addition, Currency costs increased during the year to Shs.2,352 million (2016:Shs. 1,880 million) due to higher releases of currency notes and coins. The Bank’s Consolidated Statement of financial position for the year is set out on page 98.
The Bank’s assets decreased marginally to Shs.975,623 million (2016: Shs.982,849 million) which is attributed mainly to the more than offset of, the increase in balances due from banking institutions Shs.735,548 million (2016: Shs.696,004 million), by decrease in both Securities & advances to banks Shs.34,870 (2016: Shs.44,675) and Government overdraft Shs.24,449 million (2016: Shs.69,762 million).
Liabilities also decreased to Shs.841,580 million (2016: 865,856 million) attributed to the decrease in deposits from banks and the Government which was largely contributed by the full repayment of government overdraft facility and the decline of Reverse Repo (Repurchase Agreements) investment by commercial banks.
FINANCIAL PERFORMANCE
“To be a World Class Modern Central Bank”
C E N T R A L B A N K O F K E N Y AANNUAL REPORT & FINANCIAL STATEMENTS 2016/17
90
FINANCIAL PERFORMANCE
“To be a World Class Modern Central Bank”
C E N T R A L B A N K O F K E N Y AANNUAL REPORT & FINANCIAL STATEMENTS 2016/17
91
FINANCIAL PERFORMANCE
“To be a World Class Modern Central Bank”
C E N T R A L B A N K O F K E N Y AANNUAL REPORT & FINANCIAL STATEMENTS 2016/17
92
“To be a World Class Modern Central Bank”
C E N T R A L B A N K O F K E N Y AANNUAL REPORT & FINANCIAL STATEMENTS 2016/17
93
“To be a World Class Modern Central Bank”
C E N T R A L B A N K O F K E N Y AANNUAL REPORT & FINANCIAL STATEMENTS 2016/17
94
“To be a World Class Modern Central Bank”
C E N T R A L B A N K O F K E N Y AANNUAL REPORT & FINANCIAL STATEMENTS 2016/17
95
“To be a World Class Modern Central Bank”
C E N T R A L B A N K O F K E N Y AANNUAL REPORT & FINANCIAL STATEMENTS 2016/17
96
“To be a World Class Modern Central Bank”
C E N T R A L B A N K O F K E N Y AANNUAL REPORT & FINANCIAL STATEMENTS 2016/17
97
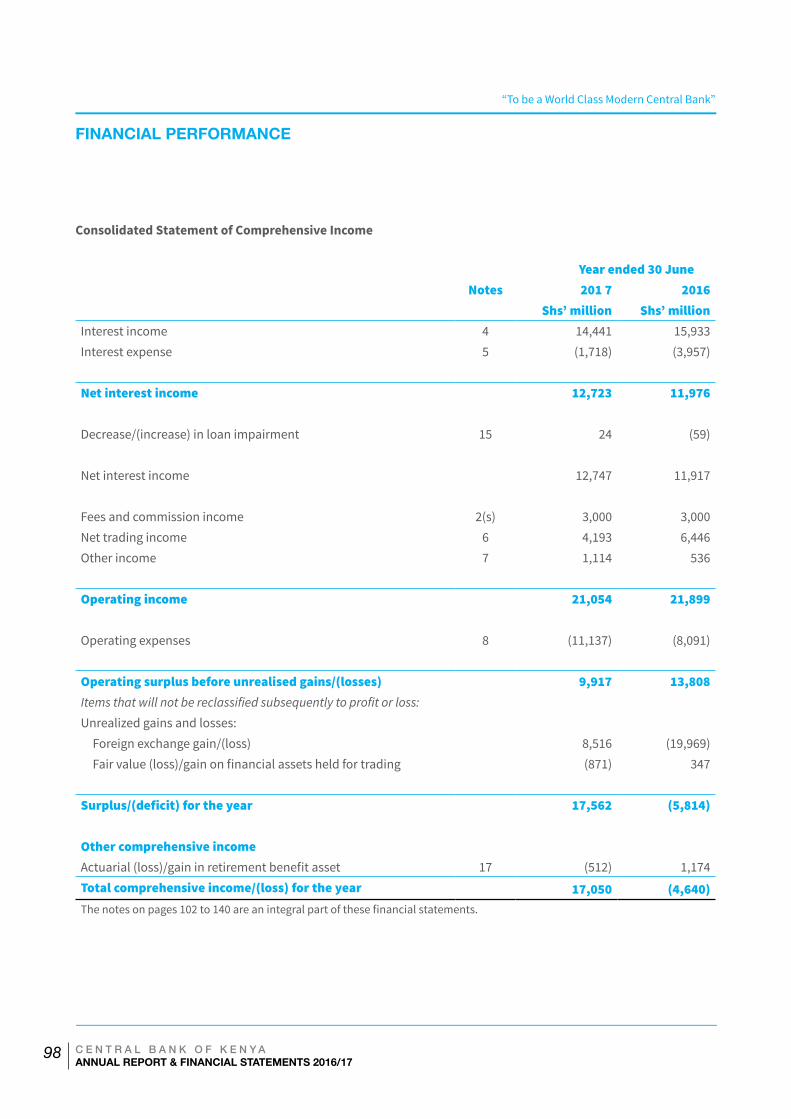
“To be a World Class Modern Central Bank”
C E N T R A L B A N K O F K E N Y AANNUAL REPORT & FINANCIAL STATEMENTS 2016/17
98
Consolidated Statement of Comprehensive Income
Year ended 30 JuneNotes 201 7 2016
Shs’ million Shs’ millionInterest income 4 14,441 15,933Interest expense 5 (1,718) (3,957)
Net interest income 12,723 11,976
Decrease/(increase) in loan impairment 15 24 (59)
Net interest income 12,747 11,917
Fees and commission income 2(s) 3,000 3,000Net trading income 6 4,193 6,446Other income 7 1,114 536
Operating income 21,054 21,899
Operating expenses 8 (11,137) (8,091)
Operating surplus before unrealised gains/(losses) 9,917 13,808Items that will not be reclassified subsequently to profit or loss:
Unrealized gains and losses:Foreign exchange gain/(loss) 8,516 (19,969)Fair value (loss)/gain on financial assets held for trading (871) 347
Surplus/(deficit) for the year 17,562 (5,814)
Other comprehensive incomeActuarial (loss)/gain in retirement benefit asset 17 (512) 1,174Total comprehensive income/(loss) for the year 17,050 (4,640)The notes on pages 102 to 140 are an integral part of these financial statements.
FINANCIAL PERFORMANCE
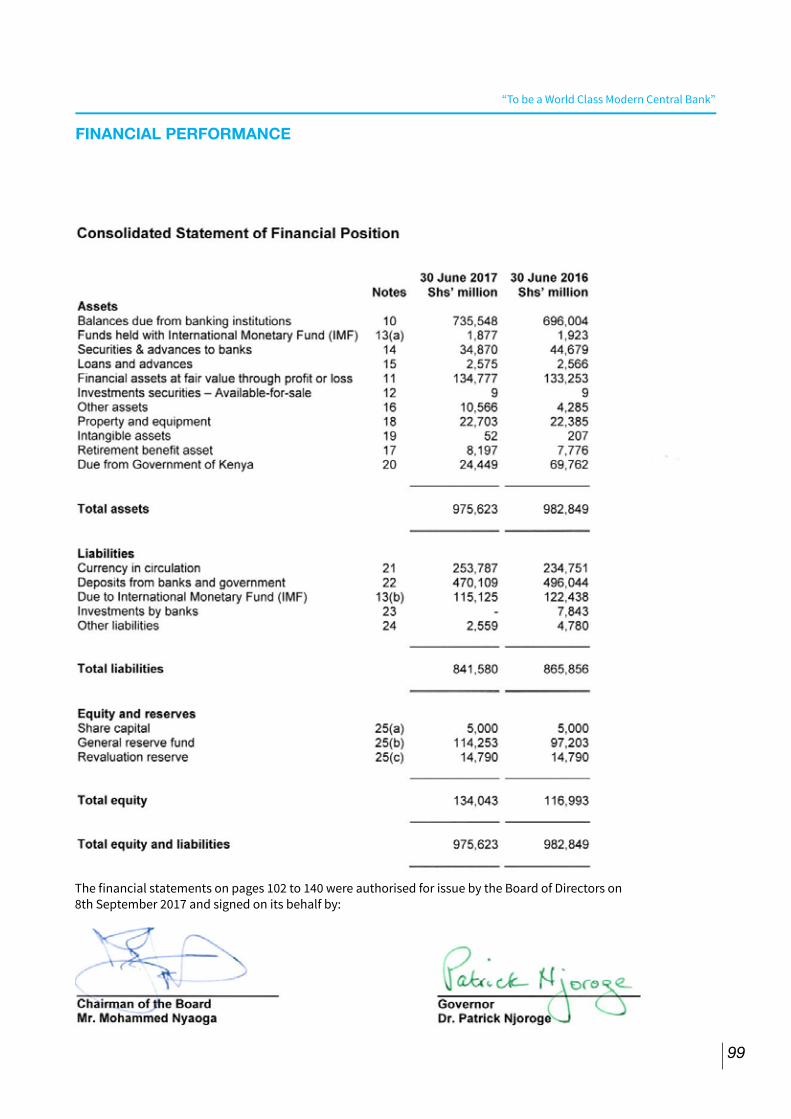
“To be a World Class Modern Central Bank”
C E N T R A L B A N K O F K E N Y AANNUAL REPORT & FINANCIAL STATEMENTS 2016/17
99
FINANCIAL PERFORMANCE
The financial statements on pages 102 to 140 were authorised for issue by the Board of Directors on 8th September 2017 and signed on its behalf by:
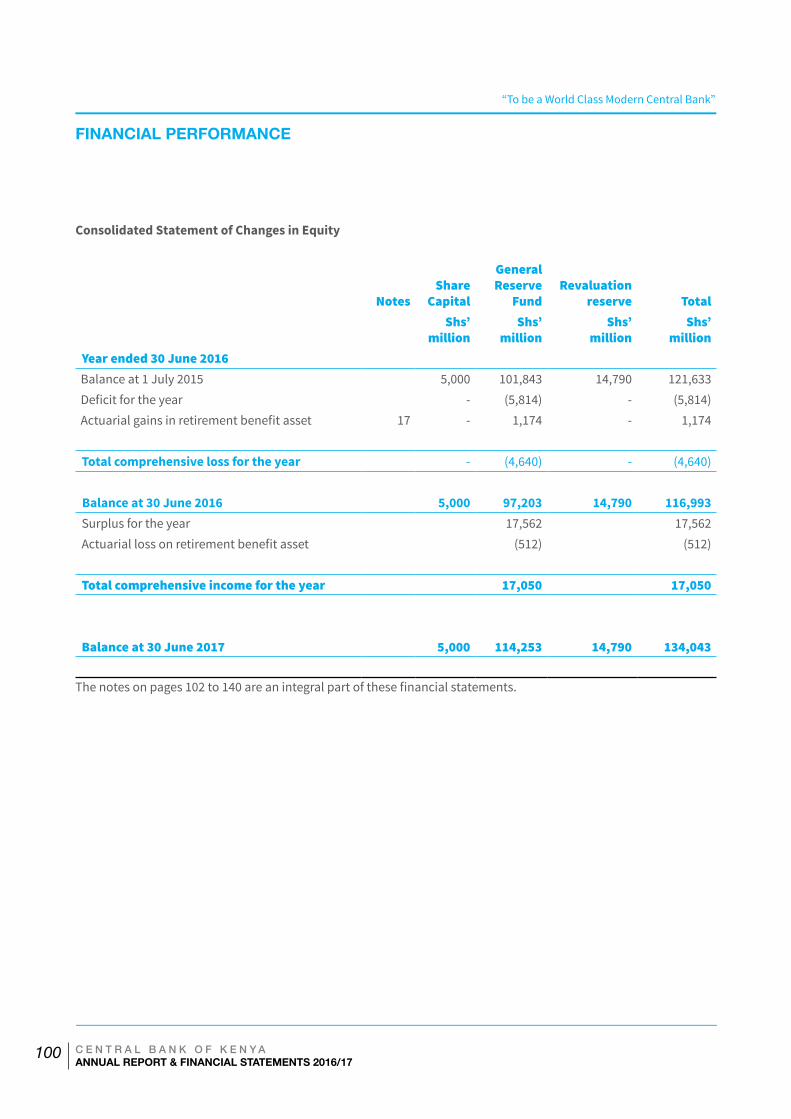
“To be a World Class Modern Central Bank”
C E N T R A L B A N K O F K E N Y AANNUAL REPORT & FINANCIAL STATEMENTS 2016/17
100
Consolidated Statement of Changes in Equity
NotesShare
Capital
General Reserve
FundRevaluation
reserve TotalShs’
millionShs’
millionShs’
millionShs’
millionYear ended 30 June 2016Balance at 1 July 2015 5,000 101,843 14,790 121,633Deficit for the year - (5,814) - (5,814)Actuarial gains in retirement benefit asset 17 - 1,174 - 1,174
Total comprehensive loss for the year - (4,640) - (4,640)
Balance at 30 June 2016 5,000 97,203 14,790 116,993Surplus for the year 17,562 17,562Actuarial loss on retirement benefit asset (512) (512)
Total comprehensive income for the year 17,050 17,050
Balance at 30 June 2017 5,000 114,253 14,790 134,043
The notes on pages 102 to 140 are an integral part of these financial statements.
FINANCIAL PERFORMANCE
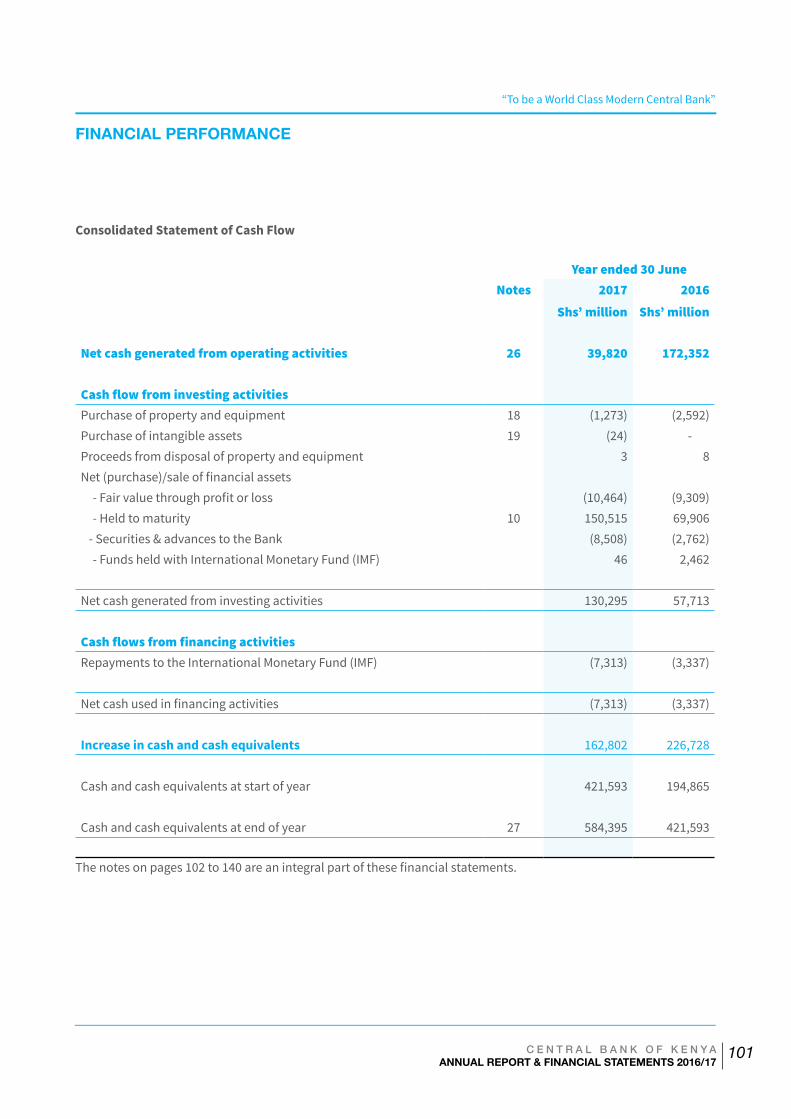
“To be a World Class Modern Central Bank”
C E N T R A L B A N K O F K E N Y AANNUAL REPORT & FINANCIAL STATEMENTS 2016/17
101
Consolidated Statement of Cash Flow
Year ended 30 JuneNotes 2017 2016
Shs’ million Shs’ million
Net cash generated from operating activities 26 39,820 172,352
Cash flow from investing activitiesPurchase of property and equipment 18 (1,273) (2,592)Purchase of intangible assets 19 (24) -Proceeds from disposal of property and equipment 3 8Net (purchase)/sale of financial assets
- Fair value through profit or loss (10,464) (9,309)- Held to maturity 10 150,515 69,906
- Securities & advances to the Bank (8,508) (2,762)- Funds held with International Monetary Fund (IMF) 46 2,462
Net cash generated from investing activities 130,295 57,713
Cash flows from financing activitiesRepayments to the International Monetary Fund (IMF) (7,313) (3,337)
Net cash used in financing activities (7,313) (3,337)
Increase in cash and cash equivalents 162,802 226,728
Cash and cash equivalents at start of year 421,593 194,865
Cash and cash equivalents at end of year 27 584,395 421,593
The notes on pages 102 to 140 are an integral part of these financial statements.
FINANCIAL PERFORMANCE
“To be a World Class Modern Central Bank”
C E N T R A L B A N K O F K E N Y AANNUAL REPORT & FINANCIAL STATEMENTS 2016/17
102
1 General informationCentral Bank of Kenya (the “Bank”/”CBK”) is established by and derives its authority and accountability from the Central Bank of Kenya Act, Cap 491 of the Laws of Kenya (the “CBK Act”). The Bank is wholly owned by the Government of Kenya and is domiciled in Kenya. The Bank acts as banker, advisor and agent of the Government of Kenya.
2 Summary of significant accounting policiesThe principal accounting policies adopted in the preparation of these Financial Statements are set out below. These policies have been consistently applied to all years presented, unless otherwise stated.
(a) Basis of preparationThe financial statements are prepared in compliance with International Financial Reporting Standards (IFRS). The measurement basis applied is the historical cost basis, except where otherwise stated in the accounting policies below. The financial statements are presented in Kenya Shillings (KShs), rounded to the nearest million.Changes in accounting policy and disclosures
(b) Adoption of new and revised International Financial Reporting Standards (IFRSs) and International Financial Reporting Interpretations Committee (IFRIC)
i) New standards and amendments to published standards effective for the year ended 30 June 2017
IFRS 14: Regulatory Deferral Accounts
IFRS 14 permits an entity which is a first-time adopter of International Financial Reporting Standards to continue to account, with some limited changes, for ‘regulatory deferral account balances’ in accordance with its previous GAAP,
Notes to the Financial Statements (continued)
both on initial adoption of IFRS and in subsequent financial statements.Applicable to annual periods beginning on or after 1 January 2016. The application of this Standard has had no effect on the consolidated financial statements. Amendments to IFRS 11
Amends IFRS 11 Joint Arrangements to require an acquirer of an interest in a joint operation in which the activity constitutes a business (as defined in IFRS 3 Business Combinations) to:
• apply all of the business combinations accounting principles in IFRS 3 and other IFRSs, except for those principles that conflict with the guidance in IFRS 11; and
• disclose the information required by IFRS 3 and other IFRSs for business combinations
Applicable to annual periods beginning on or after 1 January 2016. The application of these amendments has had no effect on the consolidated financial statements.
Amendments to IAS 16: Property, Plant and Equipment and IAS 38: Intangible Assets
Amends IAS 16 and IAS 38 to:• clarify that a depreciation method that is based
on revenue that is generated by an activity that includes the use of an asset is not appropriate for property, plant and equipment;
• introduce a rebuttable presumption that an amortisation method that is based on the revenue generated by an activity that includes the use of an intangible asset is inappropriate, which can only be overcome in limited circumstances where the intangible asset is expressed as a measure of revenue, or when it can be demonstrated that revenue and the consumption of the economic benefits of the intangible asset are highly correlated; and
FINANCIAL PERFORMANCE
“To be a World Class Modern Central Bank”
C E N T R A L B A N K O F K E N Y AANNUAL REPORT & FINANCIAL STATEMENTS 2016/17
103
• add guidance that expected future reductions in the selling price of an item that was produced using an asset could indicate the expectation of technological or commercial obsolescence of the asset, which, in turn, might reflect a reduction of the future economic benefits embodied in the asset.
Applicable to annual periods beginning on or after 1 January 2016. The application of these amendments has had no effect on the consolidated financial statements.
Amendments to IAS 16: Property, Plant and Equipment and IAS 41: Agriculture
Amends IAS 16 Property, Plant and Equipment and IAS 41 Agriculture to:• include ‘bearer plants’ within the scope of IAS
16 rather than IAS 41, allowing such assets to be accounted for a property, plant and equipment and measured after initial recognition on a cost or revaluation basis in accordance with IAS 16;
• introduce a definition of ‘bearer plants’ as a living plant that is used in the production or supply of agricultural produce, is expected to bear produce for more than one period and has a remote likelihood of being sold as agricultural produce, except for incidental scrap sales; and
• clarify that produce growing on bearer plants remains within the scope of IAS 41.
Applicable to annual periods beginning on or after 1 January 2016. The application of these amendments has had no effect on the consolidated financial statements.
Amendments to IAS 27: Separate Financial Statements
Amends IAS 27 to permit investments in subsidiaries, joint ventures and associates to be optionally accounted for using the equity method in separate financial statements.
Applicable to annual periods beginning on or after 1 January 2016. The application of these amendments has had no effect on the consolidated financial statements.
Amendments to IFRS 10: Consolidated Financial Statements and IAS 28: Investments in Associates and Joint Ventures (2011)
Amends IFRS 10 Consolidated Financial Statements and IAS 28 Investments in Associates and Joint Ventures (2011) to clarify the treatment of the sale or contribution of assets from an investor to its associate or joint venture, as follows:• require full recognition in the investor’s financial
statements of gains and losses arising on the sale or contribution of assets that constitute a business (as defined in IFRS 3 Business Combinations); and
• require the partial recognition of gains and losses where the assets do not constitute a business, i.e. a gain or loss is recognised only to the extent of the unrelated investors’ interests in that associate or joint venture.
Applicable to annual periods beginning on or after 1 January 2016. The application of these amendments has had no effect on the consolidated financial statements.
Annual Improvements to IFRSs 2012-2014 Cycle
The Annual Improvements to IFRSs 2012-2014 Cycle include a number of amendments to various IFRSs, which are summarised below:
IFRS 5, Non-current Assets Held for Sale and Discontinued Operations- The amendments introduce specific guidance in IFRS 5 for when an entity reclassifies an asset or disposal group) from held for sale to held for distribution to owners (or vice versa).
FINANCIAL PERFORMANCE
“To be a World Class Modern Central Bank”
C E N T R A L B A N K O F K E N Y AANNUAL REPORT & FINANCIAL STATEMENTS 2016/17
104
The amendments clarify that such a change should be considered as a continuation of the original plan of disposal and hence requirements set out in IFRS 5 regarding the change of sale plan do not apply. The amendments also clarifies the guidance for when held-for- distribution accounting is discontinued.
IFRS 7, Financial Instruments: Disclosures - The amendments provide additional guidance to clarify whether a servicing c o n t r a c t i s c o n t i n u i n g involvement in a transferred asset for the purpose of the disclosures required in relation to transferred assets.
IAS 19, Employee Benefits (2011) - The amendments clarify that the rate used to discount post-employment benefit obligations should be determined by reference to market yields at the end of the reporting period on high quality corporate bonds. The assessment of the depth of a market for high quality corporate bonds should be at the currency level (i.e. the same currency as the benefits are to be paid). For currencies for which there is no deep market in such high quality corporate bonds, the market yields at the end of the reporting period on government bonds denominated in that currency should be used instead.
ii) New and amended standards in issue but not yet effective in the year ended 30 June 2017
New standards and Amendments to standards Effective for annual periods beginning on or after
IFRS 9 Financial Instruments 1 January 2018IFRS 15 Revenue from contracts with customers 1 January 2018IFRS 16 Leases 1 January 2019Amendments to IAS 7 Statement of Cash Flows 1 January 2017
IFRS 9: Financial InstrumentsIFRS 9, issued in November 2009, introduced new requirements for the classification and measurement of financial assets. IFRS 9 was amended in October 2010 to include requirements for the classification and measurement of financial liabilities and for de-recognition.
Key requirements of IFRS 9:
Classification and measurement Financial assets are classified by reference to the business model within which they are held and their contractual cash flow characteristics. The 2014 version of IFRS 9 introduces a ‘fair value through other comprehensive income’ category for certain debt instruments. Financial liabilities are classified in a similar manner to under IAS 39, however there are differences in the requirements applying to the measurement of an entity’s own credit risk.
ImpairmentThe 2014 version of IFRS 9 introduces an ‘expected credit loss’ model for the measurement of the impairment of financial assets, so it is no longer necessary for a credit event to have occurred before a credit loss is recognised
Hedge accountingIntroduces a new hedge accounting model that is designed to be more closely aligned with how entities undertake risk management activities when hedging financial and non-financial risk exposures
FINANCIAL PERFORMANCE
“To be a World Class Modern Central Bank”
C E N T R A L B A N K O F K E N Y AANNUAL REPORT & FINANCIAL STATEMENTS 2016/17
105
De-recognitionThe requirements for the de-recognition of financial assets and liabilities are carried forward from IAS 39.
The directors of the bank are assessing the impact of the application of IFRS 9 in the future. The adoption of this standard may have an impact on the Bank’s consolidated financial statements in future periods.
IFRS 15: Revenue from Contracts with CustomersIn May 2014, IFRS 15 was issued which establishes a single comprehensive model for entities to use in accounting for revenue arising from contracts with customers. IFRS 15 will supersede the current revenue recognition guidance including IAS 18 Revenue, IAS 11 Construction Contracts and the related Interpretations when it becomes effective.
The core principle of IFRS 15 is that an entity should recognise revenue to depict the transfer of promised goods or services to customers in an amount that reflects the consideration to which the entity expects to be entitled in exchange for those goods or services.
The directors anticipate that the adoption of this standard may not have a significant impact on the Bank’s consolidated financial statements in future periods.
IFRS 16: LeasesIFRS 16 specifies how an IFRS reporter will recognise, measure, present and disclose leases. The standard provides a single lessee accounting model, requiring lessees to recognise assets and liabilities for all leases unless the lease term is 12 months or less or the underlying asset has a low value. Lessors continue to classify leases as operating or finance, with IFRS 16’s approach to lessor accounting substantially unchanged from its predecessor, IAS 17.
The directors of the bank are assessing the impact of the application of IFRS 16 in the future. The adoption of this standard may have an impact on the Bank’s consolidated financial statements in future periods.
Amendments to IAS 7: Statement of Cash Flows
Amends IAS 7 Statement of Cash Flows to clarify that entities shall provide disclosures that enable users of financial statements to evaluate changes in liabilities arising from financing activities
The directors anticipate that the application of these amendments may not have a significant impact on the Bank’s consolidated financial statements in future periods.
(c) Accounting for currency expensesThe cost of unissued bank note stocks is recognised in the statement of financial position as deferred currency costs under ‘other assets’. Bank note costs are charged to profit or loss in the year in which the bank notes are issued.
Coin minting costs are charged to profit or loss when issued to the public. The cost of new currency coins not yet issued is recognised as inventory within ‘other assets’ consistent with the accounting for the cost of unissued bank note stocks.
(d) ConsolidationKenya School of Monetary Studies is a subsidiary of the Bank. The Bank has the power to govern the financial and operating policies generally accompanying a shareholding of more than one half of the voting rights. Subsidiaries are fully consolidated from the date on which control is transferred to the Bank. The group uses the acquisition method to account for business combinations. The consideration transferred for the acquisition of a subsidiary is the fair values of the assets transferred, the liabilities incurred and
FINANCIAL PERFORMANCE
“To be a World Class Modern Central Bank”
C E N T R A L B A N K O F K E N Y AANNUAL REPORT & FINANCIAL STATEMENTS 2016/17
106
the equity interests issued by the group. Acquisition-related costs are expensed as incurred. Identifiable assets acquired and liabilities and contingent liabilities assumed in a business combination are measured initially at their fair value at the acquisition date.
The excess of the aggregate of the consideration transferred and the amount of any non-controlling interest in the acquiree and the acquisition-date fair value of any previous equity interest in the acquiree over the fair value of the Bank’s share of the identifiable net assets acquired is recorded as goodwill. If this is less than the fair value of the net assets of the subsidiary acquired in the case of a bargain purchase, the difference is recognised directly in profit or loss.Inter-company transactions, balances and unrealised gains on transactions between group entities are eliminated. Unrealised losses are also eliminated unless the transaction provides evidence of an impairment of the asset transferred. Accounting policies of subsidiaries have been changed where necessary to ensure consistency with the policies adopted by the Bank.
(e) Functional currency and translation of foreign currencies
i) Functional and presentation currencyItems included in the financial are measured using the currency of the primary economic environment in which the Bank operates (the “Functional Currency”). The financial statements are presented in Kenya Shillings (“Shs”) which is the Bank’s Functional Currency.
ii) Transactions and balancesForeign currency transactions are translated into the Functional Currency using exchange rates prevailing at the dates of the transactions or valuation where items are re-measured. All foreign exchange gains and losses are presented in profit or loss within ‘foreign exchange gains/(losses)’.
(f) Sale and repurchase agreementsSecurities sold subject to repurchase agreements (‘repos’) are reclassified in the financial statements as pledged assets when the transferee has the right by contract or custom to sell or repledge the collateral; the counterparty liability is included in investments by banks.
Securities purchased under agreements to resell (‘reverse repos’) are recorded as advances to banks. The difference between sale and repurchase price is treated as interest and accrued over the life of the agreements using the effective interest method. Securities lent to counterparties are also retained in the financial statements.
The Bank from time to time mops up money from the financial market (‘repos’) or injects money into the market (‘reverse repos’) with maturities of 4 - 7 days. The Bank engages in these transactions with commercial banks only. These have been disclosed in the financial statements as ‘advances to banks’ and ‘investments by banks’.
(g) Financial assets and liabilitiesi) Financial assets
The Bank classifies its financial assets in the following categories: financial assets at fair value through profit or loss, loans and receivables, held-to-maturity and available-for-sale financial assets. The directors determine the classification of its financial assets at initial recognition. The Bank uses trade date accounting for regular way contracts when recording financial asset transactions.
Financial assets at fair value through profit or lossThis category comprises two sub-categories: financial assets classified as held for trading, and financial assets designated by the Bank as at fair value through profit or loss upon initial recognition.
FINANCIAL PERFORMANCE
“To be a World Class Modern Central Bank”
C E N T R A L B A N K O F K E N Y AANNUAL REPORT & FINANCIAL STATEMENTS 2016/17
107
A financial asset is classified as held for trading if it is acquired or incurred principally for the purpose of selling or repurchasing it in the near term or if it is part of a portfolio of identified financial instruments that are managed together and for which there is evidence of a recent actual pattern of short-term profit-taking. Derivatives are also categorised as held for trading unless they are designated and effective as hedging instruments. All derivatives are carried as assets when fair value is positive and as liabilities when fair value is negative.
The Bank designates certain financial assets upon initial recognition as at fair value through profit or loss (fair value option). This designation cannot subsequently be changed and can only be applied when the following conditions are met:• the application of the fair value option reduces
or eliminates an accounting mismatch that would otherwise arise or
• the financial assets are part of a portfolio of financial instruments which is risk managed and reported to senior management on a fair value basis or
• the financial assets consist of debt host and embedded derivatives that must be separated.
Financial instruments included in this category are recognised initially at fair value; transaction costs are taken directly to profit or loss. Gains and losses arising from changes in fair value are included directly in profit or loss and are reported as Fair value loss on financial assets held for trading ‘. Interest income and expense and dividend income and expenses on financial assets held for trading are included in interest income’ and ‘interest expense’ respectively.
Loans and receivablesLoans and receivables are non-derivative financial assets with fixed or determinable payments that are not quoted in an active market.Loans and receivables are initially recognised at fair
value – which is the cash consideration to originate or purchase the loan including any transaction costs – and measured subsequently at amortised cost using the effective interest method.
The Bank operates a staff loans scheme for its employees for the provision of facilities such as house and car loans. The loans are granted to staff at an interest rate of 3% per annum which generally below the prevailing market interest rates. Loans issued at non market rates are initially measured at fair value (by discounting the related cash flows using market rates of interest) and subsequently carried at amortised cost. The difference between the fair value of the loans and the carrying amount at inception is treated as a long term employee benefit and is accounted for as a deferred cost. The resulting loan adjustment account is released to interest income over the loan period in line with the unwinding of the discount, while the deferred cost is expensed to staff costs as the services are rendered to the Bank over the period of the loan.
Available-for-sale financial assetsAvailable-for-sale financial assets are non-derivatives that are either designated in this category or not classified in any of the other categories. They are included in non-current assets unless the investment matures or management intends to dispose of it within 12 months of the end of the reporting period.
Available-for-sale financial assets are measured at fair value. Gains or losses arising from fair value re-measurements are included in other comprehensive income.
ii. Financial liabilitiesThe Bank’s holding in financial liabilities represents mainly deposits from banks and government and other liabilities. Such financial liabilities are initially recognised at fair value and subsequently measured at amortised cost.
FINANCIAL PERFORMANCE
“To be a World Class Modern Central Bank”
C E N T R A L B A N K O F K E N Y AANNUAL REPORT & FINANCIAL STATEMENTS 2016/17
108
Cash Reserve Ratio are statutory deposits taken from commercial banks and non-bank financial institutions for liquidity management as part of monetary policies in accordance with the Kenyan Banking Act and are interest free.
iii. Determination of fair valueFor financial instruments traded in active markets, the determination of fair values of financial instruments is based on quoted market prices or dealer price quotations. This includes listed equity securities and quoted debt instruments on major exchanges and broker quotes from Bloomberg.
A financial instrument is regarded as quoted in an active market if quoted prices are readily and regularly available from an exchange, dealer, broker, industry group, pricing service or regulatory agency, and those prices represent actual and regularly occurring market transactions on an arm’s length basis. If the above criteria are not met, the market is regarded as being inactive. Indicators that a market is inactive are when there is a wide bid-offer spread or significant increase in the bid-offer spread or there are few recent transactions.For all other financial instruments, fair value is determined using valuation techniques. In these techniques, fair values are estimated from observable data in respect of similar financial instruments, using models to estimate the present value of expected future cash flows or other valuation techniques, using inputs.In cases when the fair value of unlisted equity instruments cannot be determined reliably, the instruments are carried at cost less impairment. The fair values of contingent liabilities and irrevocable loan commitments correspond to their carrying amounts.
iv. De-recognitionFinancial assets are derecognised when the contractual rights to receive the cash flows from these assets have ceased to exist or the assets have been transferred and substantially all the risks and rewards of ownership of the assets are also transferred (that is, if substantially all the risks and rewards have not been transferred, the Bank tests control to ensure that continuing involvement on the basis of any retained powers of control does not prevent de-recognition). Financial liabilities are derecognised when they have been redeemed or otherwise extinguished.
FINANCIAL PERFORMANCE
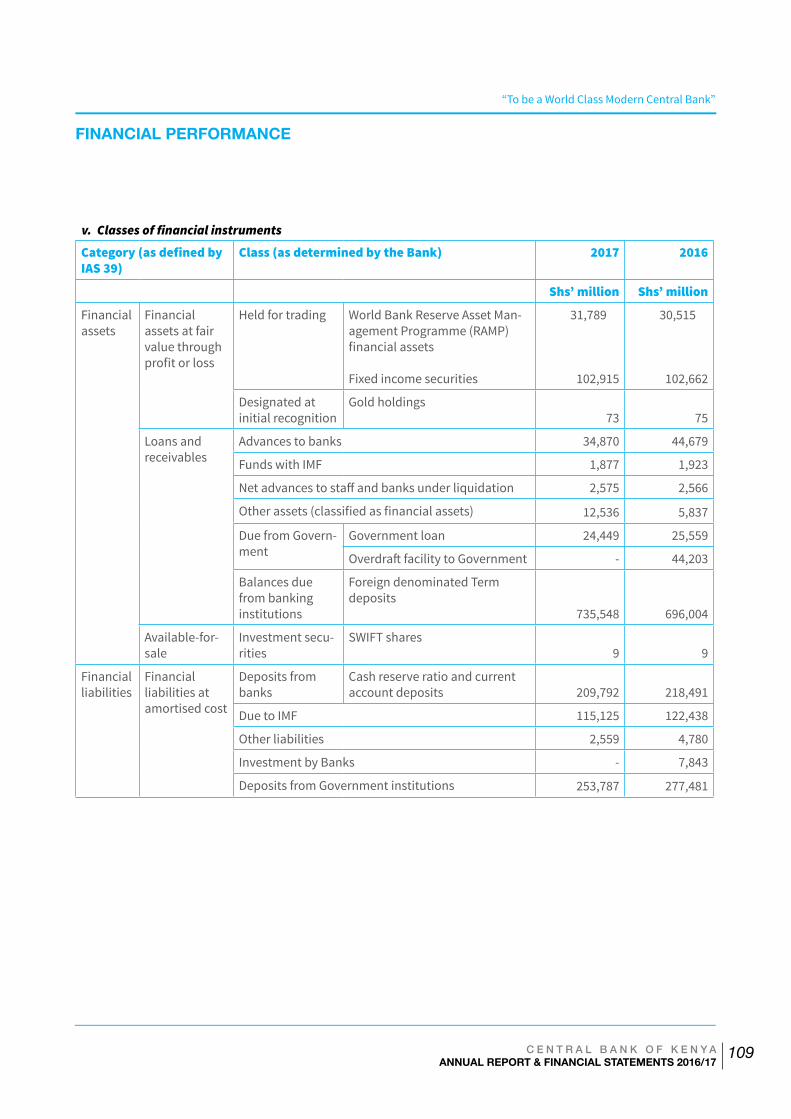
“To be a World Class Modern Central Bank”
C E N T R A L B A N K O F K E N Y AANNUAL REPORT & FINANCIAL STATEMENTS 2016/17
109
v. Classes of financial instruments
Category (as defined by IAS 39)
Class (as determined by the Bank) 2017 2016
Shs’ million Shs’ million
Financial assets
Financial assets at fair value through profit or loss
Held for trading World Bank Reserve Asset Man-agement Programme (RAMP) financial assets
Fixed income securities
31,789
102,915
30,515
102,662
Designated at initial recognition
Gold holdings73 75
Loans and receivables
Advances to banks 34,870 44,679
Funds with IMF 1,877 1,923
Net advances to staff and banks under liquidation 2,575 2,566
Other assets (classified as financial assets) 12,536 5,837
Due from Govern-ment
Government loan 24,449 25,559
Overdraft facility to Government - 44,203
Balances due from banking institutions
Foreign denominated Term deposits
735,548 696,004
Available-for-sale
Investment secu-rities
SWIFT shares9 9
Financial liabilities
Financial liabilities at amortised cost
Deposits from banks
Cash reserve ratio and current account deposits 209,792 218,491
Due to IMF 115,125 122,438
Other liabilities 2,559 4,780
Investment by Banks - 7,843
Deposits from Government institutions 253,787 277,481
FINANCIAL PERFORMANCE
“To be a World Class Modern Central Bank”
C E N T R A L B A N K O F K E N Y AANNUAL REPORT & FINANCIAL STATEMENTS 2016/17
110
vi. Impairment of financial assets
(a) Loans and receivablesThe Bank assesses at each reporting date whether there is objective evidence that a financial asset or group of financial assets is impaired. If there is objective evidence that an impairment loss on loans carried at amortised cost has been incurred, the amount of the loss is measured as the difference between the asset’s carrying amount and the present value of estimated future cash flows (excluding future credit losses that have not been incurred) discounted at the financial instrument’s original effective interest rate. The carrying amount of the asset is reduced through the use of an allowance account and the amount of the loss is recognised in profit or loss. A loan is normally written off, either partially or in full, when there is no realistic prospect of recovery of the principal amount, and for a collateralised loan, after taking into account any value of the security which has been realised.
(b) Available for sale financial assetsThe Bank assesses at each reporting date whether there is objective evidence that a financial asset or group of financial assets is impaired. If there is objective evidence that an impairment loss, the cumulative loss – measured as the difference between the acquisition cost and the current fair value, less any impairment loss on that financial asset previously recognised in profit or loss – is removed from equity and recognised in profit or loss.If, in a subsequent period, the fair value of a debt instrument classified as available-for-sale increases and the increase can be objectively related to an event occurring after the impairment loss was recognised in profit or loss, the impairment loss is reversed through profit or loss.
If any such evidence exists for available-for-sale financial assets, impairment losses recognised in profit or loss on equity instruments are not reversed through profit or loss.
vii. Offsetting financial instrumentsFinancial assets and liabilities are offset and the net amount reported in the statement of financial position when there is a legally enforceable right to set off the recognised amounts and there is an intention to settle on a net basis, or realise the asset and settle the liability simultaneously.
(h) Cash and cash equivalentsCash and cash equivalents include cash in hand, deposits held at call with banks and other short-term highly liquid investments with original maturities of three months or less.
(i) Property and equipmentLand and buildings comprise mainly branches and offices. All equipment used by the Bank is stated at historical cost less depreciation. Historical cost includes expenditure that is directly attributable to the acquisition of the items. Land and buildings are stated at valuation less accumulated depreciation. Valuations are carried out every three years.
Subsequent expenditures are included in the asset’s carrying amount or are recognised as a separate asset, as appropriate, only when it is probable that future economic benefits associated with the item will flow to the Bank and the cost of the item can be measured reliably. The carrying amount of the replaced part is de-recognised. All other repair and maintenance costs are charged to profit or loss during the financial period in which they are incurred.Freehold land is not depreciated. Depreciation of other assets is calculated using the straight-line method to allocate their cost or revalued amounts to their residual values over their estimated useful lives, as follows:
FINANCIAL PERFORMANCE
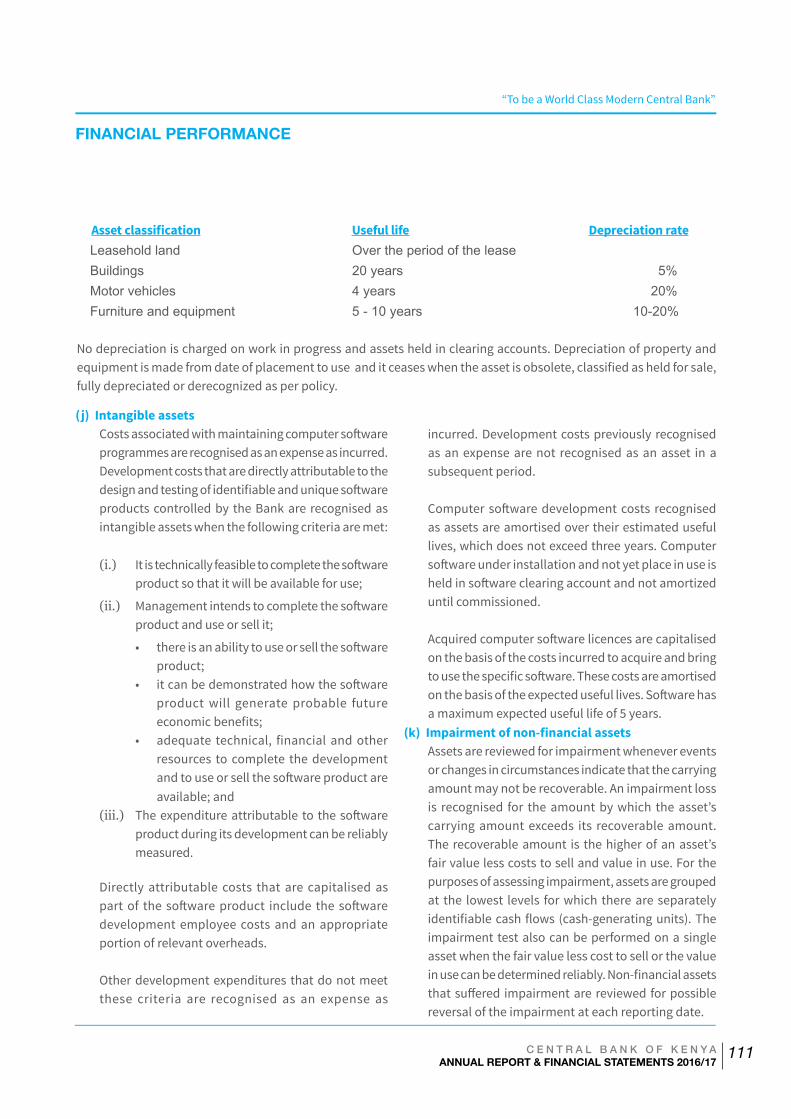
“To be a World Class Modern Central Bank”
C E N T R A L B A N K O F K E N Y AANNUAL REPORT & FINANCIAL STATEMENTS 2016/17
111
Asset classification Useful life Depreciation rateLeasehold land Over the period of the lease Buildings 20 years 5% Motor vehicles 4 years 20% Furniture and equipment 5 - 10 years 10-20%
No depreciation is charged on work in progress and assets held in clearing accounts. Depreciation of property and equipment is made from date of placement to use and it ceases when the asset is obsolete, classified as held for sale, fully depreciated or derecognized as per policy.
(j) Intangible assetsCosts associated with maintaining computer software programmes are recognised as an expense as incurred. Development costs that are directly attributable to the design and testing of identifiable and unique software products controlled by the Bank are recognised as intangible assets when the following criteria are met:
(i.) It is technically feasible to complete the software product so that it will be available for use;
(ii.) Management intends to complete the software product and use or sell it;
• there is an ability to use or sell the software product;
• it can be demonstrated how the software product will generate probable future economic benefits;
• adequate technical, financial and other resources to complete the development and to use or sell the software product are available; and
(iii.) The expenditure attributable to the software product during its development can be reliably measured.
Directly attributable costs that are capitalised as part of the software product include the software development employee costs and an appropriate portion of relevant overheads.
Other development expenditures that do not meet these criteria are recognised as an expense as
incurred. Development costs previously recognised as an expense are not recognised as an asset in a subsequent period.
Computer software development costs recognised as assets are amortised over their estimated useful lives, which does not exceed three years. Computer software under installation and not yet place in use is held in software clearing account and not amortized until commissioned.
Acquired computer software licences are capitalised on the basis of the costs incurred to acquire and bring to use the specific software. These costs are amortised on the basis of the expected useful lives. Software has a maximum expected useful life of 5 years.
(k) Impairment of non-financial assetsAssets are reviewed for impairment whenever events or changes in circumstances indicate that the carrying amount may not be recoverable. An impairment loss is recognised for the amount by which the asset’s carrying amount exceeds its recoverable amount. The recoverable amount is the higher of an asset’s fair value less costs to sell and value in use. For the purposes of assessing impairment, assets are grouped at the lowest levels for which there are separately identifiable cash flows (cash-generating units). The impairment test also can be performed on a single asset when the fair value less cost to sell or the value in use can be determined reliably. Non-financial assets that suffered impairment are reviewed for possible reversal of the impairment at each reporting date.
FINANCIAL PERFORMANCE
“To be a World Class Modern Central Bank”
C E N T R A L B A N K O F K E N Y AANNUAL REPORT & FINANCIAL STATEMENTS 2016/17
112
(l) Employee benefitsThe Bank operates a defined benefit and defined contribution pension schemes. The schemes are funded through payments to trustee-administered funds on a monthly basis. On the defined contribution scheme, the Bank pays fixed contributions to the scheme. The payments are charged to the profit or loss in the year to which they relate. The Bank has no further payment obligation once the contributions have been paid.The defined benefit plan defines an amount of pension benefit that an employee will receive on retirement, dependent on age, years of service and compensation. The assets of the scheme are held by the Bank in an independent trustee administered fund. The asset recognised in the statement of financial position in respect of the defined benefit pension scheme is the fair value of the scheme’s assets less the present value of the defined benefit obligation at the reporting date. The defined benefit obligation is calculated annually by an independent actuary using the projected unit method. The present value of the defined benefit obligation is determined by discounting the estimated cash outflows using interest rates of Kenya treasury bonds that have terms to maturity approximating to the terms of the related pension liability.The asset recognised in the statement of financial position in respect of defined benefit pension plans is the present value of the defined benefit obligation at the end of the reporting period less the fair value of plan assets, together with adjustments for unrecognised past-service costs. The defined benefit obligation is calculated annually by independent actuaries using the projected unit credit method. The present value of the defined benefit obligation is determined by discounting the estimated future cashoutflows using interest rates of government bonds that are denominated in the currency in which the benefits will be paid, and that have terms to maturity approximating to the terms of the related pension obligation.
Past-service costs are recognised immediately in income, unless the changes to the pension plan are conditional on the employees remaining in service for a specified period of time (the vesting period). In this case, the past-service costs are amortised on a straight-line basis over the vesting period.The Bank and all its employees contribute to the National Social Security Fund, which is a defined contribution scheme.
A defined contribution plan is a retirement benefit plan under which the Bank pays fixed contributions into a separate entity. The Bank has no legal or constructive obligations to pay further contributions if the fund does not hold sufficient assets to pay all employees the benefits relating to employee service in the current and prior periods.
The Bank’s contributions to the defined contribution scheme are charged to the profit or loss account in the year in which they fall due.The estimated monetary liability for employees’ accrued annual leave entitlement at the reporting date is recognised as an expense accrual.
(m) Income taxSection 7 of the Income Tax Act exempts the Bank from any taxation imposed by law in respect of income or profits. This exemption includes stamp duty in respect of instruments executed by or on behalf of the Bank.
(n) ProvisionsProvisions are recognised when: the Bank has a present legal or constructive obligation as a result of past events; it is probable that an outflow of resources will be required to settle the obligation; and the amount has been reliably estimated. Provisions are not recognised for future operating losses.
Where there are a number of similar obligations, the likelihood that an outflow will be required in settlement is determined by considering the class
FINANCIAL PERFORMANCE
“To be a World Class Modern Central Bank”
C E N T R A L B A N K O F K E N Y AANNUAL REPORT & FINANCIAL STATEMENTS 2016/17
113
of obligations as a whole. A provision is recognised even if the likelihood of an outflow with respect to any one item included in the same class of obligations may be small.
Provisions are measured at the present value of the expenditures expected to be required to settle the obligation at a rate that reflects current market assessments of the time value of money and the risks specific to the obligation. The increase in the provision due to passage of time is recognised as interest expense.
(o) Surplus fundsThe Central Bank of Kenya Act (Cap 491) allows the Bank to retain at least 10% or any other amounts as the board, in consultation with the minister, may determine, off the net annual profit (surplus) of the bank after allowing for the expenses of operations and after provision has been made for bad and doubtful debts, depreciation in assets, contributions to staff benefit funds, and such other contingencies and accounting provisions as the Bank deems appropriate.
(p) Share capitalOrdinary shares are classified as ‘share capital’ in equity.
(q) LeasesBank as lessee
The leases entered into by the Bank are primarily operating leases. Payments made under operating leases (net of any incentives received from the lessor) are charged to the income statement on a straight-line basis over the period of the lease.
Bank as lessorThe group leases certain property, plant and equipment where it does not transfer substantially all the risks and benefits of ownership of the assets. The operating leases generate rental income which is recorded in the income statement on a straight-line basis over the period of the lease.
(r) Interest income and expenseInterest income and expense for all interest-bearing financial instruments are recognised in profit or loss using the effective interest method.
The effective interest method is a method of calculating the amortised cost of a financial asset or liability and of allocating the interest income or interest expense over the relevant period. The effective interest rate is the rate that exactly discounts estimated future cash payments or receipts through the expected life of the financial instrument to the net carrying amount of the financial asset or liability on initial recognition. When calculating the effective interest rate, the Bank estimates cash flows considering all contractual terms of the financial instrument, and any revisions to these estimates are recognised in the income statement. The calculation includes amounts paid or received that are an integral part of the effective interest rate of a financial instrument, including transaction costs and all other premiums or discounts.
(s) Fee and commission incomeFees and commissions are generally recognised on an accrual basis when the service has been provided.
The Bank earns from the Government of Kenya a commission of 1.5% of amounts raised through its agency role in the issuance of Treasury bills and bonds. The annual commission income is limited to Sh.3 billion as per the agreement between the Bank and the National Treasury effective 1 July 2007. In addition, the Bank earns commissions from other debt instruments issued to meet funding requirements of State Corporations.
(t) Commitments on behalf of the Kenya Government and National TreasuryThe Bank issues Treasury bills and bonds on behalf of the National Treasury. Commitments arising on such transactions on behalf of Kenya Government and the National Treasury are not included in these financial statements as the Bank is involved in such transactions only as agent.
FINANCIAL PERFORMANCE
“To be a World Class Modern Central Bank”
C E N T R A L B A N K O F K E N Y AANNUAL REPORT & FINANCIAL STATEMENTS 2016/17
114
(u) Currency in circulationNotes and coins in circulation are measured at fair value. Currency in circulation represents the nominal value of all bank notes and coins held by the public and commercial banks.
(v) InventoriesThe Bank’s inventory is comprised of new currency notes issued. Inventories are stated at the sum of the production costs. Cost is determined using the first-in, first-out (FIFO) method.
Bank notes printing expenses and coin minting costs for each denomination which include ordering, printing, minting, freight, insurance and handling costs are initially deferred. Based on the currency issued into circulation, the respective proportional actual costs incurred are released to the profit or loss from the deferred costs account. The deferred amount is recognised as prepayment and represents un-issued bank notes and coins stock.
(w) Loan due from the Government of KenyaThe loan due from the Government of Kenya arose from overdrawn accounts which were converted to a loan with effect from 1 July 1997 after an amendment to the Central Bank of Kenya Act to limit the Bank’s lending to Government of Kenya to 5% of Government of Kenya audited revenue.
On 24 July 2007, a deed of guarantee was signed between the Government of Kenya and Central Bank of Kenya in which the Government agreed to repay the loan at Shs 1.11 billion per annum over 32 years at 3% interest per annum. The security held is lien over cash balances, stock, treasury bonds and such other government securities as are specified in Section 46(5) of the Central Bank of Kenya Act.
The loan due from the Government of Kenya is categorised as a loan and receivables and is measured at amortised cost.
(x) Funds held at/ due to International Monetary Fund (IMF)Kenya has been a member of the International Monetary Fund (IMF) since 1966. The Bank is the designated depository for the IMF’s holdings of Kenya’s currency. IMF currency holdings are held in the No. 1 and No. 2 Accounts, which are deposit accounts of the IMF with the Bank.
Borrowings from and repayments to the IMF are denominated in Special Drawing Rights (SDRs). The SDR balances in IMF accounts are translated into Shillings at the prevailing exchange rates and any unrealized gains or losses are accounted for in accordance with accounting policy on foreign currencies.
On a custodial basis, the Bank holds a non-negotiable, non-interest bearing and en cashable on demand security issued by the Treasury in favour of the IMF in its capacity as the IMF’s depository. The security issued is in part payment of Kenya’s quota of IMF shares.
(y) ComparativesWhere necessary, comparative figures have been adjusted to conform to changes in presentation in the current year.
FINANCIAL PERFORMANCE
“To be a World Class Modern Central Bank”
C E N T R A L B A N K O F K E N Y AANNUAL REPORT & FINANCIAL STATEMENTS 2016/17
115
3 Critical accounting estimates and judgements in applying accounting policies
(i) Critical estimates in applying the entity’s accounting policies
The Bank makes estimates and assumptions that affect the reported amounts of assets and liabilities within the next financial year. Estimates and judgements are continually evaluated and are based on historical experience and other factors, including expectations of future events that are believed to be reasonable under the circumstances. a. Post-retirement benefits
Post-retirement benefits are long term liabilities whose value can only be estimated using assumptions about developments over a long period. The Bank has employed actuarial advice in arriving at the figures in the financial statements (Note 17 which includes assumptions). The Board of Directors considers the assumptions used by the actuary in their calculations to be appropriate for this purpose.
b. Loans and advancesCritical estimates are made by the management in determining the recoverable amount of impaired loans and receivables.
c. Fair value of financial assetsThe fair value of financial instruments that are not traded in an active market and off market loans are determined by using valuation techniques.
d. Property and equipment Land and buildings are carried at fair value; representing open market value determined periodically by internal professional valuers.
(ii) Critical judgements in applying the entity’s accounting policies
In the process of applying the Bank’s accounting policies, management has made judgements in determining:
• the classification of financial assets and leases• whether assets are impaired.
FINANCIAL PERFORMANCE
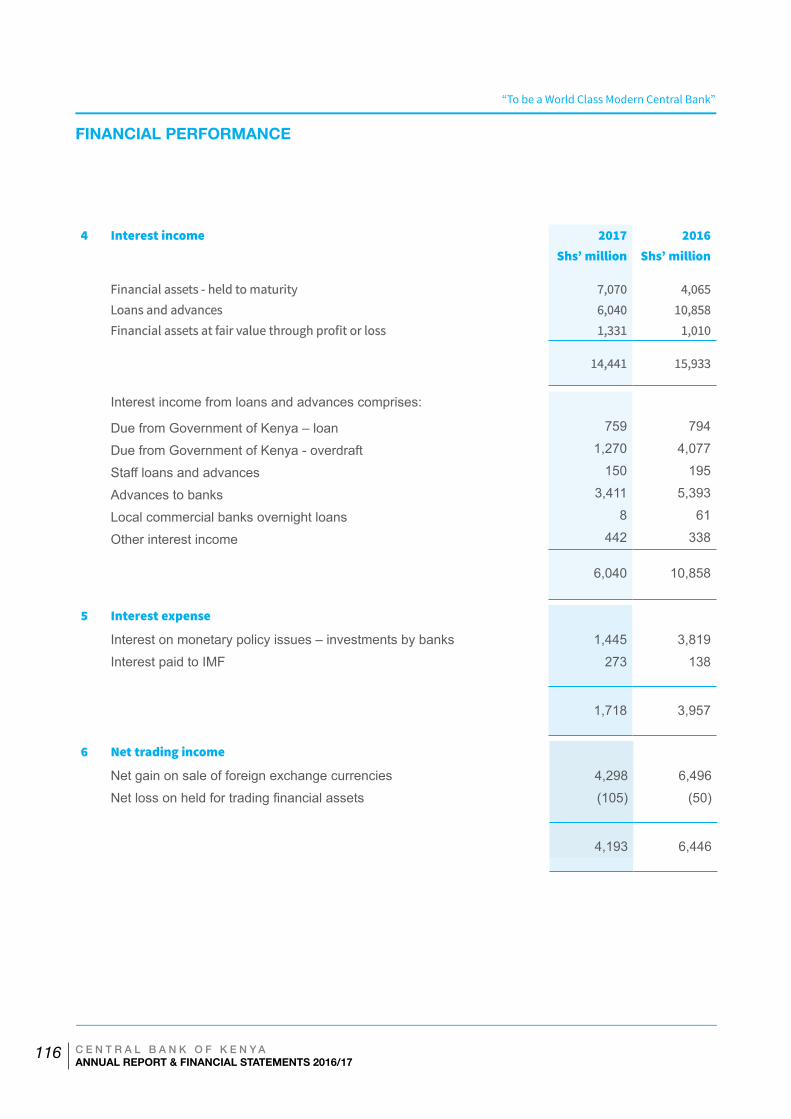
“To be a World Class Modern Central Bank”
C E N T R A L B A N K O F K E N Y AANNUAL REPORT & FINANCIAL STATEMENTS 2016/17
116
4 Interest income 2017 2016Shs’ million Shs’ million
Financial assets - held to maturity 7,070 4,065Loans and advances 6,040 10,858Financial assets at fair value through profit or loss 1,331 1,010
14,441 15,933
Interest income from loans and advances comprises:
Due from Government of Kenya – loan 759 794
Due from Government of Kenya - overdraft 1,270 4,077
Staff loans and advances 150 195
Advances to banks 3,411 5,393
Local commercial banks overnight loans 8 61
Other interest income 442 338
6,040 10,858
5 Interest expense
Interest on monetary policy issues – investments by banks 1,445 3,819
Interest paid to IMF 273 138
1,718 3,957
6 Net trading income
Net gain on sale of foreign exchange currencies 4,298 6,496
Net loss on held for trading financial assets (105) (50)
4,193 6,446
FINANCIAL PERFORMANCE
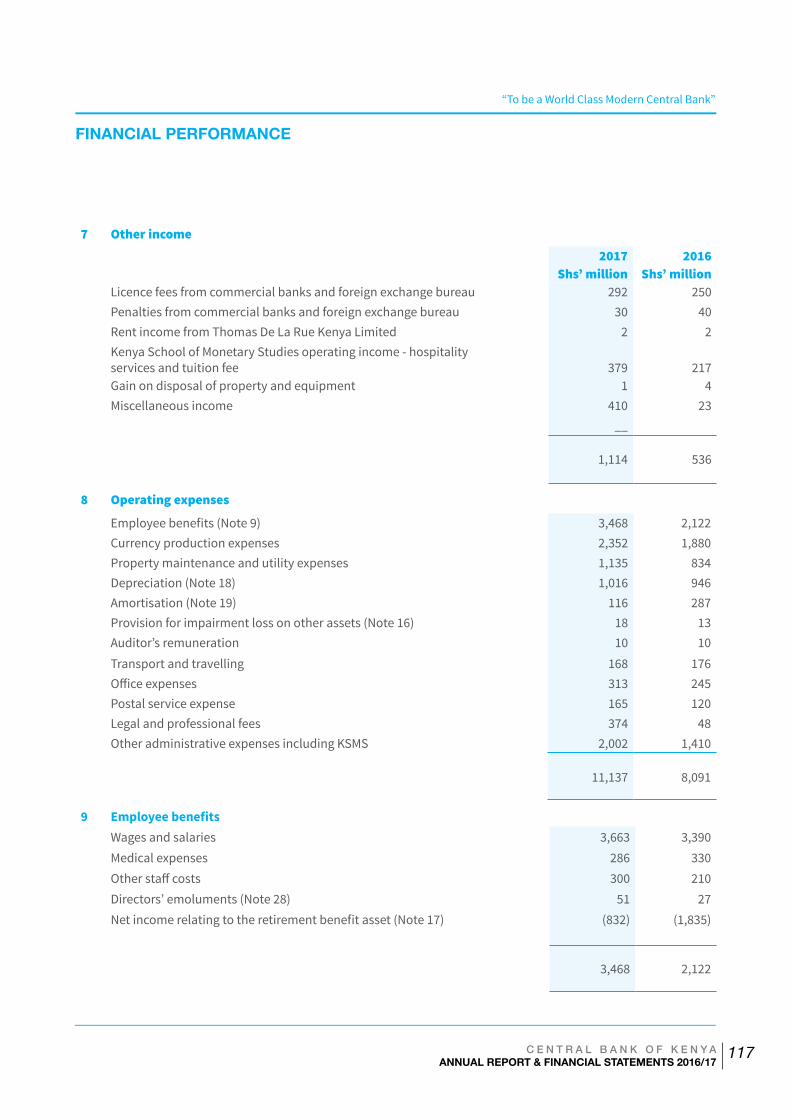
“To be a World Class Modern Central Bank”
C E N T R A L B A N K O F K E N Y AANNUAL REPORT & FINANCIAL STATEMENTS 2016/17
117
7 Other income2017 2016
Shs’ million Shs’ millionLicence fees from commercial banks and foreign exchange bureau 292 250Penalties from commercial banks and foreign exchange bureau 30 40Rent income from Thomas De La Rue Kenya Limited 2 2Kenya School of Monetary Studies operating income - hospitality services and tuition fee 379 217Gain on disposal of property and equipment 1 4Miscellaneous income 410 23
__
1,114 536
8 Operating expenses
Employee benefits (Note 9) 3,468 2,122Currency production expenses 2,352 1,880Property maintenance and utility expenses 1,135 834Depreciation (Note 18) 1,016 946Amortisation (Note 19) 116 287Provision for impairment loss on other assets (Note 16) 18 13Auditor’s remuneration 10 10Transport and travelling 168 176Office expenses 313 245Postal service expense 165 120Legal and professional fees 374 48Other administrative expenses including KSMS 2,002 1,410
11,137 8,091
9 Employee benefitsWages and salaries 3,663 3,390Medical expenses 286 330Other staff costs 300 210Directors’ emoluments (Note 28) 51 27Net income relating to the retirement benefit asset (Note 17) (832) (1,835)
3,468 2,122
FINANCIAL PERFORMANCE
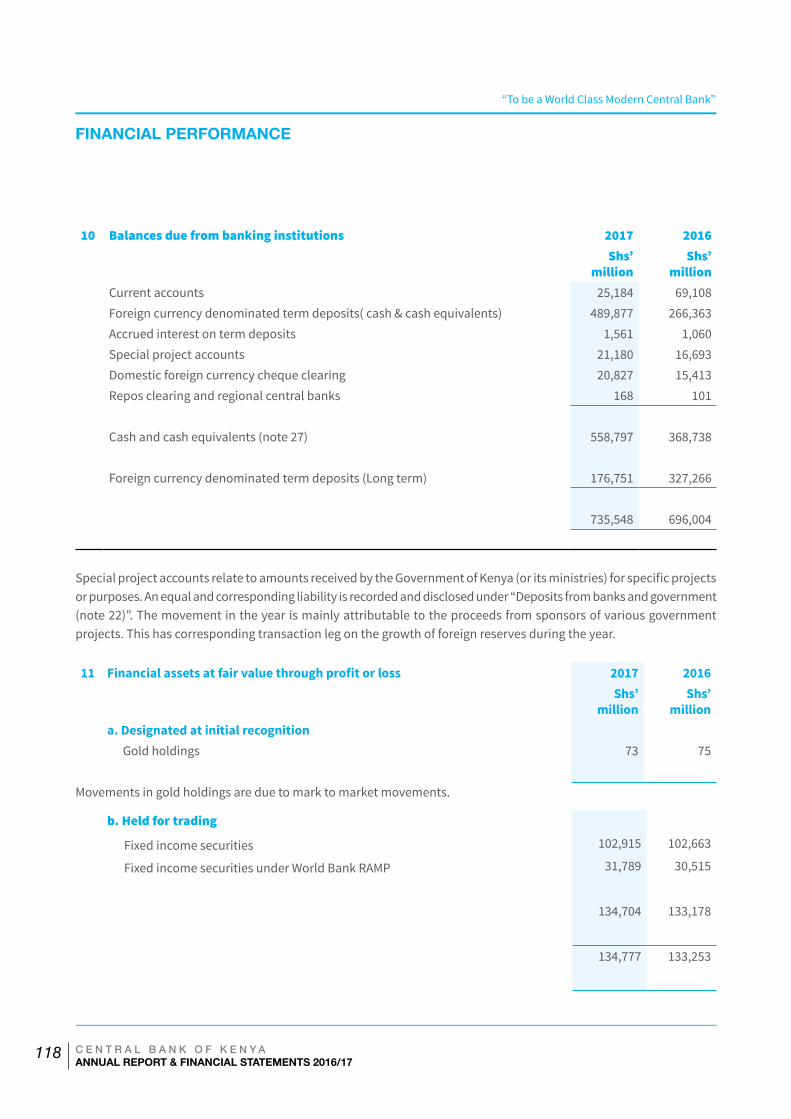
“To be a World Class Modern Central Bank”
C E N T R A L B A N K O F K E N Y AANNUAL REPORT & FINANCIAL STATEMENTS 2016/17
118
10 Balances due from banking institutions 2017 2016Shs’
millionShs’
millionCurrent accounts 25,184 69,108Foreign currency denominated term deposits( cash & cash equivalents) 489,877 266,363Accrued interest on term deposits 1,561 1,060Special project accounts 21,180 16,693Domestic foreign currency cheque clearing 20,827 15,413Repos clearing and regional central banks 168 101
Cash and cash equivalents (note 27) 558,797 368,738
Foreign currency denominated term deposits (Long term) 176,751 327,266
735,548 696,004
Special project accounts relate to amounts received by the Government of Kenya (or its ministries) for specific projects or purposes. An equal and corresponding liability is recorded and disclosed under “Deposits from banks and government (note 22)”. The movement in the year is mainly attributable to the proceeds from sponsors of various government projects. This has corresponding transaction leg on the growth of foreign reserves during the year.
11 Financial assets at fair value through profit or loss 2017 2016Shs’
millionShs’
milliona. Designated at initial recognition
Gold holdings 73 75
Movements in gold holdings are due to mark to market movements.
b. Held for trading
Fixed income securities 102,915 102,663
Fixed income securities under World Bank RAMP 31,789 30,515
134,704 133,178
134,777 133,253
FINANCIAL PERFORMANCE
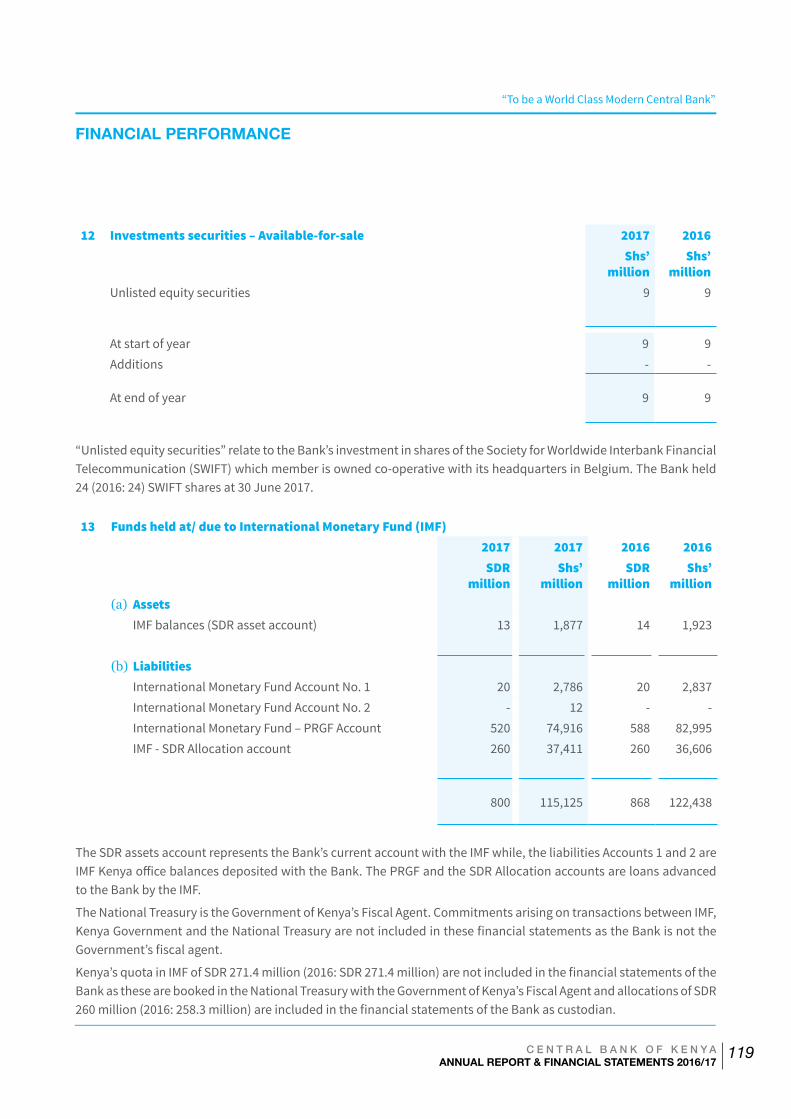
“To be a World Class Modern Central Bank”
C E N T R A L B A N K O F K E N Y AANNUAL REPORT & FINANCIAL STATEMENTS 2016/17
119
12 Investments securities – Available-for-sale 2017 2016Shs’
millionShs’
millionUnlisted equity securities 9 9
At start of year 9 9Additions - -
At end of year 9 9
“Unlisted equity securities” relate to the Bank’s investment in shares of the Society for Worldwide Interbank Financial Telecommunication (SWIFT) which member is owned co-operative with its headquarters in Belgium. The Bank held 24 (2016: 24) SWIFT shares at 30 June 2017.
13 Funds held at/ due to International Monetary Fund (IMF)2017 2017 2016 2016SDR
millionShs’
millionSDR
millionShs’
million(a) Assets
IMF balances (SDR asset account) 13 1,877 14 1,923
(b) Liabilities International Monetary Fund Account No. 1 20 2,786 20 2,837International Monetary Fund Account No. 2 - 12 - -International Monetary Fund – PRGF Account 520 74,916 588 82,995IMF - SDR Allocation account 260 37,411 260 36,606
800 115,125 868 122,438
The SDR assets account represents the Bank’s current account with the IMF while, the liabilities Accounts 1 and 2 are IMF Kenya office balances deposited with the Bank. The PRGF and the SDR Allocation accounts are loans advanced to the Bank by the IMF.
The National Treasury is the Government of Kenya’s Fiscal Agent. Commitments arising on transactions between IMF, Kenya Government and the National Treasury are not included in these financial statements as the Bank is not the Government’s fiscal agent.
Kenya’s quota in IMF of SDR 271.4 million (2016: SDR 271.4 million) are not included in the financial statements of the Bank as these are booked in the National Treasury with the Government of Kenya’s Fiscal Agent and allocations of SDR 260 million (2016: 258.3 million) are included in the financial statements of the Bank as custodian.
FINANCIAL PERFORMANCE
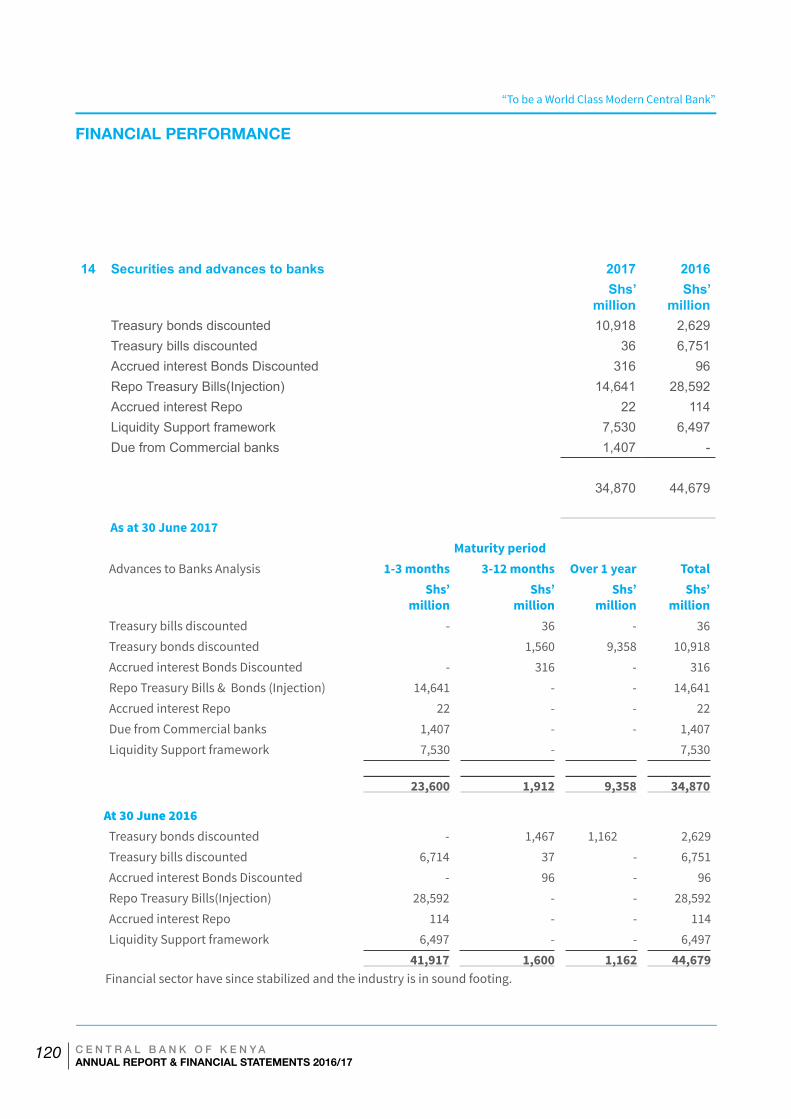
“To be a World Class Modern Central Bank”
C E N T R A L B A N K O F K E N Y AANNUAL REPORT & FINANCIAL STATEMENTS 2016/17
120
14 Securities and advances to banks 2017 2016Shs’
millionShs’
millionTreasury bonds discounted 10,918 2,629Treasury bills discounted 36 6,751Accrued interest Bonds Discounted 316 96Repo Treasury Bills(Injection) 14,641 28,592Accrued interest Repo 22 114Liquidity Support framework 7,530 6,497Due from Commercial banks 1,407 -
34,870 44,679
As at 30 June 2017Maturity period
Advances to Banks Analysis 1-3 months 3-12 months Over 1 year TotalShs’
millionShs’
millionShs’
millionShs’
millionTreasury bills discounted - 36 - 36 Treasury bonds discounted 1,560 9,358 10,918 Accrued interest Bonds Discounted - 316 - 316 Repo Treasury Bills & Bonds (Injection) 14,641 - - 14,641Accrued interest Repo 22 - - 22 Due from Commercial banks 1,407 - - 1,407Liquidity Support framework 7,530 - 7,530
23,600
1,912
9,358
34,870
At 30 June 2016Treasury bonds discounted - 1,467 1,162 2,629 Treasury bills discounted 6,714 37 - 6,751 Accrued interest Bonds Discounted - 96 - 96 Repo Treasury Bills(Injection) 28,592 - - 28,592 Accrued interest Repo 114 - - 114 Liquidity Support framework 6,497 - - 6,497
41,917 1,600 1,162 44,679 Financial sector have since stabilized and the industry is in sound footing.
FINANCIAL PERFORMANCE
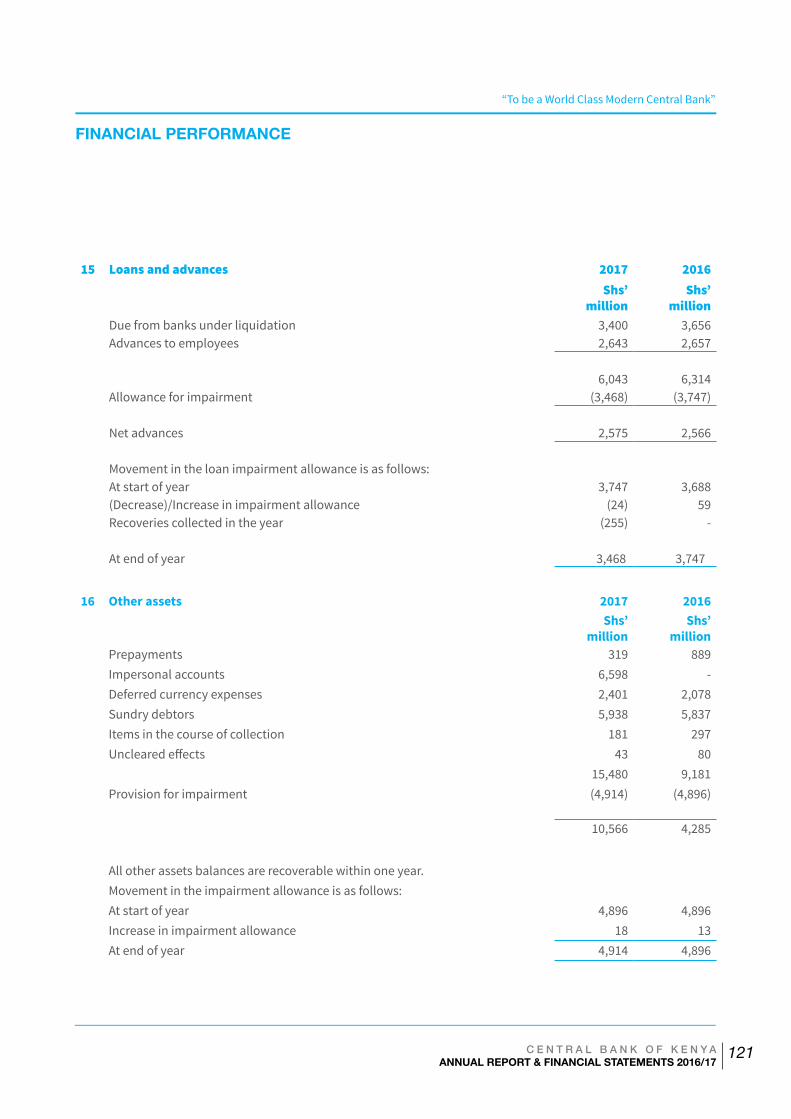
“To be a World Class Modern Central Bank”
C E N T R A L B A N K O F K E N Y AANNUAL REPORT & FINANCIAL STATEMENTS 2016/17
121
15 Loans and advances 2017 2016Shs’
millionShs’
millionDue from banks under liquidation 3,400 3,656Advances to employees 2,643 2,657
6,043 6,314Allowance for impairment (3,468) (3,747)
Net advances 2,575 2,566
Movement in the loan impairment allowance is as follows:At start of year 3,747 3,688(Decrease)/Increase in impairment allowance (24) 59Recoveries collected in the year (255) -
At end of year 3,468 3,747
16 Other assets 2017 2016Shs’
millionShs’
millionPrepayments 319 889Impersonal accounts 6,598 -Deferred currency expenses 2,401 2,078Sundry debtors 5,938 5,837Items in the course of collection 181 297Uncleared effects 43 80
15,480 9,181Provision for impairment (4,914) (4,896)
10,566 4,285
All other assets balances are recoverable within one year.Movement in the impairment allowance is as follows:At start of year 4,896 4,896Increase in impairment allowance 18 13At end of year 4,914 4,896
FINANCIAL PERFORMANCE
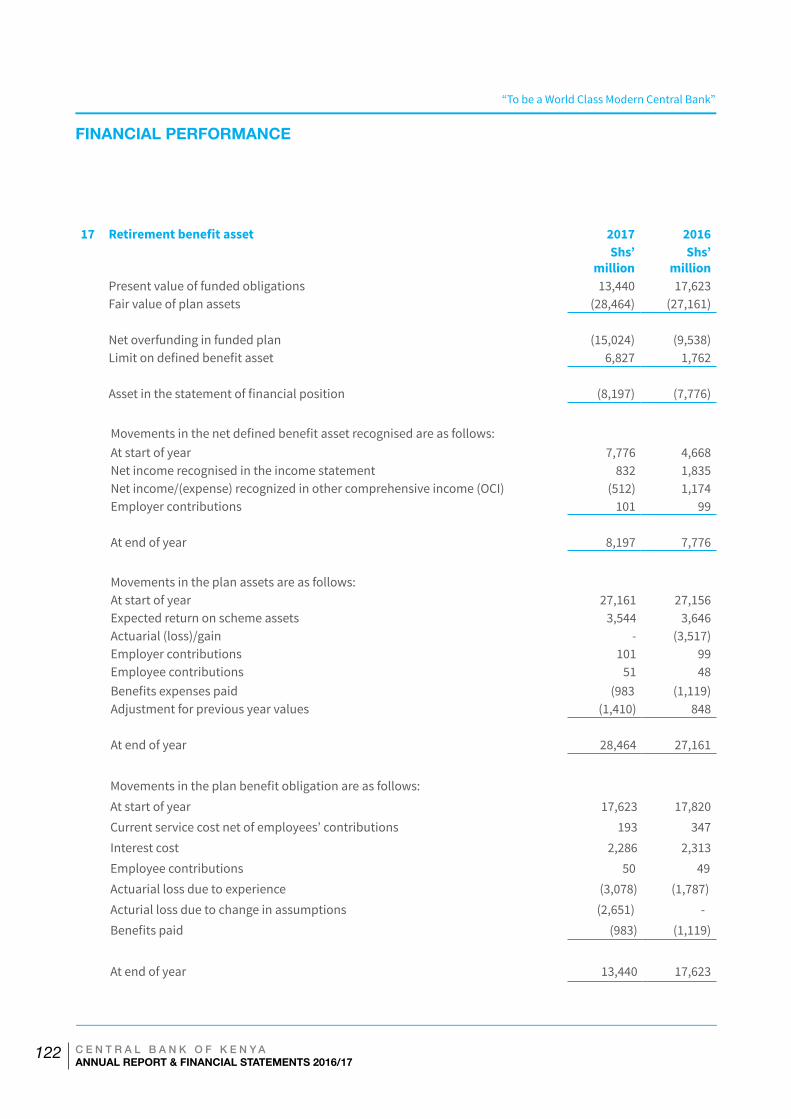
“To be a World Class Modern Central Bank”
C E N T R A L B A N K O F K E N Y AANNUAL REPORT & FINANCIAL STATEMENTS 2016/17
122
17 Retirement benefit asset 2017 2016Shs’
millionShs’
millionPresent value of funded obligations 13,440 17,623Fair value of plan assets (28,464) (27,161)
Net overfunding in funded plan (15,024) (9,538) Limit on defined benefit asset 6,827 1,762
Asset in the statement of financial position (8,197) (7,776)
Movements in the net defined benefit asset recognised are as follows: At start of year 7,776 4,668Net income recognised in the income statement 832 1,835Net income/(expense) recognized in other comprehensive income (OCI) (512) 1,174Employer contributions 101 99
At end of year 8,197 7,776
Movements in the plan assets are as follows:At start of year 27,161 27,156Expected return on scheme assets 3,544 3,646 Actuarial (loss)/gain - (3,517)Employer contributions 101 99Employee contributions 51 48Benefits expenses paid (983 (1,119) Adjustment for previous year values (1,410) 848
At end of year 28,464 27,161
Movements in the plan benefit obligation are as follows:At start of year 17,623 17,820Current service cost net of employees’ contributions 193 347Interest cost 2,286 2,313Employee contributions 50 49Actuarial loss due to experience (3,078) (1,787)Acturial loss due to change in assumptions (2,651) -Benefits paid (983) (1,119)
At end of year 13,440 17,623
FINANCIAL PERFORMANCE
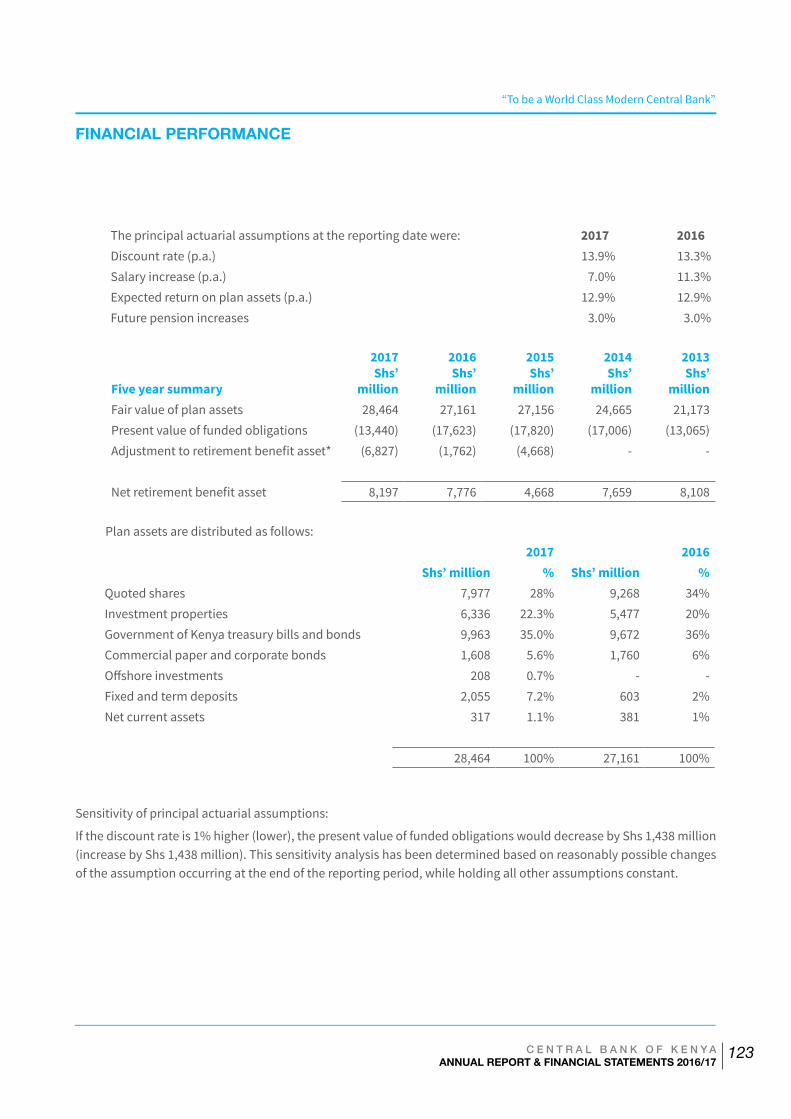
“To be a World Class Modern Central Bank”
C E N T R A L B A N K O F K E N Y AANNUAL REPORT & FINANCIAL STATEMENTS 2016/17
123
The principal actuarial assumptions at the reporting date were: 2017 2016Discount rate (p.a.) 13.9% 13.3%Salary increase (p.a.) 7.0% 11.3%Expected return on plan assets (p.a.) 12.9% 12.9%Future pension increases 3.0% 3.0%
Five year summary
2017Shs’
million
2016Shs’
million
2015Shs’
million
2014 Shs’
million
2013Shs’
millionFair value of plan assets 28,464 27,161 27,156 24,665 21,173Present value of funded obligations (13,440) (17,623) (17,820) (17,006) (13,065)Adjustment to retirement benefit asset* (6,827) (1,762) (4,668) - -
Net retirement benefit asset 8,197 7,776 4,668 7,659 8,108
Plan assets are distributed as follows:2017 2016
Shs’ million % Shs’ million %Quoted shares 7,977 28% 9,268 34%Investment properties 6,336 22.3% 5,477 20%Government of Kenya treasury bills and bonds 9,963 35.0% 9,672 36%Commercial paper and corporate bonds 1,608 5.6% 1,760 6%Offshore investments 208 0.7% - -Fixed and term deposits 2,055 7.2% 603 2%Net current assets 317 1.1% 381 1%
28,464 100% 27,161 100%
Sensitivity of principal actuarial assumptions:
If the discount rate is 1% higher (lower), the present value of funded obligations would decrease by Shs 1,438 million (increase by Shs 1,438 million). This sensitivity analysis has been determined based on reasonably possible changes of the assumption occurring at the end of the reporting period, while holding all other assumptions constant.
FINANCIAL PERFORMANCE
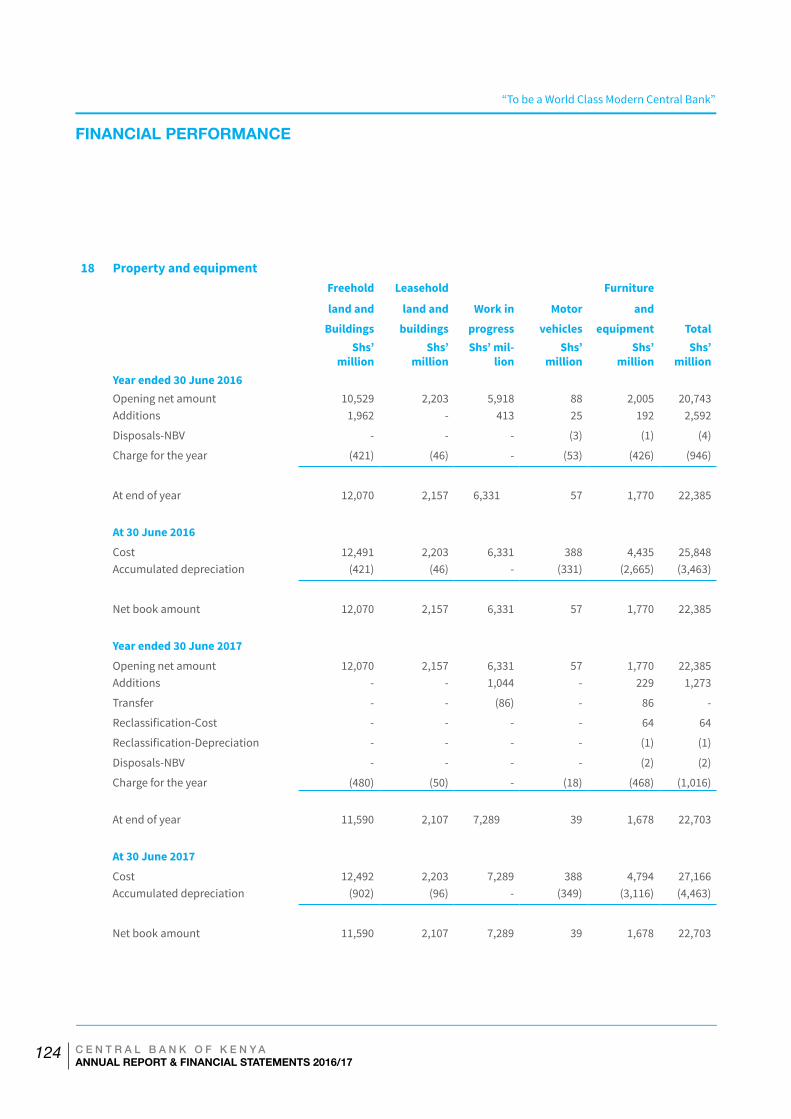
“To be a World Class Modern Central Bank”
C E N T R A L B A N K O F K E N Y AANNUAL REPORT & FINANCIAL STATEMENTS 2016/17
124
18 Property and equipmentFreehold Leasehold Furniture
land and land and Work in Motor and
Buildings buildings progress vehicles equipment TotalShs’
millionShs’
millionShs’ mil-
lionShs’
millionShs’
millionShs’
millionYear ended 30 June 2016Opening net amount 10,529 2,203 5,918 88 2,005 20,743Additions 1,962 - 413 25 192 2,592
Disposals-NBV - - - (3) (1) (4)
Charge for the year (421) (46) - (53) (426) (946)
At end of year 12,070 2,157 6,331 57 1,770 22,385
At 30 June 2016
Cost 12,491 2,203 6,331 388 4,435 25,848Accumulated depreciation (421) (46) - (331) (2,665) (3,463)
Net book amount 12,070 2,157 6,331 57 1,770 22,385
Year ended 30 June 2017
Opening net amount 12,070 2,157 6,331 57 1,770 22,385Additions - - 1,044 - 229 1,273
Transfer - - (86) - 86 -
Reclassification-Cost - - - - 64 64
Reclassification-Depreciation - - - - (1) (1)
Disposals-NBV - - - - (2) (2)
Charge for the year (480) (50) - (18) (468) (1,016)
At end of year 11,590 2,107 7,289 39 1,678 22,703
At 30 June 2017
Cost 12,492 2,203 7,289 388 4,794 27,166Accumulated depreciation (902) (96) - (349) (3,116) (4,463)
Net book amount 11,590 2,107 7,289 39 1,678 22,703
FINANCIAL PERFORMANCE
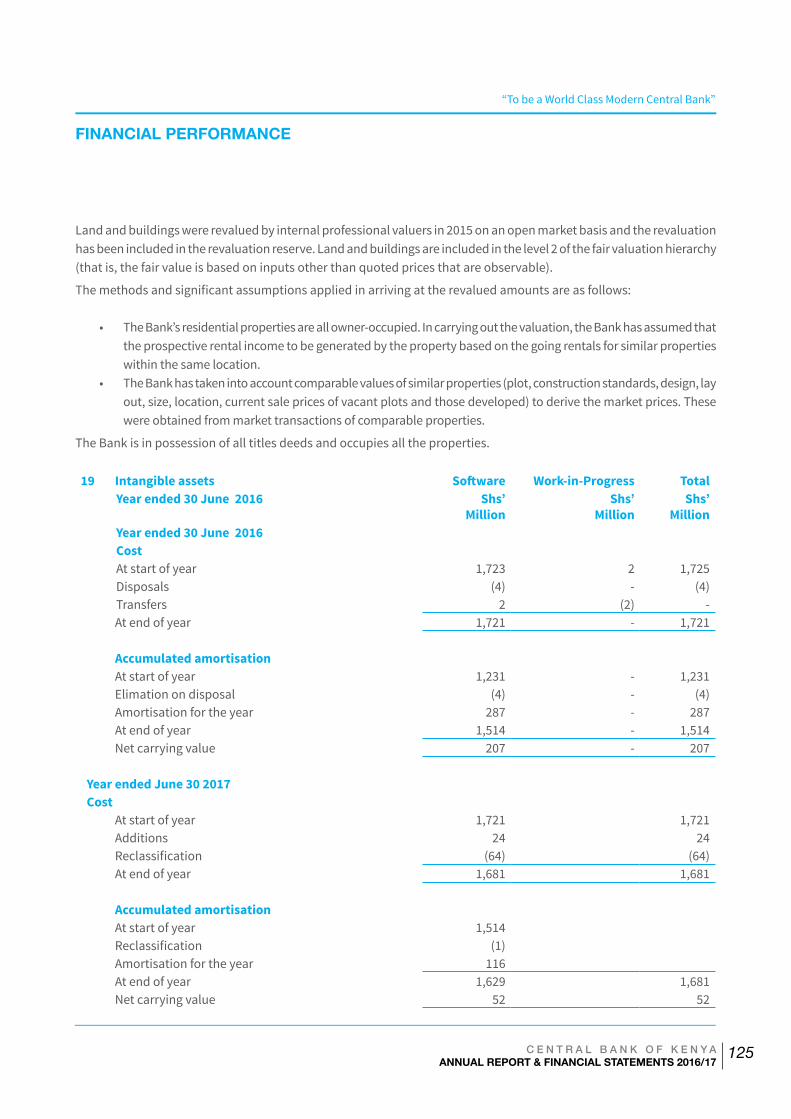
“To be a World Class Modern Central Bank”
C E N T R A L B A N K O F K E N Y AANNUAL REPORT & FINANCIAL STATEMENTS 2016/17
125
Land and buildings were revalued by internal professional valuers in 2015 on an open market basis and the revaluation has been included in the revaluation reserve. Land and buildings are included in the level 2 of the fair valuation hierarchy (that is, the fair value is based on inputs other than quoted prices that are observable).
The methods and significant assumptions applied in arriving at the revalued amounts are as follows:
• The Bank’s residential properties are all owner-occupied. In carrying out the valuation, the Bank has assumed that the prospective rental income to be generated by the property based on the going rentals for similar properties within the same location.
• The Bank has taken into account comparable values of similar properties (plot, construction standards, design, lay out, size, location, current sale prices of vacant plots and those developed) to derive the market prices. These were obtained from market transactions of comparable properties.
The Bank is in possession of all titles deeds and occupies all the properties.
19 Intangible assets Software Work-in-Progress TotalYear ended 30 June 2016 Shs’
MillionShs’
MillionShs’
MillionYear ended 30 June 2016CostAt start of year 1,723 2 1,725Disposals (4) - (4)Transfers 2 (2) -At end of year 1,721 - 1,721
Accumulated amortisationAt start of year 1,231 - 1,231Elimation on disposal (4) - (4)Amortisation for the year 287 - 287At end of year 1,514 - 1,514Net carrying value 207 - 207
Year ended June 30 2017Cost
At start of year 1,721 1,721Additions 24 24Reclassification (64) (64)At end of year 1,681 1,681
Accumulated amortisationAt start of year 1,514Reclassification (1)Amortisation for the year 116At end of year 1,629 1,681Net carrying value 52 52
FINANCIAL PERFORMANCE
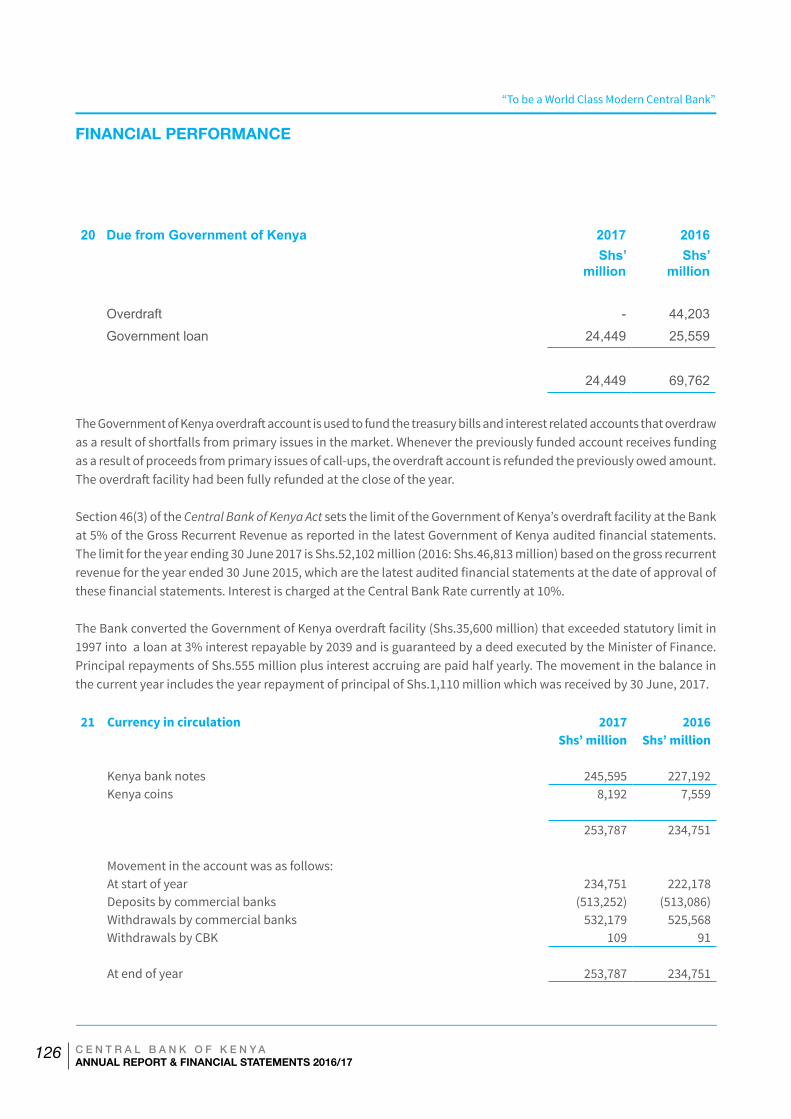
“To be a World Class Modern Central Bank”
C E N T R A L B A N K O F K E N Y AANNUAL REPORT & FINANCIAL STATEMENTS 2016/17
126
20 Due from Government of Kenya 2017 2016 Shs’
million Shs’
million
Overdraft - 44,203
Government loan 24,449 25,559
24,449 69,762
The Government of Kenya overdraft account is used to fund the treasury bills and interest related accounts that overdraw as a result of shortfalls from primary issues in the market. Whenever the previously funded account receives funding as a result of proceeds from primary issues of call-ups, the overdraft account is refunded the previously owed amount. The overdraft facility had been fully refunded at the close of the year.
Section 46(3) of the Central Bank of Kenya Act sets the limit of the Government of Kenya’s overdraft facility at the Bank at 5% of the Gross Recurrent Revenue as reported in the latest Government of Kenya audited financial statements. The limit for the year ending 30 June 2017 is Shs.52,102 million (2016: Shs.46,813 million) based on the gross recurrent revenue for the year ended 30 June 2015, which are the latest audited financial statements at the date of approval of these financial statements. Interest is charged at the Central Bank Rate currently at 10%.
The Bank converted the Government of Kenya overdraft facility (Shs.35,600 million) that exceeded statutory limit in 1997 into a loan at 3% interest repayable by 2039 and is guaranteed by a deed executed by the Minister of Finance. Principal repayments of Shs.555 million plus interest accruing are paid half yearly. The movement in the balance in the current year includes the year repayment of principal of Shs.1,110 million which was received by 30 June, 2017.
21 Currency in circulation 2017 2016Shs’ million Shs’ million
Kenya bank notes 245,595 227,192Kenya coins 8,192 7,559
253,787 234,751
Movement in the account was as follows:At start of year 234,751 222,178Deposits by commercial banks (513,252) (513,086)Withdrawals by commercial banks 532,179 525,568Withdrawals by CBK 109 91
At end of year 253,787 234,751
FINANCIAL PERFORMANCE
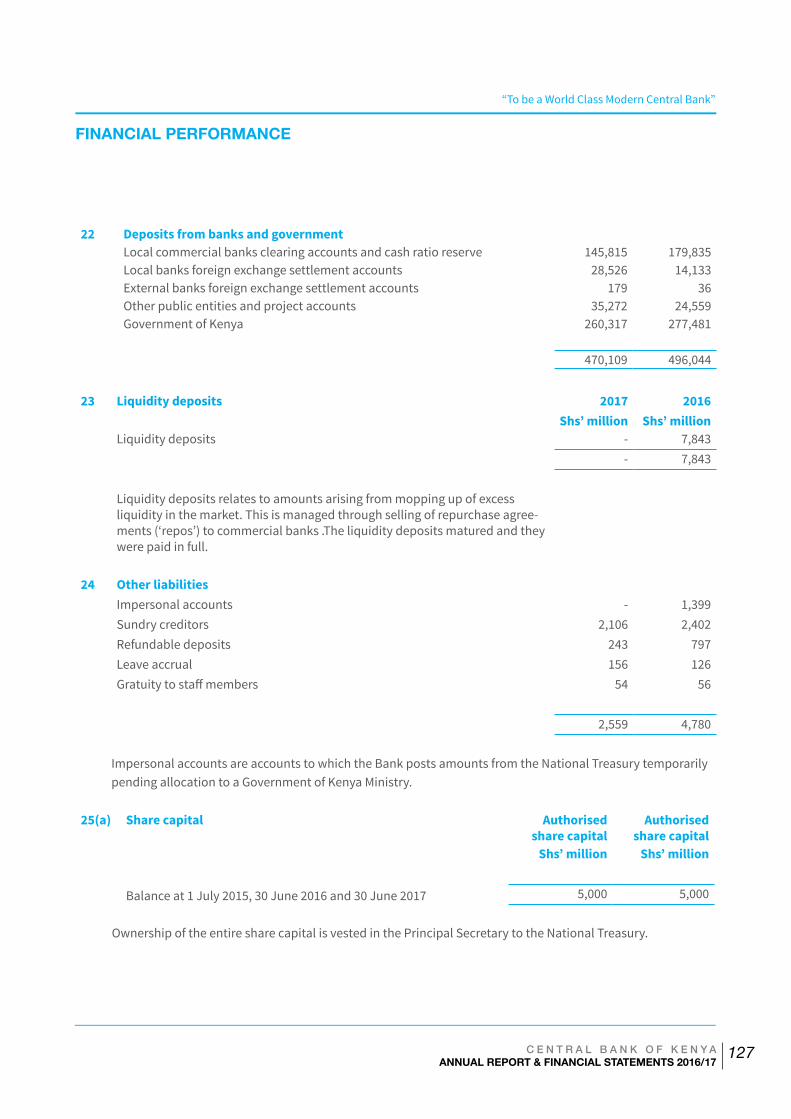
“To be a World Class Modern Central Bank”
C E N T R A L B A N K O F K E N Y AANNUAL REPORT & FINANCIAL STATEMENTS 2016/17
127
22 Deposits from banks and governmentLocal commercial banks clearing accounts and cash ratio reserve 145,815 179,835Local banks foreign exchange settlement accounts 28,526 14,133External banks foreign exchange settlement accounts 179 36Other public entities and project accounts 35,272 24,559Government of Kenya 260,317 277,481
470,109 496,044
23 Liquidity deposits 2017 2016Shs’ million Shs’ million
Liquidity deposits - 7,843- 7,843
Liquidity deposits relates to amounts arising from mopping up of excess liquidity in the market. This is managed through selling of repurchase agree-ments (‘repos’) to commercial banks .The liquidity deposits matured and they were paid in full.
24 Other liabilitiesImpersonal accounts - 1,399Sundry creditors 2,106 2,402Refundable deposits 243 797Leave accrual 156 126Gratuity to staff members 54 56
2,559 4,780
Impersonal accounts are accounts to which the Bank posts amounts from the National Treasury temporarily pending allocation to a Government of Kenya Ministry.
25(a) Share capital Authorised share capital
Authorised share capital
Shs’ million Shs’ million
Balance at 1 July 2015, 30 June 2016 and 30 June 2017 5,000 5,000
Ownership of the entire share capital is vested in the Principal Secretary to the National Treasury.
FINANCIAL PERFORMANCE
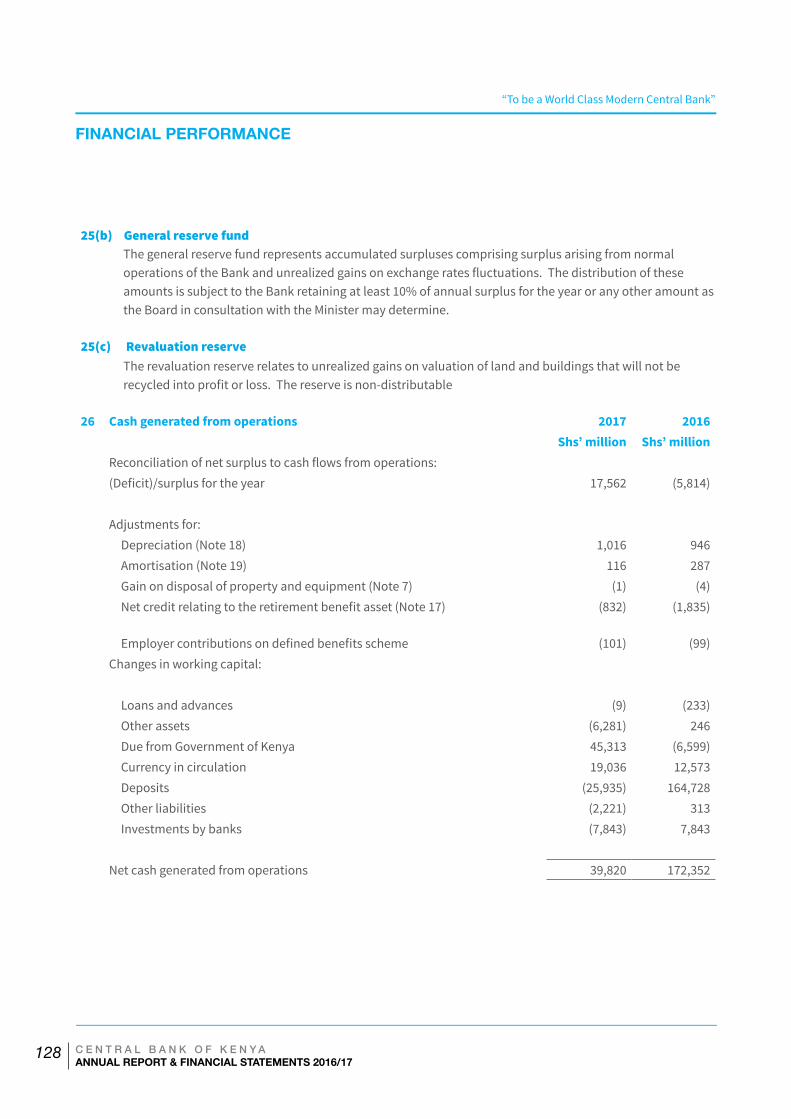
“To be a World Class Modern Central Bank”
C E N T R A L B A N K O F K E N Y AANNUAL REPORT & FINANCIAL STATEMENTS 2016/17
128
25(b) General reserve fundThe general reserve fund represents accumulated surpluses comprising surplus arising from normal operations of the Bank and unrealized gains on exchange rates fluctuations. The distribution of these amounts is subject to the Bank retaining at least 10% of annual surplus for the year or any other amount as the Board in consultation with the Minister may determine.
25(c) Revaluation reserve The revaluation reserve relates to unrealized gains on valuation of land and buildings that will not be recycled into profit or loss. The reserve is non-distributable
26 Cash generated from operations 2017 2016Shs’ million Shs’ million
Reconciliation of net surplus to cash flows from operations:(Deficit)/surplus for the year 17,562 (5,814)
Adjustments for:Depreciation (Note 18) 1,016 946Amortisation (Note 19) 116 287Gain on disposal of property and equipment (Note 7) (1) (4)Net credit relating to the retirement benefit asset (Note 17) (832) (1,835)
Employer contributions on defined benefits scheme (101) (99)Changes in working capital:
Loans and advances (9) (233)Other assets (6,281) 246Due from Government of Kenya 45,313 (6,599)Currency in circulation 19,036 12,573Deposits (25,935) 164,728Other liabilities (2,221) 313Investments by banks (7,843) 7,843
Net cash generated from operations 39,820 172,352
FINANCIAL PERFORMANCE
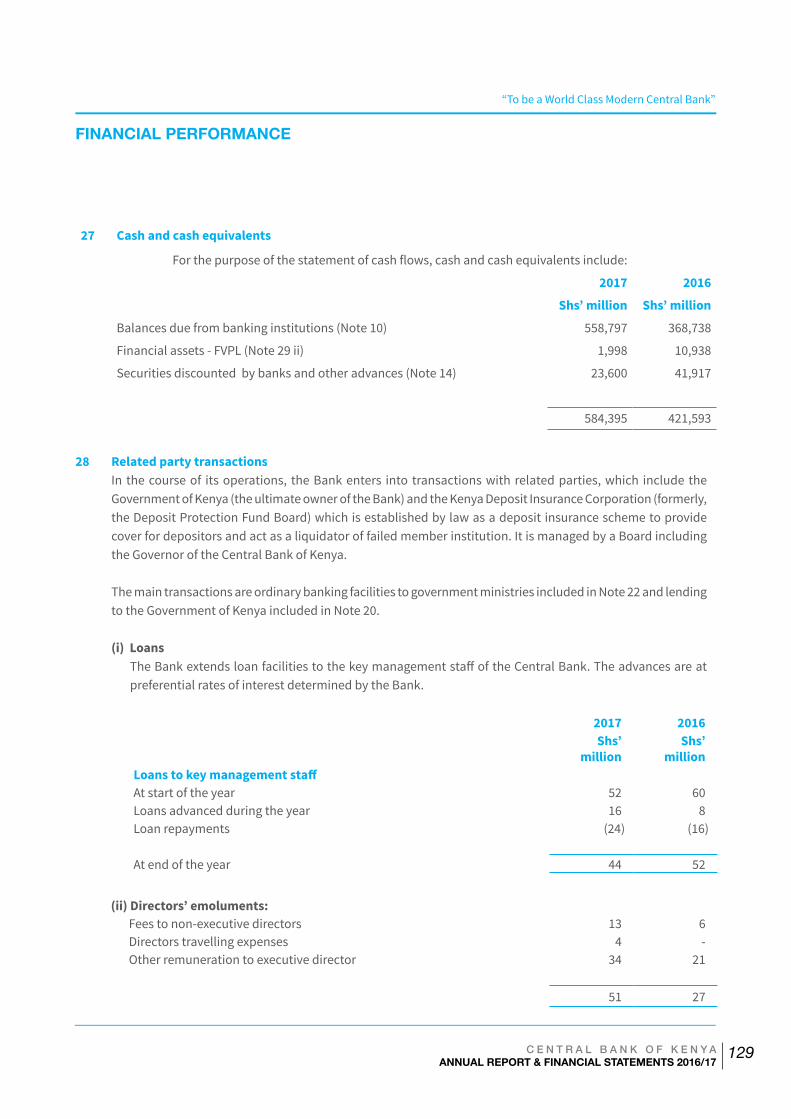
“To be a World Class Modern Central Bank”
C E N T R A L B A N K O F K E N Y AANNUAL REPORT & FINANCIAL STATEMENTS 2016/17
129
27 Cash and cash equivalents
For the purpose of the statement of cash flows, cash and cash equivalents include:
2017 2016
Shs’ million Shs’ million
Balances due from banking institutions (Note 10) 558,797 368,738
Financial assets - FVPL (Note 29 ii) 1,998 10,938
Securities discounted by banks and other advances (Note 14) 23,600 41,917
584,395 421,593
28 Related party transactionsIn the course of its operations, the Bank enters into transactions with related parties, which include the Government of Kenya (the ultimate owner of the Bank) and the Kenya Deposit Insurance Corporation (formerly, the Deposit Protection Fund Board) which is established by law as a deposit insurance scheme to provide cover for depositors and act as a liquidator of failed member institution. It is managed by a Board including the Governor of the Central Bank of Kenya.
The main transactions are ordinary banking facilities to government ministries included in Note 22 and lending to the Government of Kenya included in Note 20.
(i) LoansThe Bank extends loan facilities to the key management staff of the Central Bank. The advances are at preferential rates of interest determined by the Bank.
2017 2016Shs’
millionShs’
millionLoans to key management staffAt start of the year 52 60Loans advanced during the year 16 8Loan repayments (24) (16)
At end of the year 44 52
(ii) Directors’ emoluments:Fees to non-executive directors 13 6Directors travelling expenses 4 -Other remuneration to executive director 34 21
51 27
FINANCIAL PERFORMANCE
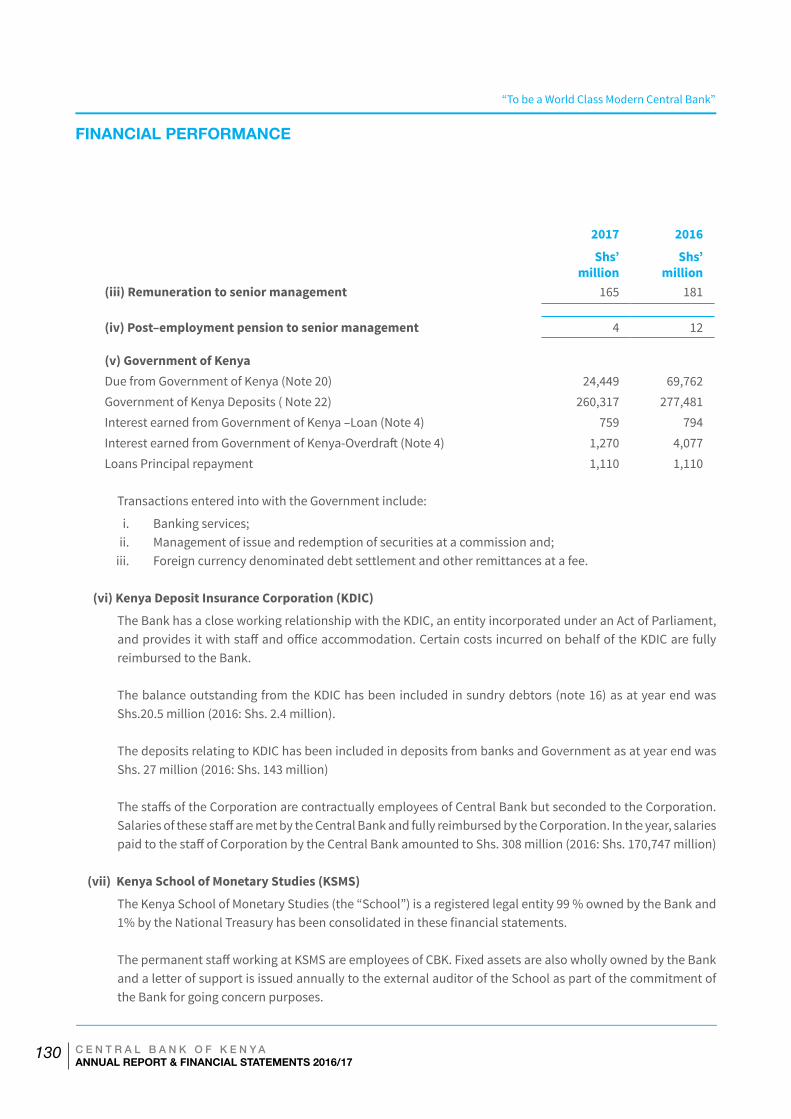
“To be a World Class Modern Central Bank”
C E N T R A L B A N K O F K E N Y AANNUAL REPORT & FINANCIAL STATEMENTS 2016/17
130
2017 2016
Shs’ million
Shs’ million
(iii) Remuneration to senior management 165 181
(iv) Post–employment pension to senior management 4 12
(v) Government of KenyaDue from Government of Kenya (Note 20) 24,449 69,762Government of Kenya Deposits ( Note 22) 260,317 277,481Interest earned from Government of Kenya –Loan (Note 4) 759 794Interest earned from Government of Kenya-Overdraft (Note 4) 1,270 4,077Loans Principal repayment 1,110 1,110
Transactions entered into with the Government include:
i. Banking services;ii. Management of issue and redemption of securities at a commission and;
iii. Foreign currency denominated debt settlement and other remittances at a fee.
(vi) Kenya Deposit Insurance Corporation (KDIC)
The Bank has a close working relationship with the KDIC, an entity incorporated under an Act of Parliament, and provides it with staff and office accommodation. Certain costs incurred on behalf of the KDIC are fully reimbursed to the Bank.
The balance outstanding from the KDIC has been included in sundry debtors (note 16) as at year end was Shs.20.5 million (2016: Shs. 2.4 million).
The deposits relating to KDIC has been included in deposits from banks and Government as at year end was Shs. 27 million (2016: Shs. 143 million)
The staffs of the Corporation are contractually employees of Central Bank but seconded to the Corporation. Salaries of these staff are met by the Central Bank and fully reimbursed by the Corporation. In the year, salaries paid to the staff of Corporation by the Central Bank amounted to Shs. 308 million (2016: Shs. 170,747 million)
(vii) Kenya School of Monetary Studies (KSMS)
The Kenya School of Monetary Studies (the “School”) is a registered legal entity 99 % owned by the Bank and 1% by the National Treasury has been consolidated in these financial statements.
The permanent staff working at KSMS are employees of CBK. Fixed assets are also wholly owned by the Bank and a letter of support is issued annually to the external auditor of the School as part of the commitment of the Bank for going concern purposes.
FINANCIAL PERFORMANCE
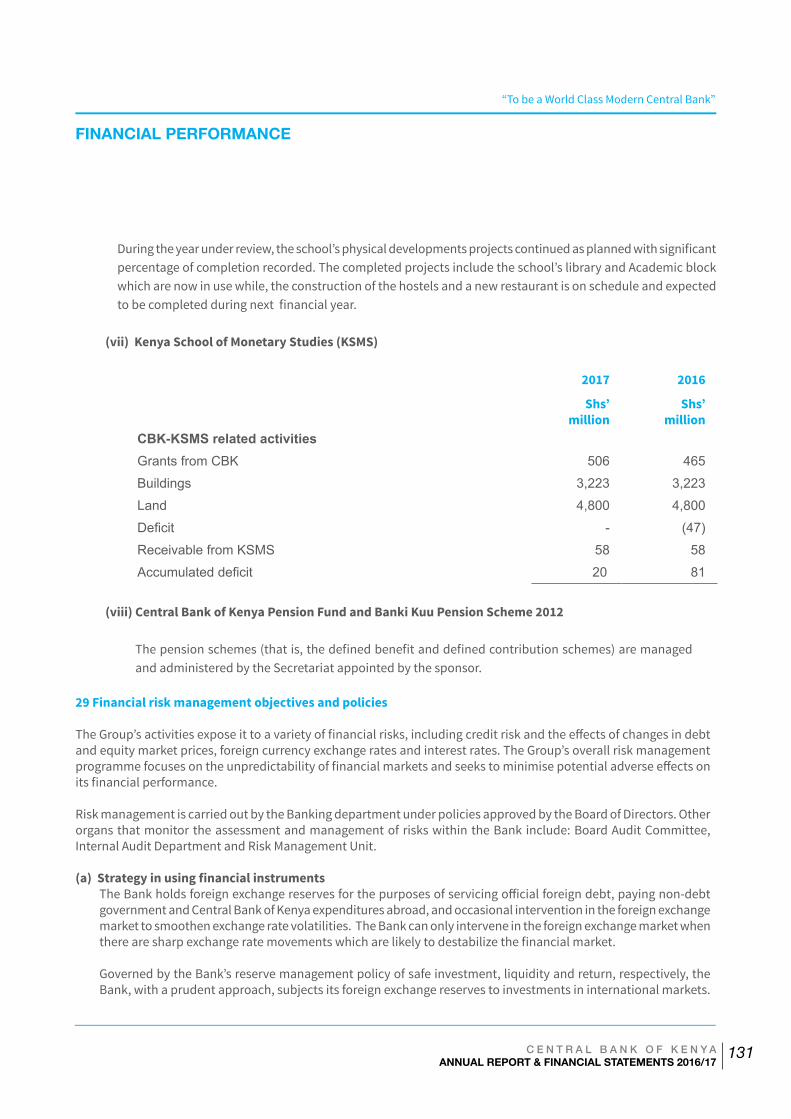
“To be a World Class Modern Central Bank”
C E N T R A L B A N K O F K E N Y AANNUAL REPORT & FINANCIAL STATEMENTS 2016/17
131
During the year under review, the school’s physical developments projects continued as planned with significant percentage of completion recorded. The completed projects include the school’s library and Academic block which are now in use while, the construction of the hostels and a new restaurant is on schedule and expected to be completed during next financial year.
(vii) Kenya School of Monetary Studies (KSMS)
2017 2016
Shs’ million
Shs’ million
CBK-KSMS related activitiesGrants from CBK 506 465
Buildings 3,223 3,223
Land 4,800 4,800
Deficit - (47)
Receivable from KSMS 58 58
Accumulated deficit 20 81
(viii) Central Bank of Kenya Pension Fund and Banki Kuu Pension Scheme 2012
The pension schemes (that is, the defined benefit and defined contribution schemes) are managed and administered by the Secretariat appointed by the sponsor.
29 Financial risk management objectives and policies
The Group’s activities expose it to a variety of financial risks, including credit risk and the effects of changes in debt and equity market prices, foreign currency exchange rates and interest rates. The Group’s overall risk management programme focuses on the unpredictability of financial markets and seeks to minimise potential adverse effects on its financial performance.
Risk management is carried out by the Banking department under policies approved by the Board of Directors. Other organs that monitor the assessment and management of risks within the Bank include: Board Audit Committee, Internal Audit Department and Risk Management Unit.
(a) Strategy in using financial instrumentsThe Bank holds foreign exchange reserves for the purposes of servicing official foreign debt, paying non-debt government and Central Bank of Kenya expenditures abroad, and occasional intervention in the foreign exchange market to smoothen exchange rate volatilities. The Bank can only intervene in the foreign exchange market when there are sharp exchange rate movements which are likely to destabilize the financial market.
Governed by the Bank’s reserve management policy of safe investment, liquidity and return, respectively, the Bank, with a prudent approach, subjects its foreign exchange reserves to investments in international markets.
FINANCIAL PERFORMANCE
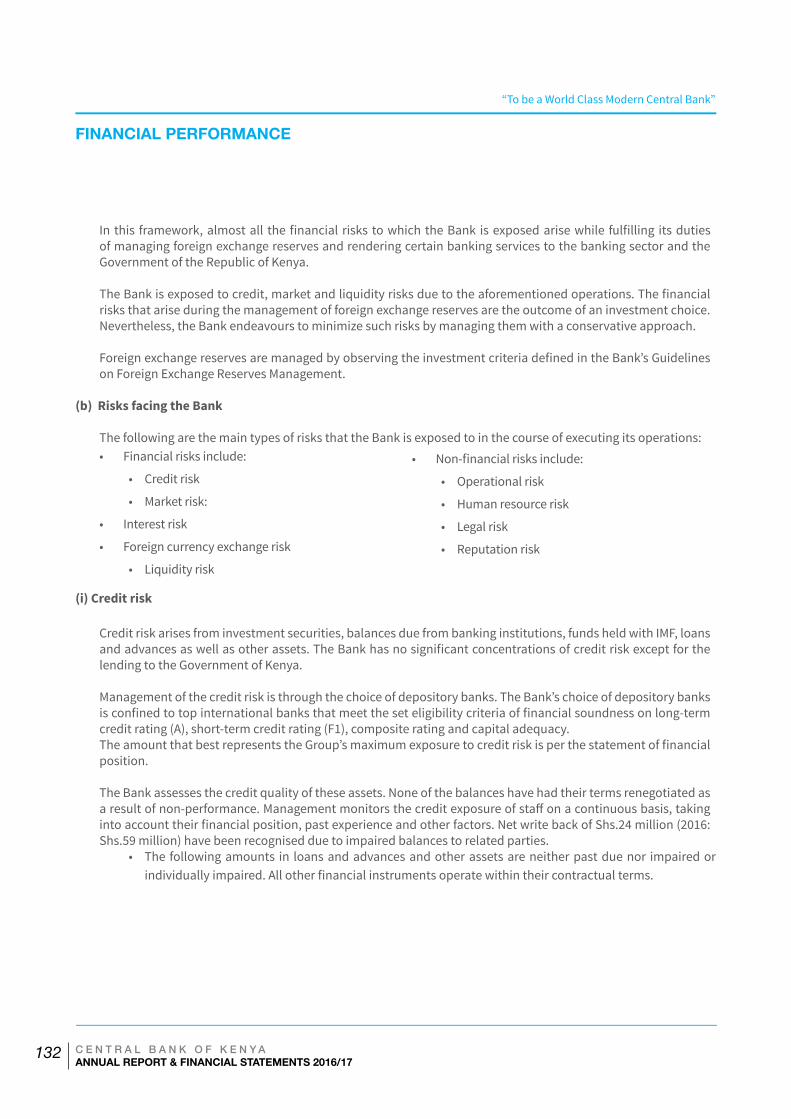
“To be a World Class Modern Central Bank”
C E N T R A L B A N K O F K E N Y AANNUAL REPORT & FINANCIAL STATEMENTS 2016/17
132
In this framework, almost all the financial risks to which the Bank is exposed arise while fulfilling its duties of managing foreign exchange reserves and rendering certain banking services to the banking sector and the Government of the Republic of Kenya.
The Bank is exposed to credit, market and liquidity risks due to the aforementioned operations. The financial risks that arise during the management of foreign exchange reserves are the outcome of an investment choice. Nevertheless, the Bank endeavours to minimize such risks by managing them with a conservative approach.
Foreign exchange reserves are managed by observing the investment criteria defined in the Bank’s Guidelines on Foreign Exchange Reserves Management.
(b) Risks facing the Bank
The following are the main types of risks that the Bank is exposed to in the course of executing its operations:• Financial risks include:
• Credit risk
• Market risk:
• Interest risk
• Foreign currency exchange risk
• Liquidity risk
• Non-financial risks include:
• Operational risk
• Human resource risk
• Legal risk
• Reputation risk
(i) Credit risk
Credit risk arises from investment securities, balances due from banking institutions, funds held with IMF, loans and advances as well as other assets. The Bank has no significant concentrations of credit risk except for the lending to the Government of Kenya.
Management of the credit risk is through the choice of depository banks. The Bank’s choice of depository banks is confined to top international banks that meet the set eligibility criteria of financial soundness on long-term credit rating (A), short-term credit rating (F1), composite rating and capital adequacy. The amount that best represents the Group’s maximum exposure to credit risk is per the statement of financial position.
The Bank assesses the credit quality of these assets. None of the balances have had their terms renegotiated as a result of non-performance. Management monitors the credit exposure of staff on a continuous basis, taking into account their financial position, past experience and other factors. Net write back of Shs.24 million (2016: Shs.59 million) have been recognised due to impaired balances to related parties.
• The following amounts in loans and advances and other assets are neither past due nor impaired or individually impaired. All other financial instruments operate within their contractual terms.
FINANCIAL PERFORMANCE
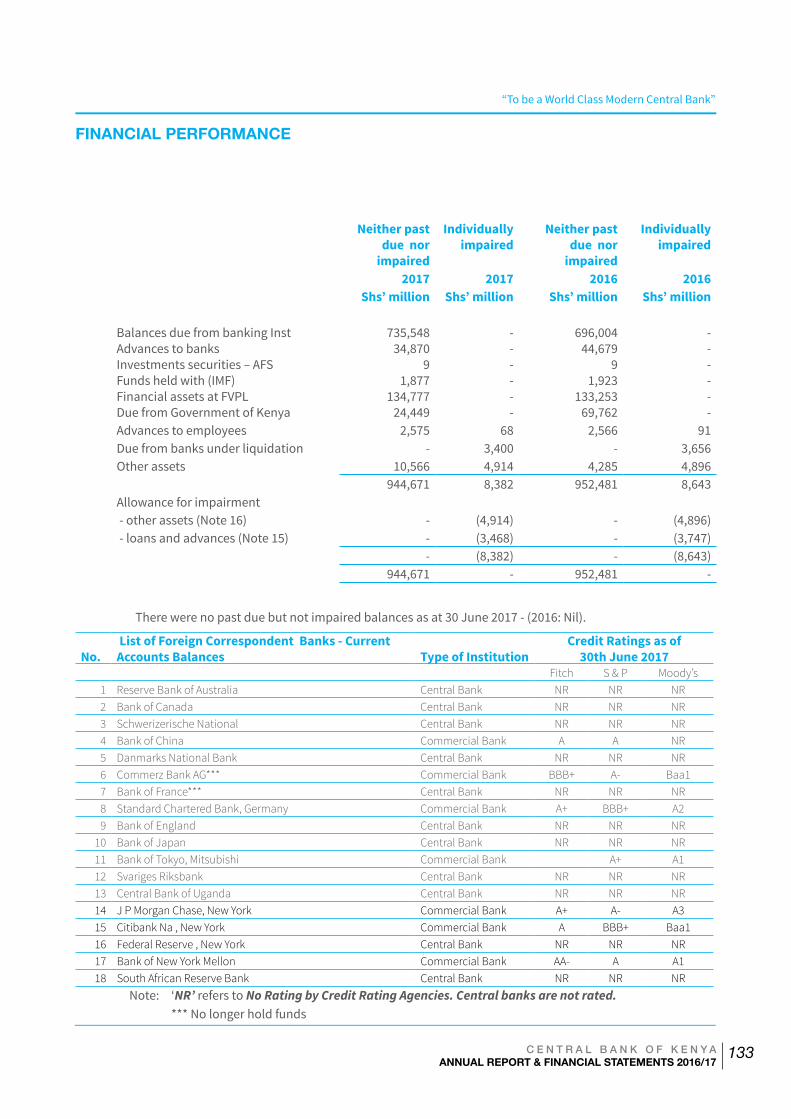
“To be a World Class Modern Central Bank”
C E N T R A L B A N K O F K E N Y AANNUAL REPORT & FINANCIAL STATEMENTS 2016/17
133
Neither past due nor
impaired
Individually impaired
Neither past due nor
impaired
Individually impaired
2017 2017 2016 2016Shs’ million Shs’ million Shs’ million Shs’ million
Balances due from banking Inst Advances to banksInvestments securities – AFS Funds held with (IMF)Financial assets at FVPLDue from Government of Kenya
735,54834,870
91,877
134,77724,449
------
696,00444,679
91,923
133,25369,762
------
Advances to employees 2,575 68 2,566 91 Due from banks under liquidation - 3,400 - 3,656
Other assets 10,566 4,914 4,285 4,896944,671 8,382 952,481 8,643
Allowance for impairment - other assets (Note 16) - (4,914) - (4,896) - loans and advances (Note 15) - (3,468) - (3,747)
- (8,382) - (8,643)944,671 - 952,481 -
There were no past due but not impaired balances as at 30 June 2017 - (2016: Nil).
No. List of Foreign Correspondent Banks - Current Accounts Balances Type of Institution
Credit Ratings as of 30th June 2017
Fitch S & P Moody’s1 Reserve Bank of Australia Central Bank NR NR NR2 Bank of Canada Central Bank NR NR NR3 Schwerizerische National Central Bank NR NR NR4 Bank of China Commercial Bank A A NR5 Danmarks National Bank Central Bank NR NR NR6 Commerz Bank AG*** Commercial Bank BBB+ A- Baa17 Bank of France*** Central Bank NR NR NR8 Standard Chartered Bank, Germany Commercial Bank A+ BBB+ A29 Bank of England Central Bank NR NR NR
10 Bank of Japan Central Bank NR NR NR11 Bank of Tokyo, Mitsubishi Commercial Bank A+ A1 12 Svariges Riksbank Central Bank NR NR NR13 Central Bank of Uganda Central Bank NR NR NR14 J P Morgan Chase, New York Commercial Bank A+ A- A315 Citibank Na , New York Commercial Bank A BBB+ Baa116 Federal Reserve , New York Central Bank NR NR NR17 Bank of New York Mellon Commercial Bank AA- A A118 South African Reserve Bank Central Bank NR NR NR
Note: ‘NR’ refers to No Rating by Credit Rating Agencies. Central banks are not rated. *** No longer hold funds
FINANCIAL PERFORMANCE
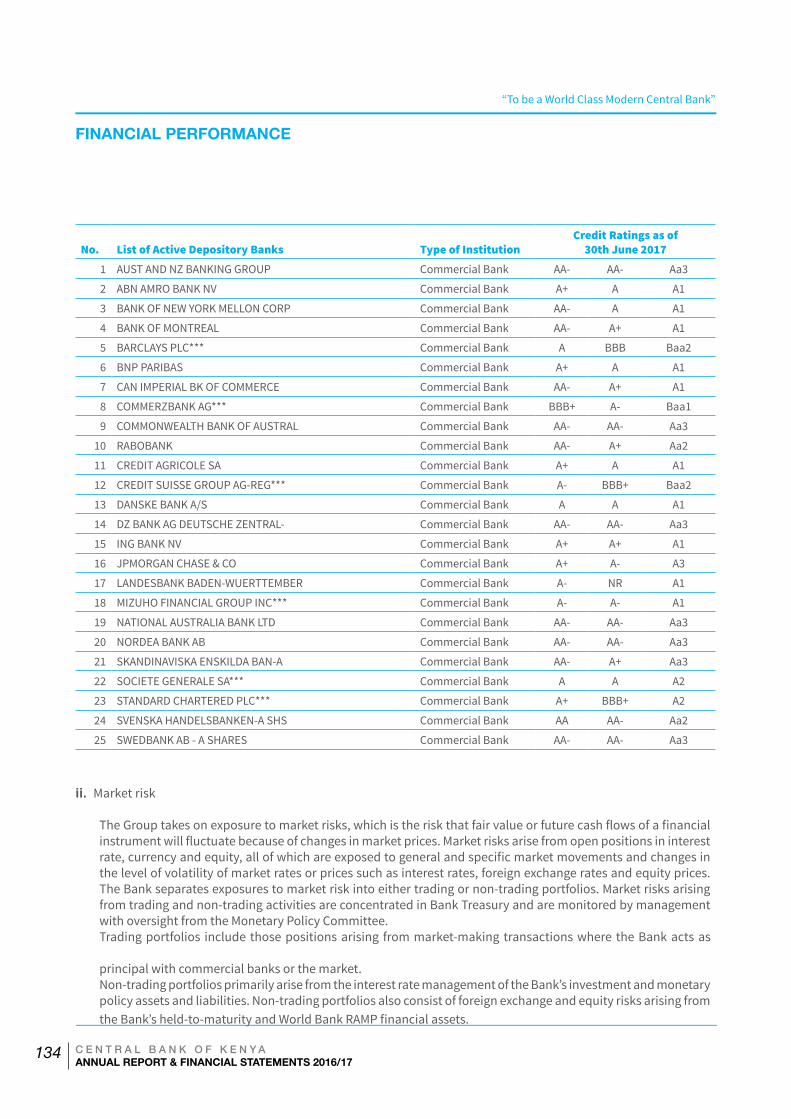
“To be a World Class Modern Central Bank”
C E N T R A L B A N K O F K E N Y AANNUAL REPORT & FINANCIAL STATEMENTS 2016/17
134
No. List of Active Depository Banks Type of InstitutionCredit Ratings as of
30th June 20171 AUST AND NZ BANKING GROUP Commercial Bank AA- AA- Aa3
2 ABN AMRO BANK NV Commercial Bank A+ A A1
3 BANK OF NEW YORK MELLON CORP Commercial Bank AA- A A1
4 BANK OF MONTREAL Commercial Bank AA- A+ A1
5 BARCLAYS PLC*** Commercial Bank A BBB Baa2
6 BNP PARIBAS Commercial Bank A+ A A1
7 CAN IMPERIAL BK OF COMMERCE Commercial Bank AA- A+ A1
8 COMMERZBANK AG*** Commercial Bank BBB+ A- Baa1
9 COMMONWEALTH BANK OF AUSTRAL Commercial Bank AA- AA- Aa3
10 RABOBANK Commercial Bank AA- A+ Aa2
11 CREDIT AGRICOLE SA Commercial Bank A+ A A1
12 CREDIT SUISSE GROUP AG-REG*** Commercial Bank A- BBB+ Baa2
13 DANSKE BANK A/S Commercial Bank A A A1
14 DZ BANK AG DEUTSCHE ZENTRAL- Commercial Bank AA- AA- Aa3
15 ING BANK NV Commercial Bank A+ A+ A1
16 JPMORGAN CHASE & CO Commercial Bank A+ A- A3
17 LANDESBANK BADEN-WUERTTEMBER Commercial Bank A- NR A1
18 MIZUHO FINANCIAL GROUP INC*** Commercial Bank A- A- A1
19 NATIONAL AUSTRALIA BANK LTD Commercial Bank AA- AA- Aa3
20 NORDEA BANK AB Commercial Bank AA- AA- Aa3
21 SKANDINAVISKA ENSKILDA BAN-A Commercial Bank AA- A+ Aa3
22 SOCIETE GENERALE SA*** Commercial Bank A A A2
23 STANDARD CHARTERED PLC*** Commercial Bank A+ BBB+ A2
24 SVENSKA HANDELSBANKEN-A SHS Commercial Bank AA AA- Aa2
25 SWEDBANK AB - A SHARES Commercial Bank AA- AA- Aa3
ii. Market risk
The Group takes on exposure to market risks, which is the risk that fair value or future cash flows of a financial instrument will fluctuate because of changes in market prices. Market risks arise from open positions in interest rate, currency and equity, all of which are exposed to general and specific market movements and changes in the level of volatility of market rates or prices such as interest rates, foreign exchange rates and equity prices. The Bank separates exposures to market risk into either trading or non-trading portfolios. Market risks arising from trading and non-trading activities are concentrated in Bank Treasury and are monitored by management with oversight from the Monetary Policy Committee.Trading portfolios include those positions arising from market-making transactions where the Bank acts as
principal with commercial banks or the market.Non-trading portfolios primarily arise from the interest rate management of the Bank’s investment and monetary policy assets and liabilities. Non-trading portfolios also consist of foreign exchange and equity risks arising from the Bank’s held-to-maturity and World Bank RAMP financial assets.
FINANCIAL PERFORMANCE
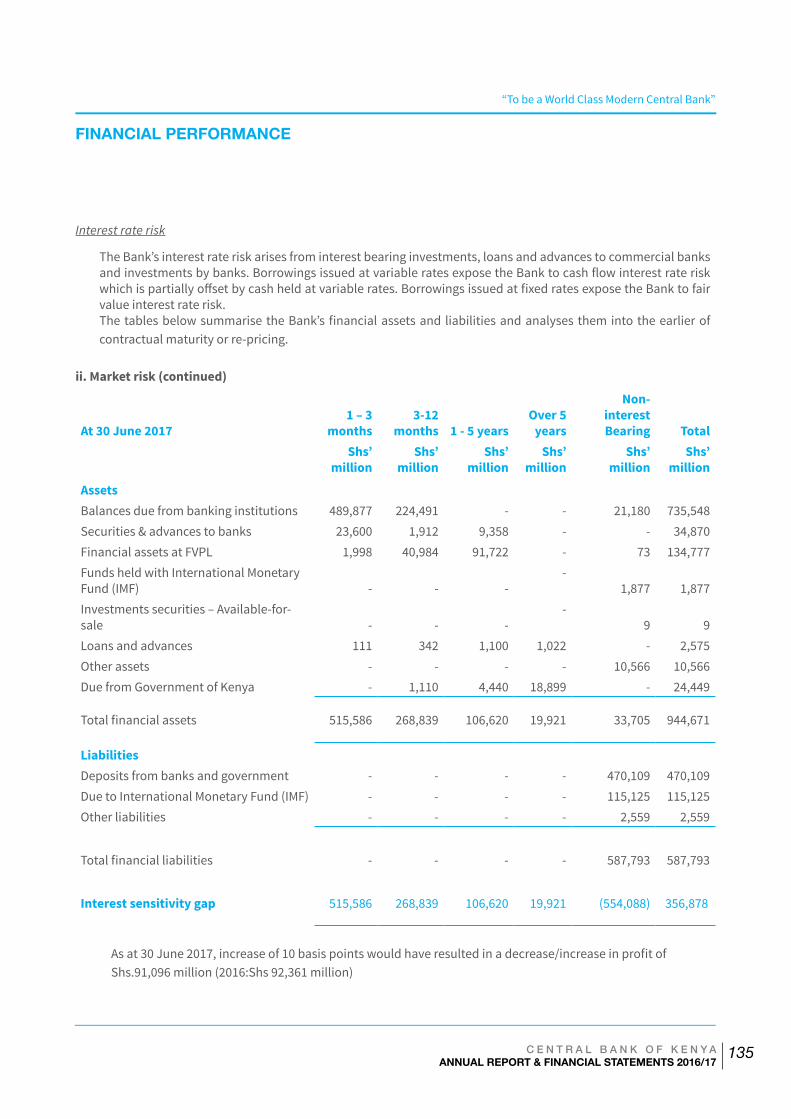
“To be a World Class Modern Central Bank”
C E N T R A L B A N K O F K E N Y AANNUAL REPORT & FINANCIAL STATEMENTS 2016/17
135
Interest rate risk
The Bank’s interest rate risk arises from interest bearing investments, loans and advances to commercial banks and investments by banks. Borrowings issued at variable rates expose the Bank to cash flow interest rate risk which is partially offset by cash held at variable rates. Borrowings issued at fixed rates expose the Bank to fair value interest rate risk. The tables below summarise the Bank’s financial assets and liabilities and analyses them into the earlier of contractual maturity or re-pricing.
ii. Market risk (continued)
At 30 June 20171 – 3
months 3-12
months 1 - 5 yearsOver 5
years
Non-interestBearing Total
Shs’ million
Shs’ million
Shs’ million
Shs’ million
Shs’ million
Shs’ million
AssetsBalances due from banking institutions 489,877 224,491 - - 21,180 735,548Securities & advances to banks 23,600 1,912 9,358 - - 34,870Financial assets at FVPL 1,998 40,984 91,722 - 73 134,777Funds held with International Monetary Fund (IMF) - - -
-1,877 1,877
Investments securities – Available-for-sale - - -
-9 9
Loans and advances 111 342 1,100 1,022 - 2,575Other assets - - - - 10,566 10,566Due from Government of Kenya - 1,110 4,440 18,899 - 24,449
Total financial assets 515,586 268,839 106,620 19,921 33,705 944,671
LiabilitiesDeposits from banks and government - - - - 470,109 470,109Due to International Monetary Fund (IMF) - - - - 115,125 115,125Other liabilities - - - - 2,559 2,559
Total financial liabilities - - - - 587,793 587,793
Interest sensitivity gap 515,586 268,839 106,620 19,921 (554,088) 356,878
As at 30 June 2017, increase of 10 basis points would have resulted in a decrease/increase in profit of Shs.91,096 million (2016:Shs 92,361 million)
FINANCIAL PERFORMANCE
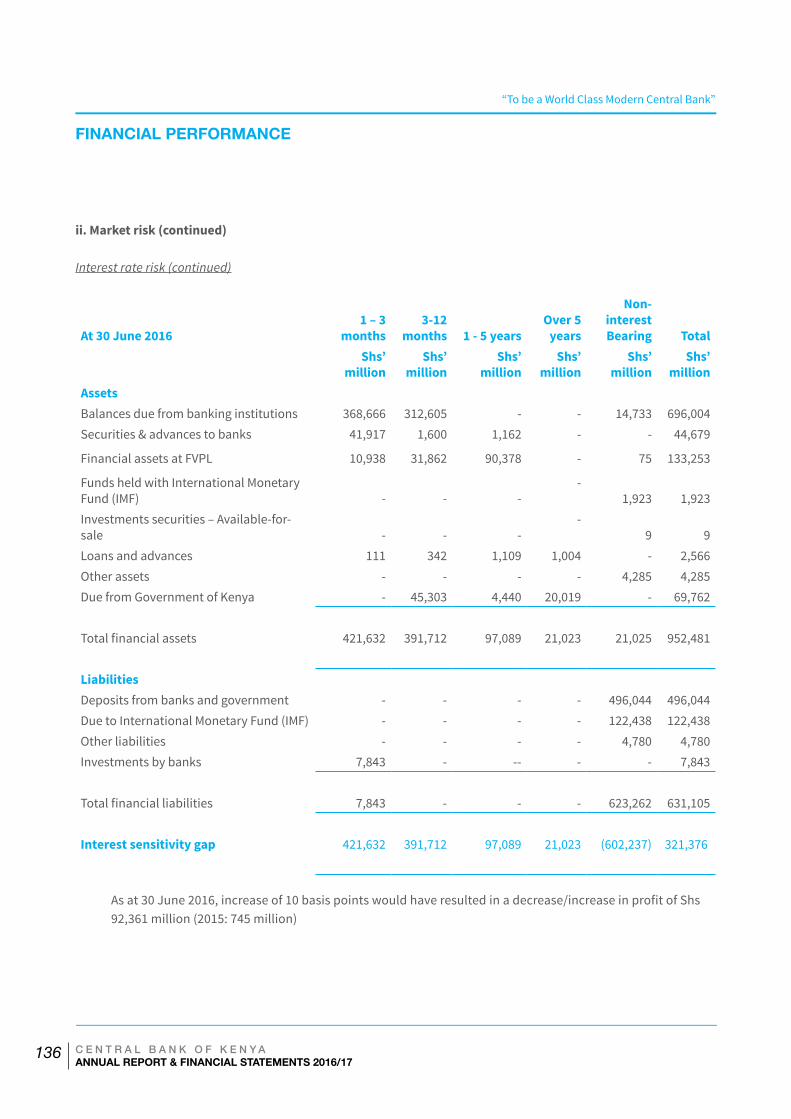
“To be a World Class Modern Central Bank”
C E N T R A L B A N K O F K E N Y AANNUAL REPORT & FINANCIAL STATEMENTS 2016/17
136
ii. Market risk (continued)
Interest rate risk (continued)
At 30 June 20161 – 3
months 3-12
months 1 - 5 yearsOver 5
years
Non-interestBearing Total
Shs’ million
Shs’ million
Shs’ million
Shs’ million
Shs’ million
Shs’ million
AssetsBalances due from banking institutions 368,666 312,605 - - 14,733 696,004Securities & advances to banks 41,917 1,600 1,162 - - 44,679
Financial assets at FVPL 10,938 31,862 90,378 - 75 133,253
Funds held with International Monetary Fund (IMF) - - -
-1,923 1,923
Investments securities – Available-for-sale - - -
-9 9
Loans and advances 111 342 1,109 1,004 - 2,566Other assets - - - - 4,285 4,285Due from Government of Kenya - 45,303 4,440 20,019 - 69,762
Total financial assets 421,632 391,712 97,089 21,023 21,025 952,481
LiabilitiesDeposits from banks and government - - - - 496,044 496,044Due to International Monetary Fund (IMF) - - - - 122,438 122,438Other liabilities - - - - 4,780 4,780Investments by banks 7,843 - -- - - 7,843
Total financial liabilities 7,843 - - - 623,262 631,105
Interest sensitivity gap 421,632 391,712 97,089 21,023 (602,237) 321,376
As at 30 June 2016, increase of 10 basis points would have resulted in a decrease/increase in profit of Shs 92,361 million (2015: 745 million)
FINANCIAL PERFORMANCE
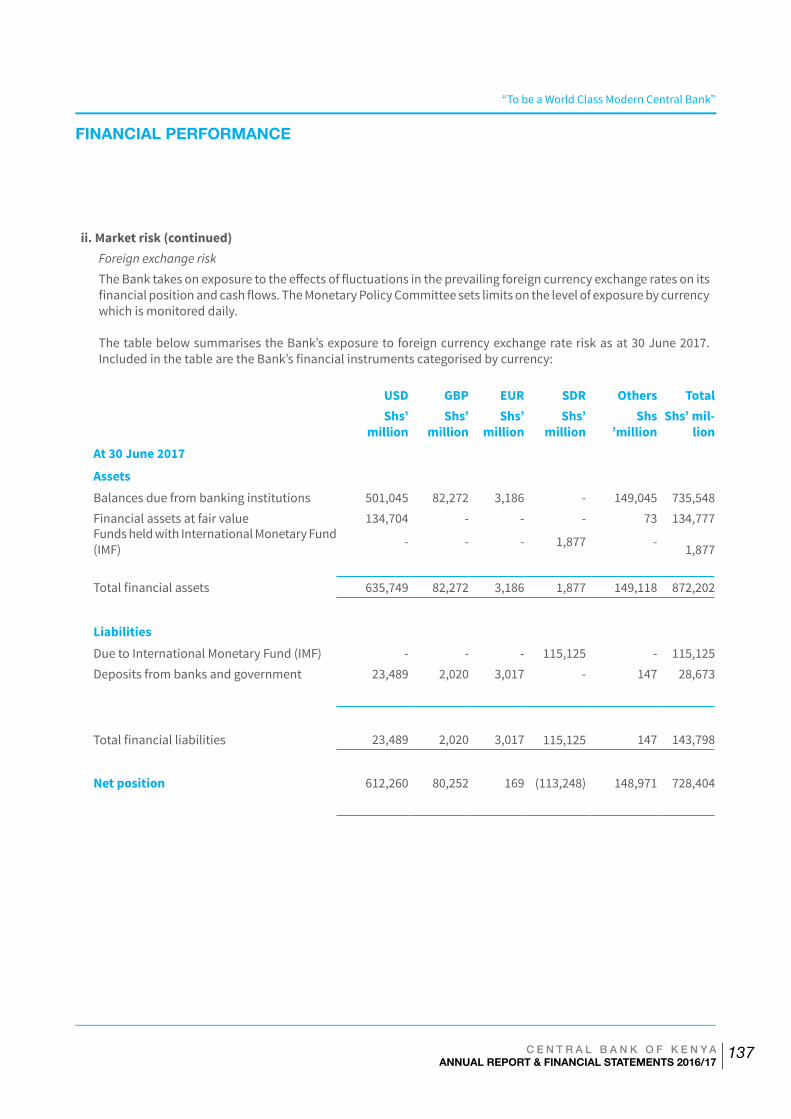
“To be a World Class Modern Central Bank”
C E N T R A L B A N K O F K E N Y AANNUAL REPORT & FINANCIAL STATEMENTS 2016/17
137
ii. Market risk (continued)Foreign exchange risk
The Bank takes on exposure to the effects of fluctuations in the prevailing foreign currency exchange rates on its financial position and cash flows. The Monetary Policy Committee sets limits on the level of exposure by currency which is monitored daily.
The table below summarises the Bank’s exposure to foreign currency exchange rate risk as at 30 June 2017. Included in the table are the Bank’s financial instruments categorised by currency:
USD GBP EUR SDR Others TotalShs’
millionShs’
millionShs’
millionShs’
millionShs
’millionShs’ mil-
lionAt 30 June 2017
AssetsBalances due from banking institutions 501,045 82,272 3,186 - 149,045 735,548Financial assets at fair value 134,704 - - - 73 134,777Funds held with International Monetary Fund (IMF) - - - 1,877 -
1,877
Total financial assets 635,749 82,272 3,186 1,877 149,118 872,202
LiabilitiesDue to International Monetary Fund (IMF) - - - 115,125 - 115,125Deposits from banks and government 23,489 2,020 3,017 - 147 28,673
Total financial liabilities 23,489 2,020 3,017 115,125 147 143,798
Net position 612,260 80,252 169 (113,248) 148,971 728,404
FINANCIAL PERFORMANCE
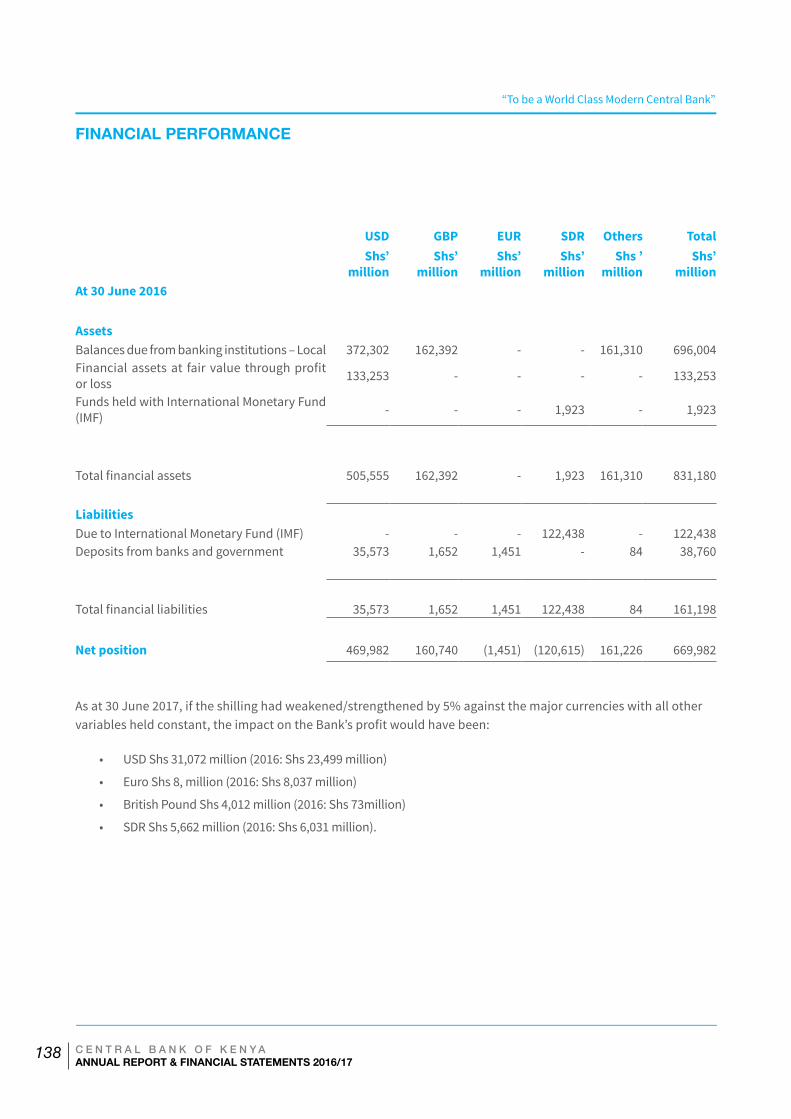
“To be a World Class Modern Central Bank”
C E N T R A L B A N K O F K E N Y AANNUAL REPORT & FINANCIAL STATEMENTS 2016/17
138
USD GBP EUR SDR Others TotalShs’
millionShs’
millionShs’
millionShs’
millionShs ’
millionShs’
millionAt 30 June 2016
AssetsBalances due from banking institutions – Local 372,302 162,392 - - 161,310 696,004Financial assets at fair value through profit or loss 133,253 - - - - 133,253
Funds held with International Monetary Fund (IMF) - - - 1,923 - 1,923
Total financial assets 505,555 162,392 - 1,923 161,310 831,180
LiabilitiesDue to International Monetary Fund (IMF) - - - 122,438 - 122,438Deposits from banks and government 35,573 1,652 1,451 - 84 38,760
Total financial liabilities 35,573 1,652 1,451 122,438 84 161,198
Net position 469,982 160,740 (1,451) (120,615) 161,226 669,982
As at 30 June 2017, if the shilling had weakened/strengthened by 5% against the major currencies with all other variables held constant, the impact on the Bank’s profit would have been:
• USD Shs 31,072 million (2016: Shs 23,499 million)
• Euro Shs 8, million (2016: Shs 8,037 million)
• British Pound Shs 4,012 million (2016: Shs 73million)
• SDR Shs 5,662 million (2016: Shs 6,031 million).
FINANCIAL PERFORMANCE
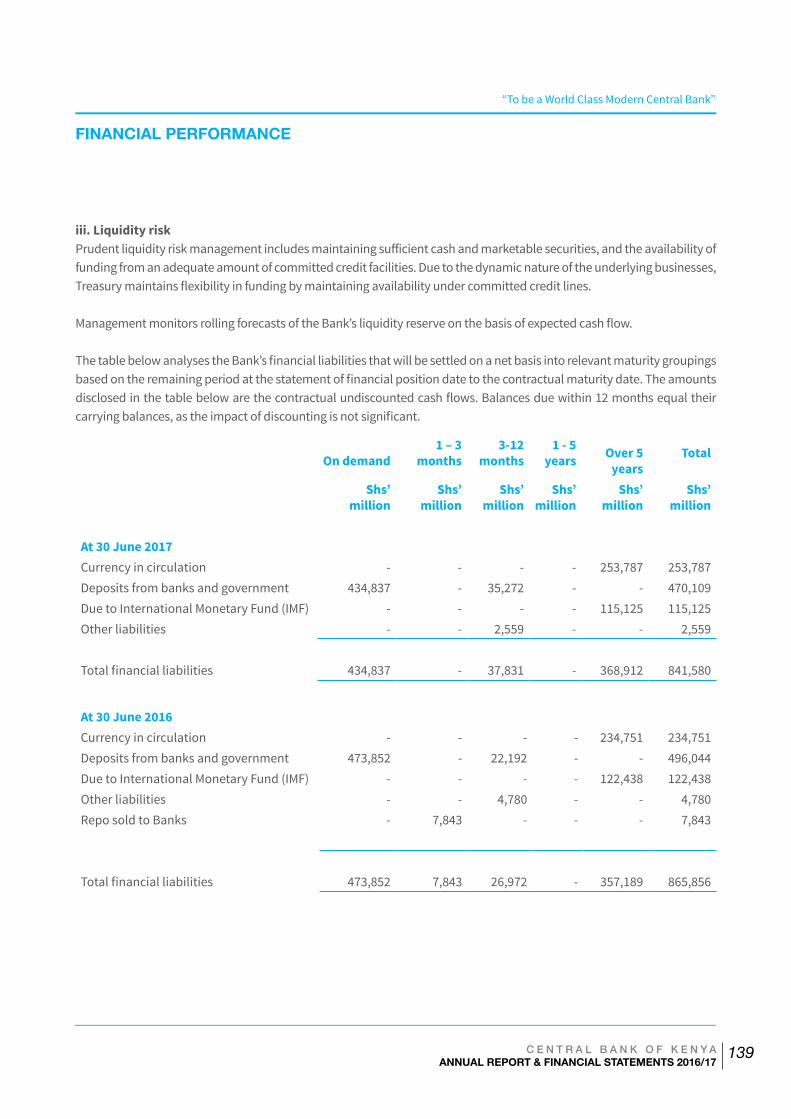
“To be a World Class Modern Central Bank”
C E N T R A L B A N K O F K E N Y AANNUAL REPORT & FINANCIAL STATEMENTS 2016/17
139
iii. Liquidity riskPrudent liquidity risk management includes maintaining sufficient cash and marketable securities, and the availability of funding from an adequate amount of committed credit facilities. Due to the dynamic nature of the underlying businesses, Treasury maintains flexibility in funding by maintaining availability under committed credit lines.
Management monitors rolling forecasts of the Bank’s liquidity reserve on the basis of expected cash flow.
The table below analyses the Bank’s financial liabilities that will be settled on a net basis into relevant maturity groupings based on the remaining period at the statement of financial position date to the contractual maturity date. The amounts disclosed in the table below are the contractual undiscounted cash flows. Balances due within 12 months equal their carrying balances, as the impact of discounting is not significant.
On demand1 – 3
months 3-12
months1 - 5
years Over 5 years
Total
Shs’ million
Shs’ million
Shs’ million
Shs’ million
Shs’ million
Shs’ million
At 30 June 2017Currency in circulation - - - - 253,787 253,787Deposits from banks and government 434,837 - 35,272 - - 470,109Due to International Monetary Fund (IMF) - - - - 115,125 115,125Other liabilities - - 2,559 - - 2,559
Total financial liabilities 434,837 - 37,831 - 368,912 841,580
At 30 June 2016Currency in circulation - - - - 234,751 234,751Deposits from banks and government 473,852 - 22,192 - - 496,044Due to International Monetary Fund (IMF) - - - - 122,438 122,438Other liabilities - - 4,780 - - 4,780Repo sold to Banks - 7,843 - - - 7,843
Total financial liabilities 473,852 7,843 26,972 - 357,189 865,856
FINANCIAL PERFORMANCE
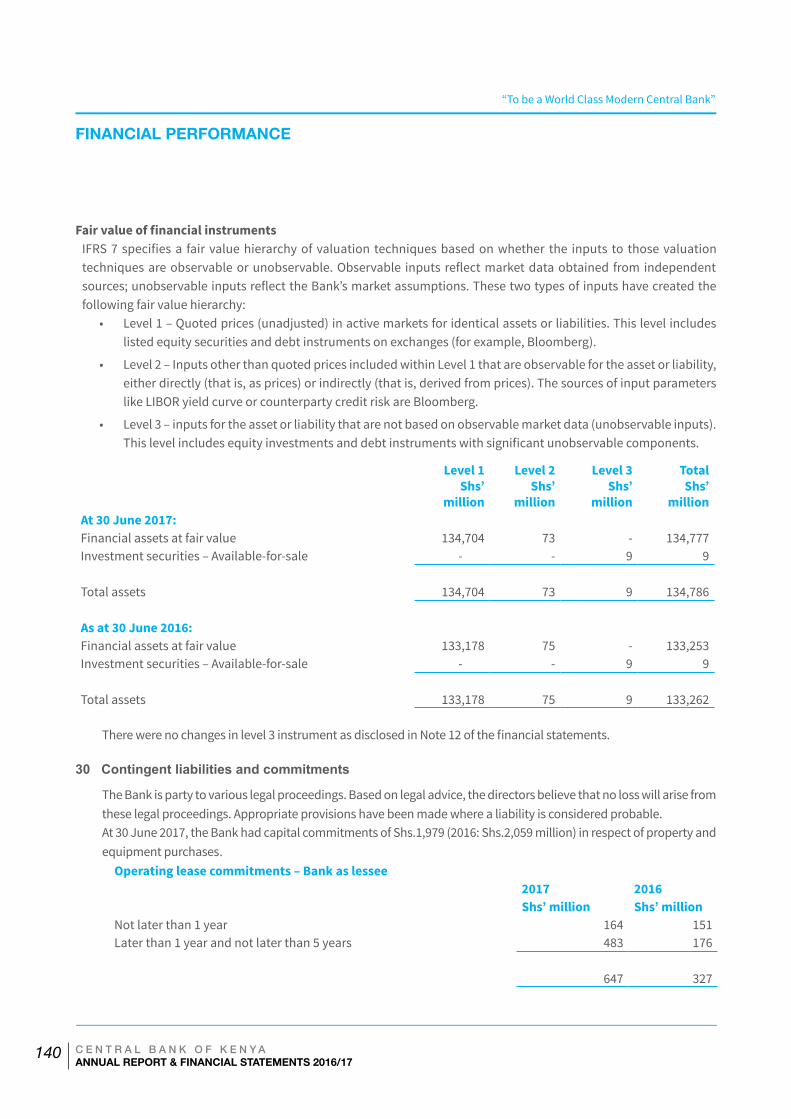
“To be a World Class Modern Central Bank”
C E N T R A L B A N K O F K E N Y AANNUAL REPORT & FINANCIAL STATEMENTS 2016/17
140
Fair value of financial instrumentsIFRS 7 specifies a fair value hierarchy of valuation techniques based on whether the inputs to those valuation techniques are observable or unobservable. Observable inputs reflect market data obtained from independent sources; unobservable inputs reflect the Bank’s market assumptions. These two types of inputs have created the following fair value hierarchy:
• Level 1 – Quoted prices (unadjusted) in active markets for identical assets or liabilities. This level includes listed equity securities and debt instruments on exchanges (for example, Bloomberg).
• Level 2 – Inputs other than quoted prices included within Level 1 that are observable for the asset or liability, either directly (that is, as prices) or indirectly (that is, derived from prices). The sources of input parameters like LIBOR yield curve or counterparty credit risk are Bloomberg.
• Level 3 – inputs for the asset or liability that are not based on observable market data (unobservable inputs). This level includes equity investments and debt instruments with significant unobservable components.
Level 1Shs’
million
Level 2Shs’
million
Level 3Shs’
million
Total Shs’
millionAt 30 June 2017:Financial assets at fair value 134,704 73 - 134,777Investment securities – Available-for-sale - - 9 9
Total assets 134,704 73 9 134,786
As at 30 June 2016:Financial assets at fair value 133,178 75 - 133,253Investment securities – Available-for-sale - - 9 9
Total assets 133,178 75 9 133,262
There were no changes in level 3 instrument as disclosed in Note 12 of the financial statements.
30 Contingent liabilities and commitments
The Bank is party to various legal proceedings. Based on legal advice, the directors believe that no loss will arise from these legal proceedings. Appropriate provisions have been made where a liability is considered probable. At 30 June 2017, the Bank had capital commitments of Shs.1,979 (2016: Shs.2,059 million) in respect of property and equipment purchases.
Operating lease commitments – Bank as lessee2017 2016Shs’ million Shs’ million
Not later than 1 year 164 151Later than 1 year and not later than 5 years 483 176
647 327
FINANCIAL PERFORMANCE
“To be a World Class Modern Central Bank”
C E N T R A L B A N K O F K E N Y AANNUAL REPORT & FINANCIAL STATEMENTS 2016/17
141

“To be a World Class Modern Central Bank”
C E N T R A L B A N K O F K E N Y AANNUAL REPORT & FINANCIAL STATEMENTS 2016/17
142

“To be a World Class Modern Central Bank”
C E N T R A L B A N K O F K E N Y AANNUAL REPORT & FINANCIAL STATEMENTS 2016/17
143

“To be a World Class Modern Central Bank”
C E N T R A L B A N K O F K E N Y AANNUAL REPORT & FINANCIAL STATEMENTS 2016/17
144