Embed Size (px)
Citation preview
A N N U A L R E P O R T
2 0 1 6
GLOBAL DIAGNOSTICS
2 | ABAXIS ANNUAL REPORT 2016
Revenues by Geographic Region
Revenues by Product Category
Other5%
Revenues by Segment
Other2%
Revenues by Geography, Product and Segment for the Year Ended March 31, 2016Reflects results from continuing operations
FINANCIAL HIGHLIGHTS
Financial Overview
North America
80%
Europe14%
Asia Pacific & ROW
6%
Consumables75%
Instruments20%
Veterinary Market
81%
Medical Market
17%
Consolidated Statements of Income Data(in thousands, except per share data)
Year Ended March 31,
Revenues
Gross profit
Income from continuing operations
Loss from discontinued operations, net of tax
Gain on sale of discontinued operations, net of tax
Net income
Diluted net income per share from continuing operations
Diluted net income per share from discontinued operations
Diluted net income per share
Shares used in calculating diluted net income per share
2012
$155,994
$86,096
$15,698
$(2,607)
-
$13,091
$0.70
$(0.12)
$0.58
22,462
2013
$180,878
$100,975
$31,127
$(3,668)
-
$27,459
$1.39
$(0.16)
$1.23
22,381
2014
$162,031
$83,950
$16,229
$(2,044)
-
$14,185
$0.72
$(0.09)
$0.63
22,575
2015
$202,593
$108,970
$20,803
$(1,154)
$7,682
$27,331
$0.91
$0.29
$1.20
22,787
Consolidated Balance Sheets Data(1)
(in thousands)
As of March 31,
Cash and cash equivalents and investments
Working capital
Total assets
Non-current liabilities
Total shareholders’ equity
2012
$90,974
$109,966
$181,836
$4,620
$159,785
2013
$95,264
$132,944
$201,763
$5,550
$176,194
2014
$121,182
$148,553
$217,380
$6,205
$193,916
2015
$157,305
$168,576
$269,064
$7,585
$220,194
(1) Consolidated balance sheets data reported in the table includes continuing and discontinued operations.
2016
$218,901
$123,252
$31,074
$(3)
$559
$31,630
$1.36
$0.02
$1.38
22,883
2016
$152,255
$183,026
$271,380
$5,896
$236,312
ABAXIS ANNUAL REPORT 2016 | 3
Dear Shareholders:
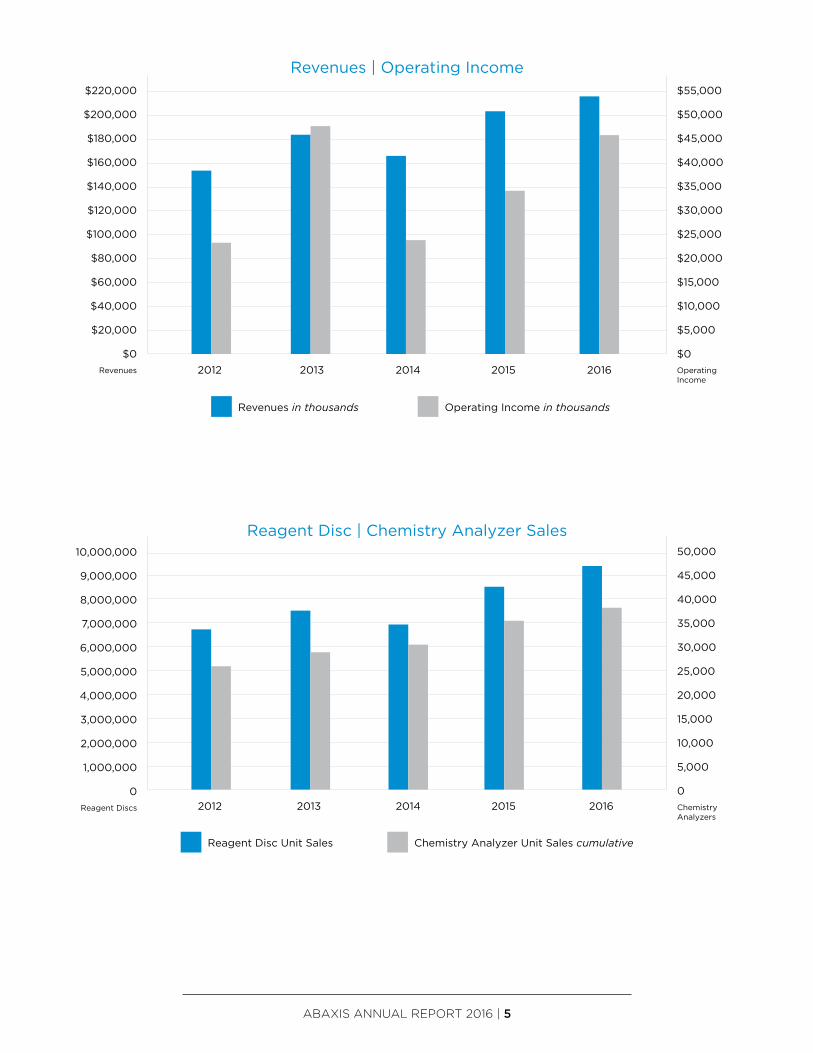
I am very pleased to report that Abaxis continued its growth during fiscal 2016. Abaxis achieved record revenues, strong profitability, and significant positive cash flows in fiscal 2016. Importantly, our growth in revenues was spread across a broad array of strategic contributors including new product introductions and opportunities, geographic expansion, and solid growth in sales of our core medical and veterinary consumable products.
Revenues from continuing operations in fiscal 2016 were $218.9 million, an increase of 8% over fiscal 2015. As a result of our revenue growth and an improvement in our gross profit margins during fiscal 2016, our income from operations increased by 35% over fiscal 2015. Our research and development expenditures increased by 13% as we continue to invest in strengthening our product offerings. Our diluted net income per share from continuing operations in fiscal 2016 was $1.36, compared to $0.91 in the prior year.
Key Financial Highlights of Fiscal 2016• Revenues from continuing operations in North America grew to $175.0 million. International revenues from continuing operations increased to $43.9 million.
• Total sales of medical and veterinary chemistry analyzers were $25.2 million, with a total of 3,535 instruments sold worldwide.
• Medical and veterinary reagent disc sales increased by 9% to $121.1 million, with total unit sales exceeding 9.5 million worldwide.
• We improved gross margins to 56% from 54% in the prior year. Gross profit was $123.3 million, an increase of 13% compared to fiscal 2015.
• We paid four quarterly cash dividends of $0.11 per share each to our shareholders, totaling $10.0 million.
Fiscal 2016 North America Business HighlightsNorth America revenues increased by 7%, or $11.7 million, from fiscal 2015. Revenues from medical and veterinary consumable products represented 78% of our total revenues in North America, an increase of 17%, or $20.0 million, from fiscal 2015. The growth in consumable revenues in fiscal 2016 was driven by sales of our medical and veterinary reagent discs, hematology reagent kits and VetScan rapid diagnostic tests product line. Within our rapid diagnostic tests product line, we generated higher sales from our VetScan Feline FeLV/FIV Rapid Tests, which we introduced in fiscal 2015. The VetScan Feline FeLV/FIV Rapid Test is a highly sensitive and specific test for the detection of antibodies to Feline Immunodeficiency Virus and Feline Leukemia Virus antigen in feline whole blood, serum, or plasma.
Sales of our VetScan VS2 chemistry analyzers and veterinary reagent discs represented 49% of our total revenues in North America, and the sale of these products increased by $1.9 million from fiscal 2015. While revenues from veterinary reagent discs increased by 11%, or $7.2 million, due to an expanded installed base of VetScan VS2 chemistry analyzers, revenues from VetScan VS2 chemistry analyzers decreased by 33%, or $5.3 million, from fiscal 2015 due to higher sales in the prior year from initial stocking orders to two additional distributors and a supply agreement with a large group purchasing organization.
We are focused on continued growth opportunities in our domestic market. In the third quarter of fiscal 2016, we entered into a five-year supply agreement with Banfield Pet Hospital, an organization with more than 900 pet hospitals within the United States and Puerto Rico. Under our supply agreement, we will provide our VetScan hematology analyzers and associated consumables to all of Banfield’s pet hospital locations, for which installation and training began in early fiscal 2017.
Expanding our Global ReachRevenues outside of North America accounted for 20% of total worldwide revenues in fiscal 2016. We continued to focus on increasing our presence globally. Our progress thus far includes increasing revenues in Asia Pacific and rest of the world to $12.6 million in fiscal 2016, a 42% increase over fiscal 2015, driven by the sale of 200 Piccolo Xpress chemistry analyzers to a distributor in China for placement in various provinces throughout the People’s Republic of China.
Our revenues in the Europe market increased slightly to $31.3 million in fiscal 2016, an increase of 3% over fiscal 2015, despite the impact of an unfavorable change in foreign currency exchange rates. In fiscal 2016, we completed the integration of two distributors that we acquired in the United Kingdom in the prior fiscal year, Quality Clinical
Letter to Shareholders
4 | ABAXIS ANNUAL REPORT 2016
Letter to Shareholders
Reagents Limited and Trio Diagnostics (Ireland) Limited. We believe our business in the United Kingdom will be a strong contributor to our international growth by enabling us to continue servicing and supplying Abaxis veterinary products to our existing customer base and also, to facilitate our efforts to expanding our customer base. Growing our international markets remains a key element of our strategic plan as we continue to invest in expanding our sales and marketing infrastructure in markets outside of North America in fiscal 2017.
Medical Segment highlightsAbaxis’ Piccolo Xpress chemistry analyzer allows healthcare providers to provide on-site point-of-care diagnostics with specific chemistry panels. The Piccolo system uses patented reagent discs to run up to 14 lab-accurate test results in approximately 12 minutes. During fiscal 2016, total worldwide revenues in the medical market segment increased by 7%, or $2.5 million, as compared to fiscal 2015. While our total revenues from Piccolo Xpress chemistry analyzers worldwide decreased by 4%, or $0.4 million, due to higher unit sales in the prior year resulting from the Ebola epidemic, our medical reagent discs, the recurring component, increased by 14%, or $3.1 million, over fiscal 2015 due to an expanded installed base of Piccolo Xpress chemistry analyzers in North America.
R&D InvestmentsWe continued to make strategic investments in research and development projects. We invested 8% of our revenues, or $18.4 million, in research and development in fiscal 2016. Our projects in fiscal 2016 included continued development of our high sensitivity immunoassay platform, development of electronic connectivity technology and development of VetScan VUE Rapid Test Reader, a diagnostic instrument operated with a mobile device to interpret VetScan rapid tests. We plan to increase our research and development expenditures in fiscal 2017, as we further invest in the expansion and improvement of our product portfolio.
Maintaining a Strong Balance SheetWe continue to plan carefully, invest prudently and spend conservatively. Our total cash, cash equivalents and short- and long-term investments at March 31, 2016 were $152.3 million. During fiscal 2016, we maintained strength in our cash position and paid a dividend each quarter. During fiscal 2016, we spent $13.0 million to repurchase 0.3 million shares of our common stock, reducing the average number of shares outstanding.
Looking Ahead As we enter fiscal 2017, we are excited about the market landscape in front of us. We’re focused on meeting the needs of patients and customers and with a strong commitment to improving the quality of care and quality of life for patients around the world, our employees and partners have created significant opportunity and laid the foundation for continued success. We believe our strategic priorities align with the needs of patients in the medical and veterinary markets. We’re looking forward to implementing our growth strategies and thank you for your ongoing support.
Sincerely,
Clint H. SeversonChairman and Chief Executive Officer
ABAXIS ANNUAL REPORT 2016 | 5
Revenues | Operating Income
10,000,000
9,000,000
8,000,000
7,000,000
6,000,000
5,000,000
4,000,000
3,000,000
2,000,000
1,000,000
0
Reagent Discs
50,000
45,000
40,000
35,000
30,000
25,000
20,000
15,000
10,000
5,000
0
Chemistry Analyzers
Reagent Disc Unit Sales Chemistry Analyzer Unit Sales cumulative
Reagent Disc | Chemistry Analyzer Sales
2012 2013 2014 2015 2016
$220,000
$200,000
$180,000
$160,000
$140,000
$120,000
$100,000
$80,000
$60,000
$40,000
$20,000
$0
Revenues
$55,000
$50,000
$45,000
$40,000
$35,000
$30,000
$25,000
$20,000
$15,000
$10,000
$5,000
$0
OperatingIncome
2012 2013 2014 2015 2016
Revenues in thousands Operating Income in thousands

[THIS PAGE INTENTIONALLY LEFT BLANK]

6 | ABAXIS ANNUAL REPORT 2016
2016 FORM 10-K AND
2016 FORM 10-K/A

[THIS PAGE INTENTIONALLY LEFT BLANK]
UNITED STATES SECURITIES AND EXCHANGE COMMISSIONWashington, D.C. 20549
FORM 10-K(Mark One)
☒ ANNUAL REPORT PURSUANT TO SECTION 13 or 15(d) OF THE SECURITIES EXCHANGE ACT OF 1934For the fiscal year ended March 31, 2016
or
□ TRANSITION REPORT PURSUANT TO SECTION 13 or 15(d) OF THE SECURITIES EXCHANGE ACT OF 1934
Commission File Number 000-19720
ABAXIS, INC.(Exact name of registrant as specified in its charter)
California 77-0213001(State or other jurisdiction of incorporation or
organization)(I.R.S. Employer Identification No.)
3240 Whipple Road, Union City, California 94587(Address of principal executive offices) (Zip code)
Registrant’s telephone number, including area code: (510) 675-6500Securities registered pursuant to Section 12(b) of the Act:
Title of Class Name of Each Exchange on Which Registered
Common Stock, no par value NASDAQ Global Select Market
Securities registered pursuant to Section 12(g) of the Act: NoneIndicate by check mark if the registrant is a well-known seasoned issuer, as defined in Rule 405 of the Securities Act.
Yes ☒ No □
Indicate by check mark if the registrant is not required to file reports pursuant to Section 13 or Section 15(d) of the Act.Yes □ No ☒
Indicate by check mark whether the registrant (1) has filed all reports required to be filed by Section 13 or 15(d) of the Securities ExchangeAct of 1934 during the preceding 12 months (or for such shorter period that the registrant was required to file such reports), and (2) has beensubject to such filing requirements for the past 90 days.
Yes ☒ No □
Indicate by check mark whether the registrant has submitted electronically and posted on its corporate Web site, if any, every Interactive DataFile required to be submitted and posted pursuant to Rule 405 of Regulation S-T during the preceding 12 months (or for such shorter periodthat the registrant was required to submit and post such files).
Yes ☒ No □
Indicate by check mark if disclosure of delinquent filers pursuant to Item 405 of Regulation S-K is not contained herein, and will not becontained, to the best of registrant’s knowledge, in definitive proxy or information statements incorporated by reference in Part III of thisForm 10-K or any amendment to this Form 10-K. ☒Indicate by check mark whether the registrant is a large accelerated filer, an accelerated filer, a non-accelerated filer, or a smaller reportingcompany. See the definitions of ‘‘large accelerated filer,’’ ‘‘accelerated filer’’ and ‘‘smaller reporting company’’ in Rule 12b-2 of the ExchangeAct. (Check one):
Large accelerated filer ☒ Accelerated filer □ Non-accelerated filer □ Smaller reporting company □
(Do not check if a smaller reportingcompany)
Indicate by check mark whether the registrant is a shell company (as defined in Rule 12b-2 of the Exchange Act).Yes □ No ☒
The aggregate market value of the voting stock held by non-affiliates of Abaxis as of September 30, 2015, the last business day of the secondfiscal quarter, based upon the closing price of such stock on the NASDAQ Global Select Market on September 30, 2015, was $701,046,000.For purposes of this disclosure, 6,780,000 shares of common stock held by persons who hold more than 10% of the outstanding shares of theregistrant’s common stock and shares held by executive officers and directors of the registrant have been excluded because such persons maybe deemed to be affiliates. This determination of affiliate status is not necessarily conclusive for any other purpose.As of May 26, 2016, there were 22,500,000 shares of the registrant’s common stock outstanding.
Abaxis, Inc.Annual Report on Form 10-K
For The Fiscal Year Ended March 31, 2016
TABLE OF CONTENTS
Page
PART IItem 1. Business . . . . . . . . . . . . . . . . . . . . . . . . . . . . . . . . . . . . . . . . . . . . . . . . . . . . . . . . . . . . . . . . . . . . . . . 3Item 1A. Risk Factors . . . . . . . . . . . . . . . . . . . . . . . . . . . . . . . . . . . . . . . . . . . . . . . . . . . . . . . . . . . . . . . . . . . . 13Item 1B. Unresolved Staff Comments . . . . . . . . . . . . . . . . . . . . . . . . . . . . . . . . . . . . . . . . . . . . . . . . . . . . . . . 26Item 2. Properties . . . . . . . . . . . . . . . . . . . . . . . . . . . . . . . . . . . . . . . . . . . . . . . . . . . . . . . . . . . . . . . . . . . . . . 26Item 3. Legal Proceedings . . . . . . . . . . . . . . . . . . . . . . . . . . . . . . . . . . . . . . . . . . . . . . . . . . . . . . . . . . . . . . . 26Item 4. Mine Safety Disclosures . . . . . . . . . . . . . . . . . . . . . . . . . . . . . . . . . . . . . . . . . . . . . . . . . . . . . . . . . . 26
PART II
Item 5. Market for Registrant’s Common Equity, Related Stockholder Matters and Issuer Purchases ofEquity Securities . . . . . . . . . . . . . . . . . . . . . . . . . . . . . . . . . . . . . . . . . . . . . . . . . . . . . . . . . . . . . . 27
Item 6. Selected Consolidated Financial Data . . . . . . . . . . . . . . . . . . . . . . . . . . . . . . . . . . . . . . . . . . . . . . . 29Item 7. Management’s Discussion and Analysis of Financial Condition and Results of Operations. . . . . 30Item 7A. Quantitative and Qualitative Disclosures About Market Risk. . . . . . . . . . . . . . . . . . . . . . . . . . . . . 56Item 8. Financial Statements and Supplementary Data . . . . . . . . . . . . . . . . . . . . . . . . . . . . . . . . . . . . . . . . 58Item 9. Changes in and Disagreements with Accountants on Accounting and Financial Disclosure. . . . . 94Item 9A. Controls and Procedures . . . . . . . . . . . . . . . . . . . . . . . . . . . . . . . . . . . . . . . . . . . . . . . . . . . . . . . . . . 94Item 9B. Other Information . . . . . . . . . . . . . . . . . . . . . . . . . . . . . . . . . . . . . . . . . . . . . . . . . . . . . . . . . . . . . . . 96
PART III
Item 10. Directors, Executive Officers and Corporate Governance. . . . . . . . . . . . . . . . . . . . . . . . . . . . . . . . 96Item 11. Executive Compensation . . . . . . . . . . . . . . . . . . . . . . . . . . . . . . . . . . . . . . . . . . . . . . . . . . . . . . . . . . 96Item 12. Security Ownership of Certain Beneficial Owners and Management and Related
Stockholder Matters. . . . . . . . . . . . . . . . . . . . . . . . . . . . . . . . . . . . . . . . . . . . . . . . . . . . . . . . . . . . 96Item 13. Certain Relationships and Related Transactions, and Director Independence . . . . . . . . . . . . . . . . 96Item 14. Principal Accounting Fees and Services. . . . . . . . . . . . . . . . . . . . . . . . . . . . . . . . . . . . . . . . . . . . . . 96
PART IV
Item 15. Exhibits and Financial Statement Schedules . . . . . . . . . . . . . . . . . . . . . . . . . . . . . . . . . . . . . . . . . . 97
Signatures . . . . . . . . . . . . . . . . . . . . . . . . . . . . . . . . . . . . . . . . . . . . . . . . . . . . . . . . . . . . . . . . . . . . . . . . . . . . . . . . 99Exhibit Index . . . . . . . . . . . . . . . . . . . . . . . . . . . . . . . . . . . . . . . . . . . . . . . . . . . . . . . . . . . . . . . . . . . . . . . . . . . . . 100
2
Abaxis, Inc. Form 10-K
PART I
FORWARD-LOOKING STATEMENTS
This report contains forward-looking statements within the meaning of Sections 21E of the Securities Exchange Actof 1934, as amended that reflect Abaxis’ current view with respect to future events and financial performance. Allstatements contained in this report, other than statements of historical fact, including statements regarding our futureresults of operations and financial condition, our business strategy and plans, and our objectives for our business, areforward-looking statements. The words ‘‘will,’’ ‘‘anticipates,’’ ‘‘believes,’’ ‘‘expects,’’ ‘‘intends,’’ ‘‘plans,’’ ‘‘future,’’‘‘projects,’’ ‘‘estimates,’’ ‘‘would,’’ ‘‘may,’’ ‘‘could,’’ ‘‘should,’’ ‘‘might,’’ and similar expressions identify forward-looking statements. These forward-looking statements are subject to certain risks and uncertainties, including but notlimited to those discussed below, that could cause actual results to differ materially from historical results or thoseanticipated. Such risks and uncertainties relate to our manufacturing operations, including the vulnerability of ourmanufacturing operations to potential interruptions and delays and our ability to manufacture products free of defects,our ability to compete effectively, market acceptance of our products, fluctuations in our quarterly results ofoperations and difficulty in predicting future results, the performance of our independent distributors and our abilityto manage their inventory levels effectively, expansion of our sales, marketing and distribution efforts, ourdependence on Abbott Point of Care, Inc., (‘‘Abbott’’) for our U.S. medical sales, our dependence on certain sole orlimited source suppliers, the effect of exchange rate fluctuations on international operations, dependence on keypersonnel, the protection of our intellectual property and claims of infringement of intellectual property asserted bythird parties and other risks detailed under ‘‘Risk Factors’’ in this Annual Report on Form 10-K.
Readers are cautioned not to place undue reliance on these forward-looking statements, which speak only as of thedate hereof. Abaxis assumes no obligation to update any forward-looking statements as circumstances change.Readers are advised to read this Annual Report on Form 10-K in its entirety, paying careful attention to the riskfactors set forth in this and other reports or documents filed by Abaxis from time to time with the Securities andExchange Commission (‘‘SEC’’), particularly the quarterly reports on Form 10-Q and any current reports onForm 8-K, copies of which may be obtained from Abaxis or from the SEC at its website at www.sec.gov.
When used in this report, the terms ‘‘we,’’ ‘‘us,’’ ‘‘our,’’ ‘‘the Company’’ and ‘‘Abaxis’’ refer to Abaxis, Inc. and oursubsidiaries. Our fiscal year ends on March 31, and accordingly, the terms ‘‘fiscal 2016,’’ ‘‘fiscal 2015’’ and ‘‘fiscal2014’’ in this report refer to the years ended March 31, 2016, 2015 and 2014, respectively.
Item 1. Business
General
Abaxis, Inc. is a worldwide developer, manufacturer and marketer of portable blood analysis systems that are usedin a broad range of medical specialties in human or veterinary patient care to provide clinicians with rapid bloodconstituent measurements. Our mission is to improve the efficiency of care delivery to and the quality of life ofpatients in the medical and veterinary markets. We provide leading edge technology, tools and services that supportbest medical practices, enabling physicians and veterinarians to respond to the health needs of their clients at the pointof care while operating economical and profitable practices.
Our primary products are as follows:
• point-of-care diagnostic instruments and consumables used in the medical market; and
• point-of-care diagnostic instruments and consumables used in the veterinary market
Abaxis is a California corporation and was incorporated in 1989. Since our company’s formation, our sales haveincreased in part due to the increased installed base of our blood chemistry analyzers and the expansion of testmethods that we provide to the medical and veterinary markets. Additionally, over the past several years, we haveexpanded our diagnostic products and service offerings in the veterinary market. While we offer our direct customersa range of diagnostic products and services, our business and revenue model is focused on recurring revenue.Recurring revenues consist primarily of consumable revenue. We believe that the breadth of our product portfolioenables us to compete in the worldwide healthcare market.
Discontinued Operations
Until March 2015, we provided veterinary reference laboratory diagnostic and consulting services for veterinariansthrough our Abaxis Veterinary Reference Laboratories (‘‘AVRL’’) division. On March 31, 2015, we sold substantially
3
Abaxis, Inc. Form 10-K
all of the assets of AVRL to Antech Diagnostics, Inc., the VCA laboratory division (‘‘Antech’’), for $21.0 million incash pursuant to an asset purchase agreement as described in more detail in the section of this report entitled‘‘Management’s Discussion and Analysis of Financial Condition and Results of Operations - DiscontinuedOperations’’ and Note 3 to the Consolidated Financial Statements in Part II, Item 8 of this report.
We have reclassified the assets and liabilities of AVRL as discontinued operations on our consolidated balance sheetsfor all periods presented and the results of operations of AVRL as discontinued operations on our consolidatedstatements of income for all periods presented.
Business Segments and Products
We manage our business in two reportable business segments, the medical market and the veterinary market, whichare based on the diagnostic products sold and services provided by market and customer group. For products that wesell that are not specifically identified to any particular business segment, we categorize the revenue as Other. Adescription of our business segments is set forth below. Financial information regarding our reportable businesssegments is included under ‘‘Results of Operations’’ in Item 7 of this report and Note 19 to the Consolidated FinancialStatements in Part II, Item 8 of this report.
Medical Market
Customer Base
Our products sold to the medical market are used by a diverse range of medical specialties requiring accurate, realtime results to enable rapid clinical decisions in the area of human diagnostics. The current customer focus of ourmedical products include: physicians’ office practices across multiple specialties, urgent care, outpatient and walk-inclinics (free-standing or hospital-connected), health screening operations, home care providers (national, regional orlocal), nursing homes, ambulance companies, oncology treatment clinics, dialysis centers, pharmacies, hospitallaboratories, military installations (ships, field hospitals and mobile care units) pharmaceutical clinical trials andcruise ship lines. Revenues in the medical market accounted for 17%, 17% and 17% of our total revenues for fiscal2016, 2015 and 2014, respectively.
Products
Our point-of-care products in the medical market consist of our Piccolo chemistry analyzers and consumableproducts, as described below.
Piccolo Chemistry Analyzers. We develop, manufacture and sell the Piccolo Xpress chemistry analyzer for use inhuman patient care to provide clinicians with rapid blood constituent measurements. The Piccolo Xpress chemistryanalyzer provides on the spot routine multi-chemistry and electrolyte results using a small patient sample size in anytreatment setting. The Piccolo Xpress chemistry analyzer can be operated with minimal training and performsmultiple routine general chemistry tests on whole blood, serum or plasma samples. The system provides test resultsin approximately 12 minutes with precision and accuracy comparable to a clinical laboratory analyzer. The PiccoloXpress analyzer has a sophisticated Intelligent Quality Control (iQC) system and proprietary algorithms that assurequality and dependable results. We continue to support and service previous versions of our Piccolo chemistryanalyzers.
4
Abaxis, Inc. Form 10-K
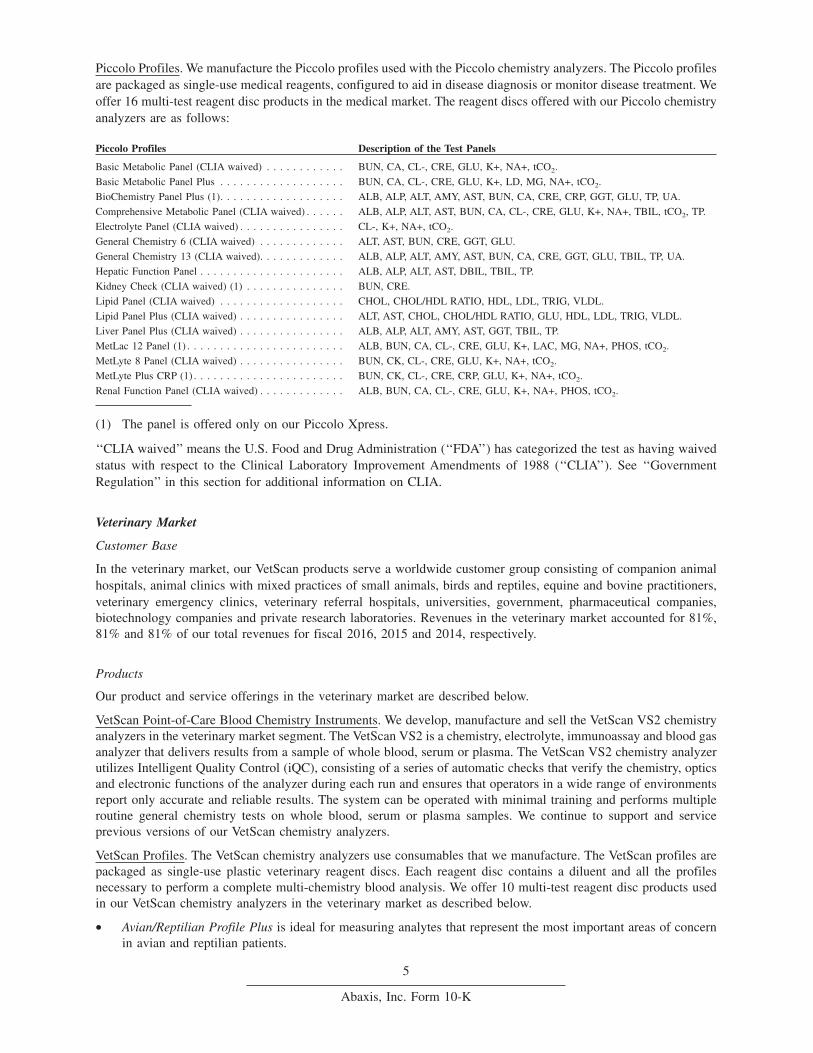
Piccolo Profiles. We manufacture the Piccolo profiles used with the Piccolo chemistry analyzers. The Piccolo profilesare packaged as single-use medical reagents, configured to aid in disease diagnosis or monitor disease treatment. Weoffer 16 multi-test reagent disc products in the medical market. The reagent discs offered with our Piccolo chemistryanalyzers are as follows:
Piccolo Profiles Description of the Test Panels
Basic Metabolic Panel (CLIA waived) . . . . . . . . . . . . BUN, CA, CL-, CRE, GLU, K+, NA+, tCO2.
Basic Metabolic Panel Plus . . . . . . . . . . . . . . . . . . . BUN, CA, CL-, CRE, GLU, K+, LD, MG, NA+, tCO2.
BioChemistry Panel Plus (1). . . . . . . . . . . . . . . . . . . ALB, ALP, ALT, AMY, AST, BUN, CA, CRE, CRP, GGT, GLU, TP, UA.
Comprehensive Metabolic Panel (CLIA waived) . . . . . . ALB, ALP, ALT, AST, BUN, CA, CL-, CRE, GLU, K+, NA+, TBIL, tCO2, TP.
Electrolyte Panel (CLIA waived) . . . . . . . . . . . . . . . . CL-, K+, NA+, tCO2.
General Chemistry 6 (CLIA waived) . . . . . . . . . . . . . ALT, AST, BUN, CRE, GGT, GLU.
General Chemistry 13 (CLIA waived). . . . . . . . . . . . . ALB, ALP, ALT, AMY, AST, BUN, CA, CRE, GGT, GLU, TBIL, TP, UA.
Hepatic Function Panel . . . . . . . . . . . . . . . . . . . . . . ALB, ALP, ALT, AST, DBIL, TBIL, TP.
Kidney Check (CLIA waived) (1) . . . . . . . . . . . . . . . BUN, CRE.
Lipid Panel (CLIA waived) . . . . . . . . . . . . . . . . . . . CHOL, CHOL/HDL RATIO, HDL, LDL, TRIG, VLDL.
Lipid Panel Plus (CLIA waived) . . . . . . . . . . . . . . . . ALT, AST, CHOL, CHOL/HDL RATIO, GLU, HDL, LDL, TRIG, VLDL.
Liver Panel Plus (CLIA waived) . . . . . . . . . . . . . . . . ALB, ALP, ALT, AMY, AST, GGT, TBIL, TP.
MetLac 12 Panel (1) . . . . . . . . . . . . . . . . . . . . . . . . ALB, BUN, CA, CL-, CRE, GLU, K+, LAC, MG, NA+, PHOS, tCO2.
MetLyte 8 Panel (CLIA waived) . . . . . . . . . . . . . . . . BUN, CK, CL-, CRE, GLU, K+, NA+, tCO2.
MetLyte Plus CRP (1) . . . . . . . . . . . . . . . . . . . . . . . BUN, CK, CL-, CRE, CRP, GLU, K+, NA+, tCO2.
Renal Function Panel (CLIA waived) . . . . . . . . . . . . . ALB, BUN, CA, CL-, CRE, GLU, K+, NA+, PHOS, tCO2.
(1) The panel is offered only on our Piccolo Xpress.
‘‘CLIA waived’’ means the U.S. Food and Drug Administration (‘‘FDA’’) has categorized the test as having waivedstatus with respect to the Clinical Laboratory Improvement Amendments of 1988 (‘‘CLIA’’). See ‘‘GovernmentRegulation’’ in this section for additional information on CLIA.
Veterinary Market
Customer Base
In the veterinary market, our VetScan products serve a worldwide customer group consisting of companion animalhospitals, animal clinics with mixed practices of small animals, birds and reptiles, equine and bovine practitioners,veterinary emergency clinics, veterinary referral hospitals, universities, government, pharmaceutical companies,biotechnology companies and private research laboratories. Revenues in the veterinary market accounted for 81%,81% and 81% of our total revenues for fiscal 2016, 2015 and 2014, respectively.
Products
Our product and service offerings in the veterinary market are described below.
VetScan Point-of-Care Blood Chemistry Instruments. We develop, manufacture and sell the VetScan VS2 chemistryanalyzers in the veterinary market segment. The VetScan VS2 is a chemistry, electrolyte, immunoassay and blood gasanalyzer that delivers results from a sample of whole blood, serum or plasma. The VetScan VS2 chemistry analyzerutilizes Intelligent Quality Control (iQC), consisting of a series of automatic checks that verify the chemistry, opticsand electronic functions of the analyzer during each run and ensures that operators in a wide range of environmentsreport only accurate and reliable results. The system can be operated with minimal training and performs multipleroutine general chemistry tests on whole blood, serum or plasma samples. We continue to support and serviceprevious versions of our VetScan chemistry analyzers.
VetScan Profiles. The VetScan chemistry analyzers use consumables that we manufacture. The VetScan profiles arepackaged as single-use plastic veterinary reagent discs. Each reagent disc contains a diluent and all the profilesnecessary to perform a complete multi-chemistry blood analysis. We offer 10 multi-test reagent disc products usedin our VetScan chemistry analyzers in the veterinary market as described below.
• Avian/Reptilian Profile Plus is ideal for measuring analytes that represent the most important areas of concernin avian and reptilian patients.
5
Abaxis, Inc. Form 10-K
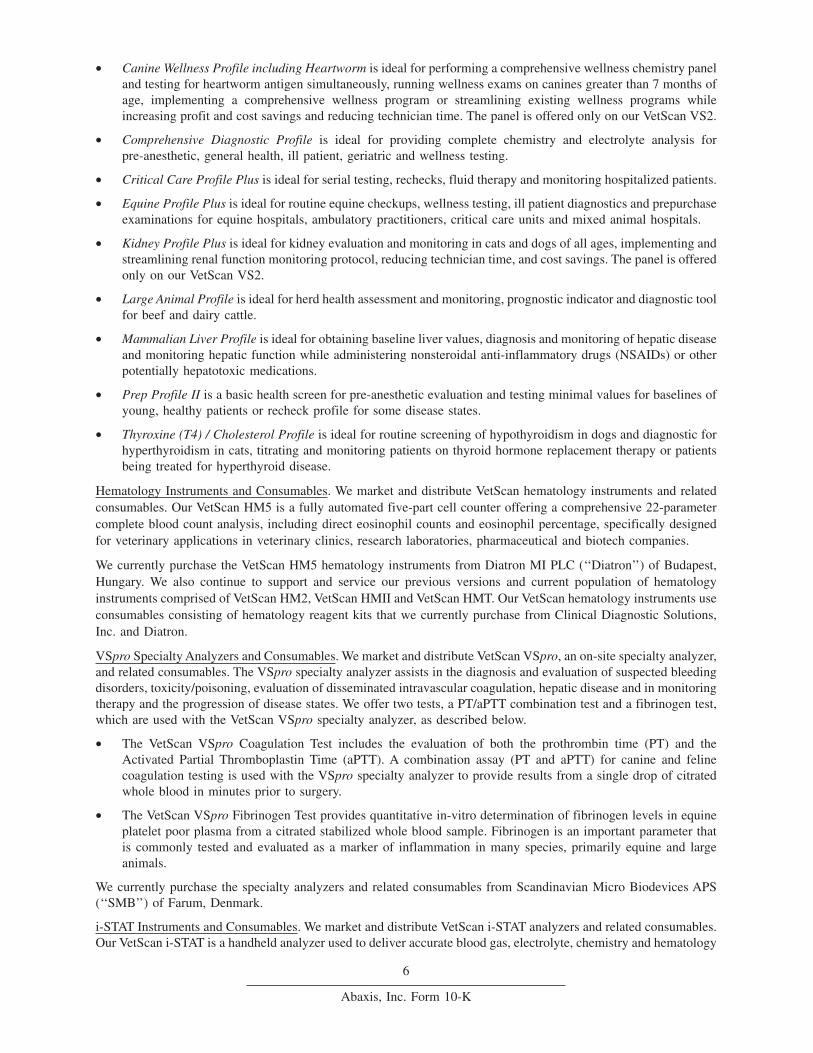
• Canine Wellness Profile including Heartworm is ideal for performing a comprehensive wellness chemistry paneland testing for heartworm antigen simultaneously, running wellness exams on canines greater than 7 months ofage, implementing a comprehensive wellness program or streamlining existing wellness programs whileincreasing profit and cost savings and reducing technician time. The panel is offered only on our VetScan VS2.
• Comprehensive Diagnostic Profile is ideal for providing complete chemistry and electrolyte analysis forpre-anesthetic, general health, ill patient, geriatric and wellness testing.
• Critical Care Profile Plus is ideal for serial testing, rechecks, fluid therapy and monitoring hospitalized patients.
• Equine Profile Plus is ideal for routine equine checkups, wellness testing, ill patient diagnostics and prepurchaseexaminations for equine hospitals, ambulatory practitioners, critical care units and mixed animal hospitals.
• Kidney Profile Plus is ideal for kidney evaluation and monitoring in cats and dogs of all ages, implementing andstreamlining renal function monitoring protocol, reducing technician time, and cost savings. The panel is offeredonly on our VetScan VS2.
• Large Animal Profile is ideal for herd health assessment and monitoring, prognostic indicator and diagnostic toolfor beef and dairy cattle.
• Mammalian Liver Profile is ideal for obtaining baseline liver values, diagnosis and monitoring of hepatic diseaseand monitoring hepatic function while administering nonsteroidal anti-inflammatory drugs (NSAIDs) or otherpotentially hepatotoxic medications.
• Prep Profile II is a basic health screen for pre-anesthetic evaluation and testing minimal values for baselines ofyoung, healthy patients or recheck profile for some disease states.
• Thyroxine (T4) / Cholesterol Profile is ideal for routine screening of hypothyroidism in dogs and diagnostic forhyperthyroidism in cats, titrating and monitoring patients on thyroid hormone replacement therapy or patientsbeing treated for hyperthyroid disease.
Hematology Instruments and Consumables. We market and distribute VetScan hematology instruments and relatedconsumables. Our VetScan HM5 is a fully automated five-part cell counter offering a comprehensive 22-parametercomplete blood count analysis, including direct eosinophil counts and eosinophil percentage, specifically designedfor veterinary applications in veterinary clinics, research laboratories, pharmaceutical and biotech companies.
We currently purchase the VetScan HM5 hematology instruments from Diatron MI PLC (‘‘Diatron’’) of Budapest,Hungary. We also continue to support and service our previous versions and current population of hematologyinstruments comprised of VetScan HM2, VetScan HMII and VetScan HMT. Our VetScan hematology instruments useconsumables consisting of hematology reagent kits that we currently purchase from Clinical Diagnostic Solutions,Inc. and Diatron.
VSpro Specialty Analyzers and Consumables. We market and distribute VetScan VSpro, an on-site specialty analyzer,and related consumables. The VSpro specialty analyzer assists in the diagnosis and evaluation of suspected bleedingdisorders, toxicity/poisoning, evaluation of disseminated intravascular coagulation, hepatic disease and in monitoringtherapy and the progression of disease states. We offer two tests, a PT/aPTT combination test and a fibrinogen test,which are used with the VetScan VSpro specialty analyzer, as described below.
• The VetScan VSpro Coagulation Test includes the evaluation of both the prothrombin time (PT) and theActivated Partial Thromboplastin Time (aPTT). A combination assay (PT and aPTT) for canine and felinecoagulation testing is used with the VSpro specialty analyzer to provide results from a single drop of citratedwhole blood in minutes prior to surgery.
• The VetScan VSpro Fibrinogen Test provides quantitative in-vitro determination of fibrinogen levels in equineplatelet poor plasma from a citrated stabilized whole blood sample. Fibrinogen is an important parameter thatis commonly tested and evaluated as a marker of inflammation in many species, primarily equine and largeanimals.
We currently purchase the specialty analyzers and related consumables from Scandinavian Micro Biodevices APS(‘‘SMB’’) of Farum, Denmark.
i-STAT Instruments and Consumables. We market and distribute VetScan i-STAT analyzers and related consumables.Our VetScan i-STAT is a handheld analyzer used to deliver accurate blood gas, electrolyte, chemistry and hematology
6
Abaxis, Inc. Form 10-K
results in minutes from 2-3 drops of whole blood. The VetScan i-STAT offers a variety of disposable, single-usecartridges (10) including tests for acid/base analysis, blood gases, chemistry, hematology, electrolytes, and somespecialty tests including Lactate, ACT and Cardiac Troponin I. These cartridges are configured with parameters thatcan give a clear patient’s condition depending on the clinical situation. The VetScan i-STAT has reference ranges forcats, dogs and horses. We currently purchase the VetScan i-STAT analyzers and related consumables from Abbott.
Rapid Tests. In the veterinary market, our VetScan Rapid Test product line consists of individual rapid tests that aidin the detection of various specific diseases. The lateral flow immunoassay technology in the rapid tests providesimmediate results. We offer the following VetScan Rapid Tests in the veterinary market, as described below.
• The VetScan Canine Anaplasma Rapid Test is a highly sensitive and specific test for the detection of antibodiesto A. phagocytophilum and/or A. platys in canine whole blood, serum, or plasma.
• The VetScan Canine Ehrlichia Rapid Test is a rapid test for the qualitative detection of antibodies to E. canis,E. chaffeensis, and/or E. ewingii in canines.
• The VetScan Feline FeLV/FIV Rapid Test is a rapid test for the detection of antibodies to FelineImmunodeficiency Virus and Antigen to Feline Leukemia Virus in feline whole blood, serum, or plasma.
• The VetScan Canine Heartworm Rapid Test is a rapid test for the qualitative detection of Dirofilaria immitis incanine or feline whole blood, serum or plasma.
• The VetScan Canine Lyme Rapid Test is a rapid test for the qualitative detection of antibodies to Borreliaburgdorferi in canine whole blood, serum or plasma.
• The VetScan Canine Parvovirus Rapid Test is a rapid test for the qualitative detection of canine parvovirusantigen in feces.
• The VetScan Giardia Rapid Test is a rapid test for the qualitative detection of Giardia cyst antigens in caninefeces.
We currently purchase substantially all of the VetScan Rapid Tests from SA Scientific Co. in the United States.
Services
AVRL. We sold our entire AVRL business, which provided veterinary reference laboratory diagnostic and consultingservices for veterinarians in the United States to Antech, which transaction closed on March 31, 2015. In connectionwith this sale of assets, we terminated our strategic alliance with Kansas State University, K-State VeterinaryDiagnostic Lab and Kansas State University Institute for Commercialization (formerly known as National Institutefor Strategic Technology Acquisition and Commercialization), to provide veterinary diagnostic and laboratory testingand related services.
Other
We also generate revenues from the sale of products using our patented Orbos Discrete Lyophilization Process (the‘‘Orbos process’’) to companies for other applications. The Orbos process involves flash-freezing a drop of liquidreagent to form a solid bead and then freeze-drying the bead to remove water. The Orbos beads are stable in dry formand dissolve rapidly in aqueous solutions. The dry reagents used in our reagent discs are produced using the Orbosprocess. This process allows the production of a precise amount of active chemical ingredient in the form of a solublebead. We believe that the Orbos process has broad applications in products where delivery of active ingredients ina stable, pre-metered format is desired.
We have a supply contract with Becton, Dickinson and Company (‘‘BD’’) for products using the Orbos process. InJanuary 2011, we entered into a ten year supplier agreement with Becton, Dickinson and Company to supply productsusing Abaxis’ patented Orbos process. In our agreement, BD will be subject to purchase minimum quantities on anannual basis to maintain specified pricing based on volume purchasing during each calendar year 2011 through 2021.Actual purchases by BD in the future will be based on their demand, and therefore, may vary from period to period.The agreement will expire in January 2021 and can be extended. From time to time, we license the technologyunderlying the Orbos process to third parties. Revenues from these arrangements, however, are unpredictable.
Sales and Marketing
We market and sell our products worldwide by maintaining direct sales forces and through independent distributors.We primarily sold our veterinary reference laboratory diagnostic and consulting services in the United States through
7
Abaxis, Inc. Form 10-K
our direct sales force. Our sales force is primarily located in the United States. Abaxis Europe GmbH, ourwholly-owned subsidiary in Germany, markets and distributes diagnostic systems for medical and veterinary uses inthe European and Asia Pacific markets. Sales and marketing expenses were $42.5 million, $42.1 million and$34.7 million, or 19%, 21% and 21% of our total revenues in fiscal 2016, 2015 and 2014, respectively. Starting inthe third quarter of fiscal 2015, Abaxis UK, our wholly-owned subsidiary in the United Kingdom, distributeslaboratory instrumentation and consumables to the veterinary profession in the United Kingdom. Abaxis UK wasformed by our acquisition of Quality Clinical Reagents Limited and Trio Diagnostics (Ireland) Ltd in November2014.
Distribution within North America
Medical Market
For our products in the human medical market, we employ primarily independent distributors to market our products.Starting in January 2013, we transitioned the majority of our medical product sales to Abbott as our exclusivedistributor in the medical market. Pursuant to our Exclusive Agreement with Abbott (the ‘‘Abbott Agreement’’),Abbott obtained the exclusive right to sell and distribute our Piccolo Xpress chemistry analyzers and associatedconsumables in the professionally-attended human healthcare market in the United States and China (including HongKong). Effective September 2013, we amended the Abbott Agreement to limit Abbott’s territory under suchagreement to the United States. Under the Abbott Agreement, we have certain responsibilities for providing technicalsupport and warranty services to Abbott in support of its marketing and sales efforts. The initial term of the AbbottAgreement ends on December 31, 2017, and after the initial term, the Abbott Agreement renews automatically forsuccessive one-year periods unless terminated by either party based upon a notice of non-renewal six months priorto the then-current expiration date. Abbott accounted for 10%, 11% and 10% of our total worldwide revenues in fiscal2016, 2015 and 2014, respectively.
We will continue to sell and distribute these medical products outside of the market segments as to which Abbott hasexclusive rights. Under our Abbott Agreement, we will continue to sell and distribute to Catapult Health LLC andspecified customer segments in the United States, including pharmacy and retail store clinics, shopping malls,contract research organizations (‘‘CROs’’) and cruise ship lines.
Veterinary Market
For our products in the veterinary market, we employ a combination of direct sales and independent distributors.Veterinarians are served typically by local distributors, some with national affiliations. We work with variousindependent distributors to sell our instruments and consumable products. In the United States, our distributorsinclude, among others, Henry Schein Animal Health, Merritt Veterinary Supplies, Inc., MWI Veterinary Supply, Inc.(‘‘MWI’’), Northeast Veterinary Supply, Patterson Companies, Inc. (including both Patterson’s veterinary businessand Animal Health International, Inc., as a result of Patterson’s acquisition of Animal Health International in oursecond quarter of fiscal 2016), Penn Veterinary Supply, Inc. and Western Medical Supply, Inc. In Canada, ourdistributors of veterinary products include Associated Veterinary Purchasing Co. Ltd., CDMV, Midwest VeterinaryPurchasing Cooperative Ltd., Veterinary Purchasing Company Limited and Western Drug Distribution CenterLimited. In September 2012, we entered into a non-exclusive distributor agreement with MWI. MWI accounted for20%, 19% and 19% of our total worldwide revenues in fiscal 2016, 2015 and 2014, respectively.
In addition to selling through distributors, we also directly supply our VetScan products to large group purchasingorganizations, hospital networks and other buying groups in the United States, such as Veterinary Centers of America(VCA), a veterinary hospital chain in North America that operates more than 700 animal hospitals. In May 2014, weentered into a product supply agreement with VCA to supply our VetScan chemistry analyzers and diagnostic reagentdiscs for placement at VCA’s animal hospitals located in North America. Additionally, in May 2014, we entered intoa non-exclusive co-marketing agreement with VCA’s Antech Diagnostic laboratory services to supply our VetScanchemistry analyzers in combination with Antech Diagnostic laboratory services as a diagnostic solution to serveveterinary practices throughout North America. In the third quarter of fiscal 2016, we also entered into a five-yearsupply agreement with Banfield Pet Hospital, an organization with more than 900 pet hospitals within the UnitedStates and Puerto Rico. Under our supply agreement, we will provide our VetScan hematology analyzers andassociated consumables to all of Banfield’s pet hospital locations, for which installation and training began in earlyfiscal 2017.
8
Abaxis, Inc. Form 10-K
Distribution Outside of North America
Our medical and veterinary products are sold worldwide. For reporting purposes, we organize our operations outsideof North America as follows: Europe and Asia Pacific and rest of the world. International revenues accounted forapproximately 20%, 19% and 22% of our revenues in fiscal 2016, 2015 and 2014, respectively. Maintaining andexpanding our international presence is an important component of our long-term growth strategy. Internationally, weuse primarily distributors who offer our medical or veterinary diagnostic products in certain countries and markets.Our international sales and marketing objectives include identifying and defining the market segments in eachcountry by product and then focusing on specific objectives for each segment in each country. These specificobjectives include modification and expansion of distribution and distributor training and monitoring to ensure theattainment of sales goals.
We currently have distributors that carry either our medical or veterinary products in the following countries:Australia, Austria, Belgium, Czech Republic, Denmark, France, Germany, Hong Kong, India, Indonesia, Israel, Italy,Japan, Korea, Macao, the Netherlands, New Zealand, the Philippines, Portugal, Romania, Russia, Singapore, Spain,Sweden, Switzerland, Turkey, the United Arab Emirates and the United Kingdom. Our distributor in each of thesecountries is responsible for obtaining the necessary approvals to sell our new and existing products. A discussion ofthe risks associated with our international revenues is included in Item 1A of this Annual Report. Revenues in Europeaccounted for 14%, 15% and 17% of our total revenues for fiscal 2016, 2015 and 2014, respectively. Revenues inAsia Pacific and rest of the world accounted for 6%, 4% and 5% of our total revenues for fiscal 2016, 2015 and 2014,respectively.
Manufacturing and Suppliers
We manufacture our Piccolo and VetScan blood chemistry instruments and the associated reagent discs at our facilitylocated in Union City, California. We utilize standardized manufacturing processes, quality control and cost reductionand inventory management programs for our manufacturing operations. We continue to review our operations andfacilities in an effort to reduce costs, increase manufacturing capacity and increase efficiencies. Our manufacturingactivities are concentrated in the following three primary areas:
• Point-of-Care Blood Chemistry Instruments: Our Piccolo and VetScan systems employ a variety of componentsdesigned or specified by us, including a variable speed motor, microprocessors, a liquid crystal display, a printer,a spectrophotometer and other electronic components. These components are manufactured by severalthird-party suppliers that have been qualified and approved by us and then assembled by our contractmanufacturers. The components are assembled at our facility into the finished product and completely tested toensure that the finished product meets product specifications. Our blood analyzer products use severaltechnologically-advanced components that we currently purchase from a limited number of suppliers, includingcertain components from our single-source supplier, Hamamatsu Corporation. Our analyzers also use a printerthat is primarily made by Advanced Printing Systems.
• Reagent Discs: The molded plastic discs used in the manufacture of the reagent disc are manufactured to ourspecifications by established injection-molding manufacturers. To achieve the precision required for accuratetest results, the discs must be molded to very strict tolerances. To date, we have qualified two injection-moldingmanufacturers, C. Brewer & Co., a division of Balda AG, and Nypro, Inc., a subsidiary of Jabil Circuit, to makethe molded plastic discs that, when loaded with reagents and welded together, form our reagent disc products.We assemble the reagent discs by loading the molded plastic discs with reagents and then ultrasonically weldingtogether the top and bottom pieces.
• Reagent Beads and Reagents: Our reagent discs contain dry reagent chemistry beads and diluents to performblood analyses. Lateral flow rapid tests contain reagents and diluents necessary to perform blood analyses. Wepurchase chemicals from third-party suppliers and formulate the raw materials, using proprietary processes, intobeads at the proper concentration and consistency to facilitate placement in the reagent disc and providehomogeneous dissolution and mixing when contacted by the diluted sample. We are dependent on the followingcompanies as single source providers of one or more chemicals that we use in the reagent production process:Amano Enzyme USA Co., Ltd., Kikkoman Corporation Biochemical Division, Microgenics Corporation, adivision of Thermo Fisher Scientific, Roche Molecular Biochemicals of Roche Diagnostics Corporation, adivision of F. Hoffmann-La Roche, Ltd., SA Scientific Co., Sekisui Diagnostics, Sigma Aldrich Inc. and ToyoboSpecialties.
9
Abaxis, Inc. Form 10-K
Although we believe that there may be potential alternate suppliers available for these critical components, to datewe have not qualified additional vendors beyond those referenced above and cannot assure you that we would be ableto enter into arrangements with additional vendors on favorable terms, or at all. We primarily operate on a purchaseorder basis with most of our suppliers and, therefore, these suppliers are under no contractual obligation to supplyus with their products or to do so at specified prices.
In our veterinary market, we also market instruments and consumables that are manufactured by third parties and werely on third parties to supply us with these specific products. These original manufacturer-supplied products arecurrently available from limited sources as discussed below.
• Hematology Instruments and Reagent Kits: Our VetScan hematology instruments are manufactured by Diatronin Hungary and are purchased by us as a completed instrument. In addition, we currently have qualified twosuppliers to produce the reagent kits for our hematology instruments: Clinical Diagnostic Solutions, Inc. andDiatron.
• VSpro Specialty Analyzers and Cartridges: Our VetScan VSpro specialty analyzers and cartridges aremanufactured by SMB in Denmark and are purchased by us as completed products. Under our amendedequipment manufacturing agreement with SMB effective January 2014, we have annual purchase requirementson the VSpro specialty analyzers and related cartridges during each calendar year from 2014 through 2016.
• i-STAT Analyzers and Cartridges: The VetScan i-STAT 1 analyzers and cartridges are manufactured by Abbottand are purchased by us as completed products. We are subject to minimum purchase and minimum salesrequirement if we want to maintain as an exclusive distributor of the related products. The initial term of theagreement ended in December 2014. After this initial term, our agreement continues automatically forsuccessive one-year periods unless terminated by either party.
• Rapid Tests: Substantially all of our VetScan Rapid Tests are manufactured by a single source supplier, SAScientific Co., located in the United States.
For the suppliers of original equipment manufactured products with which we have long-term contracts, there can beno assurance that these suppliers will always fulfill their obligations under these contracts, or that any suppliers willnot experience disruptions in their ability to supply our requirements for products. In addition, under some contractswith suppliers we have minimum purchase obligations and our failure to satisfy those obligations may result in lossof some or all of our rights under these contracts.
We generally operate with a limited order backlog because our products are typically shipped shortly after orders arereceived. As a result, product sales in any quarter are generally dependent on orders booked and shipped in thatquarter.
Competition
Competition in the human medical and veterinary diagnostic markets is intense. The diagnostic market is awell-established field in which there are a number of competitors that have substantially greater financial resourcesand larger, more established marketing, sales and service organizations than we do. We compete primarily with thefollowing organizations: commercial clinical laboratories, hospitals’ clinical laboratories and manufacturers of benchtop multi-test blood analyzers and other testing systems that health care providers can use at the point of care.
Historically, hospitals and commercial laboratories perform most of the human diagnostic testing, and veterinaryspecialized commercial laboratories perform most of the veterinary medical testing. We have identified five principalfactors that we believe customers typically use to evaluate our products and those of our competitors. These factorsinclude the following: range of tests offered, immediacy of results, cost effectiveness, ease of use and reliability ofresults. We believe that we compete effectively on each of these factors except for the range of tests offered. Clinicallaboratories are effective at processing large panels of tests using skilled technicians and complex equipment.Currently, while our offering of instruments and reagent discs does not provide the same broad range of tests ashospitals and commercial laboratories, we believe that in certain markets, our products provide a sufficient breadthof test menus to compete successfully with clinical laboratories given the advantages of our products with respect tothe other four factors.
Our principal competitors in the point-of-care human medical diagnostic market are Alere Switzerland GmbH, AlfaWassermann S.P.A., Ortho-Clinical Diagnostics, Inc. and F. Hoffmann-La Roche Ltd. Additionally, in certainsegments of the human medical diagnostic market, we compete with Abbott’s i-STAT division. Many of our
10
Abaxis, Inc. Form 10-K
competitors in the human medical diagnostic market have significantly larger product lines to offer and greaterfinancial and other resources than we do. In particular, many of these competitors have large sales forces andwell-established distribution channels and brand names.
Our principal competitors in the veterinary diagnostic market are Idexx Laboratories, Inc. and Heska Corporation.Idexx has a larger veterinary product and service offering and larger sales infrastructure than we do and awell-established brand name.
Government Regulation
Regulation by governmental authorities in the U.S. and foreign countries is a significant factor in the manufactureand marketing of our current and future products and in our ongoing product research and development activities. Weare not required to comply with all of the FDA government regulations applicable to the human medical market whenmanufacturing our VetScan products; however, we intend for all of our manufacturing operations to be compliantwith the Quality System Regulation to help ensure product quality and integrity regardless of end use or patient. Aswe continue to sell in foreign markets, we may have to obtain additional governmental clearances in those markets.The government regulations for our medical and veterinary products vary.
FDA Regulation of Human Medical Devices
Our Piccolo products are in vitro diagnostic medical devices subject to regulation by the FDA, under the FederalFood, Drug, and Cosmetic Act (‘‘FDCA’’). Medical devices, to be commercially distributed in the United States, mustreceive either 510(k) premarket clearance or Premarket Approval (‘‘PMA’’) from the FDA prior to marketing.Devices deemed to pose relatively less risk are placed in either class I or II, which generally requires the manufacturerto submit a premarket notification requesting permission for commercial distribution; this is known as 510(k)clearance. Most lower risk, or class I, devices are exempted from this requirement. Devices deemed by the FDA topose the greatest risk, such as life-sustaining, life supporting or implantable devices, or devices deemed notsubstantially equivalent to a previously 510(k) cleared device or a preamendment class III device for which PMAapplications have not been called, are placed in class III requiring PMA approval. The FDA has classified our Piccoloproducts as class I or class II devices, depending on their specific intended uses and indications for use.
To obtain 510(k) clearance, a manufacturer must submit a premarket notification demonstrating that the proposeddevice is substantially equivalent in intended use, principles of operation, and technological characteristics to apreviously 510(k) cleared device or a device that was in commercial distribution before May 28, 1976 for which theFDA has not called for submission of PMA applications. The FDA’s 510(k) clearance pathway usually takes fromthree to six months, but it can take longer. After a device receives 510(k) clearance, any modification that couldsignificantly affect its safety or effectiveness, or that would constitute a major change in its intended use, requiresa new 510(k) clearance or could require a PMA approval.
As of March 31, 2016, we currently have received FDA premarket clearance for our Piccolo chemistry analyzer and27 reagent tests that we have on 16 reagent discs. We are currently developing additional tests that we will have toclear with the FDA through the 510(k) notification process. The FDA may disagree with our assessment and requireus to seek PMA approval or require us to meet significant postmarketing requirements.
Our Piccolo products are also subject to the Clinical Laboratory Improvement Amendments of 1988 (‘‘CLIA’’). Thecurrent CLIA regulations divide laboratory tests into three categories: ‘‘waived,’’ ‘‘moderately complex’’ and ‘‘highlycomplex.’’ We currently offer Basic Metabolic Panel, Comprehensive Metabolic Panel, Electrolyte Panel, GeneralChemistry 6, General Chemistry 13, Kidney Check, Lipid Panel, Lipid Panel Plus, Liver Panel Plus, MetLyte 8 Paneland Renal Function Panel tests under waived status, which permits personnel not subject to CLIA imposed trainingrequirements to run the Piccolo chemistry analyzer using these tests and thus allows for marketing to more sites(doctors’ offices and other point-of-care environments that maintain a CLIA certificate of waiver) than our otherproducts that are subject to the other categories. For example, five of the tests performed using the Piccolo systemare in the ‘‘moderately complex’’ category. This category requires that any location in which testing is performed becertified as a laboratory. Hence, we can only sell some Piccolo products to customers who meet the standards of alaboratory, which requires a testing facility to be certified by the Centers for Medicare and Medicaid Services, orCMS, and meet the CLIA regulations. As a result, the market for these non-waived products is more limited.
In March 2014, the FDA granted CLIA waived status for fingerstick draw for total cholesterol, high-densitylipoprotein cholesterol and triglycerides blood tests. As a result, combined with existing CLIA waived tests for liver
11
Abaxis, Inc. Form 10-K
diagnostics and glucose using fingerstick samples, we now have two complete lipid panels that can be used byhealthcare professionals to diagnose, treat and monitor hyperlipidemia patients using a sample obtained from eithervenous blood or a fingerstick draw. This enables U.S. healthcare professionals to perform lipid and liver diagnostics,as well as measure glucose levels with a simple fingerstick using the Piccolo chemistry analyzer.
USDA Licensure of Veterinary Biologics
Our rotor-based Canine Heartworm Antigen Test (‘‘CHW’’) and our lateral flow tests, including Canine BorreliaBurgdorferi Antibody Test Kit (rapid test for Lyme disease in dogs), Canine Ehrlichia Antibody Test Kit and CanineAnaplasma Test Kit, are regulated as veterinary biologics under the Virus, Serum, and Toxin Act of 1913. Both testsrequire licensure of both the product and manufacturing facilities. Biologics products are subject to more extensivetesting to establish their purity, safety, potency, and efficacy and any failure to comply with the United StatesDepartment of Agriculture’s Animal and Plant Health Inspection Service (APHIS) Center for Veterinary Biologics(CVB) licensure or post-marketing approval requirements can result in the inability to obtain and maintain requiredlicenses for our products and there can be no assurances that our products can be maintained to the required qualitylevels necessary to continue to market these products. In addition, we are currently developing additional tests thatwill be subject to CVB licensure as veterinary biologics and licensure under CVB cannot be assured for theseproducts.
Manufacturing and International Regulations
The 1976 Medical Device Amendments also require us to manufacture our Piccolo products in accordance with GoodManufacturing Practices guidelines. Current Good Manufacturing Practice requirements are set forth in the FDA’sQuality System Regulation. These requirements regulate the methods used in, and the facilities and controls used forthe design, manufacture, packaging, storage, installation and servicing of our medical devices intended for humanuse. Our manufacturing facility is subject to periodic inspections. In addition, various state regulatory agencies mayregulate the manufacture of our products.
Federal, state, local and international regulations regarding the manufacture and sale of health care products anddiagnostic devices may change. In addition, as we continue to sell in foreign markets, we may have to obtainadditional governmental clearances in those markets. To date, we have complied with what we believe to be allapplicable federal, state, local and international regulatory requirements and standards, including those of the FDA,USDA, State of California Food and Drug Branch and International Organization for Standardization for medicaldevices.
New Products and Research and Development
We are focused on the development of new products and on improvements to existing products. Research anddevelopment activities relate to development of new tests and test methods, clinical trials, product improvements,optimization and enhancement of existing products and expenses related to regulatory and quality assurance.
Our research and development expenses, which consist of personnel costs, consulting expenses and materials andrelated expenses, were $18.4 million, $16.3 million and $13.6 million, or 8%, 8% and 8% of our total revenues, infiscal 2016, 2015 and 2014, respectively. Research and development expense as a percentage of total revenuesremained consistent over the same periods, reflecting our continued commitment to invest in long-term growthopportunities.
We anticipate that we will continue to make expenditures for research and development as we seek to provide newproducts to maintain and improve our competitive position. We will continue to develop new products and servicesthat we believe will provide further opportunities for growth in the human medical and veterinary markets.Development of tests for point-of-care diagnostics will be targeted at specific applications based on fulfilling clinicalneeds.
Patents, Proprietary Technologies and Licenses
Our products sold in both the medical and veterinary markets are based on complex, rapidly-developing technologies.Some of these technologies are covered by patents that we own and others are owned by third-parties and are usedby us under license.
12
Abaxis, Inc. Form 10-K
We have pursued the development of a patent portfolio to protect our proprietary technology. Our policy is to filepatent applications to protect technology, inventions and improvements that are important to the development of ourbusiness. We also rely upon trade secrets, trademarks, know-how, continuing technological innovations and licensingopportunities to develop and maintain our competitive position. As of March 31, 2016, 80 patent applications havebeen filed on our behalf with the United States Patent and Trademark Office, of which 44 patents have been issuedand 16 patents are currently active. The expiration dates of our active patents with the United States Patent andTrademark Office range from December 2017 to October 2034. In addition, we have 7 issued and active foreignpatents and 38 foreign patent applications pending, of which three are Patent Cooperation Treaty internationalapplications to be filed nationally in foreign countries.
Some of our existing products are manufactured or sold under the terms of license agreements that require us to payroyalties to the licensor based on the sales of products containing the licensed technology. From January 2009 toFebruary 2015, we licensed co-exclusively certain worldwide patent rights related to lateral flow immunoassaytechnology in the field of animal health diagnostics in the professional marketplace from Alere. The licenseagreement enabled us to develop and market products under rights from Alere in the animal health and laboratoryanimal research markets. In exchange for the license rights, we (i) paid an up-front license fee of $5.0 million,(ii) agreed to pay royalties during the term of the agreement, based solely on sales of products in a jurisdiction countrycovered by valid and unexpired claims in that jurisdiction under the licensed Alere patent rights, and (iii) agreed topay a yearly minimum license fee of between $0.5 million to $1.0 million per year, which fee was creditable againstany royalties due during such calendar year. The royalties, if any, were payable through the date of the expiration ofthe last valid patent licensed under the agreement that includes at least one claim in a jurisdiction covering productswe sell in that jurisdiction. Effective February 2015, we terminated our license agreement with Alere as the licensedpatents that we used had expired.
Employees
As of March 31, 2016, we had 549 full-time employees. None of our employees are covered by a collectivebargaining agreement and we consider our relations with our employees to be good.
Geographic Information
For a description of our revenue and long-lived assets by geographic location, see Note 20 of the Notes to ourConsolidated Financial Statements included elsewhere in this Annual Report on Form 10-K.
Information Available to Investors
The Company’s website is www.abaxis.com. This Annual Report on Form 10-K, our Quarterly Reports onForm 10-Q, our Current Reports on Form 8-K and any amendments hereto and thereto are made available withoutcharge on the Investor Relations section of our website, filed under ‘‘SEC Filings’’. These materials are available onthe website as soon as reasonably practicable after filing these materials with, or furnishing them to, the Securitiesand Exchange Commission. In addition, copies of our reports, proxy statements and other information filedelectronically with the SEC may be accessed at http://www.sec.gov. The public may also submit a written request tothe SEC, Office of FOIA/PA Operations, 100 F Street, NE, Washington, DC 20549. This information may also beobtained by calling the SEC at 202-551-8300, by sending an electronic message to the SEC at [email protected] by sending a fax to the SEC at 202-772-9337.
Item 1A. Risk Factors
RISK FACTORS THAT MAY AFFECT OUR PERFORMANCE
Our future performance is subject to a number of risks. If any of the following risks actually occur, our business couldbe harmed and the trading price of our common stock could decline. In evaluating our business, you should carefullyconsider the following risks in addition to the other information in this Annual Report on Form 10-K. We note thesefactors for investors as permitted by the Private Securities Litigation Reform Act of 1995. It is not possible to predictor identify all such factors and, therefore, you should not consider the following risks to be a complete statement ofall the potential risks or uncertainties that we face.
Our facilities and manufacturing operations are vulnerable to interruption as a result of natural disasters, systemfailures and other business disruptions. Any such interruption may harm our business.
Our business depends on the efficient and uninterrupted operation of our manufacturing operations, which areco-located with our corporate headquarters in Union City, California. These manufacturing operations are vulnerable
13
Abaxis, Inc. Form 10-K
to damage or interruption from earthquakes, fire, floods, power loss, telecommunications failures, break-ins andsimilar events. A failure of manufacturing operations, be it in the development and manufacturing of our Piccolo orVetScan blood chemistry analyzers or the reagent discs used in the blood chemistry analyzers, could result in ourinability to supply customer demand. We do not have a backup facility to provide redundant manufacturing capacityin the event of a system failure or other significant loss or problem. Accordingly, if our manufacturing operations inUnion City, California were interrupted, we may be required to bring an alternative facility online, a process thatcould take several weeks to several months or more. The occurrence of a business disruption could harm our revenueand financial condition and increase our costs and expenses. Although we carry property and business interruptioninsurance to insure against the financial impact of certain events of this nature, our coverage may not be adequateto compensate us for all losses that may occur.
We face significant competition. We may not be able to compete effectively with larger, more established entitiesor their products, or with future organizations or future products, which could cause our sales to decline.
The diagnostic market is a well-established field in which there are a number of competitors that have substantiallygreater financial and operational resources and larger, more established marketing, sales and service organizationsthan we do. We compete primarily with the following organizations: commercial clinical laboratories, hospitals’clinical laboratories, and manufacturers of bench top multi-test blood analyzers and other testing systems that healthcare providers can use at the point of care.
Historically, hospitals and commercial laboratories perform most of the human diagnostic testing, and veterinaryspecialized commercial laboratories perform most of the veterinary medical testing. We have identified five principalfactors that we believe customers typically use to evaluate our products and those of our competitors. These factorsinclude the following: range of tests offered, immediacy of results, cost effectiveness, ease of use and reliability ofresults. We believe that we compete effectively on each of these factors except for the range of tests offered. Clinicallaboratories are effective at processing large panels of tests using skilled technicians and complex equipment.Currently, while our offering of instruments and reagent discs does not provide the same broad range of tests ashospitals and commercial laboratories, we believe that in certain markets, our products provide a sufficient breadthof test menus to compete successfully with clinical laboratories given the advantages of our products with respect tothe other four factors. In addition, we cannot assure you that we will continue to be able to compete effectively oncost effectiveness, ease of use, immediacy of results or reliability of results. We also cannot assure you that we willever be able to compete effectively on the basis of range of tests offered.
Our principal competitors in the point-of-care human medical diagnostic market are Alere, Alfa Wassermann S.P.A.,Ortho-Clinical Diagnostics, Inc. and F. Hoffmann-La Roche Ltd. Additionally, in certain segments of the humanmedical diagnostic market, we compete with Abbott’s i-STAT division. Many of our competitors in the humanmedical diagnostic market have significantly larger product lines to offer and greater financial and other resourcesthan we do. In particular, many of these competitors have large sales forces and well-established distribution channelsand brand names.
Our principal competitors in the veterinary diagnostic market are Idexx Laboratories, Inc. and Heska Corporation.Idexx has a larger veterinary product and service offering than we do and a large sales infrastructure network andwell-established brand name. Consequently, we must develop our distribution channels and significantly expand ourdirect sales force in order to compete more effectively in these markets.
We would fail to achieve anticipated revenues if the market does not accept our products.
We believe that our core compact blood chemistry analyzer product differs substantially from current blood chemistryanalyzers on the market. We compete with centralized laboratories that offer a greater number of tests than ourproducts, at a lower cost, but require more time. We also compete with other point-of-care analyzers that often requiremore maintenance and offer a narrower range of tests. However, these point-of-care analyzers are generally marketedby larger companies which have greater resources for sales and marketing, in addition to a recognized brand nameand established distribution relationships.
In the human medical market, we believe that our blood chemistry analyzers offer customers many advantages,including substantial improvements in clinical efficiencies. However, the implementation of point-of-care diagnosticsin the current healthcare environment involves changes to current standard practices, such as using large clinicallaboratories, and adopting our technology requires a shift in both the procedures and mindset of care providers. Thehuman medical market in particular is highly regulated, structured and subject to government and managed care
14
Abaxis, Inc. Form 10-K
influences; accordingly, the market can be difficult to penetrate and slower to adapt to new technologies. If we or ourdistribution partner, Abbott, are unable to convince large numbers of medical clinics, hospitals and other point-of-careenvironments of the benefits of our Piccolo blood chemistry analyzers and our other products, we could fail toachieve anticipated revenue.
Historically, in the veterinary market, we have marketed our VetScan products through both direct sales anddistribution channels to veterinarians. We continue to develop new animal blood tests to expand our productofferings; however, we cannot be assured that these products will be accepted by the veterinary market. Any failureto achieve market acceptance with our current or future products would harm our business and financial condition.Moreover, we may identify new areas for serving our veterinary market customers that may not be accepted by themarket or achieve our financial goals to increase revenues and profitability at acceptable levels. For example, we soldour AVRL business in March 2015, as it failed to perform to our expectations.
We are not able to predict sales in future quarters and a number of factors affect our periodic results, which mayresult in significant variance in our quarterly results of operations and may negatively impact our stock price.
We are not able to accurately predict our sales in future quarters. Our revenues in the medical and veterinary marketsare derived primarily by selling to distributors that resell our products to the ultimate user. While we are better ableto predict sales of our reagent discs and other consumable products, as we sell these discs primarily for use with ourinstruments that we sold in prior periods, we generally are unable to predict with much certainty sales of ourinstruments, as we typically sell our instruments to new users or as an upgrade for to our existing customers, whichcan fluctuate on a quarterly basis. We generally operate with a limited order backlog, because we ship our productsshortly after we receive the orders from our customers. As a result, our product sales in any quarter are generallydependent on orders that we receive and ship in that quarter. Accordingly, our sales in any one quarter or period arenot indicative of our sales in any future period.
The sales cycle for our products can fluctuate, which may cause revenue and results of operations to vary significantlyfrom period to period. We believe this fluctuation is primarily due (i) to seasonal patterns in the decision makingprocesses by our independent distributors and direct customers, (ii) to inventory or timing considerations by ourdistributors and (iii) on the purchasing requirements of the U.S. government to acquire our products. Accordingly,we believe that period to period comparisons of our results of operations are not necessarily meaningful. In the future,our periodic results of operations may vary significantly depending on, but not limited to, a number of factors,including:
• new product or service announcements made by us or our competitors;
• changes in our pricing structures or the pricing structures of our competitors;
• the sales performance of our independent distributors;
• excess inventory levels and inventory imbalances at our independent distributors;
• our ability to develop, introduce and market new products or services on a timely basis, or at all;
• our manufacturing capacities and our ability to increase the scale of these capacities;
• the mix of sales among our instruments and consumable products;
• the amount of our research and development, sales and marketing and general and administrative expenses; and
• changes in our strategies.
As a result, it is likely that in some periods our operating results will not meet investor expectations or those of publicmarket analysts. Any unanticipated change in revenues or operating results is likely to cause our stock price tofluctuate since such changes reflect new information available to investors and analysts. Any fluctuations in ourquarterly results may not accurately reflect the underlying performance of our business and could cause a decline inthe trading price of our common stock.
A failure to manage the inventory levels of our distributors effectively could adversely affect our revenues, grossmargins and results of operations.
We must manage the inventory of our products held by our distributors effectively. Any excess or shortage ofinventory held by our distributors could affect our results of operations. Our distributors may increase orders duringperiods of product shortages and cancel or delay orders if their inventory is too high. They also may adjust their
15
Abaxis, Inc. Form 10-K
orders in response to the supply of our products, the products of our competitors that are available to them, and inresponse to seasonal fluctuations in customer demand. Revenues from sales to our distributors generally arerecognized based upon shipment of our products to the distributors, net of estimated sales allowances, discounts andrebates. Inventory management remains an area of focus as we balance inventory levels of our instruments andconsumables, especially in our United States veterinary market distribution channel, consisting of both national andregional distributors. We must also balance the need to maintain sufficient inventory levels in the distribution channelagainst the risk of inventory obsolescence because of the shelf life of our consumable products and customer demand.If we ultimately determine that we have excess inventory at our distributors or inventory imbalances in thedistribution channel, we may have to reduce our selling prices, which could result in lower gross margins. Forexample, during the second half of fiscal 2014, as compared to the same period in fiscal 2013, our revenues wereadversely impacted in the United States veterinary market by excess channel inventory and inventory imbalances andresulted to a decrease of sales orders from our largest distributors in the veterinary market. The excess channelinventory was the result of our distributors not selling our products to end customers at the same rate as they werepurchasing products from us. In addition, we only began selling through our distributors Henry Schein Animal Healthand Patterson Companies, Inc. in the third quarter of fiscal 2015 and our revenues in future quarters may be impactedby the timing of purchases of our products sold by them as these new distributors integrate our products into theirsales process. Should our efforts to monitor and manage channel inventory be unsuccessful, our business, financialcondition and results of operations are likely to be adversely affected.
We rely primarily on distributors to sell our products and we rely on sole distributor arrangements in a numberof countries. Our failure to successfully develop and maintain these relationships could adversely affect ourbusiness, financial condition and results of operations.
We sell our medical and veterinary products primarily through a limited number of distributors. As a result, we aredependent upon these distributors to sell our products and to assist us in promoting and creating a demand for ourproducts. We operate on a purchase order basis with the distributors and the distributors are under no contractualobligation to continue carrying our products. Further, many of our distributors may carry our competitors’ products,and may promote our competitors’ products over our own products.
We depend on a number of distributors in North America who distribute our VetScan products. In the United Statesveterinary market segment, we rely on our distribution network, consisting of both national distributors andindependent regional distributors. We depend on our distributors to assist us in promoting our products in theveterinary market, and accordingly, if one or more of our distributors were to stop selling our products in the future,we may experience a temporary sharp decline or delay in our sales revenues until our customers identify anotherdistributor or purchase products directly from us.
Internationally, we rely on only a few distributors for our products in both the medical and veterinary diagnosticmarkets. We currently rely on distributors that carry either our medical or veterinary products in the followingcountries: Australia, Austria, Belgium, Canada, China, Czech Republic, Denmark, France, Germany, Hong Kong,India, Indonesia, Israel, Italy, Japan, Korea, Mexico, the Netherlands, New Zealand, the Philippines, Portugal,Romania, Russia, Singapore, Spain, Sweden, Switzerland, Turkey, the United Arab Emirates, the United Kingdomand the United States. Our distributors in each of these countries are responsible for obtaining the necessary approvalsto sell our new and existing products. These distributors may not be successful in obtaining proper approvals for ournew and existing products in their respective countries, and they may not be successful in marketing our products.Furthermore, an inability of, or any delays by, our distributor in receiving the necessary approvals for our new orother products can adversely impact our revenues in a country. We plan to continue to enter into additional distributorrelationships to expand our international distribution base and presence. However, we may not be successful inentering into additional distributor relationships on favorable terms, or at all. In addition, our distributors mayterminate their relationship with us at any time. Historically, we have experienced a high degree of turnover amongour international distributors. This turnover makes it difficult for us to establish a steady distribution networkoverseas. Consequently, we may not be successful in marketing our Piccolo and VetScan products internationally, andour business and financial condition may be harmed as a result.
In the United States, we rely on Abbott as our exclusive distributor in certain medical markets to sell our products.Our dependency on Abbott means that any failure to successfully develop products and maintain this relationshipcould adversely affect our business, financial condition and results of operations.
Abbott has the exclusive right to sell and distribute our Piccolo Xpress chemistry analyzer and associatedconsumables in the United States professionally-attended human healthcare market, excluding sales and distribution
16
Abaxis, Inc. Form 10-K
to Catapult Health LLC and specified customer segments, which includes pharmacy and retail store clinics, shoppingmalls, clinical research organizations and cruise ship lines. As a result of the Abbott Agreement, we no longer havecontrol over the marketing and sale of our primary medical products into most of the U.S. medical market and aredependent upon the efforts and priorities of Abbott in promoting and creating a demand for such products in suchmarket. We do not have any control over pricing, inventory levels, distribution efforts and other factors that mayimpact the level of sales achieved, timing of revenue recognized and other adjustments that may impact our reportedsales. Moreover, we are dependent upon Abbott’s forecasts and sales efforts and maintenance of pre-existingsub-distributor agreements that were assigned to Abbott. As a result, if Abbott’s efforts are unsuccessful, our business,financial condition and results of operations are likely to be adversely affected. For example, the transition of thisU.S. medical business had an adverse effect on our revenues during fiscal 2014, with respect to lower average sellingprices of Piccolo products sold to Abbott and the timing of purchases of our products now sold by Abbott as itintegrated our products into its sales process.
In addition, as a result of the Abbott Agreement, we have substantially reduced the size of our United States medicalsales force. The initial term of the Abbott Agreement ends on December 31, 2017, and after the initial term, theagreement renews automatically for successive one-year periods unless terminated by either party based upon anotice of non-renewal six months prior to the then-current expiration date. In the event the agreement is terminated,we would be required to invest and re-establish presence and sales capabilities in markets that were served by Abbottand/or identify one or more suitable replacement distribution partner(s), which would require significant time andeffort. We could not be assured of replacing the capabilities of Abbott in those markets. New sales personnel anddistribution partners take time to train and gain full productivity with customers, and if we are unable to accomplishthis successfully, our business, financial condition and results of operations could be adversely affected.
We depend on limited or sole suppliers, many of whom we do not have long-term contracts with, and failure ofour suppliers to provide the components or products to us could harm our business.
We use several key components that are currently available from limited or sole sources as discussed below.
• Blood Chemistry Analyzer Components: Our blood analyzer products use several technologically-advancedcomponents that we currently purchase from a limited number of suppliers, including certain components fromour single source supplier, Hamamatsu Corporation. Our analyzers also use a printer that is primarily made byAdvanced Printing Systems. The loss of the supply of any of these components could force us to redesign ourblood chemistry analyzers.
• Reagent Discs: Two injection-molding manufacturers, C. Brewer Co., a division of Balda AG, and Nypro, Inc.,a subsidiary of Jabil Circuit, currently make the molded plastic discs that, when loaded with reagents and weldedtogether, form our reagent disc products. We believe that only a few manufacturers are capable of producingthese discs to the narrow tolerances that we require. To date, we have only qualified these two manufacturersto manufacture the molded plastic discs.
• Reagent Chemicals: We currently depend on the following single source vendors for some of the chemicals thatwe use to produce the reagents and dry reagent chemistry beads that are either inserted in our reagent discs,lateral flow rapid tests or sold as stand-alone products: Amano Enzyme USA Co., Ltd., Kikkoman CorporationBiochemical Division, Microgenics Corporation, a division of Thermo Fisher Scientific, Roche MolecularBiochemicals of Roche Diagnostics Corporation, a division of F. Hoffmann-La Roche, Ltd., SA Scientific Co.,Sekisui Diagnostics, Sigma Aldrich Inc. and Toyobo Specialties.
We market original equipment manufacturer supplied products that are currently available from limited sources asdiscussed below.
• Hematology Instruments and Reagent Kits: Our VetScan hematology instruments are manufactured by Diatronin Hungary and are purchased by us as a completed instrument. In addition, we currently have qualified twosuppliers to produce the reagent kits for our hematology instruments: Clinical Diagnostic Solutions, Inc. andDiatron.
• VSpro Specialty Analyzers and Cartridges: Our VetScan VSpro specialty analyzers and cartridges aremanufactured by SMB in Denmark and are purchased by us as completed products.
• i-STAT Analyzers and Cartridges: Our VetScan i-STAT analyzers and cartridges are manufactured by Abbottand are purchased by us as completed products.
17
Abaxis, Inc. Form 10-K
• Rapid Tests: Substantially all of our VetScan Rapid Tests are manufactured by a single source supplier, SAScientific Co., located in the United States.
We currently have purchase obligations with SMB to purchase VSpro specialty analyzers and related cartridges andDiatron to purchase Diatron hematology products. However, with our other suppliers, we primarily operate on apurchase order basis and, therefore, these suppliers are under no contractual obligation to supply us with theirproducts or to do so at specified prices. Although we believe that there may be potential alternate suppliers availablefor these critical components, to date we have not qualified additional vendors beyond those referenced above andcannot assure you we would be able to enter into arrangements with additional vendors on favorable terms, or at all.For the suppliers of original equipment manufactured products with which we have long-term contracts, there can beno assurance that these suppliers will always fulfill their obligations under these contracts, or that any suppliers willnot experience disruptions in their ability to supply our requirements for products. In addition, under some contractswith suppliers we have minimum purchase obligations and our failure to satisfy those obligations may result in a lossof some or all of our rights under these contracts.
Because we are dependent on a limited number of suppliers and manufacturers for our products, we are particularlysusceptible to any interruption in the supply of these products or the viability of our assembly arrangements. The lossof any one of these suppliers or a disruption in our manufacturing arrangements could adversely affect our business,financial condition and results of operations.
We must increase sales of our Piccolo and VetScan products or we may not be able to increase or sustainprofitability.
Our ability to continue to be profitable and to increase profitability will depend, in part, on our ability to increase oursales volumes of our Piccolo and VetScan products. Increasing the sales volume of our products will depend upon,among other things:
• the sales performance of our independent distributors;
• our ability to improve our existing products and develop new and innovative products;
• our ability to increase our sales and marketing activities;
• our ability to effectively manage our manufacturing activities; and
• our ability to effectively compete against current and future competitors.
We cannot assure you that we will be able to successfully increase the sales volumes of our products to increase orsustain profitability.
We must continue to increase our sales, marketing and distribution efforts in the human diagnostic market or ourbusiness will not grow.
The human diagnostic market is fragmented, heavily regulated and constantly changing. Our limited sales, marketingand distribution capabilities are continually challenged to translate these changes into compelling value propositionsfor our prospective customers. Accordingly, we cannot assure you that:
• we will be able to maintain consistent growth through Abbott and our other independent distributors;
• the costs associated with sales, marketing and distributing our products will not be excessive; or
• government regulations or private insurer policies will not adversely affect our ability to be successful.
We depend on key members of our management and scientific staff and, if we fail to retain and recruit qualifiedindividuals, our ability to execute our business strategy and generate sales would be harmed.
Our future success depends, to a great degree, on the principal members of our management and scientific staff. Theloss of any of these key personnel, including in particular Clinton H. Severson, our Chief Executive Officer andChairman of our Board of Directors, might impede the achievement of our business objectives. We may not be ableto continue to attract and retain skilled and experienced marketing, sales and manufacturing personnel on acceptableterms in the future because numerous medical products and other high technology companies compete for theservices of these qualified individuals. If we are unable to hire and train qualified personnel, we may not be able to
18
Abaxis, Inc. Form 10-K
maintain or expand our business. Additionally, if we are unable to retain key personnel, we may not be able to replacethem readily or on terms that are reasonable, which also could hurt our business. We currently do not maintain keyman life insurance on any of our employees.
We may experience manufacturing problems related to our instruments, which could adversely affect ourbusiness, financial condition or results of operations.
We manufacture our point-of-care chemistry analyzers at our manufacturing facility in Union City, California. Shouldwe experience problems related to the manufacture of our blood chemistry analyzer, we could fail to achieveanticipated revenues or we may incur an additional increase in our cost of revenues. These problems may includemanufacturing defects and product failures, defects in raw materials acquired from our suppliers, delays in receiptof raw materials from our suppliers, obsolescence, increases in raw materials costs and labor disturbances. There canbe no assurance that our efforts to resolve manufacturing difficulties will be successful or that similar problems willnot arise in the future. If we are unable to prevent such problems from occurring in the future, we may not be ableto manufacture sufficient quantities to meet anticipated demand and, therefore, will not be able to effectively marketand sell our blood chemistry analyzers or other instruments that we market and sell; accordingly, our business,financial condition and results of operations could be adversely affected.
We need to successfully manufacture and market additional reagent discs for the human diagnostic market if weare to compete in that market.
We believe that we must develop and obtain regulatory clearance and third-party payor reimbursement for additionalseries of reagent discs with various tests for use with our Piccolo chemistry analyzers if we are to successfullycompete in the human medical market. Our failure to meet these challenges will materially adversely affect ouroperating results and financial condition.
We rely on patents and other proprietary information, the loss of which would negatively affect our business.
As of March 31, 2016, 80 patent applications have been filed on our behalf with the United States Patent andTrademark Office (‘‘USPTO’’), of which 44 patents have been issued and 16 patents are currently active.Additionally, we have filed several international patent applications covering the same subject matter as our domesticapplications. The patent position of any medical device manufacturer, including us, is uncertain and may involvecomplex legal and factual issues. Consequently, we may not be issued any additional patents, either domestically orinternationally. Furthermore, our patents may not provide significant proprietary protection because there is a chancethat they will be circumvented or invalidated. We cannot be certain that we were the first creator of the inventionscovered by our issued patents or pending patent applications, or that we were the first to file patent applications forthese inventions, because (1) the USPTO maintains all patent applications that are not filed in any foreignjurisdictions in secrecy until it issues the patents (when a patent application owner files a request for nonpublication)and (2) publications of discoveries in the scientific or patent literature tend to lag behind actual discoveries by severalmonths. We may have to participate in interference proceedings, which are proceedings in front of the USPTO, todetermine who will be issued a patent. These proceedings could be costly and could be decided against us.
We also rely upon copyrights, trademarks and unpatented trade secrets. Others may independently developsubstantially equivalent proprietary information and techniques that would undermine our proprietary technologies.Further, others may gain access to our trade secrets or disclose such technology. Although we require our employees,consultants and advisors to execute agreements that require that our corporate information be kept confidential andthat any inventions by these individuals are property of Abaxis, there can be no assurance that these agreements willprovide meaningful protection or adequate remedies for our trade secrets in the event of unauthorized use ordisclosure of such information. The unauthorized dissemination of our confidential information would negativelyimpact our business.
Changes in health care regulations and third-party payor reimbursement can negatively affect our business.
By regulating the availability of, or the maximum amount of reimbursement provided for blood testing services,third-party payors, such as managed care organizations, pay-per-service insurance plans, and the Centers forMedicare and Medicaid Services (‘‘CMS’’), can indirectly affect the pricing or the relative attractiveness of ourhuman testing products. For example, in the United States, the CMS set the national level of reimbursement of feesfor blood testing services for Medicare beneficiaries. If third-party payors decrease the reimbursement amounts for
19
Abaxis, Inc. Form 10-K
blood testing services, it may decrease the likelihood that physicians and hospitals will adopt point-of-carediagnostics as a viable means of care delivery. Consequently, we would need to charge less for our products. If thegovernment and third-party payors do not provide for adequate coverage and reimbursement levels to allow healthcare providers to use our products, the demand for our products will decrease and our business and financial conditionwould be harmed.
In the United States, there have been and continue to be a number of legislative initiatives to contain healthcare costs.For example, the Patient Protection and Affordable Care Act, as amended by the Health Care and EducationReconciliation Act, collectively, PPACA, enacted in March 2010, made changes that significantly impact the medicaldevice industries and clinical laboratories. Beginning in January 2013, each medical device manufacturer has to payan excise tax in an amount equal to 2.3% of the price for which such manufacturer sells its medical devices, whichapplies to sales of taxable medical devices after December 31, 2012. In December 2015, President Obama signed intolaw the Consolidated Appropriations Act of 2016. The Consolidated Appropriations Act includes a two-yearmoratorium on the medical device excise tax such that medical device revenues in calendar years 2016 and 2017 willbe exempt from the excise tax. Unless there is further legislative action during that two-year period, the tax will beautomatically reinstated for sales of medical devices on or after January 1, 2018. PPACA also mandated a reductionin payments for clinical laboratory services paid under the Medicare Clinical Laboratory Fee Schedule, or CLFS, of1.75% for the calendar years 2011 through 2015 and a productivity adjustment to the CLFS, further reducing paymentrates. Additionally, the Middle Class Tax Relief and Job Creation Act of 2012 required that CMS reduce the CLFSby 2% in 2013, which served as a base for 2014 and subsequent years. In addition, effective January 1, 2014, CMSalso began bundling the Medicare payments for certain laboratory tests ordered while a patient received services ina hospital outpatient setting. Further, on April 1, 2014, the Protecting Access to Medicare Act of 2014, or PAMA, wassigned into law, which, among other things, significantly alters the current payment methodology under the CLFS.
Some commercial payors are guided by the CLFS in establishing their reimbursement rates. Clinicians may decidenot to order clinical diagnostic tests if third party payments are inadequate, and we cannot predict whether third-partypayors will offer adequate reimbursement for tests utilizing our products to make them commercially attractive.Changes in healthcare policy, such as the creation of test utilization limits for diagnostic products in general orrequirements that Medicare patients pay for portions of clinical laboratory tests or services received, couldsubstantially impact the sales of our tests, increase costs and divert management’s attention from our business. Weexpect that additional state and federal healthcare reform measures will be adopted in the future, any of which couldlimit the amounts that federal and state governments will pay for healthcare products and services, which could resultin reduced demand or additional pricing pressures. In addition, sales of our tests outside of the United States willsubject us to foreign regulatory requirements, which may also change over time.
We may be subject, directly or indirectly, to federal and state healthcare fraud and abuse laws and other federaland state laws applicable to our sales and marketing practices. If we are unable to comply, or have not complied,with such laws, we could face substantial penalties.
Our operations are directly, or indirectly through our customers, subject to various federal and state fraud and abuselaws, including, without limitation, the federal and state anti-kickback statutes, physician payment transparency lawsand false claims laws. These laws may impact, among other things, our sales and marketing and education programsand require us to implement additional internal systems for tracking certain marketing expenditures and reportingthem to government authorities. In addition, we may be subject to patient privacy regulation by both the federalgovernment and the states in which we conduct our business. If our operations are found to be in violation of anyof these laws or any other governmental regulations that apply to us, we may be subject to penalties, withoutlimitation, including civil and criminal penalties, damages, fines, disgorgement, the curtailment or restructuring ofour operations, exclusion from participation in federal and state healthcare programs and imprisonment, any of whichcould adversely affect our ability to operate our business and our results of operations.
Approval and/or clearance by the FDA, USDA and foreign regulatory authorities for our products requiressignificant time and expenditures.
Before we may commercialize our human medical diagnostic products in the United States, we are required to obtaineither 510(k) clearance or pre-marketing approval (‘‘PMA’’) from the FDA, unless an exemption from pre-marketreview applies. In our veterinary market, certain products that we sell are subject to regulations pertaining to
20
Abaxis, Inc. Form 10-K
veterinary biologics, for which we must obtain approval from the USDA’s Center for Veterinary Biologics. Theprocess of obtaining regulatory clearances or approvals to market a medical device can be costly and time consuming,and we may not be able to successfully obtain 510(k) clearance from the FDA or may be subject to the more costlyand time-consuming PMA process.
In addition, governmental agencies may change their clearance or approval policies, adopt additional regulations orrevise existing regulations, or take other actions which may prevent or delay approval or clearance of our productsunder development or impact our ability to modify our currently approved or cleared products on a timely basis. Anydelay in, or failure to receive or maintain, clearance or approval for our products could prevent us from generatingrevenue from these products and adversely affect our business operations and financial results.
The FDA and other regulatory authorities have broad enforcement powers. For example, the manufacture of medicaldevices must comply with the FDA’s Quality System Regulation (‘‘QSR’’). In addition, manufacturers must registertheir manufacturing facilities, list the products with the FDA, and comply with requirements relating to labeling,marketing, complaint handling, adverse event and medical device reporting, reporting of corrections and removals,and import and export. The FDA monitors compliance with the QSR and these other requirements through periodicinspections. If our facilities or those of our manufacturers or suppliers are found to be in violation of applicable lawsand regulations, or if we or our manufacturers or suppliers fail to take satisfactory corrective action in response toan adverse inspection, the regulatory authority could take enforcement actions that could impair our ability to produceour products in a cost-effective and timely manner in order to meet our customers’ demands, and could have amaterial adverse effect on our reputation, business, results of operations and financial condition. We may also berequired to bear other costs or take other actions that may have a negative impact on our future sales and our abilityto generate profits.
Sales of our products outside the United States are subject to foreign regulatory requirements governing vigilancereporting, marketing approval, manufacturing, product licensing, pricing and reimbursement. These regulatoryrequirements vary greatly from country to country. As a result, the time required to obtain approvals outside theUnited States may differ from that required to obtain FDA clearance or USDA approval, and we may not be able toobtain foreign regulatory approvals on a timely basis or at all. Clearance or approval by the FDA does not ensureapproval by regulatory authorities in other countries, and approval by one foreign regulatory authority does notensure clearance or approval by regulatory authorities in other countries or by the FDA.
A recall of our products, or the discovery of serious safety issues with our products that leads to corrective actions,could have a significant adverse impact on our business, financial condition or results of operations.
The FDA, USDA and similar foreign governmental authorities have the authority to require the recall ofcommercialized products in the event of material deficiencies or defects in design or manufacture of a product or inthe event that a product poses an unacceptable risk to health. Manufacturers may, under their own initiative, recalla product if any material deficiency in a device is found. A government-mandated or voluntary recall by us or oneof our distributors could occur as a result of component failures, manufacturing errors, design or labeling defects orother deficiencies and issues. We are required to report to the FDA any incident in which our product may havecaused or contributed to a death or serious injury or in which our product malfunctioned and, if the malfunction wereto recur, would likely cause or contribute to death or serious injury. Repeated product malfunctions may result in avoluntary or involuntary product recall. Recalls of any of our products would divert managerial and financialresources and could impair our ability to produce our products in a cost-effective and timely manner in order to meetour customers’ demands, any of which could have an adverse effect on our business, financial condition and resultsof operations. Moreover, if we do not adequately address problems associated with our devices, we may faceadditional regulatory enforcement action, including FDA warning letters, product seizure, injunctions, administrativepenalties, or civil or criminal fines. We may also be required to bear other costs or take other actions that may havea negative impact on our sales as well as face significant adverse publicity or regulatory consequences, which couldharm our business, financial condition or results of operations.
We may inadvertently design or produce defective products, which may subject us to significant warranty liabilitiesor product liability claims. We may have insufficient product liability insurance to pay uninsured claims.
Our business exposes us to potential warranty and product liability risks that are inherent in the design, testing,manufacturing and marketing of human and veterinary medical products. Although we have established proceduresfor quality control on both the raw materials that we receive from suppliers as well as the design and manufacturing
21
Abaxis, Inc. Form 10-K
of our products, these procedures may prove inadequate to detect a design or manufacturing defect. In addition, ourPiccolo and VetScan chemistry analyzers may be unable to detect all errors that could result in the misdiagnosis ofhuman or veterinary patients.
We may be subject to substantial claims for defective products under our warranty policy or product liability laws.In addition, our policy is to credit medical providers for any defective product that we produce, including thosereagent discs that are rejected by our Piccolo and VetScan chemistry analyzers. Therefore, even if a mass defectwithin a lot or lots of reagent discs were detected by our Piccolo and VetScan chemistry analyzers, the replacementof such reagent discs free of charge would be costly and could adversely affect our business, financial condition andresults of operations. Further, in the event that a product defect is not detected in our Piccolo chemistry analyzer, ourexpansion into the human medical market greatly increases the risk that the amount of damages involved with justone product defect would adversely impact our business, financial condition and results of operations. Our productliability insurance and cash may be insufficient to cover potential liabilities. In addition, in the future the coveragethat we require may be unavailable on commercially reasonable terms, if at all. Even with our current insurancecoverage, a mass product defect, product liability claim or recall could subject us to claims above the amount of ourcoverage and could adversely affect our business, our financial condition or results of operations.
Acquisitions, strategic investments, partnerships, or alliances could be difficult to identify and integrate, divert theattention of management, disrupt our business, dilute shareholder value, and adversely affect our business,financial condition or results of operations.
We have in the past and may in the future seek to acquire or invest in businesses, products, or technologies that webelieve could complement or expand our products, enhance our capabilities, or otherwise offer growth opportunities.For example, we acquired Quality Clinical Reagents Limited (‘‘QCR’’) and Trio Diagnostics (Ireland) Ltd (‘‘Trio’’)in November 2014. Any acquisition may divert the attention of management and cause us to incur various expensesin identifying, investigating, and pursuing suitable acquisitions, whether or not the acquisitions are completed, andmay result in unforeseen operating difficulties and expenditures. In particular, we may encounter difficultiesassimilating or integrating the businesses, technologies, products, personnel, or operations of the acquired companies,particularly if the key personnel of the acquired company choose not to work for us, their products are not easilyadapted to work with ours, or we have difficulty retaining the customers of any acquired business due to changes inownership, management, or otherwise. Acquisitions may also disrupt our business, divert our resources, and requiresignificant management attention that would otherwise be available for development of our existing business. Anyacquisitions we are able to complete may not result in any synergies or other benefits we had expected to achieve,which could result in impairment charges that could be substantial. In addition, we may not be able to find andidentify desirable acquisition targets or be successful in entering into an agreement with any particular target.Acquisitions could also result in dilutive issuances of equity securities or the incurrence of debt, which couldadversely affect our financial condition or results of operations. In addition, if an acquired business, including QCRor Trio, fails to meet our expectations, our business, financial condition or results of operations may suffer or we maybe exposed to risks or liabilities that were unknown to us at the time of the acquisition.
Divestitures or other dispositions could negatively impact our business.
On an ongoing basis, we assess opportunities for improved operational effectiveness and efficiency and may divest,spin-off, split-off, or otherwise dispose of businesses that are deemed not to fit with our strategic plan or are notachieving the desired return on investment. For example, we sold our AVRL business to Antech in March 2015. Thesetransactions pose risks and challenges that could negatively impact our business. For example, when we decide tosell or otherwise dispose of a business or assets, the sale is typically subject to satisfaction of pre-closing conditionsthat may not become satisfied. In addition, divestitures or other dispositions may dilute our earnings per share, haveother adverse financial and accounting impacts, distract management, disrupt our business, negatively impact marketperception of our prospects and involve the loss of key employees, and disputes may arise with buyers. In addition,we may retain responsibility for or agree to indemnify buyers against contingent liabilities, which could have amaterial effect on our financial statements. Divestitures may also result in significant asset impairment charges,including those related to goodwill and other intangible assets, which could have a material adverse effect on ourfinancial condition and results of operations. We cannot assure you that divestiture or other disposition efforts willbe successful in generating improved operating efficiencies. In addition, past disposition activities may not be a goodindication of future disposition opportunities, and any divestiture or other disposition of any business may leave uswith reduced financial and marketing resources to develop products and services to compete against our competitors.
22
Abaxis, Inc. Form 10-K
We may be subject to litigation for a variety of claims, which could adversely affect our business, financialcondition or results of operations.
In addition to product liability claims, we and our directors and officers may be subject to claims arising from ournormal business activities. These may include claims, suits, and proceedings involving shareholder and fiduciarymatters, intellectual property, labor and employment, wage and hour, commercial and other matters. For example, inOctober 2012, the St. Louis Police Retirement System, a purported shareholder of Abaxis, filed a lawsuit againstcertain officers and each of the directors of the Company in the United States District Court for the Northern Districtof California alleging, among other things, that the directors violated Section 14(a) of the Securities Exchange Actof 1934 and breached their fiduciary duties by allegedly failing to disclose material information in our 2010 proxystatement, breached their fiduciary duties by allegedly violating the terms of our 2005 Equity Incentive Plan, andbreached their fiduciary duties by failing to disclose alleged material information in our 2012 proxy statementregarding (1) the events leading up to our proposal to amend the 2005 Equity Incentive Plan to eliminate the limiton the number of shares that may be issued pursuant to restricted stock units, and (2) the effects of the proposedamendment on certain settled and outstanding restricted stock units. On August 12, 2014, the Court issued a finaljudgment order, among other things, approving a settlement of the lawsuit, pursuant to which (a) the parties haveagreed that the claims against the defendants will be dismissed with prejudice and will be granted the release ofcertain known or unknown claims that have been or could have been brought later in the court arising out of the sameallegations, (b) we have agreed that we will adopt certain corporate governance measures, such measures to be ineffect for at least five years and (c) the court awarded $579,430 in attorney’s fees and costs to plaintiff’s counsel,which was paid by our insurance. The outcome of any litigation, regardless of its merits, is inherently uncertain. Anyclaims and lawsuits, and the disposition of such claims and lawsuits, could be time-consuming and expensive toresolve, divert management attention and resources, and lead to attempts on the part of other parties to pursue similarclaims. Any adverse determination related to litigation or settlement or other resolution of a legal matter couldadversely affect our business, financial condition or results of operations, harm our reputation or otherwise negativelyimpact our business.
Our stock price is highly volatile and investing in our stock involves a high degree of risk, which could result insubstantial losses for investors.
The market price of our common stock, like the securities of many other medical products companies, fluctuates overa wide range, and will continue to be highly volatile in the future. During the quarter ended March 31, 2016, theclosing sale prices of our common stock on the NASDAQ Global Select Market ranged from $38.65 to $55.02 pershare and the closing sale price on March 31, 2016, was $45.39 per share. During the last eight fiscal quarters endedMarch 31, 2016, our stock price closed at a high of $66.54 per share on March 30, 2015 and a low of $37.95 per shareon April 4, 2014. Many factors may affect the market price of our common stock, including:
• fluctuation in our operating results;
• announcements of technological innovations or new commercial products by us or our competitors;
• changes in governmental regulation in the United States and internationally;
• prospects and proposals for health care reform;
• governmental or third-party payors’ controls on prices that our customers may pay for our products;
• developments or disputes concerning our patents or our other proprietary rights;
• product liability claims and public concern as to the safety of our devices or similar devices developed by ourcompetitors; and
• general market conditions.
In the past, stockholders have filed securities class action litigation following periods of market volatility. If we wereto become involved in such securities litigation, it could subject us to substantial costs, divert resources and theattention of management from our business, and adversely affect our business, financial condition or results ofoperations. Because our stock price is so volatile, investing in our common stock is highly risky. A potential investormust be able to withstand the loss of his entire investment in our common stock.
23
Abaxis, Inc. Form 10-K
Fluctuations in foreign exchange rates could adversely affect our business, financial condition or results ofoperations.
For our international sales denominated in U.S. dollars, an increase in the value of the U.S. dollar relative to foreigncurrencies could make our products less competitive in international markets. For our sales denominated in foreigncurrencies, we are subject to fluctuations in exchange rates between the U.S. dollar and the particular foreign currencyand changes in such exchange rates could adversely affect our reported results of operations and distort period toperiod comparisons. Our business, financial condition or results of operations could also be adversely affected by theseasonality of international sales and the economic conditions of our overseas markets.
Our subsidiaries in Europe and the United Kingdom increase our exposure to foreign currency fluctuation risks.These risks include uncertainty regarding the Euro and the British pound sterling, that could adversely impact ourresults of operations based on the movements of the applicable foreign currency exchange rates in relation to the U.S.dollar. Fluctuating exchange rates cause the value of items on both the assets and liabilities side of the balance sheetto change, which could also negatively impact our results of operations. Our financial results will therefore besensitive to movements in foreign exchange rates. A depreciation of non-U.S. dollar currencies relative to the U.S.dollar could have a material adverse impact on our results of operations and could cause our results of operations todiffer from our expectations and the expectations of our investors. Additionally, such foreign currency exchange ratefluctuations could make it more difficult to detect underlying trends in our business and results of operations. We donot currently engage in hedging transactions to mitigate foreign currency exchange risks.
We are dependent on information technology systems, infrastructure and data.
We are dependent upon information technology systems, infrastructure and data. We operate and manage our businessby relying on several information systems to maintain financial records, process customer orders, manage inventory,process shipments to customers and operate other critical functions. Information technology system failures, networkdisruptions and breaches of data security could disrupt our operations. If we were to experience a system disruptionin the information technology systems that enable us to interact with customers and suppliers, it could result in theloss of sales and customers, delays or cancellation of orders, impeding the manufacture or shipment of products,processing transactions and reporting financial results and significant incremental costs.
The multitude and complexity of our computer systems make them inherently vulnerable to service interruption ordestruction, malicious intrusion and random attack. Likewise, data privacy or security breaches by employees orothers may pose a risk that sensitive data, including our intellectual property, trade secrets or personal informationof our employees, customers or other business partners and any patient information may be exposed to unauthorizedpersons or to the public. Cyberattacks are increasing in their frequency, sophistication and intensity. Cyberattackscould include the deployment of harmful malware, denial-of-service, social engineering and other means to affectservice reliability and threaten data confidentiality, integrity and availability. Our business partners face similar risksand any security breach of their systems could adversely affect our security posture.
Management has taken steps to address these concerns by implementing network security and internal controlmeasures. While we have invested, and continue to invest, in the protection of our data and information technologyinfrastructure, there can be no assurance that our efforts will prevent service interruptions, or identify breaches in oursystems, that could adversely affect our business and operations and/or result in the loss of critical or sensitiveinformation, which could result in financial, legal, business or reputational harm to us. In addition, our liabilityinsurance may not be sufficient in type or amount to cover us against claims related to security breaches, cyberattacksand other related breaches.
We are subject to complex requirements from legislation requiring companies to evaluate internal control overfinancial reporting.
Rules adopted by the Securities and Exchange Commission pursuant to Section 404 of the Sarbanes-Oxley Act of2002 require an assessment of internal control over financial reporting by our management and an attestation of theeffectiveness of our internal control over financial reporting by an independent registered public accounting firm. Wehave an ongoing program to perform the assessment, testing and evaluation to comply with these requirements andwe expect to continue to incur significant expenses for Section 404 compliance on an ongoing basis.
We cannot predict the outcome of our testing in future periods. In the event that our internal control over financialreporting is not effective as defined under Section 404, or any failure to implement required new or improved
24
Abaxis, Inc. Form 10-K
controls, or difficulties encountered in implementation could harm results of operations or prevent us from accuratelyreporting financial results or cause a failure to meet our reporting obligations in the future. If management cannotassess internal control over financial reporting is effective, or our independent registered public accounting firm isunable to provide an unqualified attestation report on such assessment, investor confidence and our share value maybe negatively impacted.
Regulations related to conflict minerals could adversely impact our business, financial condition or results ofoperations.
The Dodd-Frank Wall Street Reform and Consumer Protection Act contains provisions to improve transparency andaccountability concerning the supply of tin, tantalum, tungsten and gold, known as conflict minerals, originating fromthe Democratic Republic of Congo, (‘‘ the DRC’’), and adjoining countries. As a result, in August 2012 the SECadopted annual disclosure and reporting requirements for public companies that use conflict minerals mined from theDRC and adjoining countries in their products. We have determined that we use at least one of these conflict mineralsin the manufacture of our products, although we have been unable to determine the source of the conflict mineralsthat we use. These disclosure requirements require us to use diligent efforts to determine which conflict minerals weuse and the source of those conflict minerals, and disclose the results of our findings annually. There are and will becosts associated with complying with these disclosure requirements, including those costs incurred in conductingdiligent efforts to determine which conflict minerals we use and the sources of conflict minerals used in our products.Further, the implementation of these rules could adversely affect the sourcing, supply and pricing of materials usedin our products. As there may be only a limited number of suppliers offering conflict free conflict minerals, we cannotbe sure that we will be able to obtain necessary conflict free conflict minerals in sufficient quantities or at competitiveprices. In addition, we may face reputational challenges if we determine that our products contain minerals notdetermined to be conflict free or if we are unable to sufficiently verify the origins for all conflict minerals used inour products through the procedures we may implement. If we determine to redesign our products to not use conflictminerals, our business, financial condition and results of operations could be adversely affected.
We must comply with strict and potentially costly environmental regulations or we could pay significant fines.
We are subject to stringent federal, state and local laws, rules, regulations and policies that govern the use, generation,manufacture, storage, air emission, effluent discharge, handling and disposal of certain materials and wastes. Inparticular, we are subject to laws, rules and regulations governing the handling and disposal of biohazardous materialsused in the development and testing of our products. Our costs to comply with applicable environmental regulationsconsist primarily of handling and disposing of human and veterinary blood samples for testing (whole blood, plasmaand serum). Although we believe that we have complied with applicable laws and regulations in all material respectsand have not been required to take any action to correct any noncompliance, we may have to incur significant coststo comply with environmental regulations if our manufacturing to commercial levels continues to increase. Inaddition, if a government agency determines that we have not complied with these laws, rules and regulations, wemay have to pay significant fines and/or take remedial action that would be expensive and we do not carryenvironmental-related insurance coverage.
We are subject to taxation in multiple jurisdictions. Our financial condition and results of operations could beadversely affected by unanticipated changes in our tax provisions or exposure to additional income tax liabilities.
We are subject to taxation in, and to the tax laws and regulations of, multiple jurisdictions as a result of theinternational scope of our operations and our corporate and financing structure. We are also subject to transfer pricinglaws with respect to our intercompany transactions, including those relating to the flow of funds among ourcompanies. Adverse developments in these laws or regulations, or any change in position regarding the application,administration or interpretation thereof, in any applicable jurisdiction, could have a material adverse effect on ourbusiness, consolidated financial condition or results of our operations. Our determination of our tax liability is subjectto review by tax authorities in any applicable jurisdiction, including the United States, who may disagree with thepositions we have taken or intend to take regarding the tax treatment or characterization of any of our transactions.Any adverse outcome of such a review could have an adverse effect on our results of operations and financialcondition. In addition, the determination of our provision for income taxes and other tax liabilities requires significantjudgment including our determination of whether a valuation allowance against deferred tax assets is required. Ourultimate tax liability may differ from the amounts recorded in our condensed consolidated financial statements andmay adversely affect our financial condition and results of operations.
25
Abaxis, Inc. Form 10-K
Our ability to issue preferred stock may delay or prevent a change of control of Abaxis.
Our board of directors has the authority to issue up to 5,000,000 shares of preferred stock and to determine the price,rights, preferences, privileges and restrictions, including voting rights, of those shares without any further vote oraction by the shareholders, except to the extent required by NASDAQ rules. The issuance of preferred stock, whileproviding flexibility in connection with possible financings or acquisitions or other corporate purposes, could havethe effect of making it more difficult for a third party to acquire a majority of our outstanding voting stock and,consequently, negatively affect our stock price.
Item 1B. Unresolved Staff Comments
Not applicable.
Item 2. Properties
We are headquartered in Union City, California, where we lease approximately 158,378 square feet of office, researchand development and manufacturing space, pursuant to a lease expiring in March 2026, with two options to extendthe term for an additional five years each.
Additionally, our facilities include the following:
• In Union City, California, we lease approximately 38,856 square feet of warehousing space expiring in fiscal2017.
• In Germany, we lease approximately 32,722 square feet of office and warehousing space expiring in fiscal 2025.
• In the United Kingdom, we own approximately 2,600 square feet of office and warehousing space and we leaseapproximately 4,300 square feet of office and warehousing space expiring in fiscal 2026.
We believe that our existing facilities are adequate to meet our current requirements, and that we will be able to obtainadditional facilities space on commercially reasonable terms, if and when they are required.
Item 3. Legal Proceedings
We are not currently party to any material pending legal proceedings. We are involved from time to time in variouslitigation matters in the normal course of business. There can be no assurance that existing or future legal proceedingsarising in the ordinary course of business or otherwise will not have a material adverse effect on our business,consolidated financial position, results of operations or cash flows.
Item 4. Mine Safety Disclosures
Not applicable.
26
Abaxis, Inc. Form 10-K
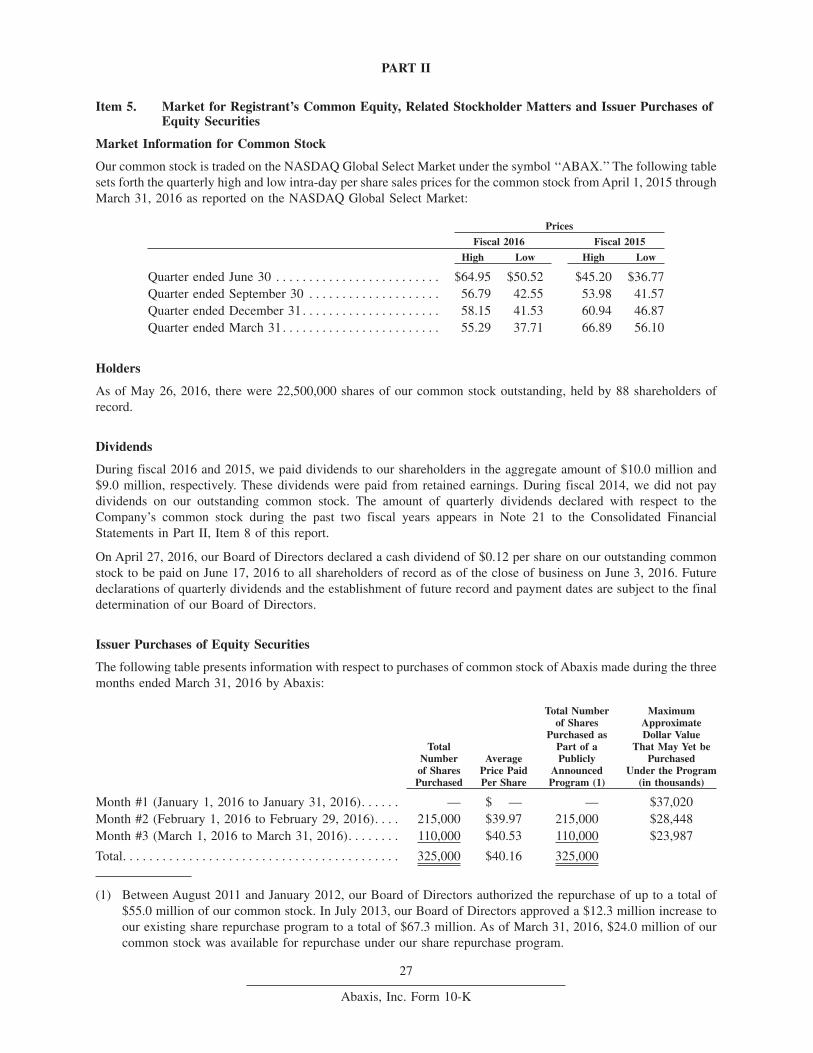
PART II
Item 5. Market for Registrant’s Common Equity, Related Stockholder Matters and Issuer Purchases ofEquity Securities
Market Information for Common Stock
Our common stock is traded on the NASDAQ Global Select Market under the symbol ‘‘ABAX.’’ The following tablesets forth the quarterly high and low intra-day per share sales prices for the common stock from April 1, 2015 throughMarch 31, 2016 as reported on the NASDAQ Global Select Market:
Prices
Fiscal 2016 Fiscal 2015
High Low High Low
Quarter ended June 30 . . . . . . . . . . . . . . . . . . . . . . . . . $64.95 $50.52 $45.20 $36.77Quarter ended September 30 . . . . . . . . . . . . . . . . . . . . 56.79 42.55 53.98 41.57Quarter ended December 31. . . . . . . . . . . . . . . . . . . . . 58.15 41.53 60.94 46.87Quarter ended March 31. . . . . . . . . . . . . . . . . . . . . . . . 55.29 37.71 66.89 56.10
Holders
As of May 26, 2016, there were 22,500,000 shares of our common stock outstanding, held by 88 shareholders ofrecord.
Dividends
During fiscal 2016 and 2015, we paid dividends to our shareholders in the aggregate amount of $10.0 million and$9.0 million, respectively. These dividends were paid from retained earnings. During fiscal 2014, we did not paydividends on our outstanding common stock. The amount of quarterly dividends declared with respect to theCompany’s common stock during the past two fiscal years appears in Note 21 to the Consolidated FinancialStatements in Part II, Item 8 of this report.
On April 27, 2016, our Board of Directors declared a cash dividend of $0.12 per share on our outstanding commonstock to be paid on June 17, 2016 to all shareholders of record as of the close of business on June 3, 2016. Futuredeclarations of quarterly dividends and the establishment of future record and payment dates are subject to the finaldetermination of our Board of Directors.
Issuer Purchases of Equity Securities
The following table presents information with respect to purchases of common stock of Abaxis made during the threemonths ended March 31, 2016 by Abaxis:
TotalNumberof SharesPurchased
AveragePrice PaidPer Share
Total Numberof Shares
Purchased asPart of aPublicly
AnnouncedProgram (1)
MaximumApproximateDollar Value
That May Yet bePurchased
Under the Program(in thousands)
Month #1 (January 1, 2016 to January 31, 2016). . . . . . — $ — — $37,020Month #2 (February 1, 2016 to February 29, 2016). . . . 215,000 $39.97 215,000 $28,448Month #3 (March 1, 2016 to March 31, 2016). . . . . . . . 110,000 $40.53 110,000 $23,987
Total. . . . . . . . . . . . . . . . . . . . . . . . . . . . . . . . . . . . . . . . . . 325,000 $40.16 325,000
(1) Between August 2011 and January 2012, our Board of Directors authorized the repurchase of up to a total of$55.0 million of our common stock. In July 2013, our Board of Directors approved a $12.3 million increase toour existing share repurchase program to a total of $67.3 million. As of March 31, 2016, $24.0 million of ourcommon stock was available for repurchase under our share repurchase program.
27
Abaxis, Inc. Form 10-K
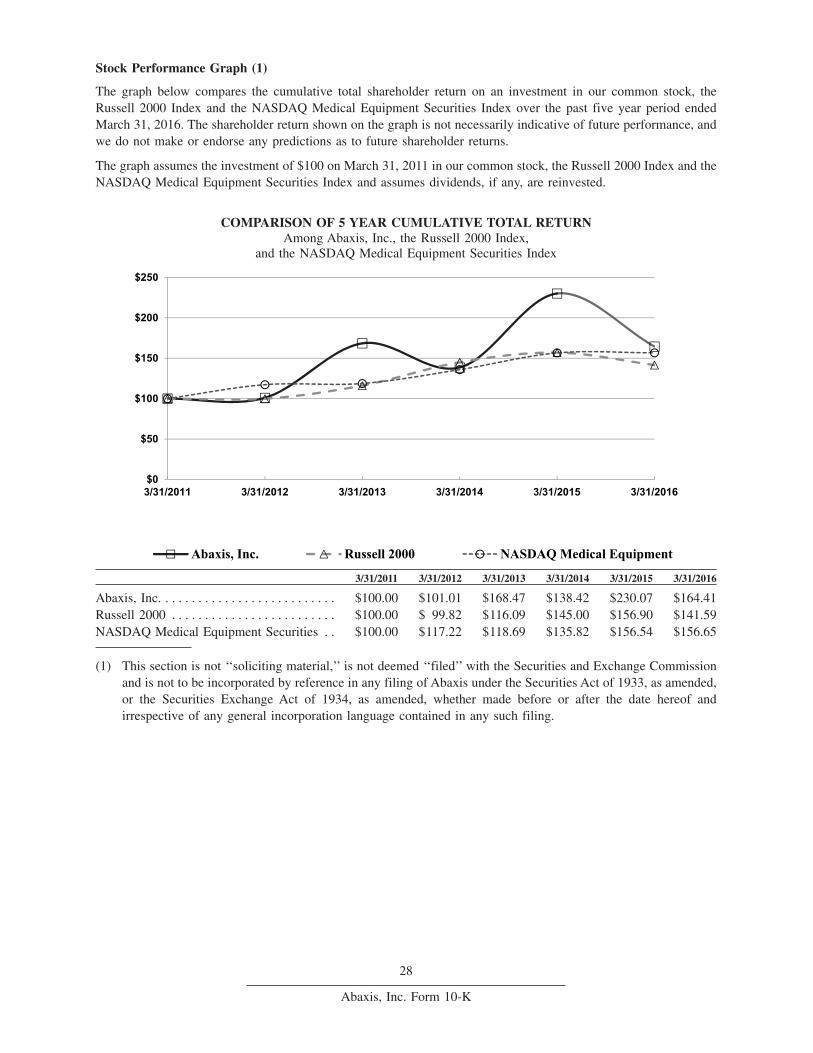
Stock Performance Graph (1)
The graph below compares the cumulative total shareholder return on an investment in our common stock, theRussell 2000 Index and the NASDAQ Medical Equipment Securities Index over the past five year period endedMarch 31, 2016. The shareholder return shown on the graph is not necessarily indicative of future performance, andwe do not make or endorse any predictions as to future shareholder returns.
The graph assumes the investment of $100 on March 31, 2011 in our common stock, the Russell 2000 Index and theNASDAQ Medical Equipment Securities Index and assumes dividends, if any, are reinvested.
COMPARISON OF 5 YEAR CUMULATIVE TOTAL RETURNAmong Abaxis, Inc., the Russell 2000 Index,
and the NASDAQ Medical Equipment Securities Index
$0
$50
$100
$150
$200
$250
3/31/2011 3/31/2012 3/31/2013 3/31/2014 3/31/2015 3/31/2016
Abaxis, Inc. Russell 2000 NASDAQ Medical Equipment
3/31/2011 3/31/2012 3/31/2013 3/31/2014 3/31/2015 3/31/2016
Abaxis, Inc. . . . . . . . . . . . . . . . . . . . . . . . . . . $100.00 $101.01 $168.47 $138.42 $230.07 $164.41Russell 2000 . . . . . . . . . . . . . . . . . . . . . . . . . $100.00 $ 99.82 $116.09 $145.00 $156.90 $141.59NASDAQ Medical Equipment Securities . . $100.00 $117.22 $118.69 $135.82 $156.54 $156.65
(1) This section is not ‘‘soliciting material,’’ is not deemed ‘‘filed’’ with the Securities and Exchange Commissionand is not to be incorporated by reference in any filing of Abaxis under the Securities Act of 1933, as amended,or the Securities Exchange Act of 1934, as amended, whether made before or after the date hereof andirrespective of any general incorporation language contained in any such filing.
28
Abaxis, Inc. Form 10-K
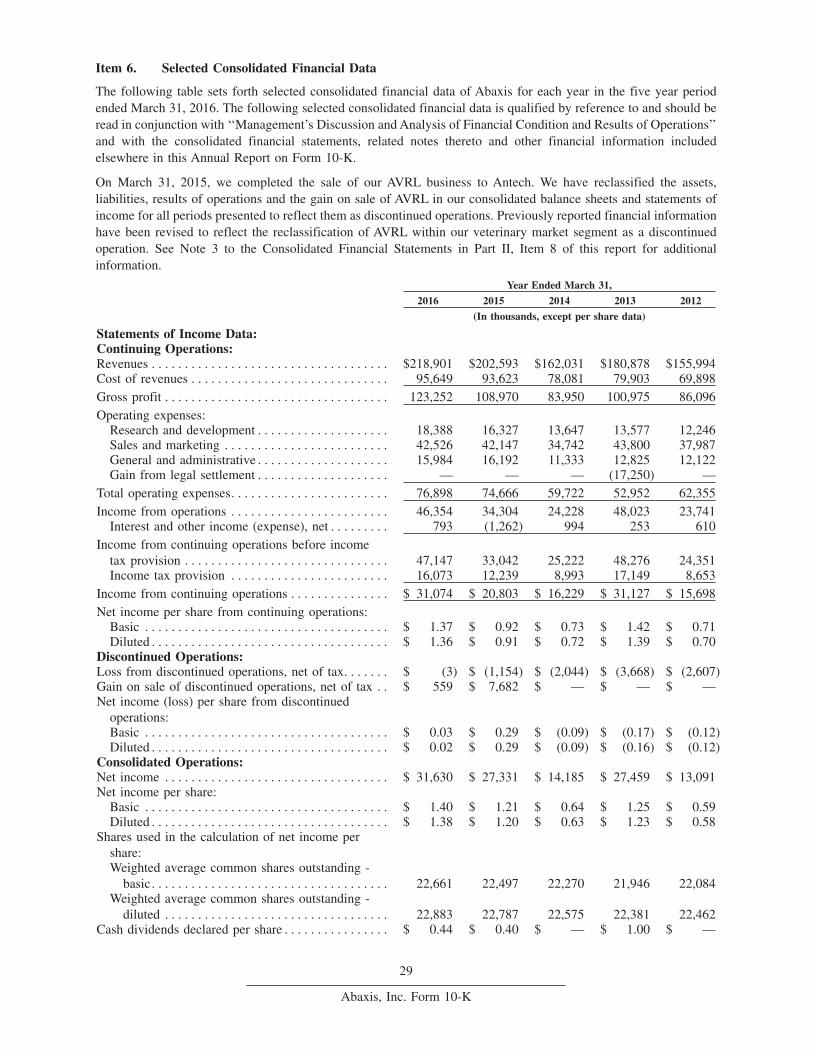
Item 6. Selected Consolidated Financial Data
The following table sets forth selected consolidated financial data of Abaxis for each year in the five year periodended March 31, 2016. The following selected consolidated financial data is qualified by reference to and should beread in conjunction with ‘‘Management’s Discussion and Analysis of Financial Condition and Results of Operations’’and with the consolidated financial statements, related notes thereto and other financial information includedelsewhere in this Annual Report on Form 10-K.
On March 31, 2015, we completed the sale of our AVRL business to Antech. We have reclassified the assets,liabilities, results of operations and the gain on sale of AVRL in our consolidated balance sheets and statements ofincome for all periods presented to reflect them as discontinued operations. Previously reported financial informationhave been revised to reflect the reclassification of AVRL within our veterinary market segment as a discontinuedoperation. See Note 3 to the Consolidated Financial Statements in Part II, Item 8 of this report for additionalinformation.
Year Ended March 31,
2016 2015 2014 2013 2012
(In thousands, except per share data)
Statements of Income Data:Continuing Operations:Revenues . . . . . . . . . . . . . . . . . . . . . . . . . . . . . . . . . . . . $218,901 $202,593 $162,031 $180,878 $155,994Cost of revenues . . . . . . . . . . . . . . . . . . . . . . . . . . . . . . 95,649 93,623 78,081 79,903 69,898Gross profit . . . . . . . . . . . . . . . . . . . . . . . . . . . . . . . . . . 123,252 108,970 83,950 100,975 86,096Operating expenses:
Research and development . . . . . . . . . . . . . . . . . . . . 18,388 16,327 13,647 13,577 12,246Sales and marketing . . . . . . . . . . . . . . . . . . . . . . . . . 42,526 42,147 34,742 43,800 37,987General and administrative . . . . . . . . . . . . . . . . . . . . 15,984 16,192 11,333 12,825 12,122Gain from legal settlement . . . . . . . . . . . . . . . . . . . . — — — (17,250) —
Total operating expenses. . . . . . . . . . . . . . . . . . . . . . . . 76,898 74,666 59,722 52,952 62,355Income from operations . . . . . . . . . . . . . . . . . . . . . . . . 46,354 34,304 24,228 48,023 23,741
Interest and other income (expense), net . . . . . . . . . 793 (1,262) 994 253 610Income from continuing operations before income
tax provision . . . . . . . . . . . . . . . . . . . . . . . . . . . . . . . 47,147 33,042 25,222 48,276 24,351Income tax provision . . . . . . . . . . . . . . . . . . . . . . . . 16,073 12,239 8,993 17,149 8,653
Income from continuing operations . . . . . . . . . . . . . . . $ 31,074 $ 20,803 $ 16,229 $ 31,127 $ 15,698Net income per share from continuing operations:
Basic . . . . . . . . . . . . . . . . . . . . . . . . . . . . . . . . . . . . . $ 1.37 $ 0.92 $ 0.73 $ 1.42 $ 0.71Diluted . . . . . . . . . . . . . . . . . . . . . . . . . . . . . . . . . . . . $ 1.36 $ 0.91 $ 0.72 $ 1.39 $ 0.70
Discontinued Operations:Loss from discontinued operations, net of tax. . . . . . . $ (3) $ (1,154) $ (2,044) $ (3,668) $ (2,607)Gain on sale of discontinued operations, net of tax . . $ 559 $ 7,682 $ — $ — $ —Net income (loss) per share from discontinued
operations:Basic . . . . . . . . . . . . . . . . . . . . . . . . . . . . . . . . . . . . . $ 0.03 $ 0.29 $ (0.09) $ (0.17) $ (0.12)Diluted . . . . . . . . . . . . . . . . . . . . . . . . . . . . . . . . . . . . $ 0.02 $ 0.29 $ (0.09) $ (0.16) $ (0.12)
Consolidated Operations:Net income . . . . . . . . . . . . . . . . . . . . . . . . . . . . . . . . . . $ 31,630 $ 27,331 $ 14,185 $ 27,459 $ 13,091Net income per share:
Basic . . . . . . . . . . . . . . . . . . . . . . . . . . . . . . . . . . . . . $ 1.40 $ 1.21 $ 0.64 $ 1.25 $ 0.59Diluted . . . . . . . . . . . . . . . . . . . . . . . . . . . . . . . . . . . . $ 1.38 $ 1.20 $ 0.63 $ 1.23 $ 0.58
Shares used in the calculation of net income pershare:Weighted average common shares outstanding -
basic. . . . . . . . . . . . . . . . . . . . . . . . . . . . . . . . . . . . 22,661 22,497 22,270 21,946 22,084Weighted average common shares outstanding -
diluted . . . . . . . . . . . . . . . . . . . . . . . . . . . . . . . . . . 22,883 22,787 22,575 22,381 22,462Cash dividends declared per share . . . . . . . . . . . . . . . . $ 0.44 $ 0.40 $ — $ 1.00 $ —
29
Abaxis, Inc. Form 10-K
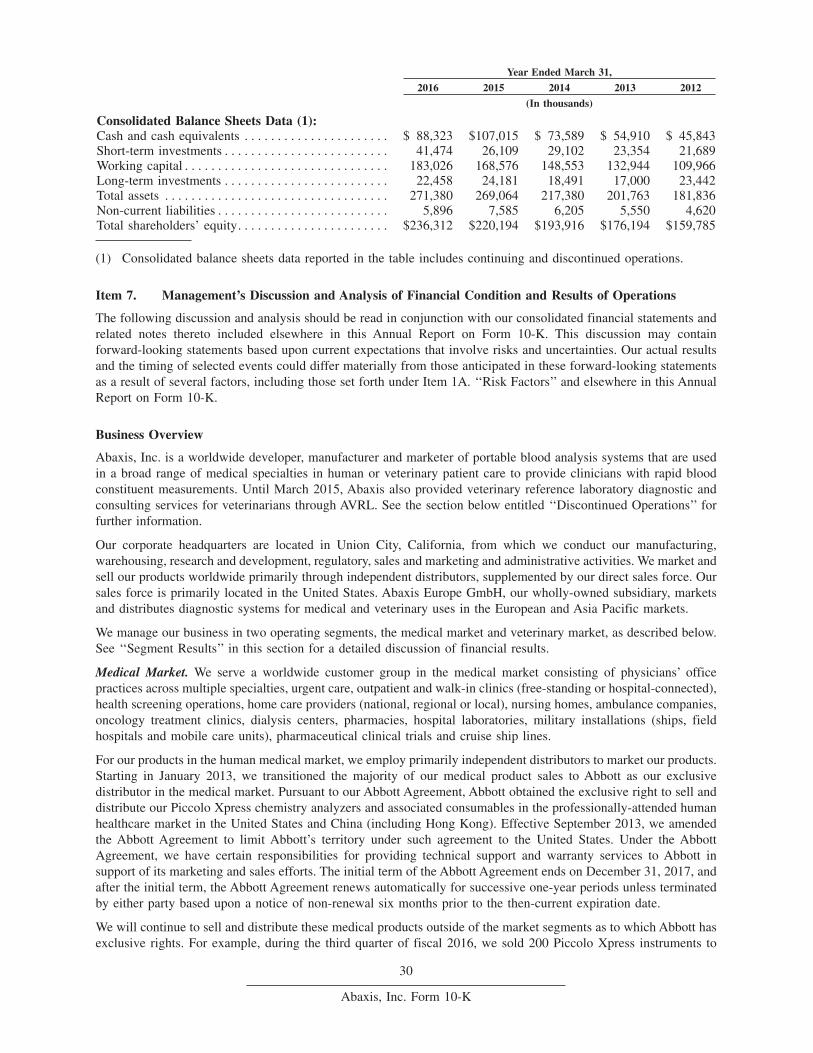
Year Ended March 31,
2016 2015 2014 2013 2012
(In thousands)
Consolidated Balance Sheets Data (1):Cash and cash equivalents . . . . . . . . . . . . . . . . . . . . . . $ 88,323 $107,015 $ 73,589 $ 54,910 $ 45,843Short-term investments . . . . . . . . . . . . . . . . . . . . . . . . . 41,474 26,109 29,102 23,354 21,689Working capital . . . . . . . . . . . . . . . . . . . . . . . . . . . . . . . 183,026 168,576 148,553 132,944 109,966Long-term investments . . . . . . . . . . . . . . . . . . . . . . . . . 22,458 24,181 18,491 17,000 23,442Total assets . . . . . . . . . . . . . . . . . . . . . . . . . . . . . . . . . . 271,380 269,064 217,380 201,763 181,836Non-current liabilities . . . . . . . . . . . . . . . . . . . . . . . . . . 5,896 7,585 6,205 5,550 4,620Total shareholders’ equity. . . . . . . . . . . . . . . . . . . . . . . $236,312 $220,194 $193,916 $176,194 $159,785
(1) Consolidated balance sheets data reported in the table includes continuing and discontinued operations.
Item 7. Management’s Discussion and Analysis of Financial Condition and Results of Operations
The following discussion and analysis should be read in conjunction with our consolidated financial statements andrelated notes thereto included elsewhere in this Annual Report on Form 10-K. This discussion may containforward-looking statements based upon current expectations that involve risks and uncertainties. Our actual resultsand the timing of selected events could differ materially from those anticipated in these forward-looking statementsas a result of several factors, including those set forth under Item 1A. ‘‘Risk Factors’’ and elsewhere in this AnnualReport on Form 10-K.
Business Overview
Abaxis, Inc. is a worldwide developer, manufacturer and marketer of portable blood analysis systems that are usedin a broad range of medical specialties in human or veterinary patient care to provide clinicians with rapid bloodconstituent measurements. Until March 2015, Abaxis also provided veterinary reference laboratory diagnostic andconsulting services for veterinarians through AVRL. See the section below entitled ‘‘Discontinued Operations’’ forfurther information.
Our corporate headquarters are located in Union City, California, from which we conduct our manufacturing,warehousing, research and development, regulatory, sales and marketing and administrative activities. We market andsell our products worldwide primarily through independent distributors, supplemented by our direct sales force. Oursales force is primarily located in the United States. Abaxis Europe GmbH, our wholly-owned subsidiary, marketsand distributes diagnostic systems for medical and veterinary uses in the European and Asia Pacific markets.
We manage our business in two operating segments, the medical market and veterinary market, as described below.See ‘‘Segment Results’’ in this section for a detailed discussion of financial results.
Medical Market. We serve a worldwide customer group in the medical market consisting of physicians’ officepractices across multiple specialties, urgent care, outpatient and walk-in clinics (free-standing or hospital-connected),health screening operations, home care providers (national, regional or local), nursing homes, ambulance companies,oncology treatment clinics, dialysis centers, pharmacies, hospital laboratories, military installations (ships, fieldhospitals and mobile care units), pharmaceutical clinical trials and cruise ship lines.
For our products in the human medical market, we employ primarily independent distributors to market our products.Starting in January 2013, we transitioned the majority of our medical product sales to Abbott as our exclusivedistributor in the medical market. Pursuant to our Abbott Agreement, Abbott obtained the exclusive right to sell anddistribute our Piccolo Xpress chemistry analyzers and associated consumables in the professionally-attended humanhealthcare market in the United States and China (including Hong Kong). Effective September 2013, we amendedthe Abbott Agreement to limit Abbott’s territory under such agreement to the United States. Under the AbbottAgreement, we have certain responsibilities for providing technical support and warranty services to Abbott insupport of its marketing and sales efforts. The initial term of the Abbott Agreement ends on December 31, 2017, andafter the initial term, the Abbott Agreement renews automatically for successive one-year periods unless terminatedby either party based upon a notice of non-renewal six months prior to the then-current expiration date.
We will continue to sell and distribute these medical products outside of the market segments as to which Abbott hasexclusive rights. For example, during the third quarter of fiscal 2016, we sold 200 Piccolo Xpress instruments to
30
Abaxis, Inc. Form 10-K
Fuzhou Kelian Medical Devices, Ltd. a point-of-care diagnostics distributor based in China. Under our AbbottAgreement, we will continue to sell and distribute to Catapult Health LLC and specified customer segments in theUnited States, including pharmacy and retail store clinics, shopping malls, clinical research organizations and cruiseship lines.
Veterinary Market. Our VetScan products serve a worldwide customer group in the veterinary market consisting ofcompanion animal hospitals, animal clinics with mixed practices of small animals, birds and reptiles, equine andbovine practitioners, veterinary emergency clinics, veterinary referral hospitals, universities, government,pharmaceutical companies, biotechnology companies and private research laboratories.
We depend on a number of distributors in North America that distribute our VetScan products. In September 2012,we entered into a distribution agreement with MWI to purchase, market and sell the full line of Abaxis veterinaryproducts throughout the United States. In the United States veterinary market segment, we also rely on variousindependent regional distributors. We continue to enter into additional distributor relationships to expand ourdistribution base in North America. In October 2014, we entered into distribution agreements with Henry ScheinAnimal Health and Patterson Companies, Inc. to sell the full line of Abaxis veterinary products throughout the UnitedStates. We depend on our distributors to assist us in promoting our VetScan products, and accordingly, if one or moreof our distributors were to stop selling our products in the future, we may experience a temporary sharp decline ordelay in our sales revenues until our customers identify another distributor or purchase products directly from us. Inaddition to selling through distributors, we also directly supply our VetScan products to large group purchasingorganizations, hospital networks and other buying groups in the United States, such as Veterinary Centers of America(VCA), a veterinary hospital chain in North America that operates more than 700 animal hospitals. In May 2014, weentered into a product supply agreement with VCA to supply our VetScan chemistry analyzers and diagnostic reagentdiscs for placement at VCA’s animal hospitals located in North America. In May 2014, we entered into anon-exclusive co-marketing agreement with VCA’s Antech Diagnostic laboratory services to supply our VetScanchemistry analyzers in combination with Antech Diagnostic laboratory services as a diagnostic solution to serveveterinary practices throughout North America. In the third quarter of fiscal 2016, we also entered into a five-yearsupply agreement with Banfield Pet Hospital, an organization with more than 900 pet hospitals within the UnitedStates and Puerto Rico. Under our supply agreement, we will provide our VetScan hematology analyzers andassociated consumables to all of Banfield’s pet hospital locations, for which installation and training began in earlyfiscal 2017.
Discontinued Operations
In March 2015, we entered into an asset purchase agreement with Antech pursuant to which we sold substantially allof the assets of our AVRL business to Antech. The transaction closed on March 31, 2015. We determined that ourAVRL business met the criteria to be classified as a discontinued operation, which required retrospective applicationto financial information for all periods presented. Accordingly, the historical financial statements appearing in thisreport have been revised to reflect this reclassification. Unless otherwise noted, references to revenues and expensesin this report are to our revenues and expenses excluding those from AVRL operations. See Note 3 of theConsolidated Financial Statements included in Part II, Item 8 of this report for more information.
The total purchase price under the asset purchase agreement was $21.0 million in cash. We received $20.1 millionin cash proceeds during the fourth quarter of fiscal 2015 and we recognized a pre-tax gain of $12.3 million($7.7 million after-tax) on sale of discontinued operations during fiscal 2015. Additionally, upon meeting certainconditions by the first anniversary of the closing date in March 2016, we recognized a pre-tax gain of $0.9 million($0.6 million after-tax) on sale of discontinued operations during fiscal 2016.
The pre-tax gain on this sale reflects the excess of the sum of the cash proceeds received over the costs incurred inconnection with the sale of AVRL. During the fourth quarter of fiscal 2015, we recorded costs of $7.8 million relatedto cash payments for employee-related costs, including severance, contract termination and other associated costs. Inconnection with the transaction, we recorded disposal and an impairment charge on long-lived assets of $1.9 millionduring fiscal 2015. These items partially offset the cash proceeds that we received in accordance with the terms ofthe asset purchase agreement.
Overview of Financial Results
In fiscal 2016, total revenues were $218.9 million, an increase of 8% from fiscal 2015. The net increase in revenueswas primarily attributable to revenues from consumable sales of $165.0 million, an increase of 14% over fiscal 2015,due to (a) an increase in the unit sales of medical and veterinary reagent discs due to an expanded instrument installed
31
Abaxis, Inc. Form 10-K
base, (b) higher sales of our VetScan Feline FeLV/FIV Rapid Test, which we introduced in fiscal 2015, (c) an increasein the unit sales of VetScan Canine Heartworm Rapid Test Kit and (d) an increase in the sales of VetScan rapid testsin North America resulting from two additional distributors, Henry Schein Animal Health and Patterson Companies,Inc., starting in the third quarter of fiscal 2015. Revenues from instrument sales were $43.0 million, a decrease of12% from fiscal 2015, due to a decrease in the unit sales of VetScan chemistry analyzers in the third quarter of fiscal2016 due to (a) higher sales in the third quarter of fiscal 2015 to VCA’s Animal Hospitals resulting from a productsupply agreement that we entered into in May 2014 and (b) higher sales of VetScan chemistry analyzers and VetScanhematology instruments in the third quarter of fiscal 2015 from initial stocking orders to two additional distributors,Henry Schein Animal Health and Patterson Companies, Inc., starting in the third quarter of fiscal 2015. Gross profitin fiscal 2016 was $123.3 million, an increase of 13% from fiscal 2015, primarily attributable to higher unit sales ofreagent discs in our veterinary market, which have a higher margin contribution, and changes in the product mix soldin our veterinary market.
Total operating expenses in fiscal 2016 were $76.9 million, an increase of $2.2 million, or 3%, from $74.7 millionin fiscal 2015, primarily attributable to an increase in research and development spending related primarily to newproduct development and enhancement of existing products in both the medical and veterinary markets, including thedevelopment of electronic connectivity technology and additional projects related to high sensitivity immunoassay.
Net income for fiscal 2016 was $31.6 million, an increase of 16% from $27.3 million in fiscal 2015, due primarilyto the increase in revenues of $16.3 million, as described above, offset in part by (a) an increase in our income taxprovision of $3.8 million resulting from a higher income from continuing operations before income tax provision and(b) a gain from the sale of our AVRL business, net of tax, of $7.7 million in the fourth quarter of fiscal 2015. Ourdiluted net income per share increased to $1.38 in fiscal 2016 from $1.20 in fiscal 2015. Our diluted net income pershare from continuing operations increased to $1.36 in fiscal 2016 from $0.91 in fiscal 2015.
Cash, cash equivalents and investments decreased by $5.1 million during fiscal 2016 to a total of $152.3 million atMarch 31, 2016. During fiscal 2016, operating cash flows were $28.1 million, a decrease of $8.3 million comparedto $36.4 million during fiscal 2015, primarily attributable to payments in the first quarter of fiscal 2016 related toaccrued liabilities for bonus, taxes and discontinued operations recorded at the end of fiscal 2015, partially offset byan increase in revenues of $16.3 million. Key non-operating uses of cash during fiscal 2016 included payments of$5.2 million to purchase property and equipment, payments of $5.3 million made for tax withholdings related to netshare settlements of restricted stock units, payment of $10.0 million in cash dividends to shareholders and$13.0 million for repurchases of our common stock under our share repurchase program to repurchase and retire325,000 shares of our common stock at an average purchase price of $40.18 per share, including commissionexpense.
Factors that May Impact Future Performance
Our industry is impacted by numerous competitive, regulatory and other significant factors. Our sales for any futureperiods are not predictable with a significant degree of certainty, and may depend on a number of factors outside ofour control. We are dependent upon the efforts and priorities of our distributors in promoting and creating a demandfor our products and as such, we do not have full control over the marketing and sale of our products into thesemarkets. Should these efforts be unsuccessful, or should we fail to maintain these relationships, our business,financial condition and results of operations are likely to be adversely affected. We generally operate with a limitedorder backlog because our products are typically shipped shortly after orders are received. Product sales in anyquarter are generally dependent on orders booked and shipped in that quarter. As a result, any shortfall in productsales during a quarter would negatively affect our results of operations and financial condition during that quarter.In addition, our sales may be adversely impacted by pricing pressure from competitors. Our ability to increase ourrevenues and profitability will depend, in part, on our ability to increase the sales volumes of our products, to increasethe sales performance of our independent distributors, and to successfully compete with our competitors.
Abbott controls the marketing and sale of our primary medical products into most of the U.S. medical market and,accordingly, we are dependent upon the efforts and priorities of Abbott in promoting and creating a demand for suchproducts in such market. Should these efforts be unsuccessful, our business, financial condition and results ofoperations may be adversely affected. For example, during fiscal 2014, we were adversely impacted by the timingof purchases of our medical products sold to Abbott as it integrated our products into its sales process and sold itsinventory.
32
Abaxis, Inc. Form 10-K
In the United States veterinary market, we rely on our national and independent regional distributors. We are alsodependent upon the efforts and priorities of these distributors in promoting and creating a demand for our productsand do not have full control over the marketing and sale of our products into these markets. Should these efforts beunsuccessful, or should we fail to maintain these relationships, our business, financial condition and results ofoperations are likely to be adversely affected. For example, during fiscal 2014, our strategy of increasing demand forour veterinary products through the expansion of our distribution partners, did not lead to the increased demand forour products in the veterinary clinics that we had anticipated resulting in excess channel inventory. In response, wetook additional steps to more closely monitor and manage channel inventory in an effort to normalize the veterinaryproduct inventories at our distribution partners in the United States. As a result of these efforts, we believe that ourdistributors’ purchases of our veterinary chemistry analyzers and related reagent discs in fiscal 2015 weresubstantially in line with in-clinic sales. For the hematology, i-STAT and VSpro specialty veterinary products that wesell in the United States, sales orders from our largest distributors in the veterinary market decreased during the firsthalf of fiscal 2015 as compared to the same period in fiscal 2014, resulting from excess channel inventory createdduring the first half of fiscal 2014; however, as a result of our efforts in closely monitoring and managing channelinventory, we believe that these distributors’ purchases of hematology, i-STAT and VSpro specialty veterinaryproducts were substantially in line with in-clinic sales in the third quarter of fiscal 2015. We only began sellingthrough our distributors Henry Schein Animal Health and Patterson Companies, Inc. in the third quarter of fiscal 2015and our revenues in future quarters may be impacted by the timing of purchases of our products sold by them as thesenew distributors integrate our products into their sales process. We will continue to closely monitor and managechannel inventory at our distribution partners in the United States.
Critical Accounting Policies, Estimates and Judgments
Our consolidated financial statements are prepared in accordance with accounting principles generally accepted in theUnited States and pursuant to the rules and regulations of the Securities and Exchange Commission. The preparationof these financial statements requires management to make estimates and assumptions that affect the reportedamounts of assets and liabilities at the date of the financial statements and revenues and expenses during the reportingperiod. On an on-going basis, we evaluate our estimates and the sensitivity of these estimates to deviations in theassumptions used in making them. We base our estimates on historical experience and on various other assumptionsthat are believed to be reasonable under the circumstances. However, there can be no assurance that our actual resultswill not differ from these estimates.
We have identified the policies below as critical because they are not only important to understanding our financialcondition and results of operations, but also because application and interpretation of these policies requires bothjudgment and estimates of matters that are inherently uncertain and unknown. Accordingly, actual results may differmaterially from our estimates. The impact and any associated risks related to these policies on our business operationsare discussed below. For a more detailed discussion on the application of these and other accounting policies, see theNotes to Consolidated Financial Statements included in this Annual Report on Form 10-K.
Revenue Recognition. Our primary customers are distributors and direct customers in both the medical andveterinary markets. Service revenues were primarily generated from veterinary reference laboratory diagnostic andconsulting services for veterinarians. Revenues from product sales, net of estimated sales allowances, discounts andrebates, are recognized when (i) evidence of an arrangement exists, (ii) upon shipment of the products or renderingof services to the customer, (iii) the sales price is fixed or determinable and (iv) collection of the resulting receivableis reasonably assured. Rights of return are not provided. Until March 2015, we offered discounts on AVRL servicesfor a specified period as incentives. Discounts were reductions to invoiced amounts within a specified period andwere recorded at the time services are performed. Net service revenues were recognized at the time services wereperformed.
Amounts collected in advance of revenue recognition are recorded as a current or non-current deferred revenueliability based on the time from the balance sheet date to the future date of revenue recognition. We recognize revenueassociated with extended maintenance agreements ratably over the life of the contract.
Multiple Element Revenue Arrangements. Our sales arrangements may contain multiple element revenuearrangements in which a customer may purchase a combination of instruments, consumables or extendedmaintenance agreements. Additionally, we provide incentives in the form of free goods or extended maintenanceagreements to customers in connection with the sale of our instruments. We participate in selling arrangements in theveterinary market that include multiple deliverables, such as instruments and consumables. Prior to the sale of our
33
Abaxis, Inc. Form 10-K
AVRL business to Antech in March 2015, our selling arrangements in the veterinary market had also included serviceagreements associated with our veterinary reference laboratory. Judgments as to the allocation of consideration froman arrangement to the multiple elements of the arrangement, and the appropriate timing of revenue recognition arecritical with respect to these arrangements.
A multiple element arrangement includes the sale of one or more tangible product offerings with one or moreassociated services offerings, each of which are individually considered separate units of accounting. We allocaterevenues to each element in a multiple element arrangement based upon the relative selling price of each deliverable.When applying the relative selling price method, we determine the selling price for each deliverable usingvendor-specific objective evidence (‘‘VSOE’’) of selling price, if it exists, or third-party evidence (‘‘TPE’’) of sellingprice. If neither VSOE nor TPE of selling price exist for a deliverable, we use our best estimate of selling price forthat deliverable. Revenue allocated to each element is then recognized when all revenue recognition criteria are metfor each element.
Revenues from our multiple element arrangements are allocated separately to the instruments, consumables, extendedmaintenance agreements and incentives based on the relative selling price method. Amounts allocated to eachelement are based on its objectively determined fair value, such as the sales price for the product when it is soldseparately. Revenues allocated to each element are then recognized when the basic revenue recognition criteria, asdescribed above, are met for each element. Revenues associated with incentives in the form of free goods are deferreduntil the goods are shipped to the customer. Revenues associated with incentives in the form of extended maintenanceagreements are deferred and recognized ratably over the life of the extended maintenance contract, generally one tothree years. Incentives in the form of extended maintenance agreements are our most significant multiple elementarrangement.
For our selling arrangements in the veterinary market that include multiple deliverables, such as instruments,consumables or service agreements (prior to the sale of AVRL in March 2015) associated with our veterinaryreference laboratory, revenue is recognized upon delivery of the product or performance of the service during the termof the service contract when the basic revenue recognition criteria, as described above, are met for each element. Weallocate revenues to each element based on the relative selling price of each deliverable. Amounts allocated to eachelement are based on its objectively determined fair value, such as the sales price for the product or service when itis sold separately.
Until March 2015, we offered customer incentives consisting of arrangements with customers to include discountson future sales of services associated with our veterinary reference laboratory. We applied judgment in determiningwhether future discounts are significant and incremental. When the future discount offered was not consideredsignificant and incremental, we did not account for the discount as an element of the original arrangement. Todetermine whether a discount was significant and incremental, we looked to the discount provided in comparison tostandalone sales of the same product to similar customers, the level of discount provided on other elements in thearrangement, and the significance of the discount to the overall arrangement. If the discount in the multiple elementarrangement approximated the discount typically provided in standalone sales, that discount is not consideredincremental. During fiscal 2015 and 2014, our customer incentive programs with future discounts were not significantand in fiscal 2016 we did not offer any such incentives.
At March 31, 2016 and 2015, the current portion of deferred revenue balances was $1.6 million and $1.3 million,respectively, and the non-current portion of deferred revenue balances was $2.3 million and $3.2 million,respectively. Net current and non-current deferred revenue decreased by $0.7 million from March 31, 2015 toMarch 31, 2016, primarily attributable to deferred revenue recognized ratably over the life of extended maintenancecontracts offered to customers in the form of free services in connection with the sale of our instruments. In October2013, we changed the standard warranty period on certain instruments from three to five years, which resulted in adecrease in maintenance contracts offered to customers in the form of free services during the second half of fiscal2014.
Starting in fiscal 2016, we entered into sales contracts as the lessor of instruments under sales-type lease agreementswith our customers. In the veterinary market, we may offer arrangements to end users for monthly payments ofinstrument and consumable purchases over a term of six years. The present value of lease receivables, includingaccrued interest, was $2.1 million and $0, as of March 31, 2016 and 2015, respectively. Our short-term and long-termlease receivables are recorded within ‘‘Receivables’’ and ‘‘Other Assets,’’ respectively, on our consolidated balancesheets. Interest income is recognized monthly over the lease term using the effective-interest method.
34
Abaxis, Inc. Form 10-K
Customer Programs. From time to time, we offer customer marketing and incentive programs. Our most significantcustomer programs are described as follows:
Instrument Trade-In Programs. We periodically offer trade-in programs to customers for trading in an existinginstrument to purchase a new instrument and we will either provide incentives in the form of free goods or reducethe sales price of the instrument. These incentives in the form of free goods are recorded based on the relative sellingprice method according to the policies described above.
Instrument Rental Programs. We periodically offer programs to customers whereby certain instruments are madeavailable to customers for rent or on an evaluation basis. These programs typically require customers to purchase aminimum quantity of consumables during a specified period for which we recognize revenue on the relatedconsumables according to the policies described above. Depending on the program offered, customers may purchasethe instrument during the rental or evaluation period. Proceeds from such sale are recorded as revenue according tothe policies described above. Rental income, if any, is also recorded as revenue according to the policies describedabove.
Sales Incentive Programs. We periodically offer customer sales incentive programs and we record reductions torevenue related to these programs. Incentives may be provided in the form of rebates to distributors for volume-basedpurchases or upon meeting other specified requirements, end-user rebates and discounts. A summary of our revenuereductions is described below. Other rebate programs offered to distributors or customers vary from period to periodin the medical and veterinary markets and were not significant.
• Volume-based Incentives. Volume-based incentives, in the form of rebates, are offered from time to time todistributors and group purchasing organizations upon meeting the sales volume requirements during a qualifyingperiod and are recorded as a reduction to gross revenues during a qualifying period. The pricing rebate programis primarily offered to distributors and group purchasing organizations in the North America veterinary market,upon meeting the sales volume requirements of veterinary products during the qualifying period. Factors usedin the rebate calculations include the identification of products sold subject to a rebate during the qualifyingperiod and which rebate percentage applies. Based on these factors and using historical trends, adjusted forcurrent changes, we estimate the amount of the rebate and record the rebate as a deduction to gross revenueswhen we record the sale of the product. The rebate is recorded as a reserve to offset accounts receivable assettlements are made through offsets to outstanding customer invoices. Settlement of the rebate accruals fromthe date of sale ranges from one to nine months after sale. Changes in the rebate accrual at the end of each periodare based upon distributors and group purchasing organizations meeting the purchase requirements during thequarter.
• Distributor Rebate Incentives. During fiscal 2016 and 2015, we offered a customer sales incentive program,whereby distributors were offered a rebate upon meeting certain requirements. We recognize the rebateobligation as a reduction of revenue at the later of the date on which we sell the product or the date the programis offered. These customer sales incentive programs require management to estimate the rebate amounts todistributors who will qualify for the incentive during the promotional period. We record the estimated liabilityin other current accrued liabilities on our consolidated balance sheets. Management’s estimates are based onhistorical experience and the specific terms and conditions of the incentive programs.
• End-User Rebates and Discounts. From time to time, cash rebates are offered to end-users who purchase certainproducts or instruments during a promotional period and are recorded as a reduction to gross revenues.Additionally, we periodically offer sales incentives to end-users, in the form of sales discounts, to purchaseconsumables for a specified promotional period, typically over five years from the sale of our instrument, andwe reimburse resellers for the value of the sales discount provided to the end-user. We estimate the amount ofthe incentive earned by end-users during a quarter and record a liability to the reseller as a reduction to grossrevenues. Factors used in the liability calculation of incentives earned by end-users include the identification ofqualified end-users under the sales program during the period and using historical trends. Settlement of theliability to the reseller ranges from one to twelve months from the date an end-user earns the incentive.
35
Abaxis, Inc. Form 10-K
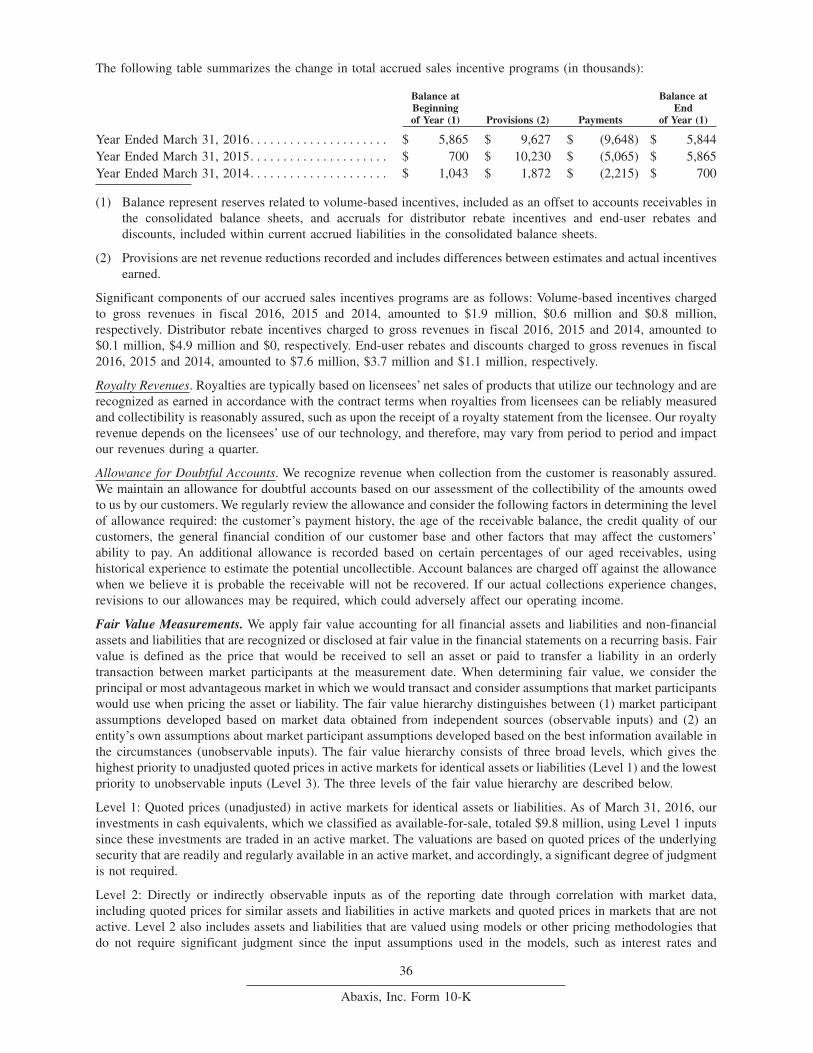
The following table summarizes the change in total accrued sales incentive programs (in thousands):
Balance atBeginningof Year (1) Provisions (2) Payments
Balance atEnd
of Year (1)
Year Ended March 31, 2016. . . . . . . . . . . . . . . . . . . . . $ 5,865 $ 9,627 $ (9,648) $ 5,844Year Ended March 31, 2015. . . . . . . . . . . . . . . . . . . . . $ 700 $ 10,230 $ (5,065) $ 5,865Year Ended March 31, 2014. . . . . . . . . . . . . . . . . . . . . $ 1,043 $ 1,872 $ (2,215) $ 700
(1) Balance represent reserves related to volume-based incentives, included as an offset to accounts receivables inthe consolidated balance sheets, and accruals for distributor rebate incentives and end-user rebates anddiscounts, included within current accrued liabilities in the consolidated balance sheets.
(2) Provisions are net revenue reductions recorded and includes differences between estimates and actual incentivesearned.
Significant components of our accrued sales incentives programs are as follows: Volume-based incentives chargedto gross revenues in fiscal 2016, 2015 and 2014, amounted to $1.9 million, $0.6 million and $0.8 million,respectively. Distributor rebate incentives charged to gross revenues in fiscal 2016, 2015 and 2014, amounted to$0.1 million, $4.9 million and $0, respectively. End-user rebates and discounts charged to gross revenues in fiscal2016, 2015 and 2014, amounted to $7.6 million, $3.7 million and $1.1 million, respectively.
Royalty Revenues. Royalties are typically based on licensees’ net sales of products that utilize our technology and arerecognized as earned in accordance with the contract terms when royalties from licensees can be reliably measuredand collectibility is reasonably assured, such as upon the receipt of a royalty statement from the licensee. Our royaltyrevenue depends on the licensees’ use of our technology, and therefore, may vary from period to period and impactour revenues during a quarter.
Allowance for Doubtful Accounts. We recognize revenue when collection from the customer is reasonably assured.We maintain an allowance for doubtful accounts based on our assessment of the collectibility of the amounts owedto us by our customers. We regularly review the allowance and consider the following factors in determining the levelof allowance required: the customer’s payment history, the age of the receivable balance, the credit quality of ourcustomers, the general financial condition of our customer base and other factors that may affect the customers’ability to pay. An additional allowance is recorded based on certain percentages of our aged receivables, usinghistorical experience to estimate the potential uncollectible. Account balances are charged off against the allowancewhen we believe it is probable the receivable will not be recovered. If our actual collections experience changes,revisions to our allowances may be required, which could adversely affect our operating income.
Fair Value Measurements. We apply fair value accounting for all financial assets and liabilities and non-financialassets and liabilities that are recognized or disclosed at fair value in the financial statements on a recurring basis. Fairvalue is defined as the price that would be received to sell an asset or paid to transfer a liability in an orderlytransaction between market participants at the measurement date. When determining fair value, we consider theprincipal or most advantageous market in which we would transact and consider assumptions that market participantswould use when pricing the asset or liability. The fair value hierarchy distinguishes between (1) market participantassumptions developed based on market data obtained from independent sources (observable inputs) and (2) anentity’s own assumptions about market participant assumptions developed based on the best information available inthe circumstances (unobservable inputs). The fair value hierarchy consists of three broad levels, which gives thehighest priority to unadjusted quoted prices in active markets for identical assets or liabilities (Level 1) and the lowestpriority to unobservable inputs (Level 3). The three levels of the fair value hierarchy are described below.
Level 1: Quoted prices (unadjusted) in active markets for identical assets or liabilities. As of March 31, 2016, ourinvestments in cash equivalents, which we classified as available-for-sale, totaled $9.8 million, using Level 1 inputssince these investments are traded in an active market. The valuations are based on quoted prices of the underlyingsecurity that are readily and regularly available in an active market, and accordingly, a significant degree of judgmentis not required.
Level 2: Directly or indirectly observable inputs as of the reporting date through correlation with market data,including quoted prices for similar assets and liabilities in active markets and quoted prices in markets that are notactive. Level 2 also includes assets and liabilities that are valued using models or other pricing methodologies thatdo not require significant judgment since the input assumptions used in the models, such as interest rates and
36
Abaxis, Inc. Form 10-K
volatility factors, are corroborated by readily observable data from actively quoted markets for substantially the fullterm of the financial instrument. As of March 31, 2016, our available-for-sale investments in corporate bonds, totaled$7.0 million, using Level 2 inputs, based on market pricing and other observable market inputs for similar securitiesobtained from various third party data providers.
Level 3: Unobservable inputs that are supported by little or no market data and require the use of significantmanagement judgment. These values are generally determined using pricing models for which the assumptions utilizemanagement’s estimates of market participant assumptions. As of March 31, 2016 and 2015, we did not have anyLevel 3 financial assets or liabilities measured at fair value on a recurring basis.
Fair value is a market-based measure considered from the perspective of a market participant who holds the asset orowes the liability rather than an entity-specific measure. Therefore, even when market assumptions are not readilyavailable, our own assumptions are developed to reflect those that market participants would use in pricing the assetor liability at the measurement date. At March 31, 2016, we also had $56.9 million in investments classified asheld-to-maturity and carried at amortized cost.
Investment in Unconsolidated Affiliate. In February 2011, we purchased a 15% equity ownership interest inScandinavian Micro Biodevices APS (‘‘SMB’’) for $2.8 million in cash. We use the equity method to account for ourinvestment in this entity because we do not control it, but have the ability to exercise significant influence over it.Equity method investments are recorded at original cost and adjusted periodically to recognize (1) our proportionateshare of the investees’ net income or losses after the date of investment, (2) additional contributions made anddividends or distributions received, and (3) impairment losses resulting from adjustments to net realizable value. Weeliminate all intercompany transactions in accounting for our equity method investments. We record ourproportionate share of the investees’ net income or losses in ‘‘Interest and other income (expense), net’’ on ourconsolidated statements of income. At March 31, 2016 and 2015, our investment in unconsolidated affiliate totaled$2.7 million and $2.7 million, respectively.
We assess the potential impairment of our equity method investments when indicators such as a history of operatinglosses, a negative earnings and cash flow outlook, and the financial condition and prospects for the investee’sbusiness segment might indicate a loss in value. To date, since our investment in SMB, we have not recorded animpairment charge on this investment.
Warranty Reserves. We provide for the estimated future costs to be incurred under our standard warranty obligationon our instruments. Our standard warranty obligation on instruments ranges from one to five years, depending on thespecific product. The estimated contractual warranty obligation is recorded when the related revenue is recognizedand any additional amount is recorded when such cost is probable and can be reasonably estimated. Cost of revenuesreflects estimated warranty expense for instruments sold in the current period and any adjustments in estimatedwarranty expense for the installed base under our standard warranty obligation based on our quarterly evaluation ofservice experience. While we engage in product quality programs and processes, including monitoring and evaluatingthe quality of our suppliers, our estimated accrual for warranty exposure is based on our historical experience as toproduct failures, estimated product failure rates, estimated repair costs, material usage and freight incurred inrepairing the instrument after failure and known design changes under the warranty plan. Effective October 2013, weprospectively changed our standard warranty obligations on certain instruments sold from three to five years. Theincrease in the standard warranty period did not result in a material impact on our cost of revenues or our accruedwarranty costs during fiscal 2016, 2015 and 2014.
We also provide for the estimated future costs to be incurred under our standard warranty obligation on our reagentdiscs. A provision for defective reagent discs is recorded and classified as a current liability when the related sale isrecognized and any additional amount is recorded when such cost is probable and can be reasonably estimated, atwhich time they are included in cost of revenues. The warranty cost includes the replacement costs and freight of adefective reagent disc.
As of March 31, 2016, our current portion of warranty reserves for instruments and reagent discs totaled $1.3 millionand our non-current portion of warranty reserves for instruments totaled $1.9 million, which reflects our estimate ofwarranty obligations based on the estimated product failure rates, the number of instruments in standard warranty,estimated repair and related costs of instruments, and an estimate of defective reagent discs and replacement andrelated costs of a defective reagent disc. Total change in accrued warranty reserve from March 31, 2015 to March 31,2016, was insignificant.
37
Abaxis, Inc. Form 10-K
For fiscal 2016, 2015 and 2014, the provision for warranty expense related to instruments was $1.2 million,$2.4 million and $1.6 million, respectively. During fiscal 2016, we recorded an adjustment to pre-existing warrantiesof $0.2 million, which reduced our warranty reserves and our cost of revenues, based on our historical experienceand our projected performance rate of instruments. The change in the provision for warranty expense related toinstruments during fiscal 2016, as compared to fiscal 2015, was primarily attributable to a decrease in the numberof instruments under standard warranty. The increase in the provision for warranty expense related to instrumentsduring fiscal 2015, as compared to fiscal 2014 was primarily attributable to an increase in the number of instrumentsunder standard warranty.
For fiscal 2016, 2015 and 2014, the provision for warranty expense related to replacement of defective reagent discswas $0.4 million, $0.2 million and $0.5 million, respectively. The changes in the provision for warranty expenserelated to reagent discs was primarily due to our judgment of the estimated product failure rate of reagent discs underwarranty.
Management periodically evaluates the sufficiency of the warranty provisions and makes adjustments whennecessary. If an unusual performance rate related to warranty claims is noted, an additional warranty accrual may beassessed and recorded when a failure event is probable and the cost can be reasonably estimated. We review thehistorical warranty cost trends and analyze the adequacy of the ending accrual balance of warranty reserves eachquarter. The determination of warranty reserves requires us to make estimates of the estimated product failure rate,expected costs to repair or replace the instruments and to replace defective reagent discs under warranty. If actualrepair or replacement costs of instruments or replacement costs of reagent discs differ significantly from ourestimates, adjustments to cost of revenues may be required. Additionally, if factors change and we revise ourassumptions on the product failure rate of instruments or reagent discs, then our warranty reserves and cost ofrevenues could be materially impacted in the quarter of such revision, as well as in following quarters.
Inventories. We state inventories at the lower of cost or market, cost being determined using standard costs whichapproximate actual costs using the first-in, first-out (FIFO) method. Inventories include material, labor andmanufacturing overhead. We establish provisions for excess, obsolete and unusable inventories after evaluation offuture demand of our products and market conditions. If future demand or actual market conditions are less favorablethan those estimated by management or if a significant amount of the material were to become unusable, additionalinventory write-downs may be required, which would have a negative effect on our operating income.
Intangible Assets. Intangible assets, consisted of customer relationships, tradename, licenses and other rightsacquired from third parties, are presented at cost, net of accumulated amortization. The intangible assets areamortized using the straight-line method over their estimated useful lives of 2-10 years, which approximates theeconomic benefit. If our underlying assumptions regarding the estimated useful life of an intangible asset change,then the amortization period, amortization expense and the carrying value for such asset would be adjustedaccordingly. During fiscal 2016, 2015 and 2014, our changes in estimated useful life of intangible assets were notsignificant, except as noted below in ‘‘Valuation of Long-Lived Assets.’’
Valuation of Long-Lived Assets. We evaluate the carrying value of our long-lived assets, such as property andequipment and amortized intangible assets, whenever events or changes in business circumstances or our planned useof long-lived assets indicate that the carrying amount of an asset may not be fully recoverable or their useful livesare no longer appropriate. We look to current and future profitability, as well as current and future undiscounted cashflows, excluding financing costs, as primary indicators of recoverability. An impairment loss would be recognizedwhen the sum of the undiscounted future net cash flows expected to result from the use of the asset and its eventualdisposal is less than the carrying amount. If impairment is determined to exist, any related impairment loss iscalculated based on fair value and long-lived assets are written down to their respective fair values. During fiscal2016, 2015 and 2014, we recognized impairment charges on long-lived assets of $13,000, $1.9 million and $0,respectively. The impairment charges on our long-lived assets in fiscal 2015 were in relation to the property andequipment and intangible assets of our AVRL business, which has been offset against the gain from the sale of AVRLon the consolidated statement of income for fiscal 2015.
Income Taxes. We account for income taxes using the liability method under which deferred tax assets and liabilitiesare determined based on the differences between the financial statement carrying amounts of existing assets and
38
Abaxis, Inc. Form 10-K
liabilities and their respective tax bases. Deferred tax assets and liabilities are measured using enacted tax ratesexpected to apply to taxable income in the years in which those temporary differences are expected to be recoveredor settled. Valuation allowances are established, when necessary, to reduce deferred tax assets to the amountsexpected to be recovered.
We recognize and measure benefits for uncertain tax positions using a two-step approach. The first step is to evaluatethe tax position taken or expected to be taken in a tax return by determining if the weight of evidence indicates thatit is more likely than not that the tax position will be sustained upon audit, including resolution of any related appealsor litigation processes. For tax positions that are more likely than not to be sustained upon audit, the second step isto measure the tax benefit as the largest amount that is more than 50 percent likely to be realized upon settlement.Significant judgment is required to evaluate uncertain tax positions. At March 31, 2016 and 2015, we had nosignificant uncertain tax positions. Our policy is to include interest and penalties related to gross unrecognized taxbenefits within our provision for income taxes. In fiscal 2016, 2015 and 2014, we did not recognize any interest orpenalties related to uncertain tax positions in the consolidated statements of income, and at March 31, 2016 and 2015,we had no accrued interest or penalties.
Share-Based Compensation Expense. We account for share-based compensation arrangements using the fair valuemethod. We recognize share-based compensation expense, net of an estimated forfeiture rate, over the requisiteservice period of the award to employees and directors. As required by fair value provisions of share-basedcompensation, employee share-based compensation expense recognized is calculated over the requisite service periodof the awards and reduced for estimated forfeitures. The forfeiture rate is estimated based on historical data of ourshare-based compensation awards that are granted and cancelled prior to vesting and upon historical experience ofemployee turnover. Changes in estimated forfeiture rates and differences between estimated forfeiture rates and actualexperience may result in significant, unanticipated increases or decreases in share-based compensation expense fromperiod to period. To the extent we revise our estimate of the forfeiture rate in the future, our share-based compensationexpense could be materially impacted in the quarter of revision, as well as in following quarters.
Prior to fiscal 2007, we granted stock option awards to employees and directors as part of our share-basedcompensation program. We have not granted any stock options since the beginning of fiscal 2007. We haverecognized compensation expense for stock options granted during the requisite service period of the stock option.As of March 31, 2016, we had no unrecognized compensation expense related to stock options granted.
Since fiscal 2007, we have granted restricted stock unit awards to employees and directors as part of our share-basedcompensation program. Restricted stock unit awards to consultants have been insignificant. Awards of restricted stockunits are issued at no cost to the recipient and may have time-based vesting criteria, or a combination of time-basedand performance-based vesting criteria, as described below.
Restricted Stock Unit Awards (Time Vesting)
The fair value of restricted stock unit awards with only time-based vesting terms, which we refer to as restricted stockunit awards (time vesting), used in our expense recognition method is measured based on the number of sharesgranted and the closing market price of our common stock on the date of grant. Such value is recognized as anexpense over the corresponding requisite service period. The share-based compensation expense is reduced by anestimate of the restricted stock unit awards that are expected to be forfeited. The forfeiture estimate is based onhistorical data and other factors, and compensation expense is adjusted for actual results. As a result, if factors changeand we use different assumptions, our share-based compensation expense could be materially different in the future.
Restricted Stock Unit Awards (Performance Vesting)
We also began granting restricted stock unit awards subject to performance vesting criteria, which we refer to asrestricted stock unit awards (performance vesting), to our executive officers starting in fiscal 2013. Restricted stockunit awards (performance vesting) consist of the right to receive shares of common stock, subject to achievement oftime-based criteria and certain corporate performance-related goals over a specified period, as established by theCompensation Committee of our Board of Directors (the ‘‘Compensation Committee’’). For restricted stock unitssubject to performance vesting, we recognize any related share-based compensation expense ratably over the serviceperiod based on the most probable outcome of the performance condition. The fair value of our restricted stock unitawards (performance vesting) used in our expense recognition method is measured based on the number of sharesgranted, the closing market price of our common stock on the date of grant and an estimate of the probability of theachievement of the performance goals. The amount of share-based compensation expense recognized in any one
39
Abaxis, Inc. Form 10-K
period can vary based on the attainment or expected attainment of the performance goals. If such performance goalsare not ultimately met, no compensation expense is recognized and any previously recognized compensation expenseis reversed.
In fiscal 2014, 2015, 2016 and 2017, the Compensation Committee approved the grant of restricted stock unit awards(performance vesting) described below. These restricted stock units vest only if both of the following criteria aresatisfied: (1) our consolidated income from operations during the fiscal year in which grant occurred, as certified bythe Compensation Committee, is in excess of the applicable target amount described below; and (2) the recipientremains in the continuous service of the Company until the applicable vesting date set forth as follows:
• 25% of the shares subject to an award vest in full upon achieving 90% of the consolidated income fromoperations target described above and continuous service until the third anniversary of the date of grant;
• 25% of the shares subject to an award vest in full upon achieving 90% of the consolidated income fromoperations target described above and continuous service until the fourth anniversary of the date of grant;
• 25% of the shares subject to an award vest in full upon achieving 100% of the consolidated income fromoperations target described above and continuous service until the third anniversary of the date of grant; and
• 25% of the shares subject to an award vest in full upon achieving 100% of the consolidated income fromoperations target described above and continuous service until the fourth anniversary of the date of grant.
In April 2013, in consideration of the grant of restricted stock unit awards (performance vesting) to our executiveofficers in fiscal 2014, 75% of the remaining restricted stock unit awards (performance vesting) to our executiveofficers that were granted in fiscal 2013, which consisted of the second, third and fourth tranches, were cancelled.As a result, these restricted stock units are no longer outstanding and were not deemed granted for accountingpurposes because each annual performance target was to be set at the start of each respective single-fiscal yearperformance period in accordance with ASC 718-10-55-95.
Fiscal 2014 Performance RSUs. In April 2013, the Compensation Committee approved the grant of restricted stockunit awards (performance vesting) for 129,000 shares of common stock to our executive officers that contained theforegoing time-based and performance-based vesting terms (the ‘‘FY2014 Performance RSUs’’). The aggregateestimated grant date fair value of the FY2014 Performance RSUs was $5.5 million based on the closing market priceof our common stock on the date of grant.
At March 31, 2014, we reviewed each of the underlying performance targets related to the outstanding FY2014Performance RSUs and determined that it was not probable that the FY2014 Performance RSUs would vest and asa result did not record share-based compensation related to these awards during fiscal 2014. On April 23, 2014, theCompensation Committee determined that the Company’s consolidated income from operations for fiscal 2014 wasbelow 90% of target and, accordingly, the FY2014 Performance RSUs did not vest and were cancelled.
Fiscal 2015 Performance RSUs. In April 2014, the Compensation Committee approved the grant of restricted stockunit awards (performance vesting) for 172,000 shares of common stock to our executive officers that contained theforegoing time-based and performance-based vesting terms (the ‘‘FY2015 Performance RSUs’’). The aggregateestimated grant date fair value of the FY2015 Performance RSUs was $7.0 million based on the closing market priceof our common stock on the date of grant. During fiscal 2016 and 2015, we recorded share-based compensationexpense ratably over the vesting terms of the FY2015 Performance RSUs, as we determined that the performancetargets would be met.
Fiscal 2016 Performance RSUs. In April 2015, the Compensation Committee approved the grant of restricted stockunit awards (performance vesting) for 187,000 shares of common stock to our executive officers and to certain of ouremployees that contained the foregoing time-based and performance-based vesting terms (the ‘‘FY2016 PerformanceRSUs’’). The aggregate estimated grant date fair value of the FY2016 Performance RSUs was $10.3 million basedon the closing market price of our common stock on the date of grant. During fiscal 2016, we recorded share-basedcompensation expense ratably over the vesting terms of the FY2015 Performance RSUs, as we determined that theperformance targets would be met.
40
Abaxis, Inc. Form 10-K
Fiscal 2017 Performance RSUs. In April 2016, the Compensation Committee approved the grant of restricted stockunit awards (performance vesting) for 152,000 shares of common stock to our executive officers and to certain of ouremployees (the ‘‘FY2017 Performance RSUs’’) that contained the foregoing time-based and performance-basedvesting terms, except that the restricted stock units granted to our CEO, Mr. Clinton Severson, vest as follows:
• approximately 18% of the shares subject to an award vest in full upon achieving 90% of the consolidated incomefrom operations target described above and continuous service until the third anniversary of the date of grant;
• approximately 18% of the shares subject to an award vest in full upon achieving 90% of the consolidated incomefrom operations target described above and continuous service until the fourth anniversary of the date of grant;
• approximately 32% of the shares subject to an award vest in full upon achieving 100% of the consolidatedincome from operations target described above and continuous service until the third anniversary of the date ofgrant; and
• approximately 32% of the shares subject to an award vest in full upon achieving 100% of the consolidatedincome from operations target described above and continuous service until the fourth anniversary of the dateof grant.
The aggregate estimated grant date fair value of the FY2017 Performance RSUs was $6.8 million based on theclosing market price of our common stock on the date of grant.
Share-based compensation expense has had a material impact on our earnings per share and on our consolidatedfinancial statements for fiscal 2016, 2015 and 2014. The impact of share-based compensation expense on ourconsolidated financial results is disclosed in Note 15 in the Notes to Consolidated Financial Statements in Part II,Item 8 of this report. We expect that share-based compensation will materially impact our consolidated financialstatements in the foreseeable future. As of March 31, 2016, our total unrecognized compensation expense related torestricted stock unit awards (time vesting) and restricted stock unit awards (performance vesting) granted toemployees and directors totaled $24.1 million, which expense is expected to be recognized over a weighted averageservice period of 1.9 to 2.0 years. Excluding forfeitures, we estimate expense recognition of restricted stock units withtime-based vesting criteria over the requisite service period of the award, for awards granted and unvested as ofMarch 31, 2016 as follows: $10.7 million in fiscal 2017, $9.6 million in fiscal 2018, $7.6 million in fiscal 2019 and$1.2 million in fiscal 2020.
Results of Operations
Previously reported financial information has been revised to reflect the reclassification of our AVRL business withinour veterinary market segment as discontinued operations. See Note 3 to the Consolidated Financial Statements inPart II, Item 8 of this report for additional information.
41
Abaxis, Inc. Form 10-K
Total Revenues – Continuing Operations
Revenues by Product Category. The following table and the discussion that follows, presents revenues by productcategory and represents our results from continuing operations during fiscal 2016, 2015 and 2014 (in thousands,except percentages):
Revenues by Product Category
Year Ended March 31,
Change2015 to 2016
Change2014 to 2015
DollarChange
PercentChange
DollarChange
PercentChange2016 2015 2014
Instruments (1). . . . . . . . . . . . . . . $ 43,042 $ 48,649 $ 37,539 $ (5,607) (12)% $ 11,110 30%Percentage of total revenues . . 20% 24% 23%
Consumables (2) . . . . . . . . . . . . . 165,025 144,446 117,533 20,579 14% 26,913 23%Percentage of total revenues . . 75% 71% 73%
Other products (3) . . . . . . . . . . . . 10,760 9,348 6,809 1,412 15% 2,539 37%Percentage of total revenues . . 5% 5% 4%
Product sales, net. . . . . . . . . . . . . 218,827 202,443 161,881 16,384 8% 40,562 25%Percentage of total revenues . . 100% 100% 100%
Development and licensingrevenues . . . . . . . . . . . . . . . . . . 74 150 150 (76) (51)% — —%Percentage of total revenues . . <1% <1% <1%
Total revenues . . . . . . . . . . . . . . . $218,901 $202,593 $162,031 $ 16,308 8% $ 40,562 25%
(1) Instruments include chemistry analyzers, hematology instruments, VSpro specialty analyzers and i-STATanalyzers.
(2) Consumables include reagent discs, hematology reagent kits, VSpro specialty cartridges, i-STAT cartridges andrapid tests.
(3) Other products include products using the Orbos process and extended maintenance agreements.
Revenues by Geographic Region. The following table and the discussion that follows, presents our revenues bygeographic region and represents our results from continuing operations during fiscal 2016, 2015 and 2014 (inthousands, except percentages):
Revenues by Geographic Region
Year Ended March 31,
Change2015 to 2016
Change2014 to 2015
DollarChange
PercentChange
DollarChange
PercentChange2016 2015 2014
North America . . . . . . . . . . . . . . . $175,019 $163,308 $126,768 $ 11,711 7% $ 36,540 29%Percentage of total revenues . . 80% 81% 78%
Europe . . . . . . . . . . . . . . . . . . . . . 31,262 30,422 27,161 840 3% 3,261 12%Percentage of total revenues . . 14% 15% 17%
Asia Pacific and rest of theworld . . . . . . . . . . . . . . . . . . . . 12,620 8,863 8,102 3,757 42% 761 9%Percentage of total revenues . . 6% 4% 5%
Total revenues . . . . . . . . . . . . . . . $218,901 $202,593 $162,031 $ 16,308 8% $ 40,562 25%
Fiscal 2016 Compared to Fiscal 2015
North America. During fiscal 2016, total revenues in North America increased by 7%, or $11.7 million, as comparedto fiscal 2015. The change in total revenues in North America was primarily attributable to the following:
• Total revenues from our Piccolo chemistry analyzers and medical reagent discs in North America increased by3%, or $0.6 million, primarily attributable to an increase in medical reagent discs sold to Abbott, resulting froman expanded installed base of Piccolo chemistry analyzers, partially offset by a decrease in the unit sales ofPiccolo chemistry analyzers sold to Abbott, which were higher in the third quarter of fiscal 2015 due to the Ebolaepidemic outbreak in late 2014.
42
Abaxis, Inc. Form 10-K
• Total sales of our VetScan chemistry analyzers and veterinary reagent discs in North America increased by 2%,or $1.9 million, primarily attributable to an increase in the unit sales of veterinary reagent discs due to anexpanded installed base of VetScan chemistry analyzers. The increase was partially offset by (a) a decrease inthe unit sales of VetScan chemistry analyzers due to higher sales in the prior period to VCA’s Animal Hospitalsresulting from a product supply agreement that we entered into in May 2014 and (b) higher sales of VetScanchemistry analyzers in the third quarter of fiscal 2015 from initial stocking orders to two additional distributors,Henry Schein Animal Health and Patterson Companies, Inc., starting in the third quarter of fiscal 2015.
• Total sales of our VetScan hematology instruments and hematology reagent kits in North America increased by8%, or $1.9 million, primarily attributable to an increase in the unit sales of hematology reagent kits due to anexpanded installed base of hematology instruments.
• Total sales of our VetScan VSpro specialty analyzers and related consumables, VetScan i-STAT analyzers andrelated consumables and VetScan rapid tests in North America increased by 31%, or $7.3 million, primarilyattributable to (a) higher sales of our VetScan Feline FeLV/FIV Rapid Test, which we introduced in fiscal 2015,(b) an increase in the unit sales of VetScan Canine Heartworm Rapid Test Kit and (c) an increase in the salesof VetScan rapid tests resulting from two additional distributors, Henry Schein Animal Health and PattersonCompanies, Inc., starting in the third quarter of fiscal 2015.
Europe. During fiscal 2016, total revenues in Europe increased by 3%, or $0.8 million, as compared to fiscal 2015,primarily attributable to an increase in rental income from veterinary instruments rented by customers in the UnitedKingdom starting in the third quarter of fiscal 2015, resulting from our acquisition of QCR and Trio Diagnostics. Theincrease was partially offset by a decrease in revenues from veterinary reagent discs due to the impact of a lowerexchange rate between the Euro and U.S. dollar.
Asia Pacific and rest of the world. During fiscal 2016, total revenues in Asia Pacific and rest of the world increasedby 42%, or $3.8 million, as compared to fiscal 2015. Revenues from Piccolo chemistry analyzers and medical reagentdiscs increased by 160%, or $2.4 million, primarily attributable to sales of Piccolo chemistry analyzers to FuzhouKelian Medical Devices, Ltd., a point-of-care diagnostics distributor based in China. Revenues from veterinaryinstruments increased by 28%, or $0.7 million, primarily attributable to an increase in the unit sales of VetScanchemistry analyzers and VetScan hematology instruments to various distributors. Revenues from veterinaryconsumables increased by 13%, or $0.6 million, primarily attributable to an increase in the unit sales of veterinaryreagent discs to a distributor.
Significant concentrations. During fiscal 2016, three distributors in the United States, MWI, Patterson Companies,Inc. and Abbott, accounted for 20%, 11% and 10%, respectively, and one distributor in both the United States andEurope, Henry Schein, Inc., accounted for 13% of our total worldwide revenues. Two distributors in the UnitedStates, MWI and Abbott, accounted for 19% and 11%, respectively, of our total worldwide revenues in fiscal 2015.Starting in the second quarter of fiscal 2016, our revenues from Patterson Companies, Inc. include both Patterson’sveterinary business and Animal Health International, Inc., as a result of Patterson’s acquisition of Animal HealthInternational, Inc. Starting in fiscal 2016, our revenues from Henry Schein, Inc., include both Henry Schein, Inc. andscil animal care company GmbH, as a result of Henry Schein Inc.’s acquisition of scil animal care company GmbHin Europe.
Fiscal 2015 Compared to Fiscal 2014
North America. During fiscal 2015, total revenues in North America increased by 29%, or $36.5 million, as comparedto fiscal 2014. The change in total revenues in North America was primarily attributable to the following:
• Total revenues from our Piccolo chemistry analyzers and medical reagent discs in North America increased by29%, or $5.4 million, primarily attributable to an increase in the sales volume of Piccolo chemistry analyzersand medical reagent discs sold to Abbott. The increase in the sales volume of medical reagent discs sold wasprimarily attributable to an expanded installed base of Piccolo chemistry analyzers.
• Total sales of our VetScan chemistry analyzers and veterinary reagent discs in North America increased by 36%,or $22.4 million, primarily attributable to (a) sales of VetScan chemistry analyzers to VCA’s Animal Hospitalsresulting from a product supply agreement that we entered into in May 2014, (b) sales of VetScan chemistryanalyzers to Henry Schein Animal Health and Patterson Veterinary Supply, both resulting from distribution
43
Abaxis, Inc. Form 10-K
agreements that we entered in October 2014 and (c) an increase in the sales volume of veterinary reagent discsdue to an expanded installed base. These increases were partially offset by distributor rebate incentives programsoffered in connection with sales of VetScan chemistry analyzers during fiscal 2015.
• Total sales of our VetScan hematology instruments and hematology reagent kits in North America increased by36%, or $6.1 million, primarily attributable to (a) sales of VetScan hematology instruments as initial stockingorders to Henry Schein Animal Health and Patterson Veterinary Supply during the second half of fiscal 2015 and(b) an increase in the sales volume of hematology reagent kits due to an expanded installed base. These increaseswere partially offset by (a) lower unit sales of VetScan hematology instruments in the first half of fiscal 2015to balance the inventory level in the distribution channel, sales of which were in line with in-clinic sales startingin the third quarter of fiscal 2015 and (b) distributor rebate incentives programs offered in connection with salesof VetScan hematology instruments during fiscal 2015.
• Total sales of our VetScan VSpro specialty analyzers and related consumables, VetScan i-STAT analyzers andrelated consumables and VetScan rapid tests in North America increased by 3%, or $0.7 million, primarilyattributable to (a) sales of two new rapid tests, VetScan Feline FeLV/FIV Rapid Test and VetScan CanineEhrlichia Rapid Test during fiscal 2015 and (b) sales of VetScan rapid tests to Henry Schein Animal Health andPatterson Veterinary Supply during the second half of fiscal 2015. These increases were partially offset by lowerunit sales of VetScan i-STAT analyzers in the first half of fiscal 2015 to balance the inventory level in thedistribution channel, sales of which were in line with in-clinic sales starting in the third quarter of fiscal 2015.
• Revenues from other products in North America increased by 32%, or $1.9 million, primarily attributable todeferred revenue recognized ratably over the life of extended maintenance contracts offered to customers in theform of free services in connection with the sale of our instruments. In October 2013, we prospectively changedthe standard warranty obligations on certain instruments sold from three to five years, which resulted in adecrease in maintenance contracts offered to customers in the form of free services in connection with the saleof our instruments.
Europe. During fiscal 2015, total revenues in Europe increased by 12%, or $3.3 million, as compared to fiscal 2014.The change in total revenues in Europe was primarily attributable to the following:
• Revenues from Piccolo chemistry analyzers and medical reagent discs increased by 16%, or $1.0 million,primarily attributable to an increase in the sales volume of Piccolo chemistry analyzers to various distributorsduring fiscal 2015.
• Revenues from VetScan chemistry analyzers and veterinary reagent discs increased by 8%, or $1.4 million,primarily attributable to an increase in the sales volume of veterinary reagent discs due to an expanded installedbase, partially offset by (a) lower average selling prices of VetScan chemistry analyzers and (b) the impact ofa lower exchange rate between the Euro and U.S. dollar during the second half of fiscal 2015 resulting in adecrease in the dollar value of the Euro sales of veterinary reagent discs compared to the rate in effect in fiscal2014.
• Revenues from other products increased by 80%, or $0.6 million, primarily due to an increase in other veterinaryproducts sold to customers in the United Kingdom.
Asia Pacific and rest of the world. During fiscal 2015, total revenues in Asia Pacific and rest of the world increasedby 9%, or $0.8 million, as compared to fiscal 2014. The change in total revenues in Asia Pacific and rest of the worldwas primarily attributable to the following:
• Revenues from Piccolo chemistry analyzers and medical reagent discs increased by 49%, or $0.5 million,primarily attributable to an increase in the sales volume of Piccolo chemistry analyzers to two distributors andan increase in the sales volume of medical reagent discs to two distributors.
• Revenues from veterinary instruments decreased by 11%, or $0.3 million, primarily attributable to a decreasein the sales volume of VetScan chemistry analyzers to various distributors. Revenues from veterinaryconsumables increased by 14%, or $0.6 million, primarily attributable to an increase in the sales volume ofveterinary reagent discs to a distributor.
Significant concentrations. Two distributors in the United States, MWI and Abbott, accounted for 19% and 11%,respectively, of our total worldwide revenues in fiscal 2015. Two distributors in the United States, MWI and Abbott,accounted for 19% and 10%, respectively, of our total worldwide revenues in fiscal 2014.
44
Abaxis, Inc. Form 10-K
Segment Results – Continuing Operations
Total Revenues, Cost of Revenues and Gross Profit by Segment. We identify our reportable segments as thosecustomer groups that represent more than 10% of our combined revenue or gross profit or loss of all reportedoperating segments. We manage our business on the basis of the following two reportable segments: (i) the medicalmarket and (ii) the veterinary market, which are based on the products sold by market and customer group.
Fiscal 2016 Compared to Fiscal 2015
The following table and the discussion that follows presents revenues, cost of revenues, gross profit and percentageof revenues by operating segments and from certain unallocated items and represents our results from continuingoperations for fiscal 2016 and 2015 (in thousands, except percentages):
Year Ended March 31, Change
2016Percent of
Revenues (1) 2015Percent of
Revenues (1)Dollar
ChangePercentChange
Revenues:Medical Market . . . . . . . . . . . . . . . . . $ 37,845 100% $ 35,364 100% $ 2,481 7%
Percentage of total revenues . . . . . 17% 17%Veterinary Market. . . . . . . . . . . . . . . . 177,667 100% 164,018 100% 13,649 8%
Percentage of total revenues . . . . . 81% 81%Other (2) . . . . . . . . . . . . . . . . . . . . . . . 3,389 3,211 178 6%
Percentage of total revenues . . . . . 2% 2%
Total revenues. . . . . . . . . . . . . . . 218,901 202,593 16,308 8%
Cost of revenues:Medical Market . . . . . . . . . . . . . . . . . 19,832 52% 18,730 53% 1,102 6%Veterinary Market. . . . . . . . . . . . . . . . 75,688 43% 74,752 46% 936 1%Other (2) . . . . . . . . . . . . . . . . . . . . . . . 129 141 (12) (9)%
Total cost of revenues . . . . . . . . 95,649 93,623 2,026 2%
Gross profit:Medical Market . . . . . . . . . . . . . . . . . 18,013 48% 16,634 47% 1,379 8%Veterinary Market. . . . . . . . . . . . . . . . 101,979 57% 89,266 54% 12,713 14%Other (2) . . . . . . . . . . . . . . . . . . . . . . . 3,260 3,070 190 6%
Gross profit. . . . . . . . . . . . . . . . . $123,252 $108,970 $14,282 13%
(1) The percentage reported is based on revenues by operating segment.
(2) Represents unallocated items, not specifically identified to any particular business segment.
Medical Market
Revenues for Medical Market Segment
During fiscal 2016, total revenues in the medical market increased by 7%, or $2.5 million, as compared to fiscal 2015.The change in the medical market segment was primarily attributable to the following:
• Total revenues from Piccolo chemistry analyzers decreased by 4%, or $0.4 million, during fiscal 2016 ascompared to fiscal 2015, primarily attributable to a decrease in the unit sales of Piccolo chemistry analyzers soldto Abbott, which were higher in the third quarter of fiscal 2015 due to the Ebola epidemic outbreak in late 2014.The decrease was partially offset by sales of Piccolo chemistry analyzers to Fuzhou Kelian Medical Devices,Ltd., a point-of-care diagnostics distributor based in China, during the third quarter of fiscal 2016.
• Total revenues from medical reagent discs increased by 14%, or $3.1 million, during fiscal 2016 as comparedto fiscal 2015, primarily attributable to an increase in the sales volume of medical reagent discs sold in NorthAmerica to Abbott, resulting from an expanded installed base of Piccolo chemistry analyzers.
45
Abaxis, Inc. Form 10-K
Gross Profit for Medical Market Segment
Gross profit for the medical market segment increased by 8%, or $1.4 million, during fiscal 2016 as compared tofiscal 2015. Gross profit percentages for the medical market segment during fiscal 2016 and 2015 were 48% and47%, respectively. In absolute dollars, the increase in gross profit was primarily attributable to an increase in the unitsales of medical reagent discs, partially offset by lower average selling prices of Piccolo chemistry analyzers. Theincrease in gross profit percentage was impacted by an increase in the unit sales of medical reagent discs, which havea higher margin contribution.
Veterinary Market
Revenues for Veterinary Market Segment
During fiscal 2016, total revenues in the veterinary market increased by 8%, or $13.6 million, as compared to fiscal2015. The change in the veterinary market segment was primarily attributable to the following:
• Total revenues from veterinary instruments decreased by 14%, or $5.2 million, during fiscal 2016 as comparedto fiscal 2015, primarily attributable to (a) a decrease in the unit sales of VetScan chemistry analyzers due tohigher sales in the prior period to VCA’s Animal Hospitals resulting from a product supply agreement that weentered into in May 2014 and (b) higher sales of VetScan chemistry analyzers in the third quarter of fiscal 2015from initial stocking orders to two additional distributors, Henry Schein Animal Health and PattersonCompanies, Inc., starting in the third quarter of fiscal 2015. These decreases were partially offset by an increasein the unit sales of VetScan chemistry analyzers and VetScan hematology instruments to various distributors inAsia Pacific and rest of the world.
• Total revenues from consumables in the veterinary market increased by 14%, or $17.5 million, during fiscal2016 as compared to fiscal 2015, primarily attributable to (a) an increase in the unit sales of veterinary reagentdiscs and hematology reagent kits in North America due to an expanded instrument installed base, (b) anincrease in the unit sales of veterinary reagent discs to a distributor in Asia Pacific and rest of the world,(c) higher sales of our VetScan Feline FeLV/FIV Rapid Test, which we introduced in fiscal 2015, (d) an increasein the unit sales of VetScan Canine Heartworm Rapid Test Kit and (e) an increase in the sales of VetScan rapidtests in North America resulting from two additional distributors, Henry Schein Animal Health and PattersonCompanies, Inc., starting in the third quarter of fiscal 2015. These increases were partially offset by a decreasein revenues from veterinary reagent discs due to the impact of a lower exchange rate between the Euro andU.S. dollar.
• Total revenues from other products in the veterinary market increased by 32%, or $1.4 million, during fiscal2016 as compared to fiscal 2015, primarily attributable to an increase in rental income from veterinaryinstruments rented by customers in the United Kingdom starting in the third quarter of fiscal 2015, resultingfrom our acquisition of QCR and Trio Diagnostics.
Gross Profit for Veterinary Market Segment
Gross profit for the veterinary market segment increased by 14%, or $12.7 million, during fiscal 2016 as comparedto fiscal 2015. Gross profit percentages for the veterinary market segment during fiscal 2016 and 2015 were 57% and54%, respectively. In absolute dollars, the net increase in gross profit was primarily attributable to (a) an increase inthe unit sales of veterinary reagent discs, VetScan hematology reagent kits and VetScan rapid tests and (b) lowermanufacturing costs of veterinary reagent discs. The increase in gross profit percentage was impacted by changes inour product mix and an increase in the unit sales of veterinary reagent discs, which have a higher margin contribution.
Other
Our other category primarily consists of products sold using our patented Orbos Discrete Lyophilization Process. Thechange in gross profit in our other category was not significant during fiscal 2016, as compared to fiscal 2015.
46
Abaxis, Inc. Form 10-K
Fiscal 2015 Compared to Fiscal 2014
The following table and the discussion that follows presents revenues, cost of revenues, gross profit and percentageof revenues by operating segments and from certain unallocated items and represents our results from continuingoperations for fiscal 2015 and 2014 (in thousands, except percentages):
Year Ended March 31, Change
2015Percent of
Revenues (1) 2014Percent of
Revenues (1)Dollar
ChangePercentChange
Revenues:Medical Market . . . . . . . . . . . . . . . . . $ 35,364 100% $ 28,134 100% $ 7,230 26%
Percentage of total revenues . . . . . 17% 17%Veterinary Market. . . . . . . . . . . . . . . . 164,018 100% 130,859 100% 33,159 25%
Percentage of total revenues . . . . . 81% 81%Other (2) . . . . . . . . . . . . . . . . . . . . . . . 3,211 3,038 173 6%
Percentage of total revenues . . . . . 2% 2%
Total revenues. . . . . . . . . . . . . . . 202,593 162,031 40,562 25%
Cost of revenues:Medical Market . . . . . . . . . . . . . . . . . 18,730 53% 15,623 56% 3,107 20%Veterinary Market. . . . . . . . . . . . . . . . 74,752 46% 62,350 48% 12,402 20%Other (2) . . . . . . . . . . . . . . . . . . . . . . . 141 108 33 31%
Total cost of revenues . . . . . . . . 93,623 78,081 15,542 20%
Gross profit:Medical Market . . . . . . . . . . . . . . . . . 16,634 47% 12,511 44% 4,123 33%Veterinary Market. . . . . . . . . . . . . . . . 89,266 54% 68,509 52% 20,757 30%Other (2) . . . . . . . . . . . . . . . . . . . . . . . 3,070 2,930 140 5%
Gross profit. . . . . . . . . . . . . . . . . $108,970 $ 83,950 $25,020 30%
(1) The percentage reported is based on revenues by operating segment.
(2) Represents unallocated items, not specifically identified to any particular business segment.
Medical Market
Revenues for Medical Market Segment
During fiscal 2015, total revenues in the medical market increased by 26%, or $7.2 million, as compared to fiscal2014. The change in the medical market segment was primarily attributable to the following:
• Total revenues from Piccolo chemistry analyzers increased by 75%, or $4.6 million, during fiscal 2015 ascompared to fiscal 2014, primarily attributable to an increase in the sales volume of Piccolo chemistry analyzerssold in North America to Abbott, sales to various distributors in Europe and sales to two distributors in AsiaPacific and rest of the world.
• Total revenues from medical reagent discs increased by 12%, or $2.4 million, during fiscal 2015 as comparedto fiscal 2014, primarily attributable to an increase in the sales volume of medical reagent discs sold in NorthAmerica to Abbott as a result of an expanded installed base of Piccolo chemistry analyzers and sales to twodistributors in Asia Pacific and rest of the world.
Gross Profit for Medical Market Segment
Gross profit for the medical market segment increased by 33%, or $4.1 million, during fiscal 2015 as compared tofiscal 2014. Gross profit percentages for the medical market segment during fiscal 2015 and 2014 were 47% and44%, respectively. In absolute dollars, the increase in gross profit was primarily attributable to an increase in the salesvolume of Piccolo chemistry analyzers and medical reagent discs and lower manufacturing costs of Piccolo chemistryanalyzers and medical reagent discs. The increase in gross profit percentage was primarily attributable to an increasein the sales volume of Piccolo chemistry analyzers and medical reagent discs.
47
Abaxis, Inc. Form 10-K
Veterinary Market
Revenues for Veterinary Market Segment
During fiscal 2015, total revenues in the veterinary market increased by 25%, or $33.2 million, as compared to fiscal2014. The change in the veterinary market segment was primarily attributable to the following:
• Total revenues from veterinary instruments increased by 21%, or $6.5 million, during fiscal 2015 as comparedto fiscal 2014, primarily attributable to (a) sales of VetScan chemistry analyzers to VCA’s Animal Hospitals,(b) sales of VetScan chemistry analyzers to two new distributors, Henry Schein Animal Health and PattersonVeterinary Supply and (c) sales of VetScan hematology instruments as initial stocking orders to Henry ScheinAnimal Health and Patterson Veterinary Supply during the second half of fiscal 2015. These increases werepartially offset by (a) distributor rebate incentives programs offered in connection with sales of VetScanchemistry analyzers and VetScan hematology instruments in North America during fiscal 2015, (b) loweraverage selling prices of VetScan chemistry analyzers sold in Europe, (c) a decrease in the sales volume ofVetScan chemistry analyzers to various distributors in Asia Pacific and rest of the world and (d) lower unit salesof VetScan hematology instruments and VetScan i-STAT analyzers in the first half of fiscal 2015 to balance theinventory level in the distribution channel, sales of which were in line with in-clinic sales starting in the thirdquarter of fiscal 2015.
• Total revenues from consumables in the veterinary market increased by 25%, or $24.6 million, during fiscal2015 as compared to fiscal 2014, primarily attributable to (a) an increase in the sales volume of veterinaryreagent discs and hematology reagent kits, both due to an expanded installed base in North America, (b) anincrease in the sales volume of veterinary reagent discs to a distributor in Asia Pacific and rest of the world,(c) sales of two new rapid tests, VetScan Feline FeLV/FIV Rapid Test and VetScan Canine Ehrlichia Rapid Testduring fiscal 2015 and (d) sales of VetScan rapid tests to Henry Schein Animal Health and Patterson VeterinarySupply during the second half of fiscal 2015. These increases were partially offset by the impact of a lowerexchange rate between the Euro and U.S. dollar during the second half of fiscal 2015 resulting in a decrease inthe dollar value of the Euro sales of veterinary reagent discs compared to the rate in effect in fiscal 2014.
• Total revenues from other products in the veterinary market increased by 95%, or $2.1 million, during fiscal2015 as compared to fiscal 2014, primarily attributable to (a) deferred revenue recognized ratably over the lifeof extended maintenance contracts offered to customers in the form of free services in connection with the saleof our instruments and (b) an increase in other veterinary products sold to customers in the United Kingdom.
Gross Profit for Veterinary Market Segment
Gross profit for the veterinary market segment increased by 30%, or $20.8 million, during fiscal 2015 as comparedto fiscal 2014. Gross profit percentages for the veterinary market segment during fiscal 2015 and 2014 were 54% and52%, respectively. In absolute dollars, the net increase in gross profit was primarily attributable to an increase in thesales volume of VetScan chemistry analyzers and veterinary reagent discs and lower manufacturing costs of VetScanchemistry analyzers and veterinary reagent discs. The increase in gross profit percentage was primarily attributableto an increase in the sales volume of veterinary reagent discs, which have a higher margin contribution.
Other
Our other category primarily consists of products sold using our patented Orbos Discrete Lyophilization Process. Thechange in gross profit in our other category was not significant during fiscal 2015, as compared to fiscal 2014.
Cost of Revenues – Continuing Operations
The following table and the discussion that follows presents our cost of revenues and represents our results fromcontinuing operations for fiscal 2016, 2015 and 2014 (in thousands, except percentages):
Year Ended March 31,
Change2015 to 2016
Change2014 to 2015
DollarChange
PercentChange
DollarChange
PercentChange2016 2015 2014
Cost of revenues . . . . . . . . . . . . . $ 95,649 $ 93,623 $ 78,081 $ 2,026 2% $ 15,542 20%Percentage of total revenues . . . . 44% 46% 48%
48
Abaxis, Inc. Form 10-K
Cost of revenues includes the cost of materials, direct labor costs, costs associated with manufacturing, assembly,packaging, warranty repairs, test and quality assurance for our instruments and consumables and manufacturingoverhead, including costs of personnel and equipment associated with manufacturing support.
Fiscal 2016 Compared to Fiscal 2015
The increase in cost of revenues, in absolute dollars, during fiscal 2016, as compared to fiscal 2015, was primarilyattributable by an increase in the unit sales of medical and veterinary reagent discs and VetScan rapid tests, partiallyoffset by a decrease in the unit sales of Piccolo and VetScan chemistry analyzers. The decrease in cost of revenues,as a percentage of total revenues, during fiscal 2016 as compared to fiscal 2015, was primarily due to changes in ourproduct mix and an increase in the unit sales of medical and veterinary reagent discs, which have a higher margincontribution.
Fiscal 2015 Compared to Fiscal 2014
The increase in cost of revenues, in absolute dollars, during fiscal 2015, as compared to fiscal 2014, was primarilyattributable to higher unit sales of chemistry analyzers and reagent discs, partially offset by lower manufacturing costsof chemistry analyzers and reagent discs. The decrease in cost of revenues, as a percentage of total revenues, duringfiscal 2015 as compared to fiscal 2014, was primarily due to an increase in the sales volume of reagent discs.
For our manufacturing operations, while we have an ongoing cost improvement program to reduce material andcomponent costs and are implementing design changes and process improvements, any cost reductions and designand process improvements may be partially offset by increases in other manufacturing costs in subsequent periods.
Gross Profit – Continuing Operations
The following table and the discussion that follows presents our gross profit and represents our results fromcontinuing operations for fiscal 2016, 2015 and 2014 (in thousands, except percentages):
Year Ended March 31,
Change2015 to 2016
Change2014 to 2015
DollarChange
PercentChange
DollarChange
PercentChange2016 2015 2014
Total gross profit . . . . . . . . . . . . . $123,252 $ 108,970 $83,950 $ 14,282 13% $ 25,020 30%Total gross margin . . . . . . . . . . . . 56% 54% 52%
Fiscal 2016 Compared to Fiscal 2015
Gross profit in fiscal 2016 increased by 13%, or $14.3 million, as compared to fiscal 2015, primarily attributable to(a) an increase in the unit sales of medical and veterinary reagent discs, VetScan hematology reagent kits and VetScanrapid tests and (b) lower manufacturing costs of veterinary reagent discs, partially offset by lower average sellingprices of Piccolo chemistry analyzers. The increase in gross margin was impacted by changes in our product mix andan increase in the unit sales of medical and veterinary reagent discs, which have a higher margin contribution.
Fiscal 2015 Compared to Fiscal 2014
Gross profit in fiscal 2015 increased by 30%, or $25.0 million, as compared to fiscal 2014, primarily attributable tohigher unit sales of chemistry analyzers and reagent discs and lower manufacturing costs of chemistry analyzers andreagent discs. The increase in gross profit percentage was primarily attributable to higher unit sales of chemistryanalyzers and reagent discs.
49
Abaxis, Inc. Form 10-K
Research and Development – Continuing Operations
The following table and the discussion that follows presents our research and development expenses and representsour results from continuing operations for fiscal 2016, 2015 and 2014 (in thousands, except percentages):
Year Ended March 31,
Change2015 to 2016
Change2014 to 2015
DollarChange
PercentChange
DollarChange
PercentChange2016 2015 2014
Research and developmentexpenses . . . . . . . . . . . . . . . . . . $ 18,388 $ 16,327 $ 13,647 $ 2,061 13% $ 2,680 20%
Percentage of total revenues . . . . 8% 8% 8%
Research and development expenses consist of personnel costs (including salaries, benefits and share-basedcompensation expense), consulting expenses and materials and related expenses associated with the development ofnew tests and test methods, clinical trials, product improvements and optimization and enhancement of existingproducts and expenses related to regulatory and quality assurance. Research and development expenses are primarilybased on the project activities planned and the level of spending depends on budgeted expenditures. Research anddevelopment expenses for the periods presented above are related primarily to new product development andenhancement of existing products in both the medical and veterinary markets, including the development ofelectronic connectivity technology and additional projects related to high sensitivity immunoassay.
Fiscal 2016 Compared to Fiscal 2015
Research and development expenses increased by 13%, or $2.1 million, in fiscal 2016 as compared to fiscal 2015.The increase was primarily attributable to expenses related to new product development and enhancement of existingproducts in both the medical and veterinary markets. Share-based compensation expense included in research anddevelopment expenses during fiscal 2016 and 2015 was $2.1 million and $1.6 million, respectively.
Fiscal 2015 Compared to Fiscal 2014
Research and development expenses increased by 20%, or $2.7 million, in fiscal 2015 as compared to fiscal 2014.The increase was primarily attributable to (a) an increase in employee bonus compensation expense due to strongercompany performance and meeting significantly more company performance targets in fiscal 2015 as compared tofiscal 2014, (b) an increase in share-based compensation expense and (c) expenses related to new productdevelopment and enhancement of existing products in both the medical and veterinary markets, including systemfeasibility testing costs associated with our research and development diagnostic agreement with LamdaGenCorporation, which we entered into in fiscal 2014. Share-based compensation expense included in research anddevelopment expenses during fiscal 2015 and 2014 was $1.6 million and $1.1 million, respectively.
We anticipate the dollar amount of research and development expenses to increase in fiscal 2017 from fiscal 2016but remain consistent as a percentage of total revenues, as we complete new products and enhance existing productsfor both the medical and veterinary markets.
Sales and Marketing – Continuing Operations
The following table and the discussion that follows presents our sales and marketing expenses and represents ourresults from continuing operations for fiscal 2016, 2015 and 2014 (in thousands, except percentages):
Year Ended March 31,
Change2015 to 2016
Change2014 to 2015
DollarChange
PercentChange
DollarChange
PercentChange2016 2015 2014
Sales and marketing expenses. . . $ 42,526 $ 42,147 $ 34,742 $ 379 1% $ 7,405 21%Percentage of total revenues . . . . 19% 21% 21%
Sales and marketing expenses consist of personnel costs (including salaries, benefits and share-based compensationexpense), commissions and travel-related expenses for personnel engaged in selling, costs associated withadvertising, lead generation, marketing programs, trade shows and services related to customer and technical support.
50
Abaxis, Inc. Form 10-K
Fiscal 2016 Compared to Fiscal 2015
Sales and marketing expenses in fiscal 2016 increased by 1%, or $0.4 million, as compared to fiscal 2015, primarilyattributable to increased promotional and marketing spending and increased spending due to our acquisition of QCRand Trio Diagnostics in the third quarter of fiscal 2015, partially offset by a decrease in employee bonus andcommission expense based on meeting lower company performance targets during fiscal 2016. Share-basedcompensation expense included in sales and marketing expenses during fiscal 2016 and 2015 was $3.0 million and$2.4 million, respectively.
Fiscal 2015 Compared to Fiscal 2014
Sales and marketing expenses in fiscal 2015 increased by 21%, or $7.4 million, as compared to fiscal 2014. Theincrease was primarily attributable to increased personnel-related expenses, including an increase in commissions, anincrease in employee bonus compensation expense due to stronger company performance and meeting significantlymore company performance targets in fiscal 2015 as compared to fiscal 2014 and an increase in share-basedcompensation expense. Share-based compensation expense included in sales and marketing expenses during fiscal2015 and 2014 was $2.4 million and $1.9 million, respectively.
General and Administrative – Continuing Operations
The following table and the discussion that follows presents our general and administrative expenses and representsour results from continuing operations for fiscal 2016, 2015 and 2014 (in thousands, except percentages):
Year Ended March 31,
Change2015 to 2016
Change2014 to 2015
DollarChange
PercentChange
DollarChange
PercentChange2016 2015 2014
General and administrativeexpenses . . . . . . . . . . . . . . . . . . $ 15,984 $ 16,192 $ 11,333 $ (208) (1)% $ 4,859 43%
Percentage of total revenues . . . . 7% 8% 7%
General and administrative expenses consist of personnel costs (including salaries, benefits and share-basedcompensation expense), and expenses for outside professional services related to general corporate functions,including accounting and legal, and other general and administrative expenses.
Fiscal 2016 Compared to Fiscal 2015
General and administrative expenses in fiscal 2016 decreased by 1%, or $0.2 million, as compared to fiscal 2015,primarily attributable to (a) a decrease in employee bonus expense based on meeting lower company performancetargets during fiscal 2016 and (b) higher costs in the third quarter of fiscal 2015 due to our acquisition of QCR andTrio, partially offset by an increase in share-based compensation expense. Share-based compensation expenseincluded in general and administrative expenses during fiscal 2016 and 2015 was $4.6 million and $3.6 million,respectively.
Fiscal 2015 Compared to Fiscal 2014
General and administrative expenses in fiscal 2015 increased by 43%, or $4.9 million, as compared to fiscal 2014,primarily attributable to (a) an increase in employee bonus compensation expense due to stronger companyperformance and meeting significantly more company performance targets in fiscal 2015 as compared to fiscal 2014,(b) costs to acquire QCR and Trio, (c) an increase in share-based compensation expense and (d) other expenses tosupport our ongoing growth. Share-based compensation expense included in general and administrative expensesduring fiscal 2015 and 2014 was $3.6 million and $3.3 million, respectively.
Interest and Other Income (Expense), Net – Continuing Operations
The following table and the discussion that follows presents our interest and other income (expense), net andrepresents our results from continuing operations for fiscal 2016, 2015 and 2014 (in thousands, except percentages):
Year Ended March 31, Change
2016 2015 2014 2015-2016 2014-2015
Interest and other income (expense), net. . . . . . . . . . . . . $ 793 $ (1,262) $ 994 $ 2,055 $ (2,256)
51
Abaxis, Inc. Form 10-K
Interest and other income (expense), net consists primarily of interest earned on cash and cash equivalents andinvestments, foreign currency exchange gains and losses and our equity in net income (loss) of an unconsolidatedaffiliate.
Fiscal 2016 Compared to Fiscal 2015
Interest and other income (expense), net primarily consisted of foreign currency gains and (losses) of $0.1 millionand $(1.8) million for fiscal 2016 and fiscal 2015, respectively, primarily attributable to foreign currency exchangerate fluctuations.
Fiscal 2015 Compared to Fiscal 2014
Interest and other income (expense), net primarily consisted of foreign currency gains and (losses) of $(1.8) millionand $0.5 million for fiscal 2015 and fiscal 2014, respectively. The foreign currency exchange loss in fiscal 2015 wasprimarily attributable to net unfavorable foreign currency exchange rates due to the effect of a strong U.S. dollar.
Income Tax Provision – Continuing Operations
The following table and the discussion that follows presents our income tax provision and represents our results fromcontinuing operations for fiscal 2016, 2015 and 2014 (in thousands, except percentages):
Year Ended March 31,
2016 2015 2014
Income tax provision . . . . . . . . . . . . . . . . . . . . . . . . . . . . . . . . . . . . . . . . . $ 16,073 $ 12,239 $ 8,993Effective tax rate . . . . . . . . . . . . . . . . . . . . . . . . . . . . . . . . . . . . . . . . . . . . . 34% 37% 36%
Fiscal 2016 Compared to Fiscal 2015
For fiscal 2016 and 2015, our income tax provision was $16.1 million, based on an effective tax rate of 34%, and$12.2 million, based on an effective tax rate of 37%, respectively. The dollar increase in the income tax provisionduring fiscal 2016, as compared to fiscal 2015, was attributable to higher pre-tax income. The decrease in theeffective tax rate during fiscal 2016, as compared to fiscal 2015, was impacted by the retroactive reinstatement offederal research and development tax credits, foreign tax credits which reduce federal income tax expenses and areduction in non-deductible compensation.
We expect our effective tax rate will be approximately 37% for federal, foreign and various state tax jurisdictions infiscal 2017, compared to an effective tax rate of 34% in fiscal 2016. The expected effective tax rate of 37% in fiscal2017 is primarily due to a reduction in federal research and development tax credits, a reduction in foreign tax creditsand an increase in non-deductible compensation.
Fiscal 2015 Compared to Fiscal 2014
For fiscal 2015, our income tax provision was $12.2 million, based on an effective tax rate of 37%, as compared to$9.0 million, based on an effective tax rate of 36%, for fiscal 2014. The dollar increase in the income tax provisionduring fiscal 2015, as compared to fiscal 2014, was attributable to higher pre-tax income. The increase in the effectivetax rate during fiscal 2015, as compared to fiscal 2014, was primarily attributable to an increase in non-recurringnon-deductible expenses.
We did not have any unrecognized tax benefits as of March 31, 2016. During fiscal 2016, 2015 and 2014, we did notrecognize any interest or penalties related to unrecognized tax benefits.
Discontinued Operations
On March 18, 2015, we entered into an asset purchase agreement (‘‘APA’’) with Antech pursuant to which we soldsubstantially all of the assets of our AVRL business. The sale transaction closed on March 31, 2015. The totalpurchase price under the APA was $21.0 million in cash. During the fourth quarter of fiscal 2015, we received$20.1 million in cash proceeds and we recorded a gain on sale of discontinued operations, net of tax, of $7.7 million.During the fourth quarter of fiscal 2016, we recorded a pre-tax gain of $0.9 million ($0.6 million after-tax) on saleof discontinued operations, upon meeting certain conditions by the first anniversary of the closing date.
52
Abaxis, Inc. Form 10-K
Results from discontinued operations, net of tax, were net losses of $3,000, $1.2 million and $2.0 million in fiscal2016, 2015 and 2014, respectively. See Note 3 to the Consolidated Financial Statements in Part II, Item 8 of thisreport for additional information.
Liquidity and Capital Resources – Continuing and Discontinued Operations
Cash, Cash Equivalents and Investments
The following table summarizes our cash, cash equivalents and short-term and long-term investments at March 31,2016, 2015 and 2014, (in thousands, except percentages):
March 31,2016 2015 2014
Cash and cash equivalents . . . . . . . . . . . . . . . . . . . . . . . . . . . . . . . . . . . . . $ 88,323 $ 107,015 $ 73,589Short-term investments . . . . . . . . . . . . . . . . . . . . . . . . . . . . . . . . . . . . . . . . 41,474 26,109 29,102Long-term investments . . . . . . . . . . . . . . . . . . . . . . . . . . . . . . . . . . . . . . . . 22,458 24,181 18,491
Total cash, cash equivalents and investments . . . . . . . . . . . . . . . . . . . . $ 152,255 $ 157,305 $ 121,182
Percentage of total assets . . . . . . . . . . . . . . . . . . . . . . . . . . . . . . . . . . . . 56% 58% 56%
At March 31, 2016, we had net working capital of $183.0 million compared to $168.6 million at March 31, 2015.
Cash Flow Changes
Cash provided by (used in) operating, investing and financing activities during fiscal 2016, 2015 and 2014 were asfollows (in thousands):
Year Ended March 31,2016 2015 2014
Net cash provided by operating activities . . . . . . . . . . . . . . . . . . . . . . . . $ 28,056 $ 36,396 $ 35,572Net cash provided by (used in) investing activities . . . . . . . . . . . . . . . . (20,237) 10,093 (13,358)Net cash used in financing activities . . . . . . . . . . . . . . . . . . . . . . . . . . . . (26,627) (10,962) (4,045)Effect of exchange rate changes on cash and cash equivalents . . . . . . . 116 (2,101) 510
Net increase (decrease) in cash and cash equivalents. . . . . . . . . . . . . $ (18,692) $ 33,426 $ 18,679
Cash and cash equivalents at March 31, 2016 were $88.3 million compared to $107.0 million at March 31, 2015. Thedecrease in cash and cash equivalents during fiscal 2016 was primarily due to purchases of investments of$63.8 million, purchases of property and equipment of $5.2 million, payments made for tax withholdings related tonet share settlements of restricted stock units of $5.3 million, repurchases of common stock of $13.0 million andpayment of cash dividends totaling $10.0 million. The decrease was partially offset by net cash provided by operatingactivities of $28.1 million and proceeds from maturities and redemptions of investments of $49.0 million.
Our consolidated statements of cash flows includes the effect of exchange rate changes on cash and cash equivalentsand the net gains (losses) arising from transactions denominated in a currency other than the functional currency ofa location and the remeasurement of assets and liabilities of our wholly-owned subsidiaries, using the U.S. dollar asthe functional currency.
Cash Flows from Operating Activities
During fiscal 2016, we generated $28.1 million in cash from operating activities, compared to $36.4 million in fiscal2015. The cash provided by operating activities during fiscal 2016 was primarily the result of net income of$31.6 million during fiscal 2016, adjusted for the effects of non-cash adjustments including depreciation andamortization of $6.7 million and share-based compensation expense of $11.1 million, partially offset by a decreaseof $1.6 million related to excess tax benefits from share-based awards.
Other changes in operating activities during fiscal 2016 were as follows:
• Receivables, net increased by $6.1 million, from $29.0 million at March 31, 2015 to $35.1 million as ofMarch 31, 2016, primarily attributable to higher sales in the last month of the fourth quarter of fiscal 2016.
• Inventories decreased by $1.0 million from $36.2 million at March 31, 2015 to $35.1 million as of March 31,2016, primarily due to a decrease in the inventory levels of our finished goods as of March 31, 2016.
53
Abaxis, Inc. Form 10-K
• Prepaid expenses and other current assets increased by $3.5 million, from $2.9 million at March 31, 2015 to$6.4 million as of March 31, 2016, primarily attributable to the timing of estimated income taxes and theretroactive reinstatement of federal research and development tax credits and federal bonus depreciation.
• Current net deferred tax assets decreased by $1.8 million, from $6.6 million at March 31, 2015 to $4.8 millionas of March 31, 2016, primarily as a result of the timing for the deduction of reserves and accruals.
• Non-current net deferred tax assets increased by $0.5 million, from $3.4 million at March 31, 2015 to$3.9 million as of March 31, 2016, primarily as a result of the timing for the deduction of share-basedcompensation expenses.
• Other assets increased by $1.8 million from $0.1 million as of March 31, 2015 to $2.0 million, as of March 31,2016, primarily attributable to long-term receivables due to extended payment terms by customers under certainof our sales programs.
• Accrued payroll and related expenses decreased by $2.7 million, from $11.1 million at March 31, 2015 to$8.3 million as of March 31, 2016, primarily attributable to higher accrued bonus at March 31, 2015.
• Accrued taxes decreased by $3.7 million, from $4.8 million at March 31, 2015 to $1.1 million as of March 31,2016, primarily due to the timing of estimated income tax payments.
• Current liabilities of discontinued operations decreased by $5.4 million from $5.5 million at March 31, 2015 to$0.1 million as of March 31, 2016, primarily due to payments related to our cost obligations foremployee-related costs, including severance, contract termination and other associated costs in connection withthe sale of our AVRL business in March 2015.
• Other accrued liabilities, current, decreased by $0.4 million, from $9.8 million as of March 31, 2015 to$9.4 million as of March 31, 2016 and other liabilities, non-current, decreased by $0.9 million, from $1.8 millionat March 31, 2015 to $0.9 million as of March 31, 2016. The net current and non-current other liabilitiesdecreased primarily attributable to (a) a decrease in liabilities related to lower instrument sales and the types ofcustomer sales incentive programs offered during a promotional period and (b) the timing of our installmentpayment obligation related to our November 2014 acquisition of QCR and Trio.
• As of March 31, 2016 and 2015, the current portion of deferred revenue was $1.6 million and $1.3 million,respectively, and the non-current portion of deferred revenue was $2.3 million and $3.2 million, respectively.Net current and non-current deferred revenue decreased by $0.7 million from March 31, 2015 to March 31,2016, primarily attributable to deferred revenue recognized ratably over the life of extended maintenancecontracts offered to customers in the form of free services in connection with the sale of our instruments. InOctober 2013, we prospectively changed the standard warranty obligations on certain instruments sold fromthree to five years, which resulted in a decrease in maintenance contracts offered to customers in the form offree services in connection with the sale of our instruments.
• As of March 31, 2016 and 2015, the current portion of warranty reserve was $1.3 million and $1.4 million,respectively, and the non-current portion of warranty reserve was $1.9 million and $1.7 million, respectively. Netcurrent and non-current warranty reserve increased by $0.1 million. The change in current and non-currentwarranty reserve from March 31, 2015 to March 31, 2016 included an adjustment to pre-existing warranties of$0.2 million based on our historical experience and our projected performance rate of instruments. Warrantyreserve is primarily based on (a) the number of instruments in standard warranty, estimated product failure ratesand estimated repair costs and (b) an estimate of defective reagent discs and replacement costs of reagent discs.In October 2013, we prospectively changed the standard warranty obligations on certain instruments from threeto five years. The increase in the standard warranty obligation did not result in a material impact on our warrantyreserves or cost of revenues during the period. Management periodically evaluates the sufficiency of thewarranty provisions and makes adjustments when necessary. If an unusual performance rate related to warrantyclaims is noted, an additional warranty accrual may be assessed and recorded when a failure event is probableand the cost can be reasonably estimated.
We expect that cash provided by operating activities may fluctuate in future periods as a result of a number of factors,including fluctuations in our operating results, timing of product sales, accounts receivable collections performance,inventory and supply chain management, and the timing and amount of payments. Furthermore, we anticipate that
54
Abaxis, Inc. Form 10-K
we will incur incremental costs to support our future operations, including research and design costs related to thecontinuing development of our current and future products; clinical trials for our current and future products, andacquisition of capital equipment for our manufacturing facility.
Cash Flows from Investing Activities
Net cash used in investing activities during fiscal 2016 totaled $20.2 million, compared to net cash provided of$10.1 million during fiscal 2015. Cash used in investing activities during fiscal 2016 was primarily due to purchasesof investments in certificates of deposit, commercial paper and corporate bonds totaling $63.8 million, capitalexpenditures of $5.2 million and a $1.1 million cash installment payment obligation related to our November 2014acquisition of QCR and Trio, partially offset by proceeds from maturities and redemptions of investments incertificates of deposit, commercial paper, corporate bonds and municipal bonds of $49.0 million. The purchases ofcapital equipment primarily relate to increasing our manufacturing capacity and supporting our growth. We expectto continue to make significant capital expenditures as necessary in the normal course of our business.
Cash Flows from Financing Activities
Net cash used in financing activities during fiscal 2016 totaled $26.6 million, compared to net cash used of$11.0 million during fiscal 2015. Cash used in financing activities during fiscal 2016 was primarily due to paymentsmade for tax withholdings related to net share settlements of restricted stock units of $5.3 million, repurchases ofcommon stock of $13.0 million and cash dividend payments of $10.0 million, offset in part by net cash provided byfinancing activities from excess tax benefits from share-based awards of $1.6 million.
Dividend Payments
During fiscal 2016 and 2015 our total quarterly dividend payout was $10.0 million and $9.0 million, respectively.During fiscal 2014, we did not pay dividends on our outstanding common stock. The amount of quarterly dividendsdeclared with respect to the Company’s common stock during the past two fiscal years appears in Note 21 to theConsolidated Financial Statements in Part II, Item 8 of this report.
On April 27, 2016, our Board of Directors declared a cash dividend of $0.12 per share on our outstanding commonstock to be paid on June 17, 2016 to all shareholders of record as of the close of business on June 3, 2016. Futuredeclarations of quarterly dividends and the establishment of future record and payment dates are subject to the finaldetermination of our Board of Directors.
Share Repurchase Program
Between August 2011 and January 2012, our Board of Directors authorized the repurchase of up to a total of$55.0 million of our common stock. In July 2013, our Board of Directors approved a $12.3 million increase to ourexisting share repurchase program to a total of $67.3 million. As of March 31, 2016, $24.0 million of our commonstock was available for repurchase under our share repurchase program.
Since the share repurchase program began, through March 31, 2016, we have repurchased 1.6 million shares of ourcommon stock at a total cost of $43.3 million, including commission expense. During fiscal 2016, we repurchased325,000 shares of our common stock at a total cost of $13.0 million and an average per share cost includingcommission expense of $40.18. During fiscal 2015, we did not repurchase any shares of our common stock. Duringfiscal 2014, we repurchased 86,000 shares of our common stock for a total cost of $3.0 million and an average pershare cost including commission expense of $34.58. The repurchases are made from time to time on the open marketat prevailing market prices or in negotiated transactions off the market. Repurchased shares are retired.
Financial Condition
We believe that our cash and cash equivalents, investments and expected cash flows from operations will be sufficientto fund our operations, capital requirements, share repurchase program and anticipated quarterly dividends for at leastthe next twelve months. Our future capital requirements will largely depend upon the increased customer demand andmarket acceptance of our point-of-care blood analyzer products. However, our sales for any future periods are notpredictable with a significant degree of certainty. Regardless, we may seek to raise additional funds to pursuestrategic opportunities.
55
Abaxis, Inc. Form 10-K
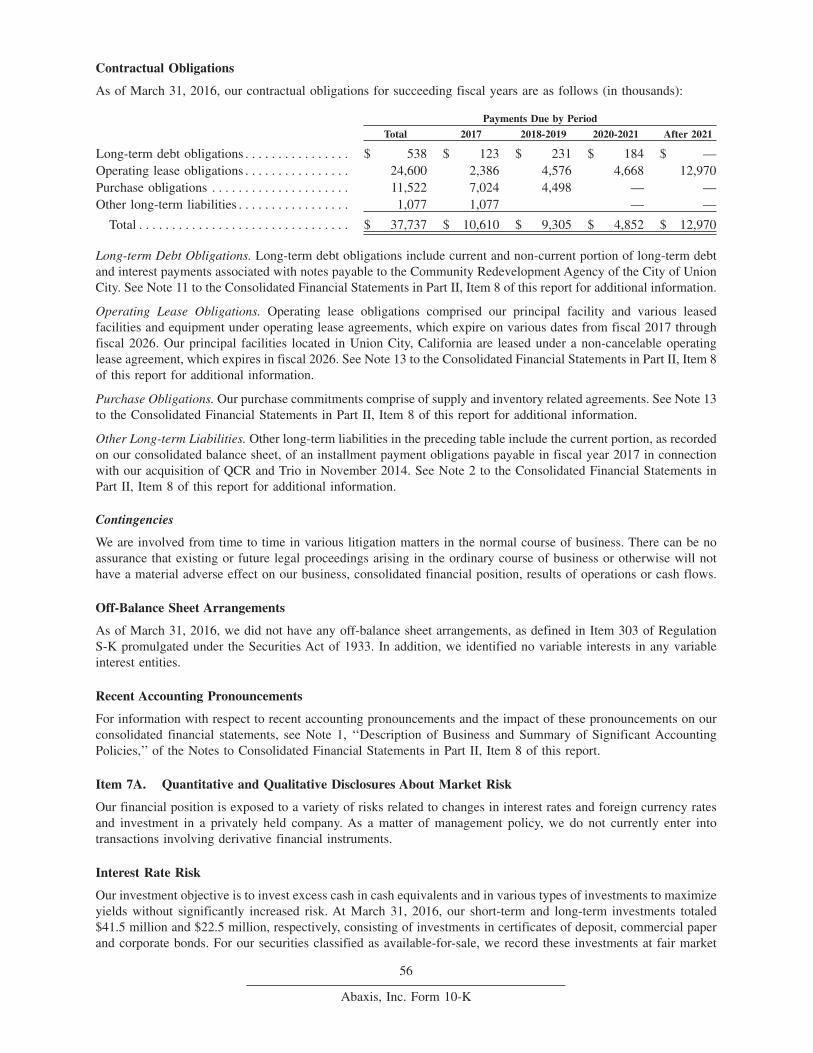
Contractual Obligations
As of March 31, 2016, our contractual obligations for succeeding fiscal years are as follows (in thousands):
Payments Due by Period
Total 2017 2018-2019 2020-2021 After 2021
Long-term debt obligations . . . . . . . . . . . . . . . . $ 538 $ 123 $ 231 $ 184 $ —Operating lease obligations . . . . . . . . . . . . . . . . 24,600 2,386 4,576 4,668 12,970Purchase obligations . . . . . . . . . . . . . . . . . . . . . 11,522 7,024 4,498 — —Other long-term liabilities . . . . . . . . . . . . . . . . . 1,077 1,077 — —
Total . . . . . . . . . . . . . . . . . . . . . . . . . . . . . . . . $ 37,737 $ 10,610 $ 9,305 $ 4,852 $ 12,970
Long-term Debt Obligations. Long-term debt obligations include current and non-current portion of long-term debtand interest payments associated with notes payable to the Community Redevelopment Agency of the City of UnionCity. See Note 11 to the Consolidated Financial Statements in Part II, Item 8 of this report for additional information.
Operating Lease Obligations. Operating lease obligations comprised our principal facility and various leasedfacilities and equipment under operating lease agreements, which expire on various dates from fiscal 2017 throughfiscal 2026. Our principal facilities located in Union City, California are leased under a non-cancelable operatinglease agreement, which expires in fiscal 2026. See Note 13 to the Consolidated Financial Statements in Part II, Item 8of this report for additional information.
Purchase Obligations. Our purchase commitments comprise of supply and inventory related agreements. See Note 13to the Consolidated Financial Statements in Part II, Item 8 of this report for additional information.
Other Long-term Liabilities. Other long-term liabilities in the preceding table include the current portion, as recordedon our consolidated balance sheet, of an installment payment obligations payable in fiscal year 2017 in connectionwith our acquisition of QCR and Trio in November 2014. See Note 2 to the Consolidated Financial Statements inPart II, Item 8 of this report for additional information.
Contingencies
We are involved from time to time in various litigation matters in the normal course of business. There can be noassurance that existing or future legal proceedings arising in the ordinary course of business or otherwise will nothave a material adverse effect on our business, consolidated financial position, results of operations or cash flows.
Off-Balance Sheet Arrangements
As of March 31, 2016, we did not have any off-balance sheet arrangements, as defined in Item 303 of RegulationS-K promulgated under the Securities Act of 1933. In addition, we identified no variable interests in any variableinterest entities.
Recent Accounting Pronouncements
For information with respect to recent accounting pronouncements and the impact of these pronouncements on ourconsolidated financial statements, see Note 1, ‘‘Description of Business and Summary of Significant AccountingPolicies,’’ of the Notes to Consolidated Financial Statements in Part II, Item 8 of this report.
Item 7A. Quantitative and Qualitative Disclosures About Market Risk
Our financial position is exposed to a variety of risks related to changes in interest rates and foreign currency ratesand investment in a privately held company. As a matter of management policy, we do not currently enter intotransactions involving derivative financial instruments.
Interest Rate Risk
Our investment objective is to invest excess cash in cash equivalents and in various types of investments to maximizeyields without significantly increased risk. At March 31, 2016, our short-term and long-term investments totaled$41.5 million and $22.5 million, respectively, consisting of investments in certificates of deposit, commercial paperand corporate bonds. For our securities classified as available-for-sale, we record these investments at fair market
56
Abaxis, Inc. Form 10-K
value with unrealized gains or losses resulting from changes in fair value reported as a separate component ofaccumulated other comprehensive loss, net of any tax effects, in shareholders’ equity. The fair value of our investmentportfolio is subject to change as a result of changes in market interest rates and investment risk related to the issuers’credit worthiness. Changes in market interest rates would not be expected to have a material impact on the fair valueof these assets at March 31, 2016, as the assets consisted of highly liquid securities.
We are exposed to the impact of interest rate changes with respect to our short-term and long-term investments. Asof March 31, 2016, we had $56.9 million in investments classified as held-to-maturity and carried at amortized cost.We have the ability to hold the investments classified as held-to-maturity in our investment portfolio at March 31,2016 until maturity and therefore, we believe we have no material exposure to interest rate risk. As of March 31,2016, our investments classified as available-for-sale totaled $7.0 million, consisting primarily of fixed incomesecurities and thus changes in interest rates would not have a material effect on our business, operating results orfinancial condition. We have not experienced any significant loss on our investment portfolio during fiscal 2016, 2015and 2014.
Foreign Currency Rate Fluctuations
We operate primarily in the United States and a majority of our revenues, cost of revenues, operating expenses andcapital purchasing activities are transacted in U.S. dollars. However, we are exposed to foreign currency risks thatarise from normal business operations. These risks are primarily related to remeasuring local currency balances andresults of our foreign subsidiaries, into U.S. dollars and third-party transactions denominated in a currency other thanthe U.S. dollar. As currency exchange rates change, remeasurement of the accounts of our foreign subsidiaries intoU.S. dollars affects year-over-year comparability of operating results.
The functional currency of our wholly-owned subsidiaries is in U.S. dollars. Foreign currency denominated accountbalances of our subsidiaries are remeasured into U.S. dollars at the end-of-period exchange rates for monetary assetsand liabilities, and historical exchange rates for nonmonetary assets. The effects of foreign currency transactions, andof remeasuring the financial condition into the functional currency, resulted in foreign currency gains and losses,which were included in ‘‘Interest and other income (expense), net’’ on our consolidated statements of income. Forour sales denominated in foreign currencies, we are exposed to foreign currency exchange rate fluctuations onrevenue and collection of receivables.
Our most significant third-party transactions denominated in foreign currency are inventory purchases of hematologyproducts from Diatron MI PLC, which are primarily denominated in Euros. To the extent the U.S. dollar strengthensagainst the Euro currency, the translation of the foreign currency denominated transactions may result in reduced costof revenues and operating expenses. Similarly, our cost of revenues and operating expenses will increase if the U.S.dollar weakens against the Euro currency. We considered the historical trends in currency exchange rates anddetermined that it was reasonably possible that changes in exchange rates of 10% for our foreign currencydenominated transactions could be experienced in the near term. If the U.S. dollar weakened or strengthened by 10%against the Euro, the impact of changes in the exchange rate would not have had a material effect on our business,operating results or financial condition for the year ended March 31, 2016. To date, we have not engaged in anyforeign currency hedging transactions. As our international operations grow, we will continue to reassess ourapproach to managing the risks relating to fluctuations in currency rates.
Investment in a Privately Held Company
In February 2011, we purchased a 15% equity ownership interest in SMB, for $2.8 million in cash. SMB is aprivately-held developer and manufacturer of point-of-care diagnostic products for veterinary use. SMB, based inFarum, Denmark, has been the original equipment manufacturer of the Abaxis VetScan VSpro point-of-care specialtyanalyzer since 2008. The investment is recorded in ‘‘Investment in Unconsolidated Affiliate’’ in our consolidatedbalance sheets and we use the equity method to account for our investment in this entity because we do not controlit, but have the ability to exercise significant influence over it. As of March 31, 2016, the total carrying amount ofour investment in SMB was $2.7 million. The investment is inherently risky and we could lose our entire investmentin this company. To date, since our investment in SMB, we have not recorded an impairment charge on thisinvestment.
57
Abaxis, Inc. Form 10-K
Item 8. Financial Statements and Supplementary Data
ABAXIS, INC.INDEX TO CONSOLIDATED FINANCIAL STATEMENTS
Description Page
Report of Independent Registered Public Accounting Firm . . . . . . . . . . . . . . . . . . . . . . . . . . . . . . . . . . . . . . . . . 59Consolidated Balance Sheets at March 31, 2016 and 2015 . . . . . . . . . . . . . . . . . . . . . . . . . . . . . . . . . . . . . . . . . 60Consolidated Statements of Income for the Years Ended March 31, 2016, 2015 and 2014 . . . . . . . . . . . . . . . . 61Consolidated Statements of Comprehensive Income for the Years Ended March 31, 2016, 2015 and 2014. . . 62Consolidated Statements of Shareholders’ Equity for the Years Ended March 31, 2016, 2015 and 2014 . . . . . 63Consolidated Statements of Cash Flows for the Years Ended March 31, 2016, 2015 and 2014 . . . . . . . . . . . . 64Notes to Consolidated Financial Statements . . . . . . . . . . . . . . . . . . . . . . . . . . . . . . . . . . . . . . . . . . . . . . . . . . . . . 65
58
Abaxis, Inc. Form 10-K
REPORT OF INDEPENDENT REGISTERED PUBLIC ACCOUNTING FIRM
To the Board of Directors and Shareholders ofAbaxis, Inc.
We have audited the accompanying consolidated balance sheets of Abaxis, Inc. and its subsidiaries (the ‘‘Company’’)as of March 31, 2016 and 2015, and the related consolidated statements of income, comprehensive income,shareholders’ equity and cash flows for each of the three years in the period ended March 31, 2016. Our audits alsoincluded the financial statement schedule listed in the Index to this Annual Report on Form 10-K at Part IVItem 15(a) 2. These consolidated financial statements and the financial statement schedule are the responsibility ofthe Company’s management. Our responsibility is to express an opinion on these consolidated financial statementsand the financial statement schedule based on our audits.
We conducted our audits in accordance with the standards of the Public Company Accounting Oversight Board(United States). Those standards require that we plan and perform the audit to obtain reasonable assurance aboutwhether the financial statements are free of material misstatement. An audit includes examining, on a test basis,evidence supporting the amounts and disclosures in the financial statements. An audit also includes assessing theaccounting principles used and significant estimates made by management, as well as evaluating the overall financialstatement presentation. We believe that our audits provide a reasonable basis for our opinion.
In our opinion, the consolidated financial statements referred to above present fairly, in all material respects, thefinancial position of Abaxis, Inc. and its subsidiaries as of March 31, 2016 and 2015, and the results of theiroperations and their cash flows for each of the three years in the period ended March 31, 2016, in conformity withaccounting principles generally accepted in the United States of America. Also, in our opinion, the related financialstatement schedule, when considered in relation to the consolidated financial statements taken as a whole, presentsfairly, in all material aspects, the information set forth therein.
We also have audited, in accordance with the standards of the Public Company Accounting Oversight Board (UnitedStates), the Company’s internal control over financial reporting as of March 31, 2016, based on criteria establishedin Internal Control — Integrated Framework (2013 Framework) issued by the Committee of SponsoringOrganizations of the Tredway Commission and our report dated May 31, 2016 expressed an unqualified opinionthereon.
/s/ Burr Pilger Mayer, Inc.
San Jose, CaliforniaMay 31, 2016
59
Abaxis, Inc. Form 10-K
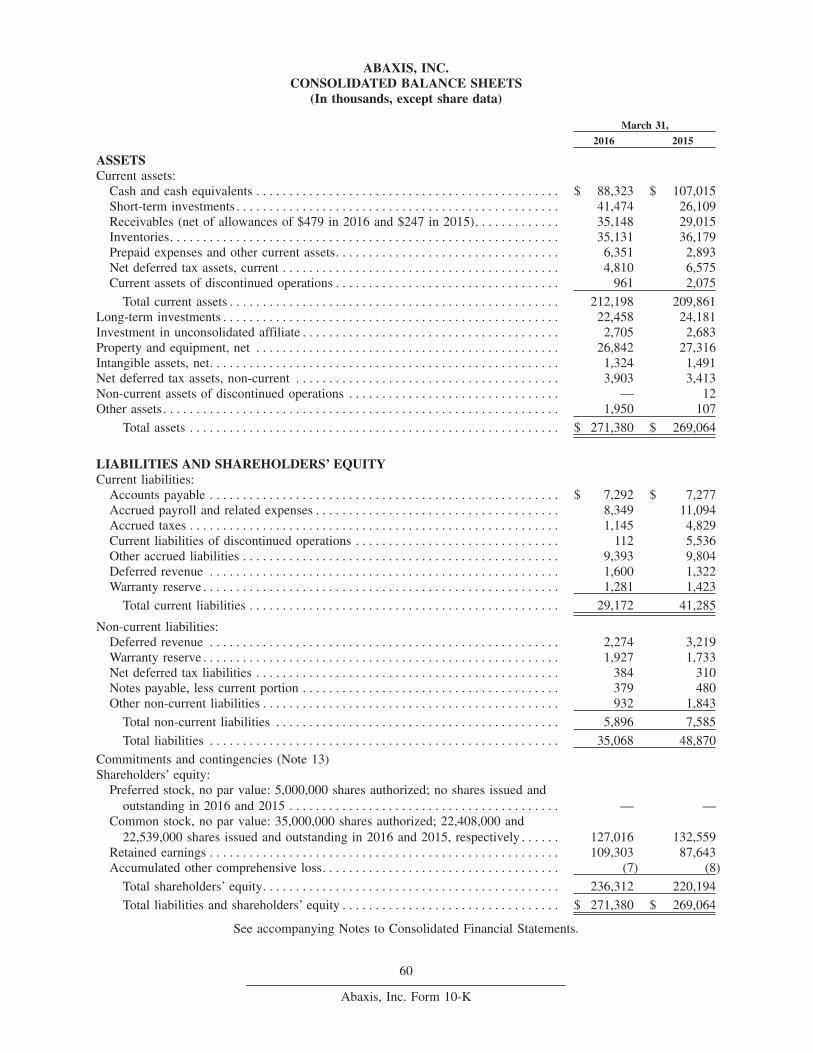
ABAXIS, INC.CONSOLIDATED BALANCE SHEETS
(In thousands, except share data)
March 31,
2016 2015
ASSETSCurrent assets:
Cash and cash equivalents . . . . . . . . . . . . . . . . . . . . . . . . . . . . . . . . . . . . . . . . . . . . . . $ 88,323 $ 107,015Short-term investments . . . . . . . . . . . . . . . . . . . . . . . . . . . . . . . . . . . . . . . . . . . . . . . . . 41,474 26,109Receivables (net of allowances of $479 in 2016 and $247 in 2015). . . . . . . . . . . . . 35,148 29,015Inventories. . . . . . . . . . . . . . . . . . . . . . . . . . . . . . . . . . . . . . . . . . . . . . . . . . . . . . . . . . . 35,131 36,179Prepaid expenses and other current assets. . . . . . . . . . . . . . . . . . . . . . . . . . . . . . . . . . 6,351 2,893Net deferred tax assets, current . . . . . . . . . . . . . . . . . . . . . . . . . . . . . . . . . . . . . . . . . . 4,810 6,575Current assets of discontinued operations . . . . . . . . . . . . . . . . . . . . . . . . . . . . . . . . . . 961 2,075
Total current assets . . . . . . . . . . . . . . . . . . . . . . . . . . . . . . . . . . . . . . . . . . . . . . . . . . 212,198 209,861Long-term investments . . . . . . . . . . . . . . . . . . . . . . . . . . . . . . . . . . . . . . . . . . . . . . . . . . . 22,458 24,181Investment in unconsolidated affiliate . . . . . . . . . . . . . . . . . . . . . . . . . . . . . . . . . . . . . . . 2,705 2,683Property and equipment, net . . . . . . . . . . . . . . . . . . . . . . . . . . . . . . . . . . . . . . . . . . . . . . 26,842 27,316Intangible assets, net. . . . . . . . . . . . . . . . . . . . . . . . . . . . . . . . . . . . . . . . . . . . . . . . . . . . . 1,324 1,491Net deferred tax assets, non-current . . . . . . . . . . . . . . . . . . . . . . . . . . . . . . . . . . . . . . . . 3,903 3,413Non-current assets of discontinued operations . . . . . . . . . . . . . . . . . . . . . . . . . . . . . . . . — 12Other assets . . . . . . . . . . . . . . . . . . . . . . . . . . . . . . . . . . . . . . . . . . . . . . . . . . . . . . . . . . . . 1,950 107
Total assets . . . . . . . . . . . . . . . . . . . . . . . . . . . . . . . . . . . . . . . . . . . . . . . . . . . . . . . . $ 271,380 $ 269,064
LIABILITIES AND SHAREHOLDERS’ EQUITYCurrent liabilities:
Accounts payable . . . . . . . . . . . . . . . . . . . . . . . . . . . . . . . . . . . . . . . . . . . . . . . . . . . . . $ 7,292 $ 7,277Accrued payroll and related expenses . . . . . . . . . . . . . . . . . . . . . . . . . . . . . . . . . . . . . 8,349 11,094Accrued taxes . . . . . . . . . . . . . . . . . . . . . . . . . . . . . . . . . . . . . . . . . . . . . . . . . . . . . . . . 1,145 4,829Current liabilities of discontinued operations . . . . . . . . . . . . . . . . . . . . . . . . . . . . . . . 112 5,536Other accrued liabilities . . . . . . . . . . . . . . . . . . . . . . . . . . . . . . . . . . . . . . . . . . . . . . . . 9,393 9,804Deferred revenue . . . . . . . . . . . . . . . . . . . . . . . . . . . . . . . . . . . . . . . . . . . . . . . . . . . . . 1,600 1,322Warranty reserve . . . . . . . . . . . . . . . . . . . . . . . . . . . . . . . . . . . . . . . . . . . . . . . . . . . . . . 1,281 1,423
Total current liabilities . . . . . . . . . . . . . . . . . . . . . . . . . . . . . . . . . . . . . . . . . . . . . . . 29,172 41,285
Non-current liabilities:Deferred revenue . . . . . . . . . . . . . . . . . . . . . . . . . . . . . . . . . . . . . . . . . . . . . . . . . . . . . 2,274 3,219Warranty reserve . . . . . . . . . . . . . . . . . . . . . . . . . . . . . . . . . . . . . . . . . . . . . . . . . . . . . . 1,927 1,733Net deferred tax liabilities . . . . . . . . . . . . . . . . . . . . . . . . . . . . . . . . . . . . . . . . . . . . . . 384 310Notes payable, less current portion . . . . . . . . . . . . . . . . . . . . . . . . . . . . . . . . . . . . . . . 379 480Other non-current liabilities . . . . . . . . . . . . . . . . . . . . . . . . . . . . . . . . . . . . . . . . . . . . . 932 1,843
Total non-current liabilities . . . . . . . . . . . . . . . . . . . . . . . . . . . . . . . . . . . . . . . . . . . 5,896 7,585
Total liabilities . . . . . . . . . . . . . . . . . . . . . . . . . . . . . . . . . . . . . . . . . . . . . . . . . . . . . 35,068 48,870
Commitments and contingencies (Note 13)Shareholders’ equity:
Preferred stock, no par value: 5,000,000 shares authorized; no shares issued andoutstanding in 2016 and 2015 . . . . . . . . . . . . . . . . . . . . . . . . . . . . . . . . . . . . . . . . . — —
Common stock, no par value: 35,000,000 shares authorized; 22,408,000 and22,539,000 shares issued and outstanding in 2016 and 2015, respectively . . . . . . 127,016 132,559
Retained earnings . . . . . . . . . . . . . . . . . . . . . . . . . . . . . . . . . . . . . . . . . . . . . . . . . . . . . 109,303 87,643Accumulated other comprehensive loss. . . . . . . . . . . . . . . . . . . . . . . . . . . . . . . . . . . . (7) (8)
Total shareholders’ equity. . . . . . . . . . . . . . . . . . . . . . . . . . . . . . . . . . . . . . . . . . . . . 236,312 220,194
Total liabilities and shareholders’ equity . . . . . . . . . . . . . . . . . . . . . . . . . . . . . . . . . $ 271,380 $ 269,064
See accompanying Notes to Consolidated Financial Statements.
60
Abaxis, Inc. Form 10-K
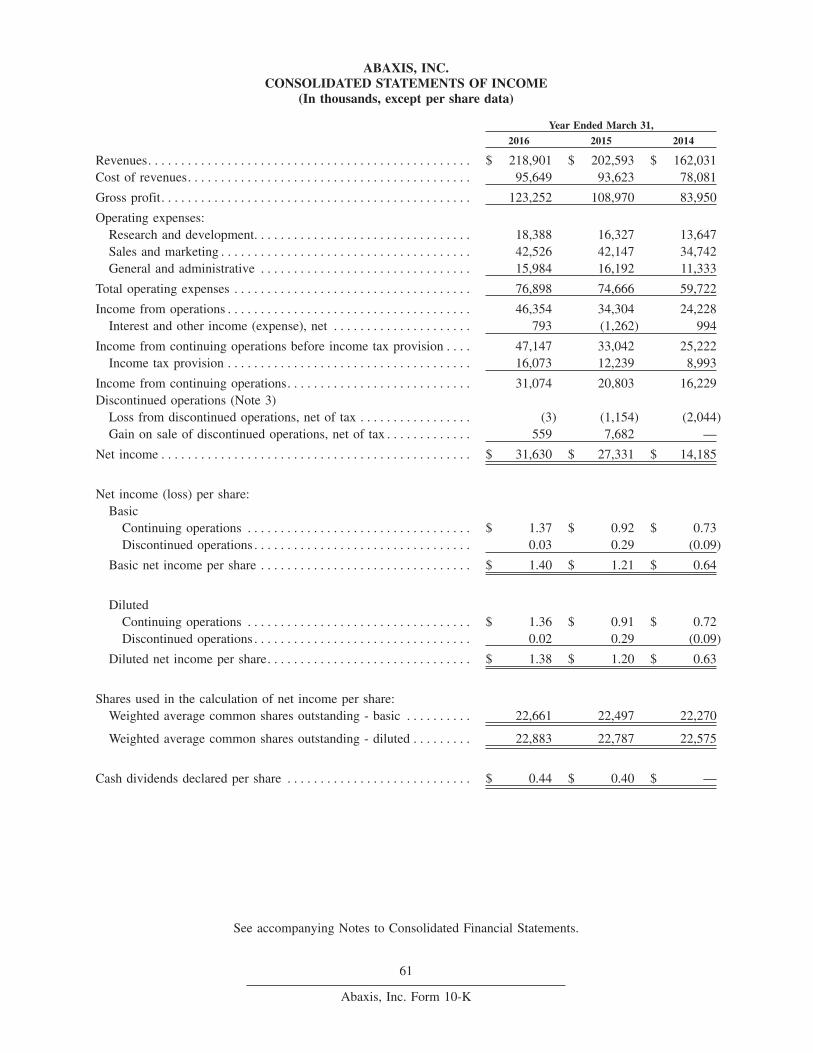
ABAXIS, INC.CONSOLIDATED STATEMENTS OF INCOME
(In thousands, except per share data)
Year Ended March 31,
2016 2015 2014
Revenues. . . . . . . . . . . . . . . . . . . . . . . . . . . . . . . . . . . . . . . . . . . . . . . . . $ 218,901 $ 202,593 $ 162,031Cost of revenues. . . . . . . . . . . . . . . . . . . . . . . . . . . . . . . . . . . . . . . . . . . 95,649 93,623 78,081
Gross profit. . . . . . . . . . . . . . . . . . . . . . . . . . . . . . . . . . . . . . . . . . . . . . . 123,252 108,970 83,950
Operating expenses:Research and development. . . . . . . . . . . . . . . . . . . . . . . . . . . . . . . . . 18,388 16,327 13,647Sales and marketing . . . . . . . . . . . . . . . . . . . . . . . . . . . . . . . . . . . . . . 42,526 42,147 34,742General and administrative . . . . . . . . . . . . . . . . . . . . . . . . . . . . . . . . 15,984 16,192 11,333
Total operating expenses . . . . . . . . . . . . . . . . . . . . . . . . . . . . . . . . . . . . 76,898 74,666 59,722
Income from operations . . . . . . . . . . . . . . . . . . . . . . . . . . . . . . . . . . . . . 46,354 34,304 24,228Interest and other income (expense), net . . . . . . . . . . . . . . . . . . . . . 793 (1,262) 994
Income from continuing operations before income tax provision . . . . 47,147 33,042 25,222Income tax provision . . . . . . . . . . . . . . . . . . . . . . . . . . . . . . . . . . . . . 16,073 12,239 8,993
Income from continuing operations. . . . . . . . . . . . . . . . . . . . . . . . . . . . 31,074 20,803 16,229Discontinued operations (Note 3)
Loss from discontinued operations, net of tax . . . . . . . . . . . . . . . . . (3) (1,154) (2,044)Gain on sale of discontinued operations, net of tax . . . . . . . . . . . . . 559 7,682 —
Net income . . . . . . . . . . . . . . . . . . . . . . . . . . . . . . . . . . . . . . . . . . . . . . . $ 31,630 $ 27,331 $ 14,185
Net income (loss) per share:Basic
Continuing operations . . . . . . . . . . . . . . . . . . . . . . . . . . . . . . . . . . $ 1.37 $ 0.92 $ 0.73Discontinued operations . . . . . . . . . . . . . . . . . . . . . . . . . . . . . . . . . 0.03 0.29 (0.09)
Basic net income per share . . . . . . . . . . . . . . . . . . . . . . . . . . . . . . . . $ 1.40 $ 1.21 $ 0.64
DilutedContinuing operations . . . . . . . . . . . . . . . . . . . . . . . . . . . . . . . . . . $ 1.36 $ 0.91 $ 0.72Discontinued operations . . . . . . . . . . . . . . . . . . . . . . . . . . . . . . . . . 0.02 0.29 (0.09)
Diluted net income per share. . . . . . . . . . . . . . . . . . . . . . . . . . . . . . . $ 1.38 $ 1.20 $ 0.63
Shares used in the calculation of net income per share:Weighted average common shares outstanding - basic . . . . . . . . . . 22,661 22,497 22,270
Weighted average common shares outstanding - diluted . . . . . . . . . 22,883 22,787 22,575
Cash dividends declared per share . . . . . . . . . . . . . . . . . . . . . . . . . . . . $ 0.44 $ 0.40 $ —
See accompanying Notes to Consolidated Financial Statements.
61
Abaxis, Inc. Form 10-K
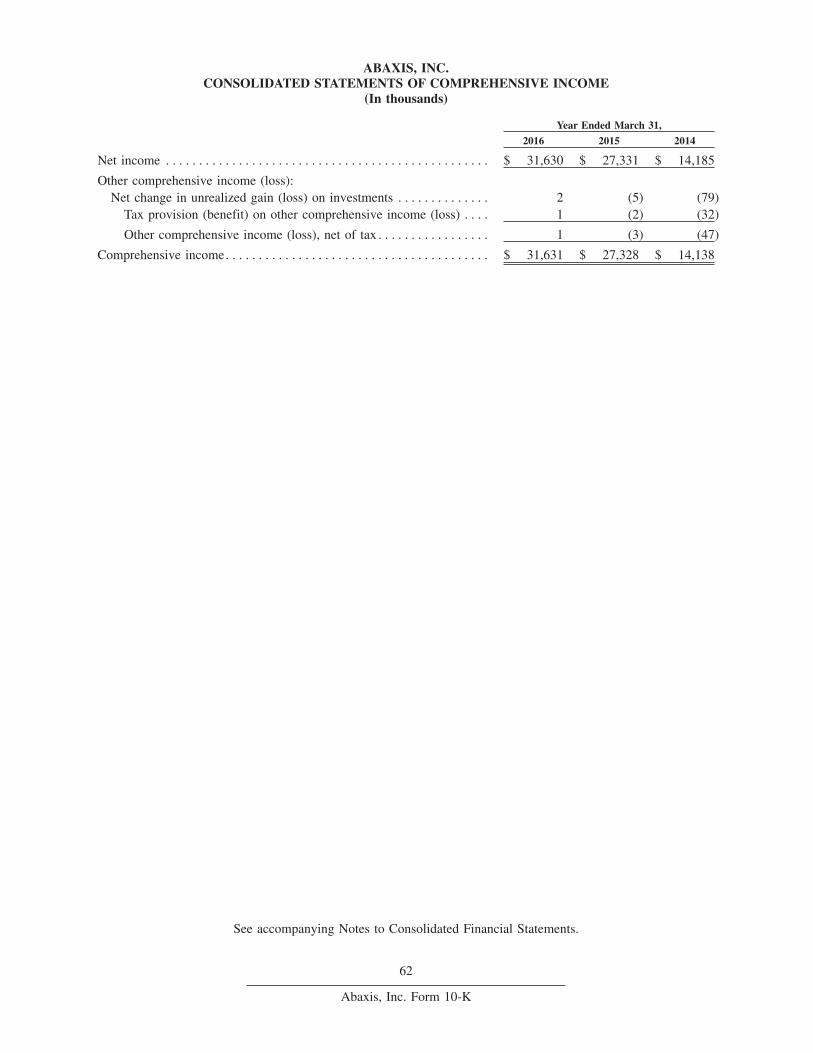
ABAXIS, INC.CONSOLIDATED STATEMENTS OF COMPREHENSIVE INCOME
(In thousands)
Year Ended March 31,
2016 2015 2014
Net income . . . . . . . . . . . . . . . . . . . . . . . . . . . . . . . . . . . . . . . . . . . . . . . . . $ 31,630 $ 27,331 $ 14,185
Other comprehensive income (loss):Net change in unrealized gain (loss) on investments . . . . . . . . . . . . . . 2 (5) (79)
Tax provision (benefit) on other comprehensive income (loss) . . . . 1 (2) (32)
Other comprehensive income (loss), net of tax . . . . . . . . . . . . . . . . . 1 (3) (47)
Comprehensive income. . . . . . . . . . . . . . . . . . . . . . . . . . . . . . . . . . . . . . . . $ 31,631 $ 27,328 $ 14,138
See accompanying Notes to Consolidated Financial Statements.
62
Abaxis, Inc. Form 10-K
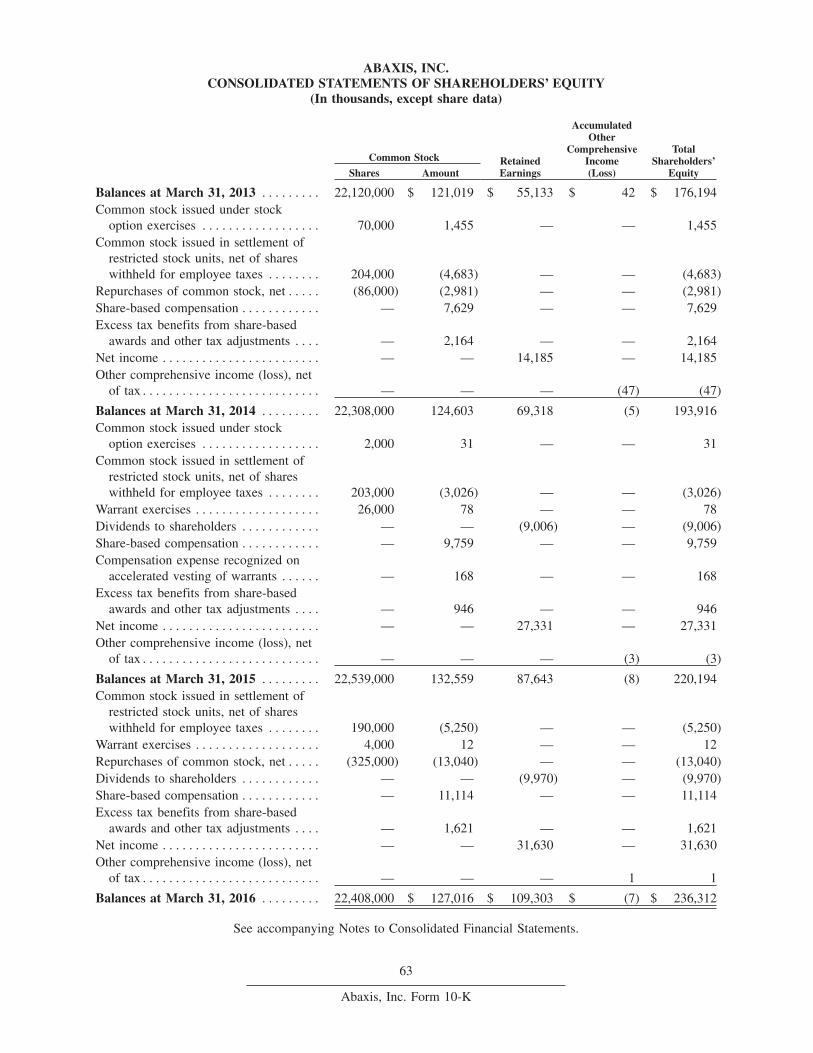
ABAXIS, INC.CONSOLIDATED STATEMENTS OF SHAREHOLDERS’ EQUITY
(In thousands, except share data)
Common Stock RetainedEarnings
AccumulatedOther
ComprehensiveIncome(Loss)
TotalShareholders’
EquityShares Amount
Balances at March 31, 2013 . . . . . . . . . 22,120,000 $ 121,019 $ 55,133 $ 42 $ 176,194Common stock issued under stock
option exercises . . . . . . . . . . . . . . . . . . 70,000 1,455 — — 1,455Common stock issued in settlement of
restricted stock units, net of shareswithheld for employee taxes . . . . . . . . 204,000 (4,683) — — (4,683)
Repurchases of common stock, net . . . . . (86,000) (2,981) — — (2,981)Share-based compensation . . . . . . . . . . . . — 7,629 — — 7,629Excess tax benefits from share-based
awards and other tax adjustments . . . . — 2,164 — — 2,164Net income . . . . . . . . . . . . . . . . . . . . . . . . — — 14,185 — 14,185Other comprehensive income (loss), net
of tax . . . . . . . . . . . . . . . . . . . . . . . . . . . — — — (47) (47)
Balances at March 31, 2014 . . . . . . . . . 22,308,000 124,603 69,318 (5) 193,916Common stock issued under stock
option exercises . . . . . . . . . . . . . . . . . . 2,000 31 — — 31Common stock issued in settlement of
restricted stock units, net of shareswithheld for employee taxes . . . . . . . . 203,000 (3,026) — — (3,026)
Warrant exercises . . . . . . . . . . . . . . . . . . . 26,000 78 — — 78Dividends to shareholders . . . . . . . . . . . . — — (9,006) — (9,006)Share-based compensation . . . . . . . . . . . . — 9,759 — — 9,759Compensation expense recognized on
accelerated vesting of warrants . . . . . . — 168 — — 168Excess tax benefits from share-based
awards and other tax adjustments . . . . — 946 — — 946Net income . . . . . . . . . . . . . . . . . . . . . . . . — — 27,331 — 27,331Other comprehensive income (loss), net
of tax . . . . . . . . . . . . . . . . . . . . . . . . . . . — — — (3) (3)
Balances at March 31, 2015 . . . . . . . . . 22,539,000 132,559 87,643 (8) 220,194Common stock issued in settlement of
restricted stock units, net of shareswithheld for employee taxes . . . . . . . . 190,000 (5,250) — — (5,250)
Warrant exercises . . . . . . . . . . . . . . . . . . . 4,000 12 — — 12Repurchases of common stock, net . . . . . (325,000) (13,040) — — (13,040)Dividends to shareholders . . . . . . . . . . . . — — (9,970) — (9,970)Share-based compensation . . . . . . . . . . . . — 11,114 — — 11,114Excess tax benefits from share-based
awards and other tax adjustments . . . . — 1,621 — — 1,621Net income . . . . . . . . . . . . . . . . . . . . . . . . — — 31,630 — 31,630Other comprehensive income (loss), net
of tax . . . . . . . . . . . . . . . . . . . . . . . . . . . — — — 1 1
Balances at March 31, 2016 . . . . . . . . . 22,408,000 $ 127,016 $ 109,303 $ (7) $ 236,312
See accompanying Notes to Consolidated Financial Statements.
63
Abaxis, Inc. Form 10-K
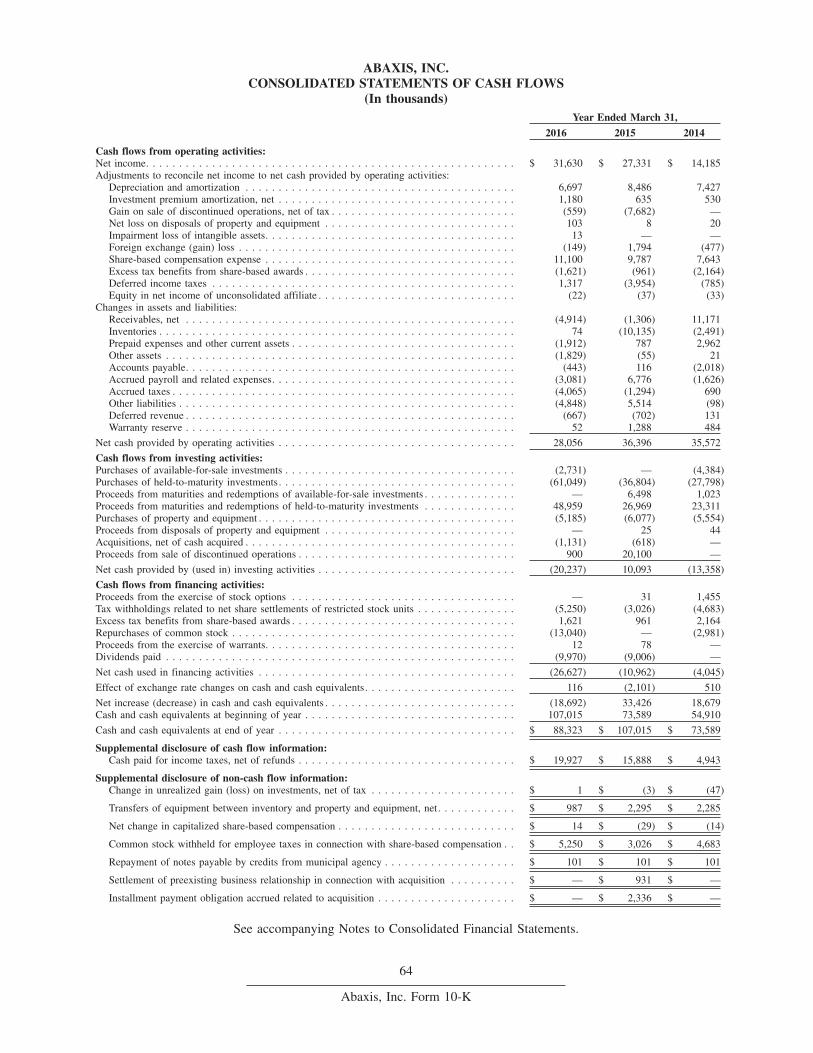
ABAXIS, INC.CONSOLIDATED STATEMENTS OF CASH FLOWS
(In thousands)Year Ended March 31,
2016 2015 2014
Cash flows from operating activities:Net income. . . . . . . . . . . . . . . . . . . . . . . . . . . . . . . . . . . . . . . . . . . . . . . . . . . . . . . . $ 31,630 $ 27,331 $ 14,185Adjustments to reconcile net income to net cash provided by operating activities:
Depreciation and amortization . . . . . . . . . . . . . . . . . . . . . . . . . . . . . . . . . . . . . . . . . 6,697 8,486 7,427Investment premium amortization, net . . . . . . . . . . . . . . . . . . . . . . . . . . . . . . . . . . . . 1,180 635 530Gain on sale of discontinued operations, net of tax . . . . . . . . . . . . . . . . . . . . . . . . . . . . (559) (7,682) —Net loss on disposals of property and equipment . . . . . . . . . . . . . . . . . . . . . . . . . . . . . 103 8 20Impairment loss of intangible assets. . . . . . . . . . . . . . . . . . . . . . . . . . . . . . . . . . . . . . 13 — —Foreign exchange (gain) loss . . . . . . . . . . . . . . . . . . . . . . . . . . . . . . . . . . . . . . . . . . (149) 1,794 (477)Share-based compensation expense . . . . . . . . . . . . . . . . . . . . . . . . . . . . . . . . . . . . . . 11,100 9,787 7,643Excess tax benefits from share-based awards . . . . . . . . . . . . . . . . . . . . . . . . . . . . . . . . (1,621) (961) (2,164)Deferred income taxes . . . . . . . . . . . . . . . . . . . . . . . . . . . . . . . . . . . . . . . . . . . . . . 1,317 (3,954) (785)Equity in net income of unconsolidated affiliate . . . . . . . . . . . . . . . . . . . . . . . . . . . . . . (22) (37) (33)
Changes in assets and liabilities:Receivables, net . . . . . . . . . . . . . . . . . . . . . . . . . . . . . . . . . . . . . . . . . . . . . . . . . . (4,914) (1,306) 11,171Inventories . . . . . . . . . . . . . . . . . . . . . . . . . . . . . . . . . . . . . . . . . . . . . . . . . . . . . . 74 (10,135) (2,491)Prepaid expenses and other current assets . . . . . . . . . . . . . . . . . . . . . . . . . . . . . . . . . . (1,912) 787 2,962Other assets . . . . . . . . . . . . . . . . . . . . . . . . . . . . . . . . . . . . . . . . . . . . . . . . . . . . . (1,829) (55) 21Accounts payable. . . . . . . . . . . . . . . . . . . . . . . . . . . . . . . . . . . . . . . . . . . . . . . . . . (443) 116 (2,018)Accrued payroll and related expenses. . . . . . . . . . . . . . . . . . . . . . . . . . . . . . . . . . . . . (3,081) 6,776 (1,626)Accrued taxes . . . . . . . . . . . . . . . . . . . . . . . . . . . . . . . . . . . . . . . . . . . . . . . . . . . . (4,065) (1,294) 690Other liabilities . . . . . . . . . . . . . . . . . . . . . . . . . . . . . . . . . . . . . . . . . . . . . . . . . . . (4,848) 5,514 (98)Deferred revenue . . . . . . . . . . . . . . . . . . . . . . . . . . . . . . . . . . . . . . . . . . . . . . . . . . (667) (702) 131Warranty reserve . . . . . . . . . . . . . . . . . . . . . . . . . . . . . . . . . . . . . . . . . . . . . . . . . . 52 1,288 484
Net cash provided by operating activities . . . . . . . . . . . . . . . . . . . . . . . . . . . . . . . . . . . . 28,056 36,396 35,572
Cash flows from investing activities:Purchases of available-for-sale investments . . . . . . . . . . . . . . . . . . . . . . . . . . . . . . . . . . . (2,731) — (4,384)Purchases of held-to-maturity investments. . . . . . . . . . . . . . . . . . . . . . . . . . . . . . . . . . . . (61,049) (36,804) (27,798)Proceeds from maturities and redemptions of available-for-sale investments . . . . . . . . . . . . . . — 6,498 1,023Proceeds from maturities and redemptions of held-to-maturity investments . . . . . . . . . . . . . . 48,959 26,969 23,311Purchases of property and equipment . . . . . . . . . . . . . . . . . . . . . . . . . . . . . . . . . . . . . . . (5,185) (6,077) (5,554)Proceeds from disposals of property and equipment . . . . . . . . . . . . . . . . . . . . . . . . . . . . . — 25 44Acquisitions, net of cash acquired . . . . . . . . . . . . . . . . . . . . . . . . . . . . . . . . . . . . . . . . . (1,131) (618) —Proceeds from sale of discontinued operations . . . . . . . . . . . . . . . . . . . . . . . . . . . . . . . . . 900 20,100 —
Net cash provided by (used in) investing activities . . . . . . . . . . . . . . . . . . . . . . . . . . . . . . (20,237) 10,093 (13,358)
Cash flows from financing activities:Proceeds from the exercise of stock options . . . . . . . . . . . . . . . . . . . . . . . . . . . . . . . . . . — 31 1,455Tax withholdings related to net share settlements of restricted stock units . . . . . . . . . . . . . . . (5,250) (3,026) (4,683)Excess tax benefits from share-based awards . . . . . . . . . . . . . . . . . . . . . . . . . . . . . . . . . . 1,621 961 2,164Repurchases of common stock . . . . . . . . . . . . . . . . . . . . . . . . . . . . . . . . . . . . . . . . . . . (13,040) — (2,981)Proceeds from the exercise of warrants. . . . . . . . . . . . . . . . . . . . . . . . . . . . . . . . . . . . . . 12 78 —Dividends paid . . . . . . . . . . . . . . . . . . . . . . . . . . . . . . . . . . . . . . . . . . . . . . . . . . . . . (9,970) (9,006) —
Net cash used in financing activities . . . . . . . . . . . . . . . . . . . . . . . . . . . . . . . . . . . . . . . (26,627) (10,962) (4,045)
Effect of exchange rate changes on cash and cash equivalents. . . . . . . . . . . . . . . . . . . . . . . 116 (2,101) 510
Net increase (decrease) in cash and cash equivalents . . . . . . . . . . . . . . . . . . . . . . . . . . . . . (18,692) 33,426 18,679Cash and cash equivalents at beginning of year . . . . . . . . . . . . . . . . . . . . . . . . . . . . . . . . 107,015 73,589 54,910
Cash and cash equivalents at end of year . . . . . . . . . . . . . . . . . . . . . . . . . . . . . . . . . . . . $ 88,323 $ 107,015 $ 73,589
Supplemental disclosure of cash flow information:Cash paid for income taxes, net of refunds . . . . . . . . . . . . . . . . . . . . . . . . . . . . . . . . . $ 19,927 $ 15,888 $ 4,943
Supplemental disclosure of non-cash flow information:Change in unrealized gain (loss) on investments, net of tax . . . . . . . . . . . . . . . . . . . . . . $ 1 $ (3) $ (47)
Transfers of equipment between inventory and property and equipment, net. . . . . . . . . . . . $ 987 $ 2,295 $ 2,285
Net change in capitalized share-based compensation . . . . . . . . . . . . . . . . . . . . . . . . . . . $ 14 $ (29) $ (14)
Common stock withheld for employee taxes in connection with share-based compensation . . $ 5,250 $ 3,026 $ 4,683
Repayment of notes payable by credits from municipal agency . . . . . . . . . . . . . . . . . . . . $ 101 $ 101 $ 101
Settlement of preexisting business relationship in connection with acquisition . . . . . . . . . . $ — $ 931 $ —
Installment payment obligation accrued related to acquisition . . . . . . . . . . . . . . . . . . . . . $ — $ 2,336 $ —
See accompanying Notes to Consolidated Financial Statements.
64
Abaxis, Inc. Form 10-K
ABAXIS, INC.NOTES TO CONSOLIDATED FINANCIAL STATEMENTS
YEARS ENDED MARCH 31, 2016, 2015 AND 2014
NOTE 1. DESCRIPTION OF BUSINESS AND SUMMARY OF SIGNIFICANTACCOUNTING POLICIES
Description of Business
Abaxis, Inc. (‘‘Abaxis,’’ the ‘‘Company,’’ ‘‘our,’’ ‘‘us,’’ or ‘‘we’’), incorporated in California in 1989, develops,manufactures and markets portable blood analysis systems that are used in a broad range of medical specialties inhuman or veterinary patient care to provide clinicians with rapid blood constituent measurements. We conductbusiness worldwide and manage our business on the basis of the following two reportable segments: the medicalmarket and the veterinary market.
Basis of Presentation
Principles of Consolidation. The accompanying consolidated financial statements include the accounts of Abaxisand our wholly-owned subsidiaries. Intercompany transactions and balances have been eliminated in consolidation.
Discontinued Operations. On March 18, 2015, we entered into an Asset Purchase Agreement with AntechDiagnostics, Inc. (‘‘Antech’’) pursuant to which we sold substantially all of the assets of our Abaxis VeterinaryReference Laboratories (‘‘AVRL’’) business. The sale transaction closed on March 31, 2015. The historical operatingresults of our AVRL business are retrospectively adjusted and presented as discontinued operations in ourconsolidated balance sheets and consolidated statements of income for all periods presented. See Note 3,‘‘Discontinued Operations’’ for additional information. Unless noted otherwise, all discussions herein with respect tothe Company’s audited consolidated financial statements relate to the Company’s continuing operations.
Reclassifications. Certain reclassifications have been made to prior periods’ financial statements to conform to thecurrent period presentation. These reclassifications did not result in any change in previously reported net income orshareholders’ equity.
Summary of Significant Accounting Policies
Management Estimates. The preparation of these consolidated financial statements in accordance with accountingprinciples generally accepted in the United States of America requires our management to make estimates andassumptions that affect the reported amounts of assets and liabilities and disclosure of contingent assets and liabilitiesat the date of the consolidated financial statements, the reported amounts of revenues and expenses during thereporting period, and related disclosures. Significant management estimates made in preparing the consolidatedfinancial statements relate to allowance for doubtful accounts, sales and other allowances, estimated selling price ofour products, valuation of inventory, fair value of investments, fair value and useful lives of intangible assets, incometaxes, valuation allowance for deferred tax assets, share-based compensation, legal exposures and warranty reserves.Our management bases their estimates on historical experience and on various other assumptions that are believedto be reasonable, the results of which form the basis for making judgments about the carrying values of assets andliabilities. Our actual results may differ materially from these estimates.
Cash and Cash Equivalents. Cash equivalents consist of highly liquid investments with original or remainingmaturities of three months or less at the time of purchase that are readily convertible into cash. The fair value of theseinvestments was determined by using quoted prices for identical investments in active markets which are measuredat Level 1 inputs under Financial Accounting Standards Board (‘‘FASB’’) Accounting Standards Codification(‘‘ASC’’) 820, ‘‘Fair Value Measurements and Disclosures.’’ The carrying value of cash equivalents approximates fairvalue due to their relatively short-term nature.
Investments. We hold both short-term and long-term investments and our portfolio primarily consists of certificatesof deposit, commercial paper, corporate bonds and municipal bonds. Short-term investments have maturities of oneyear or less. All other investments with maturity dates greater than one year are classified as long-term. Ourinvestments are accounted for as either available-for-sale or held-to-maturity. Investments classified as available-for-sale are reported at fair value at the balance sheet date, and temporary differences between cost and fair value arepresented as a separate component of accumulated other comprehensive income (loss), net of any related tax effect,in shareholders’ equity. Investments classified as held-to-maturity are based on the Company’s positive intent andability to hold to maturity and these investments are carried at amortized cost.
65
Abaxis, Inc. Form 10-K
Realized gains and losses from investments are included in ‘‘Interest and other income (expense), net,’’ computedusing the specific identification cost method. We assess whether an other-than-temporary impairment loss on ourinvestments has occurred due to declines in fair value or other market conditions. Declines in fair value that aredetermined to be other-than-temporary, if any, are recorded as charges against ‘‘Interest and other income (expense),net’’ in the consolidated statements of income. We did not recognize any impairment loss on investments during fiscal2016, 2015 or 2014.
Concentration of Credit Risks and Certain Other Risks. Financial instruments that potentially subject us to aconcentration of credit risk consist primarily of cash, cash equivalents, investments and receivables. We place ourcash, cash equivalents and investments with high credit quality financial institutions that are regularly monitored bymanagement. Deposits held with banks may exceed the amount of the insurance provided by the federal governmenton such deposits. To date, the Company has not experienced any losses on such deposits. We also have short andlong-term investments in certificates of deposit, commercial paper, corporate bonds and municipal bonds, which canbe subject to certain credit risk. However, we mitigate the risks by investing in high-grade instruments, limiting ourexposure to any one issuer, and monitoring the ongoing creditworthiness of the financial institutions and issuers.
We sell our products to distributors and direct customers located primarily in North America, Europe and othercountries. Credit is extended to our customers and we generally do not require our customers to provide collateralfor purchases on credit. Credit risks are mitigated by our credit evaluation process and monitoring the amounts owedto us, taking appropriate action when necessary. Collection of receivables may be affected by changes in economicor other industry conditions and may, accordingly, impact our overall credit risk. We maintain an allowance fordoubtful accounts, but historically have not experienced any material losses related to an individual customer orgroup of customers in any particular industry or geographic area. At March 31, 2016, one distributor in the UnitedStates accounted for 25% of our total receivables balance. At March 31, 2015, one distributor in the United Statesaccounted for 26% of our total receivables balance.
We are subject to certain risks and uncertainties and believe that changes in any of the following areas could havea material adverse effect on our future financial position or results of operations: continued Food and DrugAdministration compliance or regulatory changes; uncertainty regarding health care reforms; fundamental changesin the technology underlying blood testing; the ability to develop new products and services that are accepted in themarketplace; competition, including, but not limited to, pricing and products or product features and services; theadequate and timely sourcing of inventories; foreign currency fluctuations; litigation, product liability or other claimsagainst Abaxis; the ability to attract and retain key employees; stock price volatility due to general economicconditions or future issuances and sales of our stock; changes in legal and accounting regulations and standards; andchanges in tax regulations.
Fair Value Measurements. We apply fair value accounting for all financial assets and liabilities and non-financialassets and liabilities that are recognized or disclosed at fair value in the financial statements on a recurring basis. Fairvalue is defined as the price that would be received to sell an asset or paid to transfer a liability in an orderlytransaction between market participants at the measurement date. When determining fair value, we consider theprincipal or most advantageous market in which we would transact and consider assumptions that market participantswould use when pricing the asset or liability. The fair value hierarchy distinguishes between (1) market participantassumptions developed based on market data obtained from independent sources (observable inputs) and (2) anentity’s own assumptions about market participant assumptions developed based on the best information available inthe circumstances (unobservable inputs). The fair value hierarchy consists of three broad levels, which gives thehighest priority to unadjusted quoted prices in active markets for identical assets or liabilities (Level 1) and the lowestpriority to unobservable inputs (Level 3). The three levels of the fair value hierarchy are described below.
Level 1: Quoted prices (unadjusted) in active markets for identical assets or liabilities.
Level 2: Directly or indirectly observable inputs as of the reporting date through correlation with market data,including quoted prices for similar assets and liabilities in active markets and quoted prices in markets that are notactive. Level 2 also includes assets and liabilities that are valued using models or other pricing methodologies thatdo not require significant judgment since the input assumptions used in the models, such as interest rates andvolatility factors, are corroborated by readily observable data from actively quoted markets for substantially the fullterm of the financial instrument.
66
Abaxis, Inc. Form 10-K
Level 3: Unobservable inputs that are supported by little or no market data and require the use of significantmanagement judgment. These values are generally determined using pricing models for which the assumptions utilizemanagement’s estimates of market participant assumptions.
Assets and liabilities measured at fair value are classified in their entirety based on the lowest level of input that issignificant to the fair value measurement. Our assessment of the significance of a particular input to the fair valuemeasurement in its entirety requires judgment and considers factors specific to the asset or liability. Our financialinstruments include cash, cash equivalents, investments, receivables, accounts payable and certain other accruedliabilities. The fair value of cash, cash equivalents, receivables, accounts payable and certain other accrued liabilitiesare valued at their carrying value, which approximates fair value due to their short maturities. See Note 5, ‘‘Fair ValueMeasurements’’ for further information on fair value measurement of our financial and nonfinancial assets andliabilities.
Inventories. Inventories include material, labor and manufacturing overhead, and are stated at the lower of standardcost (which approximates actual cost using the first-in, first-out method) or market. Provisions for excess, obsoleteand unusable inventories are determined primarily by management’s evaluation of future demand of our products andmarket conditions. We account for the provisions of excess, obsolete and unusable inventories as a charge to cost ofrevenues, and a new, lower-cost basis for that inventory is established and subsequent changes in facts andcircumstances do not result in the restoration or increase in that newly established cost basis.
Investment in Unconsolidated Affiliate. In February 2011, we purchased a 15% equity ownership interest inScandinavian Micro Biodevices APS (‘‘SMB’’) for $2.8 million in cash. We use the equity method to account for ourinvestment in this entity because we do not control it, but have the ability to exercise significant influence over it.Equity method investments are recorded at original cost and adjusted periodically to recognize (1) our proportionateshare of the investees’ net income or losses after the date of investment, (2) additional contributions made anddividends or distributions received, and (3) impairment losses resulting from adjustments to net realizable value. Weeliminate all intercompany transactions in accounting for our equity method investments. During fiscal 2016, 2015and 2014, we recorded our proportionate share of the investee’s net income or loss in ‘‘Interest and other income(expense), net’’ on the consolidated statements of income.
We assess the potential impairment of our equity method investments when indicators such as a history of operatinglosses, a negative earnings and cash flow outlook, and the financial condition and prospects for the investee’sbusiness segment might indicate a loss in value. We did not recognize any impairment loss on investment inunconsolidated affiliate during fiscal 2016, 2015 or 2014.
Property and Equipment. Property and equipment are stated at cost, net of accumulated depreciation andamortization. Depreciation and amortization expense is calculated using the straight-line method using the estimateduseful lives of the assets. The table below provides estimated useful lives of property and equipment by assetclassification.
Asset Classification Estimated Useful Life
Machinery and equipment 2-15 yearsFurniture and fixtures 3-8 yearsComputer equipment 2-7 yearsBuilding 25 yearsLeasehold improvements Shorter of estimated useful life or remaining lease term
Construction in progress primarily consists of purchased material and internal payroll and related costs used in thedevelopment of production lines. We did not capitalize interest on constructed assets during fiscal 2016 or 2015 dueto immateriality.
Property and equipment includes instruments transferred from inventory and held for loan or evaluation ordemonstration purposes to customers. Units held for loan, evaluation or demonstration purposes are carried at costand depreciated over their estimated useful lives of three to five years. Depreciation expense related to theseinstruments is recorded in cost of revenues or in the respective operating expense line based on the function andpurpose for which it is being used. Proceeds from the sale of evaluation units are recorded as revenue.
Intangible Assets. Intangible assets, consisted of customer relationships, tradename, licenses and other rightsacquired from third parties, are presented at cost, net of accumulated amortization. The intangible assets are
67
Abaxis, Inc. Form 10-K
amortized using the straight-line method over their estimated useful lives of 2-10 years, which approximates theeconomic benefit. If our underlying assumptions regarding the estimated useful life of an intangible asset change,then the amortization period, amortization expense and the carrying value for such asset would be adjustedaccordingly. During fiscal 2016, 2015 and 2014, our changes in estimated useful life of intangible assets were notsignificant, except as noted below in ‘‘Valuation of Long-Lived Assets.’’
Valuation of Long-Lived Assets. We evaluate the carrying value of our long-lived assets, such as property andequipment and amortized intangible assets, whenever events or changes in business circumstances or our planned useof long-lived assets indicate that the carrying amount of an asset may not be fully recoverable or their useful livesare no longer appropriate. We look to current and future profitability, as well as current and future undiscounted cashflows, excluding financing costs, as primary indicators of recoverability. An impairment loss would be recognizedwhen the sum of the undiscounted future net cash flows expected to result from the use of the asset and its eventualdisposal is less than the carrying amount. If impairment is determined to exist, any related impairment loss iscalculated based on fair value and long-lived assets are written down to their respective fair values. During fiscal2016, 2015 and 2014, we recognized impairment charges on long-lived assets of $13,000, $1.9 million and $0,respectively. The impairment charges on our long-lived assets in fiscal 2015 were in relation to the property andequipment and intangible assets of the AVRL business, which has been offset against the gain from the sale of AVRLon the consolidated statement of income for fiscal 2015.
Revenue Recognition. Revenues from product sales and services, net of estimated sales allowances, discounts andrebates, are recognized when the following four criteria are met:
• Evidence of an arrangement exists: Persuasive evidence of an arrangement with a customer that reflects theterms and conditions to deliver products or render services must exist in order to recognize revenue.
• Upon shipment of the products or rendering of services to the customer: Delivery is considered to occur at thetime of shipment of products to a distributor or direct customer, as title and risk of loss have been transferredto the distributor or direct customer on delivery to the common carrier. Rights of return are not provided. Forservices, delivery was considered to occur as the service was provided. Service revenues were primarilygenerated from veterinary reference laboratory diagnostic and consulting services for veterinarians. Net servicerevenues were recognized at the time services were performed.
• Fixed or determinable sales price: When the sales price is fixed or determinable that amount is recognized asrevenue.
• Collection is reasonably assured: Collection is deemed probable if a customer is expected to be able to payamounts under the arrangement as those amounts become due. Revenue is recognized when collectibility of theresulting receivable is reasonably assured.
Amounts collected in advance of revenue recognition are recorded as a current or non-current deferred revenueliability based on the time from the balance sheet date to the future date of revenue recognition. We recognize revenueassociated with extended maintenance agreements ratably over the life of the contract. Until March 2015, we offereddiscounts on AVRL services for a specified period as incentives. Discounts were reductions to invoiced amountswithin a specified period and were recorded at the time services are performed.
Multiple Element Revenue Arrangements. Our sales arrangements may contain multiple element revenuearrangements in which a customer may purchase a combination of instruments, consumables or extendedmaintenance agreements. Additionally, we provide incentives in the form of free goods or extended maintenanceagreements to customers in connection with the sale of our instruments. We participate in selling arrangements in theveterinary market that include multiple deliverables, such as instruments and consumables. Prior to the sale of ourAVRL business to Antech in March 2015, our selling arrangements in the veterinary market had also included serviceagreements associated with our veterinary reference laboratory. Judgments as to the allocation of consideration froman arrangement to the multiple elements of the arrangement, and the appropriate timing of revenue recognition arecritical with respect to these arrangements.
A multiple element arrangement includes the sale of one or more tangible product offerings with one or moreassociated services offerings, each of which are individually considered separate units of accounting. We allocaterevenues to each element in a multiple element arrangement based upon the relative selling price of each deliverable.When applying the relative selling price method, we determine the selling price for each deliverable using
68
Abaxis, Inc. Form 10-K
vendor-specific objective evidence (‘‘VSOE’’) of selling price, if it exists, or third-party evidence (‘‘TPE’’) of sellingprice. If neither VSOE nor TPE of selling price exist for a deliverable, we use our best estimate of selling price forthat deliverable. Revenue allocated to each element is then recognized when all revenue recognition criteria are metfor each element.
Revenues from our multiple element arrangements are allocated separately to the instruments, consumables, extendedmaintenance agreements and incentives based on the relative selling price method. Amounts allocated to eachelement are based on its objectively determined fair value, such as the sales price for the product when it is soldseparately. Revenues allocated to each element are then recognized when the basic revenue recognition criteria, asdescribed above, are met for each element. Revenues associated with incentives in the form of free goods are deferreduntil the goods are shipped to the customer. Revenues associated with incentives in the form of extended maintenanceagreements are deferred and recognized ratably over the life of the extended maintenance contract, generally one tothree years. Incentives in the form of extended maintenance agreements are our most significant multiple elementarrangement.
For our selling arrangements in the veterinary market that include multiple deliverables, such as instruments,consumables or service agreements (prior to the sale of AVRL in March 2015) associated with our veterinaryreference laboratory, revenue is recognized upon delivery of the product or performance of the service during the termof the service contract when the basic revenue recognition criteria, as described above, are met for each element. Weallocate revenues to each element based on the relative selling price of each deliverable. Amounts allocated to eachelement are based on its objectively determined fair value, such as the sales price for the product or service when itis sold separately.
Until March 2015, we offered customer incentives consisting of arrangements with customers to include discountson future sales of services associated with our veterinary reference laboratory. We applied judgment in determiningwhether future discounts are significant and incremental. When the future discount offered was not consideredsignificant and incremental, we did not account for the discount as an element of the original arrangement. Todetermine whether a discount was significant and incremental, we looked to the discount provided in comparison tostandalone sales of the same product to similar customers, the level of discount provided on other elements in thearrangement, and the significance of the discount to the overall arrangement. If the discount in the multiple elementarrangement approximated the discount typically provided in standalone sales, that discount is not consideredincremental. During fiscal 2015 and 2014, our customer incentive programs with future discounts were not significantand in fiscal 2016 we did not offer any such incentives.
Starting in fiscal 2016, we entered into sales contracts as the lessor of instruments under sales-type lease agreementswith our customers. In the veterinary market, we may offer arrangements to end users for monthly payments ofinstrument and consumable purchases over a term of six years. The present value of lease receivables, includingaccrued interest, was $2.1 million and $0, as of March 31, 2016 and 2015, respectively. Our short-term and long-termlease receivables are recorded within ‘‘Receivables’’ and ‘‘Other Assets,’’ respectively, on our consolidated balancesheets. Interest income is recognized monthly over the lease term using the effective-interest method.
Customer Programs. From time to time, we offer customer marketing and incentive programs. Our most significantcustomer programs are described as follows:
Instrument Trade-In Programs. We periodically offer trade-in programs to customers for trading in an existinginstrument to purchase a new instrument and we will either provide incentives in the form of free goods or reducethe sales price of the instrument. These incentives in the form of free goods are recorded based on the relative sellingprice method according to the policies described above.
Instrument Rental Programs. We periodically offer programs to customers whereby certain instruments are madeavailable to customers for rent or on an evaluation basis. These programs typically require customers to purchase aminimum quantity of consumables during a specified period for which we recognize revenue on the relatedconsumables according to the policies described above. Depending on the program offered, customers may purchasethe instrument during the rental or evaluation period. Proceeds from such sale are recorded as revenue according tothe policies described above. Rental income, if any, is also recorded as revenue according to the policies describedabove.
Sales Incentive Programs. We periodically offer customer sales incentive programs and we record reductions torevenue related to these programs. Incentives may be provided in the form of rebates to distributors for volume-based
69
Abaxis, Inc. Form 10-K
purchases or upon meeting other specified requirements, end-user rebates and discounts. A summary of our revenuereductions is described below. Other rebate programs offered to distributors or customers vary from period to periodin the medical and veterinary markets and were not significant.
• Volume-based Incentives. Volume-based incentives, in the form of rebates, are offered from time to time todistributors and group purchasing organizations upon meeting the sales volume requirements during a qualifyingperiod and are recorded as a reduction to gross revenues during a qualifying period. The pricing rebate programis primarily offered to distributors and group purchasing organizations in the North America veterinary market,upon meeting the sales volume requirements of veterinary products during the qualifying period. Factors usedin the rebate calculations include the identification of products sold subject to a rebate during the qualifyingperiod and which rebate percentage applies. Based on these factors and using historical trends, adjusted forcurrent changes, we estimate the amount of the rebate and record the rebate as a deduction to gross revenueswhen we record the sale of the product. The rebate is recorded as a reserve to offset accounts receivable assettlements are made through offsets to outstanding customer invoices. Settlement of the rebate accruals fromthe date of sale ranges from one to nine months after sale. Changes in the rebate accrual at the end of each periodare based upon distributors and group purchasing organizations meeting the purchase requirements during thequarter.
• Distributor Rebate Incentives. During fiscal 2016 and 2015, we offered a customer sales incentive program,whereby distributors were offered a rebate upon meeting certain requirements. We recognize the rebateobligation as a reduction of revenue at the later of the date on which we sell the product or the date the programis offered. These customer sales incentive programs require management to estimate the rebate amounts todistributors who will qualify for the incentive during the promotional period. We record the estimated liabilityin other current accrued liabilities on our consolidated balance sheet. Management’s estimates are based onhistorical experience and the specific terms and conditions of the incentive programs.
• End-User Rebates and Discounts. From time to time, cash rebates are offered to end-users who purchase certainproducts or instruments during a promotional period and are recorded as a reduction to gross revenues.Additionally, we periodically offer sales incentives to end-users, in the form of sales discounts, to purchaseconsumables for a specified promotional period, typically over five years from the sale of our instrument, andwe reimburse resellers for the value of the sales discount provided to the end-user. We estimate the amount ofthe incentive earned by end-users during a quarter and record a liability to the reseller as a reduction to grossrevenues. Factors used in the liability calculation of incentives earned by end-users include the identification ofqualified end-users under the sales program during the period and using historical trends. Settlement of theliability to the reseller ranges from one to twelve months from the date an end-user earns the incentive.
Royalty Revenues. Royalties are typically based on licensees’ net sales of products that utilize our technology andare recognized as earned in accordance with the contract terms when royalties from licensees can be reliablymeasured and collectibility is reasonably assured, such as upon the receipt of a royalty statement from the licensee.
Allowance for Doubtful Accounts. We recognize revenue when collection from the customer is reasonably assured.We maintain an allowance for doubtful accounts based on our assessment of the collectability of the amounts owedto us by our customers. We regularly review the allowance and consider the following factors in determining the levelof allowance required: the customer’s payment history, the age of the receivable balance, the credit quality of ourcustomers, the general financial condition of our customer base and other factors that may affect the customers’ability to pay. An additional allowance is recorded based on certain percentages of our aged receivables, usinghistorical experience to estimate the potential uncollectible. Account balances are charged off against the allowancewhen we believe it is probable the receivable will not be recovered.
Shipping and Handling. In a sale transaction we recognize amounts billed to customers for shipping and handlingas revenue. Shipping and handling costs incurred for inventory purchases and product shipments are recorded in costof revenues.
Research and Development Expenses. Research and development expenses, including internally developedsoftware costs, are expensed as incurred and include expenses associated with new product research and regulatoryactivities. Our products include certain software applications that are resident in the product. The costs to developsuch software have not been capitalized as we believe our current software development processes are completedconcurrent with the establishment of technological feasibility of the software.
70
Abaxis, Inc. Form 10-K
Advertising Expenses. Costs of advertising, which are recognized as sales and marketing expenses, are generallyexpensed in the period incurred. Advertising expenses were $0.7 million, $0.9 million and $0.8 million for fiscal2016, 2015 and 2014, respectively.
Income Taxes. We account for income taxes using the liability method under which deferred tax assets and liabilitiesare determined based on the differences between the financial statement carrying amounts of existing assets andliabilities and their respective tax bases. Deferred tax assets and liabilities are measured using enacted tax ratesexpected to apply to taxable income in the years in which those temporary differences are expected to be recoveredor settled. Valuation allowances are established, when necessary, to reduce deferred tax assets to the amountsexpected to be recovered.
We recognize and measure benefits for uncertain tax positions using a two-step approach. The first step is to evaluatethe tax position taken or expected to be taken in a tax return by determining if the weight of evidence indicates thatit is more likely than not that the tax position will be sustained upon audit, including resolution of any related appealsor litigation processes. For tax positions that are more likely than not to be sustained upon audit, the second step isto measure the tax benefit as the largest amount that is more than 50 percent likely to be realized upon settlement.Significant judgment is required to evaluate uncertain tax positions. At March 31, 2016 and 2015, we had nosignificant uncertain tax positions. Our policy is to include interest and penalties related to gross unrecognized taxbenefits within our provision for income taxes. For fiscal 2016, 2015 and 2014, we did not recognize any interest orpenalties related to uncertain tax positions in the consolidated statements of income, and at March 31, 2016 and 2015,we had no accrued interest or penalties.
Share-Based Compensation Expense. We account for share-based compensation in accordance with ASC 718,‘‘Compensation-Stock Compensation.’’ We recognize share-based compensation expense, net of an estimatedforfeiture rate, over the requisite service period of the award to employees and directors. As required by fair valueprovisions of share-based compensation, employee share-based compensation expense recognized is calculated overthe requisite service period of the awards and reduced for estimated forfeitures. The forfeiture rate is estimated basedon historical data of our share-based compensation awards that are granted and cancelled prior to vesting and uponhistorical experience of employee turnover. For restricted stock units, share-based compensation expense is based onthe fair value of our stock at the grant date and recognized net of an estimated forfeiture rate, over the requisite serviceperiod of the award.
Net Income Per Share. Basic net income per share is computed by dividing net income by the weighted averagenumber of common shares outstanding during the period. Diluted net income per share is computed by dividing netincome by the weighted average number of common shares that would have been outstanding during the periodassuming the issuance of common shares for all potential dilutive common shares outstanding using the treasurystock method. Dilutive potential common shares outstanding include outstanding stock options, restricted stock unitsand warrants.
Comprehensive Income. Comprehensive income generally represents all changes in shareholders’ equity during aperiod, resulting from net income and transactions from non-owner sources. Comprehensive income consists of netincome and the net-of-tax amounts for unrealized gain (loss) on available-for-sale investments (difference betweenthe cost and fair market value). For the periods presented, the accumulated other comprehensive income (loss)consisted of the unrealized gains or losses on the Company’s available-for-sale investments, net of tax.
Foreign Currency. The U.S. dollar is the functional currency for our international subsidiaries. Foreign currencytransactions of our subsidiaries are remeasured into U.S. dollars at the end-of-period exchange rates for monetaryassets and liabilities, and historical exchange rates for nonmonetary assets. Accordingly, the effects of foreigncurrency transactions, and of remeasuring the financial condition into the functional currency resulted in foreigncurrency gains and (losses), which were included in ‘‘Interest and other income (expense), net’’ on the consolidatedstatements of income and were $0.1 million, $(1.8) million and $0.5 million for fiscal 2016, 2015 and 2014,respectively.
Recent Accounting Pronouncements
Revenue from Contracts with Customers: In May 2014, the FASB issued Accounting Standards Update (‘‘ASU’’)No. 2014-09, ‘‘Revenue from Contracts with Customers (Topic 606),’’ (‘‘ASU 2014-09’’), which supersedes therevenue recognition requirements in ASC 605, ‘‘Revenue Recognition.’’ ASU 2014-09 is based on the principle thatrevenue is recognized to depict the transfer of goods or services to customers in an amount that reflects the
71
Abaxis, Inc. Form 10-K
consideration to which the entity expects to be entitled in exchange for those goods or services. It also requiresadditional disclosure about the nature, amount, timing and uncertainty of revenue and cash flows arising fromcustomer contracts, including significant judgments and changes in judgments and assets recognized from costsincurred to obtain or fulfill a contract. On July 9, 2015, the FASB decided to delay the effective date of the newstandard by one year. ASU 2014-09 is effective for fiscal years beginning after December 15, 2017, including interimperiods within those fiscal years. We are evaluating the impact of the adoption of this standard on our consolidatedfinancial statements.
Simplifying the Measurement of Inventory: In July 2015, the FASB issued ASU No. 2015-11, ‘‘Simplifying theMeasurement of Inventory (Topic 330),’’ (‘‘ASU 2015-11’’), which amends the guidelines for the measurement ofinventory. Under the amendments, an entity should measure inventory valued using a first-in, first-out or average costmethod at the lower of cost and net realizable value. Net realizable value is defined as the estimated selling price inthe ordinary course of business, less reasonably predictable costs of completion, disposal and transportation. ASU2015-11 is effective for fiscal years beginning after December 15, 2016, including interim periods within those fiscalyears. Early adoption is permitted. We are evaluating the impact of the adoption of this standard on our consolidatedfinancial statements.
Balance Sheet Classification of Deferred Taxes: In November 2015, the FASB issued ASU No. 2015-17, ‘‘BalanceSheet Classification of Deferred Taxes (Topic 740),’’ (‘‘ASU 2015-17’’), which amends the accounting guidancerelated to balance sheet classification of deferred taxes. The amendment requires that deferred tax assets andliabilities be classified as noncurrent in the statement of financial position, thereby simplifying the current guidancethat requires an entity to separate deferred tax assets and liabilities into current and noncurrent amounts. ASU2015-17 is effective beginning in the first quarter of fiscal year 2018. Early adoption is permitted. The amendmentcan be adopted either prospectively or retrospectively. We are evaluating the impact of the adoption of this standardon our consolidated financial statements.
Recognition and Measurement of Financial Assets and Financial Liabilities: In January 2016, the FASB issuedASU No. 2016-01, ‘‘Recognition and Measurement of Financial Assets and Financial Liabilities (Subtopic 825-10),’’(‘‘ASU 2016-01’’), which changes accounting for equity investments, financial liabilities under the fair value optionand the presentation and disclosure requirements for financial instruments. In addition, it clarified guidance relatedto the valuation allowance assessment when recognizing deferred tax assets resulting from unrealized losses onavailable-for-sale debt securities. ASU 2016-01 is effective beginning in the first quarter of fiscal year 2019. Earlyadoption is permitted. We are evaluating the impact of the adoption of this standard on our consolidated financialstatements.
Leases: In February 2016, the FASB issued ASU No. 2016-02, ‘‘Leases (Topic 842),’’ (‘‘ASU 2016-02’’), whichamends a number of aspects of lease accounting, including requiring lessees to recognize almost all leases with a termgreater than one year as a right-of-use asset and corresponding liability, measured at the present value of the leasepayments. ASU 2016-02 is effective for us beginning in the first quarter of fiscal year 2020 and is required to beadopted using a modified retrospective approach. Early adoption is permitted. We are evaluating the impact of theadoption of this standard on our consolidated financial statements.
Employee Share-Based Payment Accounting: In March 2016, the FASB issued ASU No. 2016-09, ‘‘Improvementsto Employee Share-Based Payment Accounting (Topic 718),’’ (‘‘ASU 2016-09’’), which simplifies several aspects ofemployee share-based payment accounting, including the income tax consequences, classification of awards as eitherequity or liabilities and classification on the statement of cash flows. ASU 2016-09 will become effective for usbeginning in the first quarter of fiscal year 2018. Early adoption is permitted. We are evaluating the impact of theadoption of this standard on our consolidated financial statements.
NOTE 2. ACQUISITIONS
In November 2014, we entered into Share Purchase Agreements, through our wholly-owned subsidiary, pursuant towhich, we acquired 100% of the outstanding stock of Quality Clinical Reagents Limited (‘‘QCR’’) and TrioDiagnostics (Ireland) Ltd (‘‘Trio’’), both based in the United Kingdom. QCR and Trio are distributors of laboratory
72
Abaxis, Inc. Form 10-K
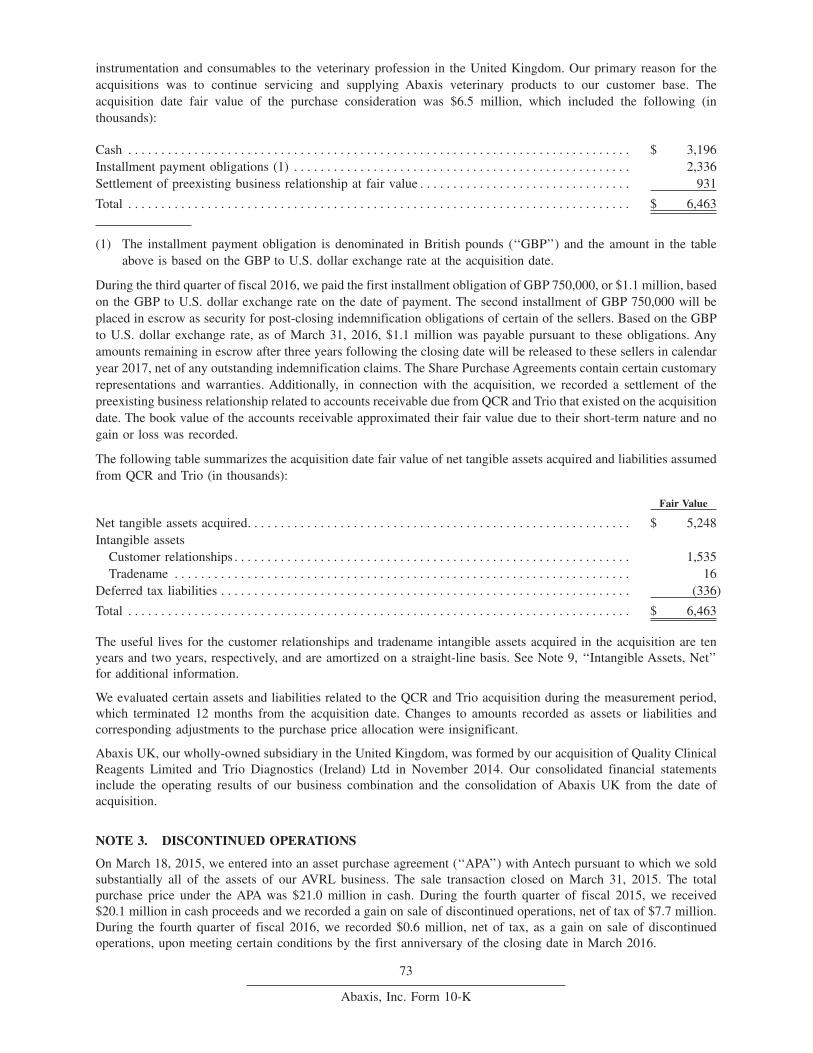
instrumentation and consumables to the veterinary profession in the United Kingdom. Our primary reason for theacquisitions was to continue servicing and supplying Abaxis veterinary products to our customer base. Theacquisition date fair value of the purchase consideration was $6.5 million, which included the following (inthousands):
Cash . . . . . . . . . . . . . . . . . . . . . . . . . . . . . . . . . . . . . . . . . . . . . . . . . . . . . . . . . . . . . . . . . . . . . . . . . . . . $ 3,196Installment payment obligations (1) . . . . . . . . . . . . . . . . . . . . . . . . . . . . . . . . . . . . . . . . . . . . . . . . . . . 2,336Settlement of preexisting business relationship at fair value . . . . . . . . . . . . . . . . . . . . . . . . . . . . . . . . 931
Total . . . . . . . . . . . . . . . . . . . . . . . . . . . . . . . . . . . . . . . . . . . . . . . . . . . . . . . . . . . . . . . . . . . . . . . . . . . . $ 6,463
(1) The installment payment obligation is denominated in British pounds (‘‘GBP’’) and the amount in the tableabove is based on the GBP to U.S. dollar exchange rate at the acquisition date.
During the third quarter of fiscal 2016, we paid the first installment obligation of GBP 750,000, or $1.1 million, basedon the GBP to U.S. dollar exchange rate on the date of payment. The second installment of GBP 750,000 will beplaced in escrow as security for post-closing indemnification obligations of certain of the sellers. Based on the GBPto U.S. dollar exchange rate, as of March 31, 2016, $1.1 million was payable pursuant to these obligations. Anyamounts remaining in escrow after three years following the closing date will be released to these sellers in calendaryear 2017, net of any outstanding indemnification claims. The Share Purchase Agreements contain certain customaryrepresentations and warranties. Additionally, in connection with the acquisition, we recorded a settlement of thepreexisting business relationship related to accounts receivable due from QCR and Trio that existed on the acquisitiondate. The book value of the accounts receivable approximated their fair value due to their short-term nature and nogain or loss was recorded.
The following table summarizes the acquisition date fair value of net tangible assets acquired and liabilities assumedfrom QCR and Trio (in thousands):
Fair Value
Net tangible assets acquired. . . . . . . . . . . . . . . . . . . . . . . . . . . . . . . . . . . . . . . . . . . . . . . . . . . . . . . . . . $ 5,248Intangible assets
Customer relationships . . . . . . . . . . . . . . . . . . . . . . . . . . . . . . . . . . . . . . . . . . . . . . . . . . . . . . . . . . . . 1,535Tradename . . . . . . . . . . . . . . . . . . . . . . . . . . . . . . . . . . . . . . . . . . . . . . . . . . . . . . . . . . . . . . . . . . . . . 16
Deferred tax liabilities . . . . . . . . . . . . . . . . . . . . . . . . . . . . . . . . . . . . . . . . . . . . . . . . . . . . . . . . . . . . . . (336)
Total . . . . . . . . . . . . . . . . . . . . . . . . . . . . . . . . . . . . . . . . . . . . . . . . . . . . . . . . . . . . . . . . . . . . . . . . . . . . $ 6,463
The useful lives for the customer relationships and tradename intangible assets acquired in the acquisition are tenyears and two years, respectively, and are amortized on a straight-line basis. See Note 9, ‘‘Intangible Assets, Net’’for additional information.
We evaluated certain assets and liabilities related to the QCR and Trio acquisition during the measurement period,which terminated 12 months from the acquisition date. Changes to amounts recorded as assets or liabilities andcorresponding adjustments to the purchase price allocation were insignificant.
Abaxis UK, our wholly-owned subsidiary in the United Kingdom, was formed by our acquisition of Quality ClinicalReagents Limited and Trio Diagnostics (Ireland) Ltd in November 2014. Our consolidated financial statementsinclude the operating results of our business combination and the consolidation of Abaxis UK from the date ofacquisition.
NOTE 3. DISCONTINUED OPERATIONS
On March 18, 2015, we entered into an asset purchase agreement (‘‘APA’’) with Antech pursuant to which we soldsubstantially all of the assets of our AVRL business. The sale transaction closed on March 31, 2015. The totalpurchase price under the APA was $21.0 million in cash. During the fourth quarter of fiscal 2015, we received$20.1 million in cash proceeds and we recorded a gain on sale of discontinued operations, net of tax of $7.7 million.During the fourth quarter of fiscal 2016, we recorded $0.6 million, net of tax, as a gain on sale of discontinuedoperations, upon meeting certain conditions by the first anniversary of the closing date in March 2016.
73
Abaxis, Inc. Form 10-K
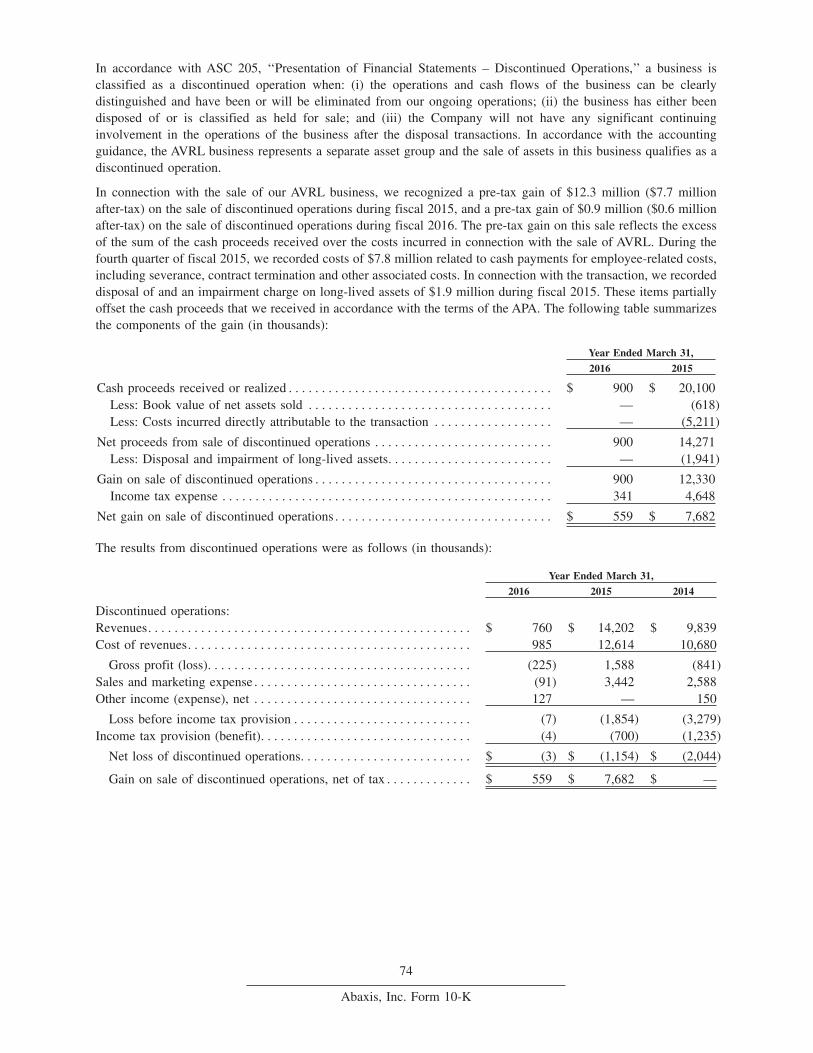
In accordance with ASC 205, ‘‘Presentation of Financial Statements – Discontinued Operations,’’ a business isclassified as a discontinued operation when: (i) the operations and cash flows of the business can be clearlydistinguished and have been or will be eliminated from our ongoing operations; (ii) the business has either beendisposed of or is classified as held for sale; and (iii) the Company will not have any significant continuinginvolvement in the operations of the business after the disposal transactions. In accordance with the accountingguidance, the AVRL business represents a separate asset group and the sale of assets in this business qualifies as adiscontinued operation.
In connection with the sale of our AVRL business, we recognized a pre-tax gain of $12.3 million ($7.7 millionafter-tax) on the sale of discontinued operations during fiscal 2015, and a pre-tax gain of $0.9 million ($0.6 millionafter-tax) on the sale of discontinued operations during fiscal 2016. The pre-tax gain on this sale reflects the excessof the sum of the cash proceeds received over the costs incurred in connection with the sale of AVRL. During thefourth quarter of fiscal 2015, we recorded costs of $7.8 million related to cash payments for employee-related costs,including severance, contract termination and other associated costs. In connection with the transaction, we recordeddisposal of and an impairment charge on long-lived assets of $1.9 million during fiscal 2015. These items partiallyoffset the cash proceeds that we received in accordance with the terms of the APA. The following table summarizesthe components of the gain (in thousands):
Year Ended March 31,
2016 2015
Cash proceeds received or realized . . . . . . . . . . . . . . . . . . . . . . . . . . . . . . . . . . . . . . . . $ 900 $ 20,100Less: Book value of net assets sold . . . . . . . . . . . . . . . . . . . . . . . . . . . . . . . . . . . . . — (618)Less: Costs incurred directly attributable to the transaction . . . . . . . . . . . . . . . . . . — (5,211)
Net proceeds from sale of discontinued operations . . . . . . . . . . . . . . . . . . . . . . . . . . . 900 14,271Less: Disposal and impairment of long-lived assets. . . . . . . . . . . . . . . . . . . . . . . . . — (1,941)
Gain on sale of discontinued operations . . . . . . . . . . . . . . . . . . . . . . . . . . . . . . . . . . . . 900 12,330Income tax expense . . . . . . . . . . . . . . . . . . . . . . . . . . . . . . . . . . . . . . . . . . . . . . . . . . 341 4,648
Net gain on sale of discontinued operations . . . . . . . . . . . . . . . . . . . . . . . . . . . . . . . . . $ 559 $ 7,682
The results from discontinued operations were as follows (in thousands):
Year Ended March 31,
2016 2015 2014
Discontinued operations:Revenues. . . . . . . . . . . . . . . . . . . . . . . . . . . . . . . . . . . . . . . . . . . . . . . . . $ 760 $ 14,202 $ 9,839Cost of revenues. . . . . . . . . . . . . . . . . . . . . . . . . . . . . . . . . . . . . . . . . . . 985 12,614 10,680
Gross profit (loss). . . . . . . . . . . . . . . . . . . . . . . . . . . . . . . . . . . . . . . . (225) 1,588 (841)Sales and marketing expense . . . . . . . . . . . . . . . . . . . . . . . . . . . . . . . . . (91) 3,442 2,588Other income (expense), net . . . . . . . . . . . . . . . . . . . . . . . . . . . . . . . . . 127 — 150
Loss before income tax provision . . . . . . . . . . . . . . . . . . . . . . . . . . . (7) (1,854) (3,279)Income tax provision (benefit). . . . . . . . . . . . . . . . . . . . . . . . . . . . . . . . (4) (700) (1,235)
Net loss of discontinued operations. . . . . . . . . . . . . . . . . . . . . . . . . . $ (3) $ (1,154) $ (2,044)
Gain on sale of discontinued operations, net of tax . . . . . . . . . . . . . $ 559 $ 7,682 $ —
74
Abaxis, Inc. Form 10-K
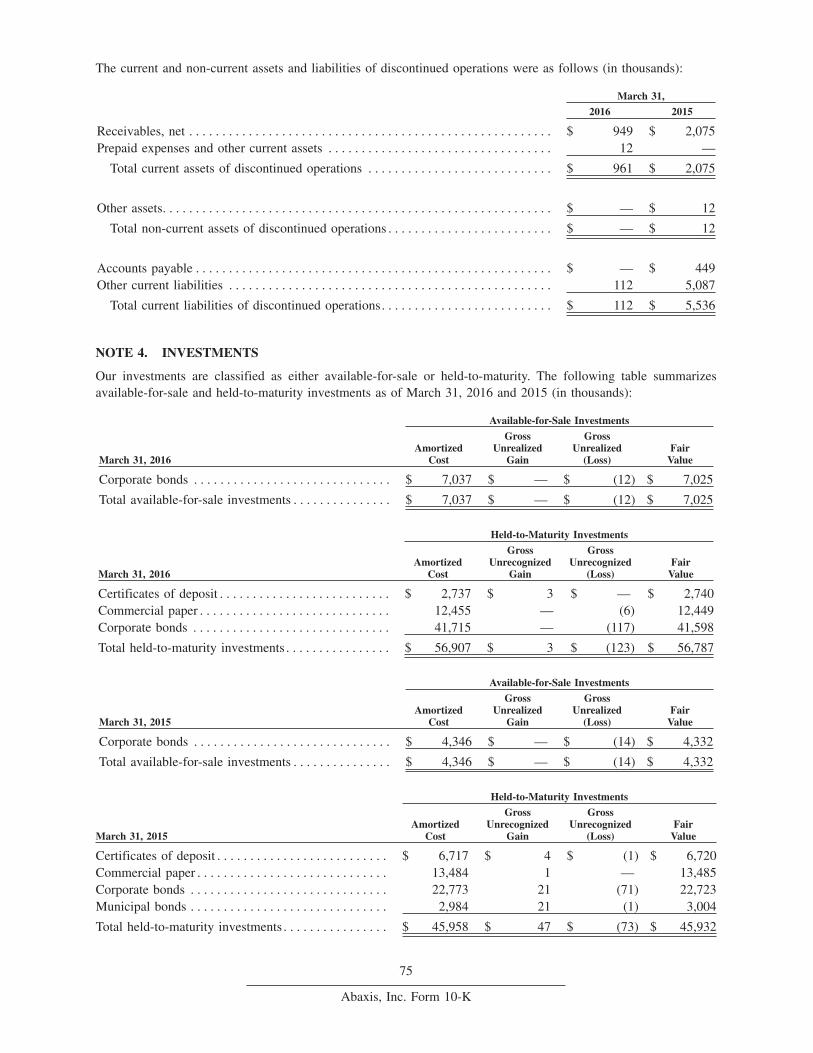
The current and non-current assets and liabilities of discontinued operations were as follows (in thousands):
March 31,
2016 2015
Receivables, net . . . . . . . . . . . . . . . . . . . . . . . . . . . . . . . . . . . . . . . . . . . . . . . . . . . . . . . $ 949 $ 2,075Prepaid expenses and other current assets . . . . . . . . . . . . . . . . . . . . . . . . . . . . . . . . . . 12 —
Total current assets of discontinued operations . . . . . . . . . . . . . . . . . . . . . . . . . . . . $ 961 $ 2,075
Other assets. . . . . . . . . . . . . . . . . . . . . . . . . . . . . . . . . . . . . . . . . . . . . . . . . . . . . . . . . . . $ — $ 12
Total non-current assets of discontinued operations . . . . . . . . . . . . . . . . . . . . . . . . . $ — $ 12
Accounts payable . . . . . . . . . . . . . . . . . . . . . . . . . . . . . . . . . . . . . . . . . . . . . . . . . . . . . . $ — $ 449Other current liabilities . . . . . . . . . . . . . . . . . . . . . . . . . . . . . . . . . . . . . . . . . . . . . . . . . 112 5,087
Total current liabilities of discontinued operations. . . . . . . . . . . . . . . . . . . . . . . . . . $ 112 $ 5,536
NOTE 4. INVESTMENTS
Our investments are classified as either available-for-sale or held-to-maturity. The following table summarizesavailable-for-sale and held-to-maturity investments as of March 31, 2016 and 2015 (in thousands):
Available-for-Sale Investments
March 31, 2016Amortized
Cost
GrossUnrealized
Gain
GrossUnrealized
(Loss)Fair
Value
Corporate bonds . . . . . . . . . . . . . . . . . . . . . . . . . . . . . . $ 7,037 $ — $ (12) $ 7,025
Total available-for-sale investments . . . . . . . . . . . . . . . $ 7,037 $ — $ (12) $ 7,025
Held-to-Maturity Investments
March 31, 2016Amortized
Cost
GrossUnrecognized
Gain
GrossUnrecognized
(Loss)Fair
Value
Certificates of deposit . . . . . . . . . . . . . . . . . . . . . . . . . . $ 2,737 $ 3 $ — $ 2,740Commercial paper . . . . . . . . . . . . . . . . . . . . . . . . . . . . . 12,455 — (6) 12,449Corporate bonds . . . . . . . . . . . . . . . . . . . . . . . . . . . . . . 41,715 — (117) 41,598
Total held-to-maturity investments . . . . . . . . . . . . . . . . $ 56,907 $ 3 $ (123) $ 56,787
Available-for-Sale Investments
March 31, 2015Amortized
Cost
GrossUnrealized
Gain
GrossUnrealized
(Loss)Fair
Value
Corporate bonds . . . . . . . . . . . . . . . . . . . . . . . . . . . . . . $ 4,346 $ — $ (14) $ 4,332
Total available-for-sale investments . . . . . . . . . . . . . . . $ 4,346 $ — $ (14) $ 4,332
Held-to-Maturity Investments
March 31, 2015Amortized
Cost
GrossUnrecognized
Gain
GrossUnrecognized
(Loss)Fair
Value
Certificates of deposit . . . . . . . . . . . . . . . . . . . . . . . . . . $ 6,717 $ 4 $ (1) $ 6,720Commercial paper . . . . . . . . . . . . . . . . . . . . . . . . . . . . . 13,484 1 — 13,485Corporate bonds . . . . . . . . . . . . . . . . . . . . . . . . . . . . . . 22,773 21 (71) 22,723Municipal bonds . . . . . . . . . . . . . . . . . . . . . . . . . . . . . . 2,984 21 (1) 3,004
Total held-to-maturity investments . . . . . . . . . . . . . . . . $ 45,958 $ 47 $ (73) $ 45,932
75
Abaxis, Inc. Form 10-K
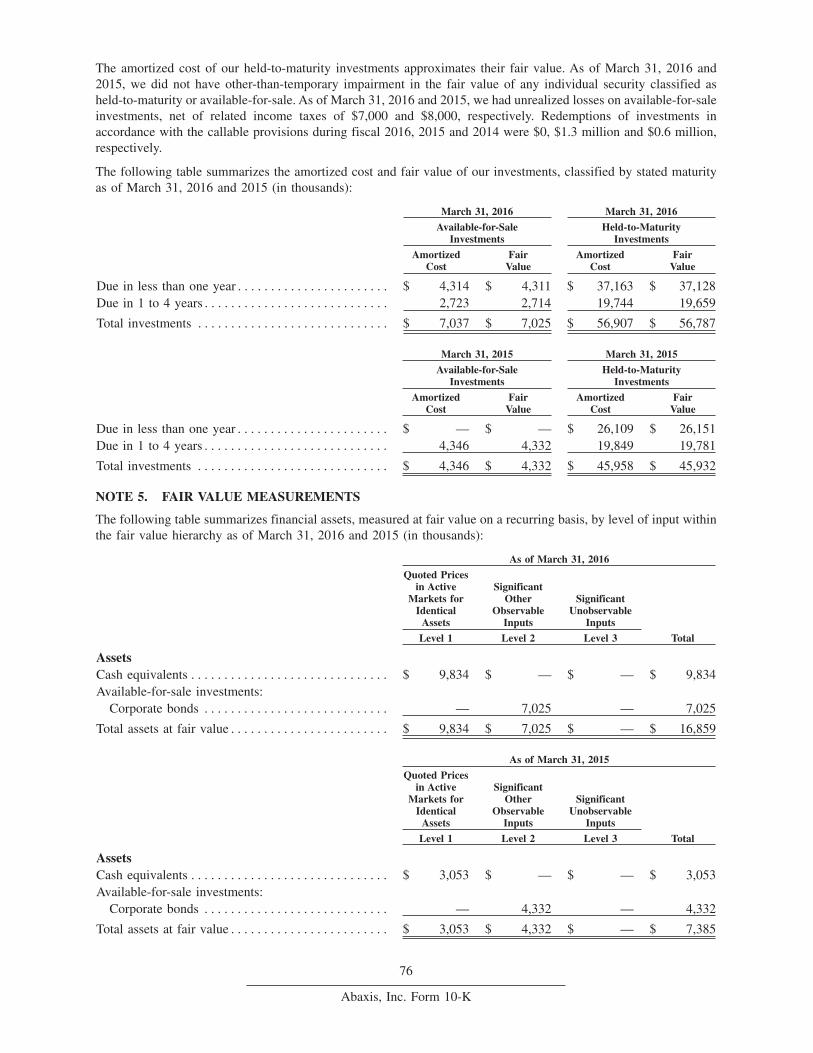
The amortized cost of our held-to-maturity investments approximates their fair value. As of March 31, 2016 and2015, we did not have other-than-temporary impairment in the fair value of any individual security classified asheld-to-maturity or available-for-sale. As of March 31, 2016 and 2015, we had unrealized losses on available-for-saleinvestments, net of related income taxes of $7,000 and $8,000, respectively. Redemptions of investments inaccordance with the callable provisions during fiscal 2016, 2015 and 2014 were $0, $1.3 million and $0.6 million,respectively.
The following table summarizes the amortized cost and fair value of our investments, classified by stated maturityas of March 31, 2016 and 2015 (in thousands):
March 31, 2016 March 31, 2016
Available-for-SaleInvestments
Held-to-MaturityInvestments
AmortizedCost
FairValue
AmortizedCost
FairValue
Due in less than one year . . . . . . . . . . . . . . . . . . . . . . . $ 4,314 $ 4,311 $ 37,163 $ 37,128Due in 1 to 4 years . . . . . . . . . . . . . . . . . . . . . . . . . . . . 2,723 2,714 19,744 19,659
Total investments . . . . . . . . . . . . . . . . . . . . . . . . . . . . . $ 7,037 $ 7,025 $ 56,907 $ 56,787
March 31, 2015 March 31, 2015
Available-for-SaleInvestments
Held-to-MaturityInvestments
AmortizedCost
FairValue
AmortizedCost
FairValue
Due in less than one year . . . . . . . . . . . . . . . . . . . . . . . $ — $ — $ 26,109 $ 26,151Due in 1 to 4 years . . . . . . . . . . . . . . . . . . . . . . . . . . . . 4,346 4,332 19,849 19,781
Total investments . . . . . . . . . . . . . . . . . . . . . . . . . . . . . $ 4,346 $ 4,332 $ 45,958 $ 45,932
NOTE 5. FAIR VALUE MEASUREMENTS
The following table summarizes financial assets, measured at fair value on a recurring basis, by level of input withinthe fair value hierarchy as of March 31, 2016 and 2015 (in thousands):
As of March 31, 2016
Quoted Pricesin Active
Markets forIdentical
Assets
SignificantOther
ObservableInputs
SignificantUnobservable
Inputs
Level 1 Level 2 Level 3 Total
AssetsCash equivalents . . . . . . . . . . . . . . . . . . . . . . . . . . . . . . $ 9,834 $ — $ — $ 9,834Available-for-sale investments:
Corporate bonds . . . . . . . . . . . . . . . . . . . . . . . . . . . . — 7,025 — 7,025
Total assets at fair value . . . . . . . . . . . . . . . . . . . . . . . . $ 9,834 $ 7,025 $ — $ 16,859
As of March 31, 2015
Quoted Pricesin Active
Markets forIdentical
Assets
SignificantOther
ObservableInputs
SignificantUnobservable
Inputs
Level 1 Level 2 Level 3 Total
AssetsCash equivalents . . . . . . . . . . . . . . . . . . . . . . . . . . . . . . $ 3,053 $ — $ — $ 3,053Available-for-sale investments:
Corporate bonds . . . . . . . . . . . . . . . . . . . . . . . . . . . . — 4,332 — 4,332
Total assets at fair value . . . . . . . . . . . . . . . . . . . . . . . . $ 3,053 $ 4,332 $ — $ 7,385
76
Abaxis, Inc. Form 10-K
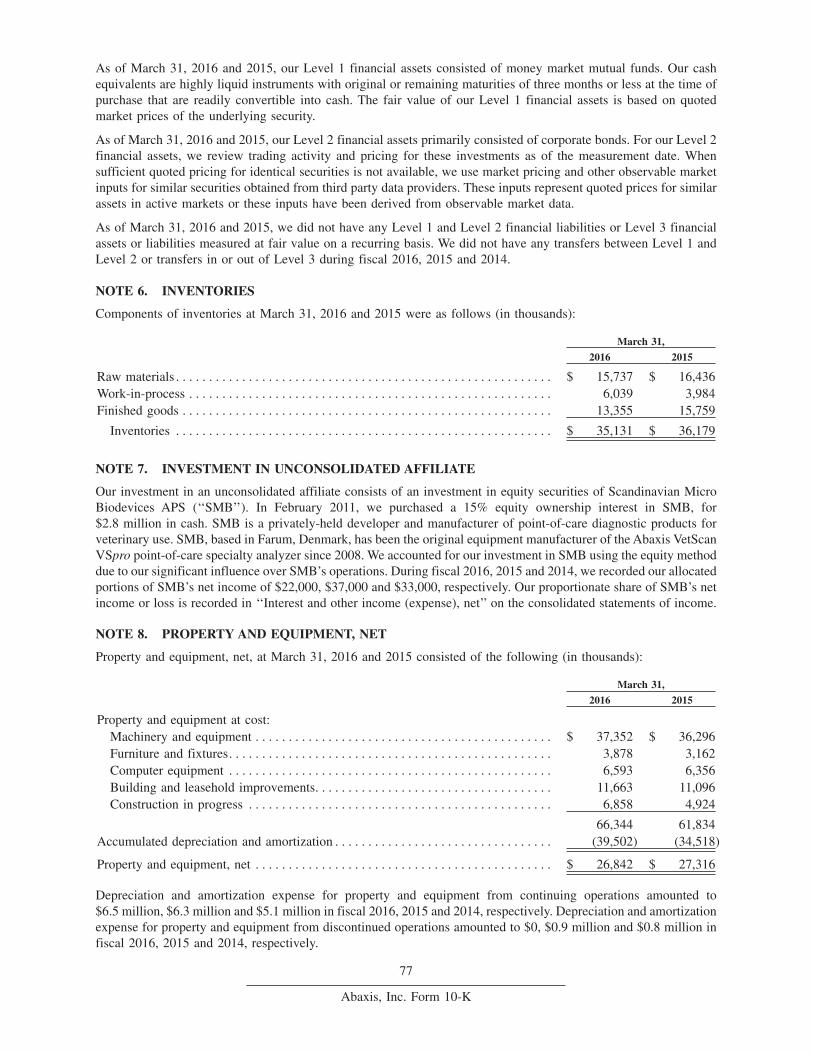
As of March 31, 2016 and 2015, our Level 1 financial assets consisted of money market mutual funds. Our cashequivalents are highly liquid instruments with original or remaining maturities of three months or less at the time ofpurchase that are readily convertible into cash. The fair value of our Level 1 financial assets is based on quotedmarket prices of the underlying security.
As of March 31, 2016 and 2015, our Level 2 financial assets primarily consisted of corporate bonds. For our Level 2financial assets, we review trading activity and pricing for these investments as of the measurement date. Whensufficient quoted pricing for identical securities is not available, we use market pricing and other observable marketinputs for similar securities obtained from third party data providers. These inputs represent quoted prices for similarassets in active markets or these inputs have been derived from observable market data.
As of March 31, 2016 and 2015, we did not have any Level 1 and Level 2 financial liabilities or Level 3 financialassets or liabilities measured at fair value on a recurring basis. We did not have any transfers between Level 1 andLevel 2 or transfers in or out of Level 3 during fiscal 2016, 2015 and 2014.
NOTE 6. INVENTORIES
Components of inventories at March 31, 2016 and 2015 were as follows (in thousands):
March 31,
2016 2015
Raw materials . . . . . . . . . . . . . . . . . . . . . . . . . . . . . . . . . . . . . . . . . . . . . . . . . . . . . . . . . $ 15,737 $ 16,436Work-in-process . . . . . . . . . . . . . . . . . . . . . . . . . . . . . . . . . . . . . . . . . . . . . . . . . . . . . . . 6,039 3,984Finished goods . . . . . . . . . . . . . . . . . . . . . . . . . . . . . . . . . . . . . . . . . . . . . . . . . . . . . . . . 13,355 15,759
Inventories . . . . . . . . . . . . . . . . . . . . . . . . . . . . . . . . . . . . . . . . . . . . . . . . . . . . . . . . . $ 35,131 $ 36,179
NOTE 7. INVESTMENT IN UNCONSOLIDATED AFFILIATE
Our investment in an unconsolidated affiliate consists of an investment in equity securities of Scandinavian MicroBiodevices APS (‘‘SMB’’). In February 2011, we purchased a 15% equity ownership interest in SMB, for$2.8 million in cash. SMB is a privately-held developer and manufacturer of point-of-care diagnostic products forveterinary use. SMB, based in Farum, Denmark, has been the original equipment manufacturer of the Abaxis VetScanVSpro point-of-care specialty analyzer since 2008. We accounted for our investment in SMB using the equity methoddue to our significant influence over SMB’s operations. During fiscal 2016, 2015 and 2014, we recorded our allocatedportions of SMB’s net income of $22,000, $37,000 and $33,000, respectively. Our proportionate share of SMB’s netincome or loss is recorded in ‘‘Interest and other income (expense), net’’ on the consolidated statements of income.
NOTE 8. PROPERTY AND EQUIPMENT, NET
Property and equipment, net, at March 31, 2016 and 2015 consisted of the following (in thousands):
March 31,
2016 2015
Property and equipment at cost:Machinery and equipment . . . . . . . . . . . . . . . . . . . . . . . . . . . . . . . . . . . . . . . . . . . . . $ 37,352 $ 36,296Furniture and fixtures. . . . . . . . . . . . . . . . . . . . . . . . . . . . . . . . . . . . . . . . . . . . . . . . . 3,878 3,162Computer equipment . . . . . . . . . . . . . . . . . . . . . . . . . . . . . . . . . . . . . . . . . . . . . . . . . 6,593 6,356Building and leasehold improvements. . . . . . . . . . . . . . . . . . . . . . . . . . . . . . . . . . . . 11,663 11,096Construction in progress . . . . . . . . . . . . . . . . . . . . . . . . . . . . . . . . . . . . . . . . . . . . . . 6,858 4,924
66,344 61,834Accumulated depreciation and amortization . . . . . . . . . . . . . . . . . . . . . . . . . . . . . . . . . (39,502) (34,518)
Property and equipment, net . . . . . . . . . . . . . . . . . . . . . . . . . . . . . . . . . . . . . . . . . . . . . $ 26,842 $ 27,316
Depreciation and amortization expense for property and equipment from continuing operations amounted to$6.5 million, $6.3 million and $5.1 million in fiscal 2016, 2015 and 2014, respectively. Depreciation and amortizationexpense for property and equipment from discontinued operations amounted to $0, $0.9 million and $0.8 million infiscal 2016, 2015 and 2014, respectively.
77
Abaxis, Inc. Form 10-K
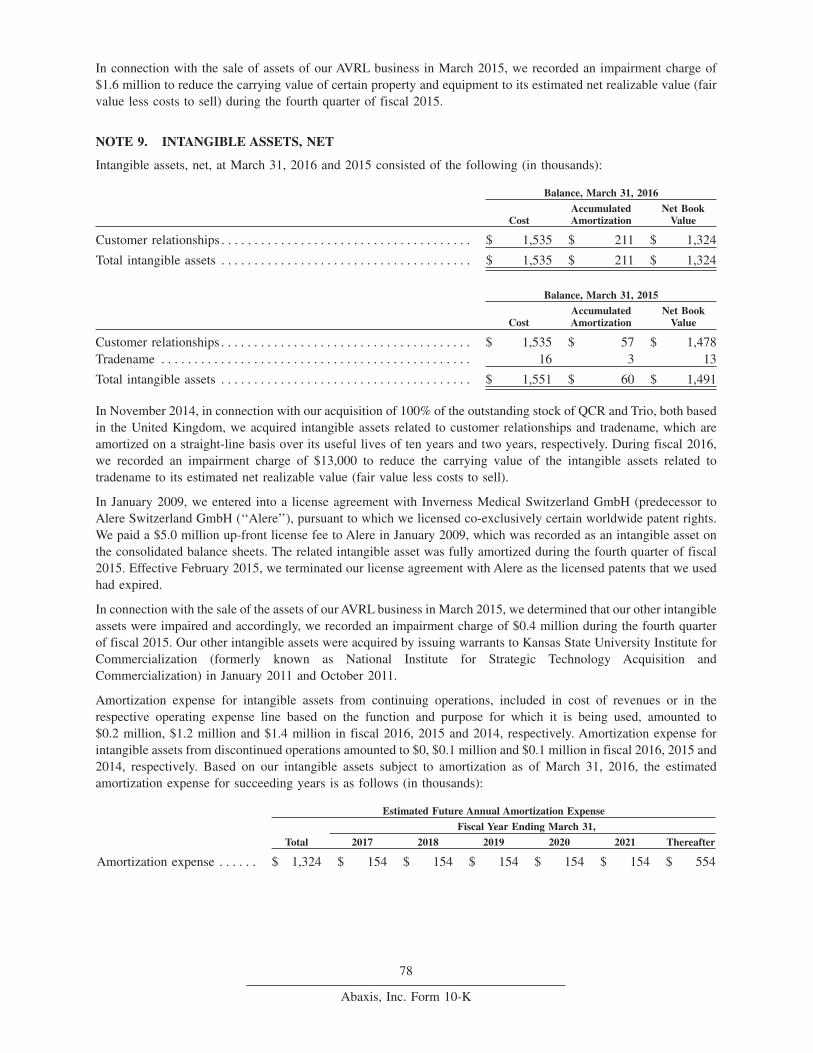
In connection with the sale of assets of our AVRL business in March 2015, we recorded an impairment charge of$1.6 million to reduce the carrying value of certain property and equipment to its estimated net realizable value (fairvalue less costs to sell) during the fourth quarter of fiscal 2015.
NOTE 9. INTANGIBLE ASSETS, NET
Intangible assets, net, at March 31, 2016 and 2015 consisted of the following (in thousands):
Balance, March 31, 2016
CostAccumulatedAmortization
Net BookValue
Customer relationships . . . . . . . . . . . . . . . . . . . . . . . . . . . . . . . . . . . . . . $ 1,535 $ 211 $ 1,324
Total intangible assets . . . . . . . . . . . . . . . . . . . . . . . . . . . . . . . . . . . . . . $ 1,535 $ 211 $ 1,324
Balance, March 31, 2015
CostAccumulatedAmortization
Net BookValue
Customer relationships . . . . . . . . . . . . . . . . . . . . . . . . . . . . . . . . . . . . . . $ 1,535 $ 57 $ 1,478Tradename . . . . . . . . . . . . . . . . . . . . . . . . . . . . . . . . . . . . . . . . . . . . . . . 16 3 13
Total intangible assets . . . . . . . . . . . . . . . . . . . . . . . . . . . . . . . . . . . . . . $ 1,551 $ 60 $ 1,491
In November 2014, in connection with our acquisition of 100% of the outstanding stock of QCR and Trio, both basedin the United Kingdom, we acquired intangible assets related to customer relationships and tradename, which areamortized on a straight-line basis over its useful lives of ten years and two years, respectively. During fiscal 2016,we recorded an impairment charge of $13,000 to reduce the carrying value of the intangible assets related totradename to its estimated net realizable value (fair value less costs to sell).
In January 2009, we entered into a license agreement with Inverness Medical Switzerland GmbH (predecessor toAlere Switzerland GmbH (‘‘Alere’’), pursuant to which we licensed co-exclusively certain worldwide patent rights.We paid a $5.0 million up-front license fee to Alere in January 2009, which was recorded as an intangible asset onthe consolidated balance sheets. The related intangible asset was fully amortized during the fourth quarter of fiscal2015. Effective February 2015, we terminated our license agreement with Alere as the licensed patents that we usedhad expired.
In connection with the sale of the assets of our AVRL business in March 2015, we determined that our other intangibleassets were impaired and accordingly, we recorded an impairment charge of $0.4 million during the fourth quarterof fiscal 2015. Our other intangible assets were acquired by issuing warrants to Kansas State University Institute forCommercialization (formerly known as National Institute for Strategic Technology Acquisition andCommercialization) in January 2011 and October 2011.
Amortization expense for intangible assets from continuing operations, included in cost of revenues or in therespective operating expense line based on the function and purpose for which it is being used, amounted to$0.2 million, $1.2 million and $1.4 million in fiscal 2016, 2015 and 2014, respectively. Amortization expense forintangible assets from discontinued operations amounted to $0, $0.1 million and $0.1 million in fiscal 2016, 2015 and2014, respectively. Based on our intangible assets subject to amortization as of March 31, 2016, the estimatedamortization expense for succeeding years is as follows (in thousands):
Estimated Future Annual Amortization Expense
Fiscal Year Ending March 31,
Total 2017 2018 2019 2020 2021 Thereafter
Amortization expense . . . . . . $ 1,324 $ 154 $ 154 $ 154 $ 154 $ 154 $ 554
78
Abaxis, Inc. Form 10-K
NOTE 10. WARRANTY RESERVES
We provide for the estimated future costs to be incurred under our standard warranty obligation on our instrumentsand reagent discs.
Instruments. Our standard warranty obligation on instruments ranges from one to five years, depending on thespecific product. The estimated contractual warranty obligation is recorded when the related revenue is recognizedand any additional amount is recorded when such cost is probable and can be reasonably estimated. Cost of revenuesreflects estimated warranty expense for instruments sold in the current period and any adjustments in estimatedwarranty expense for the installed base under our standard warranty obligation based on our quarterly evaluation ofservice experience. The estimated accrual for warranty exposure is based on historical experience as to productfailures, estimated product failure rates, estimated repair costs, material usage and freight incurred in repairing theinstrument after failure and known design changes under the warranty plan. Management periodically evaluates thesufficiency of the warranty provisions and makes adjustments when necessary. If an unusual performance rate relatedto warranty claims is noted, an additional warranty accrual may be assessed and recorded when a failure event isprobable and the cost can be reasonably estimated. Effective October 2013, we prospectively changed our standardwarranty obligations on certain instruments sold from three to five years. The increase in the standard warranty perioddid not result in a material impact on our cost of revenues or our accrued warranty costs during fiscal 2016, 2015and 2014. During fiscal 2016, we recorded an adjustment to pre-existing warranties of $0.2 million, which reducedour warranty reserves and our cost of revenues, based on our historical experience and our projected performance rateof instruments.
Reagent Discs. We record a provision for defective reagent discs when the related sale is recognized and anyadditional amount is recorded when such cost is probable and can be reasonably estimated. The warranty costincludes the replacement costs and freight of a defective reagent disc. For fiscal 2016, 2015 and 2014, the provisionfor warranty expense related to replacement of defective reagent discs was $0.4 million, $0.2 million and$0.5 million, respectively. The balance of accrued warranty reserve related to replacement of defective reagent discsat March 31, 2016 and 2015 was $0.5 million and $0.5 million, respectively, which was classified as a current liabilityon the consolidated balance sheets.
We evaluate our estimates for warranty reserves on an ongoing basis and believe we have the ability to reasonablyestimate warranty costs. However, unforeseeable changes in factors may impact the estimate for warranty and suchchanges could cause a material change in our warranty reserve accrual in the period in which the change wasidentified.
The change in our accrued warranty reserve during fiscal 2016, 2015 and 2014 is summarized as follows (inthousands):
Year Ended March 31,
2016 2015 2014
Balance at beginning of period . . . . . . . . . . . . . . . . . . . . . . . . . . . . . . . $ 3,156 $ 1,868 $ 1,384Provision for warranty expense . . . . . . . . . . . . . . . . . . . . . . . . . . . . . . . 1,615 2,647 2,068Warranty costs incurred . . . . . . . . . . . . . . . . . . . . . . . . . . . . . . . . . . . . . (1,340) (1,359) (1,584)Adjustment to pre-existing warranties. . . . . . . . . . . . . . . . . . . . . . . . . . (223) — —
Balance at end of period . . . . . . . . . . . . . . . . . . . . . . . . . . . . . . . . . . . . 3,208 3,156 1,868Non-current portion of warranty reserve. . . . . . . . . . . . . . . . . . . . . . . . 1,927 1,733 821
Current portion of warranty reserve . . . . . . . . . . . . . . . . . . . . . . . . . . . $ 1,281 $ 1,423 $ 1,047
NOTE 11. BORROWINGS
Notes Payable. We have a ten year loan agreement with the Community Redevelopment Agency of the City of UnionCity (‘‘the Agency’’) whereby the Agency provides us with an unsecured loan of up to $1.0 million, primarily topurchase capital equipment. The loan was effective January 2011, bears interest at 5.0% and is payable quarterly. Asof March 31, 2016, our short-term and long-term notes payable balances were $0.1 million and $0.4 million,respectively, and as of March 31, 2015, our short-term and long-term notes payable balances were $0.1 million and$0.5 million, respectively. The short-term balance was recorded in ‘‘Other accrued liabilities’’ on the consolidatedbalance sheets. The entire outstanding balance of the note is payable in full on the earlier of: (i) December 2020, or(ii) the date Abaxis ceases operations in Union City, California. The Agency also has the right to accelerate the
79
Abaxis, Inc. Form 10-K
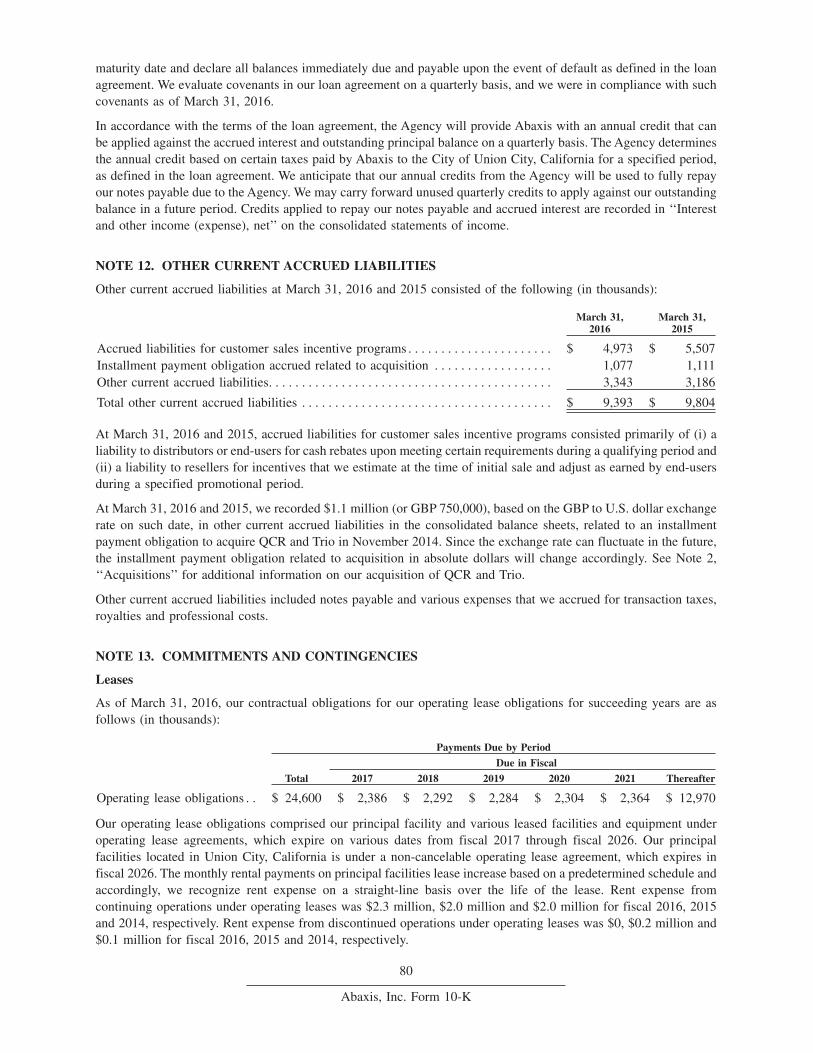
maturity date and declare all balances immediately due and payable upon the event of default as defined in the loanagreement. We evaluate covenants in our loan agreement on a quarterly basis, and we were in compliance with suchcovenants as of March 31, 2016.
In accordance with the terms of the loan agreement, the Agency will provide Abaxis with an annual credit that canbe applied against the accrued interest and outstanding principal balance on a quarterly basis. The Agency determinesthe annual credit based on certain taxes paid by Abaxis to the City of Union City, California for a specified period,as defined in the loan agreement. We anticipate that our annual credits from the Agency will be used to fully repayour notes payable due to the Agency. We may carry forward unused quarterly credits to apply against our outstandingbalance in a future period. Credits applied to repay our notes payable and accrued interest are recorded in ‘‘Interestand other income (expense), net’’ on the consolidated statements of income.
NOTE 12. OTHER CURRENT ACCRUED LIABILITIES
Other current accrued liabilities at March 31, 2016 and 2015 consisted of the following (in thousands):
March 31,2016
March 31,2015
Accrued liabilities for customer sales incentive programs . . . . . . . . . . . . . . . . . . . . . . $ 4,973 $ 5,507Installment payment obligation accrued related to acquisition . . . . . . . . . . . . . . . . . . 1,077 1,111Other current accrued liabilities. . . . . . . . . . . . . . . . . . . . . . . . . . . . . . . . . . . . . . . . . . . 3,343 3,186
Total other current accrued liabilities . . . . . . . . . . . . . . . . . . . . . . . . . . . . . . . . . . . . . . $ 9,393 $ 9,804
At March 31, 2016 and 2015, accrued liabilities for customer sales incentive programs consisted primarily of (i) aliability to distributors or end-users for cash rebates upon meeting certain requirements during a qualifying period and(ii) a liability to resellers for incentives that we estimate at the time of initial sale and adjust as earned by end-usersduring a specified promotional period.
At March 31, 2016 and 2015, we recorded $1.1 million (or GBP 750,000), based on the GBP to U.S. dollar exchangerate on such date, in other current accrued liabilities in the consolidated balance sheets, related to an installmentpayment obligation to acquire QCR and Trio in November 2014. Since the exchange rate can fluctuate in the future,the installment payment obligation related to acquisition in absolute dollars will change accordingly. See Note 2,‘‘Acquisitions’’ for additional information on our acquisition of QCR and Trio.
Other current accrued liabilities included notes payable and various expenses that we accrued for transaction taxes,royalties and professional costs.
NOTE 13. COMMITMENTS AND CONTINGENCIES
Leases
As of March 31, 2016, our contractual obligations for our operating lease obligations for succeeding years are asfollows (in thousands):
Payments Due by Period
Due in Fiscal
Total 2017 2018 2019 2020 2021 Thereafter
Operating lease obligations . . $ 24,600 $ 2,386 $ 2,292 $ 2,284 $ 2,304 $ 2,364 $ 12,970
Our operating lease obligations comprised our principal facility and various leased facilities and equipment underoperating lease agreements, which expire on various dates from fiscal 2017 through fiscal 2026. Our principalfacilities located in Union City, California is under a non-cancelable operating lease agreement, which expires infiscal 2026. The monthly rental payments on principal facilities lease increase based on a predetermined schedule andaccordingly, we recognize rent expense on a straight-line basis over the life of the lease. Rent expense fromcontinuing operations under operating leases was $2.3 million, $2.0 million and $2.0 million for fiscal 2016, 2015and 2014, respectively. Rent expense from discontinued operations under operating leases was $0, $0.2 million and$0.1 million for fiscal 2016, 2015 and 2014, respectively.
80
Abaxis, Inc. Form 10-K
Commitments
We have purchase commitments, consisting of supply and inventory related agreements, totaling approximately$11.5 million as of March 31, 2016. These purchase order commitments primarily include our purchase obligationsto purchase from SMB of Denmark through calendar year 2016 and Diatron of Hungary through fiscal 2018.
Patent Licensing Agreement. From January 2009 to February 2015, under our license agreement with Alere, welicensed co-exclusively certain worldwide patent rights related to lateral flow immunoassay technology in the fieldof animal health diagnostics in the professional marketplace. The license agreement enabled us to develop and marketproducts under rights from Alere in the animal health and laboratory animal research markets. In exchange for thelicense rights, we (i) paid an up-front license fee of $5.0 million to Alere in January 2009, (ii) agreed to pay royaltiesduring the term of the agreement, based solely on sales of products in a jurisdiction country covered by valid andunexpired claims in that jurisdiction under the licensed Alere patent rights, and (iii) agreed to pay a yearly minimumlicense fee of between $0.5 million to $1.0 million per year, which fee was creditable against any royalties due duringsuch calendar year. The royalties, if any, were payable through the date of the expiration of the last valid patentlicensed under the agreement that includes at least one claim in a jurisdiction covering products we sell in thatjurisdiction. The yearly minimum fees were payable for so long as we desire to maintain exclusivity under theagreement. Effective February 2015, we terminated our license agreement with Alere as the licensed patents that weused had expired. In accordance with the terms of the license agreement, we had no outstanding liabilities related tothis license agreement at March 31, 2016.
Litigation
We are involved from time to time in various litigation matters in the normal course of business. There can be noassurance that existing or future legal proceedings arising in the ordinary course of business or otherwise will nothave a material adverse effect on our business, consolidated financial position, results of operations or cash flows.
NOTE 14. EMPLOYEE BENEFIT PLAN
We have established the Abaxis 401(k) Plan (the ‘‘401(k) Plan’’), a tax deferred savings plan, for the benefit ofqualified employees. The 401(k) Plan is designed to provide employees with an accumulation of funds at retirement.Qualified employees may elect to have salary reduction contributions made to the plan on a bi-weekly basis. We maymake quarterly contributions to the plan at the discretion of our Board of Directors either in cash or in common stock.Our matching contributions, on a consolidated basis, to the tax deferred savings plan totaled $0.7 million,$0.7 million and $0.3 million in fiscal 2016, 2015 and 2014, respectively. In fiscal 2016, 2015 and 2014, our matchingcontributions were made in cash. We did not have any matching contributions in the form of common stock in fiscal2016, 2015 and 2014.
NOTE 15. EQUITY COMPENSATION PLANS AND SHARE-BASED COMPENSATION
Equity Compensation Plans
Our share-based compensation plan is described below.
2014 Equity Incentive Plan. Our 2014 Equity Incentive Plan (the ‘‘2014 Plan’’), which was approved by ourshareholders on October 22, 2014, is the successor to and continuation of the 2005 Equity Incentive Plan (the ‘‘2005Plan’’). The terms of the 2014 Plan provide for the grant of incentive stock options, nonstatutory stock options, stockappreciation rights, restricted stock awards, restricted stock unit awards, other stock awards and performance awardsthat may be settled in cash, stock or other property. At its October 22, 2014 effective date, the total number of sharesof the Company’s common stock available for issuance under the 2014 Plan was 1,712,409 shares, which was equalto the sum of (i) the shares remaining available for issuance pursuant to the exercise of options or issuance orsettlement of stock awards that had not previously been granted under the 2005 Plan, as of the effective date of the2014 Plan and (ii) the Returning Shares (as defined below), as of the effective date of the 2014 Plan. The ‘‘ReturningShares’’ are shares subject to outstanding stock awards granted under the 2005 Plan (the ‘‘2005 Available Pool’’), asof the effective date of the 2014 Plan, (i) expire or terminate for any reason prior to exercise or settlement, (ii) areforfeited, cancelled or otherwise returned to us because of the failure to meet a contingency or condition required forthe vesting of such shares, or (iii) are reacquired or withheld (or not issued) by us to satisfy a tax withholdingobligation in connection with a stock award or to satisfy the purchase price or exercise price of a stock award.
As of March 31, 2016, the 2014 Plan provided for the issuance of a maximum of 1,712,409 shares, of which 679,000shares of common stock were then available for future issuance pursuant to stock awards that had not previously been
81
Abaxis, Inc. Form 10-K
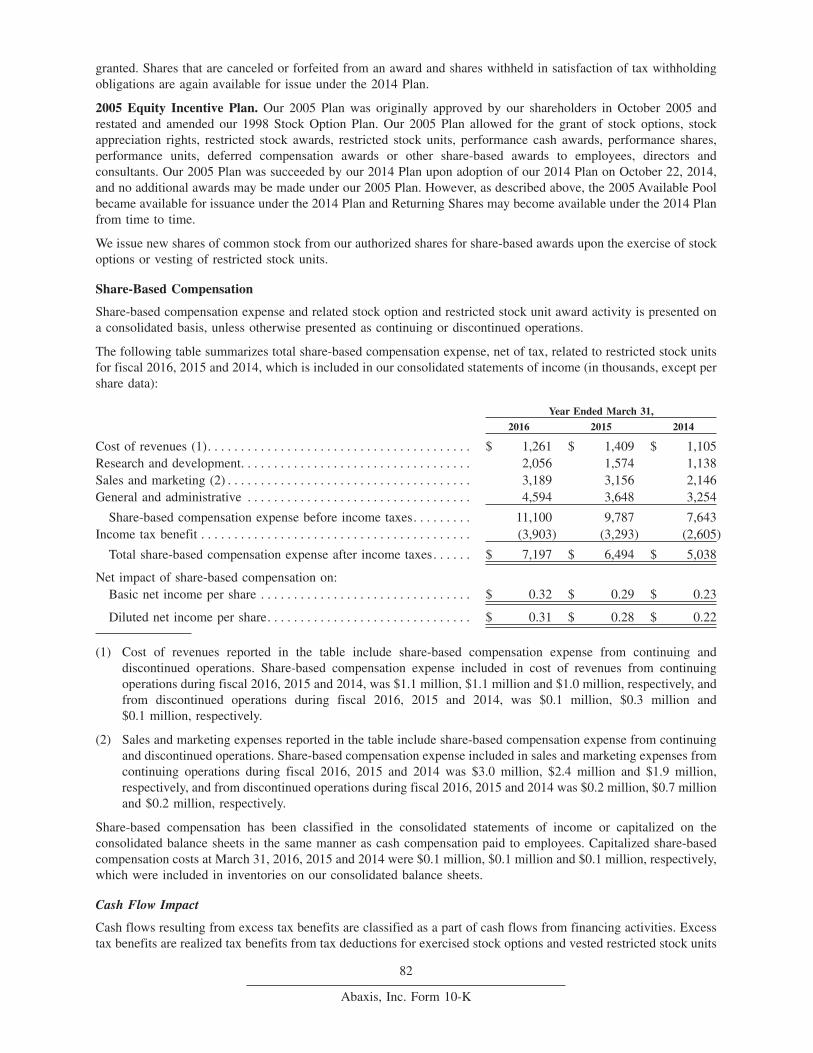
granted. Shares that are canceled or forfeited from an award and shares withheld in satisfaction of tax withholdingobligations are again available for issue under the 2014 Plan.
2005 Equity Incentive Plan. Our 2005 Plan was originally approved by our shareholders in October 2005 andrestated and amended our 1998 Stock Option Plan. Our 2005 Plan allowed for the grant of stock options, stockappreciation rights, restricted stock awards, restricted stock units, performance cash awards, performance shares,performance units, deferred compensation awards or other share-based awards to employees, directors andconsultants. Our 2005 Plan was succeeded by our 2014 Plan upon adoption of our 2014 Plan on October 22, 2014,and no additional awards may be made under our 2005 Plan. However, as described above, the 2005 Available Poolbecame available for issuance under the 2014 Plan and Returning Shares may become available under the 2014 Planfrom time to time.
We issue new shares of common stock from our authorized shares for share-based awards upon the exercise of stockoptions or vesting of restricted stock units.
Share-Based Compensation
Share-based compensation expense and related stock option and restricted stock unit award activity is presented ona consolidated basis, unless otherwise presented as continuing or discontinued operations.
The following table summarizes total share-based compensation expense, net of tax, related to restricted stock unitsfor fiscal 2016, 2015 and 2014, which is included in our consolidated statements of income (in thousands, except pershare data):
Year Ended March 31,
2016 2015 2014
Cost of revenues (1). . . . . . . . . . . . . . . . . . . . . . . . . . . . . . . . . . . . . . . . $ 1,261 $ 1,409 $ 1,105Research and development. . . . . . . . . . . . . . . . . . . . . . . . . . . . . . . . . . . 2,056 1,574 1,138Sales and marketing (2) . . . . . . . . . . . . . . . . . . . . . . . . . . . . . . . . . . . . . 3,189 3,156 2,146General and administrative . . . . . . . . . . . . . . . . . . . . . . . . . . . . . . . . . . 4,594 3,648 3,254
Share-based compensation expense before income taxes. . . . . . . . . 11,100 9,787 7,643Income tax benefit . . . . . . . . . . . . . . . . . . . . . . . . . . . . . . . . . . . . . . . . . (3,903) (3,293) (2,605)
Total share-based compensation expense after income taxes. . . . . . $ 7,197 $ 6,494 $ 5,038
Net impact of share-based compensation on:Basic net income per share . . . . . . . . . . . . . . . . . . . . . . . . . . . . . . . . $ 0.32 $ 0.29 $ 0.23
Diluted net income per share. . . . . . . . . . . . . . . . . . . . . . . . . . . . . . . $ 0.31 $ 0.28 $ 0.22
(1) Cost of revenues reported in the table include share-based compensation expense from continuing anddiscontinued operations. Share-based compensation expense included in cost of revenues from continuingoperations during fiscal 2016, 2015 and 2014, was $1.1 million, $1.1 million and $1.0 million, respectively, andfrom discontinued operations during fiscal 2016, 2015 and 2014, was $0.1 million, $0.3 million and$0.1 million, respectively.
(2) Sales and marketing expenses reported in the table include share-based compensation expense from continuingand discontinued operations. Share-based compensation expense included in sales and marketing expenses fromcontinuing operations during fiscal 2016, 2015 and 2014 was $3.0 million, $2.4 million and $1.9 million,respectively, and from discontinued operations during fiscal 2016, 2015 and 2014 was $0.2 million, $0.7 millionand $0.2 million, respectively.
Share-based compensation has been classified in the consolidated statements of income or capitalized on theconsolidated balance sheets in the same manner as cash compensation paid to employees. Capitalized share-basedcompensation costs at March 31, 2016, 2015 and 2014 were $0.1 million, $0.1 million and $0.1 million, respectively,which were included in inventories on our consolidated balance sheets.
Cash Flow Impact
Cash flows resulting from excess tax benefits are classified as a part of cash flows from financing activities. Excesstax benefits are realized tax benefits from tax deductions for exercised stock options and vested restricted stock units
82
Abaxis, Inc. Form 10-K
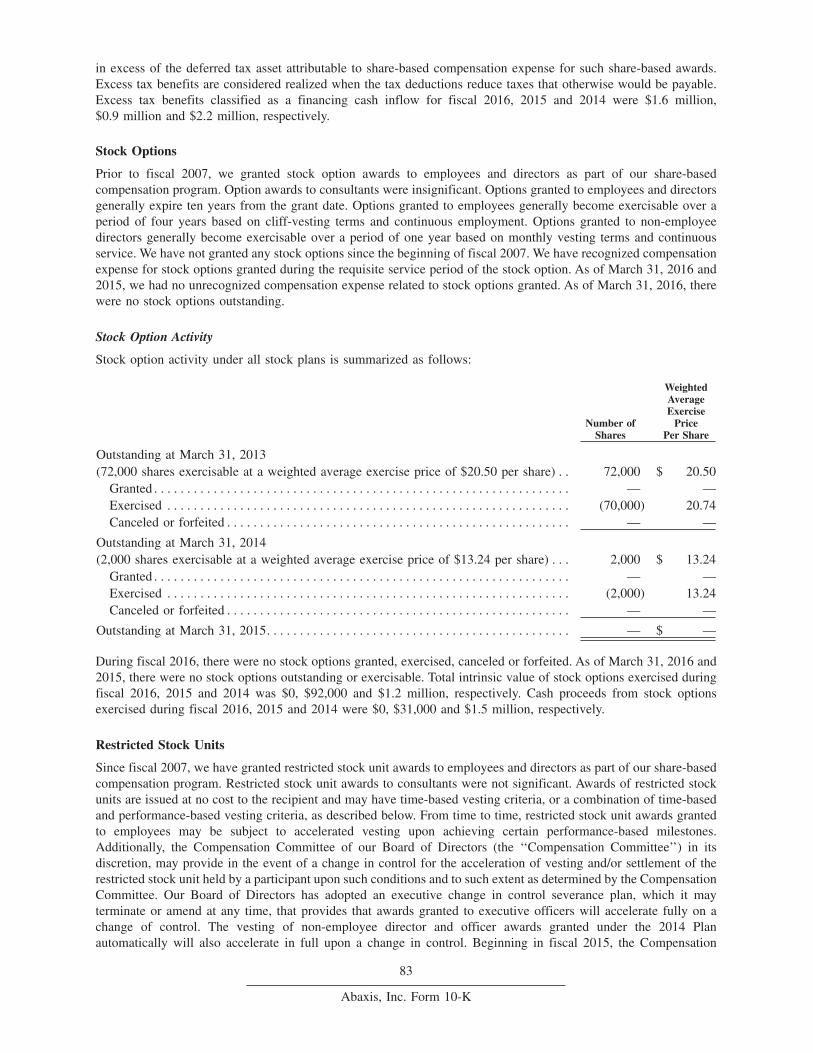
in excess of the deferred tax asset attributable to share-based compensation expense for such share-based awards.Excess tax benefits are considered realized when the tax deductions reduce taxes that otherwise would be payable.Excess tax benefits classified as a financing cash inflow for fiscal 2016, 2015 and 2014 were $1.6 million,$0.9 million and $2.2 million, respectively.
Stock Options
Prior to fiscal 2007, we granted stock option awards to employees and directors as part of our share-basedcompensation program. Option awards to consultants were insignificant. Options granted to employees and directorsgenerally expire ten years from the grant date. Options granted to employees generally become exercisable over aperiod of four years based on cliff-vesting terms and continuous employment. Options granted to non-employeedirectors generally become exercisable over a period of one year based on monthly vesting terms and continuousservice. We have not granted any stock options since the beginning of fiscal 2007. We have recognized compensationexpense for stock options granted during the requisite service period of the stock option. As of March 31, 2016 and2015, we had no unrecognized compensation expense related to stock options granted. As of March 31, 2016, therewere no stock options outstanding.
Stock Option Activity
Stock option activity under all stock plans is summarized as follows:
Number ofShares
WeightedAverageExercise
PricePer Share
Outstanding at March 31, 2013(72,000 shares exercisable at a weighted average exercise price of $20.50 per share) . . 72,000 $ 20.50
Granted . . . . . . . . . . . . . . . . . . . . . . . . . . . . . . . . . . . . . . . . . . . . . . . . . . . . . . . . . . . . . . . — —Exercised . . . . . . . . . . . . . . . . . . . . . . . . . . . . . . . . . . . . . . . . . . . . . . . . . . . . . . . . . . . . . (70,000) 20.74Canceled or forfeited . . . . . . . . . . . . . . . . . . . . . . . . . . . . . . . . . . . . . . . . . . . . . . . . . . . . — —
Outstanding at March 31, 2014(2,000 shares exercisable at a weighted average exercise price of $13.24 per share) . . . 2,000 $ 13.24
Granted . . . . . . . . . . . . . . . . . . . . . . . . . . . . . . . . . . . . . . . . . . . . . . . . . . . . . . . . . . . . . . . — —Exercised . . . . . . . . . . . . . . . . . . . . . . . . . . . . . . . . . . . . . . . . . . . . . . . . . . . . . . . . . . . . . (2,000) 13.24Canceled or forfeited . . . . . . . . . . . . . . . . . . . . . . . . . . . . . . . . . . . . . . . . . . . . . . . . . . . . — —
Outstanding at March 31, 2015. . . . . . . . . . . . . . . . . . . . . . . . . . . . . . . . . . . . . . . . . . . . . . — $ —
During fiscal 2016, there were no stock options granted, exercised, canceled or forfeited. As of March 31, 2016 and2015, there were no stock options outstanding or exercisable. Total intrinsic value of stock options exercised duringfiscal 2016, 2015 and 2014 was $0, $92,000 and $1.2 million, respectively. Cash proceeds from stock optionsexercised during fiscal 2016, 2015 and 2014 were $0, $31,000 and $1.5 million, respectively.
Restricted Stock Units
Since fiscal 2007, we have granted restricted stock unit awards to employees and directors as part of our share-basedcompensation program. Restricted stock unit awards to consultants were not significant. Awards of restricted stockunits are issued at no cost to the recipient and may have time-based vesting criteria, or a combination of time-basedand performance-based vesting criteria, as described below. From time to time, restricted stock unit awards grantedto employees may be subject to accelerated vesting upon achieving certain performance-based milestones.Additionally, the Compensation Committee of our Board of Directors (the ‘‘Compensation Committee’’) in itsdiscretion, may provide in the event of a change in control for the acceleration of vesting and/or settlement of therestricted stock unit held by a participant upon such conditions and to such extent as determined by the CompensationCommittee. Our Board of Directors has adopted an executive change in control severance plan, which it mayterminate or amend at any time, that provides that awards granted to executive officers will accelerate fully on achange of control. The vesting of non-employee director and officer awards granted under the 2014 Planautomatically will also accelerate in full upon a change in control. Beginning in fiscal 2015, the Compensation
83
Abaxis, Inc. Form 10-K
Committee discontinued the practice of granting such ‘‘single trigger’’ acceleration of vesting benefits to newexecutive officers pursuant to which an executive officer’s outstanding stock option(s) and other unvestedequity-based instruments would accelerate in full upon the occurrence of a change of control. Starting in fiscal 2015,we grant ‘‘double-trigger’’ acceleration arrangements to new executive officers, which requires both the occurrenceof a change of control and the termination by us (or our successor) for any reason other than cause, death or disabilitywithin 18 months following such change of control date, with the termination constituting a separation in service andsubject to execution of a valid and effective release of claims against us, for the acceleration of vesting of theexecutive officer’s equity awards in full.
Restricted Stock Unit Awards (Time Vesting)
Restricted stock unit awards with only time-based vesting terms, which we refer to as restricted stock unit awards(time vesting), entitle holders to receive shares of common stock at the end of a specified period of time. Forrestricted stock unit awards (time vesting), vesting is based on continuous employment or service of the holder. Uponvesting, the equivalent number of common shares are typically issued net of tax withholdings. If the service vestingconditions are not met, unvested restricted stock unit awards (time vesting) will be forfeited. Generally, restrictedstock unit awards (time vesting) vest according to one of the following time-based vesting schedules:
• Restricted stock unit awards to employees: Four-year time-based vesting as follows: five percent vesting afterthe first year; additional ten percent after the second year; additional 15 percent after the third year; and theremaining 70 percent after the fourth year of continuous employment with the Company.
• Restricted stock unit awards to non-employee directors: 100 percent vesting after one year of continuous serviceto the Company.
The fair value of restricted stock unit awards (time vesting) used in our expense recognition method is measuredbased on the number of shares granted and the closing market price of our common stock on the date of grant. Suchvalue is recognized as an expense over the corresponding requisite service period. The share-based compensationexpense is reduced for an estimate of the restricted stock unit awards that are expected to be forfeited. The forfeitureestimate is based on historical data and other factors, and compensation expense is adjusted for actual results. As ofMarch 31, 2016, the total unrecognized compensation expense related to restricted stock unit awards (time vesting)granted amounted to $16.7 million, which is expected to be recognized over a weighted average service period of1.9 years.
Restricted Stock Unit Awards (Performance Vesting)
We also began granting restricted stock unit awards subject to performance vesting criteria, which we refer to asrestricted stock unit awards (performance vesting), to our executive officers starting in fiscal 2013. Restricted stockunit awards (performance vesting) consist of the right to receive shares of common stock, subject to achievement oftime-based criteria and certain corporate performance-related goals over a specified period, as established by theCompensation Committee. For restricted stock units subject to performance vesting, we recognize any relatedshare-based compensation expense ratably over the service period based on the most probable outcome of theperformance condition. The fair value of our restricted stock unit awards (performance vesting) used in our expenserecognition method is measured based on the number of shares granted, the closing market price of our commonstock on the date of grant and an estimate of the probability of the achievement of the performance goals. The amountof share-based compensation expense recognized in any one period can vary based on the attainment or expectedattainment of the performance goals. If such performance goals are not ultimately met, no compensation expense isrecognized and any previously recognized compensation expense is reversed.
In fiscal 2014, 2015, 2016 and 2017, the Compensation Committee approved the grant of restricted stock unit awards(performance vesting) described below. These restricted stock units vest only if both of the following criteria aresatisfied: (1) our consolidated income from operations during the fiscal year in which grant occurred, as certified bythe Compensation Committee, is in excess of the applicable target amount described below; and (2) the recipientremains in the continuous service of the Company until the applicable vesting date set forth as follows:
• 25% of the shares subject to an award vest in full upon achieving 90% of the consolidated income fromoperations target described above and continuous service until the third anniversary of the date of grant;
• 25% of the shares subject to an award vest in full upon achieving 90% of the consolidated income fromoperations target described above and continuous service until the fourth anniversary of the date of grant;
84
Abaxis, Inc. Form 10-K
• 25% of the shares subject to an award vest in full upon achieving 100% of the consolidated income fromoperations target described above and continuous service until the third anniversary of the date of grant; and
• 25% of the shares subject to an award vest in full upon achieving 100% of the consolidated income fromoperations target described above and continuous service until the fourth anniversary of the date of grant.
In April 2013, in consideration of the grant of restricted stock unit awards (performance vesting) to our executiveofficers in fiscal 2014, 75% of the remaining restricted stock unit awards (performance vesting) to our executiveofficers that were granted in fiscal 2013, which consisted of the second, third and fourth tranches, were cancelled.As a result, these restricted stock units are no longer outstanding and were not deemed granted for accountingpurposes because each annual performance target was to be set at the start of each respective single-fiscal yearperformance period in accordance with ASC 718-10-55-95.
Fiscal 2014 Performance RSUs. In April 2013, the Compensation Committee approved the grant of restricted stockunit awards (performance vesting) for 129,000 shares of common stock to our executive officers that contained theforegoing time-based and performance-based vesting terms (the ‘‘FY2014 Performance RSUs’’). The aggregateestimated grant date fair value of the FY2014 Performance RSUs was $5.5 million based on the closing market priceof our common stock on the date of grant.
At March 31, 2014, we reviewed each of the underlying performance targets related to the outstanding FY2014Performance RSUs and determined that it was not probable that the FY2014 Performance RSUs would vest and asa result did not record share-based compensation related to these awards during fiscal 2014. On April 23, 2014, theCompensation Committee determined that the Company’s consolidated income from operations for fiscal 2014 wasbelow 90% of target and, accordingly, the FY2014 Performance RSUs did not vest and were cancelled.
Fiscal 2015 Performance RSUs. In April 2014, the Compensation Committee approved the grant of restricted stockunit awards (performance vesting) for 172,000 shares of common stock to our executive officers that contained theforegoing time-based and performance-based vesting terms (the ‘‘FY2015 Performance RSUs’’). The aggregateestimated grant date fair value of the FY2015 Performance RSUs was $7.0 million based on the closing market priceof our common stock on the date of grant. During fiscal 2016 and 2015, we recorded share-based compensationexpense ratably over the vesting terms of the FY2015 Performance RSUs, as we determined that the performancetargets would be met.
Fiscal 2016 Performance RSUs. In April 2015, the Compensation Committee approved the grant of restricted stockunit awards (performance vesting) for 187,000 shares of common stock to our executive officers and to certain of ouremployees that contained the foregoing time-based and performance-based vesting terms (the ‘‘FY2016 PerformanceRSUs’’). The aggregate estimated grant date fair value of the FY2016 Performance RSUs was $10.3 million basedon the closing market price of our common stock on the date of grant. During fiscal 2016, we recorded share-basedcompensation expense ratably over the vesting terms of the FY2016 Performance RSUs, as we determined that theperformance targets would be met.
Fiscal 2017 Performance RSUs. In April 2016, the Compensation Committee approved the grant of restricted stockunit awards (performance vesting) for 152,000 shares of common stock to our executive officers and to certain of ouremployees (the ‘‘FY2017 Performance RSUs’’) that contained the foregoing time-based and performance-basedvesting terms, except that the restricted stock units granted to our CEO, Mr. Clinton Severson, vest as follows:
• approximately 18% of the shares subject to an award vest in full upon achieving 90% of the consolidated incomefrom operations target described above and continuous service until the third anniversary of the date of grant;
• approximately 18% of the shares subject to an award vest in full upon achieving 90% of the consolidated incomefrom operations target described above and continuous service until the fourth anniversary of the date of grant;
• approximately 32% of the shares subject to an award vest in full upon achieving 100% of the consolidatedincome from operations target described above and continuous service until the third anniversary of the date ofgrant; and
• approximately 32% of the shares subject to an award vest in full upon achieving 100% of the consolidatedincome from operations target described above and continuous service until the fourth anniversary of the dateof grant.
85
Abaxis, Inc. Form 10-K
The aggregate estimated grant date fair value of the FY2017 Performance RSUs was $6.8 million based on theclosing market price of our common stock on the date of grant.
As of March 31, 2016, the total unrecognized compensation expense related to restricted stock unit awards(performance vesting) granted amounted to $7.4 million, which is expected to be recognized over a weighted averageservice period of 2.0 years.
Restricted Stock Unit Activity
The following table summarizes restricted stock unit activity during fiscal 2016, 2015 and 2014:
Time-BasedRestricted Stock Units
Performance-BasedRestricted Stock Units
Number ofShares
WeightedAverage
Grant DateFair Value (1)
Number ofShares (2)
WeightedAverage
Grant DateFair Value (1)
Unvested at March 31, 2013 . . . . . . . . . . . . . . . . . . . . 980,000 $ 26.42 21,000 $ 35.62Granted . . . . . . . . . . . . . . . . . . . . . . . . . . . . . . . . . . . 175,000 41.29 129,000 42.43Vested (3) . . . . . . . . . . . . . . . . . . . . . . . . . . . . . . . . . (295,000) 21.73 (21,000) 35.62Canceled and forfeited . . . . . . . . . . . . . . . . . . . . . . . (86,000) 31.61 (16,000) 42.43
Unvested at March 31, 2014 . . . . . . . . . . . . . . . . . . . . 774,000 $ 30.98 113,000 $ 42.43Granted . . . . . . . . . . . . . . . . . . . . . . . . . . . . . . . . . . . 189,000 43.85 172,000 40.82Vested (3) . . . . . . . . . . . . . . . . . . . . . . . . . . . . . . . . . (272,000) 27.24 — —Canceled and forfeited . . . . . . . . . . . . . . . . . . . . . . . (12,000) 30.37 (137,000) 42.15
Unvested at March 31, 2015 . . . . . . . . . . . . . . . . . . . . 679,000 $ 36.08 148,000 $ 40.82Granted . . . . . . . . . . . . . . . . . . . . . . . . . . . . . . . . . . . 188,000 52.90 187,000 55.08Vested (3) . . . . . . . . . . . . . . . . . . . . . . . . . . . . . . . . . (288,000) 30.06 — —Canceled and forfeited . . . . . . . . . . . . . . . . . . . . . . . (55,000) 36.48 (24,000) 55.08
Unvested at March 31, 2016 . . . . . . . . . . . . . . . . . . . . 524,000 $ 45.37 311,000 $ 48.29
(1) The weighted average grant date fair value of restricted stock units is based on the number of shares and theclosing market price of our common stock on the date of grant.
(2) The shares granted during fiscal 2013 and unvested at March 31, 2013 related to restricted stock unit awards(performance vesting) do not include the awards approved by the Compensation Committee during the fiscalyear 2013 that were deemed not to have been granted in accordance with ASC 718-10-55-95.
(3) The number of restricted stock units vested includes shares that we withheld on behalf of our employees tosatisfy the statutory tax withholding requirements.
Total intrinsic value of restricted stock units vested during fiscal 2016, 2015 and 2014 was $15.3 million,$11.7 million and $13.2 million, respectively. The total grant date fair value of restricted stock units vested duringfiscal 2016, 2015 and 2014 was $8.6 million, $7.4 million, and $7.2 million, respectively.
NOTE 16. SHAREHOLDERS’ EQUITY
Share Repurchase Program
Between August 2011 and January 2012, our Board of Directors authorized the repurchase of up to a total of$55.0 million of our common stock. In July 2013, our Board of Directors approved a $12.3 million increase to ourexisting share repurchase program to a total of $67.3 million. As of March 31, 2016, $24.0 million of our commonstock was available for repurchase under our share repurchase program.
Since the share repurchase program began, through March 31, 2016, we have repurchased 1.6 million shares of ourcommon stock at a total cost of $43.3 million, including commission expense. During fiscal 2016, we repurchased325,000 shares of our common stock at a total cost of $13.0 million and an average per share cost includingcommission expense of $40.18. During fiscal 2015, we did not repurchase any shares of our common stock. Duringfiscal 2014, we repurchased 86,000 shares at a total cost of $3.0 million and an average per share cost includingcommission expense of $34.58. The repurchases are made from time to time on the open market at prevailing marketprices or in negotiated transactions off the market. Repurchased shares are retired.
86
Abaxis, Inc. Form 10-K
Dividend Payments
During fiscal 2016 and 2015 our total quarterly dividend payout was $10.0 million and $9.0 million, respectively, andwere made from retained earnings. During fiscal 2014, we did not pay dividends on our outstanding common stock.See Note 21, ‘‘Summary of Quarterly Data (Unaudited)’’ for further information on quarterly dividends declared onour common stock during the past two fiscal years.
Common Stock Warrants
As of March 31, 2016, there were no warrants outstanding. During fiscal 2016, we issued 4,000 shares of commonstock upon the exercise of vested warrants at an exercise price of $3.00 per share.
At March 31, 2015, there were warrants to purchase 4,000 shares of common stock outstanding at a weighted averageexercise price of $3.00 per share, expiring in fiscal years 2016 through 2017. In March 2015, the terms of ouragreement with Kansas State University Institute for Commercialization were amended and accordingly, the vestingof these outstanding warrants was accelerated. During the fourth quarter of fiscal 2015, we recorded expense of$0.2 million related to the vesting acceleration using the Black-Scholes option-pricing model.
At March 31, 2014, there were warrants to purchase 30,000 shares of common stock outstanding, of which 20,000shares were vested, at a weighted average exercise price of $3.00 per share. At March 31, 2013, there were 30,000warrants outstanding, of which 14,000 shares were vested, to purchase common stock at a weighted average exerciseprice of $3.00 per share, expiring in fiscal years 2016 through 2017. The fair value of the warrants issued weredetermined using the Black-Scholes option-pricing model and were amortized over their estimated useful life, ofapproximately ten years, as an intangible asset. The warrants vested at a rate of 20% annually from their issuancedates and had a term of five years.
NOTE 17. NET INCOME PER SHARE
The computations for basic and diluted net income from continuing and discontinued operations per share are asfollows (in thousands, except share and per share data):
Year Ended March 31,2016 2015 2014
Income from continuing operations. . . . . . . . . . . . . . . . . . . . . . . . . . . . $ 31,074 $ 20,803 $ 16,229Loss from discontinued operations, net of tax . . . . . . . . . . . . . . . . . . . (3) (1,154) (2,044)Gain on sale of discontinued operations, net of tax . . . . . . . . . . . . . . . 559 7,682 —
Net income . . . . . . . . . . . . . . . . . . . . . . . . . . . . . . . . . . . . . . . . . . . . . . . $ 31,630 $ 27,331 $ 14,185
Weighted average common shares outstanding:Basic . . . . . . . . . . . . . . . . . . . . . . . . . . . . . . . . . . . . . . . . . . . . . . . . . . . . 22,661,000 22,497,000 22,270,000Effect of dilutive securities:
Stock options . . . . . . . . . . . . . . . . . . . . . . . . . . . . . . . . . . . . . . . . . — 1,000 20,000Restricted stock units . . . . . . . . . . . . . . . . . . . . . . . . . . . . . . . . . . . 221,000 276,000 257,000Warrants . . . . . . . . . . . . . . . . . . . . . . . . . . . . . . . . . . . . . . . . . . . . . 1,000 13,000 28,000
Diluted . . . . . . . . . . . . . . . . . . . . . . . . . . . . . . . . . . . . . . . . . . . . . . . . . . 22,883,000 22,787,000 22,575,000
Net income (loss) per share:Basic
Continuing operations . . . . . . . . . . . . . . . . . . . . . . . . . . . . . . . . . . $ 1.37 $ 0.92 $ 0.73Discontinued operations . . . . . . . . . . . . . . . . . . . . . . . . . . . . . . . . . 0.03 0.29 (0.09)
Basic net income per share . . . . . . . . . . . . . . . . . . . . . . . . . . . . . . . . $ 1.40 $ 1.21 $ 0.64
DilutedContinuing operations . . . . . . . . . . . . . . . . . . . . . . . . . . . . . . . . . . $ 1.36 $ 0.91 $ 0.72Discontinued operations . . . . . . . . . . . . . . . . . . . . . . . . . . . . . . . . . 0.02 0.29 (0.09)
Diluted net income per share. . . . . . . . . . . . . . . . . . . . . . . . . . . . . . . $ 1.38 $ 1.20 $ 0.63
87
Abaxis, Inc. Form 10-K
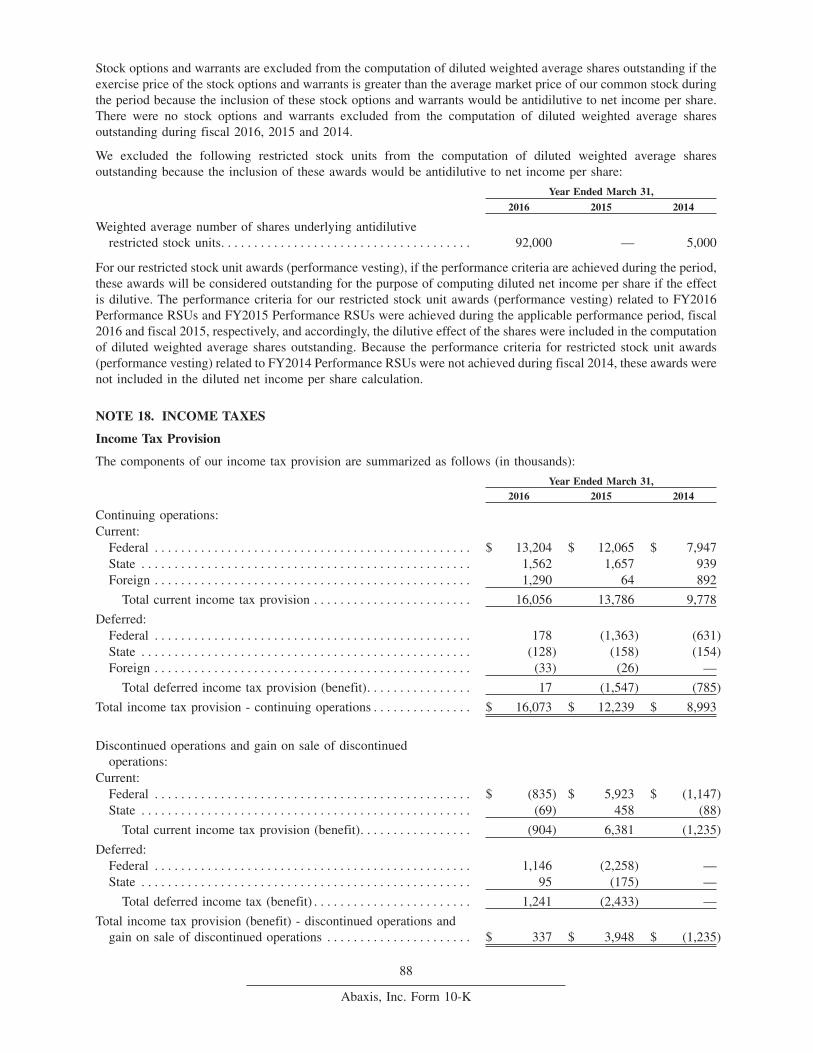
Stock options and warrants are excluded from the computation of diluted weighted average shares outstanding if theexercise price of the stock options and warrants is greater than the average market price of our common stock duringthe period because the inclusion of these stock options and warrants would be antidilutive to net income per share.There were no stock options and warrants excluded from the computation of diluted weighted average sharesoutstanding during fiscal 2016, 2015 and 2014.
We excluded the following restricted stock units from the computation of diluted weighted average sharesoutstanding because the inclusion of these awards would be antidilutive to net income per share:
Year Ended March 31,
2016 2015 2014
Weighted average number of shares underlying antidilutiverestricted stock units. . . . . . . . . . . . . . . . . . . . . . . . . . . . . . . . . . . . . . 92,000 — 5,000
For our restricted stock unit awards (performance vesting), if the performance criteria are achieved during the period,these awards will be considered outstanding for the purpose of computing diluted net income per share if the effectis dilutive. The performance criteria for our restricted stock unit awards (performance vesting) related to FY2016Performance RSUs and FY2015 Performance RSUs were achieved during the applicable performance period, fiscal2016 and fiscal 2015, respectively, and accordingly, the dilutive effect of the shares were included in the computationof diluted weighted average shares outstanding. Because the performance criteria for restricted stock unit awards(performance vesting) related to FY2014 Performance RSUs were not achieved during fiscal 2014, these awards werenot included in the diluted net income per share calculation.
NOTE 18. INCOME TAXES
Income Tax Provision
The components of our income tax provision are summarized as follows (in thousands):
Year Ended March 31,2016 2015 2014
Continuing operations:Current:
Federal . . . . . . . . . . . . . . . . . . . . . . . . . . . . . . . . . . . . . . . . . . . . . . . . $ 13,204 $ 12,065 $ 7,947State . . . . . . . . . . . . . . . . . . . . . . . . . . . . . . . . . . . . . . . . . . . . . . . . . . 1,562 1,657 939Foreign . . . . . . . . . . . . . . . . . . . . . . . . . . . . . . . . . . . . . . . . . . . . . . . . 1,290 64 892
Total current income tax provision . . . . . . . . . . . . . . . . . . . . . . . . 16,056 13,786 9,778
Deferred:Federal . . . . . . . . . . . . . . . . . . . . . . . . . . . . . . . . . . . . . . . . . . . . . . . . 178 (1,363) (631)State . . . . . . . . . . . . . . . . . . . . . . . . . . . . . . . . . . . . . . . . . . . . . . . . . . (128) (158) (154)Foreign . . . . . . . . . . . . . . . . . . . . . . . . . . . . . . . . . . . . . . . . . . . . . . . . (33) (26) —
Total deferred income tax provision (benefit). . . . . . . . . . . . . . . . 17 (1,547) (785)
Total income tax provision - continuing operations . . . . . . . . . . . . . . . $ 16,073 $ 12,239 $ 8,993
Discontinued operations and gain on sale of discontinuedoperations:
Current:Federal . . . . . . . . . . . . . . . . . . . . . . . . . . . . . . . . . . . . . . . . . . . . . . . . $ (835) $ 5,923 $ (1,147)State . . . . . . . . . . . . . . . . . . . . . . . . . . . . . . . . . . . . . . . . . . . . . . . . . . (69) 458 (88)
Total current income tax provision (benefit). . . . . . . . . . . . . . . . . (904) 6,381 (1,235)
Deferred:Federal . . . . . . . . . . . . . . . . . . . . . . . . . . . . . . . . . . . . . . . . . . . . . . . . 1,146 (2,258) —State . . . . . . . . . . . . . . . . . . . . . . . . . . . . . . . . . . . . . . . . . . . . . . . . . . 95 (175) —
Total deferred income tax (benefit) . . . . . . . . . . . . . . . . . . . . . . . . 1,241 (2,433) —
Total income tax provision (benefit) - discontinued operations andgain on sale of discontinued operations . . . . . . . . . . . . . . . . . . . . . . $ 337 $ 3,948 $ (1,235)
88
Abaxis, Inc. Form 10-K
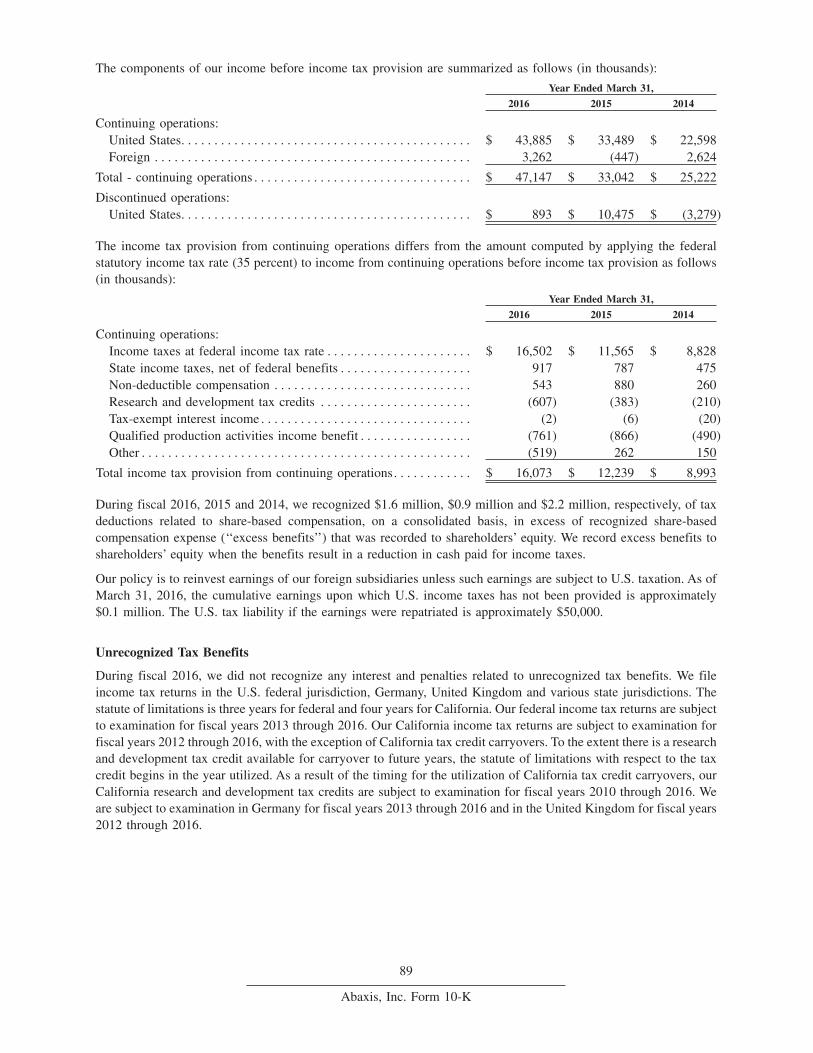
The components of our income before income tax provision are summarized as follows (in thousands):
Year Ended March 31,
2016 2015 2014
Continuing operations:United States. . . . . . . . . . . . . . . . . . . . . . . . . . . . . . . . . . . . . . . . . . . . $ 43,885 $ 33,489 $ 22,598Foreign . . . . . . . . . . . . . . . . . . . . . . . . . . . . . . . . . . . . . . . . . . . . . . . . 3,262 (447) 2,624
Total - continuing operations . . . . . . . . . . . . . . . . . . . . . . . . . . . . . . . . . $ 47,147 $ 33,042 $ 25,222
Discontinued operations:United States. . . . . . . . . . . . . . . . . . . . . . . . . . . . . . . . . . . . . . . . . . . . $ 893 $ 10,475 $ (3,279)
The income tax provision from continuing operations differs from the amount computed by applying the federalstatutory income tax rate (35 percent) to income from continuing operations before income tax provision as follows(in thousands):
Year Ended March 31,
2016 2015 2014
Continuing operations:Income taxes at federal income tax rate . . . . . . . . . . . . . . . . . . . . . . $ 16,502 $ 11,565 $ 8,828State income taxes, net of federal benefits . . . . . . . . . . . . . . . . . . . . 917 787 475Non-deductible compensation . . . . . . . . . . . . . . . . . . . . . . . . . . . . . . 543 880 260Research and development tax credits . . . . . . . . . . . . . . . . . . . . . . . (607) (383) (210)Tax-exempt interest income . . . . . . . . . . . . . . . . . . . . . . . . . . . . . . . . (2) (6) (20)Qualified production activities income benefit . . . . . . . . . . . . . . . . . (761) (866) (490)Other . . . . . . . . . . . . . . . . . . . . . . . . . . . . . . . . . . . . . . . . . . . . . . . . . . (519) 262 150
Total income tax provision from continuing operations. . . . . . . . . . . . $ 16,073 $ 12,239 $ 8,993
During fiscal 2016, 2015 and 2014, we recognized $1.6 million, $0.9 million and $2.2 million, respectively, of taxdeductions related to share-based compensation, on a consolidated basis, in excess of recognized share-basedcompensation expense (‘‘excess benefits’’) that was recorded to shareholders’ equity. We record excess benefits toshareholders’ equity when the benefits result in a reduction in cash paid for income taxes.
Our policy is to reinvest earnings of our foreign subsidiaries unless such earnings are subject to U.S. taxation. As ofMarch 31, 2016, the cumulative earnings upon which U.S. income taxes has not been provided is approximately$0.1 million. The U.S. tax liability if the earnings were repatriated is approximately $50,000.
Unrecognized Tax Benefits
During fiscal 2016, we did not recognize any interest and penalties related to unrecognized tax benefits. We fileincome tax returns in the U.S. federal jurisdiction, Germany, United Kingdom and various state jurisdictions. Thestatute of limitations is three years for federal and four years for California. Our federal income tax returns are subjectto examination for fiscal years 2013 through 2016. Our California income tax returns are subject to examination forfiscal years 2012 through 2016, with the exception of California tax credit carryovers. To the extent there is a researchand development tax credit available for carryover to future years, the statute of limitations with respect to the taxcredit begins in the year utilized. As a result of the timing for the utilization of California tax credit carryovers, ourCalifornia research and development tax credits are subject to examination for fiscal years 2010 through 2016. Weare subject to examination in Germany for fiscal years 2013 through 2016 and in the United Kingdom for fiscal years2012 through 2016.
89
Abaxis, Inc. Form 10-K
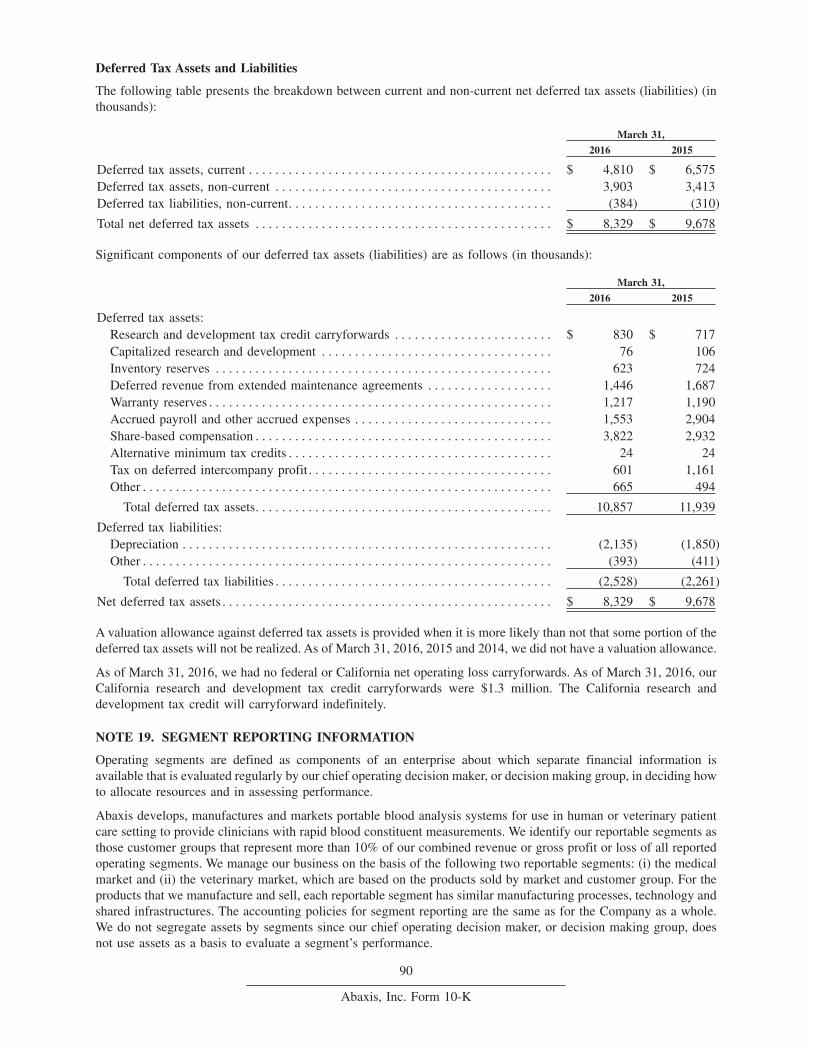
Deferred Tax Assets and Liabilities
The following table presents the breakdown between current and non-current net deferred tax assets (liabilities) (inthousands):
March 31,
2016 2015
Deferred tax assets, current . . . . . . . . . . . . . . . . . . . . . . . . . . . . . . . . . . . . . . . . . . . . . . $ 4,810 $ 6,575Deferred tax assets, non-current . . . . . . . . . . . . . . . . . . . . . . . . . . . . . . . . . . . . . . . . . . 3,903 3,413Deferred tax liabilities, non-current. . . . . . . . . . . . . . . . . . . . . . . . . . . . . . . . . . . . . . . . (384) (310)
Total net deferred tax assets . . . . . . . . . . . . . . . . . . . . . . . . . . . . . . . . . . . . . . . . . . . . . $ 8,329 $ 9,678
Significant components of our deferred tax assets (liabilities) are as follows (in thousands):
March 31,
2016 2015
Deferred tax assets:Research and development tax credit carryforwards . . . . . . . . . . . . . . . . . . . . . . . . $ 830 $ 717Capitalized research and development . . . . . . . . . . . . . . . . . . . . . . . . . . . . . . . . . . . 76 106Inventory reserves . . . . . . . . . . . . . . . . . . . . . . . . . . . . . . . . . . . . . . . . . . . . . . . . . . . 623 724Deferred revenue from extended maintenance agreements . . . . . . . . . . . . . . . . . . . 1,446 1,687Warranty reserves . . . . . . . . . . . . . . . . . . . . . . . . . . . . . . . . . . . . . . . . . . . . . . . . . . . . 1,217 1,190Accrued payroll and other accrued expenses . . . . . . . . . . . . . . . . . . . . . . . . . . . . . . 1,553 2,904Share-based compensation . . . . . . . . . . . . . . . . . . . . . . . . . . . . . . . . . . . . . . . . . . . . . 3,822 2,932Alternative minimum tax credits . . . . . . . . . . . . . . . . . . . . . . . . . . . . . . . . . . . . . . . . 24 24Tax on deferred intercompany profit. . . . . . . . . . . . . . . . . . . . . . . . . . . . . . . . . . . . . 601 1,161Other . . . . . . . . . . . . . . . . . . . . . . . . . . . . . . . . . . . . . . . . . . . . . . . . . . . . . . . . . . . . . . 665 494
Total deferred tax assets. . . . . . . . . . . . . . . . . . . . . . . . . . . . . . . . . . . . . . . . . . . . . 10,857 11,939
Deferred tax liabilities:Depreciation . . . . . . . . . . . . . . . . . . . . . . . . . . . . . . . . . . . . . . . . . . . . . . . . . . . . . . . . (2,135) (1,850)Other . . . . . . . . . . . . . . . . . . . . . . . . . . . . . . . . . . . . . . . . . . . . . . . . . . . . . . . . . . . . . . (393) (411)
Total deferred tax liabilities . . . . . . . . . . . . . . . . . . . . . . . . . . . . . . . . . . . . . . . . . . (2,528) (2,261)
Net deferred tax assets . . . . . . . . . . . . . . . . . . . . . . . . . . . . . . . . . . . . . . . . . . . . . . . . . . $ 8,329 $ 9,678
A valuation allowance against deferred tax assets is provided when it is more likely than not that some portion of thedeferred tax assets will not be realized. As of March 31, 2016, 2015 and 2014, we did not have a valuation allowance.
As of March 31, 2016, we had no federal or California net operating loss carryforwards. As of March 31, 2016, ourCalifornia research and development tax credit carryforwards were $1.3 million. The California research anddevelopment tax credit will carryforward indefinitely.
NOTE 19. SEGMENT REPORTING INFORMATION
Operating segments are defined as components of an enterprise about which separate financial information isavailable that is evaluated regularly by our chief operating decision maker, or decision making group, in deciding howto allocate resources and in assessing performance.
Abaxis develops, manufactures and markets portable blood analysis systems for use in human or veterinary patientcare setting to provide clinicians with rapid blood constituent measurements. We identify our reportable segments asthose customer groups that represent more than 10% of our combined revenue or gross profit or loss of all reportedoperating segments. We manage our business on the basis of the following two reportable segments: (i) the medicalmarket and (ii) the veterinary market, which are based on the products sold by market and customer group. For theproducts that we manufacture and sell, each reportable segment has similar manufacturing processes, technology andshared infrastructures. The accounting policies for segment reporting are the same as for the Company as a whole.We do not segregate assets by segments since our chief operating decision maker, or decision making group, doesnot use assets as a basis to evaluate a segment’s performance.
90
Abaxis, Inc. Form 10-K
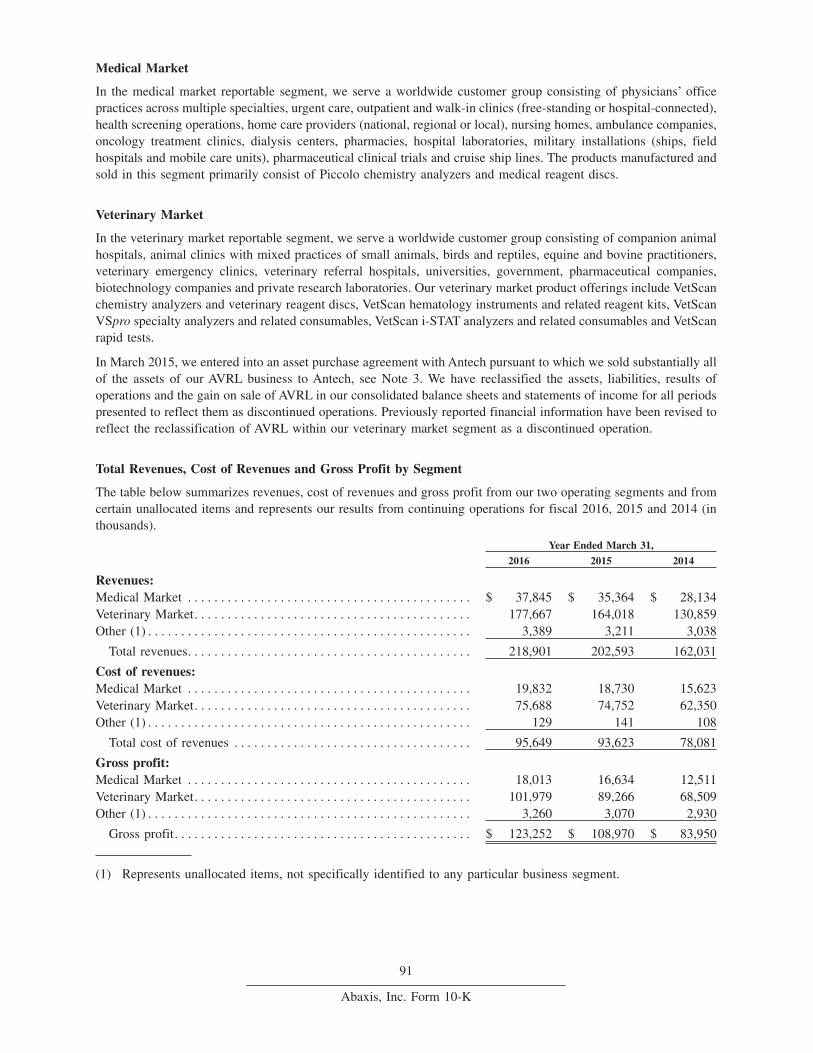
Medical Market
In the medical market reportable segment, we serve a worldwide customer group consisting of physicians’ officepractices across multiple specialties, urgent care, outpatient and walk-in clinics (free-standing or hospital-connected),health screening operations, home care providers (national, regional or local), nursing homes, ambulance companies,oncology treatment clinics, dialysis centers, pharmacies, hospital laboratories, military installations (ships, fieldhospitals and mobile care units), pharmaceutical clinical trials and cruise ship lines. The products manufactured andsold in this segment primarily consist of Piccolo chemistry analyzers and medical reagent discs.
Veterinary Market
In the veterinary market reportable segment, we serve a worldwide customer group consisting of companion animalhospitals, animal clinics with mixed practices of small animals, birds and reptiles, equine and bovine practitioners,veterinary emergency clinics, veterinary referral hospitals, universities, government, pharmaceutical companies,biotechnology companies and private research laboratories. Our veterinary market product offerings include VetScanchemistry analyzers and veterinary reagent discs, VetScan hematology instruments and related reagent kits, VetScanVSpro specialty analyzers and related consumables, VetScan i-STAT analyzers and related consumables and VetScanrapid tests.
In March 2015, we entered into an asset purchase agreement with Antech pursuant to which we sold substantially allof the assets of our AVRL business to Antech, see Note 3. We have reclassified the assets, liabilities, results ofoperations and the gain on sale of AVRL in our consolidated balance sheets and statements of income for all periodspresented to reflect them as discontinued operations. Previously reported financial information have been revised toreflect the reclassification of AVRL within our veterinary market segment as a discontinued operation.
Total Revenues, Cost of Revenues and Gross Profit by Segment
The table below summarizes revenues, cost of revenues and gross profit from our two operating segments and fromcertain unallocated items and represents our results from continuing operations for fiscal 2016, 2015 and 2014 (inthousands).
Year Ended March 31,
2016 2015 2014
Revenues:Medical Market . . . . . . . . . . . . . . . . . . . . . . . . . . . . . . . . . . . . . . . . . . . $ 37,845 $ 35,364 $ 28,134Veterinary Market. . . . . . . . . . . . . . . . . . . . . . . . . . . . . . . . . . . . . . . . . . 177,667 164,018 130,859Other (1) . . . . . . . . . . . . . . . . . . . . . . . . . . . . . . . . . . . . . . . . . . . . . . . . . 3,389 3,211 3,038
Total revenues. . . . . . . . . . . . . . . . . . . . . . . . . . . . . . . . . . . . . . . . . . . 218,901 202,593 162,031
Cost of revenues:Medical Market . . . . . . . . . . . . . . . . . . . . . . . . . . . . . . . . . . . . . . . . . . . 19,832 18,730 15,623Veterinary Market. . . . . . . . . . . . . . . . . . . . . . . . . . . . . . . . . . . . . . . . . . 75,688 74,752 62,350Other (1) . . . . . . . . . . . . . . . . . . . . . . . . . . . . . . . . . . . . . . . . . . . . . . . . . 129 141 108
Total cost of revenues . . . . . . . . . . . . . . . . . . . . . . . . . . . . . . . . . . . . 95,649 93,623 78,081
Gross profit:Medical Market . . . . . . . . . . . . . . . . . . . . . . . . . . . . . . . . . . . . . . . . . . . 18,013 16,634 12,511Veterinary Market. . . . . . . . . . . . . . . . . . . . . . . . . . . . . . . . . . . . . . . . . . 101,979 89,266 68,509Other (1) . . . . . . . . . . . . . . . . . . . . . . . . . . . . . . . . . . . . . . . . . . . . . . . . . 3,260 3,070 2,930
Gross profit. . . . . . . . . . . . . . . . . . . . . . . . . . . . . . . . . . . . . . . . . . . . . $ 123,252 $ 108,970 $ 83,950
(1) Represents unallocated items, not specifically identified to any particular business segment.
91
Abaxis, Inc. Form 10-K
NOTE 20. REVENUES BY PRODUCT CATEGORY AND GEOGRAPHIC REGION ANDSIGNIFICANT CONCENTRATIONS
Revenue Information
The following is a summary of our revenues by product category and represents our results from continuingoperations (in thousands):
Year Ended March 31,
Revenues by Product Category 2016 2015 2014
Instruments (1) . . . . . . . . . . . . . . . . . . . . . . . . . . . . . . . . . . . . . . . . . . . . $ 43,042 $ 48,649 $ 37,539Consumables (2). . . . . . . . . . . . . . . . . . . . . . . . . . . . . . . . . . . . . . . . . . . 165,025 144,446 117,533Other products (3) . . . . . . . . . . . . . . . . . . . . . . . . . . . . . . . . . . . . . . . . . 10,760 9,348 6,809
Product sales, net . . . . . . . . . . . . . . . . . . . . . . . . . . . . . . . . . . . . . . . . . . 218,827 202,443 161,881Development and licensing revenue . . . . . . . . . . . . . . . . . . . . . . . . . . . 74 150 150
Total revenues. . . . . . . . . . . . . . . . . . . . . . . . . . . . . . . . . . . . . . . . . . . . . $ 218,901 $ 202,593 $ 162,031
(1) Instruments include chemistry analyzers, hematology instruments, VSpro specialty analyzers and i-STATanalyzers.
(2) Consumables include reagent discs, hematology reagent kits, VSpro specialty cartridges, i-STAT cartridges andrapid tests.
(3) Other products include products using the Orbos process and extended maintenance agreements.
The following is a summary of our revenues by geographic region based on customer location and represents ourresults from continuing operations (in thousands):
Year Ended March 31,
Revenues by Geographic Region 2016 2015 2014
North America . . . . . . . . . . . . . . . . . . . . . . . . . . . . . . . . . . . . . . . . . . . . $ 175,019 $ 163,308 $ 126,768Europe. . . . . . . . . . . . . . . . . . . . . . . . . . . . . . . . . . . . . . . . . . . . . . . . . . . 31,262 30,422 27,161Asia Pacific and rest of the world. . . . . . . . . . . . . . . . . . . . . . . . . . . . . 12,620 8,863 8,102
Total revenues. . . . . . . . . . . . . . . . . . . . . . . . . . . . . . . . . . . . . . . . . . . . . $ 218,901 $ 202,593 $ 162,031
Significant Concentrations
During fiscal 2016, three distributors in the United States, MWI Veterinary Supply, Inc., Patterson Companies, Inc.and Abbott Point of Care, Inc, accounted for 20%, 11% and 10%, respectively, and one distributor in both the UnitedStates and Europe, Henry Schein, Inc., accounted for 13% of our total worldwide revenues. During fiscal 2015, twodistributors in the United States, MWI Veterinary Supply, Inc., and Abbott Point of Care, Inc. accounted for 19% and11%, respectively, of our total worldwide revenues. During fiscal 2014, two distributors in the United States, MWIVeterinary Supply, Inc., and Abbott Point of Care, Inc. accounted for 19% and 10%, respectively, of our totalworldwide revenues. Starting in the second quarter of fiscal 2016, our revenues from Patterson Companies, Inc.include both Patterson’s veterinary business and Animal Health International, Inc., as a result of Patterson’sacquisition of Animal Health International, Inc. Starting in fiscal 2016, our revenues from Henry Schein, Inc., includeboth Henry Schein, Inc. and scil animal care company GmbH, as a result of Henry Schein Inc.’s acquisition of scilanimal care company GmbH in Europe.
Substantially all of our long-lived assets are located in the United States.
92
Abaxis, Inc. Form 10-K
NOTE 21. SUMMARY OF QUARTERLY DATA (UNAUDITED)
The following table is a summary of unaudited quarterly data for fiscal 2016 and 2015 (in thousands, except per sharedata). Previously reported quarterly amounts have been revised to reflect the reclassification of the AVRL businesswithin our veterinary market segment as discontinued operations. See Note 3, ‘‘Discontinued Operations’’ foradditional information.
Quarter Ended
Fiscal Year Ended March 31, 2016: June 30 September 30 December 31 March 31
Revenues . . . . . . . . . . . . . . . . . . . . . . . . . . . . . . . . . . . . $ 53,090 $ 55,975 $ 52,876 $ 56,960Gross profit . . . . . . . . . . . . . . . . . . . . . . . . . . . . . . . . . . 29,392 31,962 29,602 32,296Income from continuing operations, net of tax . . . . . . 6,995 7,823 7,954 8,302Gain (loss) from discontinued operations, net of tax . . — (7) 4 —Gain on sale of discontinued operations, net of tax. . . — — — 559Net income . . . . . . . . . . . . . . . . . . . . . . . . . . . . . . . . . . . $ 6,995 $ 7,816 $ 7,958 $ 8,861
Net income (loss) per share:Basic
Continuing operations . . . . . . . . . . . . . . . . . . . . . . $ 0.31 $ 0.34 $ 0.35 $ 0.37Discontinued operations. . . . . . . . . . . . . . . . . . . . . — — — 0.02
Basic net income per share . . . . . . . . . . . . . . . . . . . . $ 0.31 $ 0.34 $ 0.35 $ 0.39
DilutedContinuing operations . . . . . . . . . . . . . . . . . . . . . . $ 0.31 $ 0.34 $ 0.35 $ 0.36Discontinued operations. . . . . . . . . . . . . . . . . . . . . — — — 0.03
Diluted net income per share . . . . . . . . . . . . . . . . . . $ 0.31 $ 0.34 $ 0.35 $ 0.39
Cash dividends declared per share . . . . . . . . . . . . . . . . $ 0.11 $ 0.11 $ 0.11 $ 0.11
Quarter Ended
Fiscal Year Ended March 31, 2015: June 30 September 30 December 31 March 31
Revenues . . . . . . . . . . . . . . . . . . . . . . . . . . . . . . . . . . . . $ 44,054 $ 50,471 $ 56,051 $ 52,017Gross profit . . . . . . . . . . . . . . . . . . . . . . . . . . . . . . . . . . 23,703 28,076 28,783 28,408Income from continuing operations, net of tax . . . . . . 5,074 5,712 6,215 3,802Loss from discontinued operations, net of tax . . . . . . . (359) (312) (330) (153)Gain on sale of discontinued operations, net of tax. . . — — — 7,682Net income . . . . . . . . . . . . . . . . . . . . . . . . . . . . . . . . . . . $ 4,715 $ 5,400 $ 5,885 $ 11,331
Net income (loss) per share:Basic
Continuing operations . . . . . . . . . . . . . . . . . . . . . . $ 0.23 $ 0.25 $ 0.27 $ 0.17Discontinued operations. . . . . . . . . . . . . . . . . . . . . (0.02) (0.01) (0.01) 0.33
Basic net income per share . . . . . . . . . . . . . . . . . . . . $ 0.21 $ 0.24 $ 0.26 $ 0.50
DilutedContinuing operations . . . . . . . . . . . . . . . . . . . . . . $ 0.23 $ 0.25 $ 0.27 $ 0.17Discontinued operations. . . . . . . . . . . . . . . . . . . . . (0.02) (0.01) (0.01) 0.33
Diluted net income per share . . . . . . . . . . . . . . . . . . $ 0.21 $ 0.24 $ 0.26 $ 0.50
Cash dividends declared per share . . . . . . . . . . . . . . . . $ 0.10 $ 0.10 $ 0.10 $ 0.10
NOTE 22. SUBSEQUENT EVENTS
On April 27, 2016, our Board of Directors declared a cash dividend of $0.12 per share on our outstanding commonstock to be paid on June 17, 2016 to all shareholders of record as of the close of business on June 3, 2016.
93
Abaxis, Inc. Form 10-K
Item 9. Changes in and Disagreements with Accountants on Accounting and Financial Disclosure
Not applicable.
Item 9A. Controls and Procedures
Evaluation of Disclosure Controls and Procedures
Our management, with the participation of our principal executive officer and principal financial officer, hasevaluated that the effectiveness of our disclosure controls and procedures, as defined in Rules 13a-15(e) and15d-15(e) under the Securities Exchange Act of 1934, as amended, (the ‘‘Exchange Act’’), as of the end of the periodcovered by this report. Based on such evaluation, our principal executive officer and principal financial officer, haveconcluded that, as of the end of such period, our disclosure controls and procedures were effective.
Management’s Report on Internal Control Over Financial Reporting
Our management is responsible for establishing and maintaining adequate internal control over financial reporting asdefined in Rules 13a-15(f) and 15d-15(f) under the Exchange Act. Under the supervision and with the participationof the Company’s management, including its principal executive officer and principal financial officer, we conductedan evaluation of the effectiveness of our internal control over financial reporting based on criteria established in theframework in Internal Control—Integrated Framework (2013 Framework) issued by the Committee of SponsoringOrganizations of the Tredway Commission (COSO). Based on this evaluation, our management has concluded thatour internal control over financial reporting was effective as of March 31, 2016.
Because of its inherent limitations, internal control over financial reporting may not prevent or detect misstatements.Also, projections of any evaluation of effectiveness to future periods are subject to the risks that controls may becomeinadequate because of changes in conditions, or that the degree of compliance with the policies or procedures maydeteriorate. Accordingly, even an effective system of internal control will provide only reasonable assurance that theobjectives of the internal control system are met.
Attestation Report of the Independent Registered Public Accounting Firm
Burr Pilger Mayer, Inc., our independent registered public accounting firm, has issued an audit report on theeffectiveness of our internal control over financial reporting as of March 31, 2016, which report is included elsewhereherein.
Changes in Internal Control over Financial Reporting
There were no changes in our internal control over financial reporting during the fiscal quarter ended March 31, 2016that have materially affected, or are reasonably likely to materially affect, our internal control over financialreporting, as defined in Rule 13a-15(f) and 15d-15(f) under the Exchange Act.
94
Abaxis, Inc. Form 10-K
REPORT OF INDEPENDENT REGISTERED PUBLIC ACCOUNTING FIRM ONINTERNAL CONTROL OVER FINANCIAL REPORTING
To the Board of Directors and Shareholdersof Abaxis, Inc.
We have audited the internal control over financial reporting of Abaxis, Inc. and its subsidiaries (the‘‘Company’’) asof March 31, 2016, based on criteria established in Internal Control — Integrated Framework (2013 Framework)issued by the Committee of Sponsoring Organizations of the Tredway Commission (COSO). The Company’smanagement is responsible for maintaining effective internal control over financial reporting and for its assessmentof the effectiveness of internal control over financial reporting included in the accompanying Management’s Reporton Internal Control Over Financial Reporting. Our responsibility is to express an opinion on the Company’s internalcontrol over financial reporting based on our audit.
We conducted our audit in accordance with the standards of the Public Company Accounting Oversight Board(United States). Those standards require that we plan and perform the audit to obtain reasonable assurance aboutwhether effective internal control over financial reporting was maintained in all material respects. Our audit includedobtaining an understanding of internal control over financial reporting, assessing the risk that a material weaknessexists, testing and evaluating the design and operating effectiveness of internal control based on the assessed risk, andperforming such other procedures as we considered necessary in the circumstances. We believe that our auditprovides a reasonable basis for our opinion.
A company’s internal control over financial reporting is a process designed to provide reasonable assurance regardingthe reliability of financial reporting and the preparation of financial statements for external purposes in accordancewith generally accepted accounting principles. A company’s internal control over financial reporting includes thosepolicies and procedures that (1) pertain to the maintenance of records that, in reasonable detail, accurately and fairlyreflect the transactions and dispositions of the assets of the company; (2) provide reasonable assurance thattransactions are recorded as necessary to permit preparation of financial statements in accordance with generallyaccepted accounting principles, and that receipts and expenditures of the company are being made only in accordancewith authorizations of management and directors of the company; and (3) provide reasonable assurance regardingprevention or timely detection of unauthorized acquisition, use, or disposition of the company’s assets that could havea material effect on the financial statements.
Because of its inherent limitations, internal control over financial reporting may not prevent or detect misstatements.Also, projections of any evaluation of effectiveness to future periods are subject to the risk that controls may becomeinadequate because of changes in conditions, or that the degree of compliance with the policies or procedures maydeteriorate.
In our opinion, Abaxis, Inc. and its subsidiaries maintained, in all material respects, effective internal control overfinancial reporting as of March 31, 2016, based on criteria established in Internal Controls Integrated Framework(2013 Framework) by COSO.
We also have audited, in accordance with the standards of the Public Company Accounting Oversight Board (UnitedStates), the consolidated balance sheets of Abaxis, Inc. and its subsidiaries as of March 31, 2016 and 2015, and therelated consolidated statements of income, comprehensive income, shareholders’ equity, and cash flows for each ofthe three years in the period ended March 31, 2016 and the related financial statement schedule and our report datedMay 31, 2016 expressed an unqualified opinion thereon.
/s/ Burr Pilger Mayer, Inc.San Jose, CaliforniaMay 31, 2016
95
Abaxis, Inc. Form 10-K
Item 9B. Other Information
Not applicable.
PART III
The information required by Part III is omitted from this report and will be included in an amendment to this reportfiled no later than 120 days after the end of the fiscal year covered by this Annual Report on Form 10-K.
Item 10. Directors, Executive Officers and Corporate Governance
The information required by this item will be contained in an amendment to this Annual Report on Form 10-K.
Item 11. Executive Compensation
The information required by this item will be contained in an amendment to this Annual Report on Form 10-K.
Item 12. Security Ownership of Certain Beneficial Owners and Management and Related StockholderMatters
The information required by this item will be contained in an amendment to this Annual Report on Form 10-K.
Item 13. Certain Relationships and Related Transactions, and Director Independence
The information required by this item will be contained in an amendment to this Annual Report on Form 10-K.
Item 14. Principal Accounting Fees and Services
The information required by this item will be contained in an amendment to this Annual Report on Form 10-K.
96
Abaxis, Inc. Form 10-K
PART IV
Item 15. Exhibits and Financial Statement Schedules
(a) The following financial statements, schedules and exhibits are filed as part of this report:
1. Financial Statements - The Financial Statements required by this item are listed on the Index to ConsolidatedFinancial Statements in Part II, Item 8 of this report, which is incorporated by reference herein.
2. Financial Statement Schedules -
• Schedule II – Valuation and Qualifying Accounts and Reserves
• Other financial statement schedules are not included because they are not required or the information isotherwise shown in the consolidated financial statements or notes thereto.
3. Exhibits - The exhibits listed on the accompanying Exhibit Index are filed as part of, or are incorporated byreference into, this report.
(b) See Item 15(a)(3) above.
(c) See Item 15(a)(2) above.
97
Abaxis, Inc. Form 10-K
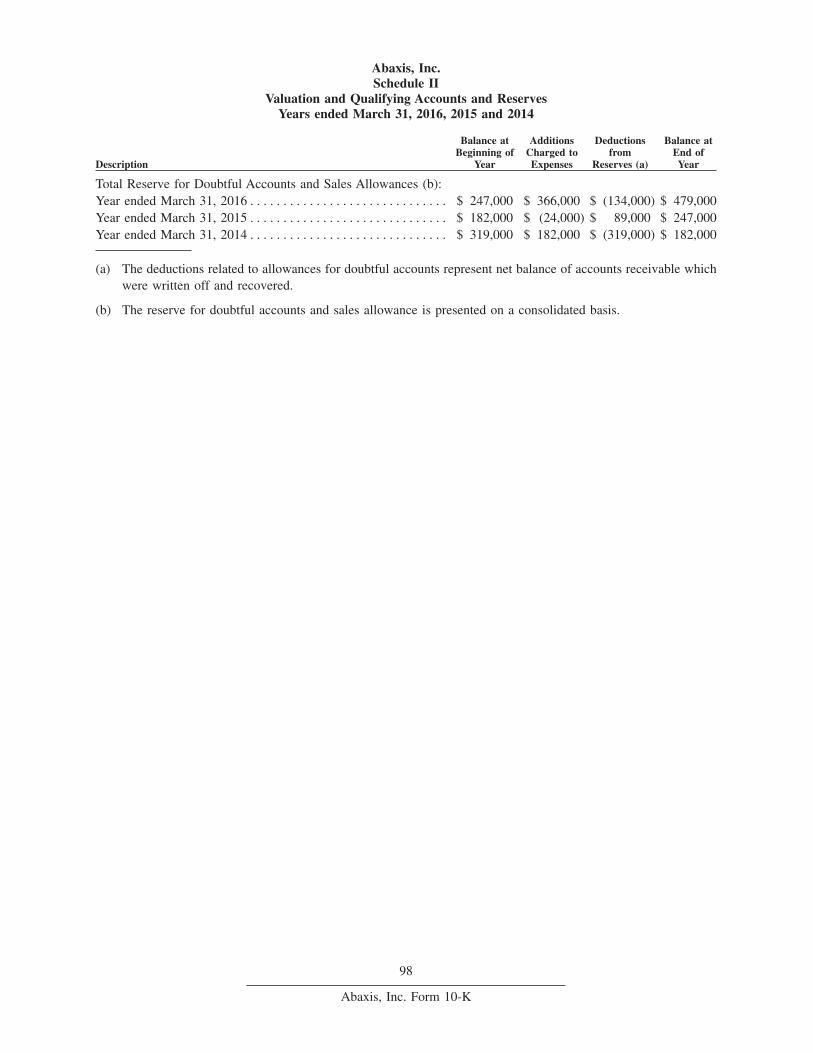
Abaxis, Inc.Schedule II
Valuation and Qualifying Accounts and ReservesYears ended March 31, 2016, 2015 and 2014
Description
Balance atBeginning of
Year
AdditionsCharged toExpenses
Deductionsfrom
Reserves (a)
Balance atEnd ofYear
Total Reserve for Doubtful Accounts and Sales Allowances (b):Year ended March 31, 2016 . . . . . . . . . . . . . . . . . . . . . . . . . . . . . . $ 247,000 $ 366,000 $ (134,000) $ 479,000Year ended March 31, 2015 . . . . . . . . . . . . . . . . . . . . . . . . . . . . . . $ 182,000 $ (24,000) $ 89,000 $ 247,000Year ended March 31, 2014 . . . . . . . . . . . . . . . . . . . . . . . . . . . . . . $ 319,000 $ 182,000 $ (319,000) $ 182,000
(a) The deductions related to allowances for doubtful accounts represent net balance of accounts receivable whichwere written off and recovered.
(b) The reserve for doubtful accounts and sales allowance is presented on a consolidated basis.
98
Abaxis, Inc. Form 10-K
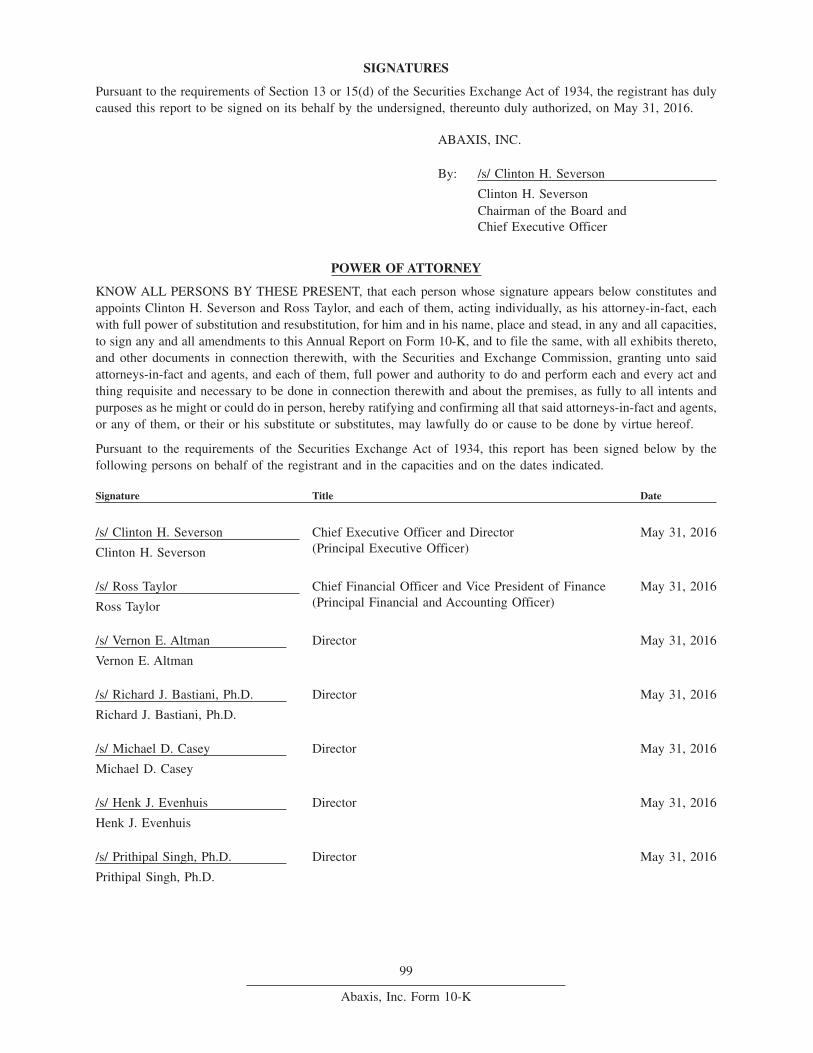
SIGNATURES
Pursuant to the requirements of Section 13 or 15(d) of the Securities Exchange Act of 1934, the registrant has dulycaused this report to be signed on its behalf by the undersigned, thereunto duly authorized, on May 31, 2016.
ABAXIS, INC.
By: /s/ Clinton H. Severson
Clinton H. SeversonChairman of the Board andChief Executive Officer
POWER OF ATTORNEY
KNOW ALL PERSONS BY THESE PRESENT, that each person whose signature appears below constitutes andappoints Clinton H. Severson and Ross Taylor, and each of them, acting individually, as his attorney-in-fact, eachwith full power of substitution and resubstitution, for him and in his name, place and stead, in any and all capacities,to sign any and all amendments to this Annual Report on Form 10-K, and to file the same, with all exhibits thereto,and other documents in connection therewith, with the Securities and Exchange Commission, granting unto saidattorneys-in-fact and agents, and each of them, full power and authority to do and perform each and every act andthing requisite and necessary to be done in connection therewith and about the premises, as fully to all intents andpurposes as he might or could do in person, hereby ratifying and confirming all that said attorneys-in-fact and agents,or any of them, or their or his substitute or substitutes, may lawfully do or cause to be done by virtue hereof.
Pursuant to the requirements of the Securities Exchange Act of 1934, this report has been signed below by thefollowing persons on behalf of the registrant and in the capacities and on the dates indicated.
Signature Title Date
/s/ Clinton H. Severson Chief Executive Officer and Director(Principal Executive Officer)
May 31, 2016
Clinton H. Severson
/s/ Ross Taylor Chief Financial Officer and Vice President of Finance(Principal Financial and Accounting Officer)
May 31, 2016
Ross Taylor
/s/ Vernon E. Altman Director May 31, 2016
Vernon E. Altman
/s/ Richard J. Bastiani, Ph.D. Director May 31, 2016
Richard J. Bastiani, Ph.D.
/s/ Michael D. Casey Director May 31, 2016
Michael D. Casey
/s/ Henk J. Evenhuis Director May 31, 2016
Henk J. Evenhuis
/s/ Prithipal Singh, Ph.D. Director May 31, 2016
Prithipal Singh, Ph.D.
99
Abaxis, Inc. Form 10-K

Exhibit Index
ExhibitNo. Description of Document
3.1 Amended and Restated Articles of Incorporation, as amended (filed with the Securities and ExchangeCommission on May 30, 2014 as Exhibit 3.1 to our Annual Report on Form 10-K for the fiscal year endedMarch 31, 2014 and incorporated herein by reference).
3.2 By-laws, as amended (filed with the Securities and Exchange Commission on May 30, 2014 asExhibit 3.2 to our Annual Report on Form 10-K for the fiscal year ended March 31, 2014 andincorporated herein by reference).
4.1 Form of Warrant to Purchase Shares of Common Stock of Abaxis, Inc. issued to the National Institute forStrategic Technology Acquisition and Commercialization (filed with the Securities and ExchangeCommission on June 13, 2011 as Exhibit 4.3 to our Annual Report on Form 10-K for the fiscal year endedMarch 31, 2011 and incorporated herein by reference).
10.1 Lease Agreement with Principal Development Investors, LLC, dated June 21, 2000 (filed with theSecurities and Exchange Commission on January 10, 2001 as Exhibit 10.10 to our Registration Statementon Form S-3 and incorporated herein by reference).
10.2* Amended and Restated Executive Employment Agreement with Mr. Clinton H. Severson, datedOctober 27, 2010 (filed with the Securities and Exchange Commission on February 9, 2011 asExhibit 10.1 to our Quarterly Report on Form 10-Q for the quarter ended December 31, 2010 andincorporated herein by reference).
10.3* 2005 Equity Incentive Plan, as amended and restated through November 8, 2012 (filed with the Securitiesand Exchange Commission on February 11, 2013 as Exhibit 10.4 to our Quarterly Report on Form 10-Qfor the quarter ended December 31, 2012 and incorporated herein by reference).
10.4* Form of Notice of Grant of Restricted Stock Units (time vesting) under the 2005 Equity Incentive Plan(filed with the Securities and Exchange Commission on June 14, 2013 as Exhibit 10.7 to our AnnualReport on Form 10-K for the year ended March 31, 2013 and incorporated herein by reference).
10.5* Form of Notice of Grant of Restricted Stock Units (performance vesting) under the 2005 Equity IncentivePlan (filed with the Securities and Exchange Commission on June 14, 2013 as Exhibit 10.8 to our AnnualReport on Form 10-K for the year ended March 31, 2013 and incorporated herein by reference).
10.6* 2014 Equity Incentive Plan (filed with the Securities and Exchange Commission on October 22, 2014 asExhibit 99.2 to our Registration Statement on Form S-8 (File No. 333-199518) and incorporated hereinby reference).
10.7* Forms of Restricted Stock Unit (time vesting) Grant Notice and Award Agreements under the Abaxis, Inc.2014 Equity Incentive Plan (filed with the Securities and Exchange Commission on February 9, 2015 asExhibit 10.2 to our Quarterly Report on Form 10-Q for the quarter ended December 31, 2014 andincorporated herein by reference).
10.8* Forms of Restricted Stock Unit (performance vesting) Grant Notice and Award Agreements under theAbaxis, Inc. 2014 Equity Incentive Plan (filed with the Securities and Exchange Commission onFebruary 9, 2015 as Exhibit 10.3 to our Quarterly Report on Form 10-Q for the quarter endedDecember 31, 2014 and incorporated herein by reference).
10.9* Abaxis, Inc. Executive Change of Control Severance Plan, as amended as of December 23, 2008 (filedwith the Securities and Exchange Commission on February 9, 2009 as Exhibit 10.2 to our QuarterlyReport on Form 10-Q for the quarter ended December 31, 2008 and incorporated herein by reference).
10.10* Fiscal 2016 Base Salary and Target Bonus for the Named Executive Officers (filed with the Securitiesand Exchange Commission on May 4, 2015 as a part of our Current Report on Form 8-K and incorporatedherein by reference).
100
Abaxis, Inc. Form 10-K
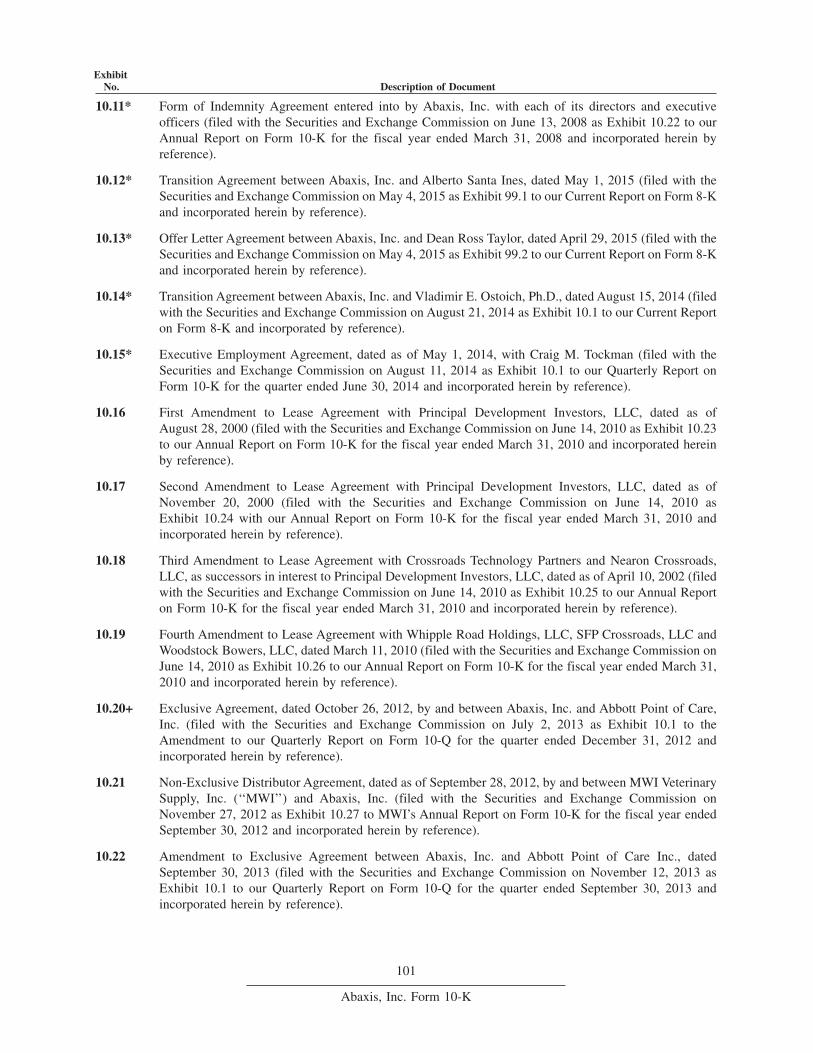
ExhibitNo. Description of Document
10.11* Form of Indemnity Agreement entered into by Abaxis, Inc. with each of its directors and executiveofficers (filed with the Securities and Exchange Commission on June 13, 2008 as Exhibit 10.22 to ourAnnual Report on Form 10-K for the fiscal year ended March 31, 2008 and incorporated herein byreference).
10.12* Transition Agreement between Abaxis, Inc. and Alberto Santa Ines, dated May 1, 2015 (filed with theSecurities and Exchange Commission on May 4, 2015 as Exhibit 99.1 to our Current Report on Form 8-Kand incorporated herein by reference).
10.13* Offer Letter Agreement between Abaxis, Inc. and Dean Ross Taylor, dated April 29, 2015 (filed with theSecurities and Exchange Commission on May 4, 2015 as Exhibit 99.2 to our Current Report on Form 8-Kand incorporated herein by reference).
10.14* Transition Agreement between Abaxis, Inc. and Vladimir E. Ostoich, Ph.D., dated August 15, 2014 (filedwith the Securities and Exchange Commission on August 21, 2014 as Exhibit 10.1 to our Current Reporton Form 8-K and incorporated by reference).
10.15* Executive Employment Agreement, dated as of May 1, 2014, with Craig M. Tockman (filed with theSecurities and Exchange Commission on August 11, 2014 as Exhibit 10.1 to our Quarterly Report onForm 10-K for the quarter ended June 30, 2014 and incorporated herein by reference).
10.16 First Amendment to Lease Agreement with Principal Development Investors, LLC, dated as ofAugust 28, 2000 (filed with the Securities and Exchange Commission on June 14, 2010 as Exhibit 10.23to our Annual Report on Form 10-K for the fiscal year ended March 31, 2010 and incorporated hereinby reference).
10.17 Second Amendment to Lease Agreement with Principal Development Investors, LLC, dated as ofNovember 20, 2000 (filed with the Securities and Exchange Commission on June 14, 2010 asExhibit 10.24 with our Annual Report on Form 10-K for the fiscal year ended March 31, 2010 andincorporated herein by reference).
10.18 Third Amendment to Lease Agreement with Crossroads Technology Partners and Nearon Crossroads,LLC, as successors in interest to Principal Development Investors, LLC, dated as of April 10, 2002 (filedwith the Securities and Exchange Commission on June 14, 2010 as Exhibit 10.25 to our Annual Reporton Form 10-K for the fiscal year ended March 31, 2010 and incorporated herein by reference).
10.19 Fourth Amendment to Lease Agreement with Whipple Road Holdings, LLC, SFP Crossroads, LLC andWoodstock Bowers, LLC, dated March 11, 2010 (filed with the Securities and Exchange Commission onJune 14, 2010 as Exhibit 10.26 to our Annual Report on Form 10-K for the fiscal year ended March 31,2010 and incorporated herein by reference).
10.20+ Exclusive Agreement, dated October 26, 2012, by and between Abaxis, Inc. and Abbott Point of Care,Inc. (filed with the Securities and Exchange Commission on July 2, 2013 as Exhibit 10.1 to theAmendment to our Quarterly Report on Form 10-Q for the quarter ended December 31, 2012 andincorporated herein by reference).
10.21 Non-Exclusive Distributor Agreement, dated as of September 28, 2012, by and between MWI VeterinarySupply, Inc. (‘‘MWI’’) and Abaxis, Inc. (filed with the Securities and Exchange Commission onNovember 27, 2012 as Exhibit 10.27 to MWI’s Annual Report on Form 10-K for the fiscal year endedSeptember 30, 2012 and incorporated herein by reference).
10.22 Amendment to Exclusive Agreement between Abaxis, Inc. and Abbott Point of Care Inc., datedSeptember 30, 2013 (filed with the Securities and Exchange Commission on November 12, 2013 asExhibit 10.1 to our Quarterly Report on Form 10-Q for the quarter ended September 30, 2013 andincorporated herein by reference).
101
Abaxis, Inc. Form 10-K
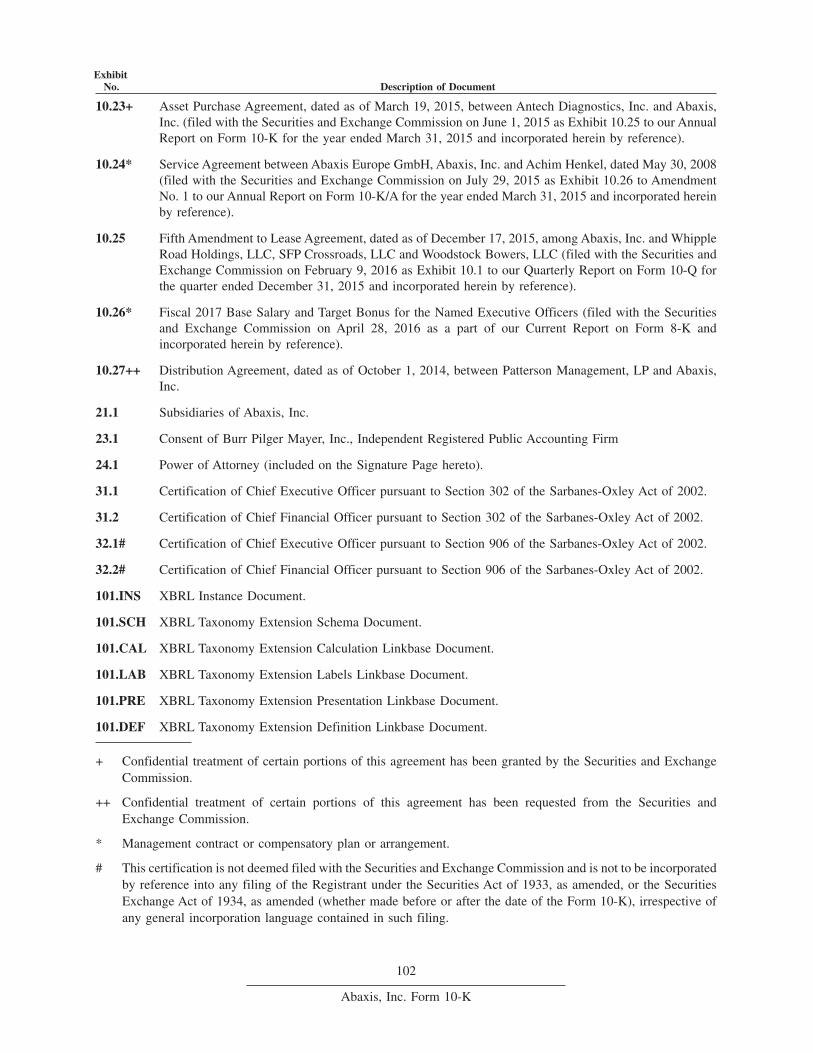
ExhibitNo. Description of Document
10.23+ Asset Purchase Agreement, dated as of March 19, 2015, between Antech Diagnostics, Inc. and Abaxis,Inc. (filed with the Securities and Exchange Commission on June 1, 2015 as Exhibit 10.25 to our AnnualReport on Form 10-K for the year ended March 31, 2015 and incorporated herein by reference).
10.24* Service Agreement between Abaxis Europe GmbH, Abaxis, Inc. and Achim Henkel, dated May 30, 2008(filed with the Securities and Exchange Commission on July 29, 2015 as Exhibit 10.26 to AmendmentNo. 1 to our Annual Report on Form 10-K/A for the year ended March 31, 2015 and incorporated hereinby reference).
10.25 Fifth Amendment to Lease Agreement, dated as of December 17, 2015, among Abaxis, Inc. and WhippleRoad Holdings, LLC, SFP Crossroads, LLC and Woodstock Bowers, LLC (filed with the Securities andExchange Commission on February 9, 2016 as Exhibit 10.1 to our Quarterly Report on Form 10-Q forthe quarter ended December 31, 2015 and incorporated herein by reference).
10.26* Fiscal 2017 Base Salary and Target Bonus for the Named Executive Officers (filed with the Securitiesand Exchange Commission on April 28, 2016 as a part of our Current Report on Form 8-K andincorporated herein by reference).
10.27++ Distribution Agreement, dated as of October 1, 2014, between Patterson Management, LP and Abaxis,Inc.
21.1 Subsidiaries of Abaxis, Inc.
23.1 Consent of Burr Pilger Mayer, Inc., Independent Registered Public Accounting Firm
24.1 Power of Attorney (included on the Signature Page hereto).
31.1 Certification of Chief Executive Officer pursuant to Section 302 of the Sarbanes-Oxley Act of 2002.
31.2 Certification of Chief Financial Officer pursuant to Section 302 of the Sarbanes-Oxley Act of 2002.
32.1# Certification of Chief Executive Officer pursuant to Section 906 of the Sarbanes-Oxley Act of 2002.
32.2# Certification of Chief Financial Officer pursuant to Section 906 of the Sarbanes-Oxley Act of 2002.
101.INS XBRL Instance Document.
101.SCH XBRL Taxonomy Extension Schema Document.
101.CAL XBRL Taxonomy Extension Calculation Linkbase Document.
101.LAB XBRL Taxonomy Extension Labels Linkbase Document.
101.PRE XBRL Taxonomy Extension Presentation Linkbase Document.
101.DEF XBRL Taxonomy Extension Definition Linkbase Document.
+ Confidential treatment of certain portions of this agreement has been granted by the Securities and ExchangeCommission.
++ Confidential treatment of certain portions of this agreement has been requested from the Securities andExchange Commission.
* Management contract or compensatory plan or arrangement.
# This certification is not deemed filed with the Securities and Exchange Commission and is not to be incorporatedby reference into any filing of the Registrant under the Securities Act of 1933, as amended, or the SecuritiesExchange Act of 1934, as amended (whether made before or after the date of the Form 10-K), irrespective ofany general incorporation language contained in such filing.
102
Abaxis, Inc. Form 10-K

UNITED STATES SECURITIES AND EXCHANGE COMMISSIONWashington, D.C. 20549
FORM 10-K/A(Mark One)
☒ ANNUAL REPORT PURSUANT TO SECTION 13 or 15(d) OF THE SECURITIES EXCHANGE ACT OF 1934For the fiscal year ended March 31, 2016
or
□ TRANSITION REPORT PURSUANT TO SECTION 13 or 15(d) OF THE SECURITIES EXCHANGE ACT OF 1934
Commission File Number 000-19720
ABAXIS, INC.(Exact name of registrant as specified in its charter)
California 77-0213001(State or other jurisdiction of incorporation or
organization)(I.R.S. Employer Identification No.)
3240 Whipple Road, Union City, California 94587(Address of principal executive offices) (Zip code)
Registrant’s telephone number, including area code: (510) 675-6500Securities registered pursuant to Section 12(b) of the Act:
Title of Class Name of Each Exchange on Which Registered
Common Stock, no par value NASDAQ Global Select Market
Securities registered pursuant to Section 12(g) of the Act: NoneIndicate by check mark if the registrant is a well-known seasoned issuer, as defined in Rule 405 of the Securities Act.
Yes ☒ No □
Indicate by check mark if the registrant is not required to file reports pursuant to Section 13 or Section 15(d) of the Act.Yes □ No ☒
Indicate by check mark whether the registrant (1) has filed all reports required to be filed by Section 13 or 15(d) of the Securities ExchangeAct of 1934 during the preceding 12 months (or for such shorter period that the registrant was required to file such reports), and (2) has beensubject to such filing requirements for the past 90 days.
Yes ☒ No □
Indicate by check mark whether the registrant has submitted electronically and posted on its corporate Web site, if any, every Interactive DataFile required to be submitted and posted pursuant to Rule 405 of Regulation S-T during the preceding 12 months (or for such shorter periodthat the registrant was required to submit and post such files).
Yes ☒ No □
Indicate by check mark if disclosure of delinquent filers pursuant to Item 405 of Regulation S-K is not contained herein, and will not becontained, to the best of registrant’s knowledge, in definitive proxy or information statements incorporated by reference in Part III of thisForm 10-K or any amendment to this Form 10-K. □Indicate by check mark whether the registrant is a large accelerated filer, an accelerated filer, a non-accelerated filer, or a smaller reportingcompany. See the definitions of ‘‘large accelerated filer,’’ ‘‘accelerated filer’’ and ‘‘smaller reporting company’’ in Rule 12b-2 of the ExchangeAct. (Check one):
Large accelerated filer ☒ Accelerated filer □ Non-accelerated filer □ Smaller reporting company □
(Do not check if a smaller reportingcompany)
Indicate by check mark whether the registrant is a shell company (as defined in Rule 12b-2 of the Exchange Act).Yes □ No ☒
The aggregate market value of the voting stock held by non-affiliates of Abaxis as of September 30, 2015, the last business day of the secondfiscal quarter, based upon the closing price of such stock on the NASDAQ Global Select Market on September 30, 2015, was $701,046,000.For purposes of this disclosure, 6,780,000 shares of common stock held by persons who hold more than 10% of the outstanding shares of theregistrant’s common stock and shares held by executive officers and directors of the registrant have been excluded because such persons maybe deemed to be affiliates. This determination of affiliate status is not necessarily conclusive for any other purpose.As of May 26, 2016, there were 22,500,000 shares of the registrant’s common stock outstanding.
ABAXIS, INC.EXPLANATORY NOTE
Abaxis, Inc., or Abaxis, is filing this amendment, or the Amendment, to its Annual Report on Form 10-K, for thefiscal year ended March 31, 2016, as filed with the Securities and Exchange Commission, or SEC, on May 31,2016, which we refer to as the Original 10-K. This Amendment is filed solely for the purpose of including theinformation required by Part III of Form 10-K.
As required by Rule 12b-15 under the Securities Exchange Act of 1934, as amended, or the Exchange Act, inconnection with this Amendment, Abaxis’ Chief Executive Officer and Chief Financial Officer are providingExchange Act Rule 13a-14(a) certifications as included herein. Accordingly, Item 15 of Part IV has also beenamended to reflect the filing of these new certifications.
Except as described above, this Amendment does not modify or update disclosure in, or exhibits to, the Original10-K. Furthermore, this Amendment does not change any previously reported financial results, nor does it reflectevents occurring after the date of the Original 10-K. Information not affected by this Amendment remainsunchanged and reflects the disclosures made at the time the Original 10-K was filed.
Abaxis, Inc.Annual Report on Form 10-K/A
For The Fiscal Year Ended March 31, 2016
TABLE OF CONTENTS
Page
PART III
Item 10. Directors, Executive Officers and Corporate Governance. . . . . . . . . . . . . . . . . . . . . . . . . . . . . . . . 4Item 11. Executive Compensation . . . . . . . . . . . . . . . . . . . . . . . . . . . . . . . . . . . . . . . . . . . . . . . . . . . . . . . . . 7Item 12. Security Ownership of Certain Beneficial Owners and Management and Related Stockholder
Matters . . . . . . . . . . . . . . . . . . . . . . . . . . . . . . . . . . . . . . . . . . . . . . . . . . . . . . . . . . . . . . . . . . . . . . 42Item 13. Certain Relationships and Related Transactions, and Director Independence . . . . . . . . . . . . . . . . 44Item 14. Principal Accounting Fees and Services. . . . . . . . . . . . . . . . . . . . . . . . . . . . . . . . . . . . . . . . . . . . . . 45
PART IV
Item 15. Exhibits and Financial Statement Schedules . . . . . . . . . . . . . . . . . . . . . . . . . . . . . . . . . . . . . . . . . . 46
Signatures . . . . . . . . . . . . . . . . . . . . . . . . . . . . . . . . . . . . . . . . . . . . . . . . . . . . . . . . . . . . . . . . . . . . . . . . . . . . . . . . 47Exhibit Index. . . . . . . . . . . . . . . . . . . . . . . . . . . . . . . . . . . . . . . . . . . . . . . . . . . . . . . . . . . . . . . . . . . . . . . . . . . . . . 48
3
Abaxis, Inc. Form 10-K/A
PART III
Item 10. Directors, Executive Officers and Corporate Governance
The following table sets forth information concerning Abaxis’ executive officers and directors as of May 31, 2016.
Name Age Title
Clinton H. Severson 68 Chairman of the Board and Chief Executive OfficerVernon E. Altman(1)(3) 70 DirectorRichard J. Bastiani, Ph.D.(1)(2)(3) 73 DirectorMichael D. Casey(1)(2)(3) 70 DirectorHenk J. Evenhuis(1)(3) 73 DirectorPrithipal Singh, Ph.D.(1)(2)(3) 77 DirectorKenneth P. Aron, Ph.D. 63 Chief Technology OfficerAchim Henkel 58 Managing Director of Abaxis Europe GmbHRoss Taylor 52 Chief Financial Officer, Vice President of Finance and SecretaryCraig M. Tockman, DVM 56 Vice President of Animal Health Sales and Marketing for North
AmericaDonald P. Wood 64 President and Chief Operating Officer
(1) Member of the Audit Committee
(2) Member of the Compensation Committee
(3) Member of the Nominating and Corporate Governance Committee
Clinton H. Severson has served as our Chief Executive Officer and one of our directors since June 1996. He wasappointed Chairman of the Board in May 1998. From June 1996 until April 2015, Mr. Severson also served as ourPresident. From February 1989 to May 1996, Mr. Severson served as President and Chief Executive Officer of MASTImmunosystems, Inc., a privately-held medical diagnostic company. Since January 2015, Mr. Severson has served onthe Board of Directors of Cutera. Since June 2011, Mr. Severson has served on the Board of Directors of ResponseBiomedical Corporation. Since November 2008, Mr. Severson has served on the Board of Directors of TrinityBiotech, a biotechnology company. From November 2006 to February 2012, Mr. Severson served on the Board ofDirectors of CytoCore, Inc., a biotechnology company. Mr. Severson is also a member of the Board of Directors ofa privately-held company. Mr. Severson was selected as a director because of his in-depth knowledge of ouroperations, financial condition and strategy in his position as our Chief Executive Officer, as well as his extensivesenior management experience in medical diagnostics and experience serving on the Boards of Directors of variouspublic and private companies.
Vernon E. Altman joined the Board in April 2011 and has served as our lead independent director since April 2014.Mr. Altman joined the founding group to start Bain & Company, a global business consulting firm, in 1973 and iscurrently Senior Advisor of Bain & Company. Mr. Altman is Chairman of the Board of Directors of Vobile, Inc. Healso served on the Board of Directors of Napster, Inc. prior to its acquisition. Mr. Altman was selected to serve asdirector because of his vast array of experiences in many different industry segments, including operational,executive leadership and board experience.
Richard J. Bastiani, Ph.D. joined the Board in September 1995. Dr. Bastiani is currently retired. Dr. Bastiani wasPresident of Dendreon, a biotechnology company, from September 1995 to September 1998. From 1971 until 1995,Dr. Bastiani held a number of positions with Syva Company, a diagnostic company, including as President from 1991until Syva was acquired by a subsidiary of Hoechst AG of Germany in 1995. From 2007 to 2011, Dr. Bastiani servedas Chairman of the Board of Directors of Response Biomedical Corporation. From 1998 to 2005, Dr. Bastiani servedas Chairman of the Board of Directors of ID Biomedical Corporation, after he was appointed to the Board ofDirectors of ID Biomedical Corporation in October 1996. Dr. Bastiani is also a member of the Board of Directorsof three privately-held companies. Dr. Bastiani was selected as a director because of his extensive leadershipexperience with biotechnology companies and his in-depth knowledge of our business, strategy and managementteam, as well as his experience serving as Chairman of the Compensation Committee and on the Boards of Directorsof various public and private companies.
4
Abaxis, Inc. Form 10-K/A
Michael D. Casey joined the Board in October 2010. Mr. Casey is currently retired. From September 1997 toFebruary 2002, Mr. Casey served as the Chairman, President, Chief Executive Officer and a director of MatrixPharmaceutical, Inc., a biotechnology company. From November 1995 to September 1997, Mr. Casey was ExecutiveVice President at Schein Pharmaceutical, Inc., a biotechnology company. From December 1996 to September 1997,he also served as President of the retail and specialty products division of Schein Pharmaceutical, Inc. From June1993 to November 1995, he served as President and Chief Operating Officer of Genetic Therapy, Inc., abiotechnology company. Mr. Casey was President of McNeil Pharmaceutical (a unit of Johnson & Johnson) from1989 to June 1993 and Vice President, Sales and Marketing for Ortho Pharmaceutical Corp. (a subsidiary of Johnson& Johnson) from 1985 to 1989. Mr. Casey has served on the Board of Directors of Celgene Corporation since 2002.Mr. Casey previously served on the Board of Directors of AVI Biopharma, Inc. (now known as Sarepta Therapeutics,Inc.) from 2006 to 2010, Allos Therapeutics, Inc. from 2002 to 2010, Cholestech Corporation from 2001 to 2007,OrthoLogic Corporation from 2004 to 2007, Sicor, Inc. from 2002 to 2004, Bone Care International, Inc. from 2001to 2005 and Durect Corp. from 2004 to 2013. Mr. Casey was selected to serve as director because of his extensiveindustry knowledge and experience, including operational, leadership and board experience from his executivepositions at pharmaceutical and biotechnology companies.
Henk J. Evenhuis joined the Board in November 2002. Mr. Evenhuis is currently retired. Mr. Evenhuis served asExecutive Vice President and Chief Financial Officer of Fair Isaac Corporation, an analytic software company, fromOctober 1999 to October 2002. From 1987 to 1998, he was Executive Vice President and Chief Financial Officer ofLam Research Corporation, a semiconductor equipment manufacturer. He served on the Board of Directors ofCredence Systems Corporation from 1993 to 2008. Mr. Evenhuis was selected as a director because of his financialexpertise and prior senior leadership experience as a Chief Financial Officer at global technology companies, as wellas his experience serving on the boards of various public companies, which provides a strong foundation to serve asChairman of the Audit Committee.
Prithipal Singh, Ph.D. joined the Board in June 1992. Dr. Singh is currently retired. Prior to retiring, Dr. Singh wasthe Founder, Chairman and Chief Executive Officer of ChemTrak Inc., a manufacturer of medical diagnosticequipment, from 1988 to 1998. Dr. Singh was an Executive Vice President of Idetec Corporation, an animal healthcare company, from 1985 to 1988 and a Vice President of Syva Corporation, a diagnostic company, from 1977 to1985. Dr. Singh was selected as a director because of his insight and experience with biotechnology companiesthrough his prior executive leadership and management positions.
Kenneth P. Aron, Ph.D. has served as our Chief Technology Officer since April 2008. Dr. Aron joined us in February2000 as Vice President of Research and Development. From April 1998 to November 1999, Dr. Aron was VicePresident of Engineering and Technology of Incyte Pharmaceuticals, a genomic information company. From April1996 to April 1998, Dr. Aron was Vice President of Research, Development and Engineering for CardiogenesisCorporation, a manufacturer of laser-based cardiology surgical products.
Achim Henkel has served as the Managing Director of our subsidiary, Abaxis Europe GmbH, since its incorporationin 2008. From January 2000 to June 2008, Mr. Henkel served as our Sales and Marketing Manager for Europe, theMiddle East and Africa. Starting in October 2014, Mr. Henkel has also served as our Sales and Marketing Managerfor Asia. From January 1998 to December 2000, Mr. Henkel served as a consultant to Abaxis.
Ross Taylor has served as our Chief Financial Officer, Vice President of Finance and Secretary since August 2015.Mr. Taylor joined us in October 2014 as Vice President of Business Development and Investor Relations. From 2005to 2014, Mr. Taylor served as Senior Vice President, Equity Research Analyst at CL King & Associates, an investmentbanking firm.
Craig M. Tockman, DVM has served as our Vice President of Animal Health Sales and Marketing for NorthAmerica since April 2014. Dr. Tockman joined in June 2006 as Director of Professional Services and was promotedto Director of Field Operations in October 2013. From 2003 to 2006, Dr. Tockman served on Abaxis’Advisory Boardsince he joined in 2003 as a founding member.
Donald P. Wood has served as our President and Chief Operating Officer since April 2015. Mr. Wood joined us inOctober 2007 as Vice President of Operations, served as Chief Operations Officer from April 2009 to April 2014 andserved as Chief Operating Officer from April 2014 to April 2015. From April 2003 to September 2007, Mr. Woodwas the Vice President of Operations of Cholestech Corporation, a medical products manufacturing company that wassubsequently acquired by Inverness Medical Innovations, Inc. in September 2007. From July 2001 to March 2003,Mr. Wood served as Vice President of Bone Health, a business unit of Quidel Corporation, a manufacturing and
5
Abaxis, Inc. Form 10-K/A
marketer of point-of-care diagnostics, and was responsible for Bone Health Product Operations, Device Research andDevelopment, and Sales and Marketing. He also served as Quidel’s Vice President of Ultrasound Operations fromAugust 1999 to July 2001. From July 1998 to August 1999, Mr. Wood was the Director of Ultrasound Operationsfor Metra Biosystems Inc., a developer and manufacturing company of point-of-care products for osteoporosis, priorto Quidel’s acquisition of Metra Biosystems Inc.
Term and Number of Directors
All of our directors hold office until the next annual meeting of shareholders of Abaxis and until their successors havebeen elected and qualified. Our Bylaws authorize our Board of Directors to fix the number of directors at not lessthan four nor more than seven. The number of authorized directors of Abaxis is currently six.
Each of our executive officers serves at the discretion of the Board of Directors. There are no family relationshipsamong any of our directors or executive officers.
Identification of Audit Committee and Financial Expert
The Audit Committee of the Board of Directors oversees Abaxis’ corporate accounting, financial reporting processand systems of internal control and financial controls. The following outside directors comprise the Audit Committee:Mr. Evenhuis, Mr. Altman, Dr. Bastiani, Mr. Casey, and Dr. Singh. Mr. Evenhuis serves as Chairman of the AuditCommittee.
The Board has determined that all members of the Audit Committee are independent (based on the requirements forindependence set forth in Rule 4350(d)(2)(A)(i) and (ii) of the NASDAQ listing standards). SEC regulations requireAbaxis to disclose whether a director qualifying as an ‘‘audit committee financial expert’’ serves on the AuditCommittee. The Board of Directors has determined that Mr. Evenhuis qualifies as an ‘‘audit committee financialexpert,’’ as defined in applicable SEC rules. The Board of Directors made a qualitative assessment of Mr. Evenhuis’level of knowledge and experience based on a number of factors, including his formal education and experience asa chief financial officer for public reporting companies.
Section 16(a) Beneficial Ownership Reporting Compliance
Section 16(a) of the Exchange Act requires our executive officers, directors and persons who beneficially own morethan 10% of our equity securities to file initial reports of ownership and reports of changes in ownership with theSEC. Such persons are required by SEC regulations to furnish us with copies of all Section 16(a) forms filed by suchpersons.
Based solely on our review of the copies of Forms 3, 4 and 5 and amendments thereto received by us or filed withthe SEC, we believe that during the period from April 1, 2015 through March 31, 2016, our executive officers,directors and greater than 10% shareholders complied with all applicable filing requirements applicable to theseexecutive officers, directors and greater than 10% shareholders, except with respect to one late Form 4 filing byMr. Donald Wood.
Code of Business Conduct and Ethics
Abaxis has adopted a Code of Business Conduct and Ethics that applies to all of our executive officers, directors andemployees, including without limitation our principal executive officer, principal financial officer, principalaccounting officer or controller or persons performing similar functions. The Code of Business Conduct and Ethicsis available on our website at www.abaxis.com under ‘‘About Us’’ at ‘‘Corporate Governance.’’ We intend to discloseany amendment to, or waiver of, any provision of the Code of Business Conduct and Ethics by disclosing suchinformation on our website, to the extent required by the applicable rules and exchange requirements.
6
Abaxis, Inc. Form 10-K/A
Item 11. Executive Compensation
COMPENSATION DISCUSSION AND ANALYSIS
This Compensation Discussion and Analysis describes the principles underlying the material components of ourexecutive compensation program for our executive officers, including the Named Executive Officers in the‘‘Summary Compensation Table.’’ We also provide an overview of the overall objectives of the program and thefactors relevant to an analysis of these policies and decisions. Our ‘‘Named Executive Officers’’ and their currenttitles are as follows:
• Clinton H. Severson, Chief Executive Officer and Chairman of the Board
• Ross Taylor, Chief Financial Officer, Vice President of Finance and Secretary
• Alberto R. Santa Ines, former Chief Financial Officer, Vice President of Finance and Secretary
• Kenneth P. Aron, Ph.D., Chief Technology Officer
• Craig M. Tockman, DVM, Vice President of Animal Health Sales and Marketing for North America
• Donald P. Wood, President and Chief Operating Officer
Mr. Taylor first became an executive officer upon his appointment to Chief Financial Officer, Vice President ofFinance and Secretary, effective as of August 1, 2015. Prior to that date, Mr. Santa Ines served as our Chief FinancialOfficer, Vice President of Finance and Secretary, until his retirement on July 31, 2015, after which he providedpart-time, non-executive employee services to us until May 15, 2016.
On April 28, 2015, Mr. Wood was appointed to the role of President and Chief Operating Officer. Prior to that date,Mr. Severson served as our President and Mr. Wood served as our Chief Operating Officer.
Executive Summary
The Compensation Committee believes our executive compensation program reflects a strong pay-for-performancephilosophy and is well-aligned with the short- and long-term interests of shareholders.
Fiscal 2016 Executive Business Performance
During fiscal 2016 our financial and operating performances were strong as we continued our efforts to enhance ourbusiness and create and sustain long-term value. We demonstrated year-over-year growth in revenues, net income andliquidity.
Our fiscal 2016 achievements include:
• Increased worldwide revenues from continuing operations by 8%, from $202.6 million in fiscal 2015 to$218.9 million in fiscal 2016. Revenues from continuing operations in North America increased by 7%, or$11.7 million, in fiscal 2016 compared to fiscal 2015, and revenues from continuing operations outside of NorthAmerica increased by 12%, or $4.6 million, in fiscal 2016 compared to fiscal 2015. Revenues from consumablesales increased to $165.0 million, an increase of 14% over fiscal 2015. In our medical market, total revenuesfrom continuing operations increased to $37.8 million in fiscal 2016, an increase of 7% over fiscal 2015. In ourveterinary market, total revenues from continuing operations increased to $177.7 million in fiscal 2016, anincrease of 8% over fiscal 2015.
• Increased gross profit to $123.3 million in fiscal 2016, an increase of 13% compared to fiscal 2015.
• Invested 8% of our revenues, or $18.4 million in research and development in fiscal 2016.
• Increased income from continuing operations to $31.1 million in fiscal 2016, an increase of 49% comparedto fiscal 2015.
• Increased diluted net income per share from continuing operations to $1.36 in fiscal 2016 from $0.91 infiscal 2015, an increase of 49%.
• Generated cash from operations of $28.1 million through the continued conservative management of ourworking capital and overall business.
7
Abaxis, Inc. Form 10-K/A
• Repurchased $13.0 million of Abaxis common stock under our share repurchase program.
• Paid four quarterly dividends of $0.11 per share on our outstanding common stock during fiscal 2016,returning an aggregate of approximately $10.0 million in cash to all shareholders.
We ended fiscal 2016 with cash, cash equivalents and investments of $152.3 million.
Fiscal 2016 Executive Compensation Highlights
Consistent with our pay-for-performance philosophy, our Compensation Committee took the following actions duringfiscal 2016 with respect to Named Executive Officer compensation.
Total Compensation Mix: Continued to deliver a substantial portion of our Named Executive Officer compensationin the form of variable, at-risk pay, structuring approximately 88% of our Named Executive Officer target total directcompensation (base salary, target bonus and long-term equity awards based on grant date fair value) in the form ofvariable, at-risk compensation (target bonus and long-term equity awards).
Performance Bonus: Established rigorous performance metrics at the beginning of fiscal 2016 and a specificcalculation methodology for the Named Executive Officers’ cash bonus opportunity. We substantially achieved suchperformance goals, at an aggregate achievement rate of 97% for the fiscal year. Each of our Named ExecutiveOfficers earned a cash bonus based on our actual performance achievement. No discretionary annual bonuses wereawarded.
Equity Incentive Awards: Awarded a significant portion (an average of 70%) of the Named Executive Officers’ annualequity incentive awards in the form of awards that vest based on achievement of specified corporate performancegoals, in addition to continued service over a four-year period. The portion (an average of 30%) of the NamedExecutive Officers’ annual equity incentive awards that do not vest based on specific performance goal achievementvest over a four-year period subject to the officers’ continued service, but are structured so the vesting is heavilyweighted towards the end of such period, with 70% vesting only if the officer remains continuously in service withus for four years.
Adjustments to Elements of Compensation: Made certain increases to the Named Executive Officers’ fiscal 2016 basesalaries and target bonuses in recognition of our Named Executive Officers’ contributions towards our businessperformance in fiscal 2015 and, in certain cases, to adjust for increased duties and responsibilities assumed byparticular Named Executive Officers. We did not make any increases to the number of shares that we awarded theNamed Executive Officers’ in the form of equity awards from those amounts awarded in fiscal 2015 (except withrespect to Mr. Taylor, who first became an executive officer in fiscal 2016).
Peer Group Analysis: Reviewed and reconstituted our peer group of companies in preparation for fiscal 2017compensation decisions, in order to ensure that we maintain market data from an appropriate and relevant group ofcompanies with whom we compete for talent as a helpful reference point in making executive compensationdecisions.
8
Abaxis, Inc. Form 10-K/A
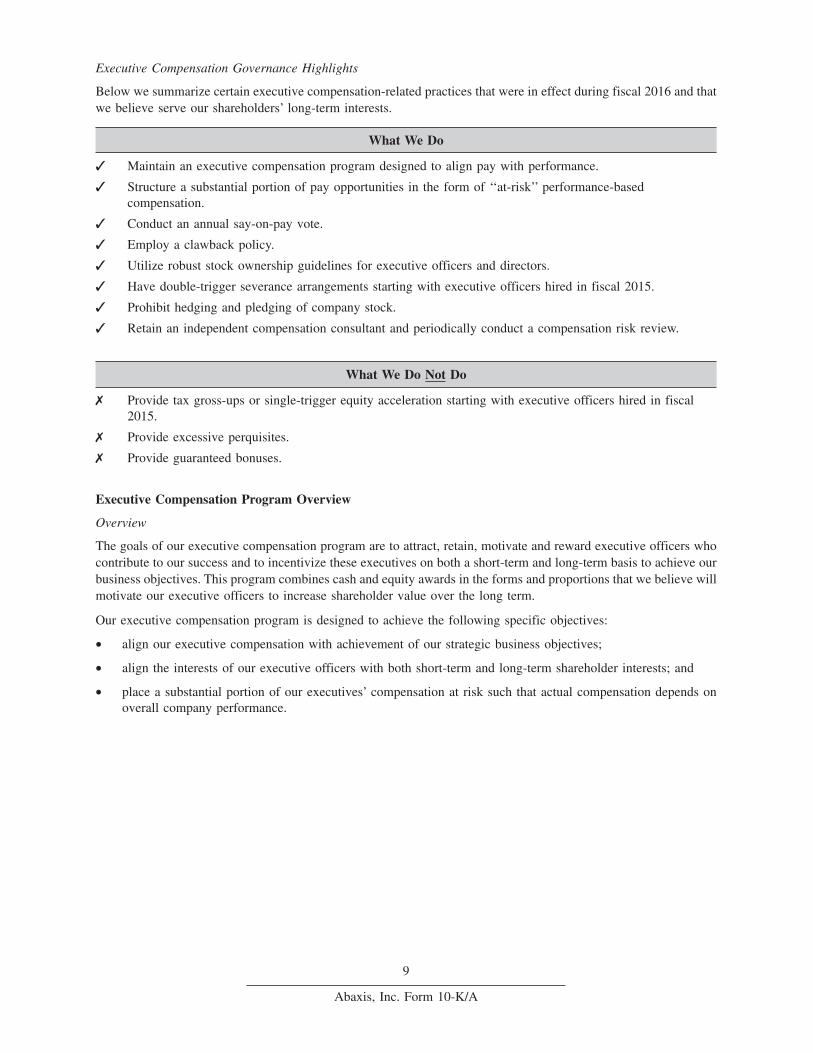
Executive Compensation Governance Highlights
Below we summarize certain executive compensation-related practices that were in effect during fiscal 2016 and thatwe believe serve our shareholders’ long-term interests.
What We Do
✓ Maintain an executive compensation program designed to align pay with performance.
✓ Structure a substantial portion of pay opportunities in the form of ‘‘at-risk’’ performance-basedcompensation.
✓ Conduct an annual say-on-pay vote.
✓ Employ a clawback policy.
✓ Utilize robust stock ownership guidelines for executive officers and directors.
✓ Have double-trigger severance arrangements starting with executive officers hired in fiscal 2015.
✓ Prohibit hedging and pledging of company stock.
✓ Retain an independent compensation consultant and periodically conduct a compensation risk review.
What We Do Not Do
✗ Provide tax gross-ups or single-trigger equity acceleration starting with executive officers hired in fiscal2015.
✗ Provide excessive perquisites.
✗ Provide guaranteed bonuses.
Executive Compensation Program Overview
Overview
The goals of our executive compensation program are to attract, retain, motivate and reward executive officers whocontribute to our success and to incentivize these executives on both a short-term and long-term basis to achieve ourbusiness objectives. This program combines cash and equity awards in the forms and proportions that we believe willmotivate our executive officers to increase shareholder value over the long term.
Our executive compensation program is designed to achieve the following specific objectives:
• align our executive compensation with achievement of our strategic business objectives;
• align the interests of our executive officers with both short-term and long-term shareholder interests; and
• place a substantial portion of our executives’ compensation at risk such that actual compensation depends onoverall company performance.
9
Abaxis, Inc. Form 10-K/A
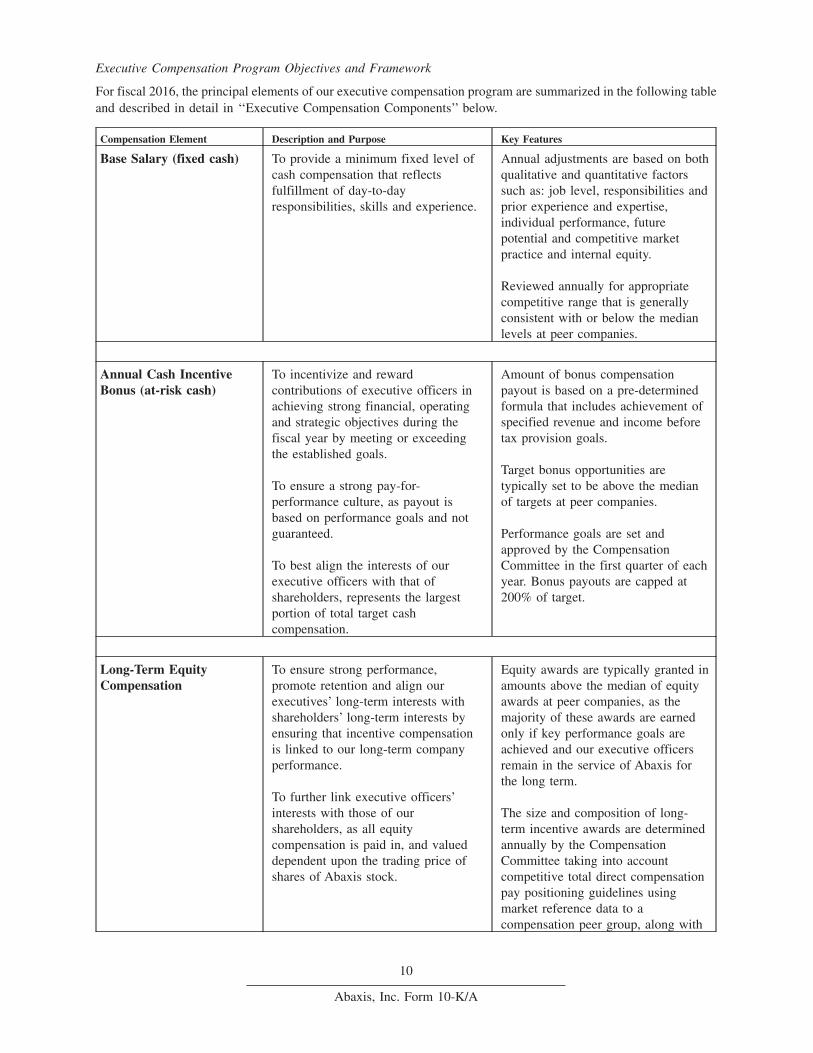
Executive Compensation Program Objectives and Framework
For fiscal 2016, the principal elements of our executive compensation program are summarized in the following tableand described in detail in ‘‘Executive Compensation Components’’ below.
Compensation Element Description and Purpose Key Features
Base Salary (fixed cash) To provide a minimum fixed level ofcash compensation that reflectsfulfillment of day-to-dayresponsibilities, skills and experience.
Annual adjustments are based on bothqualitative and quantitative factorssuch as: job level, responsibilities andprior experience and expertise,individual performance, futurepotential and competitive marketpractice and internal equity.
Reviewed annually for appropriatecompetitive range that is generallyconsistent with or below the medianlevels at peer companies.
Annual Cash IncentiveBonus (at-risk cash)
To incentivize and rewardcontributions of executive officers inachieving strong financial, operatingand strategic objectives during thefiscal year by meeting or exceedingthe established goals.
To ensure a strong pay-for-performance culture, as payout isbased on performance goals and notguaranteed.
To best align the interests of ourexecutive officers with that ofshareholders, represents the largestportion of total target cashcompensation.
Amount of bonus compensationpayout is based on a pre-determinedformula that includes achievement ofspecified revenue and income beforetax provision goals.
Target bonus opportunities aretypically set to be above the medianof targets at peer companies.
Performance goals are set andapproved by the CompensationCommittee in the first quarter of eachyear. Bonus payouts are capped at200% of target.
Long-Term EquityCompensation
To ensure strong performance,promote retention and align ourexecutives’ long-term interests withshareholders’ long-term interests byensuring that incentive compensationis linked to our long-term companyperformance.
To further link executive officers’interests with those of ourshareholders, as all equitycompensation is paid in, and valueddependent upon the trading price ofshares of Abaxis stock.
Equity awards are typically granted inamounts above the median of equityawards at peer companies, as themajority of these awards are earnedonly if key performance goals areachieved and our executive officersremain in the service of Abaxis forthe long term.
The size and composition of long-term incentive awards are determinedannually by the CompensationCommittee taking into accountcompetitive total direct compensationpay positioning guidelines usingmarket reference data to acompensation peer group, along with
10
Abaxis, Inc. Form 10-K/A
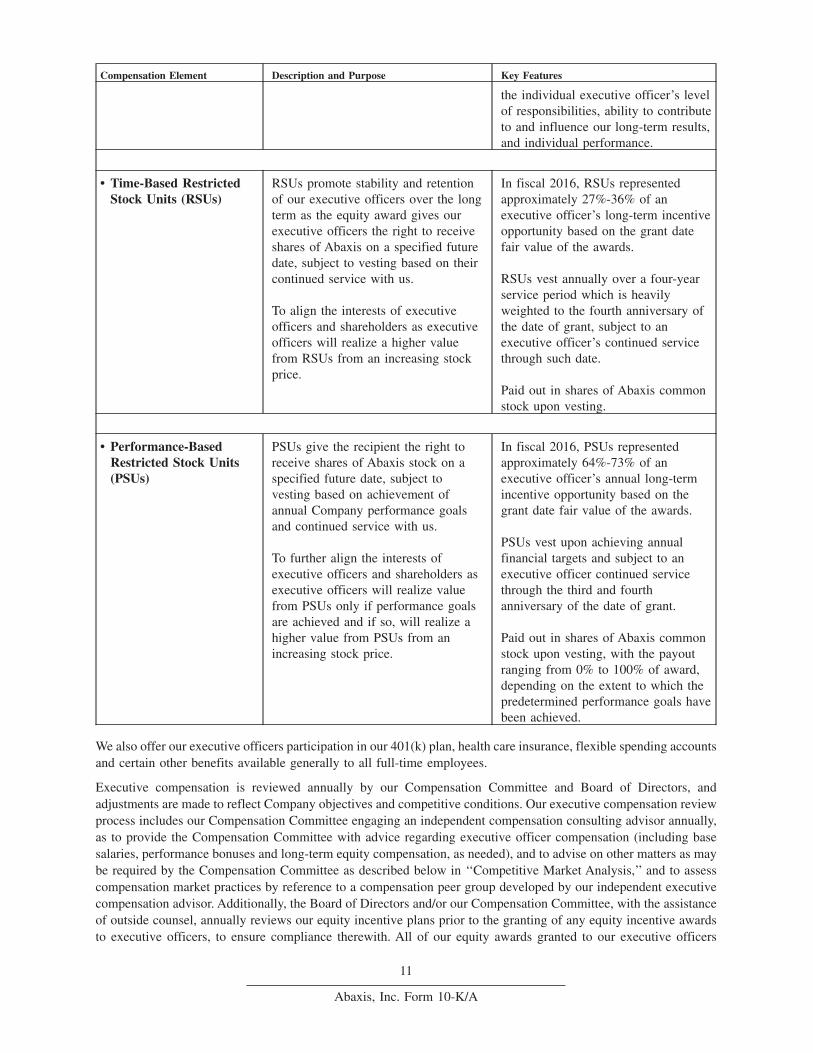
Compensation Element Description and Purpose Key Features
the individual executive officer’s levelof responsibilities, ability to contributeto and influence our long-term results,and individual performance.
• Time-Based RestrictedStock Units (RSUs)
RSUs promote stability and retentionof our executive officers over the longterm as the equity award gives ourexecutive officers the right to receiveshares of Abaxis on a specified futuredate, subject to vesting based on theircontinued service with us.
To align the interests of executiveofficers and shareholders as executiveofficers will realize a higher valuefrom RSUs from an increasing stockprice.
In fiscal 2016, RSUs representedapproximately 27%-36% of anexecutive officer’s long-term incentiveopportunity based on the grant datefair value of the awards.
RSUs vest annually over a four-yearservice period which is heavilyweighted to the fourth anniversary ofthe date of grant, subject to anexecutive officer’s continued servicethrough such date.
Paid out in shares of Abaxis commonstock upon vesting.
• Performance-BasedRestricted Stock Units(PSUs)
PSUs give the recipient the right toreceive shares of Abaxis stock on aspecified future date, subject tovesting based on achievement ofannual Company performance goalsand continued service with us.
To further align the interests ofexecutive officers and shareholders asexecutive officers will realize valuefrom PSUs only if performance goalsare achieved and if so, will realize ahigher value from PSUs from anincreasing stock price.
In fiscal 2016, PSUs representedapproximately 64%-73% of anexecutive officer’s annual long-termincentive opportunity based on thegrant date fair value of the awards.
PSUs vest upon achieving annualfinancial targets and subject to anexecutive officer continued servicethrough the third and fourthanniversary of the date of grant.
Paid out in shares of Abaxis commonstock upon vesting, with the payoutranging from 0% to 100% of award,depending on the extent to which thepredetermined performance goals havebeen achieved.
We also offer our executive officers participation in our 401(k) plan, health care insurance, flexible spending accountsand certain other benefits available generally to all full-time employees.
Executive compensation is reviewed annually by our Compensation Committee and Board of Directors, andadjustments are made to reflect Company objectives and competitive conditions. Our executive compensation reviewprocess includes our Compensation Committee engaging an independent compensation consulting advisor annually,as to provide the Compensation Committee with advice regarding executive officer compensation (including basesalaries, performance bonuses and long-term equity compensation, as needed), and to advise on other matters as maybe required by the Compensation Committee as described below in ‘‘Competitive Market Analysis,’’ and to assesscompensation market practices by reference to a compensation peer group developed by our independent executivecompensation advisor. Additionally, the Board of Directors and/or our Compensation Committee, with the assistanceof outside counsel, annually reviews our equity incentive plans prior to the granting of any equity incentive awardsto executive officers, to ensure compliance therewith. All of our equity awards granted to our executive officers
11
Abaxis, Inc. Form 10-K/A
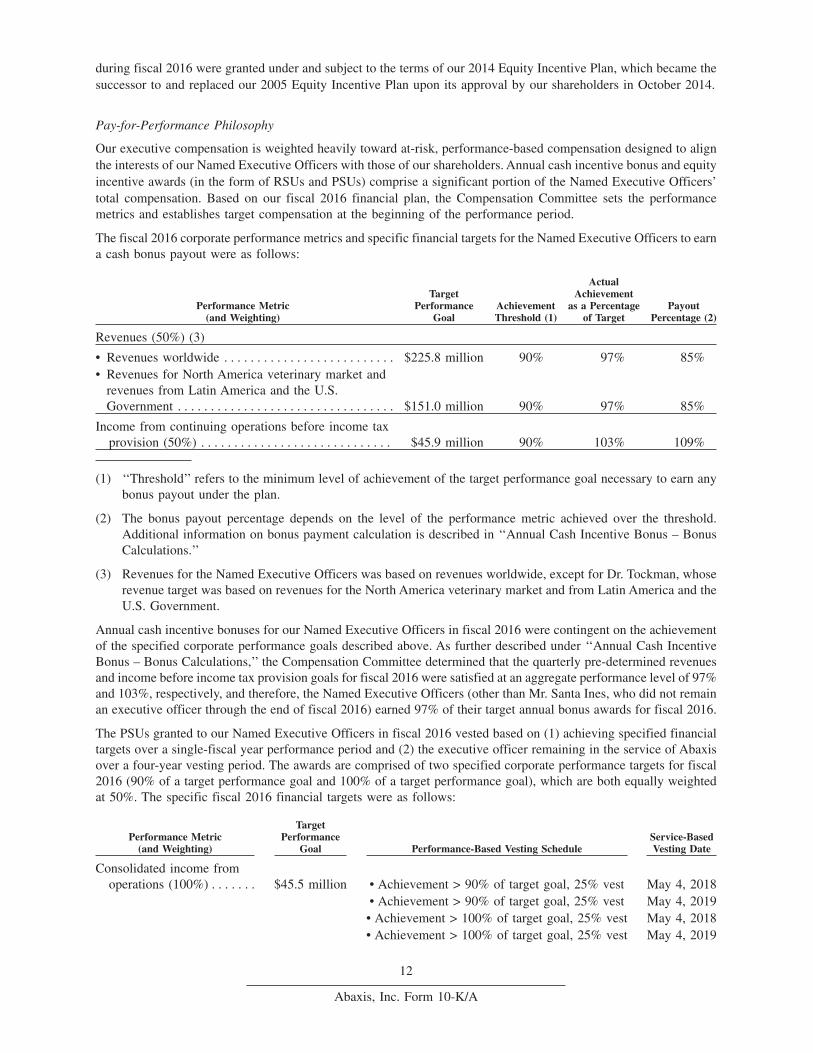
during fiscal 2016 were granted under and subject to the terms of our 2014 Equity Incentive Plan, which became thesuccessor to and replaced our 2005 Equity Incentive Plan upon its approval by our shareholders in October 2014.
Pay-for-Performance Philosophy
Our executive compensation is weighted heavily toward at-risk, performance-based compensation designed to alignthe interests of our Named Executive Officers with those of our shareholders. Annual cash incentive bonus and equityincentive awards (in the form of RSUs and PSUs) comprise a significant portion of the Named Executive Officers’total compensation. Based on our fiscal 2016 financial plan, the Compensation Committee sets the performancemetrics and establishes target compensation at the beginning of the performance period.
The fiscal 2016 corporate performance metrics and specific financial targets for the Named Executive Officers to earna cash bonus payout were as follows:
Performance Metric(and Weighting)
TargetPerformance
GoalAchievementThreshold (1)
ActualAchievement
as a Percentageof Target
PayoutPercentage (2)
Revenues (50%) (3)
• Revenues worldwide . . . . . . . . . . . . . . . . . . . . . . . . . . $225.8 million 90% 97% 85%• Revenues for North America veterinary market and
revenues from Latin America and the U.S.Government . . . . . . . . . . . . . . . . . . . . . . . . . . . . . . . . . $151.0 million 90% 97% 85%
Income from continuing operations before income taxprovision (50%) . . . . . . . . . . . . . . . . . . . . . . . . . . . . . $45.9 million 90% 103% 109%
(1) ‘‘Threshold’’ refers to the minimum level of achievement of the target performance goal necessary to earn anybonus payout under the plan.
(2) The bonus payout percentage depends on the level of the performance metric achieved over the threshold.Additional information on bonus payment calculation is described in ‘‘Annual Cash Incentive Bonus – BonusCalculations.’’
(3) Revenues for the Named Executive Officers was based on revenues worldwide, except for Dr. Tockman, whoserevenue target was based on revenues for the North America veterinary market and from Latin America and theU.S. Government.
Annual cash incentive bonuses for our Named Executive Officers in fiscal 2016 were contingent on the achievementof the specified corporate performance goals described above. As further described under ‘‘Annual Cash IncentiveBonus – Bonus Calculations,’’ the Compensation Committee determined that the quarterly pre-determined revenuesand income before income tax provision goals for fiscal 2016 were satisfied at an aggregate performance level of 97%and 103%, respectively, and therefore, the Named Executive Officers (other than Mr. Santa Ines, who did not remainan executive officer through the end of fiscal 2016) earned 97% of their target annual bonus awards for fiscal 2016.
The PSUs granted to our Named Executive Officers in fiscal 2016 vested based on (1) achieving specified financialtargets over a single-fiscal year performance period and (2) the executive officer remaining in the service of Abaxisover a four-year vesting period. The awards are comprised of two specified corporate performance targets for fiscal2016 (90% of a target performance goal and 100% of a target performance goal), which are both equally weightedat 50%. The specific fiscal 2016 financial targets were as follows:
Performance Metric(and Weighting)
TargetPerformance
Goal Performance-Based Vesting ScheduleService-BasedVesting Date
Consolidated income fromoperations (100%) . . . . . . . $45.5 million • Achievement > 90% of target goal, 25% vest May 4, 2018
• Achievement > 90% of target goal, 25% vest May 4, 2019• Achievement > 100% of target goal, 25% vest May 4, 2018• Achievement > 100% of target goal, 25% vest May 4, 2019
12
Abaxis, Inc. Form 10-K/A
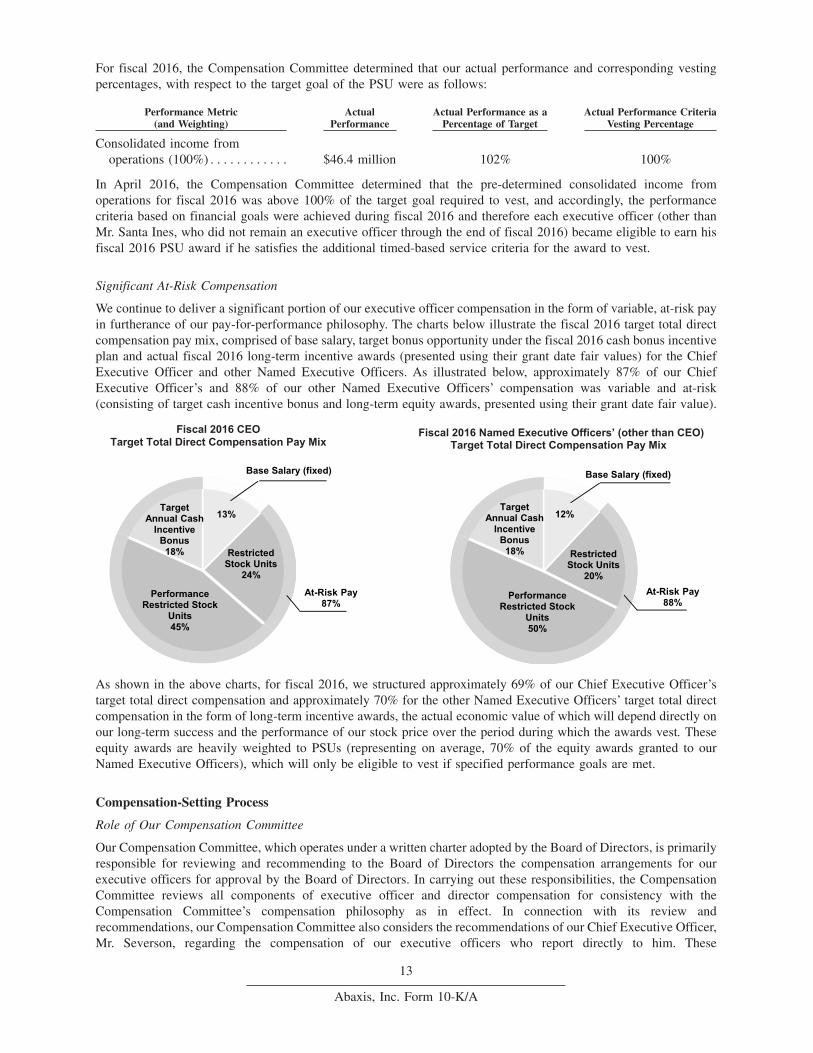
For fiscal 2016, the Compensation Committee determined that our actual performance and corresponding vestingpercentages, with respect to the target goal of the PSU were as follows:
Performance Metric(and Weighting)
ActualPerformance
Actual Performance as aPercentage of Target
Actual Performance CriteriaVesting Percentage
Consolidated income fromoperations (100%) . . . . . . . . . . . . $46.4 million 102% 100%
In April 2016, the Compensation Committee determined that the pre-determined consolidated income fromoperations for fiscal 2016 was above 100% of the target goal required to vest, and accordingly, the performancecriteria based on financial goals were achieved during fiscal 2016 and therefore each executive officer (other thanMr. Santa Ines, who did not remain an executive officer through the end of fiscal 2016) became eligible to earn hisfiscal 2016 PSU award if he satisfies the additional timed-based service criteria for the award to vest.
Significant At-Risk Compensation
We continue to deliver a significant portion of our executive officer compensation in the form of variable, at-risk payin furtherance of our pay-for-performance philosophy. The charts below illustrate the fiscal 2016 target total directcompensation pay mix, comprised of base salary, target bonus opportunity under the fiscal 2016 cash bonus incentiveplan and actual fiscal 2016 long-term incentive awards (presented using their grant date fair values) for the ChiefExecutive Officer and other Named Executive Officers. As illustrated below, approximately 87% of our ChiefExecutive Officer’s and 88% of our other Named Executive Officers’ compensation was variable and at-risk(consisting of target cash incentive bonus and long-term equity awards, presented using their grant date fair value).
13%
Performance
Restricted Stock
Units
45%
Target
Annual Cash
Incentive
Bonus
18%
Base Salary (fixed)
At-Risk Pay
87%
Restricted
Stock Units
24%
12%
Performance
Restricted Stock
Units
50%
Target
Annual Cash
Incentive
Bonus
18%
Base Salary (fixed)
At-Risk Pay
88%
Restricted
Stock Units
20%
Fiscal 2016 CEO
Target Total Direct Compensation Pay MixFiscal 2016 Named Executive Officers’ (other than CEO)
Target Total Direct Compensation Pay Mix
As shown in the above charts, for fiscal 2016, we structured approximately 69% of our Chief Executive Officer’starget total direct compensation and approximately 70% for the other Named Executive Officers’ target total directcompensation in the form of long-term incentive awards, the actual economic value of which will depend directly onour long-term success and the performance of our stock price over the period during which the awards vest. Theseequity awards are heavily weighted to PSUs (representing on average, 70% of the equity awards granted to ourNamed Executive Officers), which will only be eligible to vest if specified performance goals are met.
Compensation-Setting Process
Role of Our Compensation Committee
Our Compensation Committee, which operates under a written charter adopted by the Board of Directors, is primarilyresponsible for reviewing and recommending to the Board of Directors the compensation arrangements for ourexecutive officers for approval by the Board of Directors. In carrying out these responsibilities, the CompensationCommittee reviews all components of executive officer and director compensation for consistency with theCompensation Committee’s compensation philosophy as in effect. In connection with its review andrecommendations, our Compensation Committee also considers the recommendations of our Chief Executive Officer,Mr. Severson, regarding the compensation of our executive officers who report directly to him. These
13
Abaxis, Inc. Form 10-K/A
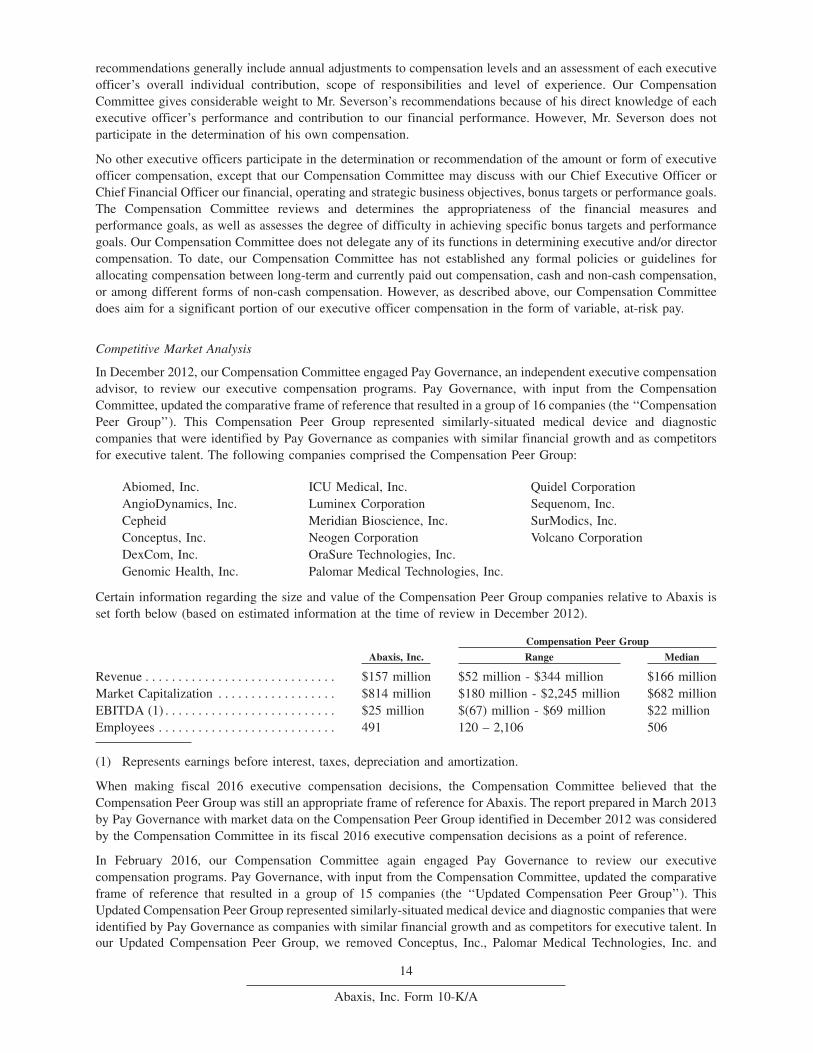
recommendations generally include annual adjustments to compensation levels and an assessment of each executiveofficer’s overall individual contribution, scope of responsibilities and level of experience. Our CompensationCommittee gives considerable weight to Mr. Severson’s recommendations because of his direct knowledge of eachexecutive officer’s performance and contribution to our financial performance. However, Mr. Severson does notparticipate in the determination of his own compensation.
No other executive officers participate in the determination or recommendation of the amount or form of executiveofficer compensation, except that our Compensation Committee may discuss with our Chief Executive Officer orChief Financial Officer our financial, operating and strategic business objectives, bonus targets or performance goals.The Compensation Committee reviews and determines the appropriateness of the financial measures andperformance goals, as well as assesses the degree of difficulty in achieving specific bonus targets and performancegoals. Our Compensation Committee does not delegate any of its functions in determining executive and/or directorcompensation. To date, our Compensation Committee has not established any formal policies or guidelines forallocating compensation between long-term and currently paid out compensation, cash and non-cash compensation,or among different forms of non-cash compensation. However, as described above, our Compensation Committeedoes aim for a significant portion of our executive officer compensation in the form of variable, at-risk pay.
Competitive Market Analysis
In December 2012, our Compensation Committee engaged Pay Governance, an independent executive compensationadvisor, to review our executive compensation programs. Pay Governance, with input from the CompensationCommittee, updated the comparative frame of reference that resulted in a group of 16 companies (the ‘‘CompensationPeer Group’’). This Compensation Peer Group represented similarly-situated medical device and diagnosticcompanies that were identified by Pay Governance as companies with similar financial growth and as competitorsfor executive talent. The following companies comprised the Compensation Peer Group:
Abiomed, Inc. ICU Medical, Inc. Quidel CorporationAngioDynamics, Inc. Luminex Corporation Sequenom, Inc.Cepheid Meridian Bioscience, Inc. SurModics, Inc.Conceptus, Inc. Neogen Corporation Volcano CorporationDexCom, Inc. OraSure Technologies, Inc.Genomic Health, Inc. Palomar Medical Technologies, Inc.
Certain information regarding the size and value of the Compensation Peer Group companies relative to Abaxis isset forth below (based on estimated information at the time of review in December 2012).
Compensation Peer Group
Abaxis, Inc. Range Median
Revenue . . . . . . . . . . . . . . . . . . . . . . . . . . . . . $157 million $52 million - $344 million $166 millionMarket Capitalization . . . . . . . . . . . . . . . . . . $814 million $180 million - $2,245 million $682 millionEBITDA (1) . . . . . . . . . . . . . . . . . . . . . . . . . . $25 million $(67) million - $69 million $22 millionEmployees . . . . . . . . . . . . . . . . . . . . . . . . . . . 491 120 – 2,106 506
(1) Represents earnings before interest, taxes, depreciation and amortization.
When making fiscal 2016 executive compensation decisions, the Compensation Committee believed that theCompensation Peer Group was still an appropriate frame of reference for Abaxis. The report prepared in March 2013by Pay Governance with market data on the Compensation Peer Group identified in December 2012 was consideredby the Compensation Committee in its fiscal 2016 executive compensation decisions as a point of reference.
In February 2016, our Compensation Committee again engaged Pay Governance to review our executivecompensation programs. Pay Governance, with input from the Compensation Committee, updated the comparativeframe of reference that resulted in a group of 15 companies (the ‘‘Updated Compensation Peer Group’’). ThisUpdated Compensation Peer Group represented similarly-situated medical device and diagnostic companies that wereidentified by Pay Governance as companies with similar financial growth and as competitors for executive talent. Inour Updated Compensation Peer Group, we removed Conceptus, Inc., Palomar Medical Technologies, Inc. and
14
Abaxis, Inc. Form 10-K/A
Volcano Corporation since these companies had been acquired and added HeartWare International, Inc. and NxStageMedical, Inc. The following companies comprised the Updated Compensation Peer Group:
Abiomed, Inc. ICU Medical, Inc. Quidel CorporationAngioDynamics, Inc. Luminex Corporation Sequenom, Inc.Cepheid Meridian Bioscience, Inc. SurModics, Inc.DexCom, Inc. Neogen CorporationGenomic Health, Inc. NxStage Medical, Inc.HeartWare International, Inc. OraSure Technologies, Inc.
Certain information regarding the size and value of the Updated Compensation Peer Group companies relative toAbaxis is set forth below (based on estimated information at the time of review in February 2016).
Compensation Peer Group
Abaxis, Inc. Range Median
Revenue . . . . . . . . . . . . . . . . . . . . . . . . . . . . . $214 million $64 million - $539 million $287 millionMarket Capitalization . . . . . . . . . . . . . . . . . . $1,028 million $168 million - $5,551 million $837 millionEBITDA (1) . . . . . . . . . . . . . . . . . . . . . . . . . . $42 million $(46) million - $100 million $24 millionEmployees . . . . . . . . . . . . . . . . . . . . . . . . . . . 582 168 – 3,600 752
(1) Represents earnings before interest, taxes, depreciation and amortization.
The market data obtained regarding the Updated Compensation Peer Group was considered by the CompensationCommittee in its fiscal 2017 executive compensation decisions. Our Compensation Committee and Board ofDirectors may engage compensation consultants in the future as they deem it necessary or appropriate and intend toretain one each year.
Independent Compensation Consultant
The Compensation Committee has considered and assessed all relevant factors, including but not limited to those setforth in Rules 10C-1(b)(4)(i) through (vi) under the Securities Exchange Act of 1934, as amended, that could giverise to a potential conflict of interest with respect to Pay Governance’s work. The Compensation Committeedetermined, based on its analysis of these factors, that the work of Pay Governance, and the individual compensationadvisors employed by Pay Governance as compensation consultants, did not create any conflict of interest.
Shareholder Advisory Vote on Executive Compensation
At our Annual Meeting of Shareholders held on October 28, 2015, we held an advisory vote on executivecompensation. Approximately 86% of the votes cast on the proposal were in favor of our Named Executive Officercompensation as disclosed in the proxy statement. Our Compensation Committee reviewed these final vote resultsand determined that, given the level of support, no material changes to our executive compensation policies andprograms were necessary as a result of the advisory vote on executive compensation.
Executive Compensation Components
Base Salary
We provide an annual base salary to each of our executive officers to compensate them for services rendered duringthe year. Salaries are reviewed annually by the Compensation Committee and adjusted for the ensuing year based on(i) both qualitative and quantitative factors such as job level, responsibilities and prior experience and expertise,individual performance, future potential, (ii) internal review of the executive officer’s total compensation,individually and relative to our other executive officers with similar levels of responsibility within Abaxis and (iii) anevaluation of the compensation levels of similarly-situated executive officers in our Compensation Peer Group (orUpdated Compensation Peer Group with respect to fiscal 2017) and in our industry generally.
For fiscal 2016 base salaries, our Compensation Committee recommended that we increase base salaries in amountsdesigned to make such amounts competitive with those of similarly-situated executives at our peer companies, usingthe report prepared in March 2013 by Pay Governance as a point of reference, to ensure an appropriate balance inthe Named Executive Officers’ compensation mix between cash and equity, to retain employees with the
15
Abaxis, Inc. Form 10-K/A
qualifications desired for each particular position and to reward each of the Named Executive Officers for hisperformance in the prior year. For fiscal 2016, the Compensation Committee made recommendations to target salariesbetween the 25th and 50th percentile of our Compensation Peer Group. Our Compensation Committee considered this25th and 50th percentile range as a general guideline for the appropriate level of potential salaries, but did not attemptto specifically match this or any other percentile. The Compensation Committee and Board of Directors determinedthat many of the prior observations made by Pay Governance in March 2013 continued to be relevant as a point ofreference for fiscal 2016. Our Compensation Committee also considered the recommendations of the Chief ExecutiveOfficer regarding the compensation of each of the Named Executive Officers who reported directly to him. However,the Compensation Committee and our Board of Directors did not base their considerations on any single factor butrather considered a mix of factors and evaluated individual salaries against that mix.
Our Board of Directors set salaries for fiscal 2016 after considering an analysis of total cash compensation for ourexecutive officers compared to the Compensation Peer Group prepared by Pay Governance and the recommendationsof the Compensation Committee. For fiscal 2016 base salaries, our Compensation Committee recommended that weincrease base salaries in amounts designed to reward each of the Named Executive Officers for their performance inthe prior year while maintaining base salaries at an appropriately competitive level for each Named ExecutiveOfficer’s position. The Compensation Committee recommended to the Board of Directors to increase base salariesfor all of our continuing Named Executive Officers from fiscal 2015 to fiscal 2016 to reflect our strong operationaland financial performance during the prior fiscal year overseen by our executive management team, annual meritincreases and individual performances. Mr. Severson’s salary increase of 10.0% also reflected consideration ofMr. Severson’s time served in his position, success of Abaxis in the past year and over an extended period and theimportance of Mr. Severson to the continued success of Abaxis. Mr. Taylor’s salary reflects his increased duties andresponsibilities in the new position of Chief Financial Officer, Vice President of Finance and Secretary. The increasein Dr. Tockman’s salary of 11.5% reflects a merit increase and recognition of the additional responsibilities assumedby Dr. Tockman during fiscal 2015 with respect to sales and marketing in North America, Latin America and the U.S.Government. The increase of 16.7% in Mr. Wood’s salary reflects his promotion from Chief Operating Officer toPresident and Chief Operating Officer in April 2015 and increased responsibilities to oversee sales and marketing inNorth America.
Based on the recommendations of the Compensation Committee, our Board of Directors approved the following basesalaries (except as otherwise noted, effective June 2015 for fiscal 2016 and June 2016 for fiscal 2017) for our NamedExecutive Officers:
Named Executive OfficerFiscal 2016Base Salary
Fiscal 2017Base Salary
Clinton H. Severson. . . . . . . . . . . . . . . . . . . . . . . . . . . . . . . . . . . . . . . . . . . . . . . . . . . $550,000 $575,000Ross Taylor (1) . . . . . . . . . . . . . . . . . . . . . . . . . . . . . . . . . . . . . . . . . . . . . . . . . . . . . . $250,000 $257,500Alberto R. Santa Ines (2) . . . . . . . . . . . . . . . . . . . . . . . . . . . . . . . . . . . . . . . . . . . . . . $290,000 —Kenneth P. Aron, Ph.D. . . . . . . . . . . . . . . . . . . . . . . . . . . . . . . . . . . . . . . . . . . . . . . . . $290,000 $298,700Craig M. Tockman, DVM . . . . . . . . . . . . . . . . . . . . . . . . . . . . . . . . . . . . . . . . . . . . . . $290,000 $298,700Donald P. Wood . . . . . . . . . . . . . . . . . . . . . . . . . . . . . . . . . . . . . . . . . . . . . . . . . . . . . . $350,000 $360,500
(1) Mr. Taylor’s fiscal 2016 base salary was effective upon his appointment as Chief Financial Officer, VicePresident of Finance and Secretary in August 2015.
(2) Upon Mr. Santa Ines’ retirement, effective as of July 31, 2015, he became a part-time, nonexecutive employeeand was paid on an hourly basis at $10.00 per hour until May 15, 2016.
16
Abaxis, Inc. Form 10-K/A
Fiscal 2016 and 2017 base salary increases for the Named Executive Officers were as follows:
Named Executive Officer
Fiscal 2016Percent IncreaseIn Base Salary
from Fiscal 2015
Fiscal 2017Percent IncreaseIn Base Salary
from Fiscal 2016
Clinton H. Severson. . . . . . . . . . . . . . . . . . . . . . . . . . . . . . . . . . . . . . . . . . . . . . . . . . . 10.0% 4.6%Ross Taylor (1) . . . . . . . . . . . . . . . . . . . . . . . . . . . . . . . . . . . . . . . . . . . . . . . . . . . . . . — 3.0%Alberto R. Santa Ines (2) . . . . . . . . . . . . . . . . . . . . . . . . . . . . . . . . . . . . . . . . . . . . . . 3.6% —Kenneth P. Aron, Ph.D. . . . . . . . . . . . . . . . . . . . . . . . . . . . . . . . . . . . . . . . . . . . . . . . . 3.6% 3.0%Craig M. Tockman, DVM . . . . . . . . . . . . . . . . . . . . . . . . . . . . . . . . . . . . . . . . . . . . . . 11.5% 3.0%Donald P. Wood . . . . . . . . . . . . . . . . . . . . . . . . . . . . . . . . . . . . . . . . . . . . . . . . . . . . . . 16.7% 3.0%
(1) Mr. Taylor first became an executive officer upon his appointment to Chief Financial Officer, Vice President ofFinance and Secretary, effective August 1, 2015.
(2) Upon Mr. Santa Ines’ retirement on July 31, 2015, he ceased receiving his fiscal 2016 annual base salary andwas eligible to be paid for part-time, non-executive employee services thereafter until May 15, 2016.
Annual Cash Incentive Bonus
Our annual cash incentive bonus program is designed to reward the achievement of key short-term corporateobjectives that ultimately drive long-term corporate achievement. The bonus plan is an ‘‘at-risk’’ compensationarrangement designed to provide market competitive cash incentive opportunities that reward our executive officersfor the achievement of the key financial performance goals established. This means that the bonus compensation isnot guaranteed. Most importantly, the program is structured to achieve our overall objective of tying this element ofcompensation to the attainment of Company performance goals that will create shareholder value.
The cash incentive bonuses are paid quarterly upon meeting pre-determined quarterly financial goals, which isdesigned to align compensation with our quarterly corporate financial performance, reward achievement of consistentshort-term profit growth and profitability and provide executives with a meaningful total cash compensationopportunity (base salary and quarterly bonus). At the beginning of fiscal 2016, the Compensation Committeeapproved the quarterly and annual financial targets that would support Abaxis’ annual operating plan. The bonusprogram, along with the specific financial performance goals, is a key element of the Compensation Committee’spay-for-performance philosophy, and consistent with this philosophy for fiscal 2016, the Chief Executive Officer andother Named Executive Officers earned the bonuses at 97% of their targets, which was commensurate with the levelof achievement of the corporate performance goals.
Target Bonus Opportunities for Fiscal 2016
For fiscal 2016, our Compensation Committee generally targeted total cash compensation to be at or slightly abovethe 75th percentile of the Compensation Peer Group. Our Compensation Committee considered this target as ageneral guideline for the appropriate level of potential cash bonus compensation. The Compensation Committeebelieved that this was appropriate because base salary is generally set at or below the median of the CompensationPeer Group, as well as to ensure we retain and motivate our executives, and align pay with performance. The actualtotal cash compensation earned could be above or below the 75th percentile of the Compensation Peer Group basedon strength of Abaxis’ performance. The target bonus level set by the Compensation Committee is designed to placea high degree of cash compensation at-risk and the Compensation Committee believes it is appropriate to provide forpayout opportunities above the median of the Compensation Peer Group, considering that the base salaries of theNamed Executive Officers are generally at or below the median of the Compensation Peer Group. The target bonuslevels for the Named Executive Officers are designed to incentivize them with respect to future companyperformance, to place a higher portion of our Named Executive Officers’ compensation at-risk and to maintain totalcompensation at an appropriately competitive level in the industry.
Based on the individual performances of the Named Executive Officers over the prior year, the scope ofresponsibilities, and on the peer company analysis of total compensation prepared by Pay Governance in March 2013,the Compensation Committee recommended to the Board of Directors to increase target bonus opportunities for fiscal2016 for Mr. Severson and Dr. Tockman. Mr. Severson’s increase in target bonus reflected the time he has served inhis position, success of Abaxis in the past year and over an extended period and the importance of Mr. Severson to
17
Abaxis, Inc. Form 10-K/A
the continued success of Abaxis. Mr. Taylor’s target bonus was determined appropriate to reflect his increased dutiesand responsibilities in the new position of Chief Financial Officer, Vice President of Finance and Secretary, and wasset with the aim to maintain internal equity of our executive officer’s total compensation. The increase in Dr.Tockman’s target bonus was determined appropriate to reflect the additional responsibilities he assumed with respectto sales and marketing in North America, Latin America and the U.S. Government and was set with the aim tomaintain internal equity of our executive officer’s total compensation. The Compensation Committee considered thetotal direct compensation for Mr. Santa Ines, Dr. Aron and Mr. Wood and determined that the target bonus from fiscal2015 would be maintained and remained appropriate for Mr. Santa Ines, Dr. Aron and Mr. Wood in fiscal 2016.
In April 2015, our Compensation Committee and Board of Directors (with Mr. Severson abstaining) approved thefiscal 2016 target bonus levels for our executive officers. The following table summarizes the fiscal 2016 target bonusamounts for our Named Executive Officers:
Named Executive OfficerFiscal 2015
Target BonusFiscal 2016
Target Bonus
Fiscal 2016Target BonusIncrease From
Fiscal 2015
Clinton H. Severson . . . . . . . . . . . . . . . . . . . . . . . . . . . . . . . . . . . . . . . . . $700,000 $800,000 14.3%Ross Taylor (1) . . . . . . . . . . . . . . . . . . . . . . . . . . . . . . . . . . . . . . . . . . . . . — $425,000 —Alberto R. Santa Ines (2) . . . . . . . . . . . . . . . . . . . . . . . . . . . . . . . . . . . . . $425,000 $425,000 —Kenneth P. Aron, Ph.D. . . . . . . . . . . . . . . . . . . . . . . . . . . . . . . . . . . . . . . $425,000 $425,000 —Craig M. Tockman, DVM . . . . . . . . . . . . . . . . . . . . . . . . . . . . . . . . . . . . $300,000 $425,000 41.7%Donald P. Wood . . . . . . . . . . . . . . . . . . . . . . . . . . . . . . . . . . . . . . . . . . . . $525,000 $525,000 —
(1) Mr. Taylor first became an executive office upon his appointment to Chief Financial Officer, Vice President ofFinance and Secretary, effective August 1, 2015.
(2) Upon Mr. Santa Ines’ retirement, effective as of July 31, 2015, he ceased to be eligible for any bonus relatedto Abaxis’ performance for the fiscal quarters starting after June 30, 2015.
Corporate Performance Measures
For fiscal 2016, our Compensation Committee selected quarterly revenues and quarterly income before income taxprovision at the beginning of the fiscal year as the corporate financial performance measures for our executive officerbonus program, which we believe are the most important measures of both annual financial performance andlong-term shareholder value.
Fiscal 2016 Cash Incentive Bonus Elements
FY 2016 Target
Bonus Award
Opportunity
X Revenue Result
50%
FY 2016 Bonus
Payout
Income Before
Income Tax Result
50%
+ =
Each of the fiscal 2016 corporate financial performance measures and target goals are disclosed above under‘‘Pay-for-Performance Philosophy.’’ The Compensation Committee selected quarterly revenues and quarterly incomebefore income tax provision as the performance metrics under the bonus plan with equal weightings, as it believesthat because we are a growth company, revenues is an important indicator of Abaxis’ potential for increasinglong-term shareholder value and income before income tax provision is an important indicator of Abaxis’ currentprofitability, a priority to our shareholders.
Using these two equally-weighted performance measures, the Compensation Committee established bonus targetsthat are set to be achievable, yet are at a level of difficulty that does not assure that the goals will be met. The bonustargets require executive officers to increase annual corporate financial performance during the applicable fiscal year,compared to our previous year’s actual financial results. Accordingly, meeting the bonus targets, requires executiveofficers to improve financial performance on a year-over-year basis and, thus, a substantial portion of our executiveofficers’ compensation is at risk if corporate financial results are not achieved during a particular fiscal year. In
18
Abaxis, Inc. Form 10-K/A
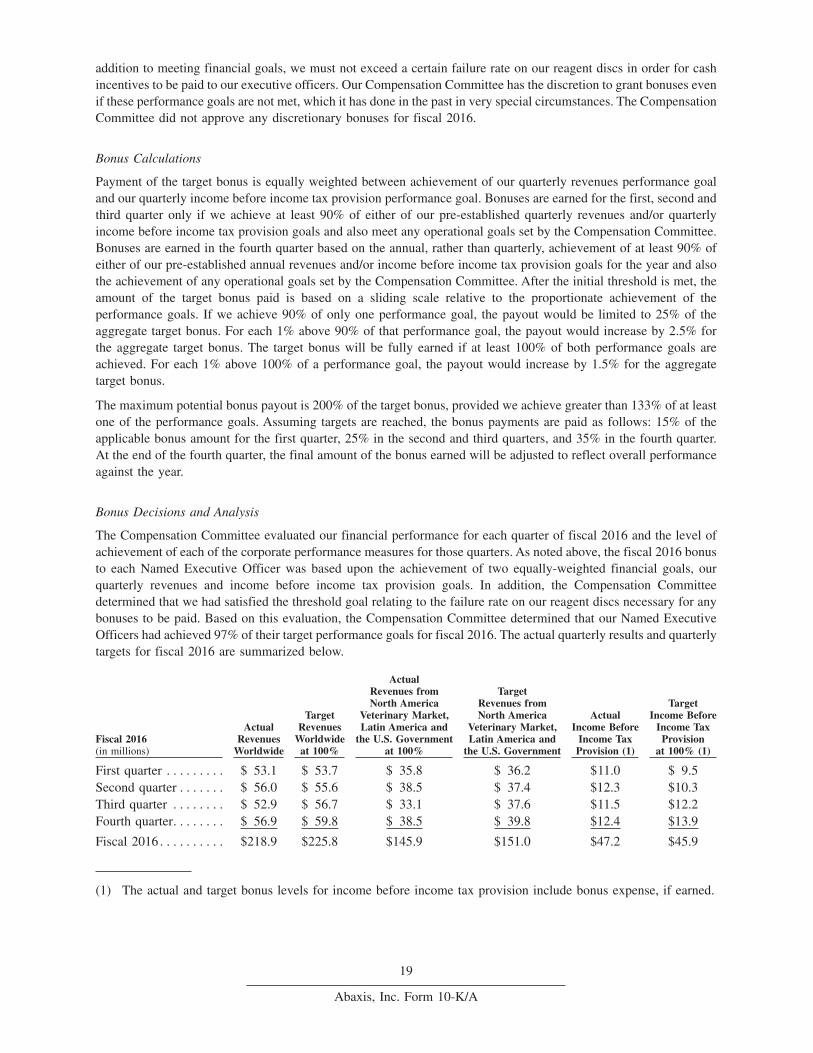
addition to meeting financial goals, we must not exceed a certain failure rate on our reagent discs in order for cashincentives to be paid to our executive officers. Our Compensation Committee has the discretion to grant bonuses evenif these performance goals are not met, which it has done in the past in very special circumstances. The CompensationCommittee did not approve any discretionary bonuses for fiscal 2016.
Bonus Calculations
Payment of the target bonus is equally weighted between achievement of our quarterly revenues performance goaland our quarterly income before income tax provision performance goal. Bonuses are earned for the first, second andthird quarter only if we achieve at least 90% of either of our pre-established quarterly revenues and/or quarterlyincome before income tax provision goals and also meet any operational goals set by the Compensation Committee.Bonuses are earned in the fourth quarter based on the annual, rather than quarterly, achievement of at least 90% ofeither of our pre-established annual revenues and/or income before income tax provision goals for the year and alsothe achievement of any operational goals set by the Compensation Committee. After the initial threshold is met, theamount of the target bonus paid is based on a sliding scale relative to the proportionate achievement of theperformance goals. If we achieve 90% of only one performance goal, the payout would be limited to 25% of theaggregate target bonus. For each 1% above 90% of that performance goal, the payout would increase by 2.5% forthe aggregate target bonus. The target bonus will be fully earned if at least 100% of both performance goals areachieved. For each 1% above 100% of a performance goal, the payout would increase by 1.5% for the aggregatetarget bonus.
The maximum potential bonus payout is 200% of the target bonus, provided we achieve greater than 133% of at leastone of the performance goals. Assuming targets are reached, the bonus payments are paid as follows: 15% of theapplicable bonus amount for the first quarter, 25% in the second and third quarters, and 35% in the fourth quarter.At the end of the fourth quarter, the final amount of the bonus earned will be adjusted to reflect overall performanceagainst the year.
Bonus Decisions and Analysis
The Compensation Committee evaluated our financial performance for each quarter of fiscal 2016 and the level ofachievement of each of the corporate performance measures for those quarters. As noted above, the fiscal 2016 bonusto each Named Executive Officer was based upon the achievement of two equally-weighted financial goals, ourquarterly revenues and income before income tax provision goals. In addition, the Compensation Committeedetermined that we had satisfied the threshold goal relating to the failure rate on our reagent discs necessary for anybonuses to be paid. Based on this evaluation, the Compensation Committee determined that our Named ExecutiveOfficers had achieved 97% of their target performance goals for fiscal 2016. The actual quarterly results and quarterlytargets for fiscal 2016 are summarized below.
Fiscal 2016(in millions)
ActualRevenues
Worldwide
TargetRevenues
Worldwideat 100%
ActualRevenues fromNorth America
Veterinary Market,Latin America and
the U.S. Governmentat 100%
TargetRevenues fromNorth America
Veterinary Market,Latin America and
the U.S. Government
ActualIncome Before
Income TaxProvision (1)
TargetIncome Before
Income TaxProvision
at 100% (1)
First quarter . . . . . . . . . $ 53.1 $ 53.7 $ 35.8 $ 36.2 $11.0 $ 9.5Second quarter . . . . . . . $ 56.0 $ 55.6 $ 38.5 $ 37.4 $12.3 $10.3Third quarter . . . . . . . . $ 52.9 $ 56.7 $ 33.1 $ 37.6 $11.5 $12.2Fourth quarter. . . . . . . . $ 56.9 $ 59.8 $ 38.5 $ 39.8 $12.4 $13.9
Fiscal 2016 . . . . . . . . . . $218.9 $225.8 $145.9 $151.0 $47.2 $45.9
(1) The actual and target bonus levels for income before income tax provision include bonus expense, if earned.
19
Abaxis, Inc. Form 10-K/A
At least 90% achievement of the target level of the pre-established corporate goal is necessary for any bonus payout.The Board of Directors (with Mr. Severson abstaining) approves the achievement of the target bonus levels for eachquarter. On April 27, 2016, the Compensation Committee approved the fiscal 2016 bonuses awarded to each of ourNamed Executive Officers, based on such achievement, which were as follows:
Named Executive OfficerFiscal 2016
Bonus AwardedPercentage ofTarget Bonus
Clinton H. Severson. . . . . . . . . . . . . . . . . . . . . . . . . . . . . . . . . . . . . . . . . . . . . . . . . . . $776,000 97%Ross Taylor . . . . . . . . . . . . . . . . . . . . . . . . . . . . . . . . . . . . . . . . . . . . . . . . . . . . . . . . . $412,250 97%Alberto R. Santa Ines (1) . . . . . . . . . . . . . . . . . . . . . . . . . . . . . . . . . . . . . . . . . . . . . . $ 76,500 18%Kenneth P. Aron, Ph.D. . . . . . . . . . . . . . . . . . . . . . . . . . . . . . . . . . . . . . . . . . . . . . . . . $412,250 97%Craig M. Tockman, DVM . . . . . . . . . . . . . . . . . . . . . . . . . . . . . . . . . . . . . . . . . . . . . . $412,250 97%Donald P. Wood . . . . . . . . . . . . . . . . . . . . . . . . . . . . . . . . . . . . . . . . . . . . . . . . . . . . . . $509,250 97%
(1) Due to Mr. Santa Ines’ retirement, effective as of July 31, 2015, he was paid a bonus of $76,500, whichrepresented our financial performance for the first fiscal quarter of fiscal 2016. Because Mr. Santa Ines ceasedto be an executive officer after such fiscal quarter, he did not earn any further performance bonuses for fiscal2016. Mr. Santa Ines’ bonus for fiscal 2016 represented 120% of his target bonus for such fiscal quarter.
Target Bonus Opportunities for Fiscal 2017
For fiscal 2017, our Compensation Committee generally aimed for total cash compensation to be at or slightly abovethe 75th percentile of the Updated Compensation Peer Group. Our Compensation Committee considered this targetas a general guideline for the appropriate level of potential cash bonus compensation. The Compensation Committeebelieved that this was appropriate because base salary is generally set below the median of the UpdatedCompensation Peer Group, with certain exceptions deemed appropriate by the Compensation Committee. Also, theCompensation Committee believed that this was appropriate to ensure we retain and motivate our executives, andalign pay with performance. The actual total cash compensation earned could be above or below the 75th percentileof the Updated Compensation Peer Group based on strength of Abaxis’ performance. The target bonus level set bythe Compensation Committee is designed to place a high degree of cash compensation at-risk and the CompensationCommittee believes it is appropriate to provide for payout opportunities above the median of the UpdatedCompensation Peer Group, considering that the base salaries of the Named Executive Officers are generally belowthe median of the Updated Compensation Peer Group. The target bonus level for the Named Executive Officers isdesigned to incentivize them with respect to future Company performance, to place a higher portion of our NamedExecutive Officers’ compensation at risk when compared to executives in the Updated Compensation Peer Group andto maintain total compensation at an appropriately competitive level in the industry based on market data obtainedin connection with the Updated Compensation Peer Group compiled in April 2016.
Based on the individual performances of the Named Executive Officers over the prior year, the scope ofresponsibilities, and on the peer company analysis of total compensation prepared by Pay Governance in April 2016,the Compensation Committee recommended to the Board of Directors to increase target bonus opportunities for fiscal2017 for our continuing Named Executive Officers. In April 2016, our Compensation Committee and Board ofDirectors (with Mr. Severson abstaining) approved the fiscal 2017 target bonus levels for our executive officers. Thefollowing table summarizes the fiscal 2017 target bonus amounts for our Named Executive Officers.
Named Executive OfficerFiscal 2017
Target Bonus
Clinton H. Severson . . . . . . . . . . . . . . . . . . . . . . . . . . . . . . . . . . . . . . . . . . . . . . . . . . . . . . . . . . . . $850,000Ross Taylor . . . . . . . . . . . . . . . . . . . . . . . . . . . . . . . . . . . . . . . . . . . . . . . . . . . . . . . . . . . . . . . . . . . $500,000Alberto R. Santa Ines (1) . . . . . . . . . . . . . . . . . . . . . . . . . . . . . . . . . . . . . . . . . . . . . . . . . . . . . . . . —Kenneth P. Aron, Ph.D.. . . . . . . . . . . . . . . . . . . . . . . . . . . . . . . . . . . . . . . . . . . . . . . . . . . . . . . . . . $500,000Craig M. Tockman, DVM. . . . . . . . . . . . . . . . . . . . . . . . . . . . . . . . . . . . . . . . . . . . . . . . . . . . . . . . $500,000Donald P. Wood . . . . . . . . . . . . . . . . . . . . . . . . . . . . . . . . . . . . . . . . . . . . . . . . . . . . . . . . . . . . . . . $600,000
(1) Due to Mr. Santa Ines’ retirement, effective as of July 31, 2015, he was not eligible to receive a target bonusamount for fiscal 2017.
20
Abaxis, Inc. Form 10-K/A
Payment of the target bonus, as identified above, for fiscal 2017, will continue to be equally weighted at 50% forachievement of our quarterly worldwide revenue performance goal (or, in the case of Dr. Tockman, our quarterlyrevenue for North America veterinary market and from Latin America and the U.S. Government performance goal)and 50% for achievement of our quarterly income before income tax provision performance goal. For fiscal 2017,bonuses will be paid in the same payout structure as the fiscal 2016 bonus discussed in ‘‘Bonus Calculations,’’ withthe exception of specified financial targets as determined by the Compensation Committee.
Long-Term Equity Incentive Compensation
Long-term incentive equity awards are designed as a key element of compensation for our executive officers so thata substantial portion of their total direct compensation is tied to increasing the market value of Abaxis. We makeannual grants of long-term incentive equity awards in the first quarter of each fiscal year (or during the fiscal yearif necessary for a newly hired or promoted employee) to align our executives’ interests with those of our shareholders,to promote executives’ focus on the long-term financial performance of Abaxis, and, through time-based andperformance-based vesting requirements, to enhance long-term performance and retention. The CompensationCommittee approves all equity award grants to our Named Executive Officers and other executive officers.
In determining the size of equity-based awards, the Compensation Committee considers competitive grant values forcomparable positions among the Compensation Peer Group (or Updated Compensation Peer Group with respect tofiscal 2017) as well as various subjective factors primarily relating to the responsibilities of the individual executive,past performance, and the executive’s expected future contributions and value to Abaxis. The CompensationCommittee also considers, in its decision-making process, the executives’ historical total compensation, includingprior equity grants, their tenure, responsibilities, experience and value to Abaxis. No one factor is given any specificweighting and the Compensation Committee exercises its judgment to determine the appropriate size and mix ofawards.
Under our 2005 Equity Incentive Plan and 2014 Equity Incentive Plan, we are permitted to award a variety ofshare-based awards, including stock options, stock appreciation rights, restricted stock awards, restricted stock units,performance cash awards, performance shares, performance units, deferred compensation awards or othershare-based awards. Prior to fiscal 2007, equity-based grants to our executive officers comprised solely of stockoptions. Beginning in fiscal 2007, we began granting RSUs to our executive officers. Starting in fiscal 2013, weimplemented a performance-based vesting equity program. Under this program, our Compensation Committeegranted our Named Executive Officers PSUs that vest only if certain financial and/or operating goals are achieved.Additionally, in fiscal 2014, we redesigned the PSUs to better align the objectives of Abaxis and interests of ourshareholders. Equity grants to our Named Executive Officers in fiscal 2016 and fiscal 2017 were in the form of RSUsand PSUs, as discussed further below.
Restricted Stock Units
We began granting RSUs in fiscal 2007. Since fiscal 2013, we have maintained a performance-based vesting equityprogram and began granting PSUs, such that a portion of the equity awards that our Compensation Committeegranted to our executive officers vest only if certain financial and/or operating goals were achieved. OurCompensation Committee has determined that a mix of time-based and performance-based vesting for the RSUawards provide an effective tool for incentivizing and retaining those executive officers who are most responsible fordirect impact on corporate performance by balancing variable compensation dependent on performance goalachievement in addition to share value (PSUs) and variable compensation with a more predictable value (RSUssubject to time-based vesting).
Since April 2013, the Compensation Committee has designed the PSUs so that vesting terms are based on (1)achieving specified financial targets over a single-fiscal year performance period and (2) remaining in the service ofAbaxis over a four-year vesting period. The awards are comprised of two specified corporate performance targets forfiscal 2016, which are both equally weighted at 50%. The Compensation Committee believes that the financial impactfrom the accounting for the share-based compensation expense of these equity incentive awards, along with theretention of the Named Executive Officers, were aligned with shareholder value.
Fiscal 2016 Equity Incentive Grants
In April 2015, after considering an analysis of total compensation for our Named Executive Officers, theCompensation Committee determined that for fiscal 2016, a mix of RSU and PSU awards would continue to provide
21
Abaxis, Inc. Form 10-K/A
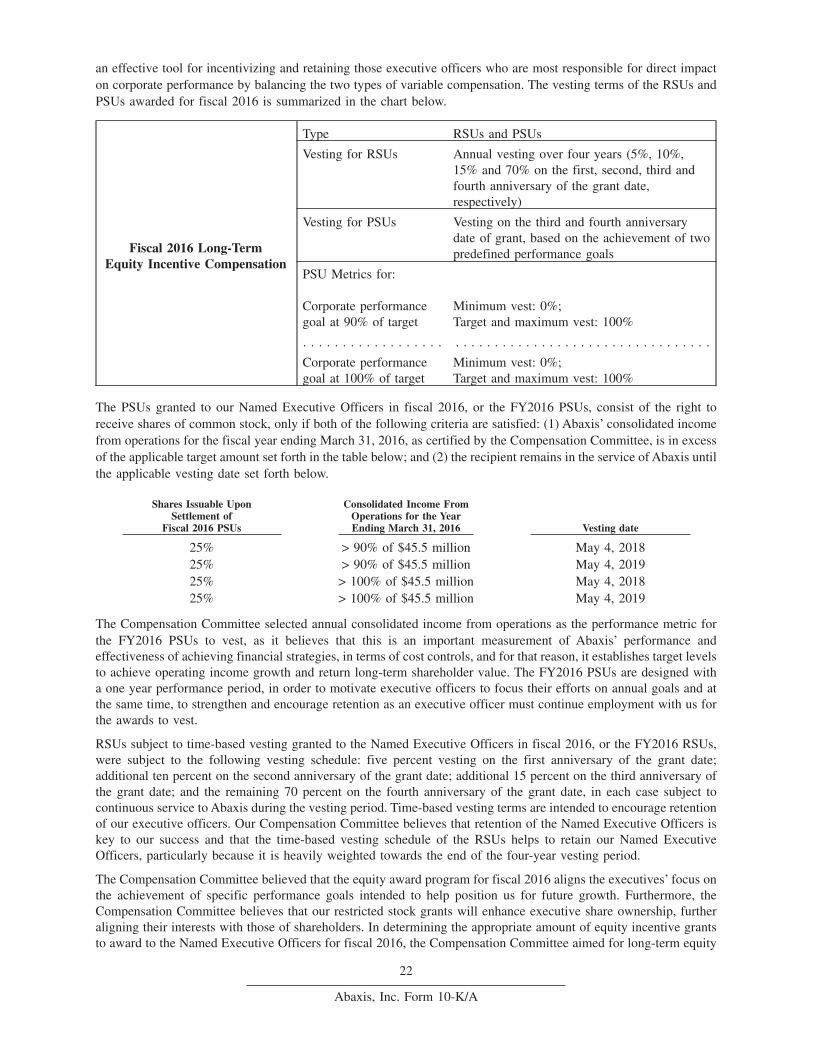
an effective tool for incentivizing and retaining those executive officers who are most responsible for direct impacton corporate performance by balancing the two types of variable compensation. The vesting terms of the RSUs andPSUs awarded for fiscal 2016 is summarized in the chart below.
Fiscal 2016 Long-TermEquity Incentive Compensation
Type RSUs and PSUs
Vesting for RSUs Annual vesting over four years (5%, 10%,15% and 70% on the first, second, third andfourth anniversary of the grant date,respectively)
Vesting for PSUs Vesting on the third and fourth anniversarydate of grant, based on the achievement of twopredefined performance goals
PSU Metrics for:
Corporate performancegoal at 90% of target
Minimum vest: 0%;Target and maximum vest: 100%
. . . . . . . . . . . . . . . . . . . . . . . . . . . . . . . . . . . . . . . . . . . . . . . . . . .
Corporate performancegoal at 100% of target
Minimum vest: 0%;Target and maximum vest: 100%
The PSUs granted to our Named Executive Officers in fiscal 2016, or the FY2016 PSUs, consist of the right toreceive shares of common stock, only if both of the following criteria are satisfied: (1) Abaxis’ consolidated incomefrom operations for the fiscal year ending March 31, 2016, as certified by the Compensation Committee, is in excessof the applicable target amount set forth in the table below; and (2) the recipient remains in the service of Abaxis untilthe applicable vesting date set forth below.
Shares Issuable UponSettlement of
Fiscal 2016 PSUs
Consolidated Income FromOperations for the YearEnding March 31, 2016 Vesting date
25% > 90% of $45.5 million May 4, 201825% > 90% of $45.5 million May 4, 201925% > 100% of $45.5 million May 4, 201825% > 100% of $45.5 million May 4, 2019
The Compensation Committee selected annual consolidated income from operations as the performance metric forthe FY2016 PSUs to vest, as it believes that this is an important measurement of Abaxis’ performance andeffectiveness of achieving financial strategies, in terms of cost controls, and for that reason, it establishes target levelsto achieve operating income growth and return long-term shareholder value. The FY2016 PSUs are designed witha one year performance period, in order to motivate executive officers to focus their efforts on annual goals and atthe same time, to strengthen and encourage retention as an executive officer must continue employment with us forthe awards to vest.
RSUs subject to time-based vesting granted to the Named Executive Officers in fiscal 2016, or the FY2016 RSUs,were subject to the following vesting schedule: five percent vesting on the first anniversary of the grant date;additional ten percent on the second anniversary of the grant date; additional 15 percent on the third anniversary ofthe grant date; and the remaining 70 percent on the fourth anniversary of the grant date, in each case subject tocontinuous service to Abaxis during the vesting period. Time-based vesting terms are intended to encourage retentionof our executive officers. Our Compensation Committee believes that retention of the Named Executive Officers iskey to our success and that the time-based vesting schedule of the RSUs helps to retain our Named ExecutiveOfficers, particularly because it is heavily weighted towards the end of the four-year vesting period.
The Compensation Committee believed that the equity award program for fiscal 2016 aligns the executives’ focus onthe achievement of specific performance goals intended to help position us for future growth. Furthermore, theCompensation Committee believes that our restricted stock grants will enhance executive share ownership, furtheraligning their interests with those of shareholders. In determining the appropriate amount of equity incentive grantsto award to the Named Executive Officers for fiscal 2016, the Compensation Committee aimed for long-term equity
22
Abaxis, Inc. Form 10-K/A
incentive compensation awards, when taken together with the base salary and annual incentive compensationopportunities provided to the Named Executive Officers, to result in actual total direct compensation to the NamedExecutive Officers to be at or slightly above the 75th percentile of the Compensation Peer Group, assumingperformance at the target level under the annual incentive compensation plan and also determines such amounts basedon individual, company, and stock performance, as compared to similarly-situated executive officers in ourCompensation Peer Group and in our industry generally. The Compensation Committee has determined thatproviding compensation at these levels would provide incentives to attract and retain highly qualified executives. TheCompensation Committee also determined that it was appropriate for all Named Executive Officers (other than ourChief Executive Officer) to generally receive a similarly-size equity grant for fiscal 2016, because this maintainsinternal pay equity. Mr. Taylor’s equity grant reflects his duties and responsibilities in his new position as our ChiefFinancial Officer, Vice President of Finance and Secretary, relative to our Compensation Peer Group. Dr. Tockman’sequity grant reflects the additional responsibilities he assumed with respect to sales and marketing in North America,Latin America and the U.S. Government during fiscal 2015 and was set to maintain internal equity of our otherexecutive officer’s total compensation.
In April 2015, our Compensation Committee and Board of Directors (with Mr. Severson abstaining) approved thefiscal 2016 long-term equity incentive compensation awards for our Named Executive Officers. The following tablesummarizes the fiscal 2016 RSUs and PSUs awarded to our Named Executive Officers.
Named Executive OfficerRSUs Granted in
Fiscal 2016 (#)PSUs Granted in
Fiscal 2016 (#)
Clinton H. Severson. . . . . . . . . . . . . . . . . . . . . . . . . . . . . . . . . . . . . . . . . . . . . . . . . . . 19,000 36,000Ross Taylor . . . . . . . . . . . . . . . . . . . . . . . . . . . . . . . . . . . . . . . . . . . . . . . . . . . . . . . . . 9,000 16,000Alberto R. Santa Ines (1) . . . . . . . . . . . . . . . . . . . . . . . . . . . . . . . . . . . . . . . . . . . . . . 9,000 24,000Kenneth P. Aron, Ph.D. . . . . . . . . . . . . . . . . . . . . . . . . . . . . . . . . . . . . . . . . . . . . . . . . 9,000 24,000Craig M. Tockman, DVM . . . . . . . . . . . . . . . . . . . . . . . . . . . . . . . . . . . . . . . . . . . . . . 9,000 24,000Donald P. Wood . . . . . . . . . . . . . . . . . . . . . . . . . . . . . . . . . . . . . . . . . . . . . . . . . . . . . . 9,000 24,000
(1) Upon Mr. Santa Ines’ retirement from his role as Chief Financial Officer, Vice President of Finance andSecretary effective July 31, 2015, his FY2016 PSUs were cancelled. Mr. Santa Ines’ FY 2016 RSUs continuedto vest during his part-time services as a nonexecutive employee through May 15, 2016.
The Compensation Committee chose to structure the fiscal 2016 equity awards granted to the Named ExecutiveOfficers to be more heavily weighted towards those with performance-based vesting (the PSUs), to further its policyof providing performance-based pay that is directly aligned with Company performance. Accordingly, our NamedExecutive Officers received, approximately 64-73% of their fiscal 2016 equity awards in the form of PSUs.
On April 27, 2016, the Compensation Committee determined that Abaxis’ consolidated income from operations forfiscal 2016 was above 100% of target and accordingly, because the performance criteria was achieved during fiscal2016, the FY2016 PSUs for all of our Named Executive Officers (other than Mr. Santa Ines) became eligible to vestin full, if each executive officer completes the remaining timed-based service criteria necessary for the award to vest.
Fiscal 2017 Equity Incentive Grants
In April 2016, after considering an analysis of total compensation for our Named Executive Officers, theCompensation Committee again determined that a mix of RSU and PSU awards would be appropriate, for the reasonsdescribed above. RSUs granted in fiscal 2017 to the Named Executive Officers continued to have the four-yeartime-based vesting terms as described above for RSUs granted in fiscal 2016.
The PSUs granted to our continuing Named Executive Officers in fiscal 2017, or the FY2017 PSUs, consist of theright to receive shares of common stock, only if both of the following criteria are satisfied: (1) Abaxis’ consolidatedincome from operations for the fiscal year ending March 31, 2017, as certified by the Compensation Committee, isin excess of the applicable target amount set forth in the table below; and (2) the recipient remains in the service ofAbaxis until the applicable vesting date set forth below.
23
Abaxis, Inc. Form 10-K/A
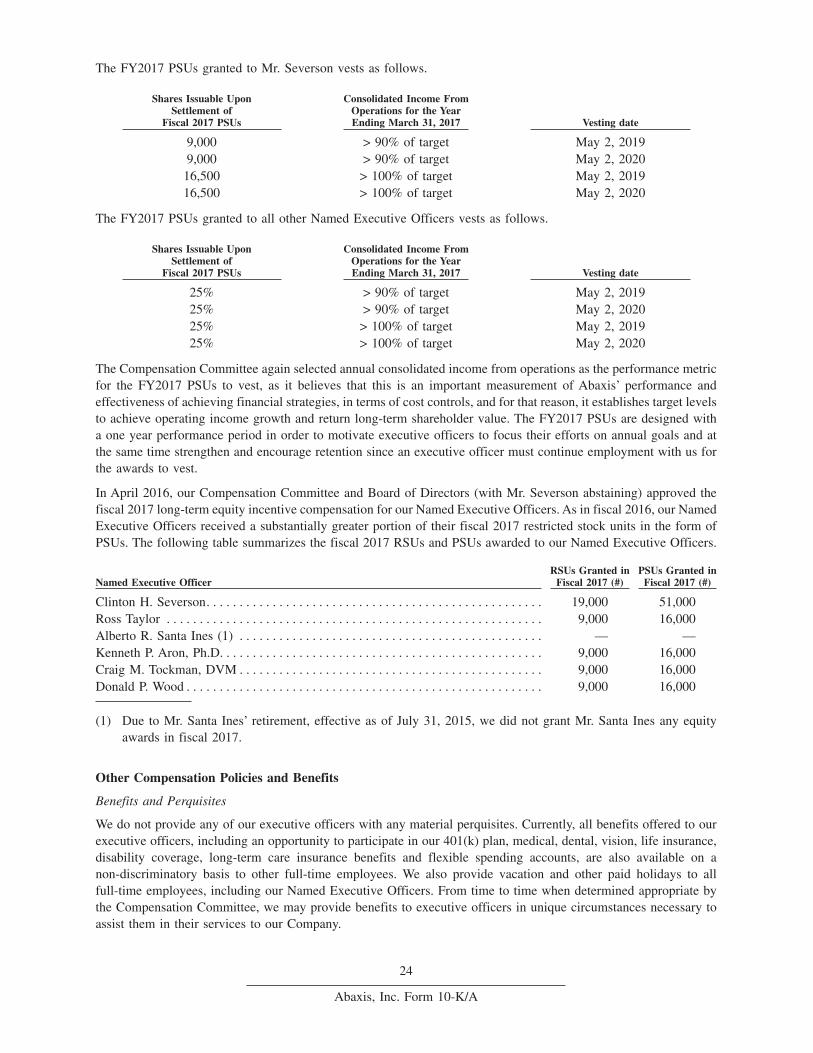
The FY2017 PSUs granted to Mr. Severson vests as follows.
Shares Issuable UponSettlement of
Fiscal 2017 PSUs
Consolidated Income FromOperations for the YearEnding March 31, 2017 Vesting date
9,000 > 90% of target May 2, 20199,000 > 90% of target May 2, 2020
16,500 > 100% of target May 2, 201916,500 > 100% of target May 2, 2020
The FY2017 PSUs granted to all other Named Executive Officers vests as follows.
Shares Issuable UponSettlement of
Fiscal 2017 PSUs
Consolidated Income FromOperations for the YearEnding March 31, 2017 Vesting date
25% > 90% of target May 2, 201925% > 90% of target May 2, 202025% > 100% of target May 2, 201925% > 100% of target May 2, 2020
The Compensation Committee again selected annual consolidated income from operations as the performance metricfor the FY2017 PSUs to vest, as it believes that this is an important measurement of Abaxis’ performance andeffectiveness of achieving financial strategies, in terms of cost controls, and for that reason, it establishes target levelsto achieve operating income growth and return long-term shareholder value. The FY2017 PSUs are designed witha one year performance period in order to motivate executive officers to focus their efforts on annual goals and atthe same time strengthen and encourage retention since an executive officer must continue employment with us forthe awards to vest.
In April 2016, our Compensation Committee and Board of Directors (with Mr. Severson abstaining) approved thefiscal 2017 long-term equity incentive compensation for our Named Executive Officers. As in fiscal 2016, our NamedExecutive Officers received a substantially greater portion of their fiscal 2017 restricted stock units in the form ofPSUs. The following table summarizes the fiscal 2017 RSUs and PSUs awarded to our Named Executive Officers.
Named Executive OfficerRSUs Granted in
Fiscal 2017 (#)PSUs Granted in
Fiscal 2017 (#)
Clinton H. Severson. . . . . . . . . . . . . . . . . . . . . . . . . . . . . . . . . . . . . . . . . . . . . . . . . . . 19,000 51,000Ross Taylor . . . . . . . . . . . . . . . . . . . . . . . . . . . . . . . . . . . . . . . . . . . . . . . . . . . . . . . . . 9,000 16,000Alberto R. Santa Ines (1) . . . . . . . . . . . . . . . . . . . . . . . . . . . . . . . . . . . . . . . . . . . . . . — —Kenneth P. Aron, Ph.D. . . . . . . . . . . . . . . . . . . . . . . . . . . . . . . . . . . . . . . . . . . . . . . . . 9,000 16,000Craig M. Tockman, DVM . . . . . . . . . . . . . . . . . . . . . . . . . . . . . . . . . . . . . . . . . . . . . . 9,000 16,000Donald P. Wood . . . . . . . . . . . . . . . . . . . . . . . . . . . . . . . . . . . . . . . . . . . . . . . . . . . . . . 9,000 16,000
(1) Due to Mr. Santa Ines’ retirement, effective as of July 31, 2015, we did not grant Mr. Santa Ines any equityawards in fiscal 2017.
Other Compensation Policies and Benefits
Benefits and Perquisites
We do not provide any of our executive officers with any material perquisites. Currently, all benefits offered to ourexecutive officers, including an opportunity to participate in our 401(k) plan, medical, dental, vision, life insurance,disability coverage, long-term care insurance benefits and flexible spending accounts, are also available on anon-discriminatory basis to other full-time employees. We also provide vacation and other paid holidays to allfull-time employees, including our Named Executive Officers. From time to time when determined appropriate bythe Compensation Committee, we may provide benefits to executive officers in unique circumstances necessary toassist them in their services to our Company.
24
Abaxis, Inc. Form 10-K/A
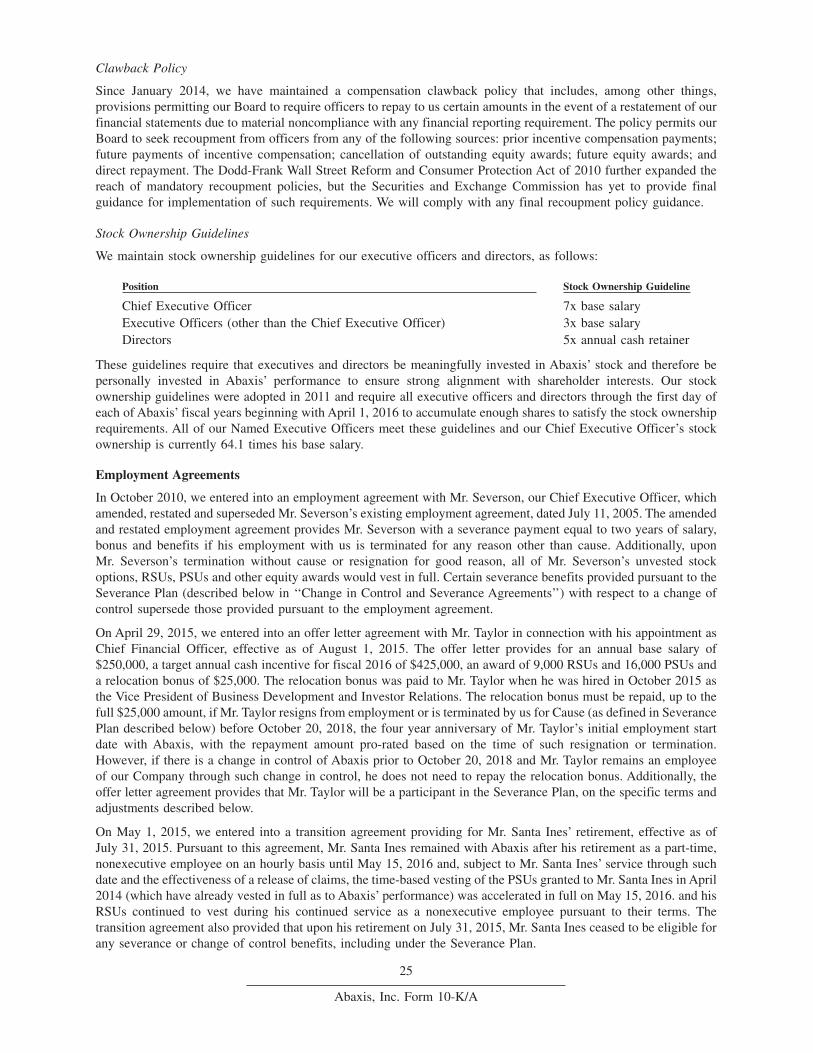
Clawback Policy
Since January 2014, we have maintained a compensation clawback policy that includes, among other things,provisions permitting our Board to require officers to repay to us certain amounts in the event of a restatement of ourfinancial statements due to material noncompliance with any financial reporting requirement. The policy permits ourBoard to seek recoupment from officers from any of the following sources: prior incentive compensation payments;future payments of incentive compensation; cancellation of outstanding equity awards; future equity awards; anddirect repayment. The Dodd-Frank Wall Street Reform and Consumer Protection Act of 2010 further expanded thereach of mandatory recoupment policies, but the Securities and Exchange Commission has yet to provide finalguidance for implementation of such requirements. We will comply with any final recoupment policy guidance.
Stock Ownership Guidelines
We maintain stock ownership guidelines for our executive officers and directors, as follows:
Position Stock Ownership Guideline
Chief Executive Officer 7x base salaryExecutive Officers (other than the Chief Executive Officer) 3x base salaryDirectors 5x annual cash retainer
These guidelines require that executives and directors be meaningfully invested in Abaxis’ stock and therefore bepersonally invested in Abaxis’ performance to ensure strong alignment with shareholder interests. Our stockownership guidelines were adopted in 2011 and require all executive officers and directors through the first day ofeach of Abaxis’ fiscal years beginning with April 1, 2016 to accumulate enough shares to satisfy the stock ownershiprequirements. All of our Named Executive Officers meet these guidelines and our Chief Executive Officer’s stockownership is currently 64.1 times his base salary.
Employment Agreements
In October 2010, we entered into an employment agreement with Mr. Severson, our Chief Executive Officer, whichamended, restated and superseded Mr. Severson’s existing employment agreement, dated July 11, 2005. The amendedand restated employment agreement provides Mr. Severson with a severance payment equal to two years of salary,bonus and benefits if his employment with us is terminated for any reason other than cause. Additionally, uponMr. Severson’s termination without cause or resignation for good reason, all of Mr. Severson’s unvested stockoptions, RSUs, PSUs and other equity awards would vest in full. Certain severance benefits provided pursuant to theSeverance Plan (described below in ‘‘Change in Control and Severance Agreements’’) with respect to a change ofcontrol supersede those provided pursuant to the employment agreement.
On April 29, 2015, we entered into an offer letter agreement with Mr. Taylor in connection with his appointment asChief Financial Officer, effective as of August 1, 2015. The offer letter provides for an annual base salary of$250,000, a target annual cash incentive for fiscal 2016 of $425,000, an award of 9,000 RSUs and 16,000 PSUs anda relocation bonus of $25,000. The relocation bonus was paid to Mr. Taylor when he was hired in October 2015 asthe Vice President of Business Development and Investor Relations. The relocation bonus must be repaid, up to thefull $25,000 amount, if Mr. Taylor resigns from employment or is terminated by us for Cause (as defined in SeverancePlan described below) before October 20, 2018, the four year anniversary of Mr. Taylor’s initial employment startdate with Abaxis, with the repayment amount pro-rated based on the time of such resignation or termination.However, if there is a change in control of Abaxis prior to October 20, 2018 and Mr. Taylor remains an employeeof our Company through such change in control, he does not need to repay the relocation bonus. Additionally, theoffer letter agreement provides that Mr. Taylor will be a participant in the Severance Plan, on the specific terms andadjustments described below.
On May 1, 2015, we entered into a transition agreement providing for Mr. Santa Ines’ retirement, effective as ofJuly 31, 2015. Pursuant to this agreement, Mr. Santa Ines remained with Abaxis after his retirement as a part-time,nonexecutive employee on an hourly basis until May 15, 2016 and, subject to Mr. Santa Ines’ service through suchdate and the effectiveness of a release of claims, the time-based vesting of the PSUs granted to Mr. Santa Ines in April2014 (which have already vested in full as to Abaxis’ performance) was accelerated in full on May 15, 2016. and hisRSUs continued to vest during his continued service as a nonexecutive employee pursuant to their terms. Thetransition agreement also provided that upon his retirement on July 31, 2015, Mr. Santa Ines ceased to be eligible forany severance or change of control benefits, including under the Severance Plan.
25
Abaxis, Inc. Form 10-K/A
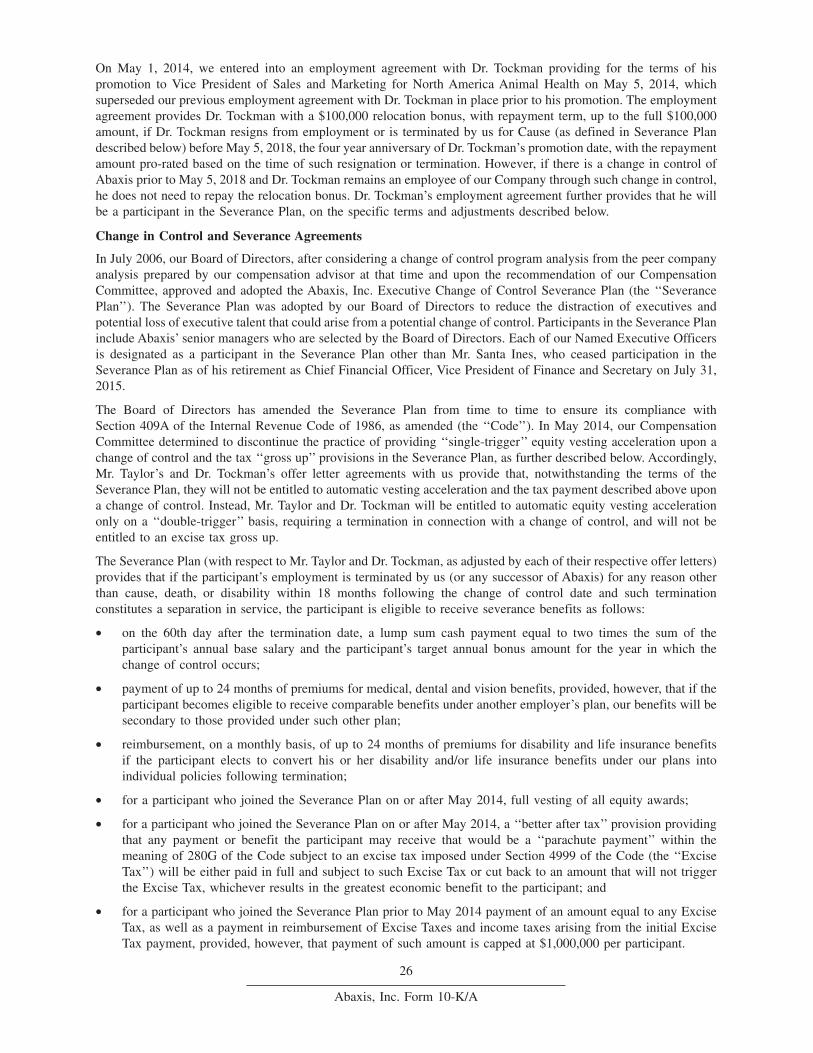
On May 1, 2014, we entered into an employment agreement with Dr. Tockman providing for the terms of hispromotion to Vice President of Sales and Marketing for North America Animal Health on May 5, 2014, whichsuperseded our previous employment agreement with Dr. Tockman in place prior to his promotion. The employmentagreement provides Dr. Tockman with a $100,000 relocation bonus, with repayment term, up to the full $100,000amount, if Dr. Tockman resigns from employment or is terminated by us for Cause (as defined in Severance Plandescribed below) before May 5, 2018, the four year anniversary of Dr. Tockman’s promotion date, with the repaymentamount pro-rated based on the time of such resignation or termination. However, if there is a change in control ofAbaxis prior to May 5, 2018 and Dr. Tockman remains an employee of our Company through such change in control,he does not need to repay the relocation bonus. Dr. Tockman’s employment agreement further provides that he willbe a participant in the Severance Plan, on the specific terms and adjustments described below.
Change in Control and Severance Agreements
In July 2006, our Board of Directors, after considering a change of control program analysis from the peer companyanalysis prepared by our compensation advisor at that time and upon the recommendation of our CompensationCommittee, approved and adopted the Abaxis, Inc. Executive Change of Control Severance Plan (the ‘‘SeverancePlan’’). The Severance Plan was adopted by our Board of Directors to reduce the distraction of executives andpotential loss of executive talent that could arise from a potential change of control. Participants in the Severance Planinclude Abaxis’ senior managers who are selected by the Board of Directors. Each of our Named Executive Officersis designated as a participant in the Severance Plan other than Mr. Santa Ines, who ceased participation in theSeverance Plan as of his retirement as Chief Financial Officer, Vice President of Finance and Secretary on July 31,2015.
The Board of Directors has amended the Severance Plan from time to time to ensure its compliance withSection 409A of the Internal Revenue Code of 1986, as amended (the ‘‘Code’’). In May 2014, our CompensationCommittee determined to discontinue the practice of providing ‘‘single-trigger’’ equity vesting acceleration upon achange of control and the tax ‘‘gross up’’ provisions in the Severance Plan, as further described below. Accordingly,Mr. Taylor’s and Dr. Tockman’s offer letter agreements with us provide that, notwithstanding the terms of theSeverance Plan, they will not be entitled to automatic vesting acceleration and the tax payment described above upona change of control. Instead, Mr. Taylor and Dr. Tockman will be entitled to automatic equity vesting accelerationonly on a ‘‘double-trigger’’ basis, requiring a termination in connection with a change of control, and will not beentitled to an excise tax gross up.
The Severance Plan (with respect to Mr. Taylor and Dr. Tockman, as adjusted by each of their respective offer letters)provides that if the participant’s employment is terminated by us (or any successor of Abaxis) for any reason otherthan cause, death, or disability within 18 months following the change of control date and such terminationconstitutes a separation in service, the participant is eligible to receive severance benefits as follows:
• on the 60th day after the termination date, a lump sum cash payment equal to two times the sum of theparticipant’s annual base salary and the participant’s target annual bonus amount for the year in which thechange of control occurs;
• payment of up to 24 months of premiums for medical, dental and vision benefits, provided, however, that if theparticipant becomes eligible to receive comparable benefits under another employer’s plan, our benefits will besecondary to those provided under such other plan;
• reimbursement, on a monthly basis, of up to 24 months of premiums for disability and life insurance benefitsif the participant elects to convert his or her disability and/or life insurance benefits under our plans intoindividual policies following termination;
• for a participant who joined the Severance Plan on or after May 2014, full vesting of all equity awards;
• for a participant who joined the Severance Plan on or after May 2014, a ‘‘better after tax’’ provision providingthat any payment or benefit the participant may receive that would be a ‘‘parachute payment’’ within themeaning of 280G of the Code subject to an excise tax imposed under Section 4999 of the Code (the ‘‘ExciseTax’’) will be either paid in full and subject to such Excise Tax or cut back to an amount that will not triggerthe Excise Tax, whichever results in the greatest economic benefit to the participant; and
• for a participant who joined the Severance Plan prior to May 2014 payment of an amount equal to any ExciseTax, as well as a payment in reimbursement of Excise Taxes and income taxes arising from the initial ExciseTax payment, provided, however, that payment of such amount is capped at $1,000,000 per participant.
26
Abaxis, Inc. Form 10-K/A
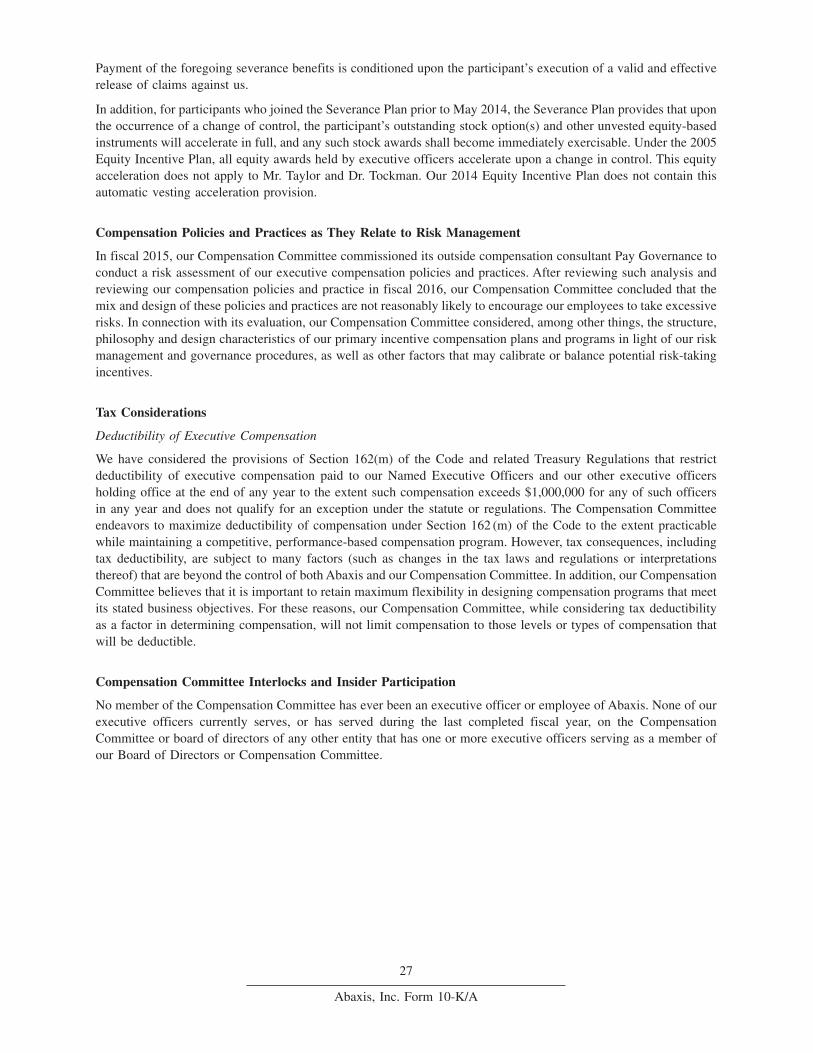
Payment of the foregoing severance benefits is conditioned upon the participant’s execution of a valid and effectiverelease of claims against us.
In addition, for participants who joined the Severance Plan prior to May 2014, the Severance Plan provides that uponthe occurrence of a change of control, the participant’s outstanding stock option(s) and other unvested equity-basedinstruments will accelerate in full, and any such stock awards shall become immediately exercisable. Under the 2005Equity Incentive Plan, all equity awards held by executive officers accelerate upon a change in control. This equityacceleration does not apply to Mr. Taylor and Dr. Tockman. Our 2014 Equity Incentive Plan does not contain thisautomatic vesting acceleration provision.
Compensation Policies and Practices as They Relate to Risk Management
In fiscal 2015, our Compensation Committee commissioned its outside compensation consultant Pay Governance toconduct a risk assessment of our executive compensation policies and practices. After reviewing such analysis andreviewing our compensation policies and practice in fiscal 2016, our Compensation Committee concluded that themix and design of these policies and practices are not reasonably likely to encourage our employees to take excessiverisks. In connection with its evaluation, our Compensation Committee considered, among other things, the structure,philosophy and design characteristics of our primary incentive compensation plans and programs in light of our riskmanagement and governance procedures, as well as other factors that may calibrate or balance potential risk-takingincentives.
Tax Considerations
Deductibility of Executive Compensation
We have considered the provisions of Section 162(m) of the Code and related Treasury Regulations that restrictdeductibility of executive compensation paid to our Named Executive Officers and our other executive officersholding office at the end of any year to the extent such compensation exceeds $1,000,000 for any of such officersin any year and does not qualify for an exception under the statute or regulations. The Compensation Committeeendeavors to maximize deductibility of compensation under Section 162 (m) of the Code to the extent practicablewhile maintaining a competitive, performance-based compensation program. However, tax consequences, includingtax deductibility, are subject to many factors (such as changes in the tax laws and regulations or interpretationsthereof) that are beyond the control of both Abaxis and our Compensation Committee. In addition, our CompensationCommittee believes that it is important to retain maximum flexibility in designing compensation programs that meetits stated business objectives. For these reasons, our Compensation Committee, while considering tax deductibilityas a factor in determining compensation, will not limit compensation to those levels or types of compensation thatwill be deductible.
Compensation Committee Interlocks and Insider Participation
No member of the Compensation Committee has ever been an executive officer or employee of Abaxis. None of ourexecutive officers currently serves, or has served during the last completed fiscal year, on the CompensationCommittee or board of directors of any other entity that has one or more executive officers serving as a member ofour Board of Directors or Compensation Committee.
27
Abaxis, Inc. Form 10-K/A
COMPENSATION COMMITTEE REPORT(1)
The Compensation Committee has reviewed and discussed with management the disclosures contained in theCompensation Discussion and Analysis included in this Annual Report on Form 10-K/A for the fiscal year endedMarch 31, 2016.
Based upon this review and discussion with management, the Compensation Committee recommended to the Boardof Directors that the Compensation Discussion and Analysis be included in this Annual Report on Form 10-K/A forthe fiscal year ended March 31, 2016.
THE COMPENSATION COMMITTEE
Richard J. Bastiani, Ph.D., ChairmanMichael D. CaseyPrithipal Singh, Ph.D.
(1) The material in this report is not ‘‘soliciting material,’’ is not deemed ‘‘filed’’ with the SEC and is not to be incorporated by reference intoany filing of Abaxis under the Securities Act of 1933, as amended, or the Securities Exchange Act of 1934, as amended, whether made beforeor after the date hereof and irrespective of any general incorporation language contained in any such filing.
28
Abaxis, Inc. Form 10-K/A
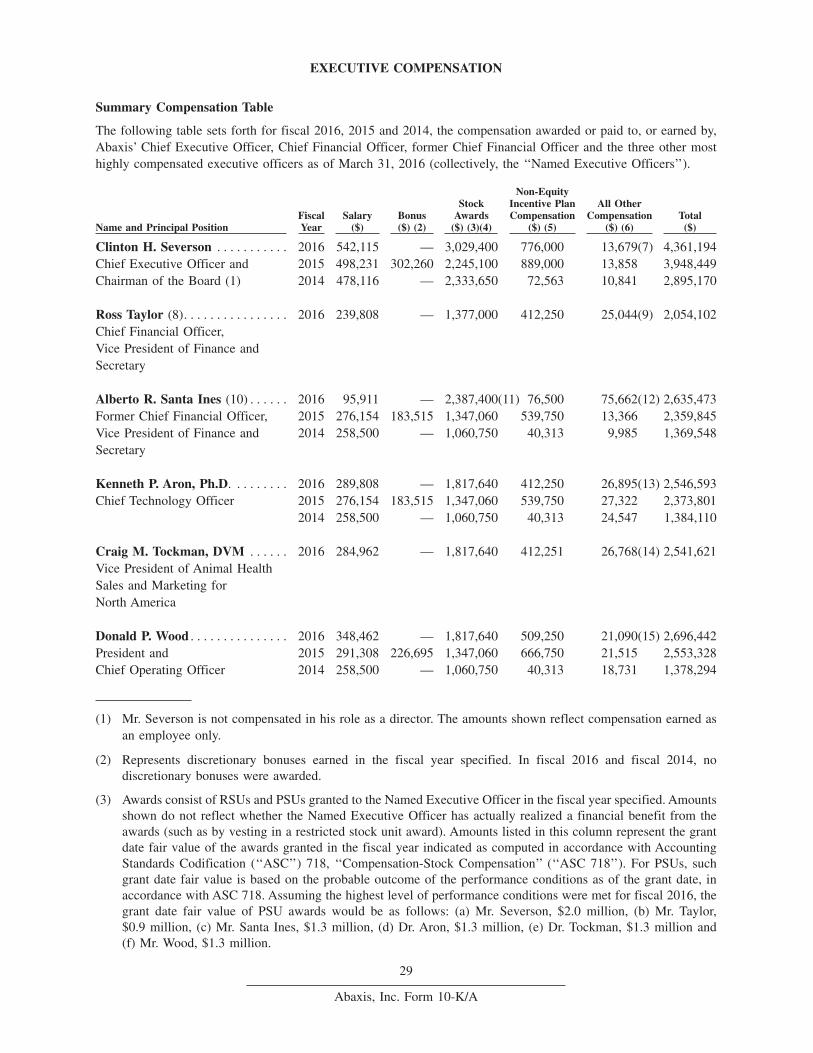
EXECUTIVE COMPENSATION
Summary Compensation Table
The following table sets forth for fiscal 2016, 2015 and 2014, the compensation awarded or paid to, or earned by,Abaxis’ Chief Executive Officer, Chief Financial Officer, former Chief Financial Officer and the three other mosthighly compensated executive officers as of March 31, 2016 (collectively, the ‘‘Named Executive Officers’’).
Name and Principal PositionFiscalYear
Salary($)
Bonus($) (2)
StockAwards
($) (3)(4)
Non-EquityIncentive PlanCompensation
($) (5)
All OtherCompensation
($) (6)Total
($)
Clinton H. Severson . . . . . . . . . . . 2016 542,115 — 3,029,400 776,000 13,679(7) 4,361,194Chief Executive Officer and 2015 498,231 302,260 2,245,100 889,000 13,858 3,948,449Chairman of the Board (1) 2014 478,116 — 2,333,650 72,563 10,841 2,895,170
Ross Taylor (8). . . . . . . . . . . . . . . . 2016 239,808 — 1,377,000 412,250 25,044(9) 2,054,102Chief Financial Officer,Vice President of Finance andSecretary
Alberto R. Santa Ines (10) . . . . . . 2016 95,911 — 2,387,400(11) 76,500 75,662(12) 2,635,473Former Chief Financial Officer, 2015 276,154 183,515 1,347,060 539,750 13,366 2,359,845Vice President of Finance and 2014 258,500 — 1,060,750 40,313 9,985 1,369,548Secretary
Kenneth P. Aron, Ph.D. . . . . . . . . 2016 289,808 — 1,817,640 412,250 26,895(13) 2,546,593Chief Technology Officer 2015 276,154 183,515 1,347,060 539,750 27,322 2,373,801
2014 258,500 — 1,060,750 40,313 24,547 1,384,110
Craig M. Tockman, DVM . . . . . . 2016 284,962 — 1,817,640 412,251 26,768(14) 2,541,621Vice President of Animal HealthSales and Marketing forNorth America
Donald P. Wood . . . . . . . . . . . . . . . 2016 348,462 — 1,817,640 509,250 21,090(15) 2,696,442President and 2015 291,308 226,695 1,347,060 666,750 21,515 2,553,328Chief Operating Officer 2014 258,500 — 1,060,750 40,313 18,731 1,378,294
(1) Mr. Severson is not compensated in his role as a director. The amounts shown reflect compensation earned asan employee only.
(2) Represents discretionary bonuses earned in the fiscal year specified. In fiscal 2016 and fiscal 2014, nodiscretionary bonuses were awarded.
(3) Awards consist of RSUs and PSUs granted to the Named Executive Officer in the fiscal year specified. Amountsshown do not reflect whether the Named Executive Officer has actually realized a financial benefit from theawards (such as by vesting in a restricted stock unit award). Amounts listed in this column represent the grantdate fair value of the awards granted in the fiscal year indicated as computed in accordance with AccountingStandards Codification (‘‘ASC’’) 718, ‘‘Compensation-Stock Compensation’’ (‘‘ASC 718’’). For PSUs, suchgrant date fair value is based on the probable outcome of the performance conditions as of the grant date, inaccordance with ASC 718. Assuming the highest level of performance conditions were met for fiscal 2016, thegrant date fair value of PSU awards would be as follows: (a) Mr. Severson, $2.0 million, (b) Mr. Taylor,$0.9 million, (c) Mr. Santa Ines, $1.3 million, (d) Dr. Aron, $1.3 million, (e) Dr. Tockman, $1.3 million and(f) Mr. Wood, $1.3 million.
29
Abaxis, Inc. Form 10-K/A
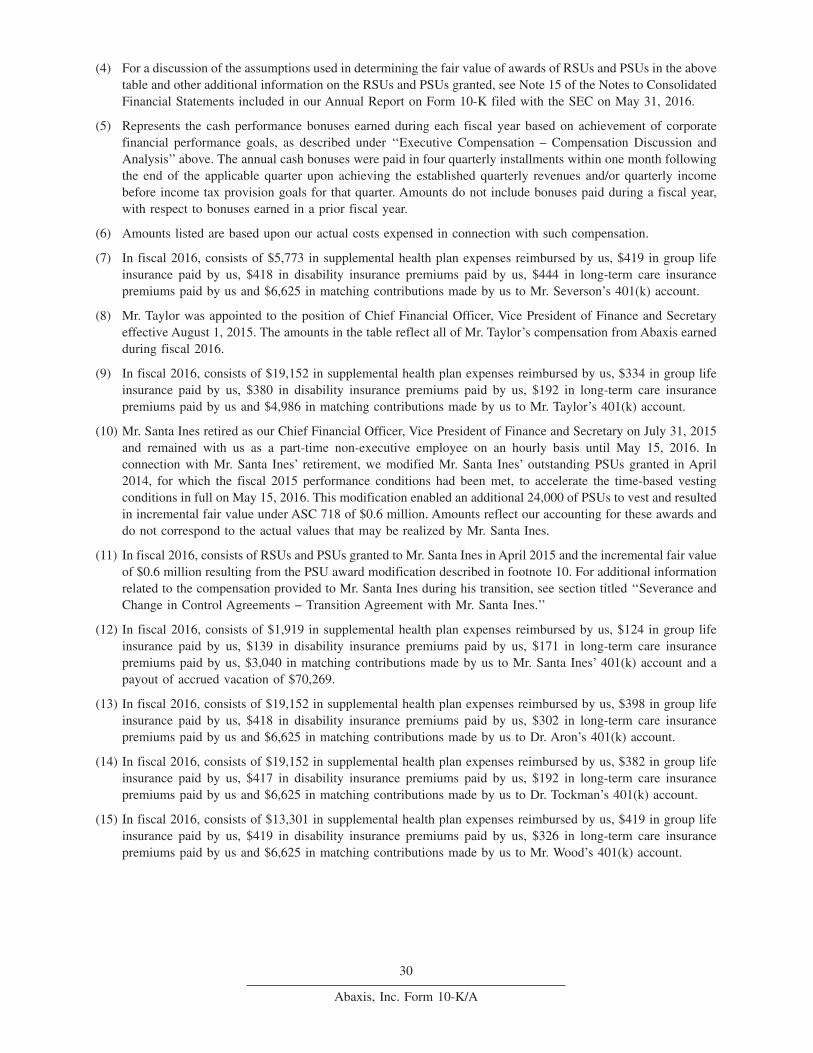
(4) For a discussion of the assumptions used in determining the fair value of awards of RSUs and PSUs in the abovetable and other additional information on the RSUs and PSUs granted, see Note 15 of the Notes to ConsolidatedFinancial Statements included in our Annual Report on Form 10-K filed with the SEC on May 31, 2016.
(5) Represents the cash performance bonuses earned during each fiscal year based on achievement of corporatefinancial performance goals, as described under ‘‘Executive Compensation – Compensation Discussion andAnalysis’’ above. The annual cash bonuses were paid in four quarterly installments within one month followingthe end of the applicable quarter upon achieving the established quarterly revenues and/or quarterly incomebefore income tax provision goals for that quarter. Amounts do not include bonuses paid during a fiscal year,with respect to bonuses earned in a prior fiscal year.
(6) Amounts listed are based upon our actual costs expensed in connection with such compensation.
(7) In fiscal 2016, consists of $5,773 in supplemental health plan expenses reimbursed by us, $419 in group lifeinsurance paid by us, $418 in disability insurance premiums paid by us, $444 in long-term care insurancepremiums paid by us and $6,625 in matching contributions made by us to Mr. Severson’s 401(k) account.
(8) Mr. Taylor was appointed to the position of Chief Financial Officer, Vice President of Finance and Secretaryeffective August 1, 2015. The amounts in the table reflect all of Mr. Taylor’s compensation from Abaxis earnedduring fiscal 2016.
(9) In fiscal 2016, consists of $19,152 in supplemental health plan expenses reimbursed by us, $334 in group lifeinsurance paid by us, $380 in disability insurance premiums paid by us, $192 in long-term care insurancepremiums paid by us and $4,986 in matching contributions made by us to Mr. Taylor’s 401(k) account.
(10) Mr. Santa Ines retired as our Chief Financial Officer, Vice President of Finance and Secretary on July 31, 2015and remained with us as a part-time non-executive employee on an hourly basis until May 15, 2016. Inconnection with Mr. Santa Ines’ retirement, we modified Mr. Santa Ines’ outstanding PSUs granted in April2014, for which the fiscal 2015 performance conditions had been met, to accelerate the time-based vestingconditions in full on May 15, 2016. This modification enabled an additional 24,000 of PSUs to vest and resultedin incremental fair value under ASC 718 of $0.6 million. Amounts reflect our accounting for these awards anddo not correspond to the actual values that may be realized by Mr. Santa Ines.
(11) In fiscal 2016, consists of RSUs and PSUs granted to Mr. Santa Ines in April 2015 and the incremental fair valueof $0.6 million resulting from the PSU award modification described in footnote 10. For additional informationrelated to the compensation provided to Mr. Santa Ines during his transition, see section titled ‘‘Severance andChange in Control Agreements − Transition Agreement with Mr. Santa Ines.’’
(12) In fiscal 2016, consists of $1,919 in supplemental health plan expenses reimbursed by us, $124 in group lifeinsurance paid by us, $139 in disability insurance premiums paid by us, $171 in long-term care insurancepremiums paid by us, $3,040 in matching contributions made by us to Mr. Santa Ines’ 401(k) account and apayout of accrued vacation of $70,269.
(13) In fiscal 2016, consists of $19,152 in supplemental health plan expenses reimbursed by us, $398 in group lifeinsurance paid by us, $418 in disability insurance premiums paid by us, $302 in long-term care insurancepremiums paid by us and $6,625 in matching contributions made by us to Dr. Aron’s 401(k) account.
(14) In fiscal 2016, consists of $19,152 in supplemental health plan expenses reimbursed by us, $382 in group lifeinsurance paid by us, $417 in disability insurance premiums paid by us, $192 in long-term care insurancepremiums paid by us and $6,625 in matching contributions made by us to Dr. Tockman’s 401(k) account.
(15) In fiscal 2016, consists of $13,301 in supplemental health plan expenses reimbursed by us, $419 in group lifeinsurance paid by us, $419 in disability insurance premiums paid by us, $326 in long-term care insurancepremiums paid by us and $6,625 in matching contributions made by us to Mr. Wood’s 401(k) account.
30
Abaxis, Inc. Form 10-K/A
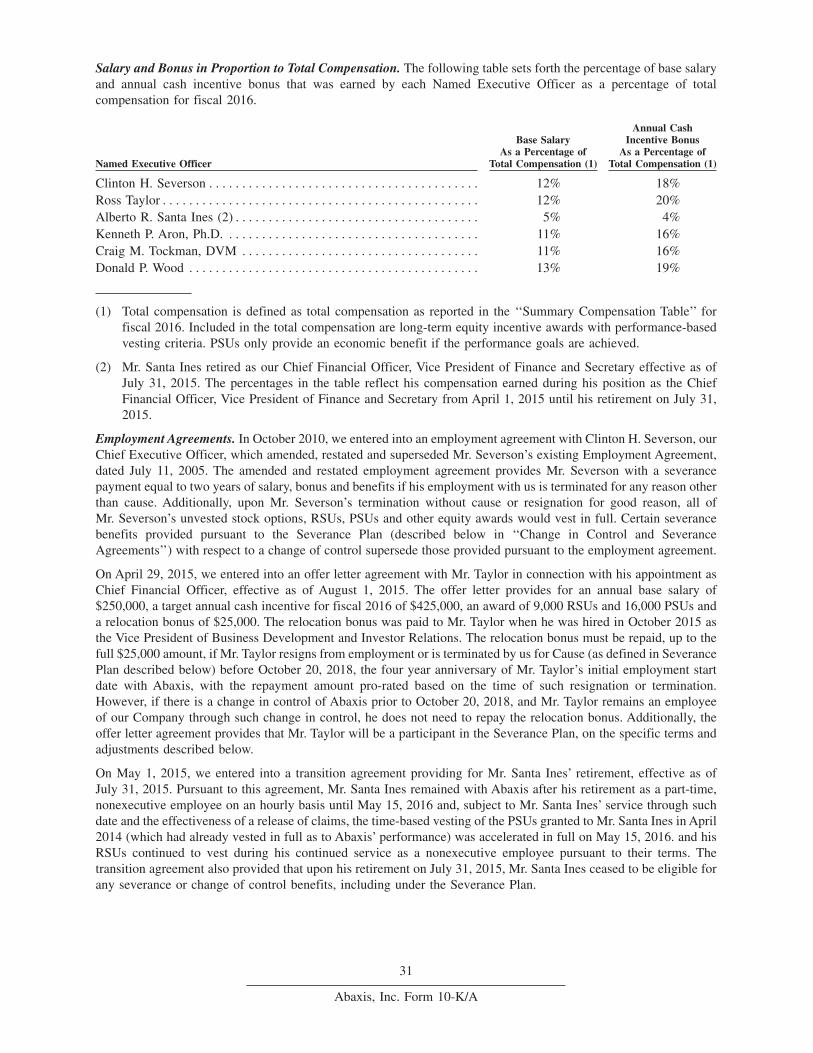
Salary and Bonus in Proportion to Total Compensation. The following table sets forth the percentage of base salaryand annual cash incentive bonus that was earned by each Named Executive Officer as a percentage of totalcompensation for fiscal 2016.
Named Executive Officer
Base SalaryAs a Percentage of
Total Compensation (1)
Annual CashIncentive Bonus
As a Percentage ofTotal Compensation (1)
Clinton H. Severson . . . . . . . . . . . . . . . . . . . . . . . . . . . . . . . . . . . . . . . . . 12% 18%Ross Taylor . . . . . . . . . . . . . . . . . . . . . . . . . . . . . . . . . . . . . . . . . . . . . . . . 12% 20%Alberto R. Santa Ines (2) . . . . . . . . . . . . . . . . . . . . . . . . . . . . . . . . . . . . . 5% 4%Kenneth P. Aron, Ph.D. . . . . . . . . . . . . . . . . . . . . . . . . . . . . . . . . . . . . . . 11% 16%Craig M. Tockman, DVM . . . . . . . . . . . . . . . . . . . . . . . . . . . . . . . . . . . . 11% 16%Donald P. Wood . . . . . . . . . . . . . . . . . . . . . . . . . . . . . . . . . . . . . . . . . . . . 13% 19%
(1) Total compensation is defined as total compensation as reported in the ‘‘Summary Compensation Table’’ forfiscal 2016. Included in the total compensation are long-term equity incentive awards with performance-basedvesting criteria. PSUs only provide an economic benefit if the performance goals are achieved.
(2) Mr. Santa Ines retired as our Chief Financial Officer, Vice President of Finance and Secretary effective as ofJuly 31, 2015. The percentages in the table reflect his compensation earned during his position as the ChiefFinancial Officer, Vice President of Finance and Secretary from April 1, 2015 until his retirement on July 31,2015.
Employment Agreements. In October 2010, we entered into an employment agreement with Clinton H. Severson, ourChief Executive Officer, which amended, restated and superseded Mr. Severson’s existing Employment Agreement,dated July 11, 2005. The amended and restated employment agreement provides Mr. Severson with a severancepayment equal to two years of salary, bonus and benefits if his employment with us is terminated for any reason otherthan cause. Additionally, upon Mr. Severson’s termination without cause or resignation for good reason, all ofMr. Severson’s unvested stock options, RSUs, PSUs and other equity awards would vest in full. Certain severancebenefits provided pursuant to the Severance Plan (described below in ‘‘Change in Control and SeveranceAgreements’’) with respect to a change of control supersede those provided pursuant to the employment agreement.
On April 29, 2015, we entered into an offer letter agreement with Mr. Taylor in connection with his appointment asChief Financial Officer, effective as of August 1, 2015. The offer letter provides for an annual base salary of$250,000, a target annual cash incentive for fiscal 2016 of $425,000, an award of 9,000 RSUs and 16,000 PSUs anda relocation bonus of $25,000. The relocation bonus was paid to Mr. Taylor when he was hired in October 2015 asthe Vice President of Business Development and Investor Relations. The relocation bonus must be repaid, up to thefull $25,000 amount, if Mr. Taylor resigns from employment or is terminated by us for Cause (as defined in SeverancePlan described below) before October 20, 2018, the four year anniversary of Mr. Taylor’s initial employment startdate with Abaxis, with the repayment amount pro-rated based on the time of such resignation or termination.However, if there is a change in control of Abaxis prior to October 20, 2018, and Mr. Taylor remains an employeeof our Company through such change in control, he does not need to repay the relocation bonus. Additionally, theoffer letter agreement provides that Mr. Taylor will be a participant in the Severance Plan, on the specific terms andadjustments described below.
On May 1, 2015, we entered into a transition agreement providing for Mr. Santa Ines’ retirement, effective as ofJuly 31, 2015. Pursuant to this agreement, Mr. Santa Ines remained with Abaxis after his retirement as a part-time,nonexecutive employee on an hourly basis until May 15, 2016 and, subject to Mr. Santa Ines’ service through suchdate and the effectiveness of a release of claims, the time-based vesting of the PSUs granted to Mr. Santa Ines in April2014 (which had already vested in full as to Abaxis’ performance) was accelerated in full on May 15, 2016. and hisRSUs continued to vest during his continued service as a nonexecutive employee pursuant to their terms. Thetransition agreement also provided that upon his retirement on July 31, 2015, Mr. Santa Ines ceased to be eligible forany severance or change of control benefits, including under the Severance Plan.
31
Abaxis, Inc. Form 10-K/A
Grants of Plan-Based Awards in Fiscal 2016
The following table sets forth the grants of plan-based awards to our Named Executive Officers during fiscal 2016.
Estimated Future Payouts UnderNon-Equity Incentive Plan Awards (1)
Estimated Future Payouts UnderEquity Incentive Plan Awards (2)
All OtherStock
Awards:Numberof Sharesof Stockor Units(#) (3)
GrantDate FairValue of
Stock andOptionAwards($) (4)Name
GrantDate
Threshold($)
Target($)
Maximum($)
Threshold(#)
Target(#)
Maximum(#)
Clinton H. SeversonAnnual cash incentive bonus . . . . 200,000 800,000 1,600,000RSUs . . . . . . . . . . . . . . . . . . . . . . . 5/4/2015 19,000 1,046,520PSUs. . . . . . . . . . . . . . . . . . . . . . . . 5/4/2015 0 36,000 36,000 1,982,880
Ross TaylorAnnual cash incentive bonus . . . . 106,250 425,000 850,000RSUs . . . . . . . . . . . . . . . . . . . . . . . 5/4/2015 9,000 495,720PSUs. . . . . . . . . . . . . . . . . . . . . . . . 5/4/2015 0 16,000 16,000 881,280
Alberto R. Santa Ines (5)Annual cash incentive bonus . . . . 106,250 425,000 850,000RSUs . . . . . . . . . . . . . . . . . . . . . . . 5/4/2015 9,000 495,720PSUs. . . . . . . . . . . . . . . . . . . . . . . . 5/4/2015 0 24,000 24,000 1,321,920
Kenneth P. Aron, Ph.D.Annual cash incentive bonus . . . . 106,250 425,000 850,000RSUs . . . . . . . . . . . . . . . . . . . . . . . 5/4/2015 9,000 495,720PSUs. . . . . . . . . . . . . . . . . . . . . . . . 5/4/2015 0 24,000 24,000 1,321,920
Craig M. Tockman, DVMAnnual cash incentive bonus . . . . 106,250 425,000 850,000RSUs . . . . . . . . . . . . . . . . . . . . . . . 5/4/2015 9,000 495,720PSUs. . . . . . . . . . . . . . . . . . . . . . . . 5/4/2015 0 24,000 24,000 1,321,920
Donald P. WoodAnnual cash incentive bonus . . . . 131,250 525,000 1,050,000RSUs . . . . . . . . . . . . . . . . . . . . . . . 5/4/2015 9,000 495,720PSUs. . . . . . . . . . . . . . . . . . . . . . . . 5/4/2015 0 24,000 24,000 1,321,920
(1) Actual cash performance bonuses, which were approved by the Board of Directors (with Mr. Severson abstaining) uponrecommendation by the Compensation Committee based on achievement of corporate financial performance goals for fiscal2016, were paid for within one month following the end of the quarter upon achieving the established quarterly revenues and/orquarterly income before income tax provision goals. Actual cash performance bonuses are shown in the ‘‘Non-Equity IncentivePlan Compensation’’ column of the ‘‘Summary Compensation Table’’ above. ‘‘Threshold’’ refers to the minimum amount ofannual bonus payable for a certain level of performance under the plan.
(2) Consists of PSUs granted under, and are subject to, the terms of our 2014 Equity Incentive Plan. PSUs were subject to vestingonly if both of the following criteria were satisfied: (a) consolidated income from operations for the fiscal year ended March 31,2016 was in excess of the applicable target amount; and (b) the recipient remained in the service of Abaxis until the applicablevesting date set forth as follows:
(i) 25% shares issuable upon settlement of FY2016 PSUs upon satisfying 90% of target of consolidated income from operationsfor the year ended March 31, 2016, and time-based vesting on May 4, 2018;
(ii) 25% shares issuable upon settlement of FY2016 PSUs upon satisfying 90% of target of consolidated income fromoperations for the year ended March 31, 2016, and time-based vesting on May 4, 2019;
(iii) 25% shares issuable upon settlement of FY2016 PSUs upon satisfying 100% of target of consolidated income fromoperations for the year ended March 31, 2016, and time-based vesting on May 4, 2018; and
32
Abaxis, Inc. Form 10-K/A
(iv) 25% shares issuable upon settlement of FY2016 PSUs upon satisfying 100% of target of consolidated income fromoperations for the year ended March 31, 2016, and time-based vesting on May 4, 2019.
Additional information on RSUs granted is described above in ‘‘Restricted Stock Units.’’
(3) Consists of RSUs granted under, and are subject to, the terms of our 2014 Equity Incentive Plan. The four-year time-basedvesting terms of the RSUs are as follows, assuming continuous employment: five percent of the shares vest after the first year;ten percent of the shares vest after the second year; 15 percent of the shares vest after the third year; and 70 percent of the sharesvest after the fourth year. Additional information on PSUs granted is described above in ‘‘Restricted Stock Units.’’
(4) Represents the fair value of the RSUs and PSUs on the date of grant, pursuant to ASC 718. See Note 15 of the Notes toConsolidated Financial Statements included in our Annual Report on Form 10-K filed with the SEC on May 31, 2016, foradditional information. For PSUs, such grant date fair value is based on the probable outcome of the performance conditionsas of the grant date, in accordance with ASC 718. Assuming the highest level of performance conditions were met, the grantdate fair value of such awards would be as follows: (a) Mr. Severson, $2.0 million, (b) Mr. Taylor, $0.9 million, (c) Mr. SantaInes, $1.3 million, (d) Dr. Aron, $1.3 million, (e) Dr. Tockman, $1.3 million and (f) Mr. Wood, $1.3 million.
(5) Upon Mr. Santa Ines’ retirement from his role as Chief Financial Officer, Vice President of Finance and Secretary effective July31, 2015, his FY2016 PSUs were cancelled. Mr. Santa Ines’ FY 2016 RSUs continued to vest during his part-time services asa nonexecutive employee through May 15, 2016. In addition to the grant date fair value of the fiscal 2016 stock awards, inconnection with his retirement, Mr. Santa Ines also had $0.6 million of incremental fair value resulting from the modificationin April 2015 of his outstanding PSUs granted in April 2014, for which the fiscal 2015 performance conditions had been met,to accelerate the time-based vesting conditions in full on May 15, 2016. For additional information related to the compensationprovided to Mr. Santa Ines during his transition, see section titled ‘‘Employment Agreements.’’
33
Abaxis, Inc. Form 10-K/A
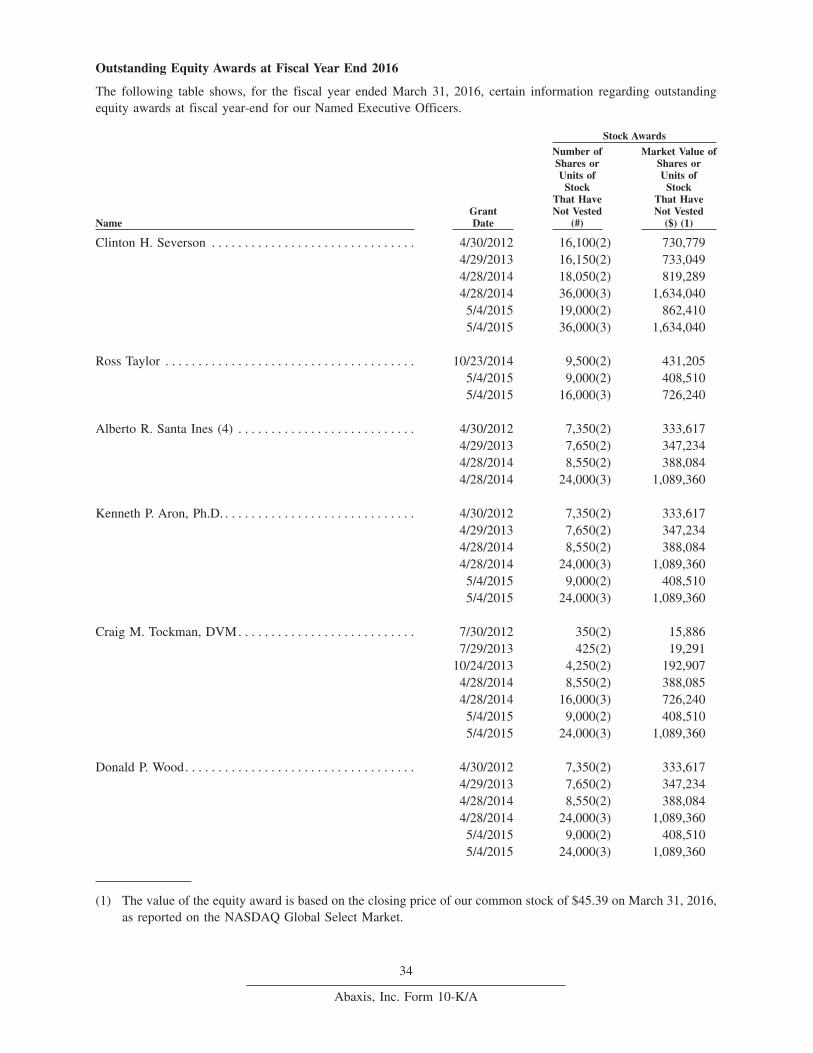
Outstanding Equity Awards at Fiscal Year End 2016
The following table shows, for the fiscal year ended March 31, 2016, certain information regarding outstandingequity awards at fiscal year-end for our Named Executive Officers.
Stock Awards
NameGrantDate
Number ofShares orUnits of
StockThat HaveNot Vested
(#)
Market Value ofShares orUnits of
StockThat HaveNot Vested
($) (1)
Clinton H. Severson . . . . . . . . . . . . . . . . . . . . . . . . . . . . . . . 4/30/2012 16,100(2) 730,7794/29/2013 16,150(2) 733,0494/28/2014 18,050(2) 819,2894/28/2014 36,000(3) 1,634,040
5/4/2015 19,000(2) 862,4105/4/2015 36,000(3) 1,634,040
Ross Taylor . . . . . . . . . . . . . . . . . . . . . . . . . . . . . . . . . . . . . . 10/23/2014 9,500(2) 431,2055/4/2015 9,000(2) 408,5105/4/2015 16,000(3) 726,240
Alberto R. Santa Ines (4) . . . . . . . . . . . . . . . . . . . . . . . . . . . 4/30/2012 7,350(2) 333,6174/29/2013 7,650(2) 347,2344/28/2014 8,550(2) 388,0844/28/2014 24,000(3) 1,089,360
Kenneth P. Aron, Ph.D. . . . . . . . . . . . . . . . . . . . . . . . . . . . . . 4/30/2012 7,350(2) 333,6174/29/2013 7,650(2) 347,2344/28/2014 8,550(2) 388,0844/28/2014 24,000(3) 1,089,360
5/4/2015 9,000(2) 408,5105/4/2015 24,000(3) 1,089,360
Craig M. Tockman, DVM. . . . . . . . . . . . . . . . . . . . . . . . . . . 7/30/2012 350(2) 15,8867/29/2013 425(2) 19,291
10/24/2013 4,250(2) 192,9074/28/2014 8,550(2) 388,0854/28/2014 16,000(3) 726,240
5/4/2015 9,000(2) 408,5105/4/2015 24,000(3) 1,089,360
Donald P. Wood. . . . . . . . . . . . . . . . . . . . . . . . . . . . . . . . . . . 4/30/2012 7,350(2) 333,6174/29/2013 7,650(2) 347,2344/28/2014 8,550(2) 388,0844/28/2014 24,000(3) 1,089,360
5/4/2015 9,000(2) 408,5105/4/2015 24,000(3) 1,089,360
(1) The value of the equity award is based on the closing price of our common stock of $45.39 on March 31, 2016,as reported on the NASDAQ Global Select Market.
34
Abaxis, Inc. Form 10-K/A
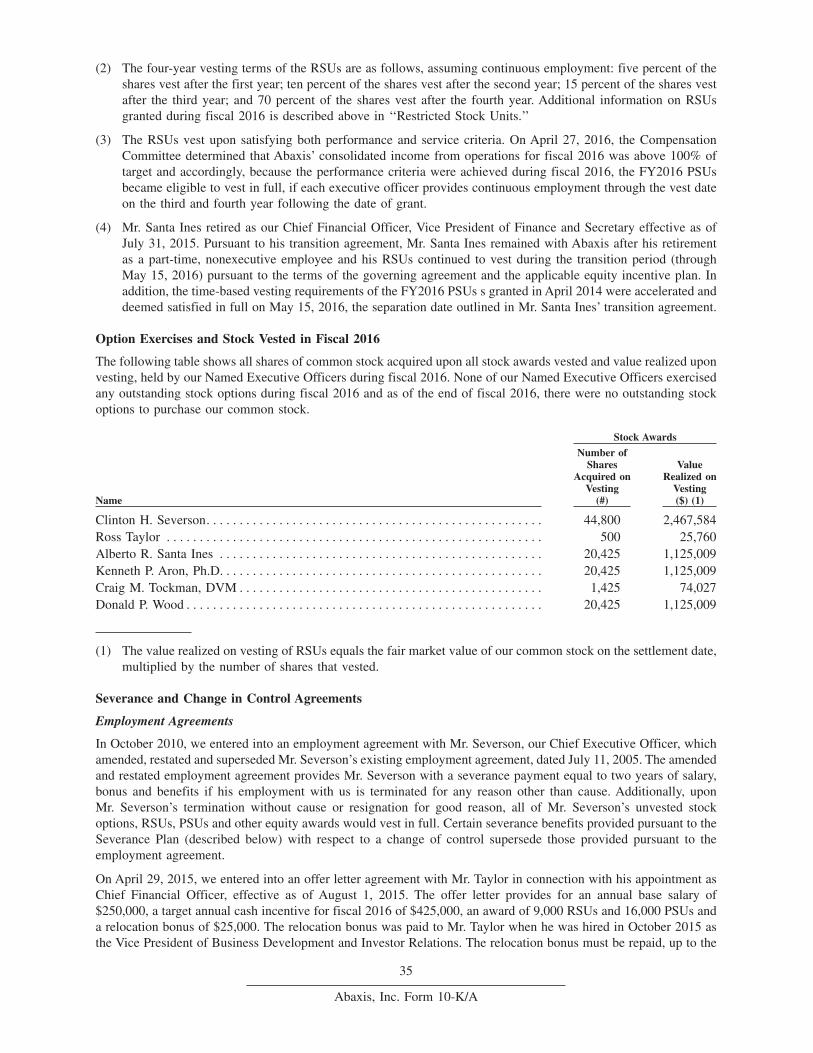
(2) The four-year vesting terms of the RSUs are as follows, assuming continuous employment: five percent of theshares vest after the first year; ten percent of the shares vest after the second year; 15 percent of the shares vestafter the third year; and 70 percent of the shares vest after the fourth year. Additional information on RSUsgranted during fiscal 2016 is described above in ‘‘Restricted Stock Units.’’
(3) The RSUs vest upon satisfying both performance and service criteria. On April 27, 2016, the CompensationCommittee determined that Abaxis’ consolidated income from operations for fiscal 2016 was above 100% oftarget and accordingly, because the performance criteria were achieved during fiscal 2016, the FY2016 PSUsbecame eligible to vest in full, if each executive officer provides continuous employment through the vest dateon the third and fourth year following the date of grant.
(4) Mr. Santa Ines retired as our Chief Financial Officer, Vice President of Finance and Secretary effective as ofJuly 31, 2015. Pursuant to his transition agreement, Mr. Santa Ines remained with Abaxis after his retirementas a part-time, nonexecutive employee and his RSUs continued to vest during the transition period (throughMay 15, 2016) pursuant to the terms of the governing agreement and the applicable equity incentive plan. Inaddition, the time-based vesting requirements of the FY2016 PSUs s granted in April 2014 were accelerated anddeemed satisfied in full on May 15, 2016, the separation date outlined in Mr. Santa Ines’ transition agreement.
Option Exercises and Stock Vested in Fiscal 2016
The following table shows all shares of common stock acquired upon all stock awards vested and value realized uponvesting, held by our Named Executive Officers during fiscal 2016. None of our Named Executive Officers exercisedany outstanding stock options during fiscal 2016 and as of the end of fiscal 2016, there were no outstanding stockoptions to purchase our common stock.
Stock Awards
Name
Number ofShares
Acquired onVesting
(#)
ValueRealized on
Vesting($) (1)
Clinton H. Severson. . . . . . . . . . . . . . . . . . . . . . . . . . . . . . . . . . . . . . . . . . . . . . . . . . . 44,800 2,467,584Ross Taylor . . . . . . . . . . . . . . . . . . . . . . . . . . . . . . . . . . . . . . . . . . . . . . . . . . . . . . . . . 500 25,760Alberto R. Santa Ines . . . . . . . . . . . . . . . . . . . . . . . . . . . . . . . . . . . . . . . . . . . . . . . . . 20,425 1,125,009Kenneth P. Aron, Ph.D. . . . . . . . . . . . . . . . . . . . . . . . . . . . . . . . . . . . . . . . . . . . . . . . . 20,425 1,125,009Craig M. Tockman, DVM . . . . . . . . . . . . . . . . . . . . . . . . . . . . . . . . . . . . . . . . . . . . . . 1,425 74,027Donald P. Wood . . . . . . . . . . . . . . . . . . . . . . . . . . . . . . . . . . . . . . . . . . . . . . . . . . . . . . 20,425 1,125,009
(1) The value realized on vesting of RSUs equals the fair market value of our common stock on the settlement date,multiplied by the number of shares that vested.
Severance and Change in Control Agreements
Employment Agreements
In October 2010, we entered into an employment agreement with Mr. Severson, our Chief Executive Officer, whichamended, restated and superseded Mr. Severson’s existing employment agreement, dated July 11, 2005. The amendedand restated employment agreement provides Mr. Severson with a severance payment equal to two years of salary,bonus and benefits if his employment with us is terminated for any reason other than cause. Additionally, uponMr. Severson’s termination without cause or resignation for good reason, all of Mr. Severson’s unvested stockoptions, RSUs, PSUs and other equity awards would vest in full. Certain severance benefits provided pursuant to theSeverance Plan (described below) with respect to a change of control supersede those provided pursuant to theemployment agreement.
On April 29, 2015, we entered into an offer letter agreement with Mr. Taylor in connection with his appointment asChief Financial Officer, effective as of August 1, 2015. The offer letter provides for an annual base salary of$250,000, a target annual cash incentive for fiscal 2016 of $425,000, an award of 9,000 RSUs and 16,000 PSUs anda relocation bonus of $25,000. The relocation bonus was paid to Mr. Taylor when he was hired in October 2015 asthe Vice President of Business Development and Investor Relations. The relocation bonus must be repaid, up to the
35
Abaxis, Inc. Form 10-K/A
full $25,000 amount, if Mr. Taylor resigns from employment or is terminated by us for Cause (as defined in SeverancePlan described below) before October 20, 2018, the four year anniversary of Mr. Taylor’s initial employment startdate with Abaxis, with the repayment amount pro-rated based on the time of such resignation or termination.However, if there is a change in control of Abaxis prior to October 20, 2018 and Mr. Taylor remains an employeeof our Company through such change in control, he does not need to repay the relocation bonus. Additionally, theoffer letter agreement also provides that Mr. Taylor will be a participant in the Severance Plan, on the specific termsand adjustments described below.
On May 1, 2014, we entered into an employment agreement with Dr. Tockman providing for the terms of hispromotion to Vice President of Sales and Marketing for North America Animal Health on May 5, 2014, whichsuperseded our previous employment agreement with Dr. Tockman in place prior to his promotion. The employmentagreement provides Dr. Tockman with a $100,000 relocation bonus, with repayment terms, up to the full $100,000amount, if Dr. Tockman resigns from employment or is terminated by us for Cause (as defined in Severance Plandescribed below) before May 5, 2018, the four year anniversary of Dr. Tockman’s promotion date, with the repaymentamount pro-rated based on the time of such resignation or termination. However, if there is a change in control ofAbaxis prior to May 5, 2018 and Dr. Tockman remains an employee of our Company through such change in control,he does not need to repay the relocation bonus. Dr. Tockman’s employment agreement further provides that he willbe a participant in the Severance Plan, on the specific terms and adjustments described below.
Transition Agreement with Mr. Santa Ines
On May 1, 2015, we entered into a transition agreement providing for Mr. Santa Ines’ retirement, effective as of July31, 2015. Pursuant to this agreement, Mr. Santa Ines remained with Abaxis after his retirement as a part-time,nonexecutive employee on an hourly basis until May 15, 2016. In addition, contingent upon Mr. Santa Ines’ servicethrough such date and Mr. Santa Ines’ release of claims that he may have on account of his employment with us, thetime-based vesting of the PSUs granted to Mr. Santa Ines in April 2014 (which had already vested in full as to theCompany’s performance) was accelerated in full on May 15, 2016. This acceleration enabled an additional 24,000of PSUs to vest and resulted in incremental fair value of $0.6 million.
Pursuant to the transition agreement, we also paid Mr. Santa Ines the bonus amount of $76,500 for the quarter endedJune 30, 2015 that he would have been paid had he continued in his full time executive officer capacity until the datebonuses were earned and paid to other executive officers for such quarter. Mr. Santa Ines also received all accruedand unused vacation earned, totaling $70,269, upon his retirement on July 31, 2015. Mr. Santa Ines also received$1,385 in matching contributions earned after his retirement as a part-time, nonexecutive employee. Upon hisretirement on July 31, 2015, Mr. Santa Ines ceased to be eligible for any severance or change of control benefits,including under the Severance Plan.
Executive Change of Control Severance Plan
In July 2006, our Board of Directors, after considering a change of control program analysis from the peer companyanalysis prepared by our compensation advisor at that time and upon the recommendation of our CompensationCommittee, approved and adopted the Abaxis, Inc. Executive Change of Control Severance Plan (the ‘‘SeverancePlan’’). The Severance Plan was adopted by our Board of Directors to reduce the distraction of executives andpotential loss of executive talent that could arise from a potential change of control. Participants in the Severance Planinclude Abaxis’ senior managers who are selected by the Board of Directors. Each of our Named Executive Officersis designated as a participant in the Severance Plan, however Mr. Santa Ines ceased such participation as of hisretirement as our Chief Financial Officer, Vice President of Finance and Secretary effective July 31, 2015.
The Board of Directors has amended the Severance Plan from time to time to ensure its compliance withSection 409A of the Code. In May 2014, our Compensation Committee determined to discontinue the practice ofproviding ‘‘single-trigger’’ equity vesting acceleration upon a change of control and the tax ‘‘gross up’’ provisionsin the Severance Plan, as further described below. Accordingly, Mr. Taylor’s and Dr. Tockman’s offer letteragreements with us provide that, notwithstanding the terms of the Severance Plan, they will not be entitled toautomatic vesting acceleration and the tax payment described above upon a change of control. Instead, Mr. Taylorand Dr. Tockman will be entitled to automatic equity vesting acceleration only on a ‘‘double-trigger’’ basis, requiringa termination in connection with a change of control, and will not be entitled to an excise tax gross up.
The Severance Plan (with respect to Mr. Taylor and Dr. Tockman, as adjusted by each of their respective employmentletters) provides that if the participant’s employment is terminated by us (or any successor of Abaxis) for any reason
36
Abaxis, Inc. Form 10-K/A
other than cause, death, or disability within 18 months following the change of control date and such terminationconstitutes a separation in service, the participant is eligible to receive severance benefits as follows:
• on the 60th day after the termination date, a lump sum cash payment equal to two times the sum of theparticipant’s annual base salary and the participant’s target annual bonus amount for the year in which thechange of control occurs;
• payment of up to 24 months of premiums for medical, dental and vision benefits, provided, however, that if theparticipant becomes eligible to receive comparable benefits under another employer’s plan, our benefits will besecondary to those provided under such other plan;
• reimbursement, on a monthly basis, of up to 24 months of premiums for disability and life insurance benefitsif the participant elects to convert his or her disability and/or life insurance benefits under our plans intoindividual policies following termination;
• for a participant who joined the Severance Plan on or after May 2014, full vesting of all equity awards;
• for a participant who joined the Severance Plan on or after May 2014, a ‘‘better after tax’’ provision providingthat any payment or benefit the participant may receive that would be a ‘‘parachute payment’’ within themeaning of 280G of the Code subject to the Excise Tax will be either paid in full and subject to such ExciseTax or cut back to an amount that will not trigger the Excise Tax, whichever results in the greatest economicbenefit to the participant; and
• for a participant who joined the Severance Plan prior to May 2014, payment of an amount equal to any ExciseTax, as well as a payment in reimbursement of Excise Taxes and income taxes arising from the initial ExciseTax payment, provided, however, that payment of such amount is capped at $1,000,000 per participant.
Payment of the foregoing severance benefits is conditioned upon the participant’s execution of a valid and effectiverelease of claims against us.
In addition, for participants who joined the Severance Plan prior to May 2014, the Severance Plan provides that uponthe occurrence of a change of control, the participant’s outstanding stock option(s) and other unvested equity-basedinstruments will accelerate in full, and any such stock awards shall become immediately exercisable. Under the 2005Equity Incentive Plan, all equity awards held by executive officers accelerate upon a change in control. This equityacceleration does not apply to Mr. Taylor and Dr. Tockman. Our 2014 Equity Incentive Plan does not contain thisautomatic vesting acceleration provision.
Incentive Plans
Under our 2005 Equity Incentive Plan, or the 2005 Plan, in the event of a ‘‘change in control,’’ as such term is definedby the 2005 Plan, the surviving, continuing, successor or purchasing entity or its parent may, without the consent ofany participant, either assume or continue in effect any or all outstanding options and stock appreciation rights orsubstitute substantially equivalent options or rights for its stock. Any options or stock appreciation rights which arenot assumed or continued in connection with a change in control or exercised prior to the change in control willterminate effective as of the time of the change in control. Our Compensation Committee may provide for theacceleration of vesting of any or all outstanding options or stock appreciation rights upon such terms and to any extentit determines. The 2005 Plan also authorizes our Compensation Committee, in its discretion and without the consentof any participant, to cancel each or any outstanding option or stock appreciation right upon a change in control inexchange for a payment to the participant with respect to each vested share (and each unvested share if so determinedby our Compensation Committee) subject to the cancelled award of an amount of cash, stock or other property equalto the fair market value of the excess of the consideration to be paid per share of common stock in the change incontrol transaction over the exercise price per share under the award. The Compensation Committee, in its discretion,may provide in the event of a change in control for the acceleration of vesting and/or settlement of any stock award,restricted stock unit award, performance share or performance unit, cash-based award or other share-based awardheld by a participant upon such conditions and to such extent as determined by our Compensation Committee. Thevesting of non-employee director awards and officer awards (including awards held by the Named ExecutiveOfficers) granted under the 2005 Plan will automatically accelerate in full upon a change in control. However, ouroffer letter agreements with new executive officers hired starting in fiscal 2015 (Mr. Taylor and Dr. Tockman) providethat, notwithstanding the terms of the 2005 Plan, they will not be entitled to automatic vesting acceleration upon achange of control.
37
Abaxis, Inc. Form 10-K/A
Under our 2014 Equity Incentive Plan, or the 2014 Plan, in the event of certain specified significant corporatetransactions, including a change in control, unless otherwise provided in a participant’s award agreement or otherwritten agreement with us or one of our affiliates, we have the discretion to take any of the following actions withrespect to stock awards: (1) arrange for the assumption, continuation or substitution of a stock award by a survivingor acquiring entity or parent company; (2) arrange for the assignment of any reacquisition or repurchase rights heldby us to the surviving or acquiring entity or parent company; (3) accelerate the vesting of the stock award, in wholeor in part, and provide for its termination prior to the effective time of the corporate transaction; (4) arrange for thelapse, in whole or in part, of any reacquisition or repurchase right held by us; (5) cancel or arrange for the cancellationof the stock award, to the extent not vested or not exercised prior to the effective time of the corporate transaction,in exchange for such cash consideration, if any, as the Board may deem appropriate; (6) make a payment equal tothe excess of (a) the value of the property the participant would have received upon exercise of the stock award or(b) the exercise price otherwise payable in connection with the stock award. We are not obligated to treat all stockawards, even those that are of the same type, in the same manner. No automatic vesting acceleration occurs underthe 2014 Plan upon a change of control, however we may provide, in an individual award agreement or in any otherwritten agreement between a participant and us that the stock award will be subject to additional acceleration ofvesting and exercisability in the event of a change of control. Our form of restricted stock unit award agreement fornon-employee directors provides that such awards will vest in full upon a change of control.
As described above, certain additional compensation is payable to a Named Executive Officer (i) if his employmentwas involuntarily terminated without cause or he resigned for good cause, (ii) upon a change in control or (iii) if hisemployment was terminated involuntarily following a change in control. The amounts shown in the table belowassume that such termination was effective as of March 31, 2016, and do not include amounts in which the NamedExecutive Officer had already vested as of March 31, 2016. The actual compensation to be paid can only bedetermined at the time of the change in control and/or a Named Executive Officer’s termination of employment.
38
Abaxis, Inc. Form 10-K/A
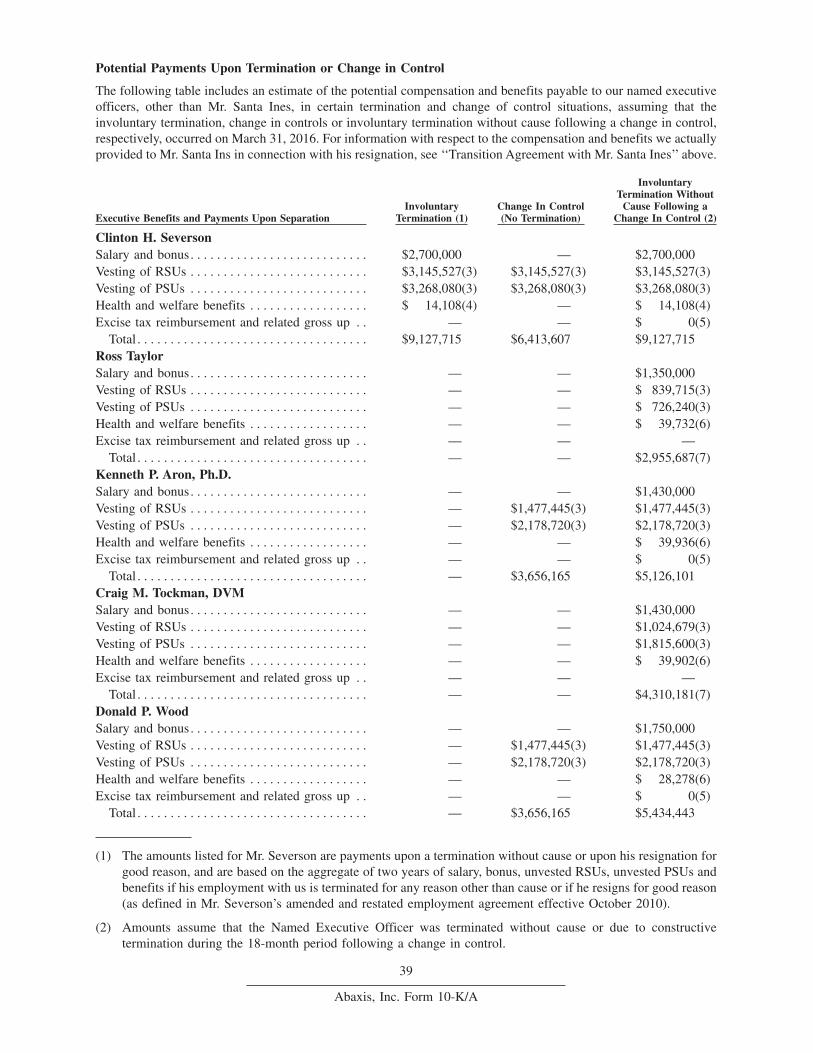
Potential Payments Upon Termination or Change in Control
The following table includes an estimate of the potential compensation and benefits payable to our named executiveofficers, other than Mr. Santa Ines, in certain termination and change of control situations, assuming that theinvoluntary termination, change in controls or involuntary termination without cause following a change in control,respectively, occurred on March 31, 2016. For information with respect to the compensation and benefits we actuallyprovided to Mr. Santa Ins in connection with his resignation, see ‘‘Transition Agreement with Mr. Santa Ines’’ above.
Executive Benefits and Payments Upon SeparationInvoluntary
Termination (1)Change In Control(No Termination)
InvoluntaryTermination Without
Cause Following aChange In Control (2)
Clinton H. SeversonSalary and bonus. . . . . . . . . . . . . . . . . . . . . . . . . . . $2,700,000 — $2,700,000Vesting of RSUs . . . . . . . . . . . . . . . . . . . . . . . . . . . $3,145,527(3) $3,145,527(3) $3,145,527(3)Vesting of PSUs . . . . . . . . . . . . . . . . . . . . . . . . . . . $3,268,080(3) $3,268,080(3) $3,268,080(3)Health and welfare benefits . . . . . . . . . . . . . . . . . . $ 14,108(4) — $ 14,108(4)Excise tax reimbursement and related gross up . . — — $ 0(5)
Total . . . . . . . . . . . . . . . . . . . . . . . . . . . . . . . . . . . $9,127,715 $6,413,607 $9,127,715Ross TaylorSalary and bonus. . . . . . . . . . . . . . . . . . . . . . . . . . . — — $1,350,000Vesting of RSUs . . . . . . . . . . . . . . . . . . . . . . . . . . . — — $ 839,715(3)Vesting of PSUs . . . . . . . . . . . . . . . . . . . . . . . . . . . — — $ 726,240(3)Health and welfare benefits . . . . . . . . . . . . . . . . . . — — $ 39,732(6)Excise tax reimbursement and related gross up . . — — —
Total . . . . . . . . . . . . . . . . . . . . . . . . . . . . . . . . . . . — — $2,955,687(7)Kenneth P. Aron, Ph.D.Salary and bonus. . . . . . . . . . . . . . . . . . . . . . . . . . . — — $1,430,000Vesting of RSUs . . . . . . . . . . . . . . . . . . . . . . . . . . . — $1,477,445(3) $1,477,445(3)Vesting of PSUs . . . . . . . . . . . . . . . . . . . . . . . . . . . — $2,178,720(3) $2,178,720(3)Health and welfare benefits . . . . . . . . . . . . . . . . . . — — $ 39,936(6)Excise tax reimbursement and related gross up . . — — $ 0(5)
Total . . . . . . . . . . . . . . . . . . . . . . . . . . . . . . . . . . . — $3,656,165 $5,126,101Craig M. Tockman, DVMSalary and bonus. . . . . . . . . . . . . . . . . . . . . . . . . . . — — $1,430,000Vesting of RSUs . . . . . . . . . . . . . . . . . . . . . . . . . . . — — $1,024,679(3)Vesting of PSUs . . . . . . . . . . . . . . . . . . . . . . . . . . . — — $1,815,600(3)Health and welfare benefits . . . . . . . . . . . . . . . . . . — — $ 39,902(6)Excise tax reimbursement and related gross up . . — — —
Total . . . . . . . . . . . . . . . . . . . . . . . . . . . . . . . . . . . — — $4,310,181(7)Donald P. WoodSalary and bonus. . . . . . . . . . . . . . . . . . . . . . . . . . . — — $1,750,000Vesting of RSUs . . . . . . . . . . . . . . . . . . . . . . . . . . . — $1,477,445(3) $1,477,445(3)Vesting of PSUs . . . . . . . . . . . . . . . . . . . . . . . . . . . — $2,178,720(3) $2,178,720(3)Health and welfare benefits . . . . . . . . . . . . . . . . . . — — $ 28,278(6)Excise tax reimbursement and related gross up . . — — $ 0(5)
Total . . . . . . . . . . . . . . . . . . . . . . . . . . . . . . . . . . . — $3,656,165 $5,434,443
(1) The amounts listed for Mr. Severson are payments upon a termination without cause or upon his resignation forgood reason, and are based on the aggregate of two years of salary, bonus, unvested RSUs, unvested PSUs andbenefits if his employment with us is terminated for any reason other than cause or if he resigns for good reason(as defined in Mr. Severson’s amended and restated employment agreement effective October 2010).
(2) Amounts assume that the Named Executive Officer was terminated without cause or due to constructivetermination during the 18-month period following a change in control.
39
Abaxis, Inc. Form 10-K/A
(3) The values of the RSUs and PSUs assume that the market price per share of our common stock on the date oftermination of employment was equal to the closing price of our common stock of $45.39 on March 31, 2016,as reported on the NASDAQ Global Select Market.
(4) Health and welfare benefits include payment of 24 months of premiums for medical, dental, vision, disability,life insurance and long-term care benefits.
(5) For purposes of computing the Excise Tax reimbursement and related gross up payments, base amountcalculations are based on the Named Executive Officer’s taxable wages for fiscal years 2012 through 2016. NoExcise Tax reimbursement or related gross up is estimated for Mr. Severson, Dr. Aron or Mr. Wood because thepayment or benefit they may receive that would be a ‘‘parachute payment’’ within the meaning of 280G of theCode is estimated to be less than the Code safe harbor limit and thus not subject to Excise Tax.
(6) Health and welfare benefits include payment of 24 months of premiums for medical, dental, vision, disabilityand life insurance benefits.
(7) Mr. Taylor and Dr. Tockman do not receive an excise tax reimbursement or related gross-up benefit.
(8) Pursuant to the ‘‘best after tax’’ provision of the Severance Plan, as adjusted by each of Mr. Taylor’s and Dr.Tockman’s respective offer letters, any payment or benefit each may receive that would be a ‘‘parachutepayment’’ within the meaning of 280G of the Code subject to an Excise Tax imposed under Section 4999 of theCode will be either paid in full and subject to such Excise Tax or cut back to an amount that will not trigger theExcise Tax, whichever results in the greatest economic benefit to the participant. Based on this provision, eachof Mr. Taylor and Dr. Tockman would have received the greatest economic benefit to receive his full severanceamount and personally pay his Excise Tax liability. The estimated Excise Tax liability that Mr. Taylor and Dr.Tockman would have been responsible for personally paying was $309,000 and $369,000, respectively.
40
Abaxis, Inc. Form 10-K/A
DIRECTOR COMPENSATION
Director Compensation Table
The table below summarizes the compensation paid to our non-employee directors for fiscal 2016.
Name (1)
Fees Earned orPaid in Cash
($)
StockAwards
($) (2) (3)Total
($)
Vernon E. Altman . . . . . . . . . . . . . . . . . . . . . . . . . . . . . . . . . . . . . . . . . . . 33,250 275,400 308,650Richard J. Bastiani, Ph.D. . . . . . . . . . . . . . . . . . . . . . . . . . . . . . . . . . . . . 34,750 275,400 310,150Michael D. Casey . . . . . . . . . . . . . . . . . . . . . . . . . . . . . . . . . . . . . . . . . . . 26,250 275,400 301,650Henk J. Evenhuis . . . . . . . . . . . . . . . . . . . . . . . . . . . . . . . . . . . . . . . . . . . 39,750 275,400 315,150Prithipal Singh, Ph.D.. . . . . . . . . . . . . . . . . . . . . . . . . . . . . . . . . . . . . . . . 32,250 275,400 307,650
(1) Clinton H. Severson, our Chief Executive Officer and Director, is not included in this table as he is an employeeof Abaxis and receives no compensation for his services as a director. The compensation received byMr. Severson as an employee is shown in the ‘‘Summary Compensation Table’’ above.
(2) Each non-employee director listed in the table above was granted an award of 5,000 RSUs on May 4, 2015 underour 2014 Plan. Amounts listed in this column represent the grant date fair value of the awards in accordance withASC 718. Amounts shown do not reflect whether the non-employee director has actually realized a financialbenefit from the awards (such as by vesting in a RSU award). For a discussion of the assumptions used indetermining the fair value of awards of RSUs in the above table, see Note 15 of the Notes to ConsolidatedFinancial Statements in our Annual Report on Form 10-K filed with the SEC on May 31, 2016. No stock awardswere forfeited by our non-employee directors during fiscal 2016.
(3) As of March 31, 2016, each of our non-employee directors held 5,000 shares subject to outstanding RSUs.
Cash Compensation Paid to Board Members
During fiscal 2016, all non-employee directors received an annual retainer of $15,000, pro-rated based on the periodof services provided by the non-employee director. The non-employee Chairs of our Audit Committee, CompensationCommittee and Nominating Committee received an annual supplement of $13,500, $7,500, and $5,000, respectively.Our non-employee directors each received $1,250 per board meeting attended and $1,000 per committee meetingattended. In April 2014, we designated Mr. Altman as our lead independent director and he received an annualsupplement of $7,000 in connection with this appointment. We also reimburse our non-employee directors forreasonable travel expenses incurred in connection with attending board and committee meetings. Directors who areemployees receive no compensation for their service as directors.
Equity Compensation Paid to Board Members
Non-employee directors are eligible to receive awards under the 2005 Plan or the 2014 Plan, as applicable, but suchawards are discretionary and not automatic. In fiscal 2016, 2015 and 2014, each non-employee director received anannual equity award of 5,000, 5,000 and 4,000, respectively, RSUs for the services provided by the non-employeedirector during the respective period. Each award of RSUs represents the right of the participant to receive, withoutpayment of monetary consideration, on the vesting date, a number of shares of common stock equal to the numberof units vesting on such date. Subject to the director’s continued service with us through the applicable vesting date,each RSU award will vest in full 12 months after the grant date. Under the terms of the 2005 Plan, and the directoragreements under the 2014 Plan, the vesting of each non-employee director RSU award will also be accelerated infull in the event of a ‘‘change in control,’’ as defined in the 2005 Plan and the director agreements under the 2014Plan.
41
Abaxis, Inc. Form 10-K/A
Item 12. Security Ownership of Certain Beneficial Owners and Management and Related StockholderMatters
The following table sets forth certain information with respect to the beneficial ownership of our common stock asof May 31, 2016 by (i) each of the Named Executive Officers in the Summary Compensation Table; (ii) each of ourdirectors; (iii) all of our executive officers and directors as a group and (iv) holders of at least five percent of ourcommon stock. The persons named in the table have sole or shared voting and investment power with respect to allshares of common stock shown as beneficially owned by them, subject to community property laws where applicableand to the information contained in the footnotes to this table.
Name and Address of Beneficial Owner
SharesBeneficially
Owned
Percent ofAbaxis
Common StockBeneficiallyOwned (1)
Five Percent Holders:Brown Capital Management, LLC and The Brown Capital Management Small
Company Fund (3). . . . . . . . . . . . . . . . . . . . . . . . . . . . . . . . . . . . . . . . . . . . . . . . . . 3,778,289 16.8%Kayne Anderson Rudnick Investment Management, LLC (4). . . . . . . . . . . . . . . . . . 2,374,591 10.6%PRIMECAP Management Company (5) . . . . . . . . . . . . . . . . . . . . . . . . . . . . . . . . . . . 2,346,000 10.4%BlackRock, Inc. (6) . . . . . . . . . . . . . . . . . . . . . . . . . . . . . . . . . . . . . . . . . . . . . . . . . . . 2,051,260 9.1%The Vanguard Group, Inc. (7) . . . . . . . . . . . . . . . . . . . . . . . . . . . . . . . . . . . . . . . . . . . 1,690,931 7.5%Neuberger Berman Group LLC, Neuberger Berman Investment Advisers, LLC,
and Neuberger Berman Equity Funds (8) . . . . . . . . . . . . . . . . . . . . . . . . . . . . . . . . 1,681,017 7.5%Named Executive Officers: (2)Clinton H. Severson. . . . . . . . . . . . . . . . . . . . . . . . . . . . . . . . . . . . . . . . . . . . . . . . . . . 576,681 2.6%Alberto R. Santa Ines (9) . . . . . . . . . . . . . . . . . . . . . . . . . . . . . . . . . . . . . . . . . . . . . . 108,856 *Kenneth P. Aron, Ph.D. (10) . . . . . . . . . . . . . . . . . . . . . . . . . . . . . . . . . . . . . . . . . . . . 93,436 *Donald P. Wood . . . . . . . . . . . . . . . . . . . . . . . . . . . . . . . . . . . . . . . . . . . . . . . . . . . . . . 52,718 *Craig M. Tockman, DVM . . . . . . . . . . . . . . . . . . . . . . . . . . . . . . . . . . . . . . . . . . . . . . 2,486 *Ross Taylor . . . . . . . . . . . . . . . . . . . . . . . . . . . . . . . . . . . . . . . . . . . . . . . . . . . . . . . . . 950 *Outside Directors: (2)Richard J. Bastiani, Ph.D. (11) . . . . . . . . . . . . . . . . . . . . . . . . . . . . . . . . . . . . . . . . . . 56,700 *Prithipal Singh, Ph.D. . . . . . . . . . . . . . . . . . . . . . . . . . . . . . . . . . . . . . . . . . . . . . . . . . 45,000 *Michael D. Casey . . . . . . . . . . . . . . . . . . . . . . . . . . . . . . . . . . . . . . . . . . . . . . . . . . . . 23,200 *Vernon E. Altman . . . . . . . . . . . . . . . . . . . . . . . . . . . . . . . . . . . . . . . . . . . . . . . . . . . . 21,303 *Henk J. Evenhuis . . . . . . . . . . . . . . . . . . . . . . . . . . . . . . . . . . . . . . . . . . . . . . . . . . . . . 15,400 *Executive officers and directors as a group (11 persons)(12) . . . . . . . . . . . . . . . . 936,524 4.2%
* Less than one percent.
(1) The percentages shown in this column are calculated based on 22,500,069 shares of common stock outstandingon May 31, 2016 and include shares of common stock that such person or group had the right to acquire on orwithin sixty days after that date, including, but not limited to, upon the vesting of RSUs and PSUs.
(2) The business address of the beneficial owners listed is c/o Abaxis, Inc., 3240 Whipple Road, Union City, CA94587.
(3) Based on information set forth in a Schedule 13G/A filed with the SEC on February 16, 2016 by Brown CapitalManagement, LLC, reporting sole power to vote and dispose of 2,247,732 and 3,778,289 of the reported shares,respectively; and by The Brown Capital Management Small Company Fund, reporting sole power to vote anddispose of 1,729,152 of the reported shares. The Brown Capital Management Small Company Fund is aregistered investment company that is managed by Brown Capital Management, LLC, an investment adviser inaccordance with Rule 13d-1(b)(1)(ii)(E). All of the reported shares are owned by various investment advisoryclients of Brown Capital Management, LLC, which is deemed to be a beneficial owner of those shares pursuant
42
Abaxis, Inc. Form 10-K/A
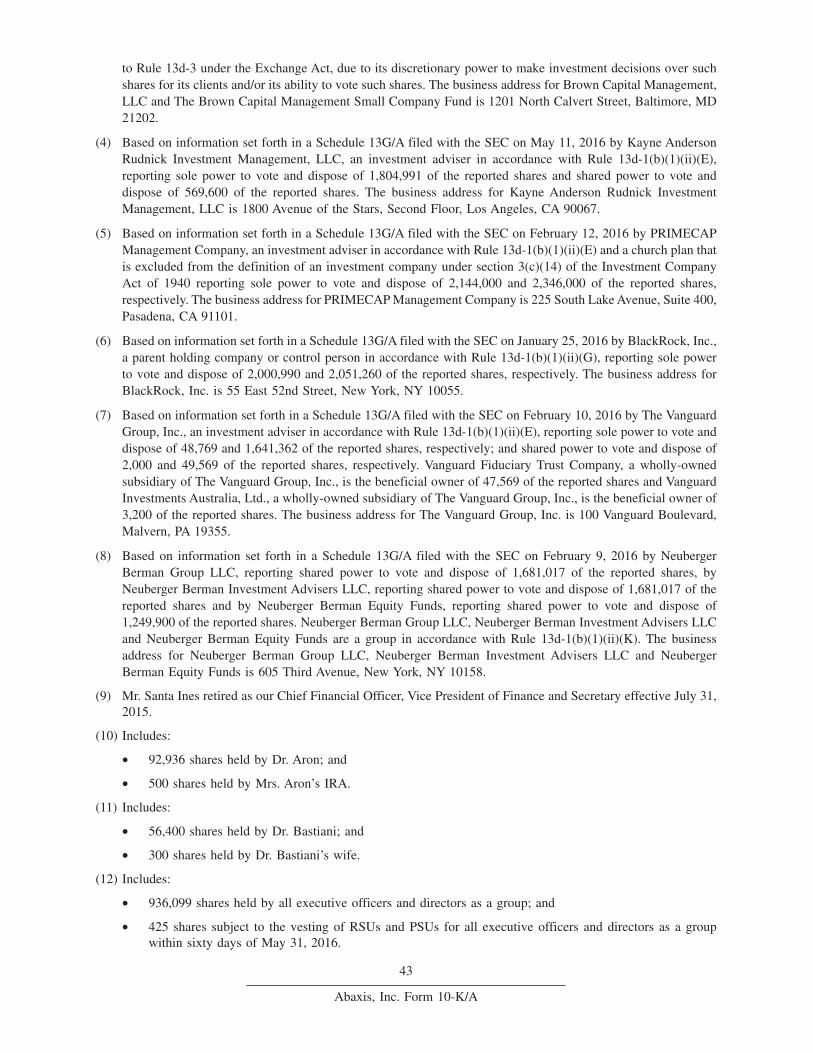
to Rule 13d-3 under the Exchange Act, due to its discretionary power to make investment decisions over suchshares for its clients and/or its ability to vote such shares. The business address for Brown Capital Management,LLC and The Brown Capital Management Small Company Fund is 1201 North Calvert Street, Baltimore, MD21202.
(4) Based on information set forth in a Schedule 13G/A filed with the SEC on May 11, 2016 by Kayne AndersonRudnick Investment Management, LLC, an investment adviser in accordance with Rule 13d-1(b)(1)(ii)(E),reporting sole power to vote and dispose of 1,804,991 of the reported shares and shared power to vote anddispose of 569,600 of the reported shares. The business address for Kayne Anderson Rudnick InvestmentManagement, LLC is 1800 Avenue of the Stars, Second Floor, Los Angeles, CA 90067.
(5) Based on information set forth in a Schedule 13G/A filed with the SEC on February 12, 2016 by PRIMECAPManagement Company, an investment adviser in accordance with Rule 13d-1(b)(1)(ii)(E) and a church plan thatis excluded from the definition of an investment company under section 3(c)(14) of the Investment CompanyAct of 1940 reporting sole power to vote and dispose of 2,144,000 and 2,346,000 of the reported shares,respectively. The business address for PRIMECAP Management Company is 225 South Lake Avenue, Suite 400,Pasadena, CA 91101.
(6) Based on information set forth in a Schedule 13G/A filed with the SEC on January 25, 2016 by BlackRock, Inc.,a parent holding company or control person in accordance with Rule 13d-1(b)(1)(ii)(G), reporting sole powerto vote and dispose of 2,000,990 and 2,051,260 of the reported shares, respectively. The business address forBlackRock, Inc. is 55 East 52nd Street, New York, NY 10055.
(7) Based on information set forth in a Schedule 13G/A filed with the SEC on February 10, 2016 by The VanguardGroup, Inc., an investment adviser in accordance with Rule 13d-1(b)(1)(ii)(E), reporting sole power to vote anddispose of 48,769 and 1,641,362 of the reported shares, respectively; and shared power to vote and dispose of2,000 and 49,569 of the reported shares, respectively. Vanguard Fiduciary Trust Company, a wholly-ownedsubsidiary of The Vanguard Group, Inc., is the beneficial owner of 47,569 of the reported shares and VanguardInvestments Australia, Ltd., a wholly-owned subsidiary of The Vanguard Group, Inc., is the beneficial owner of3,200 of the reported shares. The business address for The Vanguard Group, Inc. is 100 Vanguard Boulevard,Malvern, PA 19355.
(8) Based on information set forth in a Schedule 13G/A filed with the SEC on February 9, 2016 by NeubergerBerman Group LLC, reporting shared power to vote and dispose of 1,681,017 of the reported shares, byNeuberger Berman Investment Advisers LLC, reporting shared power to vote and dispose of 1,681,017 of thereported shares and by Neuberger Berman Equity Funds, reporting shared power to vote and dispose of1,249,900 of the reported shares. Neuberger Berman Group LLC, Neuberger Berman Investment Advisers LLCand Neuberger Berman Equity Funds are a group in accordance with Rule 13d-1(b)(1)(ii)(K). The businessaddress for Neuberger Berman Group LLC, Neuberger Berman Investment Advisers LLC and NeubergerBerman Equity Funds is 605 Third Avenue, New York, NY 10158.
(9) Mr. Santa Ines retired as our Chief Financial Officer, Vice President of Finance and Secretary effective July 31,2015.
(10) Includes:
• 92,936 shares held by Dr. Aron; and
• 500 shares held by Mrs. Aron’s IRA.
(11) Includes:
• 56,400 shares held by Dr. Bastiani; and
• 300 shares held by Dr. Bastiani’s wife.
(12) Includes:
• 936,099 shares held by all executive officers and directors as a group; and
• 425 shares subject to the vesting of RSUs and PSUs for all executive officers and directors as a groupwithin sixty days of May 31, 2016.
43
Abaxis, Inc. Form 10-K/A
Securities Authorized for Issuance Under Equity Compensation Plans
As of March 31, 2016, Abaxis had two equity incentive plans, the 2005 Plan and the 2014 Plan, under which ourequity securities are authorized for issuance to our employees, directors and consultants. Each of these plans wasapproved by our shareholders.
From time to time we issue warrants to purchase shares of our common stock to non-employees, such as serviceproviders and purchasers of our preferred stock. As of March 31, 2016, there were no warrants outstanding topurchase common stock.
The following table provides aggregate information as of March 31, 2016 regarding (i) outstanding unvested RSUsand PSUs and shares reserved under our equity compensation plans and (ii) outstanding warrants to purchase ourcommon stock.
Equity Compensation Plan Information
Plan Category
Number of Securitiesto be Issued Upon
Exercise ofOutstanding Options,Warrants and Rights
Weighted-AverageExercise Price of
Outstanding Options,Warrants and Rights
Number of SecuritiesRemaining Available forFuture Issuance UnderEquity Compensation
Plans (1)
Equity compensation plans approved by ourshareholders:Equity Incentive Plan (2). . . . . . . . . . . . . . . . . . . . . 834,644 $0.00(3) 678,825
Equity compensation plans not approved by ourshareholders:Warrants to purchase common stock . . . . . . . . . . . — $ — —
Total: . . . . . . . . . . . . . . . . . . . . . . . . . . . . . . . . . . . . . . 834,644 $0.00(3) 678,825
(1) The shares are available for award grant purposes under the 2014 Plan and exclude shares listed under thecolumn ‘‘Number of Securities to be Issued Upon Exercise of Outstanding Options, Warrants and Rights.’’
(2) The 2014 Plan, which was approved by our shareholders on October 22, 2014, is the successor to andcontinuation of the 2005 Plan.
(3) Represents outstanding and unvested RSU and PSU awards for which there is no exercise price.
Item 13. Certain Relationships and Related Transactions, and Director Independence
Certain Relationships and Related Transactions
During the fiscal year ended March 31, 2016, there was not, nor is there any currently proposed transaction or seriesof similar transactions to which Abaxis was or is to be a party in which the amount involved exceeded or exceeds$120,000 and in which any executive officer, director or holder of more than 5% of any class of voting securities ofAbaxis and members of that person’s immediate family had, has or will have a direct or indirect material interest,other than as set forth in ‘‘Executive Compensation’’ and ‘‘Director Compensation’’ above and in ‘‘Related PersonTransaction Policy and Procedures’’ below.
Indemnification Agreements
We generally enter into indemnity agreements with our directors and executive officers. These indemnity agreementsrequire us to indemnify these individuals to the fullest extent permitted by law.
Related-Person Transactions Policy and Procedures
We have adopted a written policy that our executive officers, directors, nominees for election as a director, beneficialowners of more than 5% of any class of our common stock, any members of the immediate family of any of theforegoing persons and any firm, corporation or other entity in which any of the foregoing persons is an executivepartner or principal or which such person has a 5% or greater beneficial ownership interest (each a ‘‘RelatedPerson’’), are not permitted to enter into a transaction with us without the prior consent of the Audit Committee. Any
44
Abaxis, Inc. Form 10-K/A
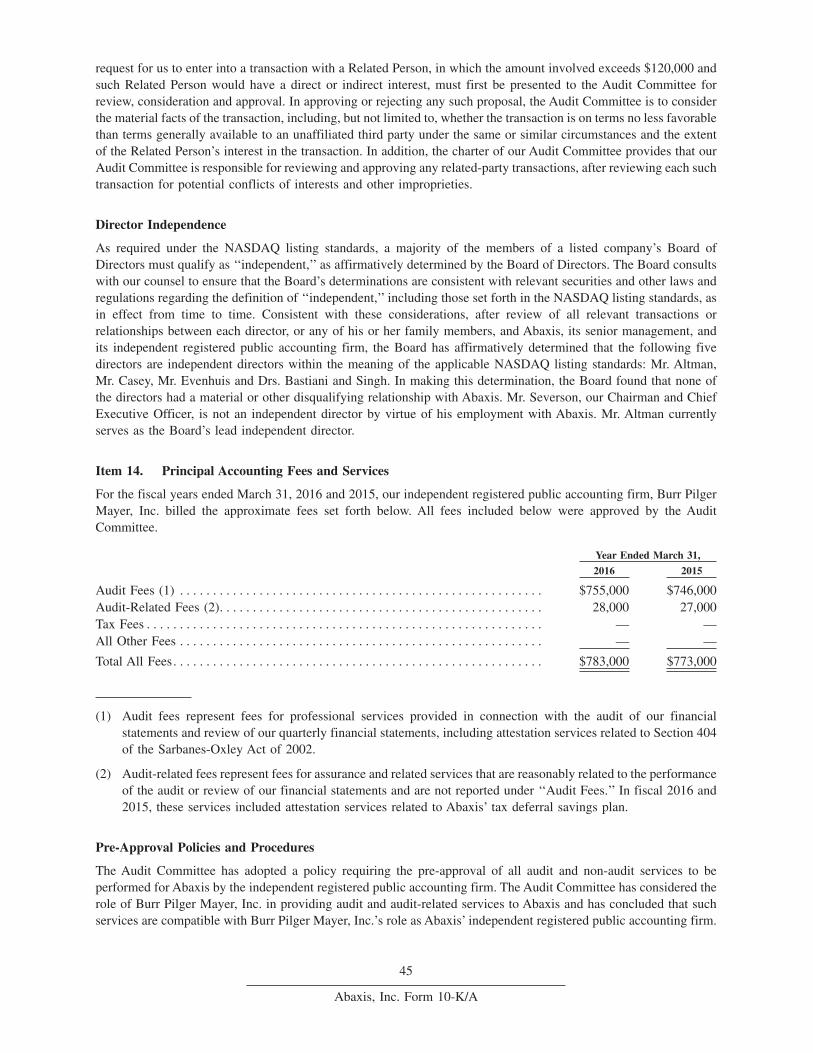
request for us to enter into a transaction with a Related Person, in which the amount involved exceeds $120,000 andsuch Related Person would have a direct or indirect interest, must first be presented to the Audit Committee forreview, consideration and approval. In approving or rejecting any such proposal, the Audit Committee is to considerthe material facts of the transaction, including, but not limited to, whether the transaction is on terms no less favorablethan terms generally available to an unaffiliated third party under the same or similar circumstances and the extentof the Related Person’s interest in the transaction. In addition, the charter of our Audit Committee provides that ourAudit Committee is responsible for reviewing and approving any related-party transactions, after reviewing each suchtransaction for potential conflicts of interests and other improprieties.
Director Independence
As required under the NASDAQ listing standards, a majority of the members of a listed company’s Board ofDirectors must qualify as ‘‘independent,’’ as affirmatively determined by the Board of Directors. The Board consultswith our counsel to ensure that the Board’s determinations are consistent with relevant securities and other laws andregulations regarding the definition of ‘‘independent,’’ including those set forth in the NASDAQ listing standards, asin effect from time to time. Consistent with these considerations, after review of all relevant transactions orrelationships between each director, or any of his or her family members, and Abaxis, its senior management, andits independent registered public accounting firm, the Board has affirmatively determined that the following fivedirectors are independent directors within the meaning of the applicable NASDAQ listing standards: Mr. Altman,Mr. Casey, Mr. Evenhuis and Drs. Bastiani and Singh. In making this determination, the Board found that none ofthe directors had a material or other disqualifying relationship with Abaxis. Mr. Severson, our Chairman and ChiefExecutive Officer, is not an independent director by virtue of his employment with Abaxis. Mr. Altman currentlyserves as the Board’s lead independent director.
Item 14. Principal Accounting Fees and Services
For the fiscal years ended March 31, 2016 and 2015, our independent registered public accounting firm, Burr PilgerMayer, Inc. billed the approximate fees set forth below. All fees included below were approved by the AuditCommittee.
Year Ended March 31,
2016 2015
Audit Fees (1) . . . . . . . . . . . . . . . . . . . . . . . . . . . . . . . . . . . . . . . . . . . . . . . . . . . . . . . $755,000 $746,000Audit-Related Fees (2). . . . . . . . . . . . . . . . . . . . . . . . . . . . . . . . . . . . . . . . . . . . . . . . . 28,000 27,000Tax Fees . . . . . . . . . . . . . . . . . . . . . . . . . . . . . . . . . . . . . . . . . . . . . . . . . . . . . . . . . . . . — —All Other Fees . . . . . . . . . . . . . . . . . . . . . . . . . . . . . . . . . . . . . . . . . . . . . . . . . . . . . . . — —
Total All Fees. . . . . . . . . . . . . . . . . . . . . . . . . . . . . . . . . . . . . . . . . . . . . . . . . . . . . . . . $783,000 $773,000
(1) Audit fees represent fees for professional services provided in connection with the audit of our financialstatements and review of our quarterly financial statements, including attestation services related to Section 404of the Sarbanes-Oxley Act of 2002.
(2) Audit-related fees represent fees for assurance and related services that are reasonably related to the performanceof the audit or review of our financial statements and are not reported under ‘‘Audit Fees.’’ In fiscal 2016 and2015, these services included attestation services related to Abaxis’ tax deferral savings plan.
Pre-Approval Policies and Procedures
The Audit Committee has adopted a policy requiring the pre-approval of all audit and non-audit services to beperformed for Abaxis by the independent registered public accounting firm. The Audit Committee has considered therole of Burr Pilger Mayer, Inc. in providing audit and audit-related services to Abaxis and has concluded that suchservices are compatible with Burr Pilger Mayer, Inc.’s role as Abaxis’ independent registered public accounting firm.
45
Abaxis, Inc. Form 10-K/A
PART IV
Item 15. Exhibits and Financial Statement Schedules
(a) The following financial statements, schedules and exhibits are filed as part of this report:
1. Financial Statements - The Financial Statements required by this item are listed on the Index to ConsolidatedFinancial Statements in Part II, Item 8 of the Original 10-K.
2. Financial Statement Schedules –
• Schedule II – Valuation and Qualifying Accounts and Reserves is included in the Original 10-K.
• Other financial statement schedules are not included because they are not required or the information isotherwise shown in the consolidated financial statements or notes thereto.
3. Exhibits - The exhibits listed on the accompanying Exhibit Index are filed as part of, or are incorporated byreference into, this report.
(b) See Item 15(a)(3) above.
(c) See Item 15(a)(2) above.
46
Abaxis, Inc. Form 10-K/A
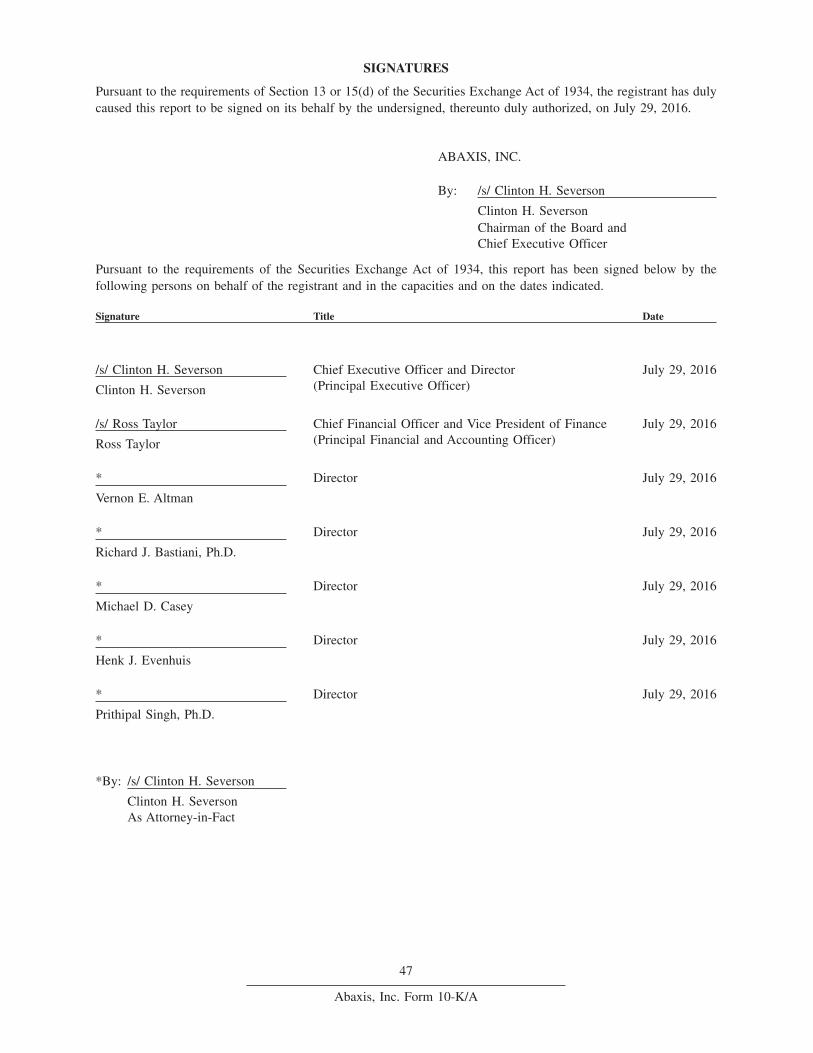
SIGNATURES
Pursuant to the requirements of Section 13 or 15(d) of the Securities Exchange Act of 1934, the registrant has dulycaused this report to be signed on its behalf by the undersigned, thereunto duly authorized, on July 29, 2016.
ABAXIS, INC.
By: /s/ Clinton H. Severson
Clinton H. SeversonChairman of the Board andChief Executive Officer
Pursuant to the requirements of the Securities Exchange Act of 1934, this report has been signed below by thefollowing persons on behalf of the registrant and in the capacities and on the dates indicated.
Signature Title Date
/s/ Clinton H. Severson Chief Executive Officer and Director(Principal Executive Officer)
July 29, 2016
Clinton H. Severson
/s/ Ross Taylor Chief Financial Officer and Vice President of Finance(Principal Financial and Accounting Officer)
July 29, 2016
Ross Taylor
* Director July 29, 2016
Vernon E. Altman
* Director July 29, 2016
Richard J. Bastiani, Ph.D.
* Director July 29, 2016
Michael D. Casey
* Director July 29, 2016
Henk J. Evenhuis
* Director July 29, 2016
Prithipal Singh, Ph.D.
*By: /s/ Clinton H. Severson
Clinton H. SeversonAs Attorney-in-Fact
47
Abaxis, Inc. Form 10-K/A
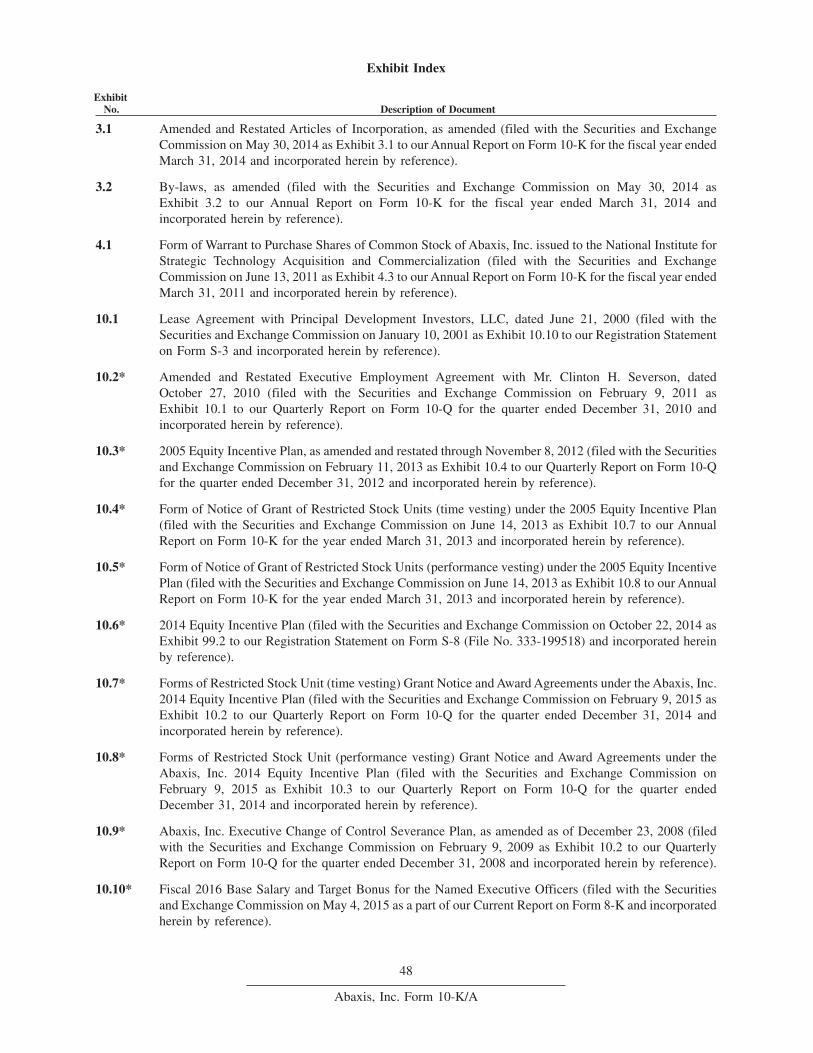
Exhibit Index
ExhibitNo. Description of Document
3.1 Amended and Restated Articles of Incorporation, as amended (filed with the Securities and ExchangeCommission on May 30, 2014 as Exhibit 3.1 to our Annual Report on Form 10-K for the fiscal year endedMarch 31, 2014 and incorporated herein by reference).
3.2 By-laws, as amended (filed with the Securities and Exchange Commission on May 30, 2014 asExhibit 3.2 to our Annual Report on Form 10-K for the fiscal year ended March 31, 2014 andincorporated herein by reference).
4.1 Form of Warrant to Purchase Shares of Common Stock of Abaxis, Inc. issued to the National Institute forStrategic Technology Acquisition and Commercialization (filed with the Securities and ExchangeCommission on June 13, 2011 as Exhibit 4.3 to our Annual Report on Form 10-K for the fiscal year endedMarch 31, 2011 and incorporated herein by reference).
10.1 Lease Agreement with Principal Development Investors, LLC, dated June 21, 2000 (filed with theSecurities and Exchange Commission on January 10, 2001 as Exhibit 10.10 to our Registration Statementon Form S-3 and incorporated herein by reference).
10.2* Amended and Restated Executive Employment Agreement with Mr. Clinton H. Severson, datedOctober 27, 2010 (filed with the Securities and Exchange Commission on February 9, 2011 asExhibit 10.1 to our Quarterly Report on Form 10-Q for the quarter ended December 31, 2010 andincorporated herein by reference).
10.3* 2005 Equity Incentive Plan, as amended and restated through November 8, 2012 (filed with the Securitiesand Exchange Commission on February 11, 2013 as Exhibit 10.4 to our Quarterly Report on Form 10-Qfor the quarter ended December 31, 2012 and incorporated herein by reference).
10.4* Form of Notice of Grant of Restricted Stock Units (time vesting) under the 2005 Equity Incentive Plan(filed with the Securities and Exchange Commission on June 14, 2013 as Exhibit 10.7 to our AnnualReport on Form 10-K for the year ended March 31, 2013 and incorporated herein by reference).
10.5* Form of Notice of Grant of Restricted Stock Units (performance vesting) under the 2005 Equity IncentivePlan (filed with the Securities and Exchange Commission on June 14, 2013 as Exhibit 10.8 to our AnnualReport on Form 10-K for the year ended March 31, 2013 and incorporated herein by reference).
10.6* 2014 Equity Incentive Plan (filed with the Securities and Exchange Commission on October 22, 2014 asExhibit 99.2 to our Registration Statement on Form S-8 (File No. 333-199518) and incorporated hereinby reference).
10.7* Forms of Restricted Stock Unit (time vesting) Grant Notice and Award Agreements under the Abaxis, Inc.2014 Equity Incentive Plan (filed with the Securities and Exchange Commission on February 9, 2015 asExhibit 10.2 to our Quarterly Report on Form 10-Q for the quarter ended December 31, 2014 andincorporated herein by reference).
10.8* Forms of Restricted Stock Unit (performance vesting) Grant Notice and Award Agreements under theAbaxis, Inc. 2014 Equity Incentive Plan (filed with the Securities and Exchange Commission onFebruary 9, 2015 as Exhibit 10.3 to our Quarterly Report on Form 10-Q for the quarter endedDecember 31, 2014 and incorporated herein by reference).
10.9* Abaxis, Inc. Executive Change of Control Severance Plan, as amended as of December 23, 2008 (filedwith the Securities and Exchange Commission on February 9, 2009 as Exhibit 10.2 to our QuarterlyReport on Form 10-Q for the quarter ended December 31, 2008 and incorporated herein by reference).
10.10* Fiscal 2016 Base Salary and Target Bonus for the Named Executive Officers (filed with the Securitiesand Exchange Commission on May 4, 2015 as a part of our Current Report on Form 8-K and incorporatedherein by reference).
48
Abaxis, Inc. Form 10-K/A

ExhibitNo. Description of Document
10.11* Form of Indemnity Agreement entered into by Abaxis, Inc. with each of its directors and executiveofficers (filed with the Securities and Exchange Commission on June 13, 2008 as Exhibit 10.22 to ourAnnual Report on Form 10-K for the fiscal year ended March 31, 2008 and incorporated herein byreference).
10.12* Transition Agreement between Abaxis, Inc. and Alberto Santa Ines, dated May 1, 2015 (filed with theSecurities and Exchange Commission on May 4, 2015 as Exhibit 99.1 to our Current Report on Form 8-Kand incorporated herein by reference).
10.13* Offer Letter Agreement between Abaxis, Inc. and Dean Ross Taylor, dated April 29, 2015 (filed with theSecurities and Exchange Commission on May 4, 2015 as Exhibit 99.2 to our Current Report on Form 8-Kand incorporated herein by reference).
10.14* Transition Agreement between Abaxis, Inc. and Vladimir E. Ostoich, Ph.D., dated August 15, 2014 (filedwith the Securities and Exchange Commission on August 21, 2014 as Exhibit 10.1 to our Current Reporton Form 8-K and incorporated by reference).
10.15* Executive Employment Agreement, dated as of May 1, 2014, with Craig M. Tockman (filed with theSecurities and Exchange Commission on August 11, 2014 as Exhibit 10.1 to our Quarterly Report onForm 10-K for the quarter ended June 30, 2014 and incorporated herein by reference).
10.16 First Amendment to Lease Agreement with Principal Development Investors, LLC, dated as ofAugust 28, 2000 (filed with the Securities and Exchange Commission on June 14, 2010 as Exhibit 10.23to our Annual Report on Form 10-K for the fiscal year ended March 31, 2010 and incorporated hereinby reference).
10.17 Second Amendment to Lease Agreement with Principal Development Investors, LLC, dated as ofNovember 20, 2000 (filed with the Securities and Exchange Commission on June 14, 2010 asExhibit 10.24 with our Annual Report on Form 10-K for the fiscal year ended March 31, 2010 andincorporated herein by reference).
10.18 Third Amendment to Lease Agreement with Crossroads Technology Partners and Nearon Crossroads,LLC, as successors in interest to Principal Development Investors, LLC, dated as of April 10, 2002 (filedwith the Securities and Exchange Commission on June 14, 2010 as Exhibit 10.25 to our Annual Reporton Form 10-K for the fiscal year ended March 31, 2010 and incorporated herein by reference).
10.19 Fourth Amendment to Lease Agreement with Whipple Road Holdings, LLC, SFP Crossroads, LLC andWoodstock Bowers, LLC, dated March 11, 2010 (filed with the Securities and Exchange Commission onJune 14, 2010 as Exhibit 10.26 to our Annual Report on Form 10-K for the fiscal year ended March 31,2010 and incorporated herein by reference).
10.20+ Exclusive Agreement, dated October 26, 2012, by and between Abaxis, Inc. and Abbott Point of Care,Inc. (filed with the Securities and Exchange Commission on July 2, 2013 as Exhibit 10.1 to theAmendment to our Quarterly Report on Form 10-Q for the quarter ended December 31, 2012 andincorporated herein by reference).
10.21 Non-Exclusive Distributor Agreement, dated as of September 28, 2012, by and between MWI VeterinarySupply, Inc. (‘‘MWI’’) and Abaxis, Inc. (filed with the Securities and Exchange Commission onNovember 27, 2012 as Exhibit 10.27 to MWI’s Annual Report on Form 10-K for the fiscal year endedSeptember 30, 2012 and incorporated herein by reference).
10.22 Amendment to Exclusive Agreement between Abaxis, Inc. and Abbott Point of Care Inc., datedSeptember 30, 2013 (filed with the Securities and Exchange Commission on November 12, 2013 asExhibit 10.1 to our Quarterly Report on Form 10-Q for the quarter ended September 30, 2013 andincorporated herein by reference).
49
Abaxis, Inc. Form 10-K/A
ExhibitNo. Description of Document
10.23+ Asset Purchase Agreement, dated as of March 19, 2015, between Antech Diagnostics, Inc. and Abaxis,Inc. (filed with the Securities and Exchange Commission on June 1, 2015 as Exhibit 10.25 to our AnnualReport on Form 10-K for the year ended March 31, 2015 and incorporated herein by reference).
10.24* Service Agreement between Abaxis Europe GmbH, Abaxis, Inc. and Achim Henkel, dated May 30, 2008(filed with the Securities and Exchange Commission on July 29, 2015 as Exhibit 10.26 to AmendmentNo. 1 to our Annual Report on Form 10-K/A for the year ended March 31, 2015 and incorporated hereinby reference).
10.25 Fifth Amendment to Lease Agreement, dated as of December 17, 2015, among Abaxis, Inc. and WhippleRoad Holdings, LLC, SFP Crossroads, LLC and Woodstock Bowers, LLC (filed with the Securities andExchange Commission on February 9, 2016 as Exhibit 10.1 to our Quarterly Report on Form 10-Q forthe quarter ended December 31, 2015 and incorporated herein by reference).
10.26* Fiscal 2017 Base Salary and Target Bonus for the Named Executive Officers (filed with the Securitiesand Exchange Commission on April 28, 2016 as a part of our Current Report on Form 8-K andincorporated herein by reference).
10.27+ Distribution Agreement, dated as of October 1, 2014, between Patterson Management, LP and Abaxis,Inc. (filed with the Securities and Exchange Commission on May 31, 2016 as Exhibit 10.27 to theOriginal 10-K and incorporated herein by reference).
21.1 Subsidiaries of Abaxis, Inc. (filed with the Securities and Exchange Commission on May 31, 2016 asExhibit 21.1 to the Original 10-K and incorporated herein by reference).
23.1 Consent of Burr Pilger Mayer, Inc., Independent Registered Public Accounting Firm (filed with theSecurities and Exchange Commission on May 31, 2016 as Exhibit 23.1 to the Original 10-K andincorporated herein by reference).
24.1 Power of Attorney (included on the Signature Page to the Original 10-K and incorporated herein byreference).
31.1 Certification of Chief Executive Officer pursuant to Section 302 of the Sarbanes-Oxley Act of 2002 (filedwith the Securities and Exchange Commission on May 31, 2016 as Exhibit 31.1 to the Original 10-K andincorporated herein by reference).
31.2 Certification of Chief Financial Officer pursuant to Section 302 of the Sarbanes-Oxley Act of 2002 (filedwith the Securities and Exchange Commission on May 31, 2016 as Exhibit 31.2 to the Original 10-K andincorporated herein by reference).
31.3 Certification of Chief Executive Officer pursuant to Section 302 of the Sarbanes-Oxley Act of 2002
31.4 Certification of Chief Financial Officer pursuant to Section 302 of the Sarbanes-Oxley Act of 2002
32.1# Certification of Chief Executive Officer pursuant to Section 906 of the Sarbanes-Oxley Act of 2002.(filed with the Securities and Exchange Commission on May 31, 2016 as Exhibit 32.1 to the Original10-K and incorporated herein by reference).
32.2# Certification of Chief Financial Officer pursuant to Section 906 of the Sarbanes-Oxley Act of 2002. (filedwith the Securities and Exchange Commission on May 31, 2016 as Exhibit 32.2 to the Original 10-K andincorporated herein by reference).
101.INS XBRL Instance Document (filed with the Securities and Exchange Commission on May 31, 2016 asExhibit 101.INS to the Original 10-K and incorporated herein by reference).
101.SCH XBRL Taxonomy Extension Schema Document (filed with the Securities and Exchange Commission onMay 31, 2016 as Exhibit 101.SCH to the Original 10-K and incorporated herein by reference).
50
Abaxis, Inc. Form 10-K/A
ExhibitNo. Description of Document
101.CAL XBRL Taxonomy Extension Calculation Linkbase Document (filed with the Securities and ExchangeCommission on May 31, 2016 as Exhibit 101.CAL to the Original 10-K and incorporated herein byreference).
101.LAB XBRL Taxonomy Extension Labels Linkbase Document (filed with the Securities and ExchangeCommission on May 31, 2016 as Exhibit 101.LAB to the Original 10-K and incorporated herein byreference).
101.PRE XBRL Taxonomy Extension Presentation Linkbase Document (filed with the Securities and ExchangeCommission on May 31, 2016 as Exhibit 101.PRE to the Original 10-K and incorporated herein byreference).
101.DEF XBRL Taxonomy Extension Definition Linkbase Document (filed with the Securities and ExchangeCommission on May 31, 2016 as Exhibit 101.DEF to the Original 10-K and incorporated herein byreference).
+ Confidential treatment of certain portions of this agreement has been granted by the Securities and ExchangeCommission.
* Management contract or compensatory plan or arrangement.
# This certification is not deemed filed with the Securities and Exchange Commission and is not to be incorporatedby reference into any filing of the Registrant under the Securities Act of 1933, as amended, or the SecuritiesExchange Act of 1934, as amended (whether made before or after the date of the Form 10-K), irrespective ofany general incorporation language contained in such filing.
51
Abaxis, Inc. Form 10-K/A

[THIS PAGE INTENTIONALLY LEFT BLANK]
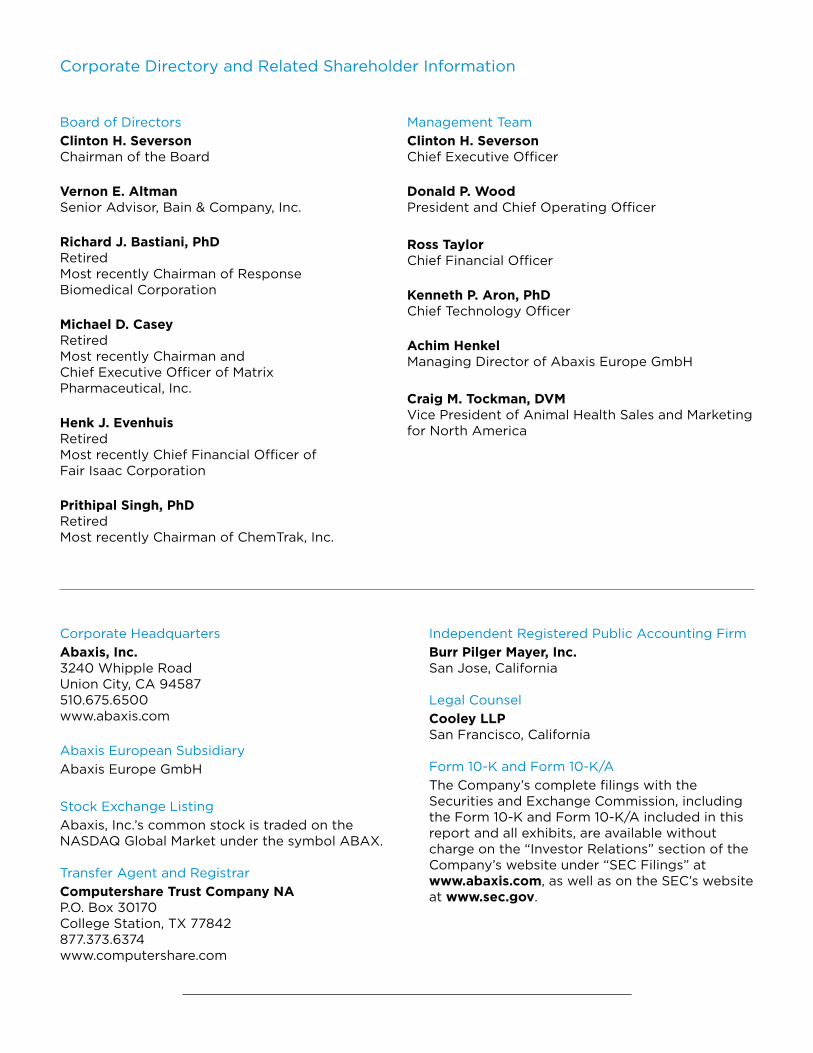
ABAXIS ANNUAL REPORT 2016 | 7
Board of Directors
Clinton H. SeversonChairman of the Board
Vernon E. AltmanSenior Advisor, Bain & Company, Inc.
Richard J. Bastiani, PhDRetiredMost recently Chairman of Response Biomedical Corporation
Michael D. CaseyRetiredMost recently Chairman andChief Executive Officer of MatrixPharmaceutical, Inc.
Henk J. EvenhuisRetiredMost recently Chief Financial Officer of Fair Isaac Corporation
Prithipal Singh, PhDRetiredMost recently Chairman of ChemTrak, Inc.
Corporate Directory and Related Shareholder Information
Corporate Headquarters
Abaxis, Inc.3240 Whipple RoadUnion City, CA 94587510.675.6500www.abaxis.com
Abaxis European Subsidiary
Abaxis Europe GmbH
Stock Exchange Listing
Abaxis, Inc.’s common stock is traded on the NASDAQ Global Market under the symbol ABAX.
Transfer Agent and Registrar
Computershare Trust Company NAP.O. Box 30170College Station, TX 77842877.373.6374www.computershare.com
Management Team
Clinton H. SeversonChief Executive Officer
Donald P. WoodPresident and Chief Operating Officer
Ross TaylorChief Financial Officer
Kenneth P. Aron, PhDChief Technology Officer
Achim HenkelManaging Director of Abaxis Europe GmbH
Craig M. Tockman, DVMVice President of Animal Health Sales and Marketing for North America
Independent Registered Public Accounting Firm
Burr Pilger Mayer, Inc.San Jose, California
Legal Counsel
Cooley LLPSan Francisco, California
Form 10-K and Form 10-K/A
The Company’s complete filings with the Securities and Exchange Commission, including the Form 10-K and Form 10-K/A included in this report and all exhibits, are available without charge on the “Investor Relations” section of the Company’s website under “SEC Filings” at www.abaxis.com, as well as on the SEC’s website at www.sec.gov.

Abaxis, VetScan, and Piccolo are registered trademarks of Abaxis, Inc. All other brands or product names are trademarks of their respective holders. Printed in U.S.A. © Abaxis 2016. All rights reserved.
GLOBAL DIAGNOSTICS
Abaxis, Inc.
3240 Whipple Road Union City, CA 94587
www.abaxis.com
GLOBAL DIAGNOSTICS
Abaxis Europe GmbH
Bunsenstrasse 9-1164347 GriesheimGermany
002CSN6F95