Embed Size (px)
Citation preview

2 0 1 4 A n n u A l R e p o R t
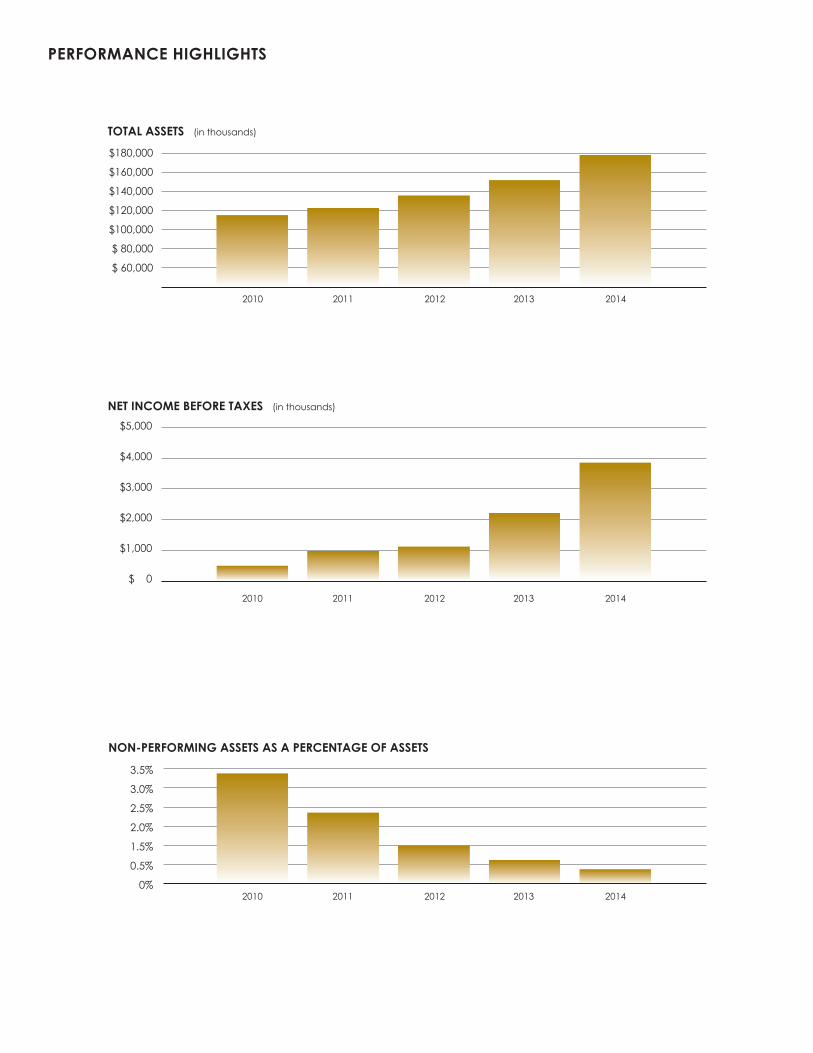
PERFORMANCE HIGHLIGHTS
$180,000
$160,000
$140,000
$120,000
$100,000
$ 80,000
$ 60,000
2010 2011 2012 2013 2014
TOTAL ASSETS (in thousands)
NON-PERFORMING ASSETS AS A PERCENTAGE OF ASSETS
3.5%
3.0%
2.5%
2.0%
1.5%
0.5%
0% 2010 2011 2012 2013 2014
NET INCOME BEFORE TAXES (in thousands)
$5,000
$4,000
$3,000
$2,000
$1,000
$ 0
2010 2011 2012 2013 2014
CONTENTS
LETTER TO SHAREHOLDERS .....................................................................................3
INDEPENDENT AUDITOR’S REPORT ........................................................................4
BALANCE SHEETS ....................................................................................................5
STATEMENTS OF INCOME .......................................................................................6
STATEMENTS OF COMPREHENSIVE INCOME ........................................................7
STATEMENTS OF CHANGES IN STOCKHOLDERS’ EQUITY .....................................8
STATEMENTS OF CASH FLOWS ...............................................................................9
NOTES TO FINANCIAL STATEMENTS .......................................................................10
BOARD OF DIRECTORS ...........................................................................................28
CORPORATE & INVESTOR INFORMATION .............................................................29

March 23, 2015
To our Fellow Owners:
2014 was a great year thanks to the dedication of our team members working together towards a common vision: to help our clients achieve their financial goals and succeed personally and professionally. This commitment to our clients resulted in another record year. We are in the top 10% of our peer group in the key measures of Return on Equity and Return on Assets and have produced eight straight quarters of double-digit loan growth. These types of accomplishments only happen by having the right people who work together to fulfill our clients’ banking goals. We provide sound advice and the financial solutions that they want, when they want them.
We have said we are a bank for high achievers, entrepreneurs, and dreamers – our colleagues and directors share that enthusiasm and spirit. This entrepreneurial DNA, and our focus on serving clients, drove outstanding financial results. Earnings for the fiscal year 2014 were $2.4 million up 67% compared to $1.4 million in 2013. Return on Average Assets and Return on Average Equity were 1.4% and 15.5%, respectively. Loans for the year were up 25% over last year. Deposits also increased 18% over the previous year. At the same time, credit quality improved as we continue to hold very low levels of nonperforming assets.
The Small Business Administration (SBA) loan initiative we implemented in May of 2014 ended the year ahead of plan. We are pleased to report that our small ticket equipment financing program continues to operate above forecasted levels in both profitability and credit quality. The Bank reported an increase in Total Capital from $15.6 million to $18.8 million during the year. We were also delighted to be in a position to offer a 2-for-1 stock dividend last April, providing additional liquidity for shareholders.
Summit Bank embraces the critical role we play in our client’s lives and in the community. We accomplished this while keeping our deposits safe, which is reflected in earning one of the highest safety ratings from an independent third-party. We lend responsibly and fairly to local businesses and professionals and we participate in a number of nonprofit organizations throughout our community. We continue to be proud of our position as the only community bank headquartered in Eugene/Springfield dedicated to serving the clients of this area. The vast majority of the deposits held at Summit are invested in loans to our neighbors and community businesses here in Eugene/Springfield.
This February, the Board unanimously approved Mr. Ross Kari to our Board of Directors. Mr. Kari who most recently served as chief financial officer of Freddie Mac, brings a global financial perspective that will help guide our Bank as we continue to grow. Previously, Mr. Kari served as the chief financial officer of Safeco and Wells Fargo Bank.
Included with the proxy this year, is our recommendation to approve a new 10-year Stock Option and Executive Compensation Plan. The original plan adopted during the formation of the bank has expired. This is a very important element of compensation for Summit Bank, allowing us to entice and retain top talent. We encourage you to vote in favor of the plan and return your proxy ballot.
2015 will no doubt provide opportunities and challenges; however, we feel we have the right team to face challenges head-on and take advantage of opportunities as they arise. Again, we want to thank all of our clients, board members, colleagues, community members and shareholders for making 2014 an outstanding year.
Sincerely,
R. Paul Weinhold Craig A. WanichekBoard Chair President and CEO
LETTER TO SHAREHOLDERS
3
11976 Garden Ave., Eugene, OR 97403 541-342-5161 www.islercpa.com
Independent Auditor’s Report
To the Board of Directors Summit Bank:
Report on the Financial Statements We have audited the financial statements of Summit Bank (the “Bank”) which comprise the balance sheets as of December 31, 2014 and 2013, and the related statements of income, comprehensive income, changes in stockholders’ equity, and cash flows for the years then ended, and the related notes to the financial statements.
Management’s Responsibility for the Financial Statements Management is responsible for the preparation and fair presentation of these financial statements in accordance with accounting principles generally accepted in the United States of America; this includes the design, implementation, and maintenance of internal control relevant to the preparation and fair presentation of financial statements that are free from material misstatement, whether due to fraud or error.
Auditor’s Responsibility Our responsibility is to express an opinion on these financial statements based on our audits. We conducted our audits in accordance with auditing standards generally accepted in the United States of America. Those standards require that we plan and perform the audit to obtain reasonable assurance about whether the financial statements are free of material misstatement.
An audit involves performing procedures to obtain audit evidence about the amounts and disclosures in the financial statements. The procedures selected depend on the auditor’s judgment, including the assessment of the risks of material misstatement of the financial statements, whether due to fraud or error. In making those risk assessments, the auditor considers internal control relevant to the entity’s preparation and fair presentation of the financial statements in order to design audit procedures that are appropriate in the circumstances but not for the purpose of expressing an opinion on the effectiveness of the entity’s internal control. Accordingly, we express no such opinion. An audit also includes evaluating the appropriateness of accounting policies used and the reasonableness of significant accounting estimates made by management, as well as evaluating the overall presentation of the financial statements.
We believe that the audit evidence we have obtained is sufficient and appropriate to provide a basis for our audit opinion.
OpinionIn our opinion, the financial statements referred to above present fairly, in all material respects, the financial position of the Bank as of December 31, 2014 and 2013, and the results of its operations and its cash flows for the years then ended in accordance with accounting principles generally accepted in the United States of America.
March 6, 2015
INDEPENDENT AUDITOR’S REPORT
4
The Federal Deposit Insurance Corporation has not reviewed the financial and related data in this statement for accuracy or relevance.
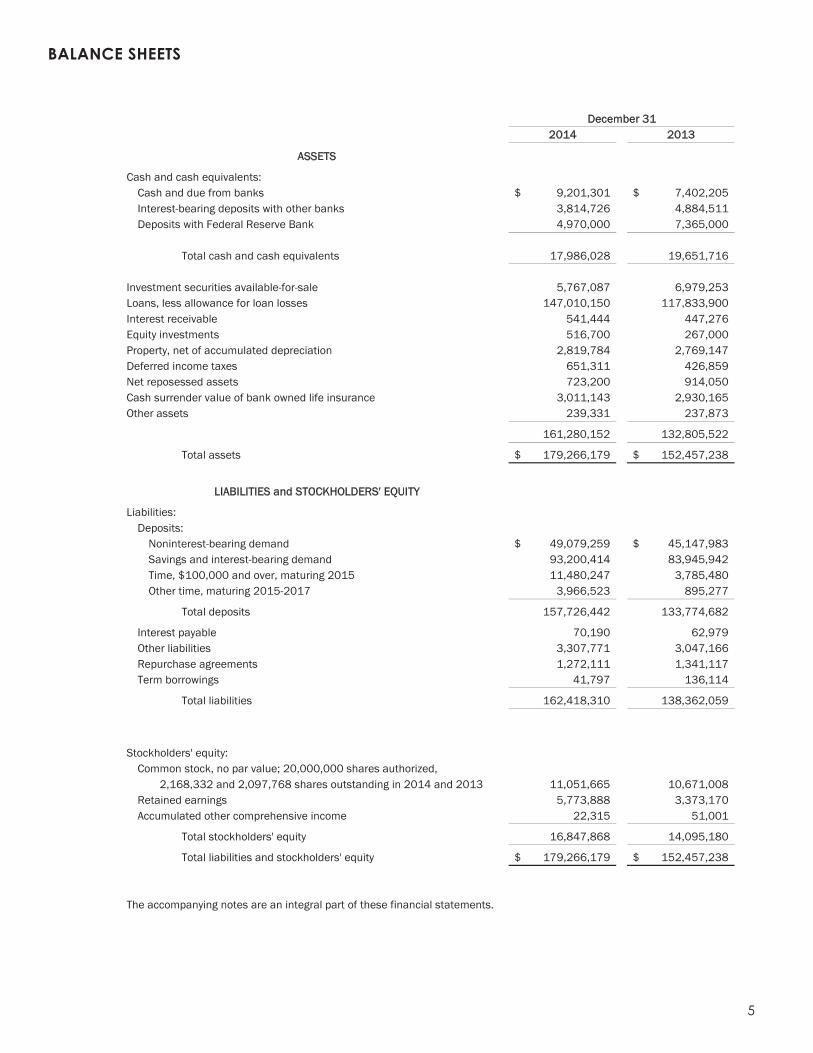
BALANCE SHEETS
5
2
BALANCE SHEETS
2014 2013
Cash and cash equivalents:Cash and due from banks 9,201,301$ 7,402,205$ Interest-bearing deposits with other banks 3,814,726 4,884,511 Deposits with Federal Reserve Bank 4,970,000 7,365,000
Total cash and cash equivalents 17,986,028 19,651,716
Investment securities available-for-sale 5,767,087 6,979,253 Loans, less allowance for loan losses 147,010,150 117,833,900 Interest receivable 541,444 447,276 Equity investments 516,700 267,000 Property, net of accumulated depreciation 2,819,784 2,769,147 Deferred income taxes 651,311 426,859 Net reposessed assets 723,200 914,050 Cash surrender value of bank owned life insurance 3,011,143 2,930,165 Other assets 239,331 237,873
161,280,152 132,805,522
Total assets 179,266,179$ 152,457,238$
Liabilities:Deposits:
Noninterest-bearing demand 49,079,259$ 45,147,983$ Savings and interest-bearing demand 93,200,414 83,945,942 Time, $100,000 and over, maturing 2015 11,480,247 3,785,480 Other time, maturing 2015-2017 3,966,523 895,277
Total deposits 157,726,442 133,774,682
Interest payable 70,190 62,979 Other liabilities 3,307,771 3,047,166 Repurchase agreements 1,272,111 1,341,117 Term borrowings 41,797 136,114
Total liabilities 162,418,310 138,362,059
Stockholders' equity:Common stock, no par value; 20,000,000 shares authorized,
2,168,332 and 2,097,768 shares outstanding in 2014 and 2013 11,051,665 10,671,008 Retained earnings 5,773,888 3,373,170 Accumulated other comprehensive income 22,315 51,001
Total stockholders' equity 16,847,868 14,095,180
Total liabilities and stockholders' equity 179,266,179$ 152,457,238$
The accompanying notes are an integral part of these financial statements.
ASSETS
LIABILITIES and STOCKHOLDERS' EQUITY
December 31
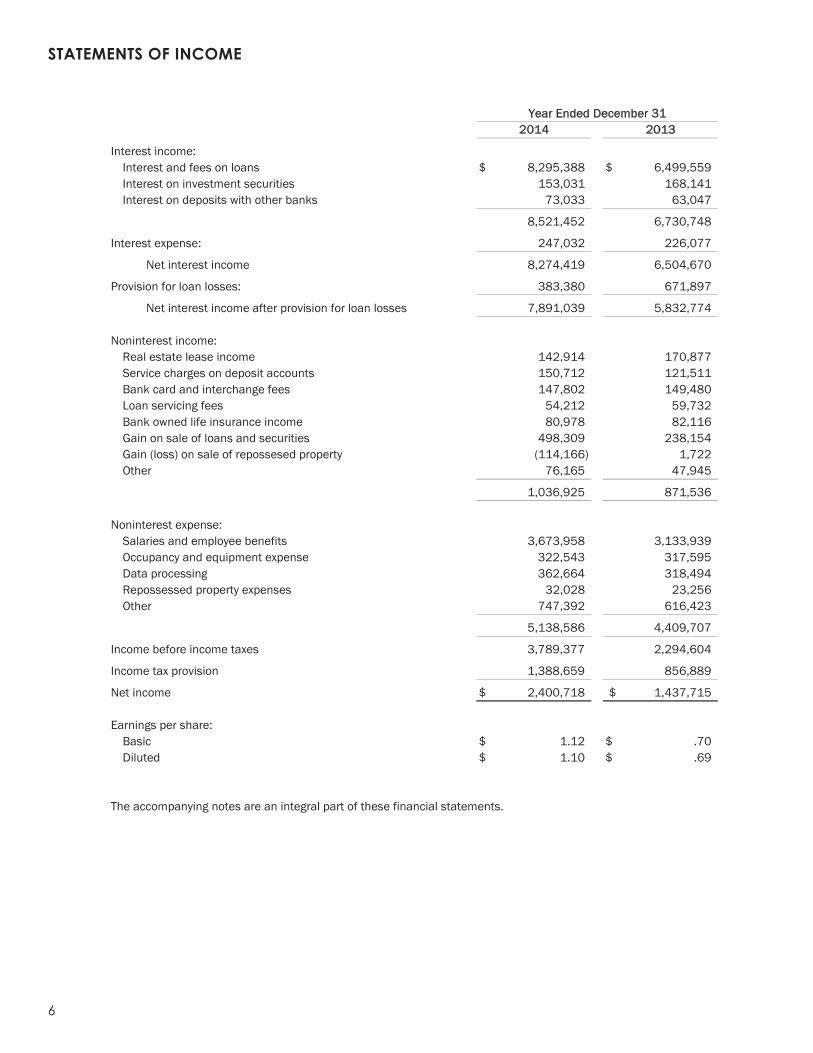
STATEMENTS OF INCOME
6
3
STATEMENTS OF INCOME
2014 2013
Interest income:Interest and fees on loans 8,295,388$ 6,499,559$ Interest on investment securities 153,031 168,141Interest on deposits with other banks 73,033 63,047
8,521,452 6,730,748
Interest expense: 247,032 226,077
Net interest income 8,274,419 6,504,670
Provision for loan losses: 383,380 671,897
Net interest income after provision for loan losses 7,891,039 5,832,774
Noninterest income:Real estate lease income 142,914 170,877Service charges on deposit accounts 150,712 121,511Bank card and interchange fees 147,802 149,480Loan servicing fees 54,212 59,732Bank owned life insurance income 80,978 82,116Gain on sale of loans and securities 498,309 238,154Gain (loss) on sale of repossesed property (114,166) 1,722Other 76,165 47,945
1,036,925 871,536
Noninterest expense:Salaries and employee benefits 3,673,958 3,133,939Occupancy and equipment expense 322,543 317,595Data processing 362,664 318,494Repossessed property expenses 32,028 23,256Other 747,392 616,423
5,138,586 4,409,707
Income before income taxes 3,789,377 2,294,604
Income tax provision 1,388,659 856,889
Net income 2,400,718$ 1,437,715$
Earnings per share:Basic 1.12$ .70$ Diluted 1.10$ .69$
The accompanying notes are an integral part of these financial statements.
Year Ended December 31
7
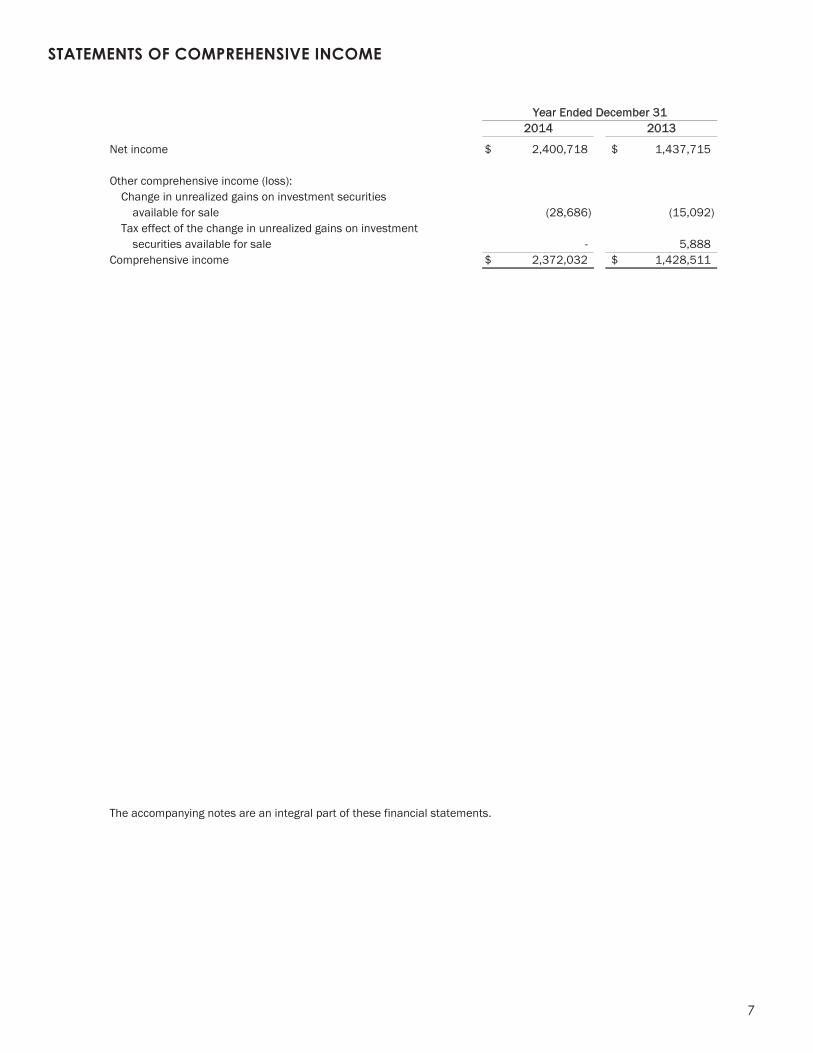
STATEMENTS OF COMPREHENSIVE INCOME
4
STATEMENTS OF COMPREHENSIVE INCOME
2014 2013
Net income 2,400,718$ 1,437,715$
Other comprehensive income (loss):Change in unrealized gains on investment securities
available for sale (28,686) (15,092) Tax effect of the change in unrealized gains on investment
securities available for sale - 5,888 Comprehensive income 2,372,032$ 1,428,511$
The accompanying notes are an integral part of these financial statements.
Year Ended December 31
5
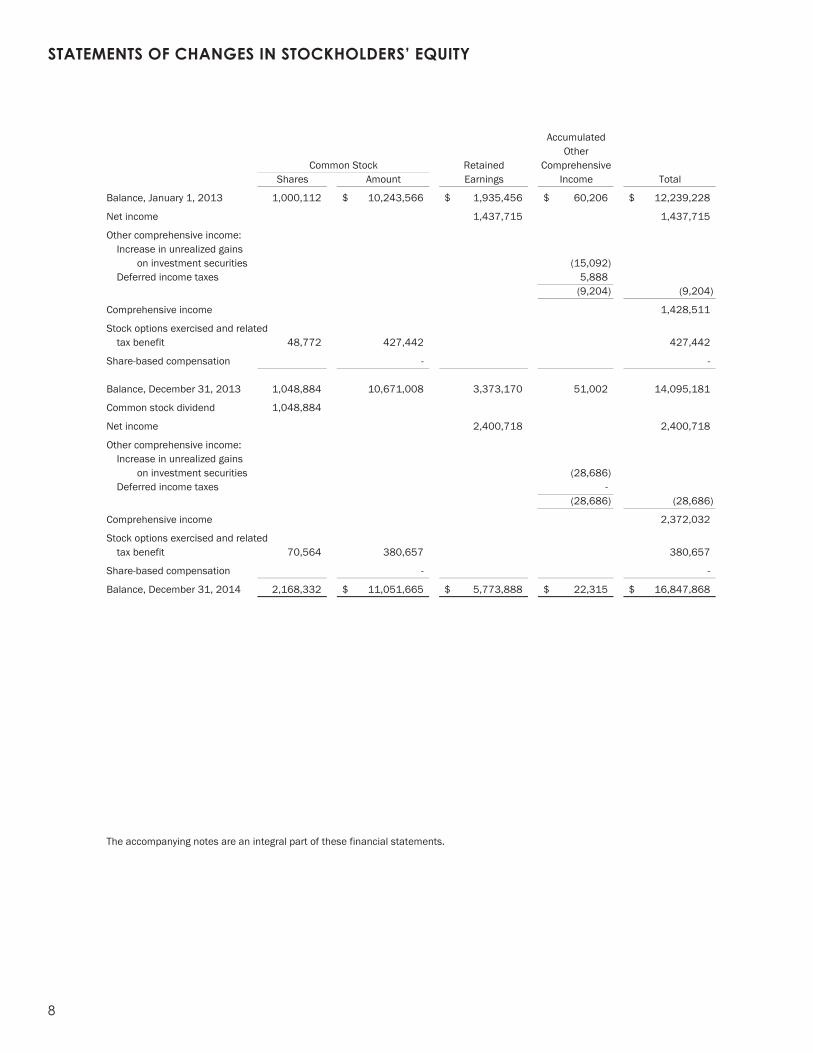
STATEMENTS OF CHANGES IN STOCKHOLDERS’ EQUITY For the Years Ended December 31, 2014 and 2013
AccumulatedOther
Retained ComprehensiveShares Amount Earnings Income Total
Balance, January 1, 2013 1,000,112 10,243,566$ 1,935,456$ 60,206$ 12,239,228$
Net income 1,437,715 1,437,715
Other comprehensive income:Increase in unrealized gains
on investment securities (15,092) Deferred income taxes 5,888
(9,204) (9,204)
Comprehensive income 1,428,511
Stock options exercised and relatedtax benefit 48,772 427,442 427,442
Share-based compensation - -
Balance, December 31, 2013 1,048,884 10,671,008 3,373,170 51,002 14,095,181
Common stock dividend 1,048,884
Net income 2,400,718 2,400,718
Other comprehensive income:Increase in unrealized gains
on investment securities (28,686) Deferred income taxes -
(28,686) (28,686)
Comprehensive income 2,372,032
Stock options exercised and relatedtax benefit 70,564 380,657 380,657
Share-based compensation - -
Balance, December 31, 2014 2,168,332 11,051,665$ 5,773,888$ 22,315$ 16,847,868$
The accompanying notes are an integral part of these financial statements.
Common Stock
8
STATEMENTS OF CHANGES IN STOCKHOLDERS’ EQUITY
6
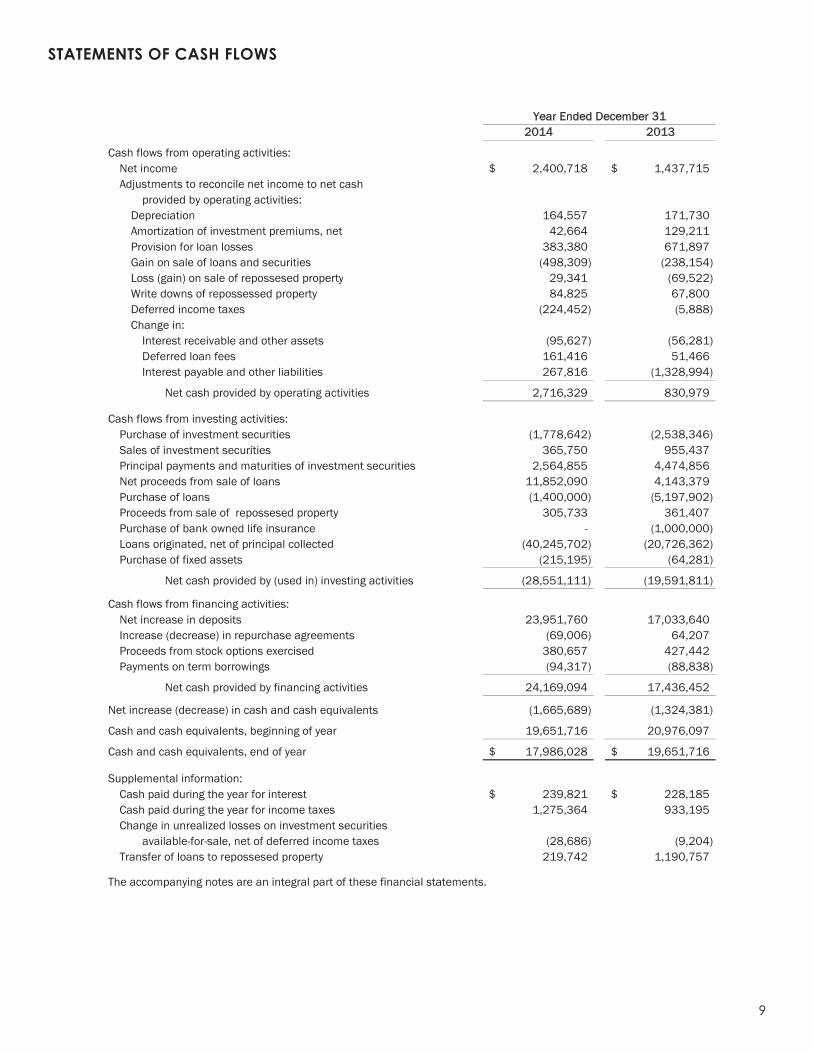
STATEMENTS OF CASH FLOWS
2014 2013
Cash flows from operating activities:Net income 2,400,718$ 1,437,715$ Adjustments to reconcile net income to net cash
provided by operating activities:Depreciation 164,557 171,730 Amortization of investment premiums, net 42,664 129,211 Provision for loan losses 383,380 671,897 Gain on sale of loans and securities (498,309) (238,154) Loss (gain) on sale of repossesed property 29,341 (69,522) Write downs of repossessed property 84,825 67,800 Deferred income taxes (224,452) (5,888) Change in:
Interest receivable and other assets (95,627) (56,281) Deferred loan fees 161,416 51,466 Interest payable and other liabilities 267,816 (1,328,994)
Net cash provided by operating activities 2,716,329 830,979
Cash flows from investing activities:Purchase of investment securities (1,778,642) (2,538,346) Sales of investment securities 365,750 955,437 Principal payments and maturities of investment securities 2,564,855 4,474,856 Net proceeds from sale of loans 11,852,090 4,143,379 Purchase of loans (1,400,000) (5,197,902) Proceeds from sale of repossesed property 305,733 361,407 Purchase of bank owned life insurance - (1,000,000) Loans originated, net of principal collected (40,245,702) (20,726,362) Purchase of fixed assets (215,195) (64,281)
Net cash provided by (used in) investing activities (28,551,111) (19,591,811)
Cash flows from financing activities:Net increase in deposits 23,951,760 17,033,640 Increase (decrease) in repurchase agreements (69,006) 64,207 Proceeds from stock options exercised 380,657 427,442 Payments on term borrowings (94,317) (88,838)
Net cash provided by financing activities 24,169,094 17,436,452
Net increase (decrease) in cash and cash equivalents (1,665,689) (1,324,381)
Cash and cash equivalents, beginning of year 19,651,716 20,976,097
Cash and cash equivalents, end of year 17,986,028$ 19,651,716$
Supplemental information:Cash paid during the year for interest 239,821$ 228,185$ Cash paid during the year for income taxes 1,275,364 933,195 Change in unrealized losses on investment securities
available-for-sale, net of deferred income taxes (28,686) (9,204) Transfer of loans to repossesed property 219,742 1,190,757
The accompanying notes are an integral part of these financial statements.
Year Ended December 31
9
STATEMENTS OF CASH FLOWS
NOTES TO FINANCIAL STATEMENTS
10
1. Summary of Significant Accounting Policies:
General – The Bank provides commercial banking, financing, real estate lending and other related services primarily in Lane County, Oregon. The accounting and reporting policies of the Bank conform with accounting principles generally accepted in the United States of America and prevailing practices within the banking industry.
Financial Statement Presentation – The preparation of the financial statements in conformity with U.S. generally accepted accounting principles (“GAAP”) requires management to make estimates and assumptions that affect reported amounts and related disclosures, and actual results could differ from those estimates. The most significant estimates are the allowance for loan losses and fair value estimates. The Bank has evaluated subsequent events through March 6, 2015, the date the financial statements were available for distribution. Certain prior year amounts have been reclassified to conform to the current year presentation.
Cash and Cash Equivalents – For purposes of reporting cash flows, cash and cash equivalents are cash and due from banks. Such amounts include both interest-bearing and non interest-bearing deposits with other banks, principally short-term time deposits, and federal funds sold on an overnight basis and may exceed amounts insured by the FDIC.
Investment Securities – The Bank classifies all investment securities as available-for-sale. Securities available-for-sale are held for indefinite periods of time and may be sold in response to changes in market interest rates, shifts in the maturity mix or concentration of bank assets or liabilities or to alleviate liquidity demands. Securities designated as available-for-sale are carried at estimated fair value. Unrealized gains and losses are excluded from earnings and are included in other comprehensive income in stockholders’ equity, net of applicable deferred taxes.
Interest income on debt securities is included in income using the effective interest method. Gains and losses realized on sales of securities are recognized using the specific identification method. Investment income includes accretion and amortization of discounts and premiums resulting from securities purchased at other than par value. Both are calculated using a “constant yield” methodology either to maturity (for non-callable securities) or to “worst call date” for callable securities. Premiums and discounts on mortgage backed securities are amortized/accreted based upon current and expected future rates of prepayments on the securities.
The Bank evaluates its securities classified as available for sale for other-than-temporary impairments (OTTI) in accordance with ASC Topic 320. Accordingly, the Bank assesses whether it intends to sell or it is more likely than not that it will be required to sell a security before recovery of its amortized cost basis less any current-period credit losses. For debt securities that are considered other-than-temporarily impaired and that the Bank does not intend to sell and will not be required to sell prior to recovery of the amortized cost basis, the Bank would separate the amount of the impairment into the amount that is credit related (credit loss component) and the amount due to all other factors. The credit loss component would be recognized in earnings and would be the difference between the security’s amortized cost basis and the present value of its expected future cash flows discounted at the security’s effective yield. The remaining difference between the security’s fair value and the present value of future expected cash flows would be due to factors that are not credit related and, therefore, would not be required to be recognized as losses in the income statement, but would be recognized in other comprehensive income. Management believes that any unrealized losses on investment securities at December 31, 2014 and December 31, 2013 are temporary.
Loans and Income Recognition – Loans are stated at the amount of unpaid principal, reduced by deferred loan origination fees and an allowance for loan losses. Interest on loans is calculated using the simple-interest method on daily balances of the principal amount outstanding. Accrual of interest is discontinued on a loan when management believes, after considering economic and business conditions and collection efforts, that the borrower’s financial condition is such that collection of the interest is doubtful. In accordance with GAAP, payments received on nonaccrual loans are applied to the principal balance and no interest income is recognized. Interest income is subsequently recognized only to the extent cash payments are received satisfying all delinquent principal and interest amounts, and the prospects for future payments in accordance with the loan agreement appear relatively certain. A nonaccrual loan may be restored to accrual status when none of
NOTES TO FINANCIAL STATEMENTS
11
its principal and interest is due and unpaid and the Bank expects full repayment of the remaining contractual principal and interest, or when it otherwise becomes well secured and in the process of collection. Loan origination fees, net of associated direct costs, if significant, are amortized by the interest or straight-line method over the contractual life of the loan.
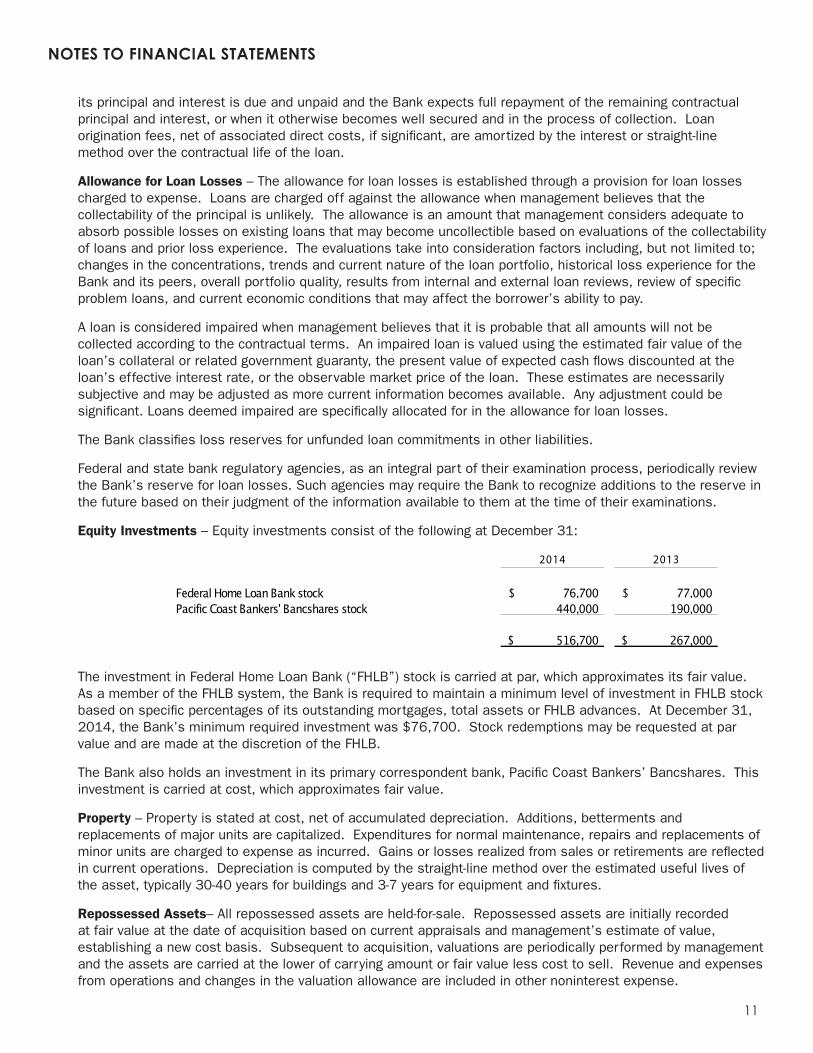
Allowance for Loan Losses – The allowance for loan losses is established through a provision for loan losses charged to expense. Loans are charged off against the allowance when management believes that the collectability of the principal is unlikely. The allowance is an amount that management considers adequate to absorb possible losses on existing loans that may become uncollectible based on evaluations of the collectability of loans and prior loss experience. The evaluations take into consideration factors including, but not limited to; changes in the concentrations, trends and current nature of the loan portfolio, historical loss experience for the Bank and its peers, overall portfolio quality, results from internal and external loan reviews, review of specific problem loans, and current economic conditions that may affect the borrower’s ability to pay.
A loan is considered impaired when management believes that it is probable that all amounts will not be collected according to the contractual terms. An impaired loan is valued using the estimated fair value of the loan’s collateral or related government guaranty, the present value of expected cash flows discounted at the loan’s effective interest rate, or the observable market price of the loan. These estimates are necessarily subjective and may be adjusted as more current information becomes available. Any adjustment could be significant. Loans deemed impaired are specifically allocated for in the allowance for loan losses.
The Bank classifies loss reserves for unfunded loan commitments in other liabilities.
Federal and state bank regulatory agencies, as an integral part of their examination process, periodically review the Bank’s reserve for loan losses. Such agencies may require the Bank to recognize additions to the reserve in the future based on their judgment of the information available to them at the time of their examinations.
Equity Investments – Equity investments consist of the following at December 31:
The investment in Federal Home Loan Bank (“FHLB”) stock is carried at par, which approximates its fair value. As a member of the FHLB system, the Bank is required to maintain a minimum level of investment in FHLB stock based on specific percentages of its outstanding mortgages, total assets or FHLB advances. At December 31, 2014, the Bank’s minimum required investment was $76,700. Stock redemptions may be requested at par value and are made at the discretion of the FHLB.
The Bank also holds an investment in its primary correspondent bank, Pacific Coast Bankers’ Bancshares. This investment is carried at cost, which approximates fair value.
Property – Property is stated at cost, net of accumulated depreciation. Additions, betterments and replacements of major units are capitalized. Expenditures for normal maintenance, repairs and replacements of minor units are charged to expense as incurred. Gains or losses realized from sales or retirements are reflected in current operations. Depreciation is computed by the straight-line method over the estimated useful lives of the asset, typically 30-40 years for buildings and 3-7 years for equipment and fixtures.
Repossessed Assets– All repossessed assets are held-for-sale. Repossessed assets are initially recorded at fair value at the date of acquisition based on current appraisals and management’s estimate of value, establishing a new cost basis. Subsequent to acquisition, valuations are periodically performed by management and the assets are carried at the lower of carrying amount or fair value less cost to sell. Revenue and expenses from operations and changes in the valuation allowance are included in other noninterest expense.
2014 2013
Federal Home Loan Bank stock 76,700$ 77,000$ Pacific Coast Bankers' Bancshares stock 440,000 190,000
516,700$ 267,000$
NOTES TO FINANCIAL STATEMENTS
12
Bank-owned Life Insurance (BOLI) The Bank is beneficiary of BOLI on certain Bank officers. The BOLI is recorded at fair value, which is based on the cash surrender value (net of surrender charges) of the insurance contracts. Changes in the cash surrender value are included in noninterest income.
Advertising – Advertising costs are charged to expense during the period in which they are incurred. Advertising expenses were $43,800 and $33,427 for the years ended December 31, 2014 and 2013, respectively.
Income Taxes – Deferred tax assets and liabilities are recognized for the future tax consequences attributable to differences between financial statement carrying amounts of existing assets and liabilities and their respective tax bases. Deferred tax assets and liabilities are calculated on differences between financial statement and tax bases of assets and liabilities using tax rates in effect for the year in which the differences are expected to reverse. A valuation allowance is recognized if, based on the available evidence, it is determined it is more likely than not some portion or all of the deferred tax assets will not be realized.
Uncertain tax positions are accounted for in accordance with ASC 740 which prescribes recognition and measurement standards for uncertain income tax positions. The Standard provides guidance on recognition, derecognition, interest, penalties and disclosure. Federal and State tax returns subsequent to 2010 remain open to examination. There is no material impact of potential tax uncertainties on Bank’s financial condition or results of operations at December 31, 2014.
Derivative Instruments – The Bank uses derivative financial instruments (interest rate swaps) to limit exposure to changes in interest rates related to specific loan assets. Derivatives entered into by the Bank are designated as fair value hedges with perfect effectiveness between changes in the value of the interest rate swap and the hedged instrument (loan asset). All derivatives and related hedged loans are recognized in the balance sheet at their fair value. Changes in the fair value of a derivative that is highly effective, along with the loss or gain on the hedged loan asset that is attributable to the hedged risk, are recorded in current-period earnings. The Bank formally documents all relationships between hedging instruments and hedged assets, as well as its risk-management objective and strategy for undertaking various hedged transactions. The Bank also formally assesses, both at the hedge’s inception and on an ongoing basis, whether the derivatives that are used in hedging transactions are highly effective in offsetting changes in fair values of hedged items.
The Bank would discontinue hedge accounting when: (a) it is determined that a derivative is no longer effective in offsetting changes in the fair value of the associated hedged loan asset; (b) the derivative expires or is sold, terminated, or exercised; or (c) management determines that designation of the derivative as a hedge instrument is no longer appropriate. The hedged loan asset would no longer be adjusted for changes in fair value and the derivative would be carried at its fair value in the balance sheet, with changes in its fair value recognized in current-period earnings.
Stockholders’ Equity and Earnings Per Share – Basic earnings per share are computed by dividing net income by the weighted average number of shares outstanding during the period. Diluted earnings per share include the effect of common stock equivalents that would arise from the exercise of stock options discussed in Note 11. On March 10, 2014, the Company’s Board of Directors declared a two-for-one stock split, effected in the form of a stock dividend, on the shares of the Company’s common stock. Each shareholder of record on April 9, 2014, received an additional share of common stock for each share of common stock then held. The stock was issued April 24, 2014. All references in the financial statements to the number of shares outstanding, per-share amounts, and stock option data of the Company’s common stock have been restated to reflect the effect of the stock split for all periods presented.
Share-Based Compensation – Financial accounting standards require companies to measure and recognize compensation expense for all share-based payments at the grant date based on the fair value of the award, as defined in the ASC 718, and include such costs as an expense over the requisite service (vesting) period. The Bank adopted ASC 718 using the modified prospective application, whereby the provisions of the statement have been applied prospectively only from the date of adoption for new (issued subsequent to December 31, 2005) and unvested stock option awards for which the requisite service is rendered after the date of adoption. Thus, the Bank recognizes as expense the fair value of stock options issued prior to January 1, 2006, but vesting after January 1, 2006, over the remaining vesting period.
NOTES TO FINANCIAL STATEMENTS
13
SBA/USDA Loans Sales and Servicing—The Bank, on a limited basis, sells or transfers loans, including the government guaranteed portion of the loans (with loan servicing retained) for proceeds equal to the principal amount of loans, as adjusted to yield interest to the investor based upon the current market rates. The Bank records an asset representing the right to service loans for others when it sells a loan and retains the servicing rights included in other assets. The carrying value of loans is allocated between the loan and the servicing rights, based on their relative fair values. The fair value of servicing rights is estimated by discounting estimated future cash flows from servicing using discount rates that approximate current market rates and using estimated prepayment rates. The servicing rights are carried at the lower of cost or market and are amortized in proportion to, and over the period of the estimated net servicing income, assuming prepayments.
For purposes of evaluating and measuring impairment, servicing rights are based on a discounted cash flow methodology, current prepayment speeds and market discount rates. Impairment is measured as the amount by which the carrying value of servicing rights for a loan asset exceeds its fair value. The carrying value of the servicing rights at December 31, 2014 and 2013 were $42,543 and $65,982, respectively. No impairment charges were recorded for the years ended December 31, 2014, or 2013 related to the servicing assets.
Fair Value – The Bank applies the hierarchy and framework for measuring fair value, and expanded disclosure about fair value measurements and the reliability of valuation inputs as provided in ASC 820. When determining fair value, the Bank considers the transaction to sell an asset or transfer a liability occurs in the principal or at least the most advantageous market for that asset or liability. Within the hierarchy, Level 1 instruments use observable market prices for the identical item in active markets and have the most reliable valuations. Level 2 instruments are valued through broker/dealer quotation or through market-observable inputs for similar items in active markets, including forward and spot prices, interest rates and volatilities. Level 3 instruments are valued using inputs not observable in an active market such as Bank-developed future cash flow estimates, and are considered the least reliable. Valuations for all of the Bank’s financial instruments fall within Levels 2 and 3.
Recently Issued Accounting Pronouncements Adopted in 2014
FASB Accounting Standard Update No. ASU 2012-04, Technical Corrections and Improvements. This ASU clarifies the Codification or corrects unintended applications of guidance that are not expected to have a significant effect on current accounting practice or create a significant administrative cost. This update is effective for the Bank for the year ended December 31, 2014.
FASB Accounting Standard Update No. ASU 2013-02, Reporting of Amounts Reclassified Out of Accumulated Other Comprehensive Income. The objective of this update is to improve the reporting of reclassifications out of accumulated other comprehensive income. The amendments in this update seek to attain that objective by requiring an entity to report the effect of significant reclassifications out of accumulated other comprehensive income on the respective line items in net income if the amount being reclassified is required under U.S. generally accepted accounting principles (GAAP) to be reclassified in its entirety to net income. This update is effective for the Bank for the year ended December 31, 2014.
FASB Accounting Standard Update No. ASU 2014-07, Technical Corrections and Improvements Related to Glossary Terms. These amendments relate to glossary terms and cover a wide range of Topics in the Codification. These amendments are presented in four sections: 1) Deletion of Master Glossary Terms arising because of terms that were carried forward from source literature to the Codification but were not utilized in the Codification; 2) Addition of Master Glossary Term Links arising from Master Glossary terms whose links did not carry forward to the Codification; 3) Duplicate Master Glossary Terms arising from Master Glossary terms that appear multiple times in the Master Glossary with similar, but not identical, definitions; and 4) Other Technical Corrections Related to Glossary Terms arising from miscellaneous changes to update Master Glossary terms.
Recently Issued Accounting Pronouncements Effective in 2015 and subsequent years
FASB Accounting Standard Update No. ASU 2013-11, Presentation of an Unrecognized Tax Benefit When a Net Operating Loss Carryforward, a Similar Tax Loss, or a Tax Credit Carryforward Exists. These amendments provide that an unrecognized tax benefit, or a portion thereof, should be presented in the financial statements as a reduction to a deferred tax asset for a net operating loss carryforward, a similar tax loss, or a tax credit carryforward, except to the extent that a net operating loss carryforward, a similar tax loss, or a tax credit carryforward is not available at the
reporting date to settle any additional income taxes that would result from disallowance of a tax position, or the tax law does not require the entity to use, and the entity does not intend to use, the deferred tax asset for such purpose, then the unrecognized tax benefit should be presented as a liability. This update is effective for the Bank for the year ended December 31, 2015.
FASB Accounting Standard Update No. ASU 2014-02, Intangibles—Goodwill and Other (Topic 350)—Accounting for Goodwill. These amendments permit a private company to subsequently amortize goodwill on a straight-line basis over a period of ten years, or less if the company demonstrates that another useful life is more appropriate. It also permits a private company to apply a simplified impairment model to goodwill. Under the goodwill accounting alternative, goodwill should be tested for impairment when a triggering event occurs that indicates that the fair value of a company (or a reporting unit) may be below its carrying amount. A private company that elects the accounting alternative is further required to make an accounting policy election to test goodwill for impairment at either the company level or the reporting unit level. This update is effective for the Bank for the year ended December 31, 2015.
FASB Accounting Standard Update No. ASU 2014-04, Receivables—Troubled Debt Restructurings by Creditors (Subtopic 310-40)—Reclassification of Residential Real Estate Collateralized Consumer Mortgage Loans upon Foreclosure. These amendments are intended to clarify when a creditor should be considered to have received physical possession of residential real estate property collateralizing a consumer mortgage loan such that the loan should be derecognized and the real estate recognized. These amendments clarify that an in substance repossession or foreclosure occurs, and a creditor is considered to have received physical possession of residential real estate property collateralizing a consumer mortgage loan, upon certain conditions. This update is effective for the Bank for the year ended December 31, 2015.
FASB Accounting Standard Update No. ASU 2014-11. Repurchase-to-Maturity Transactions, Repurchase Financings, and Disclosures. The amendments in ASU 2014-11 align the accounting for repurchase-to-maturity transactions and repurchase agreements executed as a repurchase financing with the accounting for other typical repurchase agreements. Going forward, these transactions would all be accounted for as secured borrowings. The guidance eliminates sale accounting for repurchase-to-maturity transactions and supersedes the guidance under which a transfer of a financial asset and a contemporaneous repurchase financing could be accounted for on a combined basis as a forward agreement, which has resulted in outcomes referred to as off-balance-sheet accounting. ASU 2014-11 also brings U.S. GAAP into greater alignment with IFRS for repurchase-to-maturity transactions. This update is effective for the Bank for the year ended December 31, 2015.
FASB Accounting Standard Update No. ASU 2014-12. Accounting for Share-Based Payments When the Terms of an Award Provide That a Performance Target Could Be Achieved after the Requisite Service Period. The amendments in ASU 2014-12 require that a performance target that affects vesting and that could be achieved after the requisite service period be treated as a performance condition. A reporting entity should apply existing guidance in Topic 718, Compensation – Stock Compensation, as it relates to awards with performance conditions that affect vesting to account for such awards. The performance target should not be reflected in estimating the grant-date fair value of the award. Compensation cost should be recognized in the period in which it becomes probable that the performance target will be achieved and should represent the compensation cost attributable to the period(s) for which the requisite service has already been rendered. If the performance target becomes probable of being achieved before the end of the requisite service period, the remaining unrecognized compensation cost should be recognized prospectively over the remaining requisite service period. The total amount of compensation cost recognized during and after the requisite service period should reflect the number of awards that are expected to vest and should be adjusted to reflect those awards that ultimately vest. The requisite service period ends when the employee can cease rendering service and still be eligible to vest in the award if the performance target is achieved. This update is effective for the Bank for the year ended December 31, 2016.
FASB Accounting Standard Update No. ASU 2014-14. Classification of Certain Government-Guaranteed Mortgage Loans upon Foreclosure. The amendments in ASU 2014-14 affect creditors that hold government-guaranteed mortgage loans, including those guaranteed by the FHA and the VA. It requires that a mortgage loan be derecognized and a separate other receivable be recognized upon foreclosure if the certain conditions are met. This update is effective for the Bank for the year ended December 31, 2016.
The Bank is currently evaluating the impact that the amendments effective in 2015 will have on its future financial statements.
NOTES TO FINANCIAL STATEMENTS
14
NOTES TO FINANCIAL STATEMENTS
15
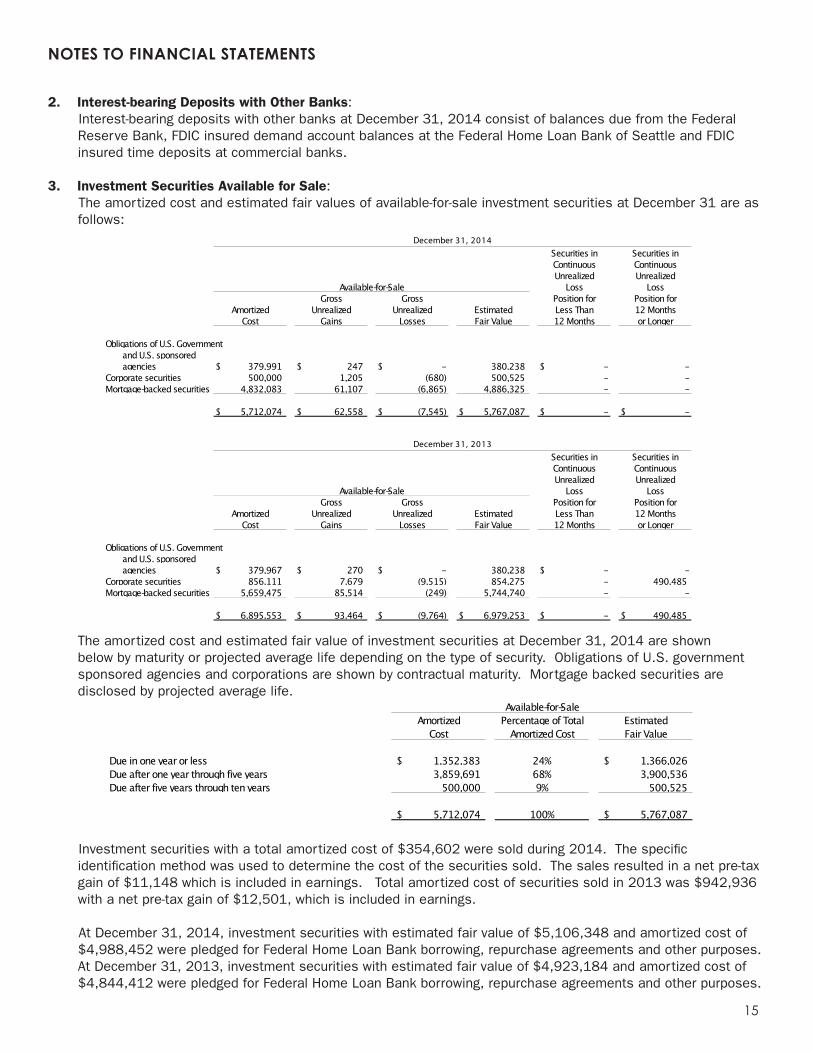
2. Interest-bearing Deposits with Other Banks: Interest-bearing deposits with other banks at December 31, 2014 consist of balances due from the Federal Reserve Bank, FDIC insured demand account balances at the Federal Home Loan Bank of Seattle and FDIC insured time deposits at commercial banks.
3. Investment Securities Available for Sale: The amortized cost and estimated fair values of available-for-sale investment securities at December 31 are as follows:
Securities in Securities inContinuous ContinuousUnrealized Unrealized
Loss LossGross Gross Position for Position for
Amortized Unrealized Unrealized Estimated Less Than 12 MonthsCost Gains Losses Fair Value 12 Months or Longer
Obligations of U.S. Government and U.S. sponsored agencies 379,991$ 247$ -$ 380,238 -$ -
Corporate securities 500,000 1,205 (680) 500,525 - -Mortgage-backed securities 4,832,083 61,107 (6,865) 4,886,325 - -
5,712,074$ 62,558$ (7,545)$ 5,767,087$ -$ -$
Securities in Securities inContinuous ContinuousUnrealized Unrealized
Loss LossGross Gross Position for Position for
Amortized Unrealized Unrealized Estimated Less Than 12 MonthsCost Gains Losses Fair Value 12 Months or Longer
Obligations of U.S. Government and U.S. sponsored agencies 379,967$ 270$ -$ 380,238 -$ -
Corporate securities 856,111 7,679 (9,515) 854,275 - 490,485Mortgage-backed securities 5,659,475 85,514 (249) 5,744,740 - -
6,895,553$ 93,464$ (9,764)$ 6,979,253$ -$ 490,485$
December 31, 2013
Available-for-Sale
Available-for-Sale
December 31, 2014
The amortized cost and estimated fair value of investment securities at December 31, 2014 are shown below by maturity or projected average life depending on the type of security. Obligations of U.S. government sponsored agencies and corporations are shown by contractual maturity. Mortgage backed securities are disclosed by projected average life.
Amortized Percentage of Total EstimatedCost Amortized Cost Fair Value
Due in one year or less 1,352,383$ 24% 1,366,026$ Due after one year through five years 3,859,691 68% 3,900,536 Due after five years through ten years 500,000 9% 500,525
5,712,074$ 100% 5,767,087$
Available-for-Sale
Investment securities with a total amortized cost of $354,602 were sold during 2014. The specific identification method was used to determine the cost of the securities sold. The sales resulted in a net pre-tax gain of $11,148 which is included in earnings. Total amortized cost of securities sold in 2013 was $942,936 with a net pre-tax gain of $12,501, which is included in earnings.
At December 31, 2014, investment securities with estimated fair value of $5,106,348 and amortized cost of $4,988,452 were pledged for Federal Home Loan Bank borrowing, repurchase agreements and other purposes. At December 31, 2013, investment securities with estimated fair value of $4,923,184 and amortized cost of $4,844,412 were pledged for Federal Home Loan Bank borrowing, repurchase agreements and other purposes.
NOTES TO FINANCIAL STATEMENTS
16
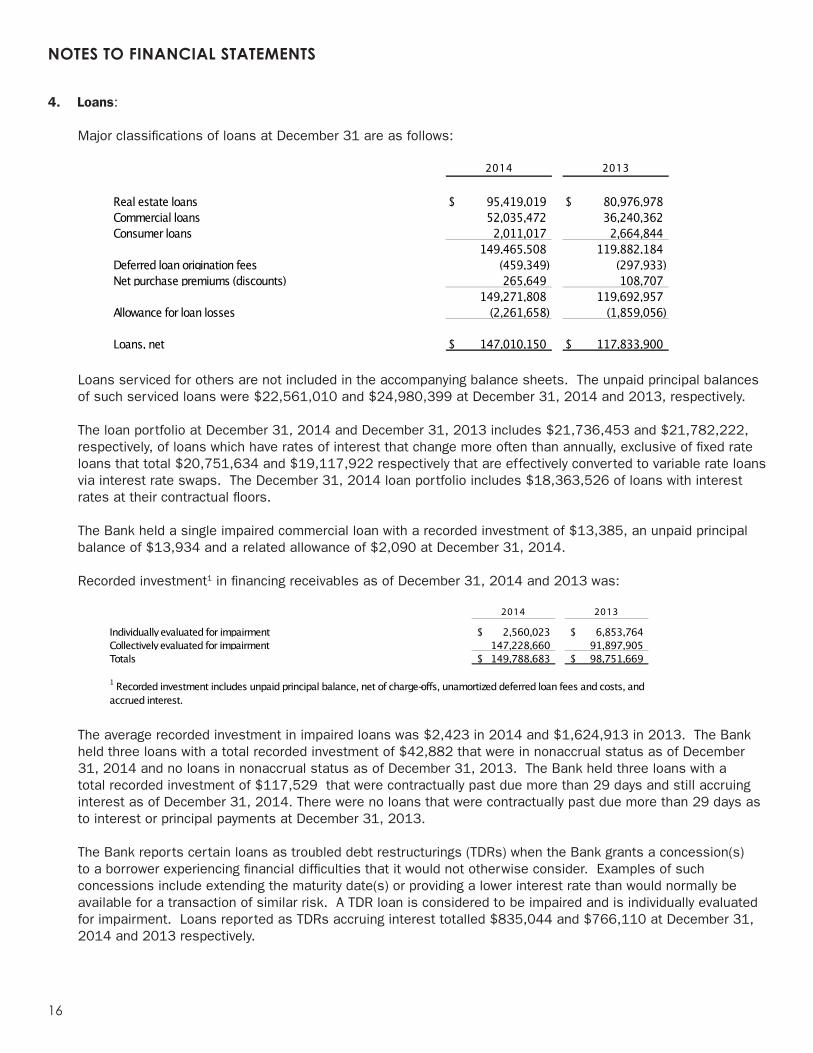
4. Loans:
Major classifications of loans at December 31 are as follows:
2014 2013
Real estate loans 95,419,019$ 80,976,978$ Commercial loans 52,035,472 36,240,362 Consumer loans 2,011,017 2,664,844
149,465,508 119,882,184Deferred loan origination fees (459,349) (297,933)Net purchase premiums (discounts) 265,649 108,707
149,271,808 119,692,957Allowance for loan losses (2,261,658) (1,859,056)
Loans, net 147,010,150$ 117,833,900$
Loans serviced for others are not included in the accompanying balance sheets. The unpaid principal balances of such serviced loans were $22,561,010 and $24,980,399 at December 31, 2014 and 2013, respectively.
The loan portfolio at December 31, 2014 and December 31, 2013 includes $21,736,453 and $21,782,222, respectively, of loans which have rates of interest that change more often than annually, exclusive of fixed rate loans that total $20,751,634 and $19,117,922 respectively that are effectively converted to variable rate loans via interest rate swaps. The December 31, 2014 loan portfolio includes $18,363,526 of loans with interest rates at their contractual floors.
The Bank held a single impaired commercial loan with a recorded investment of $13,385, an unpaid principal balance of $13,934 and a related allowance of $2,090 at December 31, 2014.
Recorded investment1 in financing receivables as of December 31, 2014 and 2013 was:
2014 2013
Individually evaluated for impairment 2,560,023$ 6,853,764$ Collectively evaluated for impairment 147,228,660 91,897,905 Totals 149,788,683$ 98,751,669$
1 Recorded investment includes unpaid principal balance, net of charge-offs, unamortized deferred loan fees and costs, and accrued interest.
The average recorded investment in impaired loans was $2,423 in 2014 and $1,624,913 in 2013. The Bank held three loans with a total recorded investment of $42,882 that were in nonaccrual status as of December 31, 2014 and no loans in nonaccrual status as of December 31, 2013. The Bank held three loans with a total recorded investment of $117,529 that were contractually past due more than 29 days and still accruing interest as of December 31, 2014. There were no loans that were contractually past due more than 29 days as to interest or principal payments at December 31, 2013.
The Bank reports certain loans as troubled debt restructurings (TDRs) when the Bank grants a concession(s) to a borrower experiencing financial difficulties that it would not otherwise consider. Examples of such concessions include extending the maturity date(s) or providing a lower interest rate than would normally be available for a transaction of similar risk. A TDR loan is considered to be impaired and is individually evaluated for impairment. Loans reported as TDRs accruing interest totalled $835,044 and $766,110 at December 31, 2014 and 2013 respectively.
NOTES TO FINANCIAL STATEMENTS
17
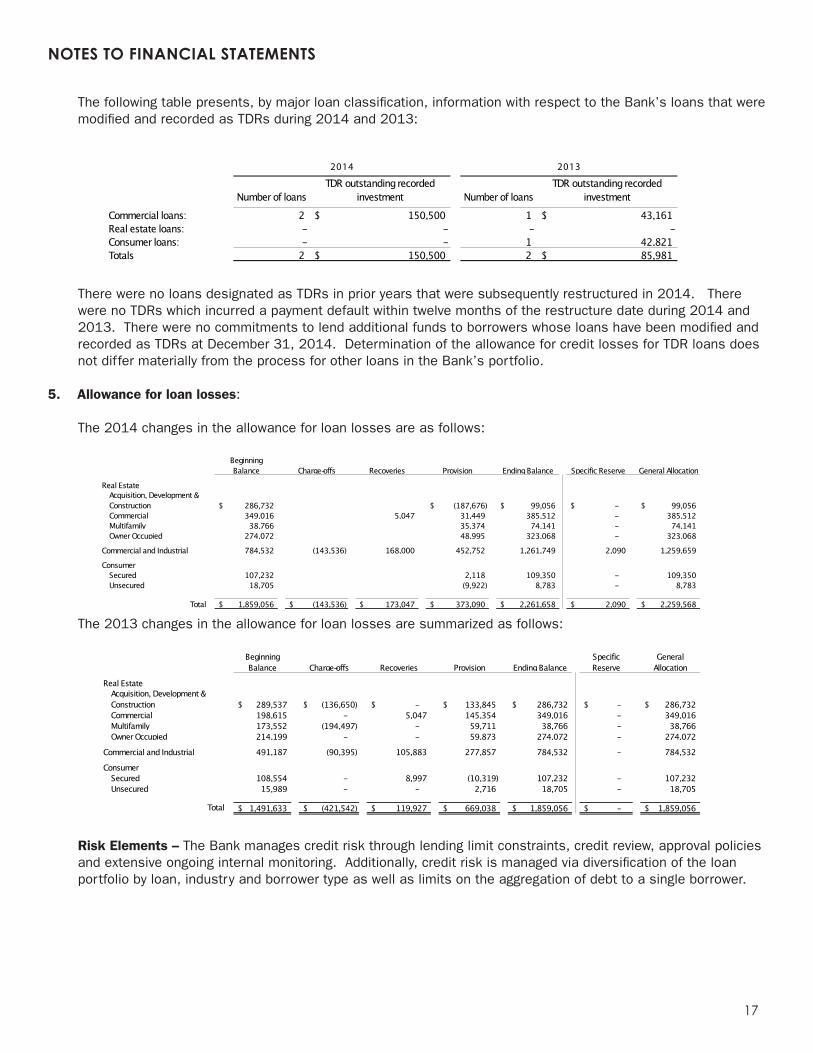
The following table presents, by major loan classification, information with respect to the Bank’s loans that were modified and recorded as TDRs during 2014 and 2013:
Number of loansTDR outstanding recorded
investment Number of loansTDR outstanding recorded
investment
Commercial loans: 2 150,500$ 1 43,161$ Real estate loans: - - - - Consumer loans: - - 1 42,821 Totals 2 150,500$ 2 85,981$
2014 2013
There were no loans designated as TDRs in prior years that were subsequently restructured in 2014. There were no TDRs which incurred a payment default within twelve months of the restructure date during 2014 and 2013. There were no commitments to lend additional funds to borrowers whose loans have been modified and recorded as TDRs at December 31, 2014. Determination of the allowance for credit losses for TDR loans does not differ materially from the process for other loans in the Bank’s portfolio.
5. Allowance for loan losses:
The 2014 changes in the allowance for loan losses are as follows:
Beginning Balance Charge-offs Recoveries Provision Ending Balance Specific Reserve General Allocation
Acquisition, Development & Construction 286,732$ (187,676)$ 99,056$ -$ 99,056$ Commercial 349,016 5,047 31,449 385,512 - 385,512 Multifamily 38,766 35,374 74,141 - 74,141 Owner Occupied 274,072 48,995 323,068 - 323,068
784,532 (143,536) 168,000 452,752 1,261,749 2,090 1,259,659
Secured 107,232 2,118 109,350 - 109,350 Unsecured 18,705 (9,922) 8,783 - 8,783
Total 1,859,056$ (143,536)$ 173,047$ 373,090$ 2,261,658$ 2,090$ 2,259,568$
Real Estate
Commercial and Industrial
Consumer
The 2013 changes in the allowance for loan losses are summarized as follows:
Beginning Balance Charge-offs Recoveries Provision Ending Balance
Specific Reserve
General Allocation
Acquisition, Development & Construction 289,537$ (136,650)$ -$ 133,845$ 286,732$ -$ 286,732$ Commercial 198,615 - 5,047 145,354 349,016 - 349,016 Multifamily 173,552 (194,497) - 59,711 38,766 - 38,766 Owner Occupied 214,199 - - 59,873 274,072 - 274,072
491,187 (90,395) 105,883 277,857 784,532 - 784,532
Secured 108,554 - 8,997 (10,319) 107,232 - 107,232 Unsecured 15,989 - - 2,716 18,705 - 18,705
Total 1,491,633$ (421,542)$ 119,927$ 669,038$ 1,859,056$ -$ 1,859,056$
Real Estate
Commercial and Industrial
Consumer
Risk Elements – The Bank manages credit risk through lending limit constraints, credit review, approval policies and extensive ongoing internal monitoring. Additionally, credit risk is managed via diversification of the loan portfolio by loan, industry and borrower type as well as limits on the aggregation of debt to a single borrower.
NOTES TO FINANCIAL STATEMENTS
18
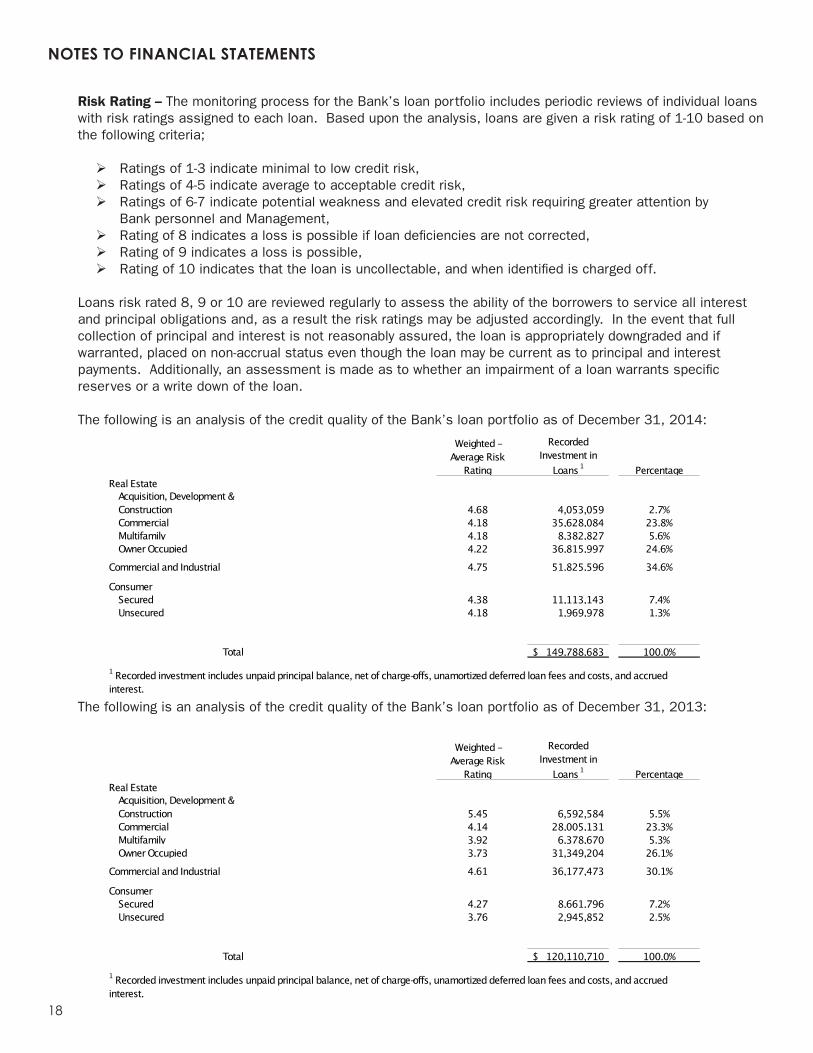
Risk Rating – The monitoring process for the Bank’s loan portfolio includes periodic reviews of individual loans with risk ratings assigned to each loan. Based upon the analysis, loans are given a risk rating of 1-10 based on the following criteria;
Ratings of 1-3 indicate minimal to low credit risk,Ratings of 4-5 indicate average to acceptable credit risk,Ratings of 6-7 indicate potential weakness and elevated credit risk requiring greater attention by
Bank personnel and Management,Rating of 8 indicates a loss is possible if loan deficiencies are not corrected,Rating of 9 indicates a loss is possible,Rating of 10 indicates that the loan is uncollectable, and when identified is charged off.
Loans risk rated 8, 9 or 10 are reviewed regularly to assess the ability of the borrowers to service all interest and principal obligations and, as a result the risk ratings may be adjusted accordingly. In the event that full collection of principal and interest is not reasonably assured, the loan is appropriately downgraded and if warranted, placed on non-accrual status even though the loan may be current as to principal and interest payments. Additionally, an assessment is made as to whether an impairment of a loan warrants specific reserves or a write down of the loan.
The following is an analysis of the credit quality of the Bank’s loan portfolio as of December 31, 2014:
Weighted - Average Risk
Rating
Recorded Investment in
Loans 1 Percentage
Acquisition, Development & Construction 4.68 4,053,059 2.7%Commercial 4.18 35,628,084 23.8%Multifamily 4.18 8,382,827 5.6%Owner Occupied 4.22 36,815,997 24.6%
4.75 51,825,596 34.6%
Secured 4.38 11,113,143 7.4%Unsecured 4.18 1,969,978 1.3%
Total 149,788,683$ 100.0%1 Recorded investment includes unpaid principal balance, net of charge-offs, unamortized deferred loan fees and costs, and accrued interest.
Real Estate
Commercial and Industrial
Consumer
The following is an analysis of the credit quality of the Bank’s loan portfolio as of December 31, 2013:
Weighted - Average Risk
Rating
Recorded Investment in
Loans 1 Percentage
Acquisition, Development & Construction 5.45 6,592,584 5.5%Commercial 4.14 28,005,131 23.3%Multifamily 3.92 6,378,670 5.3%Owner Occupied 3.73 31,349,204 26.1%
4.61 36,177,473 30.1%
Secured 4.27 8,661,796 7.2%Unsecured 3.76 2,945,852 2.5%
Total 120,110,710$ 100.0%1 Recorded investment includes unpaid principal balance, net of charge-offs, unamortized deferred loan fees and costs, and accrued interest.
Real Estate
Commercial and Industrial
Consumer
NOTES TO FINANCIAL STATEMENTS
19
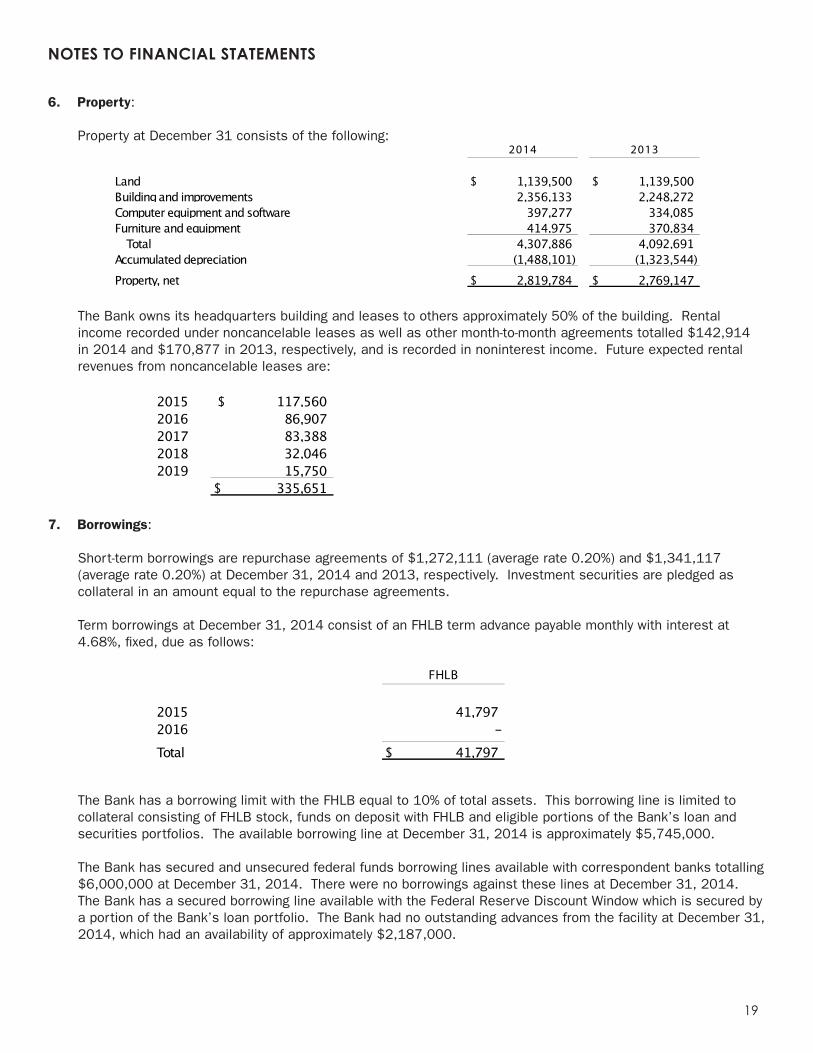
6. Property:
Property at December 31 consists of the following:2014 2013
Land 1,139,500$ 1,139,500$ Building and improvements 2,356,133 2,248,272 Computer equipment and software 397,277 334,085Furniture and equipment 414,975 370,834
Total 4,307,886 4,092,691Accumulated depreciation (1,488,101) (1,323,544)Property, net 2,819,784$ 2,769,147$
The Bank owns its headquarters building and leases to others approximately 50% of the building. Rental income recorded under noncancelable leases as well as other month-to-month agreements totalled $142,914 in 2014 and $170,877 in 2013, respectively, and is recorded in noninterest income. Future expected rental revenues from noncancelable leases are:
2015 117,560$ 2016 86,9072017 83,3882018 32,0462019 15,750
335,651$
7. Borrowings:
Short-term borrowings are repurchase agreements of $1,272,111 (average rate 0.20%) and $1,341,117 (average rate 0.20%) at December 31, 2014 and 2013, respectively. Investment securities are pledged as collateral in an amount equal to the repurchase agreements.
Term borrowings at December 31, 2014 consist of an FHLB term advance payable monthly with interest at 4.68%, fixed, due as follows:
FHLB
2015 41,7972016 - Total 41,797$
The Bank has a borrowing limit with the FHLB equal to 10% of total assets. This borrowing line is limited to collateral consisting of FHLB stock, funds on deposit with FHLB and eligible portions of the Bank’s loan and securities portfolios. The available borrowing line at December 31, 2014 is approximately $5,745,000.
The Bank has secured and unsecured federal funds borrowing lines available with correspondent banks totalling $6,000,000 at December 31, 2014. There were no borrowings against these lines at December 31, 2014. The Bank has a secured borrowing line available with the Federal Reserve Discount Window which is secured by a portion of the Bank’s loan portfolio. The Bank had no outstanding advances from the facility at December 31, 2014, which had an availability of approximately $2,187,000.
NOTES TO FINANCIAL STATEMENTS
20
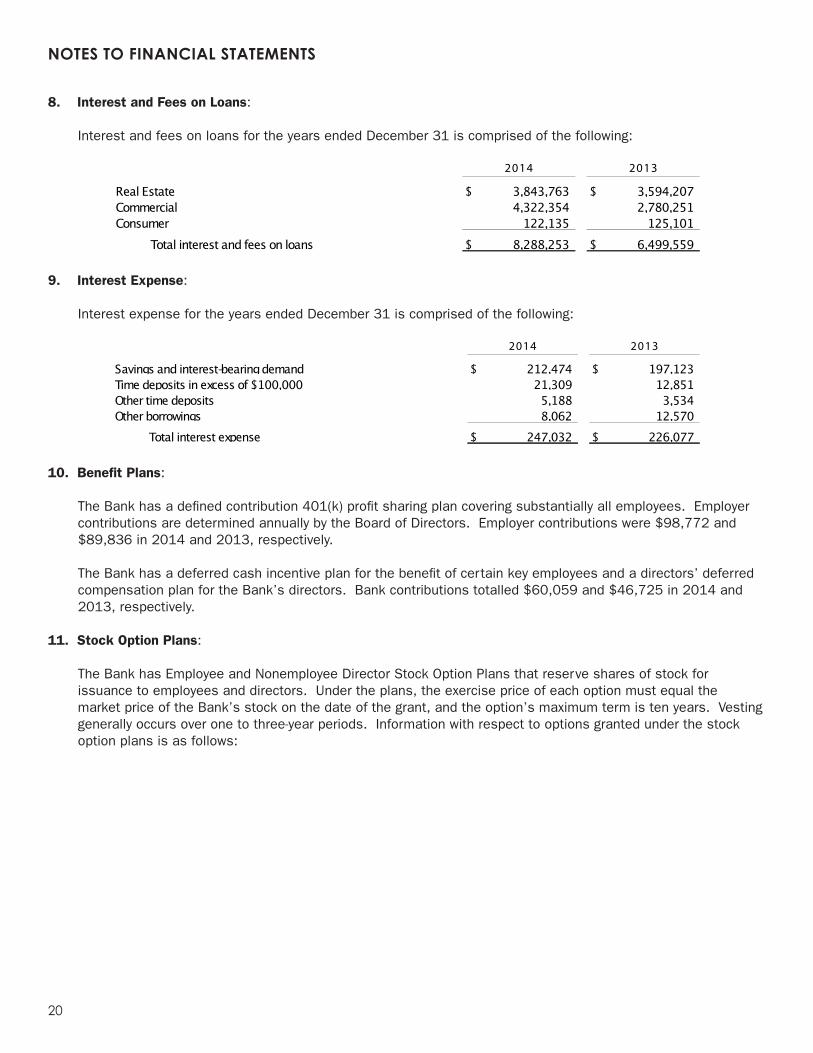
8. Interest and Fees on Loans:
Interest and fees on loans for the years ended December 31 is comprised of the following:
2014 2013
Real Estate 3,843,763$ 3,594,207$ Commercial 4,322,354 2,780,251 Consumer 122,135 125,101
Total interest and fees on loans 8,288,253$ 6,499,559$
9. Interest Expense:
Interest expense for the years ended December 31 is comprised of the following:
2014 2013
Savings and interest-bearing demand 212,474$ 197,123$ Time deposits in excess of $100,000 21,309 12,851Other time deposits 5,188 3,534Other borrowings 8,062 12,570
Total interest expense 247,032$ 226,077$
10. Benefit Plans:
The Bank has a defined contribution 401(k) profit sharing plan covering substantially all employees. Employer contributions are determined annually by the Board of Directors. Employer contributions were $98,772 and $89,836 in 2014 and 2013, respectively.
The Bank has a deferred cash incentive plan for the benefit of certain key employees and a directors’ deferred compensation plan for the Bank’s directors. Bank contributions totalled $60,059 and $46,725 in 2014 and 2013, respectively.
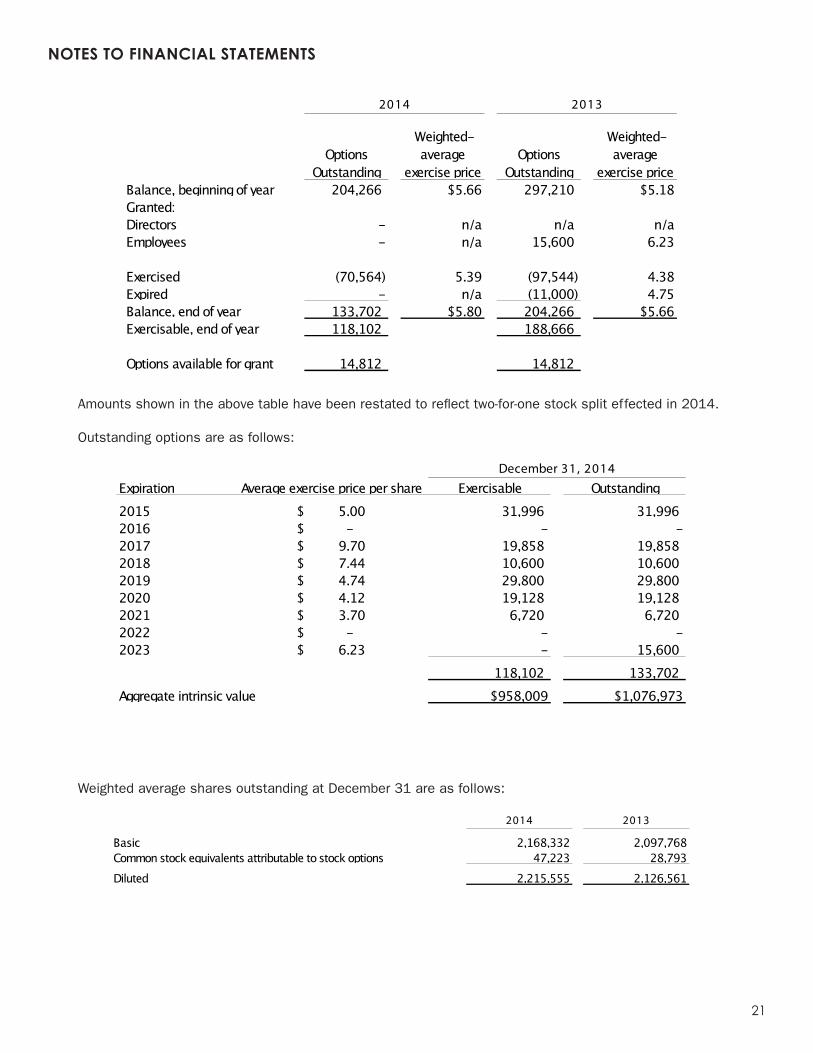
11. Stock Option Plans:
The Bank has Employee and Nonemployee Director Stock Option Plans that reserve shares of stock for issuance to employees and directors. Under the plans, the exercise price of each option must equal the market price of the Bank’s stock on the date of the grant, and the option’s maximum term is ten years. Vesting generally occurs over one to three-year periods. Information with respect to options granted under the stock option plans is as follows:
NOTES TO FINANCIAL STATEMENTS
21
Options Outstanding
Weighted- average
exercise priceOptions
Outstanding
Weighted- average
exercise priceBalance, beginning of year 204,266 $5.66 297,210 $5.18Granted:Directors - n/a n/a n/aEmployees - n/a 15,600 6.23
Exercised (70,564) 5.39 (97,544) 4.38Expired - n/a (11,000) 4.75Balance, end of year 133,702 $5.80 204,266 $5.66Exercisable, end of year 118,102 188,666
Options available for grant 14,812 14,812
2014 2013
Amounts shown in the above table have been restated to reflect two-for-one stock split effected in 2014.
Outstanding options are as follows:
Expiration Average exercise price per share Exercisable Outstanding2015 5.00$ 31,996 31,9962016 -$ - -2017 9.70$ 19,858 19,8582018 7.44$ 10,600 10,6002019 4.74$ 29,800 29,8002020 4.12$ 19,128 19,1282021 3.70$ 6,720 6,7202022 -$ - -2023 6.23$ - 15,600
118,102 133,702Aggregate intrinsic value $958,009 $1,076,973
December 31, 2014
Weighted average shares outstanding at December 31 are as follows:
2014 2013
Basic 2,168,332 2,097,768Common stock equivalents attributable to stock options 47,223 28,793Diluted 2,215,555 2,126,561
NOTES TO FINANCIAL STATEMENTS
22
The was no compensation cost related to stock options that has been charged against income (included in salaries and employee benefits) for the years ended December 31, 2014 and 2013, respectively. The total income tax benefit recognized in the income statement related to stock options was $26,285 and $0 for the years ended December 31, 2014 and 2013, respectively. As of December 31, 2014, there was $19,196 of total unrecognized compensation cost related to nonvested stock options which is expected to be recognized over a weighted-average period of 1.5 years.
The fair value of options granted under the Bank’s Stock Option Plans are estimated on the date of the grant using the Black-Scholes option pricing model. There were no options granted during 2014. The weighted average fair value of options granted in 2013 was $1.23.
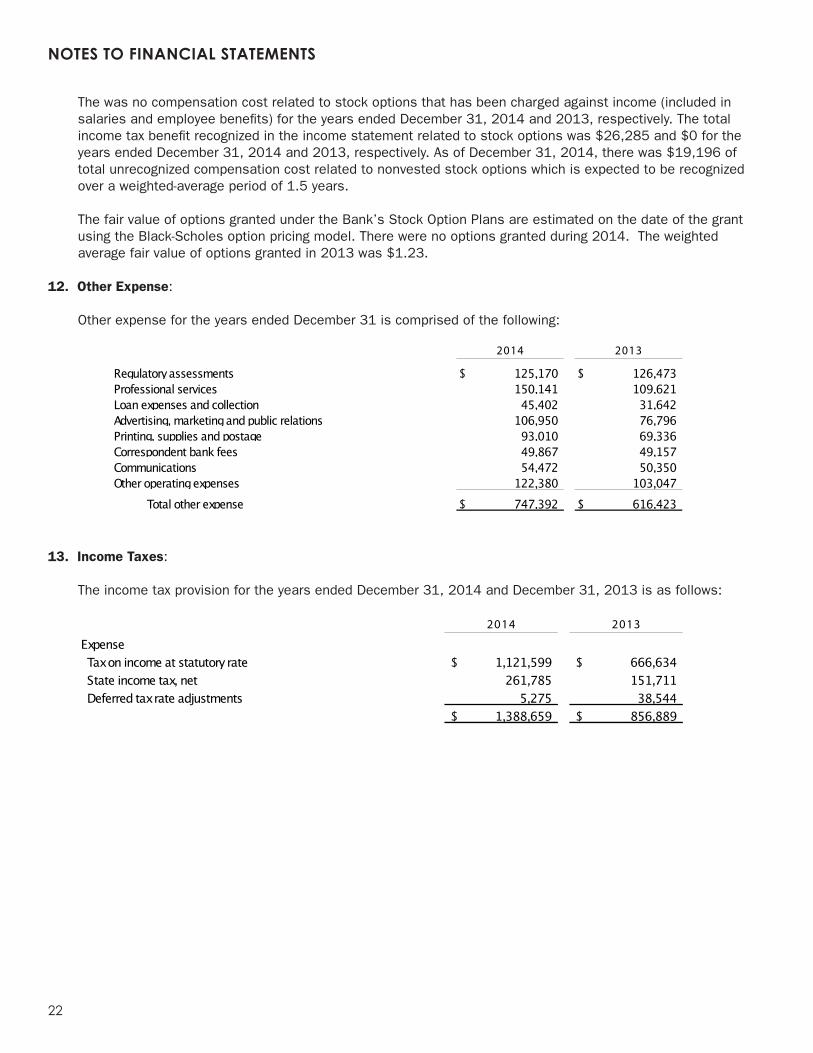
12. Other Expense:
Other expense for the years ended December 31 is comprised of the following:
2014 2013
Regulatory assessments 125,170$ 126,473$ Professional services 150,141 109,621Loan expenses and collection 45,402 31,642Advertising, marketing and public relations 106,950 76,796Printing, supplies and postage 93,010 69,336Correspondent bank fees 49,867 49,157Communications 54,472 50,350Other operating expenses 122,380 103,047
Total other expense 747,392$ 616,423$
13. Income Taxes:
The income tax provision for the years ended December 31, 2014 and December 31, 2013 is as follows:
2014 2013
Expense Tax on income at statutory rate 1,121,599$ 666,634$ State income tax, net 261,785 151,711 Deferred tax rate adjustments 5,275 38,544
1,388,659$ 856,889$
23
NOTES TO FINANCIAL STATEMENTS
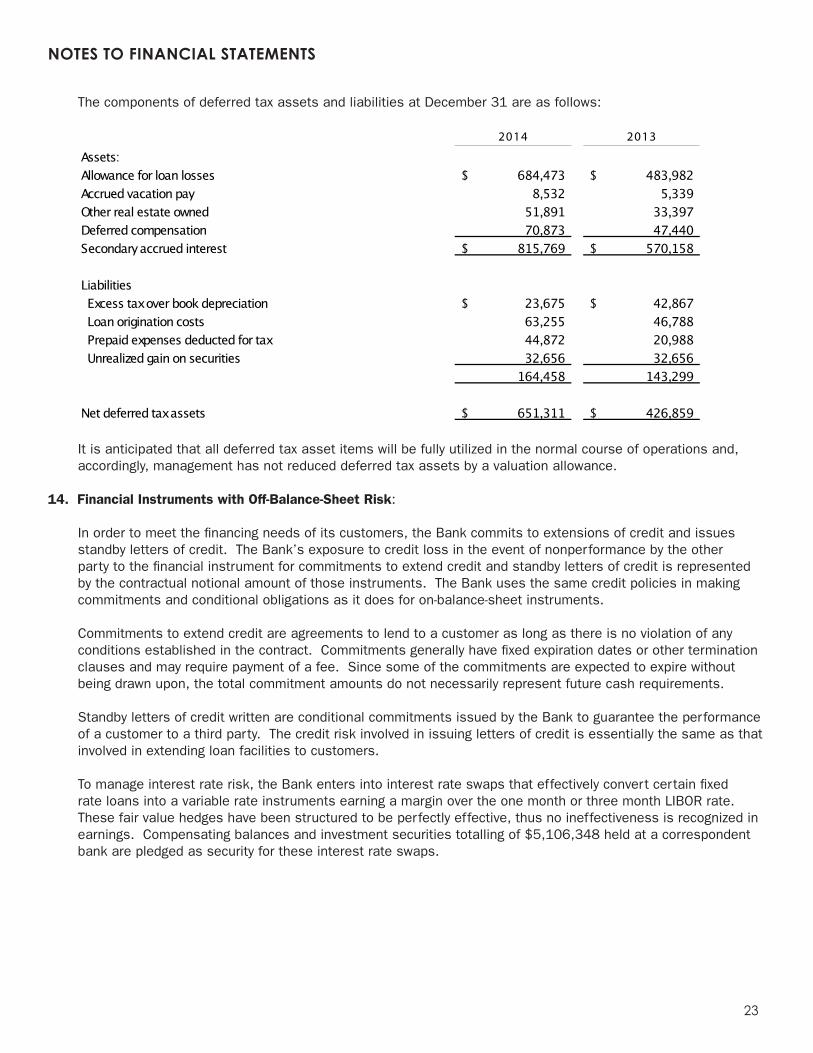
The components of deferred tax assets and liabilities at December 31 are as follows:
2014 2013
Assets:Allowance for loan losses 684,473$ 483,982$ Accrued vacation pay 8,532 5,339 Other real estate owned 51,891 33,397 Deferred compensation 70,873 47,440 Secondary accrued interest 815,769$ 570,158$
Liabilities Excess tax over book depreciation 23,675$ 42,867$ Loan origination costs 63,255 46,788 Prepaid expenses deducted for tax 44,872 20,988 Unrealized gain on securities 32,656 32,656
164,458 143,299
Net deferred tax assets 651,311$ 426,859$
It is anticipated that all deferred tax asset items will be fully utilized in the normal course of operations and, accordingly, management has not reduced deferred tax assets by a valuation allowance.
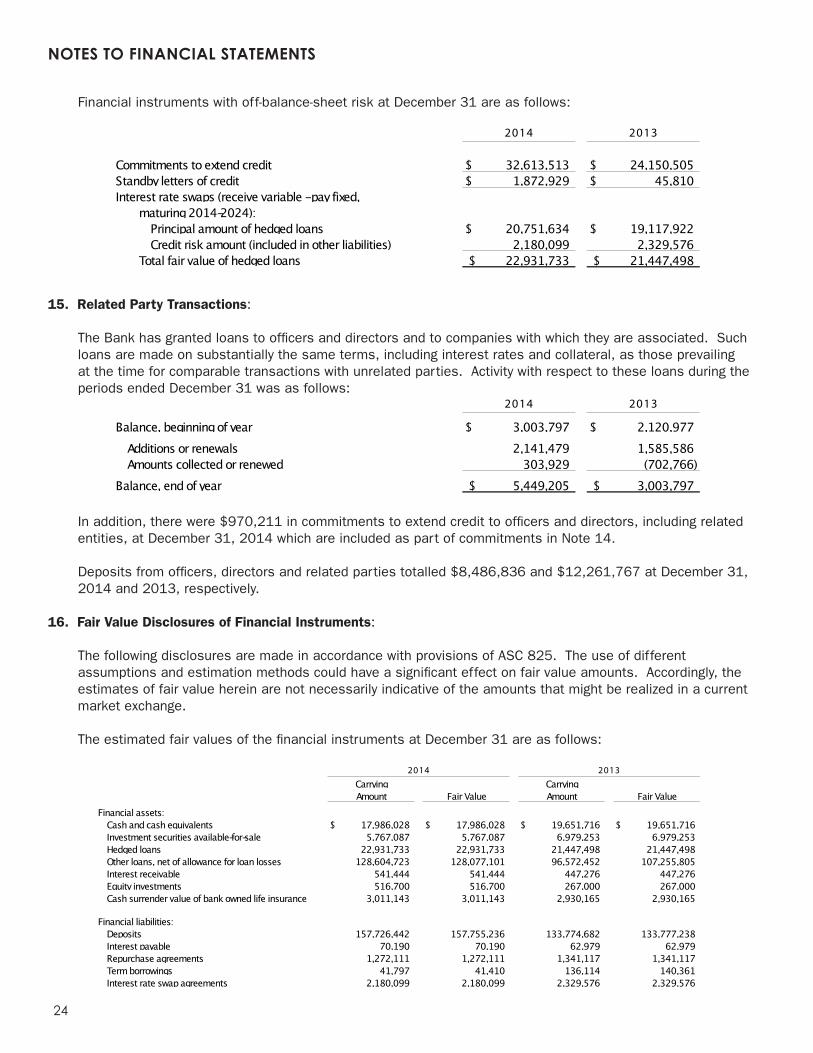
14. Financial Instruments with Off-Balance-Sheet Risk:
In order to meet the financing needs of its customers, the Bank commits to extensions of credit and issues standby letters of credit. The Bank’s exposure to credit loss in the event of nonperformance by the other party to the financial instrument for commitments to extend credit and standby letters of credit is represented by the contractual notional amount of those instruments. The Bank uses the same credit policies in making commitments and conditional obligations as it does for on-balance-sheet instruments.
Commitments to extend credit are agreements to lend to a customer as long as there is no violation of any conditions established in the contract. Commitments generally have fixed expiration dates or other termination clauses and may require payment of a fee. Since some of the commitments are expected to expire without being drawn upon, the total commitment amounts do not necessarily represent future cash requirements.
Standby letters of credit written are conditional commitments issued by the Bank to guarantee the performance of a customer to a third party. The credit risk involved in issuing letters of credit is essentially the same as that involved in extending loan facilities to customers.
To manage interest rate risk, the Bank enters into interest rate swaps that effectively convert certain fixed rate loans into a variable rate instruments earning a margin over the one month or three month LIBOR rate. These fair value hedges have been structured to be perfectly effective, thus no ineffectiveness is recognized in earnings. Compensating balances and investment securities totalling of $5,106,348 held at a correspondent bank are pledged as security for these interest rate swaps.
NOTES TO FINANCIAL STATEMENTS
24
Financial instruments with off-balance-sheet risk at December 31 are as follows:
2014 2013
Commitments to extend credit 32,613,513$ 24,150,505$ Standby letters of credit 1,872,929$ 45,810$ Interest rate swaps (receive variable - pay fixed,
maturing 2014-2024):Principal amount of hedged loans 20,751,634$ 19,117,922$ Credit risk amount (included in other liabilities) 2,180,099 2,329,576
Total fair value of hedged loans 22,931,733$ 21,447,498$
15. Related Party Transactions:
The Bank has granted loans to officers and directors and to companies with which they are associated. Such loans are made on substantially the same terms, including interest rates and collateral, as those prevailing at the time for comparable transactions with unrelated parties. Activity with respect to these loans during the periods ended December 31 was as follows:
2014 2013
Balance, beginning of year 3,003,797$ 2,120,977$ Additions or renewals 2,141,479 1,585,586Amounts collected or renewed 303,929 (702,766)
Balance, end of year 5,449,205$ 3,003,797$
In addition, there were $970,211 in commitments to extend credit to officers and directors, including related entities, at December 31, 2014 which are included as part of commitments in Note 14.
Deposits from officers, directors and related parties totalled $8,486,836 and $12,261,767 at December 31, 2014 and 2013, respectively.
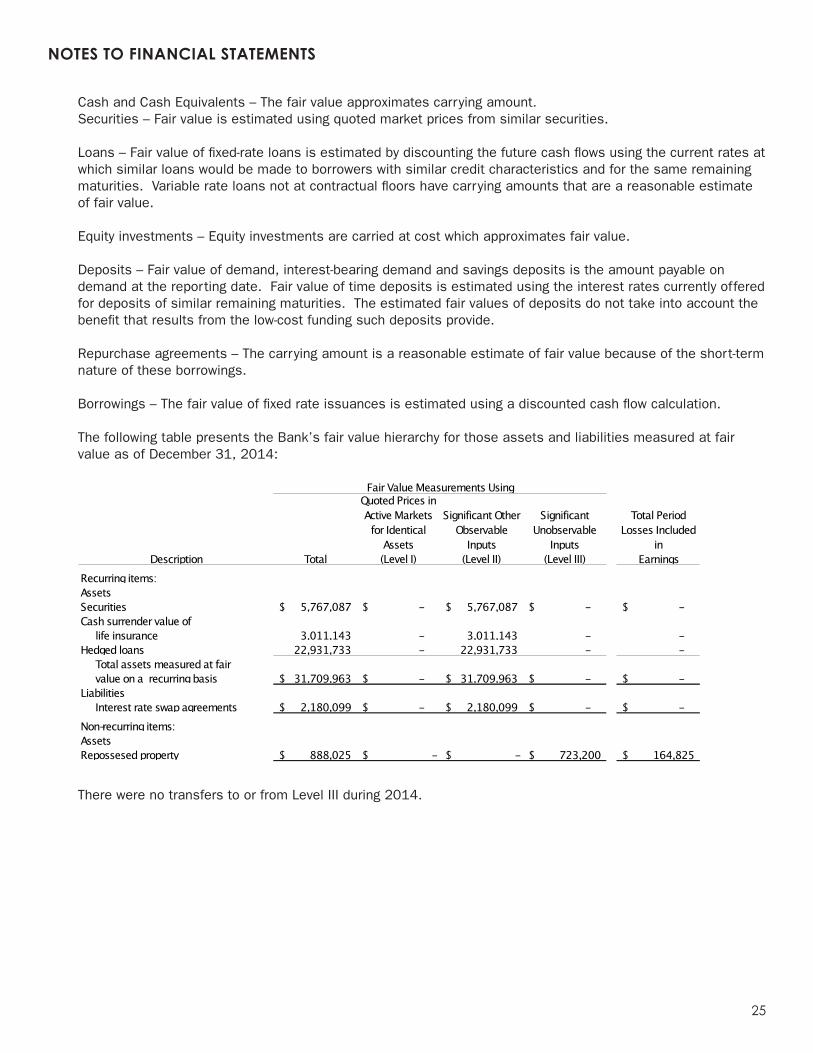
16. Fair Value Disclosures of Financial Instruments:
The following disclosures are made in accordance with provisions of ASC 825. The use of different assumptions and estimation methods could have a significant effect on fair value amounts. Accordingly, the estimates of fair value herein are not necessarily indicative of the amounts that might be realized in a current market exchange.
The estimated fair values of the financial instruments at December 31 are as follows:
2014 2013
Carrying CarryingAmount Fair Value Amount Fair Value
Financial assets:Cash and cash equivalents 17,986,028$ 17,986,028$ 19,651,716$ 19,651,716$ Investment securities available-for-sale 5,767,087 5,767,087 6,979,253 6,979,253Hedged loans 22,931,733 22,931,733 21,447,498 21,447,498Other loans, net of allowance for loan losses 128,604,723 128,077,101 96,572,452 107,255,805Interest receivable 541,444 541,444 447,276 447,276Equity investments 516,700 516,700 267,000 267,000Cash surrender value of bank owned life insurance 3,011,143 3,011,143 2,930,165 2,930,165
Financial liabilities:Deposits 157,726,442 157,755,236 133,774,682 133,777,238Interest payable 70,190 70,190 62,979 62,979Repurchase agreements 1,272,111 1,272,111 1,341,117 1,341,117Term borrowings 41,797 41,410 136,114 140,361Interest rate swap agreements 2,180,099 2,180,099 2,329,576 2,329,576
NOTES TO FINANCIAL STATEMENTS
25
Cash and Cash Equivalents – The fair value approximates carrying amount.Securities – Fair value is estimated using quoted market prices from similar securities.
Loans – Fair value of fixed-rate loans is estimated by discounting the future cash flows using the current rates at which similar loans would be made to borrowers with similar credit characteristics and for the same remaining maturities. Variable rate loans not at contractual floors have carrying amounts that are a reasonable estimate of fair value.
Equity investments – Equity investments are carried at cost which approximates fair value.
Deposits – Fair value of demand, interest-bearing demand and savings deposits is the amount payable on demand at the reporting date. Fair value of time deposits is estimated using the interest rates currently offered for deposits of similar remaining maturities. The estimated fair values of deposits do not take into account the benefit that results from the low-cost funding such deposits provide.
Repurchase agreements – The carrying amount is a reasonable estimate of fair value because of the short-term nature of these borrowings.
Borrowings – The fair value of fixed rate issuances is estimated using a discounted cash flow calculation.
The following table presents the Bank’s fair value hierarchy for those assets and liabilities measured at fair value as of December 31, 2014:
Quoted Prices in Active Markets for Identical
Assets
Significant Other Observable
Inputs
Significant Unobservable
Inputs
Total Period Losses Included
inTotal (Level I) (Level II) (Level III) Earnings
Recurring items:AssetsSecurities 5,767,087$ -$ 5,767,087$ -$ -$ Cash surrender value of
life insurance 3,011,143 - 3,011,143 - - Hedged loans 22,931,733 - 22,931,733 - -
Total assets measured at fair value on a recurring basis 31,709,963$ -$ 31,709,963$ -$ -$
LiabilitiesInterest rate swap agreements 2,180,099$ -$ 2,180,099$ -$ -$
Non-recurring items:AssetsRepossesed property 888,025$ -$ -$ 723,200$ 164,825$
Fair Value Measurements Using
Description
There were no transfers to or from Level III during 2014.
26
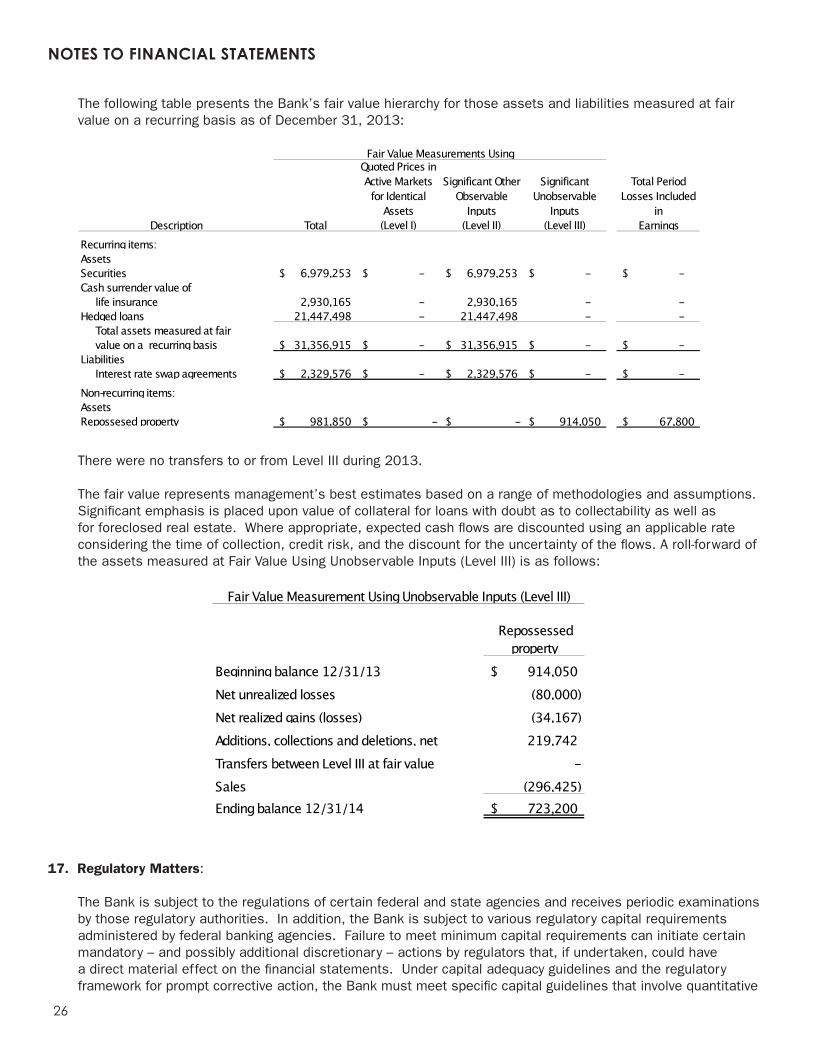
The following table presents the Bank’s fair value hierarchy for those assets and liabilities measured at fair value on a recurring basis as of December 31, 2013:
Quoted Prices in Active Markets for Identical
Assets
Significant Other Observable
Inputs
Significant Unobservable
Inputs
Total Period Losses Included
inTotal (Level I) (Level II) (Level III) Earnings
Recurring items:AssetsSecurities 6,979,253$ -$ 6,979,253$ -$ -$ Cash surrender value of
life insurance 2,930,165 - 2,930,165 - - Hedged loans 21,447,498 - 21,447,498 - -
Total assets measured at fair value on a recurring basis 31,356,915$ -$ 31,356,915$ -$ -$
LiabilitiesInterest rate swap agreements 2,329,576$ -$ 2,329,576$ -$ -$
Non-recurring items:AssetsRepossesed property 981,850$ -$ -$ 914,050$ 67,800$
Fair Value Measurements Using
Description
There were no transfers to or from Level III during 2013.
The fair value represents management’s best estimates based on a range of methodologies and assumptions. Significant emphasis is placed upon value of collateral for loans with doubt as to collectability as well as for foreclosed real estate. Where appropriate, expected cash flows are discounted using an applicable rate considering the time of collection, credit risk, and the discount for the uncertainty of the flows. A roll-forward of the assets measured at Fair Value Using Unobservable Inputs (Level III) is as follows:
Repossessed property
Beginning balance 12/31/13 914,050$ Net unrealized losses (80,000) Net realized gains (losses) (34,167) Additions, collections and deletions, net 219,742 Transfers between Level III at fair value - Sales (296,425) Ending balance 12/31/14 723,200$
Fair Value Measurement Using Unobservable Inputs (Level III)
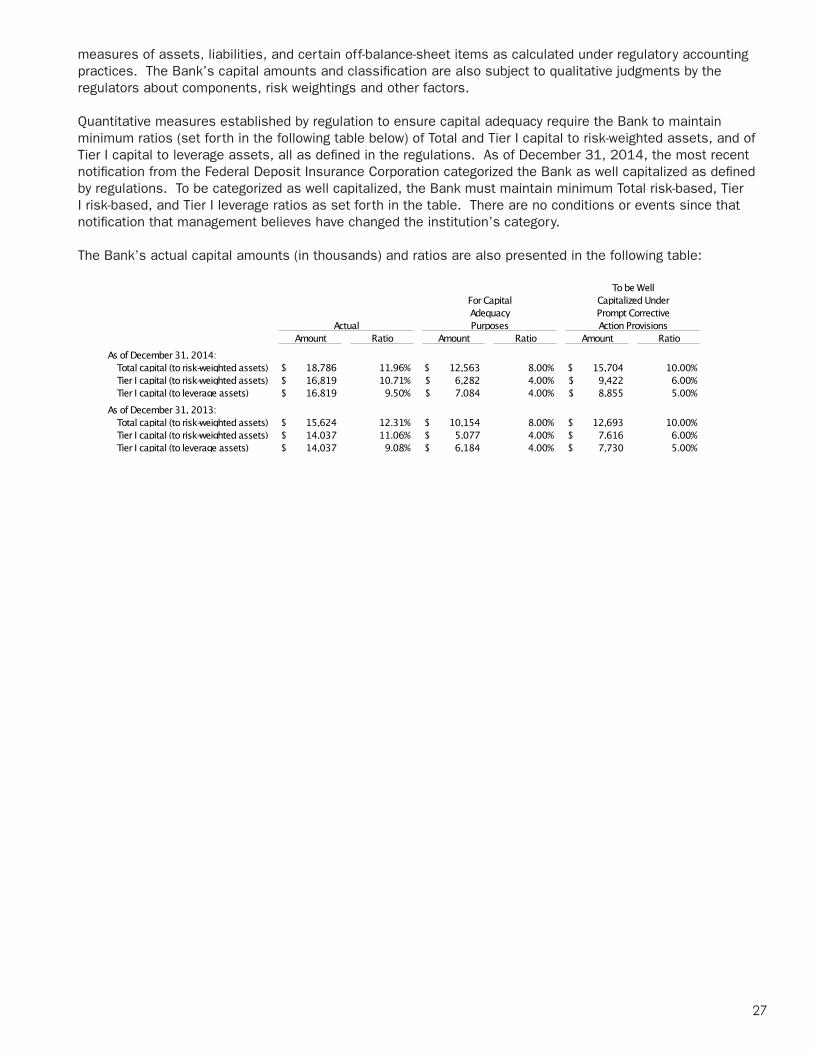
17. Regulatory Matters:
The Bank is subject to the regulations of certain federal and state agencies and receives periodic examinations by those regulatory authorities. In addition, the Bank is subject to various regulatory capital requirements administered by federal banking agencies. Failure to meet minimum capital requirements can initiate certain mandatory – and possibly additional discretionary – actions by regulators that, if undertaken, could have a direct material effect on the financial statements. Under capital adequacy guidelines and the regulatory framework for prompt corrective action, the Bank must meet specific capital guidelines that involve quantitative
NOTES TO FINANCIAL STATEMENTS
27
measures of assets, liabilities, and certain off-balance-sheet items as calculated under regulatory accounting practices. The Bank’s capital amounts and classification are also subject to qualitative judgments by the regulators about components, risk weightings and other factors.
Quantitative measures established by regulation to ensure capital adequacy require the Bank to maintain minimum ratios (set forth in the following table below) of Total and Tier I capital to risk-weighted assets, and of Tier I capital to leverage assets, all as defined in the regulations. As of December 31, 2014, the most recent notification from the Federal Deposit Insurance Corporation categorized the Bank as well capitalized as defined by regulations. To be categorized as well capitalized, the Bank must maintain minimum Total risk-based, Tier I risk-based, and Tier I leverage ratios as set forth in the table. There are no conditions or events since that notification that management believes have changed the institution’s category.
The Bank’s actual capital amounts (in thousands) and ratios are also presented in the following table:
Amount Ratio Amount Ratio Amount RatioAs of December 31, 2014:
Total capital (to risk-weighted assets) 18,786$ 11.96% 12,563$ 8.00% 15,704$ 10.00%Tier I capital (to risk-weighted assets) 16,819$ 10.71% 6,282$ 4.00% 9,422$ 6.00%Tier I capital (to leverage assets) 16,819$ 9.50% 7,084$ 4.00% 8,855$ 5.00%
As of December 31, 2013:Total capital (to risk-weighted assets) 15,624$ 12.31% 10,154$ 8.00% 12,693$ 10.00%Tier I capital (to risk-weighted assets) 14,037$ 11.06% 5,077$ 4.00% 7,616$ 6.00%Tier I capital (to leverage assets) 14,037$ 9.08% 6,184$ 4.00% 7,730$ 5.00%
Actual Purposes Action Provisions
To be WellFor Capital Capitalized UnderAdequacy Prompt Corrective

BOARD OF DIRECTORS
28
RICHARD M. ABRAHAM, MD Dr. Abraham has been a practicing Emergency and Occupational Medicine physician with Cascade Medical Associates since 1979 and is their current president. He is also managing partner of Eugene/Thurston/Junction City/Roseburg Urgent Care walk-in clinics and the medical director of Cascade Health Solutions Occupational Medicine Program. He is a founding Director of the Bank and also serves on the boards of Cascade Health Solutions and McKenzie Willamette Medical Center. He has previously served on the boards of MWMC Foundation, Pacific Source, the Safety and Health Institute, and the Marist Foundation.
ALAN V. EVANS Mr. Evans is a is founder and president of Evans, Elder & Brown, Inc., a commercial real estate brokerage active in sales, leasing, and development of commercial properties. He is a founding Director of the Bank and also serves as vice chair of the Arts and Business Alliance of Eugene. He previously served as chair of the Arts Foundation of Western Oregon and as a member of the boards of the Eugene Opera and the Oregon Bach Festival.
ROSS KARI Mr. Kari currently serves as a Trustee on the University of Oregon’s Board of Trustees. He retired in 2013 as executive vice president and chief financial officer of Freddie Mac where he was responsible for the company’s financial controls, accounting, investor relations, financial planning and reporting, tax, and compliance with the requirements of Sarbanes-Oxley. He spent a large portion of his career – from 1983 to 2001 – at Wells Fargo, rising from senior financial analyst to executive vice president and chief financial officer. He has also served as chief financial officer of Fifth Third Bank and Safeco and executive vice president and chief operating officer for the Federal Home Loan Bank of San Francisco. Mr. Kari received his Bachelor of Science degree in Mathematics and his MBA in Finance from the University of Oregon.
STEVEN J KORTH Mr. Korth is the director of real estate and development for his family business, McKay Investment Company. He has been a Director of the Bank since 2008 and has served on the boards of the Eugene Chamber of Commerce, Lane Metro Partnership, and the Oregon Community Foundation. He is also active in local government, having served on the Mayor of Eugene’s Economic Development Committee, the Eugene Enterprise Zone Committee, and as a member of the Eugene School Districts “Shaping 4-J’s Future” task force.
J. ANDREW MOORE Mr. Moore is co-president of Bigfoot Beverages. He has been a Director of the Bank since 2010 and also serves on the boards of the Oregon Soft Drink Association, the American Beverage Association, Cascade Health Solutions, and the Eugene Country Club. He previously served on the boards of the Pepsi-Cola Bottler’s Association and Lane Community College Foundation.
DENNIS G. OREM Mr. Orem is the CEO of Jerry’s Home Improvement Centers with stores in Eugene and Springfield. He is a founding Director of the Bank and has been an active participant in local, regional, and national industry trade organizations including serving on the boards of the Western Building Materials Association, the Home Center Institute, and the Eugene Chamber of Commerce.
GRETCHEN N. PIERCE Mrs. Pierce is president and General Manager of Hult & Associates, LLC, a local commercial and industrial real estate development company. She is a founding Director of the Bank and also serves on the boards of Pacific Source, Peace Health, and the Southern Oregon Leadership Council of the Oregon Community Foundation. She previously served on the boards of the University of Oregon Foundation, the Eugene Chamber of Commerce, the Oregon Community Foundation, Associated Oregon Industries, and Siuslaw Bank.
ANDY J. STORMENT Mr. Storment is the CEO of Kerr Concentrates, an Oregon based food ingredient company. He is a Founding Director of the Bank and current Board Vice Chair. He also manages investments in commercial real estate.

SUMMIT BANK TEAM
29
RACHEL ARBOGAST, Banker LISA CAGLE, Account ManagerTIM CALHOUN, Client Services OfficerJOYCE COLLEY, Vice President and Business Client AdvisorVICKIE CUSSINS, Corporate Secretary, Human Resources
and Administrative OfficerDARRYL DARE, Vice President and Technology Support
ManagerJAYSON DAVIS, Associate Business Client AdvisorM. (MICKEY) FENTON, SPHR, Corporate Secretary,
Human Resources and Administrative OfficerRODNEY GOEBEL, CourierSCOTT GOLDSTEIN, Corporate Cashier and
Chief Financial OfficerCHRIS HEMMINGS, Finance Analyst OLIVIA HEMMINGS, Client Services AdvisorMARA HOOKER, Director, Marketing & Business
DevelopmentJAMES JOHNSON, Equipment Finance Program ManagerCHRIS KLINE, Vice President and Business Client AdvisorGENEVIEVE McCLARY, Treasury Management Officer
HANS McKNIGHT, AAP, Client Services SpecialistVICKI MERAY, Business Client Services SpecialistJ. MICHAEL MERCER, Senior Vice President and
Chief Banking OfficerMARY MERRIMAN, Senior Vice President and
Chief Credit OfficerKATHY METZLER, Business Client Services SpecialistSUZETTE MOLINSKI, Account ManagerJACK OMLIN, BankerKRISTINA PARKER, Associate Business Client AdvisorCATHIE PHILLIPPE, Client Services SpecialistPAM PLILER, Senior Client Services Officer ERIK REICHERS, Vice President and Business Client AdvisorSUMMER ROAT, Administrative AssistantKIM SCOFIELD, Business Client Services OfficerALICIA VOORHEES, Associate Business Client AdvisorKIMBERLEE VOORHIES, Business Client Services SpecialistCRAIG WANICHEK, President and Chief Executive OfficerWILLIAM WHALEN, Senior Vice President and
Chief Lending Officer
CORPORATE OFFICE96 EAST BROADWAYEUGENE, OREGON 97401541-684-7500
SUMMITBANKONLINE.COM
INVESTOR INFORMATIONSCOTT [email protected]
STOCK SYMBOL SBKO
CRAIG WANICHEKMr. Wanichek is a Director and President & CEO of the Bank. He is a graduate of the University of Oregon with a Bachelor’s degree in Economics. He has seventeen years of banking experience during which he managed small to large business relationships in the Willamette Valley. He currently serves as the board chair of Cascade Health Solutions, a 100+ employee non-profit providing for the un-met health care needs of individuals in our community. He also serves on the Eugene Chamber board of directors, and previously served as chair of the City of Eugene Budget Committee and on the board of Associated Oregon Industries.
R. PAUL WEINHOLD Mr. Weinhold is the president of the University of Oregon Foundation. He is a founding Director of the Bank and currently serves as the Board Chair. He has served in leadership roles for a variety of local non-profits. Prior to joining the University of Oregon Foundation, he spent more than twenty years in leadership roles in the commercial insurance industry.
JOHN R. YORK, MD Dr. York is the retired president of Women’s Care Associates. He is a founding Director of the Bank. He previously served on the boards of Trillium Holdings, Agate Resources, Pacific Source, Medical and Surgical Specialists, and was the OBGYN department chair for Peace Health.
BOARD OF DIRECTORS

MOVE UP
Summit Bank96 east Broadway, eugene, oregon 97401
541.684.7500 SummitBankonline.com