Embed Size (px)
Citation preview


i
Annual Report & Accounts
For the Year ended 30th June 2012
Deposit Protection
Fund Board
i
Annual Report & Accounts
For the Year ended 30th June 2012
Deposit Protection
Fund Board

Vision
To be a best-practice deposit insurance scheme
Mission
To promote and contribute to public confidence in the stability of the nation’s financial system by providing a sound safety net for depositors of
member institutions.
Strategic Objectives• Promote an effective and efficient deposit insurance scheme
• Enhance operational efficiency
• Promote best practice
Strategic Pillars• Strong supervision and regulation
• Public confidence
• Prompt problem resolutions
• Public awareness
• Effective coordination
Corporate Values• Integrity
• Professionalism
• Team work
• Transparency and accountability
• Rule of Law
12
The Year under Review
23
Corp
orat
e S
oci
al R
esp
onsi
bili
ty
12
The Year under Review
iii

Corporate Information
Deposit Protection Fund Board CBK Pension House Harambee Avenue PO Box 45983 - 00100 Nairobi, Kenya Tel: +254 – 20 - 2861000 , 2863841
Fax: +254 – 20 - 2211122
Email : [email protected]
Website: www.centralbank.go.ke
Bankers
Central Bank of Kenya, Nairobi Haile Selassie Avenue PO Box 60000 - 00200 Nairobi
Auditors
KPMG Kenya 16th Floor, Lonrho House Standard Street PO Box 40612 - 00100 Nairobi
12
The
Year
un
der
Rev
iew
23Corporate Social Responsibility
12
The
Year
un
der
Rev
iew
iv

Table of Contents
Statement from the Chairman of the Board..................................................................................6
Taarifa kutoka kwa Mwenyeketi wa Bodi…………………………………................................7
Board of Directors.............................................................................................................................8
Senior Management..........................................................................................................................9
Message from the Director…………………………………………………..................................10
Ujumbe Kutoka kwa Mkurungezi …….………...........................................................................11
The Year Under Review... …………………………………….....……….............................……12
Performance of the economy ………………………………………................................… 12
Banking Sector Developments………………………………………..…................................… 14
Board Operations and Activities ………………………………….............................…………. 18
Liquidation Activities …………………………………………………............................……… 20
Corporate Social Responsibility……………………………………………............................… 23
Statement of Directors’ Responsibilities on the Financial Statements…….............................24
Report of the Independent Auditors……………………………………….............................…25
Statement of Corporate Governance………………………………..……...................................26
Income Statement……………………………………………………………................................28
Balance Sheet ………………………………………………………................................…29
Statement of Changes in Fund Balance…………………………………................................…30
Cash Flow Statement………………………………………………………..............................… 31
Accounting Policies and Notes to the Accounts………………………….............................…32
Appendices…………………………………………………………………...............................…51
Appendix I, Member banking institutions…………………………………..........................… 52
Appendix II, Membernon-banking institutions……………………………..........................…62
Appendix III,Member, deposit taking Microfinance institutions …………........................…63
12
The Year under Review
23
Corp
orat
e S
oci
al R
esp
onsi
bili
ty
12
The Year under Review
v
Tab
le o
f co
nte
nts

Statement from the Chairman of the Board
Over the last year, Deposit Protection Fund Board (DPFB) posted impressive results as performance registered the desired outcomes. In the period ending 30th June 2012, the Board realized a surplus of Ksh. 5.2 billion, compared to Ksh. 3.9 billion in the previous year. The Fund registered a growth of 18.4 percent on its fund to close at Ksh. 33.3 billion.
The year 2011/2012 was an eventful one for the DPFB as we recorded milestones in pursuit of our strategic initiatives. In particular, our progressive efforts to transform the current deposit insurance scheme from a pay-box system to a risk minimiser were realized through the enactment of a new legislation, The Kenya Deposit Insurance Act, 2012, which also established the Kenya Deposit Insurance Corporation(KDIC). In this regard, we have therefore set out our strategic roadmap to ensure successful implementation of the new deposit insurance regime.
Despite the economy having been exposed to supply side shocks, especially at the beginning of the period, due to drought conditions and the rise of world crude oil prices, we commend the response by the Monetary Policy Committee to review its policy stance to rein in inflationary expectations and stabilize the exchange rate. This policy direction is poised to be sustained and the domestic economy is expected to remain stable in the period ahead.
The domestic economy recorded another year of growth at 4.4 percent even though below the 5.5 percent target and the contagion effect from the global financial system remained limited. Rebuilding policy buffers and containing the surge in inflation will remain a policy priority.
It is gratifying to note that the Kenyan financial sector received a boost in enhancing a safe operating environment through the establishment of the Financial Reporting Centre (FRC) in efforts to combat Money Laundering. The Anti-Money Laundering Advisory Board held its inaugural meeting on 12th April, 2012 ushering in the operationalization of the FRC. This, together with the accompanying legislation, will protect the financial sector from money launderers and aid its credibility.
As I present, once again, the Annual Report of DPFB, I am truly grateful to members of the Board and the Management of the Fund for the achievements registered in 2011/2012. We will continue to spare no effort in supporting the management, especially in the critical path ahead of implementing the new deposit insurance regime.
Prof. Njuguna Ndung’uChairmanDeposit Protection Fund Board
12
The
Year
un
der
Rev
iew
23Corporate Social Responsibility
12
The
Year
un
der
Rev
iew
6
Sta
tem
ent
from
th
e Ch
airm
an
Prof. Njuguna Ndung’u
Chairman
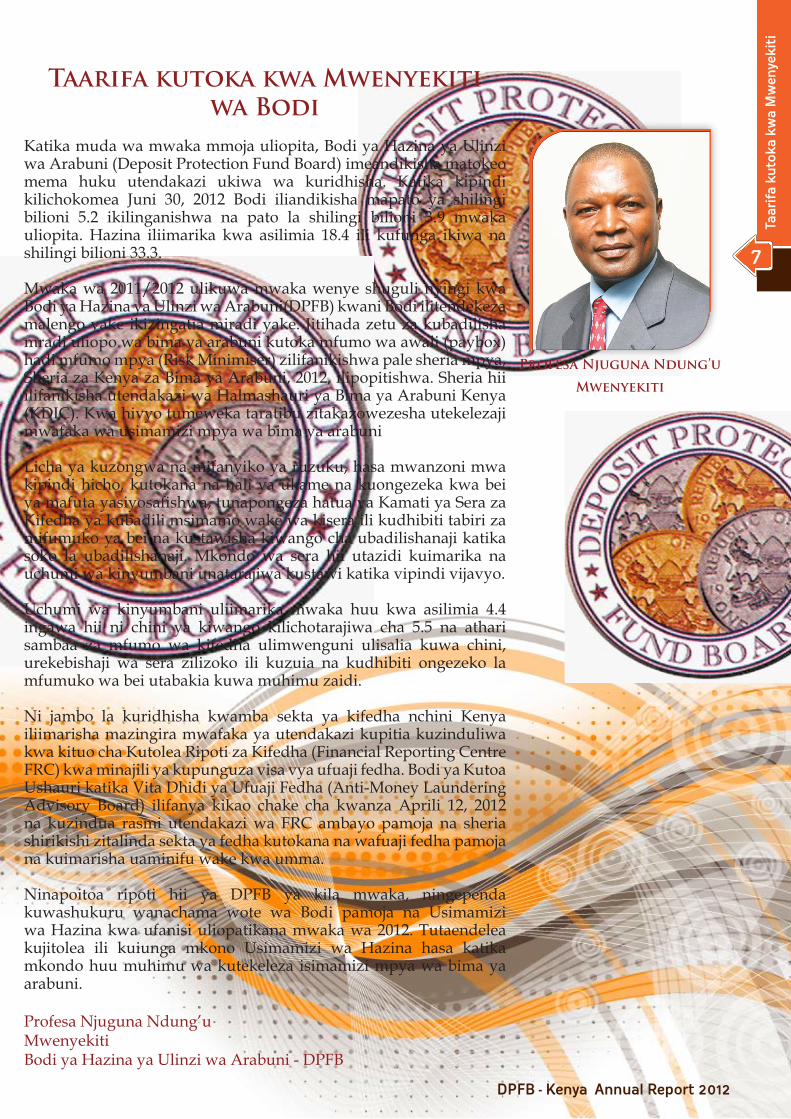
Taarifa kutoka kwa Mwenyekiti wa Bodi
Katika muda wa mwaka mmoja uliopita, Bodi ya Hazina ya Ulinzi wa Arabuni (Deposit Protection Fund Board) imeandikisha matokeo mema huku utendakazi ukiwa wa kuridhisha. Katika kipindi kilichokomea Juni 30, 2012 Bodi iliandikisha mapato ya shilingi bilioni 5.2 ikilinganishwa na pato la shilingi bilioni 3.9 mwaka uliopita. Hazina iliimarika kwa asilimia 18.4 ili kufunga ikiwa na shilingi bilioni 33.3.
Mwaka wa 2011/2012 ulikuwa mwaka wenye shuguli nyingi kwa Bodi ya Hazina ya Ulinzi wa Arabuni(DPFB) kwani Bodi ilitendekeza malengo yake ikizingatia miradi yake. Jitihada zetu za kubadilisha mradi uliopo wa bima ya arabuni kutoka mfumo wa awali (pay box) hadi mfumo mpya (Risk Minimiser) zilifanikishwa pale sheria mpya, Sheria za Kenya za Bima ya Arabuni, 2012, ilipopitishwa. Sheria hii ilifanikisha utendakazi wa Halmashauri ya Bima ya Arabuni Kenya (KDIC). Kwa hivyo tumeweka taratibu zitakazowezesha utekelezaji mwafaka wa usimamizi mpya wa bima ya arabuni
Licha ya kuzongwa na mifanyiko ya ruzuku, hasa mwanzoni mwa kipindi hicho, kutokana na hali ya ukame na kuongezeka kwa bei ya mafuta yasiyosafishwa, tunapongeza hatua ya Kamati ya Sera za Kifedha ya kubadili msimamo wake wa kisera ili kudhibiti tabiri za mifumuko ya bei na kustawisha kiwango cha ubadilishanaji katika soko la ubadilishanaji. Mkondo wa sera hii utazidi kuimarika na uchumi wa kinyumbani unatarajiwa kustawi katika vipindi vijavyo.
Uchumi wa kinyumbani uliimarika mwaka huu kwa asilimia 4.4 ingawa hii ni chini ya kiwango kilichotarajiwa cha 5.5 na athari sambaa za mfumo wa kifedha ulimwenguni ulisalia kuwa chini, urekebishaji wa sera zilizoko ili kuzuia na kudhibiti ongezeko la mfumuko wa bei utabakia kuwa muhimu zaidi.
Ni jambo la kuridhisha kwamba sekta ya kifedha nchini Kenya iliimarisha mazingira mwafaka ya utendakazi kupitia kuzinduliwa kwa kituo cha Kutolea Ripoti za Kifedha (Financial Reporting Centre FRC) kwa minajili ya kupunguza visa vya ufuaji fedha. Bodi ya Kutoa Ushauri katika Vita Dhidi ya Ufuaji Fedha (Anti-Money Laundering Advisory Board) ilifanya kikao chake cha kwanza Aprili 12, 2012 na kuzindua rasmi utendakazi wa FRC ambayo pamoja na sheria shirikishi zitalinda sekta ya fedha kutokana na wafuaji fedha pamoja na kuimarisha uaminifu wake kwa umma.
Ninapoitoa ripoti hii ya DPFB ya kila mwaka, ningependa kuwashukuru wanachama wote wa Bodi pamoja na Usimamizi wa Hazina kwa ufanisi uliopatikana mwaka wa 2012. Tutaendelea kujitolea ili kuiunga mkono Usimamizi wa Hazina hasa katika mkondo huu muhimu wa kutekeleza isimamizi mpya wa bima ya arabuni.
Profesa Njuguna Ndung’uMwenyekitiBodi ya Hazina ya Ulinzi wa Arabuni - DPFB
7
Taar
ifa
kuto
ka k
wa
Mw
enye
kiti
Profesa Njuguna Ndung’u
Mwenyekiti
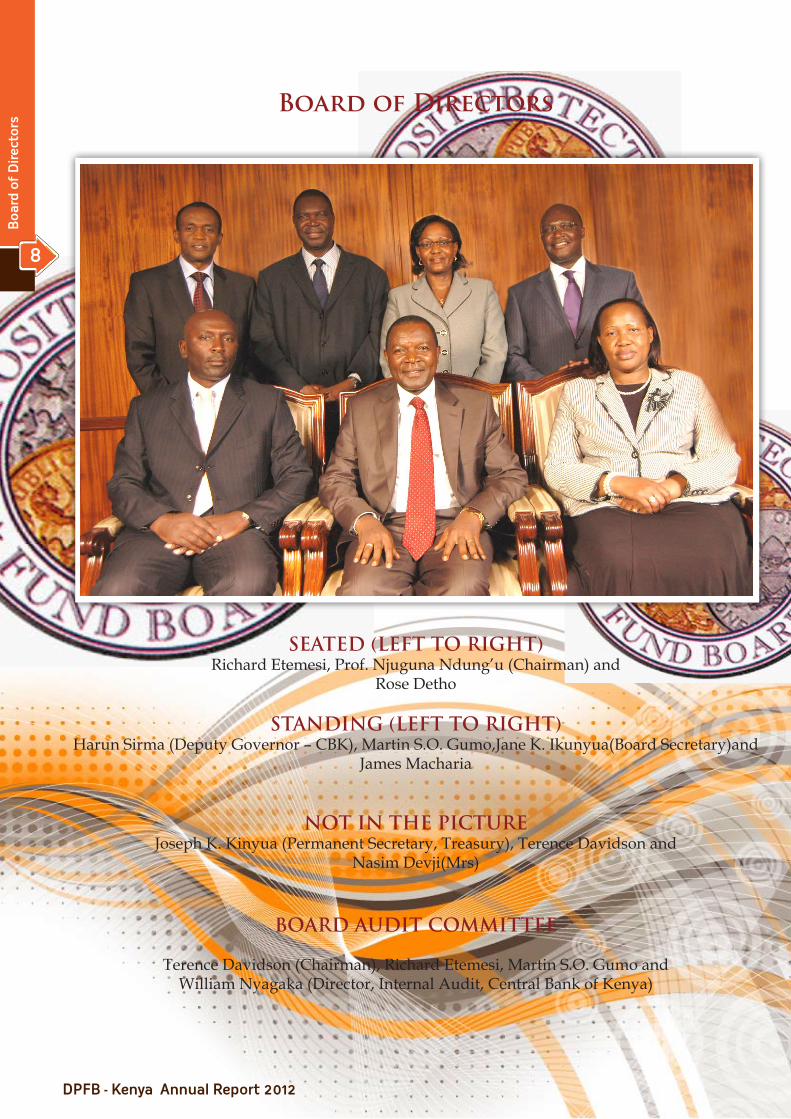
Board of Directors
SEATED (LEFT TO RIGHT)Richard Etemesi, Prof. Njuguna Ndung’u (Chairman) and
Rose Detho
STANDING (LEFT TO RIGHT)Harun Sirma (Deputy Governor – CBK), Martin S.O. Gumo,Jane K. Ikunyua(Board Secretary)and
James Macharia
NOT IN THE PICTUREJoseph K. Kinyua (Permanent Secretary, Treasury), Terence Davidson and
Nasim Devji(Mrs)
BOARD AUDIT COMMITTEE
Terence Davidson (Chairman), Richard Etemesi, Martin S.O. Gumo and William Nyagaka (Director, Internal Audit, Central Bank of Kenya)
8
Bo
ard
of
Dir
ecto
rs

Senior Management
SEATED (LEFT TO RIGHT)Jane K. Ikunyua (Board Secretary) and Rose Detho (Director, DPFB)
STANDING (LEFT TO RIGHT)Kimani Mwega (Assistant Director –Finance &Administration),Mohamud A. Mohamud (Assistant Director – Liquidations) and
Dr. W. O. Onyino (Assistant Director – ICT)
9
Sen
ior
Man
gem
ent

Message from the Director
The year 2011/2012 was a great period with accomplishments and significant milestones that marked sound progress for Deposit Protection Fund Board (DPFB). Our strategic direction and corporate objectives remained current and relevant in the period under review with the expected expansion of DPFB’s mandate, roles and responsibilities.
Since our establishment twenty three years ago, we have made significant progress in building a strong foundation for realizing our Vision of being recognized as a best practice deposit insurer. Indeed, this has been made possible with the passage of a new law in May 2012, The Kenya Deposit Insurance Act, which has enhanced the mandate of DPFB. In our new expanded role, we have been entrusted with more responsibilities to contribute to the stability of the financial system and to enhance public confidence. Therefore, we will continue to focus our efforts and resources to building our capacity and capability as well as the state of readiness of the Corporation in transforming the current DPFB to a new and enhanced scheme of deposit insurance.
The banking system proved its soundness and resilience and supported the financial intermediation of the domestic economic. The performance of the banking sector registered remarkable improvement closing the period with a strong capital base and adequate liquidity.
Positive developments continued to be made during the year towards the goal of extending financial inclusion. This culminated in the growth of depositors by 16 percent to stand at 16.47 million deposit accounts with a corresponding growth of the industry deposit base by 18 percent to close the period at Kshs. 1.678 trillion. In these developments, DPFB played its rightful role and fully covered 95 percent of total deposit accounts in the industry and increased the volume of total coverage from Kshs.168 billion to Kshs. 179 billion.
The banking sector is expected to maintain its growth momentum underpinned by increased regional presence of Kenyan banks while standing as a strong pillar in transmitting the economic policy of financial inclusion.
I take this opportunity to express my appreciation to the Board of Directors for the continuous support and guidance, and to all staff of the Fund for embracing DPFB’s core values and having worked tirelessly to realize the achievements of 2011/2012.
Rose Detho,DirectorDeposit Protection Fund Board
10
Mes
sag
e fr
om t
he
Dir
ecto
r
Rose Detho
Director

Ujumbe kutoka kwa Mkurugenzi
Kipindi cha mwaka wa 2011/2012 kilikuwa chenye mafanikio mengi na malengo kuu kutimizwa, kwa hiyo kuimarisha Bodi ya Hazina ya Ulinzi wa Arabuni (DPFB). Mikakati ya mkondo tutakayofuata pamoja na majukumu yetu ya kibiashara yanaendelea kushugulikia mahitaji ya sasa katika kipindi chini ya uchunguzi huku upanuzi wa majukumu na wajibu wa Shirika ukitarajiwa.
Tangu kuanzishwa kwa kituo hiki miaka ishirini na mitatu iliyopita, tumekuwa na maendeleo ya kutajika katika ujenzi wa muundo msingi imara utakao tuwezesha kutendekeza Ruia yetu ya kutambulika kama mtoaji bora zaidi wa bima ya arabuni. Kwa kweli, jambo hili lilifanikishwa kwa kupitishwa kwa sheria mpya mwezi Mei 2012, Sheria za Bima ya Arabuni nchini Kenya, ambayo imeimarisha uwezo wa DPFB. Katika majukumu yetu yaliyopanuliwa, tumeongezewa majukumu mengine yatakayochangia ustawi wa mfumo wa kifedha na kuimarisha imani ya umma katika asasi za kiuchumi. Kwa hivyo, tutazidi kulenga jitihada na rasilimali yetu katika ukuzaji wa uwezo wetu pamoja na kulitayarisha Shirika hili la DPFB kwa mabadiliko, kutoka ilivyo hadi mradi mpya na imara wa kutoa bima ya arabuni.
Mfumo wa benki ulidhihirisha ukomavu wake kwa kuingilia kati na kuimarisha uchumi wa kinyumbani. Utendakazi wa sekta ya benki uliimarika zaidi na kufunga kipindi ukiwa na kiwango kikubwa cha mtaji na uoewevu wa kutosha kifedha.
Maendeleo chanya yamezidi kuonekana mwaka huu yakilenga kueneza huduma za kifedha kwa wale maskini na wenye mapato ya chini. Maendeleo haya yalichangia kuimarika kwa wawekaji kwa asilimia 16 hadi akaonti milioni 16.47 za wawekaji pamoja na kuimarika kwa jumla ya arabuni katika akaonti hizi kwa asilimia 18 hadi shilingi trilioni 1.678 kufikia mwisho wa kipindi hicho. Katika maendeleo haya, DPFB ilifanya jukumu lake kikamilifu na kutoa bima kwa asilimia 95 ya arabuni zote katika sekta hii, kwa hiyo kuongeza jumla ya bima kutoka bilioni 168 hadi bilioni 179.
Sekta ya benki inatarajiwa kudumisha ustawi wake kutokana na ongezeko la matawi ya benki za kinyumbani katika kanda hii ya Afrika Mashariki huku ikizidi kuwa nguzo kuu katika kuendeleza sera za kichumi hasa katika uenezi wa huduma za kifedha kwa wale maskini na wenye mapato ya chini.
Nachukua nafasi hii kutoa shukurani zangu kwa Bodi ya Wasimamizi kwa uongozi wao na kwa wafanyakazi wote wa Hazina ya Arabuni kwa kujitolea muhanga na kufanya kazi ili kutendekeza malengo yetu ya mwaka wa 2012.
Rose DethoMkurugenzi MkuuBodi ya Hazina ya Ulinzi wa Arabuni - DPFB
11
Uju
mb
e ku
toka
kw
a M
kuru
gen
zi
Rose Detho
Mkurugenzi

THE YEAR UNDER REVIEW
I. Introduction The DPFB registered significant improvement in its operations in the year under review. No Financial Institution was placed under liquidation during the year. During the period, “Kenya Deposit Insurance Bill“, was enacted into Law by Parliament, and received the Presidential assent on 9th May, 2012. The new Act, which was still to be operationalized as at the end of the year under review, will enable the Board to operate as an autonomous body, with broader mandate encompassing supervision and risk minimization, besides the traditional objects, in line with international best practice. It is important to note, however, that by the end of the period under review, plans were at an advanced stage to institute subsidiary laws, rules, guidelines and regulations to facilitate the operationalization of the Kenya Deposit Insurance Act (KDIA).
The Financial Position of the Board improved, with the Fund registering an increase of Kshs.1,255 million in net surplus, up from Kshs.3,941 million recorded in the previous year, to Kshs. 5,196 million realized in the year under review.
The Institutions under liquidation, on their part, continued to pursue their statutory obligations. The Institutions in Liquidation, collectively, and cumulatively, paid a total of Kshs. 1, 114 million of protected deposits, effective the respective liquidation dates. The cumulative dividends paid by the Twenty Four (24) Institutions in Liquidation, up to the end of the period under review, amounted to Kshs. 5,630.94 million. During the same period, the Institutions in Liquidation, together, recovered a cumulative total of Kshs. 6,408 million in debt, compared to Kshs. 6,081 million collected as at 30th June, 2011; an increase of Kshs. 326 million.
The realization of KDI Act is a milestone in the achievement of the expanded mandate and responsibility for the DPFB, and requires development of subsidiary legislation and guidelines, to have it operationalised. When operationalized, the Act will go a long way in building confidence in the Banking Sector and fostering public confidence.
II. Performance of the economy
Real GDP increased by 4.4 percent in 2011 from 5.8 percent in 2010. All activities in the economy registered positive growth rates in 2011 except for electricity and water. In terms of sector specific contribution to total volume produced in 2011, Agriculture and Forestry contributed 21.0 percent while, Transport and Communication, Wholesale and retail trade, and Manufacturing contributed 12.4 percent, 10.8 percent and 9.6 percent, respectively. The economy, however, performed sluggish-ly in the first three months of 2012, registering real output growth of 3.5 percent. The weak growth was attributed to adverse weather conditions which impacted negatively on agricultural output and generation of hydroelectric power. Growth in the quarter was also affected by a severe frost that af-fected tea and horticultural output.
Overall 12-month inflation declined from 14.5 percent in June 2011 to 10.0 percent in June 2012. The slowdown in overall 12-month inflation in the year to June 2012 largely reflected easing in both food and fuel inflation. Reduced food inflation reflected improved weather conditions that supported food production while reduced fuel inflation was attributed to a decline in international oil prices. The monetary policy during the fiscal year 2011/2012 was primarily set to reduce inflationary pres-sures driven by monetary conditions. The tightening of policy helped to slow the rise in non-food, non-fuel inflation and to also stabilize the Shilling exchange rate.
12
The
Year
un
der
Rev
iew
12
The
Year
Un
der
Rev
iew

During the fiscal year 2011/12, the Monetary Policy Committee (MPC) adopted a tight monetary policy stance to rein in inflation and inflationary expectations and stabilize the exchange rate volatility. The Central Bank Rate (CBR) was the main instrument used to signal the direction of monetary policy. The MPC gradually revised CBR upward in the month of July, 2011 by 75 basis points from 6.25 percent to 7.0 percent in September 2011 and thereafter due to persistent risks to both inflation and exchange rate stability, the Committee enhanced the tight monetary stance by raising the CBR by 400, 550 and 150 basis points, in October, November and December 2011, respectively to stand at 18.0 percent through to June 2012. Emanating from the tight monetary policy stance, the short-term interest rates, particularly interbank rates increased from 8.61 percent in July 2011 to 28.90 percent in November 2011 and thereafter declined to reach 17.09 percent in June 2012. The easing of the average interbank rate during the second half of the fiscal year 2011-12 reflected improved market liquidity supported by net redemptions of Government securities.
The 91-day Treasury bill rate and the 182-day Treasury bill rate trended upwards during the first seven months of fiscal year 2011/12 before declining in the second half of 2011/12. The 91-day Treasury bill rate increased from 8.99 percent in July 2011 to 20.56 percent in January 2012 and declined thereafter to average 10.09 percent in June 2012. Similarly, the 182-day Treasury bill rate increased from 9.85 percent in July 2011 to 20.69 percent in January 2012 and declined thereafter to an average of 10.67 percent in June 2012. The average lending rates rose from 14.14 percent in July 2011 to 20.41 percent in June 2012, while the average deposit rates rose from 3.85 percent in July 2011 to 7.88 percent in June 2012. The increase in the overall lending rate in the year to June 2012 was much higher than the rise in overall deposits rate. Consequently, the interest rate spread widened from 10.29 percent in July 2011 to 12.52 in June 2012
The Kenya Shilling depreciated against all major world currencies in the year to June 2012. On average, the shilling depreciated by 7.72 percent, 7.3 percent, 5.98 percent and 13.58 percent respectively against the US dollar, the Sterling Pound, the Euro and the Japanese Yen to exchange at an average of Kshs 88.83 per US dollar, Kshs 140.74 per Sterling Pound, Kshs 119.24 per Euro and Kshs 112.83 per 100 Japanese Yen in the year to June 2012, compared to Kshs 82.46 per US dollar, Kshs 131.17 per Sterling Pound, Kshs 112.51 per Euro and Kshs 99.33 per 100 Japanese Yen in the year to June 2011. In the EAC region, the Kenya Shilling depreciated in the year to June 2012 against the Uganda Shilling but appreciated against the Tanzania Shilling. On average, the Uganda shilling and the Tanzania shilling exchanged at Ush 28.83 per Kenya Shilling and Tsh 18.29 per Kenya shilling compared to Ush 28.18 per Kenya shilling and Tsh 18.31 per Kenya shilling in the year to June 2012.
Kenya’s balance of payments developments in 2011 reflected both domestic and external events. On one hand, the World GDP growth declined to 3.8 percent in 2011 from 5.0 percent in 2010 owing to the crisis in the Euro Area, high oil prices and inflationary pressure in many emerging and developing economies. Likewise, global growth declined to 6.7 percent in 2011 from 12.6 percent in 2010. Receipts from Kenya’s exports of goods increased by 7 percent while those from services increased by 12 percent in the year to June 2012. Kenya’s current account position worsened as the deficit widened to US$ 3,895 million in the year to June 2012 from US$ 2,800 million in the year to June 2011. This was due to US$ 2,072 million increase in imports while exports increased by US$ 366 million. The overall balance of payments surplus increased from US$ 261 million during the year to June 2011 to US$ 841 million during the year to June 2012 largely on account of surplus in the capital and financial account.The surplus in the capital and financial account grew by 55 percent or US$1,675 million, mainly on account of increased financial flows attributed to net official (medium to long-term) flows which increased by US$ 793 million from US$ 335 million in the year to June 2011 to US$ 1,128 million in the year to June 2012 and short term flows including net errors and omissions which rose from US$ 1,831 million to US$ 3,385 million over the same period.
13
The
Year
Un
der
Rev
iew

The Central Government budgetary operations in the fiscal year 2011/12 resulted in a deficit of Kshs 181.5 billion (5.5 percent of GDP) on commitment basis compared with Kshs 137.6 billion (5.0 percent of GDP) in the fiscal year 2010/11. Government revenues and grants increased by a total of Kshs 54.9 billion to stand at Kshs 734.4 billion in fiscal year 2011/12, from Kshs 679.5 billion collected in a similar period of the fiscal year 2010/11, but underperformed with respect to the targeted amounts of Kshs 804.5 billion and Kshs 42.2 billion for the domestic revenues and external grants, respectively. Government expenditure and net lending increased by Kshs 98.8 billion in the fiscal year 2011/12 from Kshs 817.1 billion expended during a similar period of the previous fiscal year. Total expenditure comprised Kshs 639.1 billion and Kshs 276.8 billion in recurrent and development expenditure, respectively. The resulting deficit was financed through Kshs 73.6 billion borrowing from domestic sources and Kshs 99.4 billion borrowing from external sources. Total domestic debt increased by Kshs 94.6 billion from Kshs 764.2 billion at the end of June 2011 to Kshs 858.8 billion at the end of June 2012 while external debt expanded by Kshs 47.3 billion, during the period.
III. Banking Sector Developments
Overview
During the period ended June 30th, 2012, the Kenyan banking sector comprised of 43 commercial banks, 1 mortgage finance company, 6 deposit taking micro-finance institutions, 2 credit reference bureaus, 6 representative offices and 115 foreign exchange bureaus.
The Banking Sector registered enhanced performance as indicated by the growth in the key indicators such as assets which stood at Kshs 2.2 trillion, gross loans and advances at Kshs 1.3 trillion, deposits at Kshs 1.7 trillion and profit before tax at Kshs 53.2 billion as at 30th June 2012. The number of bank customer deposit accounts stood at 14.9 million while that of bank loan accounts were 2.1 million.
Structure of the Balance Sheet
The banking sector aggregate balance sheet expanded by 15.8 percent from Kshs 1.9 trillion in June 2011 to Kshs 2.2 trillion in June 2012. The major components of the balance sheet on the asset side were loans and advances, government securities and placements, which accounted for 56.6 percent, 19.5 percent and 7.3 percent of total assets respectively, while customer deposits were the main component on the liabilities side.
TABLE 1: BALANCE SHEET (KSHS MILLION) Jun-12 Jun-11 % Change Cash 39,669 36,319 9% Balances at CBK 122,183 80,298 52% Placements 160,073 115,954 38% Govt. Securities 428,733 421,570 2% Other Investments 46,727 46,550 0% Loans & Advances (Net) 1,242,367 1,038,853 20% Other Assets 155,253 134,222 16% Total Assets 2,195,005 1,873,766 17% Deposits 1,667,760 1,412,841 18% Other Liabilities 212,130 196,014 8% Capital & Reserves 315,115 264,911 19% Total Liabilities and Shareholders’ Funds 2,195,005 1,873,766 17% Source: CBK
12
The
Year
un
der
Rev
iew
14
Ban
kin
g S
ecto
r D
evel
opm
ents
Loans and Advances
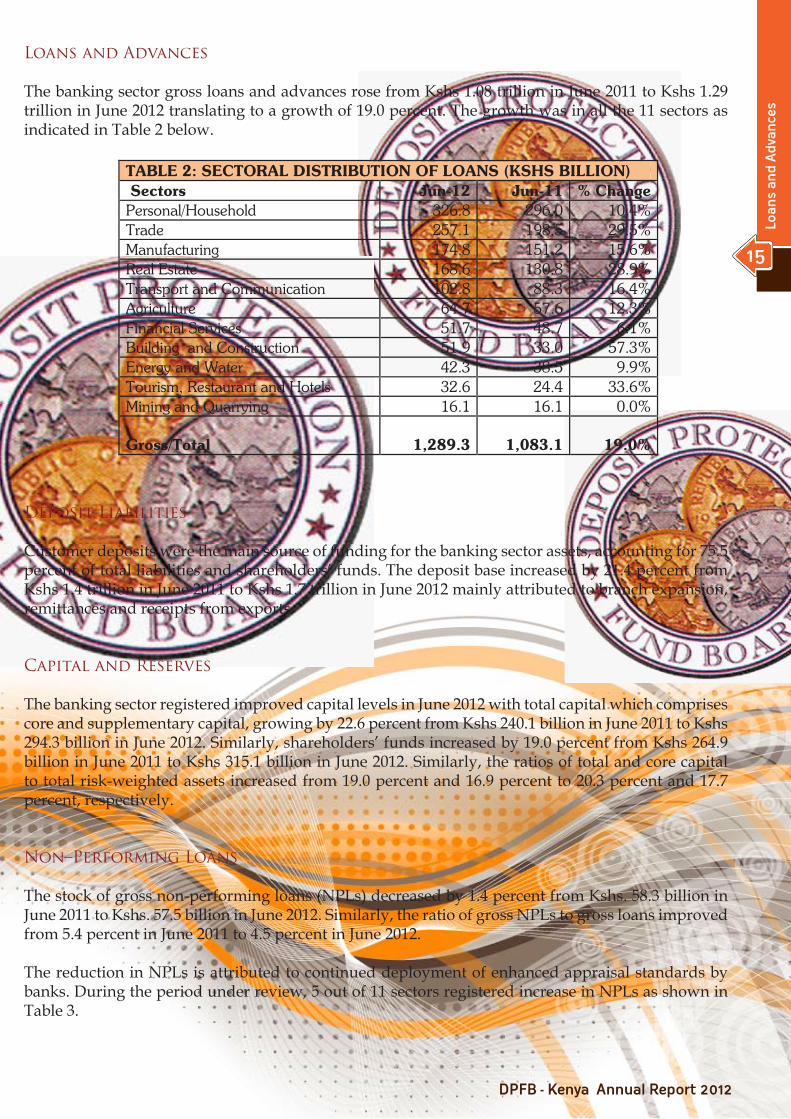
The banking sector gross loans and advances rose from Kshs 1.08 trillion in June 2011 to Kshs 1.29 trillion in June 2012 translating to a growth of 19.0 percent. The growth was in all the 11 sectors as indicated in Table 2 below.
Deposit Liabilities
Customer deposits were the main source of funding for the banking sector assets, accounting for 75.5 percent of total liabilities and shareholders’ funds. The deposit base increased by 21.4 percent from Kshs 1.4 trillion in June 2011 to Kshs 1.7 trillion in June 2012 mainly attributed to branch expansion, remittances and receipts from exports.
Capital and Reserves
The banking sector registered improved capital levels in June 2012 with total capital which comprises core and supplementary capital, growing by 22.6 percent from Kshs 240.1 billion in June 2011 to Kshs 294.3 billion in June 2012. Similarly, shareholders’ funds increased by 19.0 percent from Kshs 264.9 billion in June 2011 to Kshs 315.1 billion in June 2012. Similarly, the ratios of total and core capital to total risk-weighted assets increased from 19.0 percent and 16.9 percent to 20.3 percent and 17.7 percent, respectively.
Non–Performing Loans
The stock of gross non-performing loans (NPLs) decreased by 1.4 percent from Kshs. 58.3 billion in June 2011 to Kshs. 57.5 billion in June 2012. Similarly, the ratio of gross NPLs to gross loans improved from 5.4 percent in June 2011 to 4.5 percent in June 2012.
The reduction in NPLs is attributed to continued deployment of enhanced appraisal standards by banks. During the period under review, 5 out of 11 sectors registered increase in NPLs as shown in Table 3.
TABLE 2: SECTORAL DISTRIBUTION OF LOANS (KSHS BILLION) Sectors Jun-12 Jun-11 % Change Personal/Household 326.8 296.0 10.4% Trade 257.1 198.5 29.5% Manufacturing 174.8 151.2 15.6% Real Estate 168.6 130.8 28.9% Transport and Communication 102.8 88.3 16.4% Agriculture 64.7 57.6 12.3% Financial Services 51.7 48.7 6.1% Building and Construction 51.9 33.0 57.3% Energy and Water 42.3 38.5 9.9% Tourism, Restaurant and Hotels 32.6 24.4 33.6% Mining and Quarrying 16.1 16.1 0.0%
Gross/Total
1,289.3
1,083.1 19.0%
12
The Year under Review
15
Loan
s an
d A
dva
nce
s
Profitability
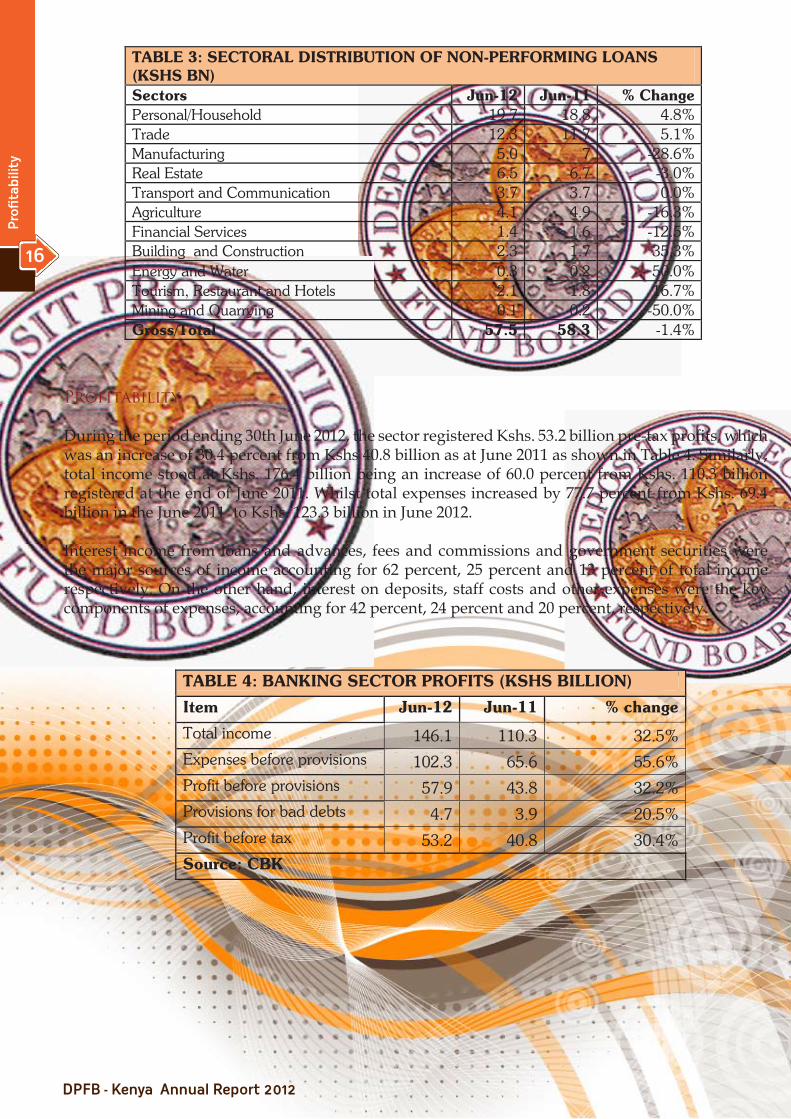
During the period ending 30th June 2012, the sector registered Kshs. 53.2 billion pre-tax profits, which was an increase of 30.4 percent from Kshs 40.8 billion as at June 2011 as shown in Table 4. Similarly, total income stood at Kshs. 176.4 billion being an increase of 60.0 percent from Kshs. 110.3 billion registered at the end of June 2011. Whilst total expenses increased by 77.7 percent from Kshs. 69.4 billion in the June 2011 to Kshs. 123.3 billion in June 2012.
Interest income from loans and advances, fees and commissions and government securities were the major sources of income accounting for 62 percent, 25 percent and 13 percent of total income respectively. On the other hand, interest on deposits, staff costs and other expenses were the key components of expenses, accounting for 42 percent, 24 percent and 20 percent, respectively.
TABLE 3: SECTORAL DISTRIBUTION OF NON-PERFORMING LOANS (KSHS BN) Sectors Jun-12 Jun-11 % Change Personal/Household 19.7 18.8 4.8% Trade 12.3 11.7 5.1% Manufacturing 5.0 7 -28.6% Real Estate 6.5 6.7 -3.0% Transport and Communication 3.7 3.7 0.0% Agriculture 4.1 4.9 -16.3% Financial Services 1.4 1.6 -12.5% Building and Construction 2.3 1.7 35.3% Energy and Water 0.3 0.2 50.0% Tourism, Restaurant and Hotels 2.1 1.8 16.7% Mining and Quarrying 0.1 0.2 -50.0% Gross/Total 57.5 58.3 -1.4%
TABLE 4: BANKING SECTOR PROFITS (KSHS BILLION)
Item Jun-12 Jun-11 % change
Total income 146.1 110.3 32.5% Expenses before provisions 102.3 65.6 55.6% Profit before provisions 57.9 43.8 32.2% Provisions for bad debts 4.7 3.9 20.5% Profit before tax 53.2 40.8 30.4% Source: CBK
12
The
Year
un
der
Rev
iew
16
Pro
fita
bility
OTHER BANKING SECTOR DEVELOPMENTS
Credit Reference Bureaus
The sharing of credit information which was launched in July 2010 had registered increased uptake by banks. As at 30th June 2012, there were 2 licensed credit reference bureaus operating in Kenya and during the period under review, 1,774,185 credit reports were requested by institutions compared to 728,553 reports as at June 2011. The uptake of credit reports by credit providers is expected to increase as use of credit reports is increasingly getting entrenched in credit appraisal processes.
The introduction of the credit information sharing mechanism has further strengthened credit appraisal standards. Banks have now incorporated credit reference reports in the credit risk appraisal. It is also expected that credit referencing will go a long way in inculcating credit utilization discipline by borrowers.
Agency Banking
As at 30th June 2012, there were 10 commercial banks that had contracted 12,067 agents facilitating over 20.4 million transactions valued at Kshs. 104.4 billion. This was an increase from the 6 banks that had contracted 6,513 agents facilitating over 5 million transactions valued at Kshs. 16.7 billion in June 2011.
Deposit Taking Micro-finance Institutions
The gross loans and advances for the 6 DTMs that were operating at the end of June 2012 stood at Kshs.17.9 billion compared to Kshs. 15.2 billion registered as at June 2011 thus translating to a growth of 17.8 percent. Similarly, the deposits base stood at Kshs. 12.3 billion representing a growth of 28.1 percent from Kshs. 9.6 billion in June 2011. The number of deposit accounts stood at 1.6 million while the number of loan accounts were 0.5 million.
Representative Offices
In November 2011 and June 2012, respectively the Central Bank granted authority to First Rand Bank of South Africa and Bank of China Limited to open Representative Offices in Kenya. Consequently, as at end of June 2012, CBK authorized 6 foreign banks to operate Representative Offices in Kenya.
Under the Banking Act, a Representative Office of a foreign bank in Kenya is not permitted to engage in banking business as defined in the Act but can only engage in marketing and liaison roles in connection with the activities of its parent bank and affiliates.
Banking Sector 2012 Outlook
The banking sector is expected to sustain its growth momentum on the backdrop of declining inflation, stabilization of the Kenya shilling and downward revision of lending interest rates. The Central Bank is also conducting a comprehensive review of the banking sector legal and regulatory framework. The revised prudential and risk management guidelines to be issued in the second half of 2012 are intended to address emerging risks and ensure the continued stability and integrity of the sector as the number of Kenyans included in the banking sector continues to grow rapidly.
12
The Year under Review
Oth
er B
anki
ng
Sec
tors
17

IV. Board Operations and Activities
Fund Membership
In accordance with Section 38(1) of the Banking Act Chapter 488 of the Laws of Kenya, every Institution licensed, under Statute, to carry on business as a bank, non-bank financial institution, and as Deposit-Taking Micro-Finance Institution, are contributors to the Fund. As at the end of 2011/2012 Financial Year, the Total Number of Member Institutions comprised of Forty Three (43) Banks, One (1) Mortgage Finance Company, and Six (6) Deposits –Taking Micro-Finance Institutions.
During the year under review, no additional Deposit-Taking Micro-Finance Institution was licensed, and the total number of Member institutions remained at Fifty (50).
Financial Performance
The Fund’s net surplus increased by 31.8percent from Kshs. 3,941 million recorded in the previous year to Kshs. 5,196 million realized during the year under review. Interest earned from Investment in Government Securities, the Fund’s major source of income, grew by 36.8percent from Kshs. 2,502 million earned in the previous year, to Kshs. 3,423 million realized during the year under review. Assessed Premium Income, on the other hand, grew by 21.7percent from Kshs. 1,621 million realized in the previous year, to Kshs. 1,973 million earned in 2011/2012 financial year, and is attributable to the increased average deposits base.
The Fund’s Total Assets grew from Kshs. 28,145 million, as at 30th June, 2011, to Kshs. 33,318 million as at 30th June, 2012, an increase of 18.4percent. The major source of this growth are the Fund’s Investments in Government Securities and the Assessed Premium Income which grew by 36.8percent and 21.7percent, respectively. The highlights of the Fund’s Major financial Indicators are Summarized in Table 5 below:-
TABLE 5: SELECTED FINANCIAL INDICATORS ( KSHS. MILLIONS ) Year/Indicator
2002 2003 2004 2005 2006 2007 2008 2009 2010 2011 2012
Premium Assessed
486 497 544 615 696 788 919 1,111 1,359 1,621 1,973
Int. on T/Bills
387 165 63 235 479 552 829 1,094 678 89 484
Int.on T/Bonds
538 709 608 576 667 683 619 662 1,538 2,413 2,939
Surplus 1,195 1,297 1,478 1,218 1,800 1,914 2,245 2,771 3,407 3,941 5,196
Net Assets 8,108 9,407 10,885 12,009 13,809 15,723 17,968 20,739 24,147 28,088 33,285
12
The
Year
un
der
Rev
iew
18
Bo
ard
Op
erat
ion
s &
Act
ivit
ies
Deposit insurance and coverage
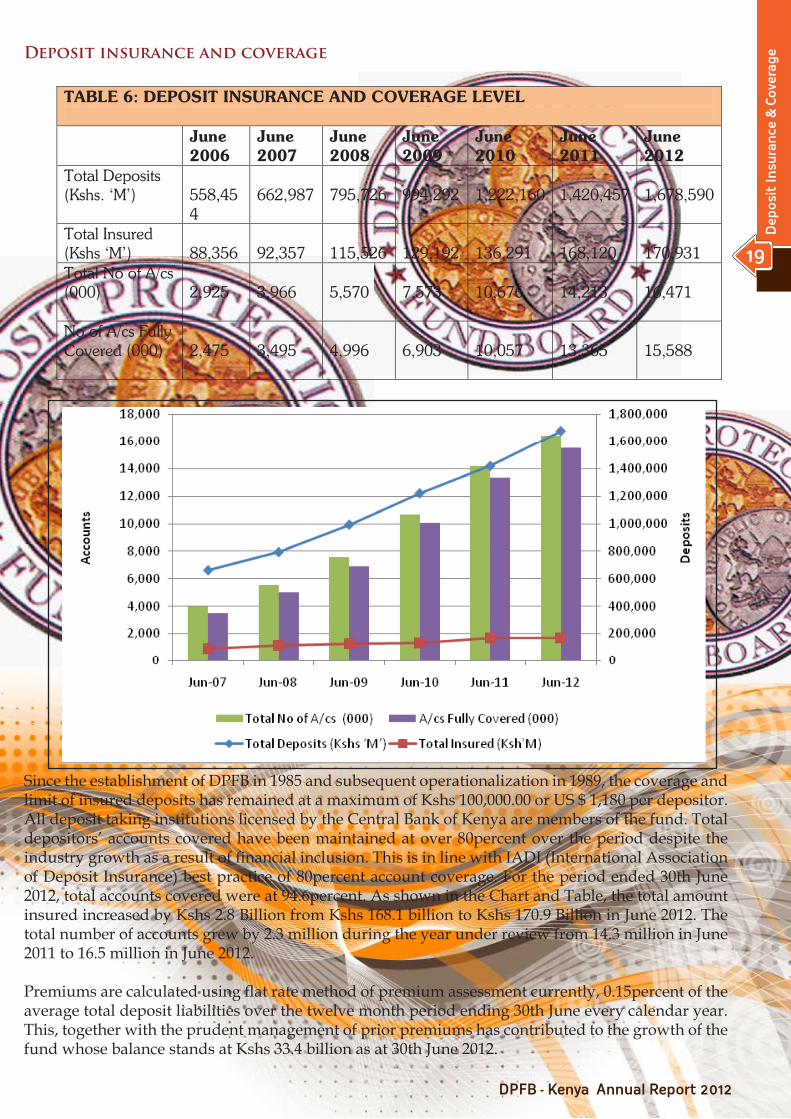
Since the establishment of DPFB in 1985 and subsequent operationalization in 1989, the coverage and limit of insured deposits has remained at a maximum of Kshs 100,000.00 or US $ 1,180 per depositor. All deposit taking institutions licensed by the Central Bank of Kenya are members of the fund. Total depositors’ accounts covered have been maintained at over 80percent over the period despite the industry growth as a result of financial inclusion. This is in line with IADI (International Association of Deposit Insurance) best practice of 80percent account coverage. For the period ended 30th June 2012, total accounts covered were at 94.6percent. As shown in the Chart and Table, the total amount insured increased by Kshs 2.8 Billion from Kshs 168.1 billion to Kshs 170.9 Billion in June 2012. The total number of accounts grew by 2.3 million during the year under review from 14.3 million in June 2011 to 16.5 million in June 2012.
Premiums are calculated using flat rate method of premium assessment currently, 0.15percent of the average total deposit liabilities over the twelve month period ending 30th June every calendar year. This, together with the prudent management of prior premiums has contributed to the growth of the fund whose balance stands at Kshs 33.4 billion as at 30th June 2012.
TABLE 6: DEPOSIT INSURANCE AND COVERAGE LEVEL June
2006 June 2007
June 2008
June 2009
June 2010
June 2011
June 2012
Total Deposits (Kshs. ‘M’)
558,454
662,987
795,726
994,292
1,222,160
1,420,457
1,678,590
Total Insured (Kshs ‘M’)
88,356
92,357
115,526
129,192
136,291
168,120
170,931
Total No of A/cs (000)
2,925
3,966
5,570
7,573
10,676
14,213
16,471
No of A/cs Fully Covered (000)
2,475
3,495
4,996
6,903
10,057
13,365
15,588
12
The Year under Review
19
Dep
osit
Insu
ran
ce &
Cov
erag
e
V. Liquidation Activities
Payment of Protected Deposits
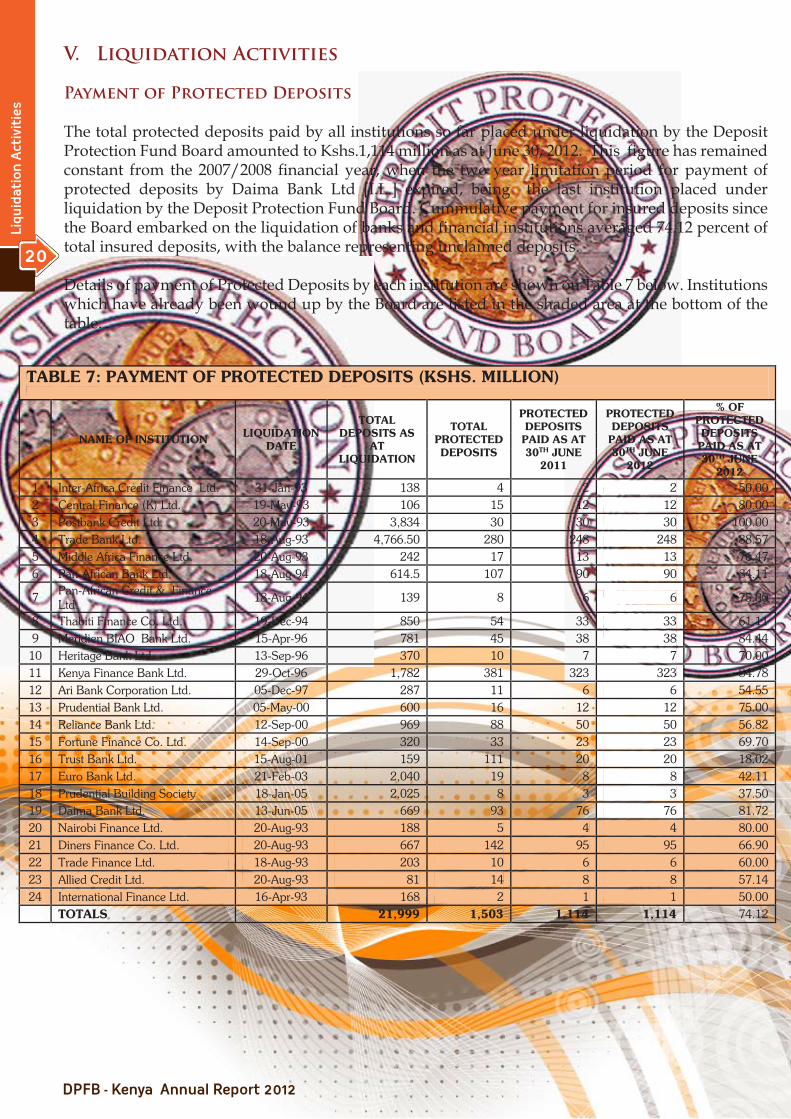
The total protected deposits paid by all institutions so far placed under liquidation by the Deposit Protection Fund Board amounted to Kshs.1,114 million as at June 30, 2012. This figure has remained constant from the 2007/2008 financial year, when the two year limitation period for payment of protected deposits by Daima Bank Ltd [I.L.] expired, being the last institution placed under liquidation by the Deposit Protection Fund Board. Cummulative payment for insured deposits since the Board embarked on the liquidation of banks and financial institutions averaged 74.12 percent of total insured deposits, with the balance representing unclaimed deposits.
Details of payment of Protected Deposits by each institution are shown on Table 7 below. Institutions which have already been wound up by the Board are listed in the shaded area at the bottom of the table.
TABLE 7: PAYMENT OF PROTECTED DEPOSITS (KSHS. MILLION)
NAME OF INSTITUTION LIQUIDATION DATE
TOTAL DEPOSITS AS
AT LIQUIDATION
TOTAL PROTECTED DEPOSITS
PROTECTED DEPOSITS PAID AS AT 30TH JUNE
2011
PROTECTED DEPOSITS
PAID AS AT 30TH JUNE
2012
% OF PROTECTED DEPOSITS PAID AS AT 30TH JUNE
2012 1 Inter-Africa Credit Finance Ltd. 31-Jan-93 138 4 2 2 50.00 2 Central Finance (K) Ltd. 19-May-93 106 15 12 12 80.00 3 Postbank Credit Ltd. 20-May-93 3,834 30 30 30 100.00 4 Trade Bank Ltd. 18-Aug-93 4,766.50 280 248 248 88.57 5 Middle Africa Finance Ltd. 20-Aug-93 242 17 13 13 76.47 6 Pan-African Bank Ltd. 18-Aug-94 614.5 107 90 90 84.11
7 Pan-African Credit & Finance Ltd.
18-Aug-94 139 8 6 6 75.00
8 Thabiti Finance Co. Ltd. 19-Dec-94 850 54 33 33 61.11 9 Meridien BIAO Bank Ltd. 15-Apr-96 781 45 38 38 84.44
10 Heritage Bank Ltd. 13-Sep-96 370 10 7 7 70.00 11 Kenya Finance Bank Ltd. 29-Oct-96 1,782 381 323 323 84.78 12 Ari Bank Corporation Ltd. 05-Dec-97 287 11 6 6 54.55 13 Prudential Bank Ltd. 05-May-00 600 16 12 12 75.00 14 Reliance Bank Ltd. 12-Sep-00 969 88 50 50 56.82 15 Fortune Finance Co. Ltd. 14-Sep-00 320 33 23 23 69.70 16 Trust Bank Ltd. 15-Aug-01 159 111 20 20 18.02 17 Euro Bank Ltd. 21-Feb-03 2,040 19 8 8 42.11 18 Prudential Building Society 18-Jan-05 2,025 8 3 3 37.50 19 Daima Bank Ltd. 13-Jun-05 669 93 76 76 81.72 20 Nairobi Finance Ltd. 20-Aug-93 188 5 4 4 80.00 21 Diners Finance Co. Ltd. 20-Aug-93 667 142 95 95 66.90 22 Trade Finance Ltd. 18-Aug-93 203 10 6 6 60.00 23 Allied Credit Ltd. 20-Aug-93 81 14 8 8 57.14 24 International Finance Ltd. 16-Apr-93 168 2 1 1 50.00 TOTALS 21,999 1,503 1,114 1,114 74.12
12
The
Year
un
der
Rev
iew
20
Liqu
idat
ion
Act
ivit
ies
Debt Recovery
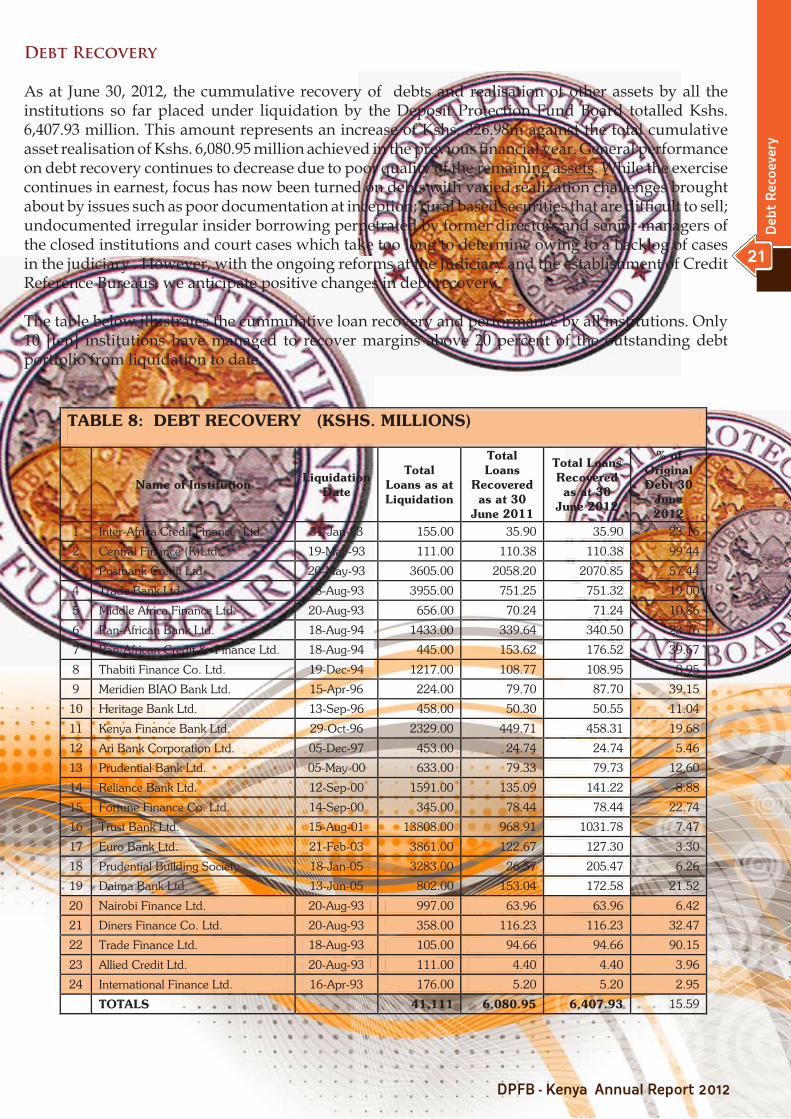
As at June 30, 2012, the cummulative recovery of debts and realisation of other assets by all the institutions so far placed under liquidation by the Deposit Protection Fund Board totalled Kshs. 6,407.93 million. This amount represents an increase of Kshs. 326.98m against the total cumulative asset realisation of Kshs. 6,080.95 million achieved in the previous financial year. General performance on debt recovery continues to decrease due to poor quality of the remaining assets. While the exercise continues in earnest, focus has now been turned on debts with varied realization challenges brought about by issues such as poor documentation at inception; rural based securities that are difficult to sell; undocumented irregular insider borrowing perpetrated by former directors and senior managers of the closed institutions and court cases which take too long to determine owing to a backlog of cases in the judiciary . However, with the ongoing reforms at the Judiciary and the establishment of Credit Reference Bureaus, we anticipate positive changes in debt recovery.
The table below illustrates the cummulative loan recovery and performance by all institutions. Only 10 [ten] institutions have managed to recover margins above 20 percent of the outstanding debt portfolio from liquidation to date.
TABLE 8: DEBT RECOVERY (KSHS. MILLIONS)
Name of Institution Liquidation Date
Total Loans as at Liquidation
Total Loans
Recovered as at 30
June 2011
Total Loans Recovered as at 30
June 2012
% of Original Debt 30
June 2012
1 Inter-Africa Credit Finance Ltd. 31-Jan-93 155.00 35.90 35.90 23.16
2 Central Finance (K)Ltd. 19-May-93 111.00 110.38 110.38 99.44
3 Postbank Credit Ltd. 20-May-93 3605.00 2058.20 2070.85 57.44
4 Trade Bank Ltd. 18-Aug-93 3955.00 751.25 751.32 19.00
5 Middle Africa Finance Ltd. 20-Aug-93 656.00 70.24 71.24 10.86
6 Pan-African Bank Ltd. 18-Aug-94 1433.00 339.64 340.50 23.76
7 Pan-African Credit & Finance Ltd. 18-Aug-94 445.00 153.62 176.52 39.67
8 Thabiti Finance Co. Ltd. 19-Dec-94 1217.00 108.77 108.95 8.95
9 Meridien BIAO Bank Ltd. 15-Apr-96 224.00 79.70 87.70 39.15
10 Heritage Bank Ltd. 13-Sep-96 458.00 50.30 50.55 11.04
11 Kenya Finance Bank Ltd. 29-Oct-96 2329.00 449.71 458.31 19.68
12 Ari Bank Corporation Ltd. 05-Dec-97 453.00 24.74 24.74 5.46
13 Prudential Bank Ltd. 05-May-00 633.00 79.33 79.73 12.60
14 Reliance Bank Ltd. 12-Sep-00 1591.00 135.09 141.22 8.88
15 Fortune Finance Co. Ltd. 14-Sep-00 345.00 78.44 78.44 22.74
16 Trust Bank Ltd. 15-Aug-01 13808.00 968.91 1031.78 7.47
17 Euro Bank Ltd. 21-Feb-03 3861.00 122.67 127.30 3.30
18 Prudential Building Society 18-Jan-05 3283.00 26.57 205.47 6.26
19 Daima Bank Ltd. 13-Jun-05 802.00 153.04 172.58 21.52
20 Nairobi Finance Ltd. 20-Aug-93 997.00 63.96 63.96 6.42
21 Diners Finance Co. Ltd. 20-Aug-93 358.00 116.23 116.23 32.47
22 Trade Finance Ltd. 18-Aug-93 105.00 94.66 94.66 90.15
23 Allied Credit Ltd. 20-Aug-93 111.00 4.40 4.40 3.96
24 International Finance Ltd. 16-Apr-93 176.00 5.20 5.20 2.95
TOTALS 41,111 6,080.95 6,407.93 15.59
12
The Year under Review
21
Deb
t R
eco
ever
y
Payment of Dividends
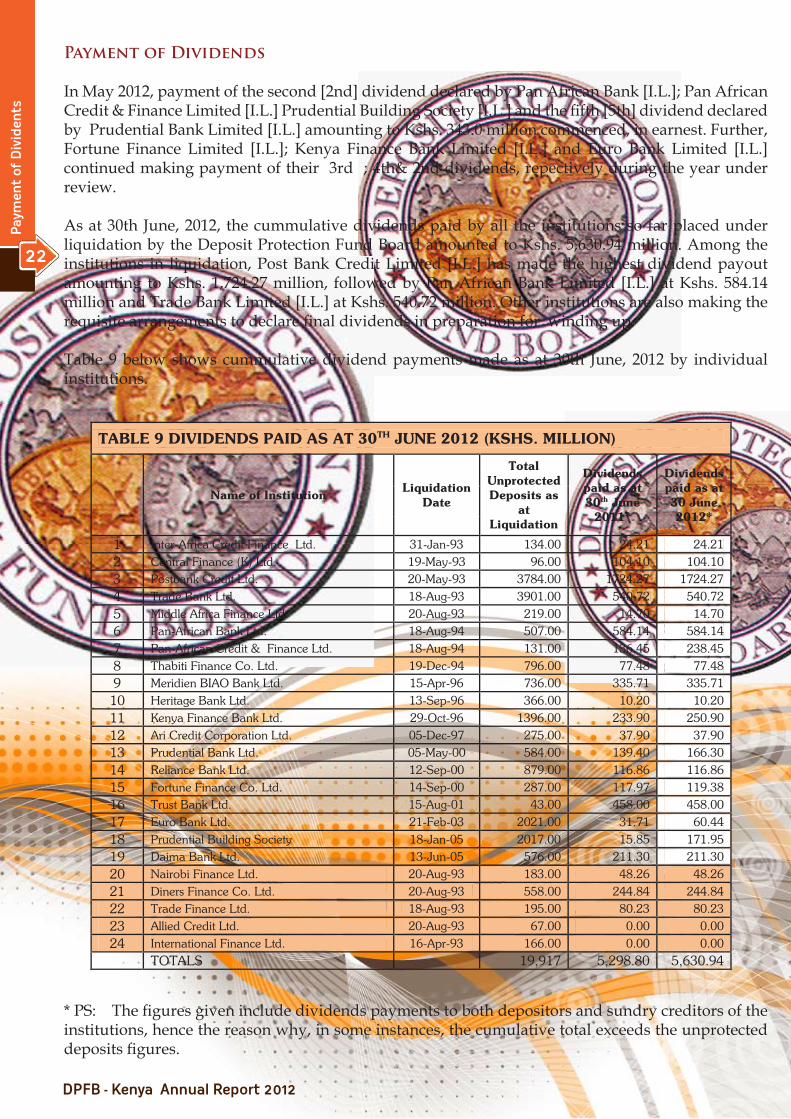
In May 2012, payment of the second [2nd] dividend declared by Pan African Bank [I.L.]; Pan African Credit & Finance Limited [I.L.] Prudential Building Society [I.L.] and the fifth [5th] dividend declared by Prudential Bank Limited [I.L.] amounting to Kshs. 343.0 million commenced, in earnest. Further, Fortune Finance Limited [I.L.]; Kenya Finance Bank Limited [I.L.] and Euro Bank Limited [I.L.] continued making payment of their 3rd ; 4th& 2nd dividends, repectively during the year under review.
As at 30th June, 2012, the cummulative dividends paid by all the institutions so far placed under liquidation by the Deposit Protection Fund Board amounted to Kshs. 5,630.94 million. Among the institutions in liquidation, Post Bank Credit Limited [I.L.] has made the highest dividend payout amounting to Kshs. 1,724.27 million, followed by Pan African Bank Limited [I.L.] at Kshs. 584.14 million and Trade Bank Limited [I.L.] at Kshs. 540.72 million. Other institutions are also making the requisite arrangements to declare final dividends in preparation for winding up.
Table 9 below shows cummulative dividend payments made as at 30th June, 2012 by individual institutions.
* PS: The figures given include dividends payments to both depositors and sundry creditors of the institutions, hence the reason why, in some instances, the cumulative total exceeds the unprotected deposits figures.
TABLE 9 DIVIDENDS PAID AS AT 30TH JUNE 2012 (KSHS. MILLION)
Name of Institution Liquidation
Date
Total Unprotected Deposits as
at Liquidation
Dividends paid as at 30th June
2011*
Dividends paid as at 30 June 2012*
1 Inter-Africa Credit Finance Ltd. 31-Jan-93 134.00 24.21 24.21 2 Central Finance (K) Ltd. 19-May-93 96.00 104.10 104.10 3 Postbank Credit Ltd. 20-May-93 3784.00 1724.27 1724.27 4 Trade Bank Ltd. 18-Aug-93 3901.00 540.72 540.72 5 Middle Africa Finance Ltd. 20-Aug-93 219.00 14.70 14.70 6 Pan-African Bank Ltd. 18-Aug-94 507.00 584.14 584.14 7 Pan-African Credit & Finance Ltd. 18-Aug-94 131.00 136.45 238.45 8 Thabiti Finance Co. Ltd. 19-Dec-94 796.00 77.48 77.48 9 Meridien BIAO Bank Ltd. 15-Apr-96 736.00 335.71 335.71 10 Heritage Bank Ltd. 13-Sep-96 366.00 10.20 10.20 11 Kenya Finance Bank Ltd. 29-Oct-96 1396.00 233.90 250.90 12 Ari Credit Corporation Ltd. 05-Dec-97 275.00 37.90 37.90 13 Prudential Bank Ltd. 05-May-00 584.00 139.40 166.30 14 Reliance Bank Ltd. 12-Sep-00 879.00 116.86 116.86 15 Fortune Finance Co. Ltd. 14-Sep-00 287.00 117.97 119.38 16 Trust Bank Ltd. 15-Aug-01 43.00 458.00 458.00 17 Euro Bank Ltd. 21-Feb-03 2021.00 31.71 60.44 18 Prudential Building Society 18-Jan-05 2017.00 15.85 171.95 19 Daima Bank Ltd. 13-Jun-05 576.00 211.30 211.30 20 Nairobi Finance Ltd. 20-Aug-93 183.00 48.26 48.26 21 Diners Finance Co. Ltd. 20-Aug-93 558.00 244.84 244.84 22 Trade Finance Ltd. 18-Aug-93 195.00 80.23 80.23 23 Allied Credit Ltd. 20-Aug-93 67.00 0.00 0.00 24 International Finance Ltd. 16-Apr-93 166.00 0.00 0.00 TOTALS 19,917 5,298.80 5,630.94
12
The
Year
un
der
Rev
iew
22
Pay
men
t of
Div
iden
ts

VII. Corporate Social Responsibility
The mission of Deposit Protection Fund Board [DPFB] is to promote stability in the Financial Sector by providing a deposit insurance scheme for depositors of member institutions. In fulfilling this important mandate, the DPFB also recognises the need to make a positive contribution to the welfare of the society and to this end, The Chairman’s Philanthropic Fund was created in furtherance of the Corporate Social Responsibilty.
In the year under review, DPFB Philanthropic Fund extended financial support to needy projects all over the country to educational, orphanage and health institutions. Some of the beneficiaries include Modogashe Orphanage Centre, Tunyai Children’s Centre, The Nyeri Hospice and the Kenya Asociation for the Welfare of People with Epilepsy.
The Board shall continue to support needy projects in line with the DPFB objectives of making a difference to society.
Construction of the nursery classroom funded by the Deposit Protection Fund Board at the Kajiado Children’s home in progress.
12
The Year under Review
23
Corp
orat
e S
oci
al R
esp
onsi
bili
ty
12
The Year under Review
23
Corp
orat
e S
oci
al R
esp
onsi
bili
ty

STATEMENT OF DIRECTORS’ RESPONSIBILITIESON THE FINANCIAL STATEMENTS
The Directors are responsible for the preparation and presentation of the financial statements of Deposit Protection Fund Board set out on pages 28 to 50 which comprise the statement of financial position at 30 June 2012, the statement of comprehensive income, statement of changes in Fund balance and statement of cash flows for the year then ended, and a summary of significant accounting policies and other explanatory notes.
The Directors’ responsibilities include: determining that the basis of accounting described in Note 2 is an acceptable basis for preparing and presenting the financial statements in the circumstances, preparation and presentation of financial statements in accordance with International Financial Reporting Standards and in the manner required by the Banking Act and for such internal control as the directors determine is necessary to enable the preparation of financial statements that are free from material misstatements, whether due to fraud or error.
Under the Banking Act, the Directors are required to prepare financial statements for each financial year which give a true and fair view of the state of affairs of the Board as at the end of the financial year and of the operating results of the Board for that year. It also requires the Director to ensure the Board keeps proper accounting records which disclose with reasonable accuracy the financial position of the Board.
The Directors accept responsibility for the annual financial statements, which have been prepared using appropriate accounting policies supported by reasonable and prudent judgments and estimates, in conformity with International Financial Reporting Standards and in the manner required by the Banking Act. The Directors are of the opinion that the financial statements give a true and fair view of the state of the financial affairs of the Board and of its operating results.
The Directors further accept responsibility for the maintenance of accounting records which may be relied upon in the preparation of financial statements, as well as adequate systems of internal financial control.
The Directors have made an assessment of the Board’s ability to continue as a going concern and have no reason to believe the Board will not be a going concern for at least the next twelve months from the date of this statement.
Approval of the financial statements
The financial statements, as indicated above, were approved by the board of directors on and were signed on its behalf by:
______________________________ ______________________________ Chairman Member
12
The
Year
un
der
Rev
iew
24
Sta
tem
ent
of D
irec
tors
Res
pon
sib
iliti
es

REPORT OF THE INDEPENDENT AUDITORSTO THE MINISTER FOR FINANCE ON THE FINANCIAL STATEMENTS
OF THE DEPOSIT PROTECTION FUND BOARD
We have audited the financial statements of Deposit Protection Fund Board set out on pages 28 to 50 which comprise the statement of financial position at 30 June 2012, the statement of comprehensive income, statement of changes in fund balance and statement of cash flows for the year then ended, and a summary of significant accounting policies and other explanatory notes.
Director’s responsibility for the financial statements
As stated on page 24, the directors are responsible for the preparation and fair presentation of these financial statements in accordance with International Financial Reporting Standards and for such internal control as the directors determine is necessary to enable the preparation of financial statements that are free from material misstatements, whether due to fraud or error.
Auditor’s responsibility
Our responsibility is to express an opinion on these financial statements based on our audit. We conducted our audit in accordance with International Standards on Auditing. Those standards require that we comply with relevant ethical requirements and plan and perform the audit to obtain reasonable assurance whether the financial statements are free from material misstatement.
An audit involves performing procedures to obtain audit evidence about the amounts and disclosures in the financial statements. The procedures selected depend on our judgement, including the assessment of the risks of material misstatement of the financial statements, whether due to fraud or error. In making those risk assessments, we consider internal control relevant to the entity’s preparation and fair presentation of the financial statements in order to design audit procedures that are appropriate in the circumstances, but not for the purpose of expressing an opinion on the effectiveness of the entity’s internal control. An audit also includes evaluating the appropriateness of accounting policies used and the reasonableness of accounting estimates made by management, as well as evaluating the overall presentation of the financial statements.
We believe that the audit evidence we have obtained is sufficient and appropriate to provide a basis for our opinion.
Opinion
In our opinion, the financial statements give a true and fair view of the financial position of the Board at 30 June 2012, and its financial performance and cash flows for the year then ended in accordance with International Financial Reporting Standards and the Banking Act (Cap 488).
Date:
Rep
ort
of t
he
Ind
epen
den
t A
udi
tors
25

STATEMENT OF CORPORATE GOVERNANCE
DPFB is a body corporate established by section 36 of the Banking Act, Cap 488 Laws of Kenya. The DPFB currently operates as a department of Central Bank of Kenya. DPFB is committed to maintaining the highest standards of integrity, professionalism and business ethics in all its operations.
Board of Directors
Section 36 (4) provides that the Board of directors shall be composed of the Governor of Central Bank of Kenya, as the Chairman, Permanent Secretary to the Treasury and five other members, appointed by the Minister for Finance, representing the member institutions. The current members representing the Institutions are: Mr. Terence Davidson, Mrs. Nasim Devji, Mr. James Macharia and Mr. Richard Etemesi.
Board Meetings
The Board meets every 3 months and has a formal schedule of Agenda items due for deliberations. The Directors are given appropriate and timely information to maintain full and effective control over strategic, financial and operational issues. The Board is not involved in the conduct of day-to-day business as this is a responsibility given to the Director, DPFB by the Banking Act. It, however, retains responsibility for determining the policy of the Fund.
Audit Committee
The members of the Audit Committee are Mr. Terence Davidson, Mr. James Macharia, Mrs. Nasim Devji, Mr. Martin Gumo and Mr. Richard Etemesi. They are all non-Executive Directors and have experience in Banking, Finance, Accounting, Administration and Management. The committee meets every three months, and as necessary, two weeks before the full Board meeting. The committee’s responsibilities are to review the efficiency and effectiveness of Internal Controls, Financial Reporting, Internal Audit function, External audit work, and Risk Management policies and procedures. Towards this end, a self-evaluation tool, which measures the committee’s performance, has been developed and implemented.
Management Structure
The DPFB Senior Management is made up of the Director, four Assistant Directors, each heading the Division of Finance & Administration, Legal, ICT and Liquidations. The DPFB Senior Management meets regularly to review overall performance of the Fund. Decision making is through several management committees, which meet regularly to deliberate and advise the Director on specific issues. All DPFB staff are employees of Central Bank of Kenya seconded to the Fund.
Directors Emoluments and Loans
The remuneration paid to the Directors for services rendered during the financial year 2011/2012 is disclosed in note 8 of the financial statements. The Directors, who are all non-executive, are paid a monthly retainer fee and a sitting allowance for every meeting attended. There were no loans to Non-Executive Directors during the year.
12
The
Year
un
der
Rev
iew
26
Sta
tem
ent
of C
orp
orat
e G
over
nan
ce

Code of Ethics
The Fund is committed to the highest standards of integrity, behavior and ethics. A formal code of ethics for all employees of Central Bank of Kenya exists and is fully implemented. All employees of the Fund are expected to avoid activities and financial interests, which could give rise to conflict of interest with their responsibilities. Strict rules of conduct apply to the staff of CBK, including those in DPFB, under the staff rules and regulations.
Internal Controls
The management of the Fund has put in place a series of internal control mechanisms to ensure the reporting of complete and accurate accounting information. Procurement of goods and services is strictly done in accordance with the Public Procurement & Disposal Act, 2005. In all operational areas of the Fund, workflows have been structured in a manner that allows adequate segregation of duties.
Authorizations
All the expenditure of the Fund must be authorized in accordance with a comprehensive set of the Fund’s policies and procedures. There is a budget, which is approved by the Board before commencement of the financial year. The Board receives regular management accounts comparing actual outcomes against budget as a means of monitoring actual financial performance of the Fund.
Internal Audit and Risk Management
The Internal Audit function is performed by Internal Audit Unit, which is responsible for monitoring and providing advice on the internal control framework. All reports of the Internal Audit are available to the Audit Committee of the Board.
Transparency
The Fund publishes an Annual Report which explains the performance of the Banking sector, membership status and other pertinent information. On an annual basis, the Financial Statements are published in the Kenya Gazette and placed in the website of the Fund. DPFB was also in the process of sharing its Strategic Plan with the Stakeholders.
12
The Year under Review
27
Sta
tem
ent
of C
orp
orat
e G
over
nan
ce

STATEMENT OF THE COMPREHENSIVE INCOME FOR THE YEAR ENDED 30TH JUNE, 2012
The notes set out on pages 32 to 50 form an integral part of these financial statements.
Report of the independent auditors – page 25
2012 2011 Note Kshs.‘000 Kshs.‘000 REVENUE Assessment income 5(a) 1,973,192 1,621,317 Investment income 5(b) 3,422,806 2,501,884 Other income 6 11,457 7,688 Write back of protected deposits 7 - 177 5,407,455 4,131,066 EXPENSES Administration and establishment 8 208,199 189,421 Provision for doubtful debts 9(b) 2,844 302 211,043 189,723 SURPLUS FOR THE YEAR 5,196,412 3,941,343
12
The
Year
un
der
Rev
iew
23Corporate Social Responsibility
12
The
Year
un
der
Rev
iew
28
Inco
me
Ste
tem
ent

STATEMENT OF FINANCIAL POSITION AS AT 30TH JUNE, 2012
The financial statements on pages 28 to 50 were approved by the Board of Directors on
…………............................…….. and were signed on its behalf by:
PROF. NJUGUNA NDUNG’U MR. RICHARD ETEMESI
___________________________________ ___________________________________Chairman Member
The notes set out on pages 32 to 50 form an integral part of these financial statements.
Report of the independent auditors – page 25
2012 2011 ASSETS Note Kshs.‘000 Kshs.‘000 Non-current assets Property and equipment 10 43,044 27,290 Prepaid operating lease rentals 11 3,515 3,614 Investment held for sale 12 100 100 Government securities 13 26,249,260 25,624,852 26,295,919 25,655,856 Current assets Receivables and prepayments 9(a) 5,143 16,554 Government securities 13 7,013,085 2,459,924 Cash and bank balance 17 3,882 12,880 7,022,110 2,489,358 TOTAL ASSETS 33,318,029 28,145,214 FUND BALANCE AND LIABILITIES Fund balance (Page 30) 33,284,581 28,088,169 Current liabilities Payables and accruals 14 6,334 4,937 Due to related party 15 16,943 41,592 Deferred income 16 10,171 10,516 33,448 57,045 TOTAL FUND BALANCE AND LIABILITIES 33,318,029 28,145,214
12
The Year under Review
23
Corp
orat
e S
oci
al R
esp
onsi
bili
ty
12
The Year under Review
29
Bal
ance
Sh
eet
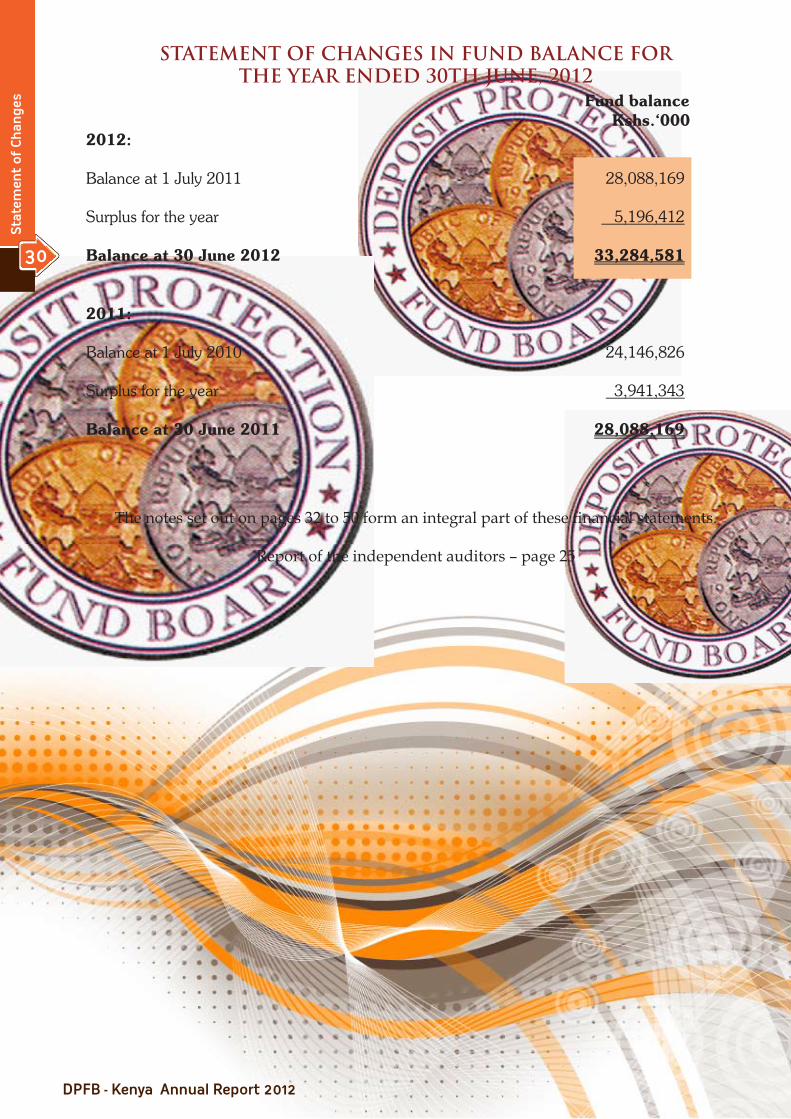
STATEMENT OF CHANGES IN FUND BALANCE FOR THE YEAR ENDED 30TH JUNE, 2012
The notes set out on pages 32 to 50 form an integral part of these financial statements.
Report of the independent auditors – page 25
Fund balance Kshs.‘000 2012: Balance at 1 July 2011 28,088,169 Surplus for the year 5,196,412 Balance at 30 June 2012 33,284,581 2011: Balance at 1 July 2010 24,146,826 Surplus for the year 3,941,343 Balance at 30 June 2011 28,088,169
12
The
Year
un
der
Rev
iew
23Corporate Social Responsibility
12
The
Year
un
der
Rev
iew
30
Sta
tem
ent
of C
han
ges
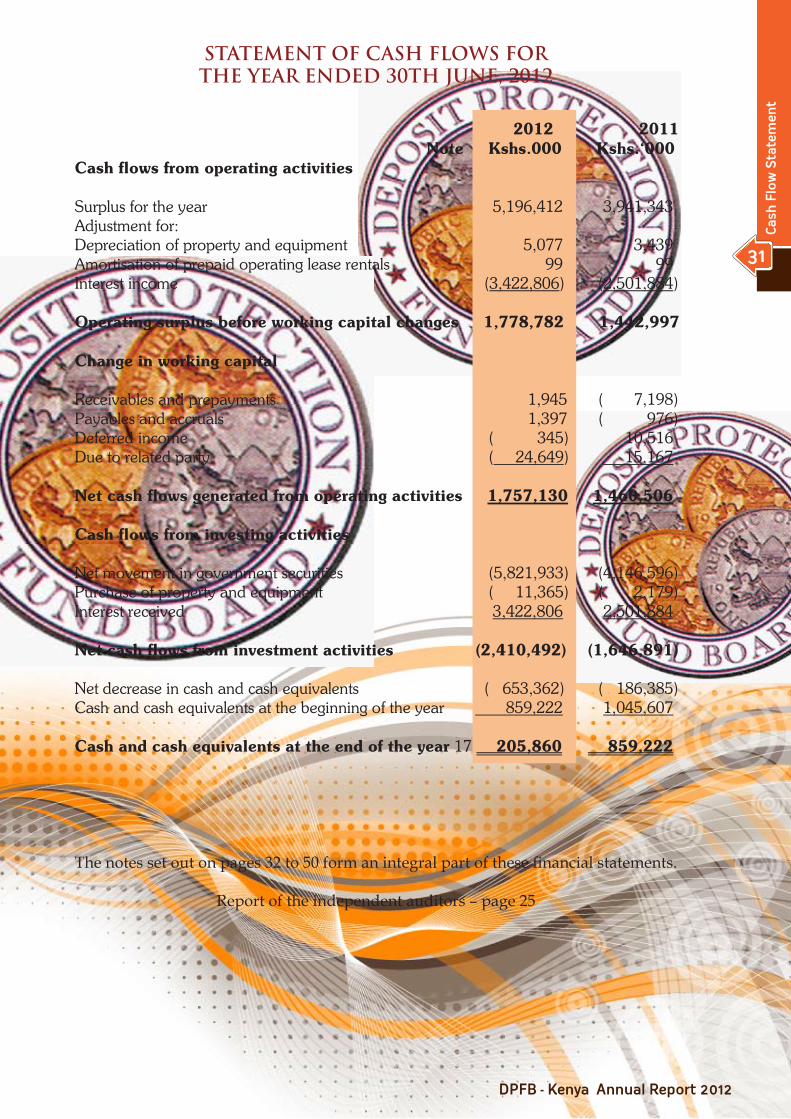
STATEMENT OF CASH FLOWS FOR THE YEAR ENDED 30TH JUNE, 2012
The notes set out on pages 32 to 50 form an integral part of these financial statements.
Report of the independent auditors – page 25
2012 2011 Note Kshs.000 Kshs.‘000 Cash flows from operating activities Surplus for the year 5,196,412 3,941,343 Adjustment for: Depreciation of property and equipment 5,077 3,439 Amortisation of prepaid operating lease rentals 99 99 Interest income (3,422,806) (2,501,884) Operating surplus before working capital changes 1,778,782 1,442,997 Change in working capital Receivables and prepayments 1,945 ( 7,198) Payables and accruals 1,397 ( 976) Deferred income ( 345) 10,516 Due to related party ( 24,649) 15,167 Net cash flows generated from operating activities 1,757,130 1,460,506 Cash flows from investing activities Net movement in government securities (5,821,933) (4,146,596) Purchase of property and equipment ( 11,365) ( 2,179) Interest received 3,422,806 2,501,884 Net cash flows from investment activities (2,410,492) (1,646,891) Net decrease in cash and cash equivalents ( 653,362) ( 186,385) Cash and cash equivalents at the beginning of the year 859,222 1,045,607 Cash and cash equivalents at the end of the year 17 205,860 859,222
Cash
Flo
w S
tate
men
t
31
NOTES TO THE FINANCIAL STATEMENTS FOR THE YEAR ENDED 30TH JUNE, 2012
1. REPORTING ENTITY
The Board is incorporated under the Banking Act, Cap 488 of the Laws of Kenya and is domiciled in Kenya. The address of its registered office is as follows:
CBK Pension House (formerly Marshall House) Harambee Avenue P O Box 45983 - 00100 Nairobi
2. BASIS OF PREPARATION
(a) Basis of preparation
The financial statements have been prepared on the historical cost convention except for measurement at fair valuation of certain investments. (b) Statement of compliance
The financial statements have been prepared in compliance with International Financial Reporting Standards (IFRSs) and interpretation of those standards.
(c) Functional and presentation currency
These financial statements are presented in Kenya Shillings (Kshs.), which is the Board’s functional currency.
(d) Use of estimates and judgments
The preparation of financial statements in conformity with International Financial Reporting Standards requires the use of estimates and assumptions that affect the reported amounts of assets and liabilities and disclosures of contingent liabilities at the date of financial statements and the reported amounts of revenues and expenses during the reporting period. Although these estimates are based on the directors’ best knowledge of current events, actual results may ultimately differ from those estimates.
The estimates and underlying assumptions are reviewed on an ongoing basis. Revisions to the accounting estimates are recognised in the period in which the estimate is revised if the revision affects only that period or in the period of revision and future periods if the revision affects both current and future periods.
In particular, information about significant areas of estimation and critical judgement in applying accounting policies that have the most significant effect on the amount recognised in the financial statement is described in Note 4.
12
The
Year
un
der
Rev
iew
23Corporate Social Responsibility
12
The
Year
un
der
Rev
iew
32
Not
es t
o t
he
Acc
oun
ts

3. SIGNIFICANT ACCOUNTING POLICIES
The principal accounting policies applied in the preparation of these financial statements are set out below. These policies have been consistently applied to all the years presented, unless otherwise stated.
(a) Revenue recognition
Assessed income comprises contributions levied to the contributory institutions and is recognized in the period when they are receivable. Such contributions are assessed at a rate of 0.15 per cent of the average of the institutions’ total deposit liabilities during the period of 12 months prior to the date of levy notice.
Interest income is recognized in the profit or loss for all interest bearing instruments on an accrual basis using the effective interest method based on the actual purchase price. Interest income includes coupon earned and unamortised discount and premium.
(b) Translation of foreign currencies
Transactions in foreign currencies during the year are converted into Kenya Shillings at the exchange rate ruling at the date of the transaction. Foreign currency monetary assets and liabilities are translated at the exchange rate ruling at the reporting date. Resulting exchange differences are recognised in profit or loss for the year.
Non-monetary assets and liabilities denominated in foreign currency are recorded at the exchange rate ruling at the date of transaction.
(c) Provisions for payments to depositors
Provisions for payments to protected depositors are recognized in the financial statements in the period the contributory institutions are placed under liquidation. Any payments that exceed the provisions made are taken into account in determining operating profit. Provisions that relate to unclaimed protected deposits are written back to income on expiry of the statutory notice period.
(d) Leases
Leases where the lessor retains substantially all the risks and benefits of ownership of the asset are classified as operating leases. Payments made under operating leases are recognized as an expense in the statement of comprehensive income on a straight-line basis over the lease term.
(e) Employee entitlements
Employee entitlements are recognized when they accrue to employees. A provision is made for the estimated liability for such entitlements as a result of services rendered by employees up to the reporting date. The estimated monetary liability for employees’ accrued annual leave entitlement at the reporting date is recognized as an expense accrual.
The Board’s employees are eligible for retirement benefits under a defined benefit plan provided through a separate fund. The defined benefit plan is funded by the Board and the Central Bank, the main sponsor. The retirement benefit asset is wholly recognized in the financial statements of the
12
The Year under Review
23
Corp
orat
e S
oci
al R
esp
onsi
bili
ty
12
The Year under Review
33
Not
es t
o t
he
Acc
oun
ts

Central Bank while the Board recognizes contributions to the fund as if it were a defined contribution scheme by charging them to the profit and loss account in the year to which they relate.The Board also contributes to a statutory defined contribution Pension Scheme, the National Social Security Fund (NSSF). Contributions are determined by local statute and are currently limited to Kshs.. 200 per employee per month. The contributions are charged to income and expenditure account in the year to which they relate.
(f) Taxation
The Board’s income is not subject to tax as it has been granted exemption by the statute. Therefore no provision for current tax or deferred tax is made in the financial statements.
(g) Recognition and measurement of financial instruments
The Board classifies its financial assets into four categories described below. Management determines the appropriate classification of its financial instruments at the time of purchase and re-evaluates its portfolio on a regular basis to ensure that all financial assets are appropriately classified.
(i) Financial assets at fair value through profit or loss
Financial assets in this category held for trading are those that the Board principally holds for the purpose of short-term profit taking and/or those designated at fair value through profit or loss at inception. These are recognised on the date the Board commits to acquire the instruments.
Trading instruments are initially recognised at cost, including transaction costs. Subsequent to initial recognition, trading instruments are stated at fair value based on quoted bid prices. Where the fair value cannot be reliably measured, the assets are stated at cost less impairment losses. Changes in fair value are recognised in profit or loss.
(ii) Loans and receivables
Loans and receivables are financial assets with fixed or determinable payments and fixed maturities that are not quoted in an active market.They arise when the Board provides money directly to borrowers, other than those created with the intention of short-term profit taking. They are recognised at the date money is disbursed to the borrower or when they are transferred to the Board from a third party.
Subsequent to initial recognition, these are carried at amortised cost, which is the present value of the expected future cash flows, discounted at the instrument’s original effective interest rate. Loan origination fees together with related direct costs are treated as part of the cost of the transaction.
Amortised cost is calculated using the effective interest rate method. The amortisation and accretion of premiums and discounts is included in interest income.
(iii) Held-to –maturity
These are financial assets with fixed or determinable payments and fixed maturities that the Board’s management has the positive intention and ability to hold to maturity. The sale of a significant amount of held-to-maturity assets would taint the entire category leading to reclassification as available-for-sale.
Subsequent to initial recognition, these are carried at amortised cost, which is the present value
12
The
Year
un
der
Rev
iew
23Corporate Social Responsibility
12
The
Year
un
der
Rev
iew
34
Not
es t
o t
he
Acc
oun
ts
12
The
Year
un
der
Rev
iew
23Corporate Social Responsibility
12
The
Year
un
der
Rev
iew
34
Not
es t
o t
he
Acc
iou
nts

of the expected future cash flows, discounted at the instrument’s original effective interest rate.
Amortised cost is calculated using the effective interest rate method. The amortisation and accretion of premiums and discounts is included in interest income.
(iv) Available-for-sale
Other financial assets held by the Board are classified as available-for-sale and are initially recognised at cost, including transaction costs. Subsequent to initial recognition, available-for-sale financial assets are stated at fair value based on quoted bid prices. Gains and losses arising from changes in the fair value of available-for-sale financial assets are recognised directly in equity in the fair value reserve, net of deferred tax. When these investments are derecognised, the cumulative gain or loss previously directly recognised in equity is recognised in profit or loss.
Derecognition
A financial asset is derecognised when the Board loses control over the contractual rights that comprise that asset. This occurs when the rights are realised, expire or are surrendered. A financial liability is derecognised when it is extinguished.
Available-for-sale assets and assets held for trading that are sold are derecognised and corresponding receivables from the buyer for the payment are recognised as of the date the Board commits to sell the assets. The Board uses the specific identification method to determine the gain or loss on derecognition.
Held-to-maturity instruments and loans and receivables are derecognised on the day they are repaid in full or when they are transferred by the Board to a third party.
(h) Investment held for sale
Investment held for sale relates to investment in a subsidiary which is accounted for under IFRS 5 ‘Non-current assets held for sale and discontinued operations’. The investment is stated at the lower of its carrying amount and the fair value less costs to sell.
(i) Cash and cash equivalents
For the purposes of the cash flow statement cash and cash equivalents comprise cash on hand, bank balances, and government securities maturing within 91 days from the date of issue.
(j) Property and equipment
(i) Recognition and measurementItems of property and equipment are measured at cost less accumulated depreciation and impairment losses.
Cost includes expenditures that are directly attributable to the acquisition of the asset.
(ii) Subsequent costsThe cost of replacing part of an item of property or equipment is recognised in the carrying amount of the item if it is probable that the future economic benefits embodied within the
12
The Year under Review
23
Corp
orat
e S
oci
al R
esp
onsi
bili
ty
12
The Year under Review
35
Not
es t
o t
he
Acc
iou
nts

part will flow to the Board and its cost can be measured reliably. The costs of the day-to-day servicing of property and equipment are recognised in profit or loss as incurred.
(iii) Depreciation
Depreciation is recognised in profit or loss on a straight line basis over the estimated useful lives of each part of an item of property and equipment as follows:
Long term leasehold land Over the lease period Buildings 2 percent Computer equipment 33 percent Office equipment, furniture and fittings 20 percent Motor vehicles 25 percent Depreciation methods, useful lives and residual values are reassessed and adjusted, if appropriate, at each reporting date.
Gains and losses on disposal of property and equipment are determined by reference to their carrying amount and are recognized in profit or loss in the year in which they arise.
(k) Impairment of assets
(i) Financial assets
A financial asset is assessed at each reporting date to determine whether there is any objective evidence that it is impaired. A financial asset is considered to be impaired if objective evidence indicates that one or more events have had a negative effect on the estimated future cash flows of that asset.
An impairment loss in respect of a financial asset measured at amortised cost is calculated as the difference between its carrying amount, and the present value of the estimated future cash flows discounted at the original effective interest rate. An impairment loss in respect of an available-for-sale financial asset is calculated by reference to its fair value.
Individually significant financial assets are tested for impairment on an individual basis. The remaining financial assets are assessed collectively in groups that share similar credit risk characteristics.
All impairment losses are recognised in profit or loss. Any cumulative loss in respect of an available-for-sale financial asset recognised previously in equity is transferred to profit or loss.
An impairment loss is reversed if the reversal can be related objectively to an event occurring after the impairment loss was recognised. For financial assets measured at amortised cost and available-for-sale financial assets that are debt securities, the reversal is recognised in profit or loss. For available-for-sale financial assets that are equity securities, the reversal is recognised directly in equity.
(ii) Non-financial assets
The carrying amounts of the Board’s non-financial assets, inventories and deferred tax assets are reviewed at each reporting date to determine whether there is any indication of impairment. If any such indication exists then the asset’s recoverable amount is estimated.
12
The
Year
un
der
Rev
iew
23Corporate Social Responsibility
12
The
Year
un
der
Rev
iew
36
Not
es t
o t
he
Acc
iou
nts

An impairment loss is recognised if the carrying amount of an asset or its cash-generating unit exceeds its recoverable amount. A cash-generating unit is the smallest identifiable asset group that generates cash flows that largely are independent from other assets and groups. Impairment losses are recognised in profit or loss. Impairment losses recognised in respect of cash-generating units reduce the carrying amount of the other assets in the unit (group of units) on a pro rata basis.
The recoverable amount of an asset or cash-generating unit is the greater of its value in use and its fair value less costs to sell. In assessing value in use, the estimated future cash flows are discounted to their present value using a pre-tax discount rate that reflects current market assessments of the time value of money and the risks specific to the asset.
Impairment losses recognised in prior periods are assessed at each reporting date for any indications that the loss has decreased or no longer exists. An impairment loss is reversed if there has been a change in the estimates used to determine the recoverable amount. An impairment loss is reversed only to the extent that the asset’s carrying amount does not exceed the carrying amount that would have been determined, net of depreciation or amortisation, if no impairment loss had been recognised.
(l) Provision
Provisions are recognised when the Board has a present legal or constructive obligation as a result of past events and it is probable that an outflow of resources embodying economic benefits will be required to settle the obligation and a reliable estimate of the amount of the obligation can be made.
(m) Related parties
In the normal course of business, the Board has entered into transactions with related parties. The related party transactions are at arm’s length.
(n) Grants
Other grants are recognised initially as deferred income at fair value when there is reasonable assurance that they will be received and the Group will comply with the conditions.
(o) Comparatives
Where necessary, comparative figures have been adjusted or excluded to conform to changes in presentation in the current year.
(p) New standards and interpretations not yet adopted
A number of new standards, amendments to standards and interpretations are not yet effective for the year ended 30 June 2012 and have not been applied in preparing these financial statements. These are summarised below, and are not expected to have a significant impact on the financial statements of the Board:
• IFRS 9 ‘Financial Instruments’. IFRS 9 will become mandatory for the Board’s 2015 financial statements.
• IFRS 10 ‘Consolidated Financial Statements’ (effective for annual periods beginning on or after 1 January 2013).
• IFRS 11 ‘Joint Arrangements’ (effective for annual periods beginning on or after 1 January 2013).
12
The Year under Review
23
Corp
orat
e S
oci
al R
esp
onsi
bili
ty
12
The Year under Review
37
Not
es t
o t
he
Acc
iou
nts
• IFRS 12 ‘Disclosure of Interests in Other Entities’ (effective for annual periods beginning on or after 1 January 2013).
• IFRS 13 ‘Fair Value Measurement’ (effective for annual periods beginning on or after 1 January 2013).
• IAS 19 ‘Employee Benefits (Amended)’ (effective for annual periods beginning on or after 1 January 2013).
• IAS 27 (2011) Separate Financial Statements (effective 1 January 2013).• IAS 28 (2011) Investments in Associates and Joint Ventures (effective 1 January 2013).• Amendments to IAS 1 ‘Presentation of items of other comprehensive income’ (effective 1 July
2012).
The Board does not plan to adopt any of the above standards early and the extent of the impact has not been determined.
4. CRITICAL ACCOUNTING ESTIMATES AND JUDGEMENTS
Estimates and judgements are continually evaluated and are based on historical experience and other factors, including experience of future events that are believed to be reasonable under the circumstances.
(a) Critical accounting estimates and assumptions
(i) Property and equipment
Critical estimates are made by the management in determining depreciation rates for property and equipment. The rates used are set out in the accounting policy for property, equipment.
(ii) Impairment of receivables
The Board reviews its receivables’ portfolio regularly to assess the likelihood of impairment. This requires an estimation of the amounts that are irrecoverable especially debts incurred by institutions under liquidation.
(iii) Fair value estimation
The fair value of financial instruments that are not traded in an active market is determined by using valuation techniques. These include the use of recent arm’s length transactions, reference to other instruments that are substantially the same, discounted cash flow analysis, and option pricing models refined to reflect the issuer’s specific circumstances.
(b) Critical judgements in applying the entity’s accounting policies
In the process of applying the Board’s accounting policies, management has made judgements in determining whether assets are impaired.
12
The
Year
un
der
Rev
iew
23Corporate Social Responsibility
12
The
Year
un
der
Rev
iew
38
Not
es t
o t
he
Acc
iou
nts
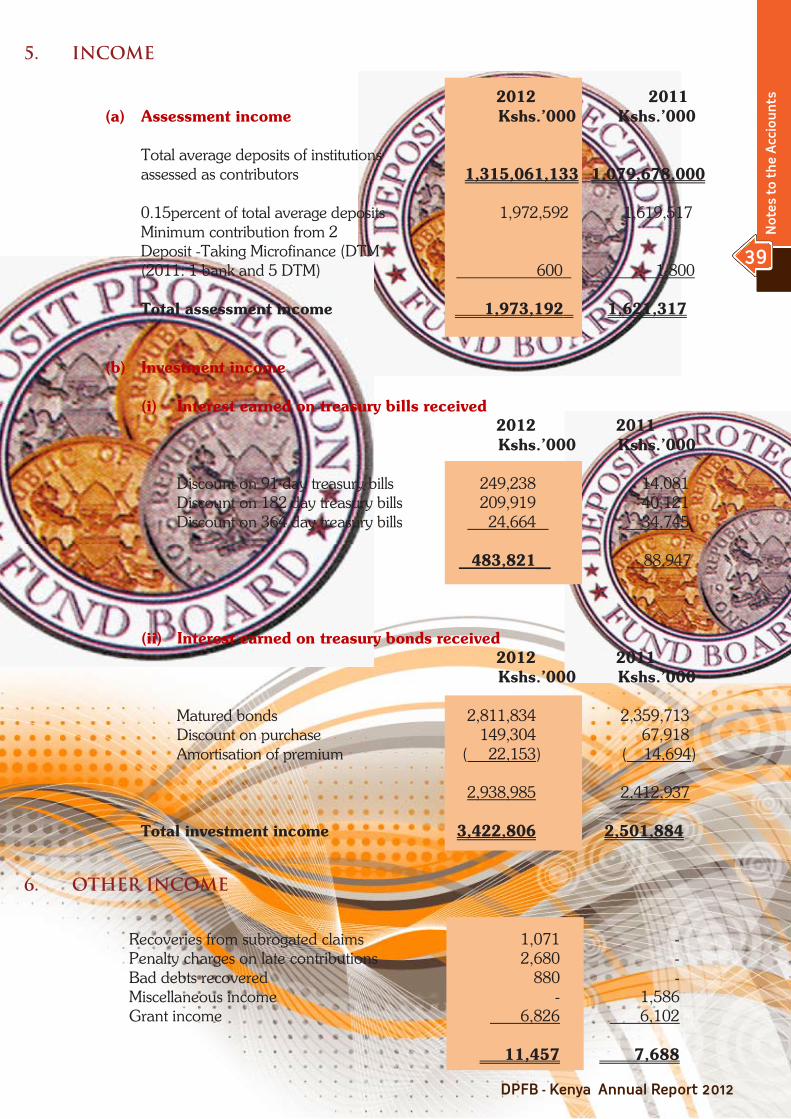
5. INCOME
6. OTHER INCOME
2012 2011 (a) Assessment income Kshs.’000 Kshs.’000
Total average deposits of institutions assessed as contributors 1,315,061,133 1,079,678,000 0.15percent of total average deposits 1,972,592 1,619,517 Minimum contribution from 2 Deposit -Taking Microfinance (DTM (2011: 1 bank and 5 DTM) 600 1,800 Total assessment income 1,973,192 1,621,317
(b) Investment income (i) Interest earned on treasury bills received
2012 2011 Kshs.’000 Kshs.’000 Discount on 91 day treasury bills 249,238 14,081 Discount on 182 day treasury bills 209,919 40,121 Discount on 364 day treasury bills 24,664 34,745 483,821 88,947
(ii) Interest earned on treasury bonds received 2012 2011 Kshs.’000 Kshs.’000 Matured bonds 2,811,834 2,359,713 Discount on purchase 149,304 67,918 Amortisation of premium ( 22,153) ( 14,694) 2,938,985 2,412,937
Total investment income 3,422,806 2,501,884
Recoveries from subrogated claims 1,071 - Penalty charges on late contributions 2,680 - Bad debts recovered 880 - Miscellaneous income - 1,586 Grant income 6,826 6,102 11,457 7,688
12
The Year under Review
23
Corp
orat
e S
oci
al R
esp
onsi
bili
ty
12
The Year under Review
39
Not
es t
o t
he
Acc
iou
nts

7. WRITE-BACK OF PROTECTED DEPOSITS
Write-back of provision for protected deposits - 177
The Board has been making provisions equivalent to the amount of its exposure to protected depositors whenever a bank or financial institution is put under liquidation. The period for claims to be made by protected depositors under the statute is two years after the date of notice.
8. ADMINISTRATION AND ESTABLISHMENT EXPENSES
9. RECEIVABLES AND PREPAYMENTS
2012 2011 Kshs.’000 Kshs.’000 Staff costs 130,679 139,550 Depreciation 5,077 3,439 Lease amortization 99 99 Auditors remuneration 925 841 Directors’ emoluments - fees 6,513 2,976 Legal and professional fees 380 645 Occupancy costs 12,355 11,158 Other 52,171 30,713 208,199 189,421
2012 2011 Kshs.’000 Kshs.’000 (a) Receivables and prepayments
Receivables and prepayments 109,269 118,716 Provision for bad debts (Note 9(b)) (104,126) (102,162) 5,143 16,554
(b) Provisions for impaired receivables As at 30 June 2012, receivables amounting to Kshs. 104 million (2011 - Kshs. 102 million) were fully impaired and provided for. Movements in the provisions for impairment of receivables were as follows: 2012 2011 Kshs.’000 Kshs.’000 At 1 July 102,162 103,275 Additional provision 2,844 302 Write back-provision for bad debts ( 880) ( 1,415) At 30 June (Note 19(a)) 104,126 102,162
12
The
Year
un
der
Rev
iew
23Corporate Social Responsibility
12
The
Year
un
der
Rev
iew
40
Not
es t
o t
he
Acc
iou
nts
12
The
Year
un
der
Rev
iew
23Corporate Social Responsibility
12
The
Year
un
der
Rev
iew
40
Not
es t
o t
he
Acc
iou
nts

10.
PR
OP
ERT
Y A
ND
EQ
UIP
MEN
T
O
ffic
e
Fu
rnitu
re
and
kitc
hen
Mot
or
2012
: B
uild
ings
&
fitt
ings
eq
uipm
ent
vehi
cle
Com
pute
rs
Wor
k-In
- T
otal
Pr
ogre
ss
K
shs.’
000
Ksh
s.’00
0
Ksh
s.’00
0
K
shs.’
000
K
shs.’
000
Ksh
s.’00
0
K
shs.
’000
C
ost
At 1
July
201
1 16
,740
16
,130
9,
659
8,71
3 5,
837
- 57
,079
A
dditi
ons
-
464
546
7,76
6 2,
589
9,46
6 20
,831
A
t 30
June
201
2 16
,740
16
,594
10
,205
16
,479
8,
426
9,46
6 77
,910
D
epre
ciat
ion
At 1
July
201
1 3
,317
7,
755
6,24
3 7,
284
5,19
0 -
29,7
89
Rec
lass
ifica
tion
C
harg
e fo
r the
yea
r
367
1,
105
792
2,29
9 51
4 -
5,07
7 A
t 30
June
201
2 3
,684
8,
860
7,03
5 9,
583
5,70
4 -
34,8
66
Net
boo
k va
lue
At 3
0 Ju
ne 2
012
13,0
56
7,73
4 3,
170
6,89
6 2,
722
9,46
6 43
,044
20
11:
Cos
t A
t 1 Ju
ly 2
010
16,7
40
15,5
14
8,43
5 8,
713
5,49
8 -
54,9
00
Rec
lass
ifica
tion
- -
156
- (
1
56)
-
Add
ition
s
- 61
6 1,
068
- 49
5 -
2,17
9 A
t 30
June
201
1 16
,740
16
,130
9,
659
8,71
3 5,
837
- 57
,079
D
epre
ciat
ion
At 1
July
201
0 2
,950
6,
559
5,34
9 6,
809
4,68
3 -
26,3
50
Rec
lass
ifica
tion
- -
53
- (
53)
- -
Cha
rge
for t
he y
ear
3
67
1,19
6 84
1 47
5 56
0 -
3,43
9 A
t 30
June
201
1 3
,317
7,
755
6,24
3 7,
284
5,19
0 -
29,7
89
N
et b
ook
valu
e A
t 30
June
201
1 13
,423
8,
375
3,41
6 1,
429
647
- 27
,290
N
o de
prec
iatio
n ha
s be
en c
harg
ed i
n ar
rivin
g at
the
res
ults
for
the
yea
r in
res
pect
of
certa
in f
ully
dep
reci
ated
ass
ets
with
a
cost
of
Ksh
s.. 4
,392
,930
(2
011:
Ksh
s. 4,
153,
818)
and
are
stil
l in
use.
If
depr
ecia
tion
had
been
cha
rged
dur
ing
the
year
on
the
cost
of
thes
e as
sets
at n
orm
al r
ates
it w
ould
hav
e am
ount
ed to
K
shs..
1,4
64,3
09 (2
011:
Ksh
s. 1,
384,
605)
.
12
The Year under Review
23
Corp
orat
e S
oci
al R
esp
onsi
bili
ty
12
The Year under Review
41
Not
es t
o t
he
Acc
iou
nts
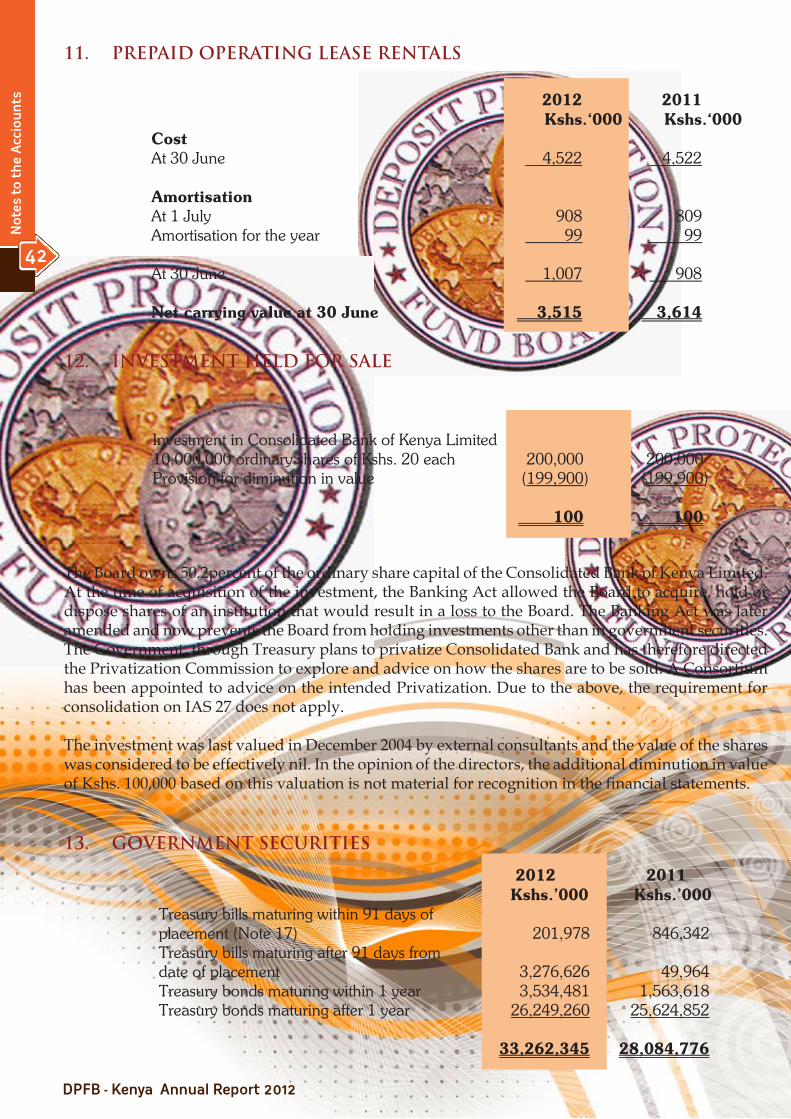
11. PREPAID OPERATING LEASE RENTALS
12. INVESTMENT HELD FOR SALE
The Board owns 50.2percent of the ordinary share capital of the Consolidated Bank of Kenya Limited. At the time of acquisition of the investment, the Banking Act allowed the Board to acquire, hold or dispose shares of an institution that would result in a loss to the Board. The Banking Act was later amended and now prevents the Board from holding investments other than in government securities. The Government, through Treasury plans to privatize Consolidated Bank and has therefore directed the Privatization Commission to explore and advice on how the shares are to be sold. A Consortium has been appointed to advice on the intended Privatization. Due to the above, the requirement for consolidation on IAS 27 does not apply.
The investment was last valued in December 2004 by external consultants and the value of the shares was considered to be effectively nil. In the opinion of the directors, the additional diminution in value of Kshs. 100,000 based on this valuation is not material for recognition in the financial statements.
13. GOVERNMENT SECURITIES
2012 2011 Kshs.‘000 Kshs.‘000 Cost At 30 June 4,522 4,522 Amortisation At 1 July 908 809 Amortisation for the year 99 99 At 30 June 1,007 908 Net carrying value at 30 June 3,515 3,614
Investment in Consolidated Bank of Kenya Limited 10,000,000 ordinary shares of Kshs. 20 each 200,000 200,000 Provision for diminution in value (199,900) (199,900) 100 100
2012 2011 Kshs.’000 Kshs.’000 Treasury bills maturing within 91 days of placement (Note 17) 201,978 846,342 Treasury bills maturing after 91 days from date of placement 3,276,626 49,964 Treasury bonds maturing within 1 year 3,534,481 1,563,618 Treasury bonds maturing after 1 year 26,249,260 25,624,852 33,262,345 28,084,776
12
The
Year
un
der
Rev
iew
23Corporate Social Responsibility
12
The
Year
un
der
Rev
iew
42
Not
es t
o t
he
Acc
iou
nts
12
The
Year
un
der
Rev
iew
23Corporate Social Responsibility
12
The
Year
un
der
Rev
iew
42
Not
es t
o t
he
Acc
iou
nts
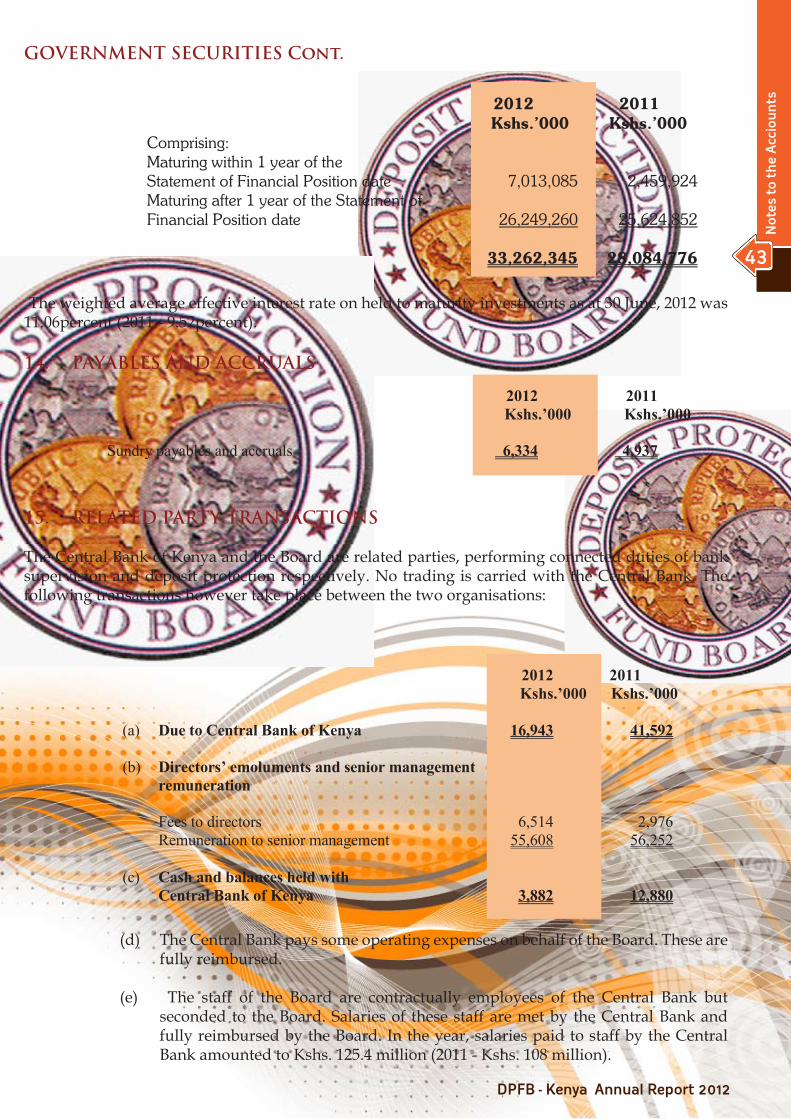
GOVERNMENT SECURITIES Cont.
The weighted average effective interest rate on held to maturity investments as at 30 June, 2012 was 11.06percent (2011 - 9.52percent).
14. PAYABLES AND ACCRUALS
15. RELATED PARTY TRANSACTIONS
The Central Bank of Kenya and the Board are related parties, performing connected duties of bank supervision and deposit protection respectively. No trading is carried with the Central Bank. The following transactions however take place between the two organisations:
(d) The Central Bank pays some operating expenses on behalf of the Board. These are fully reimbursed.
(e) The staff of the Board are contractually employees of the Central Bank but seconded to the Board. Salaries of these staff are met by the Central Bank and fully reimbursed by the Board. In the year, salaries paid to staff by the Central Bank amounted to Kshs. 125.4 million (2011 - Kshs. 108 million).
2012 2011 Kshs.’000 Kshs.’000
Comprising: Maturing within 1 year of the Statement of Financial Position date 7,013,085 2,459,924 Maturing after 1 year of the Statement of Financial Position date 26,249,260 25,624,852 33,262,345 28,084,776
2012 2011 Kshs.’000 Kshs.’000 Sundry payables and accruals 6,334 4,937
2012 2011 Kshs.’000 Kshs.’000 (a) Due to Central Bank of Kenya 16,943 41,592 (b) Directors’ emoluments and senior management
remuneration Fees to directors 6,514 2,976 Remuneration to senior management 55,608 56,252
(c) Cash and balances held with
Central Bank of Kenya 3,882 12,880
12
The Year under Review
23
Corp
orat
e S
oci
al R
esp
onsi
bili
ty
12
The Year under Review
43
Not
es t
o t
he
Acc
iou
nts
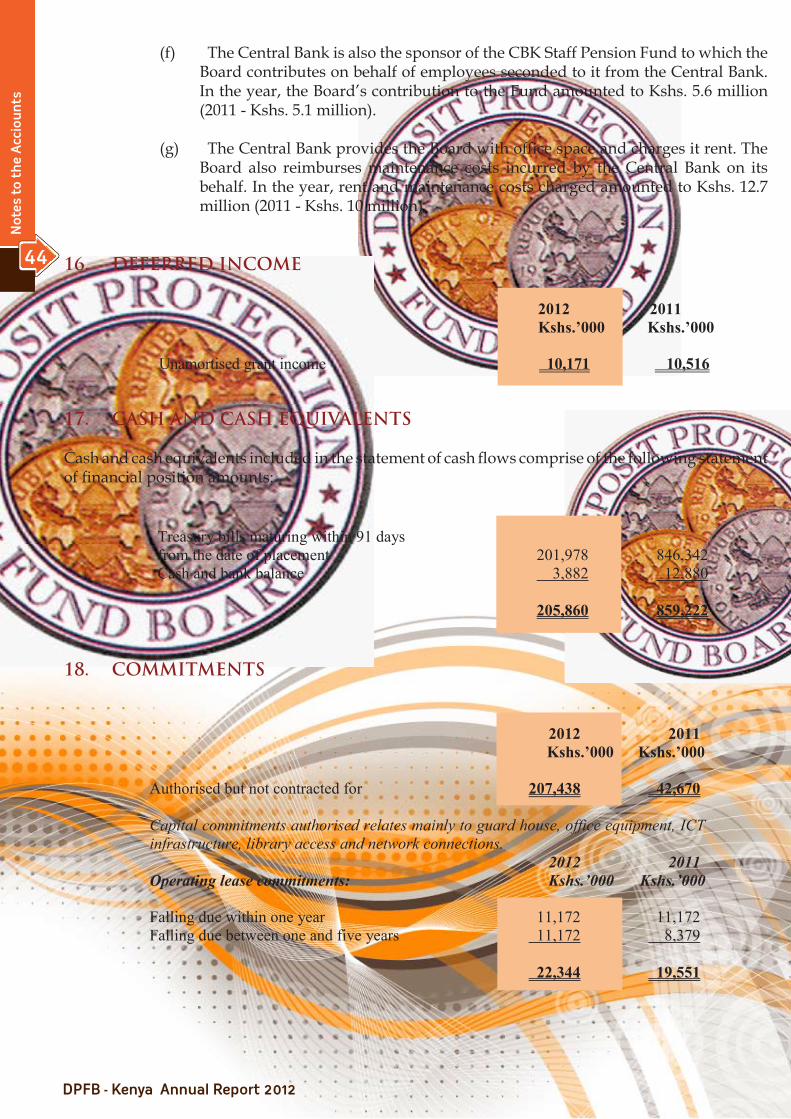
(f) The Central Bank is also the sponsor of the CBK Staff Pension Fund to which the Board contributes on behalf of employees seconded to it from the Central Bank. In the year, the Board’s contribution to the Fund amounted to Kshs. 5.6 million (2011 - Kshs. 5.1 million).
(g) The Central Bank provides the Board with office space and charges it rent. The Board also reimburses maintenance costs incurred by the Central Bank on its behalf. In the year, rent and maintenance costs charged amounted to Kshs. 12.7 million (2011 - Kshs. 10 million).
16. DEFERRED INCOME
17. CASH AND CASH EQUIVALENTS
Cash and cash equivalents included in the statement of cash flows comprise of the following statement of financial position amounts:
18. COMMITMENTS
2012 2011 Kshs.’000 Kshs.’000 Unamortised grant income 10,171 10,516
Treasury bills maturing within 91 days from the date of placement 201,978 846,342 Cash and bank balance 3,882 12,880 205,860 859,222
2012 2011 Kshs.’000 Kshs.’000 Authorised but not contracted for 207,438 42,670 Capital commitments authorised relates mainly to guard house, office equipment, ICT infrastructure, library access and network connections. 2012 2011 Operating lease commitments: Kshs.’000 Kshs.’000 Falling due within one year 11,172 11,172 Falling due between one and five years 11,172 8,379 22,344 19,551
12
The
Year
un
der
Rev
iew
23Corporate Social Responsibility
12
The
Year
un
der
Rev
iew
44
Not
es t
o t
he
Acc
iou
nts

19. RISK MANAGEMENT
Structure and reporting
The Board of Directors is responsible for the overall risk management approach and for approving the risk management policy and strategies. There are other organs that monitor the assessment and management of risks within the Board including;
Audit Committee of the Board
The Audit Committee assists the Board in the fulfillment of its oversight responsibilities. The Committee guides and monitors the implementation of controls by the Board.
Deposit Insurance and Risk Management Section
The Board has an established Deposit Insurance & Risk Management Section that receives off-site information on deposits from member institutions for analysis and works closely with Central Bank of Kenya to monitor the performance of the Banking industry.
Internal Audit and Risk Management Unit
The operations of the Board are subject to internal audit by the Internal Audit Unit of the Deposit Protection Fund Board. The Internal Audit Unit employs full scope audit approach in planning and carrying out its audit engagements. The business processes are assessed with regard to business continuity procedures, physical safety, system safety, conformity to legal requirements and regulations, sufficiency of human resources and information safety. In addition, the financial risks and reputation risks are also determined.
Controls that are designed to reduce these risks to acceptable levels are assessed in terms of sufficiency and effectiveness; additional controls are recommended in order to increase effectiveness.
The main risks faced by the Board in respect of its principal non-derivative financial instruments are interest rate risk and liquidity risk. The directors review and agree on policies for managing these risks. The Board maintains a conservative policy regarding interest rate and liquidity risks. The Board does not engage in speculation in the markets. In addition, the Board does not speculate or trade in derivative financial instruments.
The Board’s principal financial instruments comprise investments held to maturity; cash and cash equivalents; receivables and prepayments; payables and accruals; provisions for protected deposit claims; and amounts due to related parties.
(a) Credit risk
Credit risk is the risk of financial loss to the Board if a customer or counterparty to a financial instrument fails to meet its contractual obligations, and arises principally from the Board’s receivables from customers.
Trade and other receivables
The Board’s exposure to credit risk is influenced mainly by the individual characteristics of each customer.
12
The Year under Review
23
Corp
orat
e S
oci
al R
esp
onsi
bili
ty
12
The Year under Review
45
Not
es t
o t
he
Acc
iou
nts
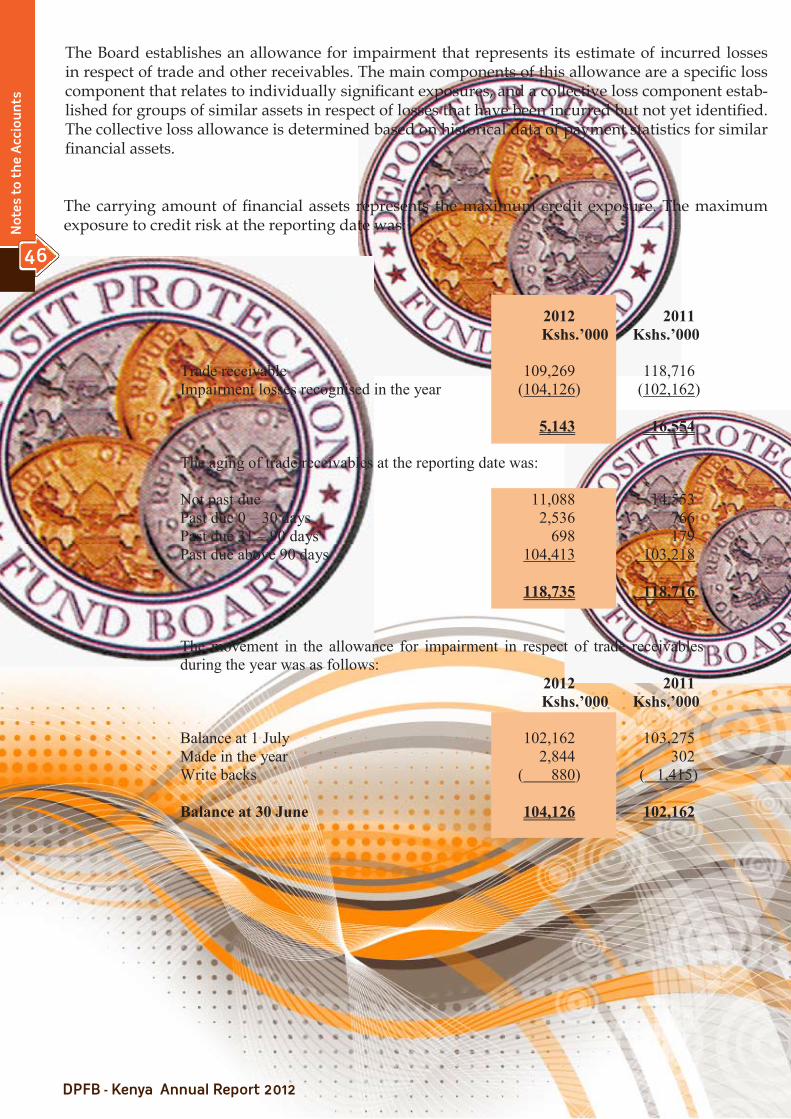
The Board establishes an allowance for impairment that represents its estimate of incurred losses in respect of trade and other receivables. The main components of this allowance are a specific loss component that relates to individually significant exposures, and a collective loss component estab-lished for groups of similar assets in respect of losses that have been incurred but not yet identified. The collective loss allowance is determined based on historical data of payment statistics for similar financial assets.
The carrying amount of financial assets represents the maximum credit exposure. The maximum exposure to credit risk at the reporting date was:
2012 2011 Kshs.’000 Kshs.’000 Trade receivable 109,269 118,716 Impairment losses recognised in the year (104,126) (102,162) 5,143 16,554 The aging of trade receivables at the reporting date was: Not past due 11,088 14,553 Past due 0 – 30 days 2,536 766 Past due 31 – 90 days 698 179 Past due above 90 days 104,413 103,218 118,735 118,716 The movement in the allowance for impairment in respect of trade receivables during the year was as follows: 2012 2011 Kshs.’000 Kshs.’000 Balance at 1 July 102,162 103,275 Made in the year 2,844 302 Write backs ( 880) ( 1,415) Balance at 30 June 104,126 102,162
12
The
Year
un
der
Rev
iew
23Corporate Social Responsibility
12
The
Year
un
der
Rev
iew
46
Not
es t
o t
he
Acc
iou
nts

(b
) I
nter
est r
ate
risk
man
agem
ent
Inte
rest
rate
risk
is th
e ris
k th
at th
e va
lue
and
cash
flow
s of
a fi
nanc
ial i
nstru
men
t will
fluc
tuat
e du
e to
cha
nges
in m
arke
t int
eres
t ra
tes.
Exce
ss fu
nds h
eld
by th
e B
oard
are
inve
sted
in T
reas
ury
bills
and
Tre
asur
y bo
nds.
The
follo
win
g ta
ble
sets
out
the
carr
ying
am
ount
by
mat
urity
, of t
he B
oard
’s fi
nanc
ial i
nstru
men
ts th
at a
re e
xpos
ed to
inte
rest
rate
ris
k:
2012
:
Upt
o 1
year
1 –
5 ye
ars
6 –
10 y
ears
O
ver
10
year
s
Non
in
tere
st
bear
ing
Tot
al
K
shs.’
000
Ksh
s.’00
0 K
shs.’
000
Ksh
s.’00
0 K
shs.’
000
Ksh
s.’00
0
Rec
eiva
bles
and
pre
paym
ents
-
-
- -
5,14
3 5,
143
Cas
h an
d ba
nk b
alan
ce
- -
- -
3,88
2 3,
882
Inve
stm
ents
hel
d to
mat
urity
7,
013,
085
7,02
5,25
5 9,
532,
262
9,69
1,74
3 -
33,2
62,3
45
Paya
bles
and
acc
rual
s -
- -
- (6
,334
) (6
,334
) D
ue to
rela
ted
party
-
- -
- (1
6,94
3)
(16,
943)
Inte
rest
sens
itivi
ty g
ap
At 3
0 Ju
ne 2
012
7,01
3,08
5 7,
025,
255
9,53
2,26
2 9,
691,
743
(14,
252)
33
,248
,093
2011
:
Rec
eiva
bles
and
pre
paym
ents
-
- -
- 16
,554
16
,554
C
ash
and
bank
bal
ance
-
- -
- 12
,880
12
,880
In
vest
men
ts h
eld
to m
atur
ity
2,45
9,92
4 8,
758,
629
11,8
82,6
48
4,98
3,57
5 -
28,0
84,7
76
Paya
bles
and
acc
rual
s -
- -
- (4
,937
) (4
,937
) D
ue to
rela
ted
party
-
- -
- (4
1,59
2)
(41,
592)
Inte
rest
sens
itivi
ty g
ap
At 3
0 Ju
ne 2
011
2,45
9,92
4 8,
758,
629
11,8
82,6
48
4,98
3,57
5 (1
7,09
5)
28,0
67,6
81
12
The Year under Review
23
Corp
orat
e S
oci
al R
esp
onsi
bili
ty
12
The Year under Review
47
Not
es t
o t
he
Acc
iou
nts

(b) Interest rate risk management
The following table demonstrates the sensitivity to a reasonably possible change in the interest rates, with all other variables held constant, on the Board’s surplus. The sensitivity computations assume that financial assets maintain a constant rate of return from one year to the next.
(c) Liquidity risk management
Liquidity risk is the risk that the Board will encounter difficulty in meeting obligations from its financial liabilities. The Board’s approach to managing liquidity is to ensure, as far as possible, that it will always have sufficient liquidity to meet its liabilities when due, without incurring unacceptable losses or risking damage to the Board’s reputation. In the course of its operations the Board invests its capital in forms that vary in liquidity ranging from government securities that are readily convertible and sundry receivables. Simultaneously it carries current liabilities in form of provisions for protected deposits, sundry payables and related party liabilities. The entity matches its current assets to the current liabilities falling due to mitigate the risk of low liquidity.
The Board’s financial liabilities amount to Kshs.. 23,277,000 (2011 - Kshs. 46,529,000) and are all short term.
(d) Currency risk
The Board operates wholly within Kenya and its assets and liabilities are reported in the local currency. It does not transact in foreign currencies.
2012 2011 Kshs.’000 Kshs.’000
Effect on surplus for the year of a +5percent change in interest rates 1,663,117 1,402,894 Effect on surplus for the year of a -5percent change in interest rates (1,663,117) (1,402,894)
12
The
Year
un
der
Rev
iew
23Corporate Social Responsibility
12
The
Year
un
der
Rev
iew
48
Not
es t
o t
he
Acc
iou
nts

(e)
F
air v
alue
The f
air v
alue
of f
inan
cial
asse
ts an
d lia
bilit
ies i
s the
sam
e as t
he ca
rryin
g am
ount
s as s
how
n in
the s
tate
men
t of f
inan
cial
pos
ition
: 20
12:
Oth
er fi
nanc
ial
liabi
lity
Loan
s and
re
ceiv
able
s A
vaila
ble
for s
ale
Hel
d to
m
atur
ity
Tota
l car
ryin
g va
lue
Fair
Val
ue
K
shs.
’000
K
shs.
’000
K
shs.
’000
K
shs.
’000
K
shs.
’000
K
shs.
’000
Fi
nanc
ial a
sset
s
G
over
nmen
t sec
uriti
es
- -
- 33
,262
,345
33
,262
,345
33
,262
,345
In
vestm
ent h
eld
for s
ale
- -
100
- 10
0 10
0 Ca
sh an
d ba
nk b
alan
ces
- -
3,88
2 -
3,88
2 3,
882
- -
3,98
2 33
,262
,345
33
,266
,327
33
,266
,327
Fi
nanc
ial l
iabi
litie
s
A
mou
nts d
ue to
gro
up co
mpa
nies
16
,943
-
- -
16,9
43
16,9
43
Trad
e and
oth
er p
ayab
les
6,33
4 -
- -
6,33
4 6,
334
23
,277
-
- -
23,2
77
23,2
77
2011
:
Fi
nanc
ial a
sset
s
G
over
nmen
t sec
uriti
es
- -
- 28
,084
,776
28
,084
,776
28
,084
,776
In
vestm
ent h
eld
for s
ale
- -
100
- 10
0 10
0 Ca
sh an
d ba
nk b
alan
ces
- -
12,8
80
- 12
,880
12
,880
- -
12,9
80
28,0
84,7
76
2
8,09
7,75
6
28,
097,
7 56
Fi
nanc
ial l
iabi
litie
s
A
mou
nts d
ue to
gro
up co
mpa
nies
41
,592
-
- -
41,5
92
41,5
92
Trad
e and
oth
er p
ayab
les
4,93
7 -
- -
4,93
7 4,
937
46,5
29
-
-
-
46
,529
46
,529
12
The Year under Review
23
Corp
orat
e S
oci
al R
esp
onsi
bili
ty
12
The Year under Review
49
Not
es t
o t
he
Acc
iou
nts
(f) Capital management
The primary objectives of the Board’s capital management are to ensure that the Board maintains healthy capital ratios in order to support its business and to maximize the value for the insured depositors in member institutions. The Board manages its Fund and makes adjustments to it, as per the requirements of the Banking Act. The total accumulated Fund as at 30 June 2012 was Kshs. 33,285 million (2011 - Kshs. 28,088 million).
20. CONTIGENT LIABILITIES
Litigation
Mr. Ajay Shah (former Managing Director of Trust Bank Limited) filed a case in 2002 claiming general damages and special damages amounting to Kshs. 144 million against Trust Bank Limited (In Liquidation) and the Board on allegations of defamation and publication of malicious false statements. The suit is pending hearing. No provision has been made in the financial statements because, in the opinion of the directors, the claim is unlikely to succeed and DPFB is sued as the Liquidator of Trust Bank Ltd (IL). Therefore incase judgment is entered against DPFB the costs shall be paid by Trust Bank Ltd (IL).
12
The
Year
un
der
Rev
iew
23Corporate Social Responsibility
12
The
Year
un
der
Rev
iew
50
Not
es t
o t
he
Acc
iou
nts

COMMERCIAL BANKS AND OTHER FINANCIAL INSTITUTIONS ASSESSED CONTRIBUTORS FOR THE YEAR ENDED 30 JUNE 2012
COMMERCIAL BANKS 1. African Banking Corporation Limited 2. Bank of Africa Kenya Limited 3. Bank of Baroda Kenya Limited 4. Bank of India 5. Barclays Bank of Kenya Limited 6. CFC Stanbic Bank Limited 7. Charterhouse Bank Limited 8. Chase Bank Limited 9. Citibank N.A. 10. Commercial Bank of Africa Limited 11. Consolidated Bank of Kenya Limited 12. Co-operative Bank of Kenya Limited 13. Credit Bank Limited 14. Development Bank of Kenya Limited 15. Diamond Trust Bank of Kenya Limited 16. Dubai Bank Kenya Limited 17. Ecobank Kenya Limited 18. Equatorial Commercial Bank Limited 19. Equity Bank Limited 20. Family Bank Limited 21. Fidelity Commercial Bank Limited 22. FINA Bank Limited 23. First Community Bank Limited 24. Giro Commercial Bank Limited 25. Guardian Bank Limited 26. Gulf African Bank Limited 27. Habib Bank A.G. Zurich 28. Habib Bank Limited 29. Imperial Bank Limited 30. I&M Bank Limited31. Jamii Bora Bank Ltd 32. Kenya Commercial Bank Limited 33. K-Rep Bank Limited 34. Middle East Bank Kenya Limited 35. National Bank of Kenya Limited 36. NIC Bank Limited 37. Oriental Commercial Bank Limited 38. Paramount Universal Bank Limited 39. Prime Bank Limited 40. Standard Chartered Bank of Kenya Limited 41. Transnational Bank Limited42 UBA Kenya Bank Ltd 43. Victoria Commercial Bank Limited
12
The Year under Review
23
Corp
orat
e S
oci
al R
esp
onsi
bili
ty
12
The Year under Review
51
Ap
pen
dice
s
MORTGAGE FINANCE INSITUTION
1. Housing Finance Company of Kenya Ltd
DEPOSIT TAKING MICRO FINANCE INSITUTIONS
1. Faulu Kenya Ltd2. KWFT Microfinance Ltd3. Uwezo DTM Ltd4. Smep DTM Ltd5. Remu DTM Ltd6. Rafiki DTM Ltd

Bank
Branch Network
Directors’ Names Status Approved Auditors
1
African Banking Corporation Ltd P.O Box 46452-00100 Nairobi Tel 2223922 www.abcthebank.com
9
Ashraf Savani Shamaz Savani Richard Omwela Joseph K. Muiruri Anil Ishani
Chairman Managing Director Non Executive Non-Executive Non-Executive
Delloite & Touche
2 Bank of Africa (K) Ltd P.O. Box 69562-00400 Nairobi Tel 3275000 www.boakenya.com
27 Paul Derreumaux Kwame Ahadzi Jean-Geo Pastouret Ramesh R. Vora Vincent de Brouwer A. Randrianasolo Davinder Sikand Shakir M.Merali (Alt) Ben Zwinkels Benjelloun-Touimi Mohamed Bennani
Chairman Managing Director Dy.Managing Director Co. Secretary Non-Executive Non-Executive Non-Executive Non-Executive Non-Executive Non-Executive Non-Executive
Price Waterhouse Coopers
3 Bank of Baroda (K) Ltd. P.O. Box 30033-00100 Nairobi. Tel 2248402 / 2226416 [email protected]
10 Rajiv K. Bakshi Arun Shrivastava Kupple Dev Lamba Joseph K. Muiruri Vikram C. Kanji
M Sunil K. Srivastava
Chairman Executive Non-Executive Non-Executive Non-Executive Executive
PKF Kenya
4
Bank of India Ltd. P.O. Box 30246-00100 Nairobi. Tel 2221414 -1 6 [email protected]
4
Dr M. P. Chandaria Allan N. Ngugi Mary Ngatia
Local Advisory Committee Local Advisory Committee Local Advisory Committee
PKF Kenya
12
The
Year
un
der
Rev
iew
23Corporate Social Responsibility
12
The
Year
un
der
Rev
iew
52
Ap
pen
dix
I
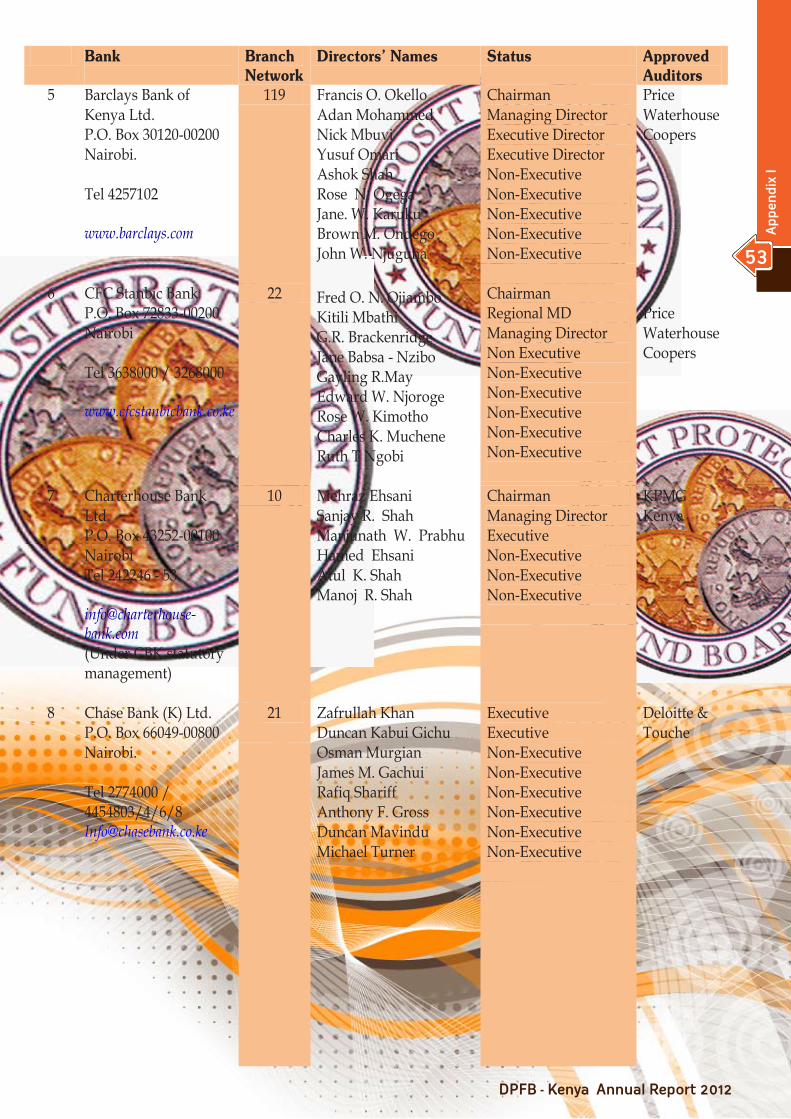
Bank
Branch Network
Directors’ Names Status Approved Auditors
5 Barclays Bank of Kenya Ltd. P.O. Box 30120-00200 Nairobi. Tel 4257102 www.barclays.com
119 Francis O. Okello Adan Mohammed Nick Mbuvi Yusuf Omari Ashok Shah Rose N. Ogega Jane. W. Karuku Brown M. Ondego John W. Njuguna
Chairman Managing Director Executive Director Executive Director Non-Executive Non-Executive Non-Executive Non-Executive Non-Executive
Price Waterhouse Coopers
6 CFC Stanbic Bank P.O. Box 72833-00200 Nairobi Tel 3638000 / 3268000 www.cfcstanbicbank.co.ke
22 Fred O. N. Ojiambo Kitili Mbathi G.R. Brackenridge Jane Babsa - Nzibo Gayling R.May Edward W. Njoroge Rose W. Kimotho Charles K. Muchene Ruth T Ngobi
Chairman Regional MD Managing Director Non Executive Non-Executive Non-Executive Non-Executive Non-Executive Non-Executive
Price Waterhouse Coopers
7 Charterhouse Bank Ltd. P.O. Box 43252-00100 Nairobi Tel 242246 - 53 [email protected] (Under CBK statutory management)
10 Mehraz Ehsani Sanjay R. Shah Manjunath W. Prabhu Hamed Ehsani Atul K. Shah Manoj R. Shah
Chairman Managing Director Executive Non-Executive Non-Executive Non-Executive
KPMG Kenya
8 Chase Bank (K) Ltd. P.O. Box 66049-00800 Nairobi. Tel 2774000 / 4454803/4/6/8 [email protected]
21
Zafrullah Khan Duncan Kabui Gichu Osman Murgian James M. Gachui Rafiq Shariff Anthony F. Gross Duncan Mavindu Michael Turner
Executive Executive Non-Executive Non-Executive Non-Executive Non-Executive Non-Executive Non-Executive
Deloitte & Touche
12
The Year under Review
23
Corp
orat
e S
oci
al R
esp
onsi
bili
ty
12
The Year under Review
53
Ap
pen
dix
I
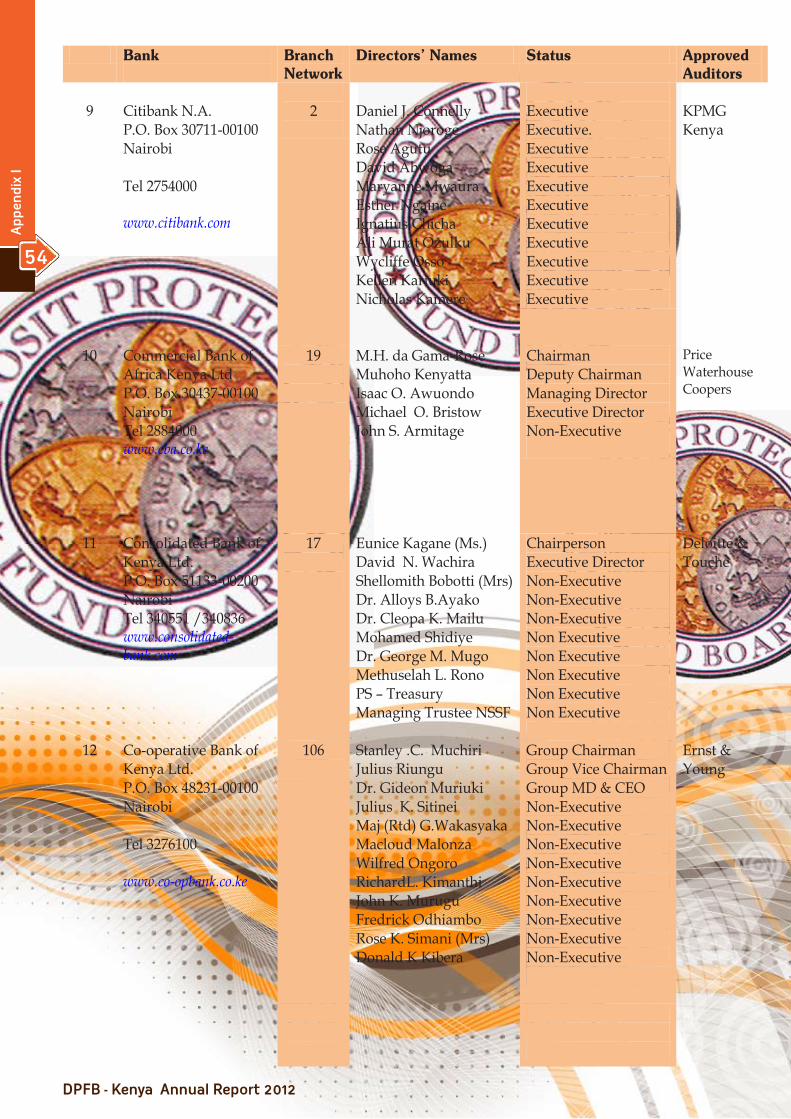
Bank
Branch Network
Directors’ Names Status Approved Auditors
9
Citibank N.A. P.O. Box 30711-00100 Nairobi Tel 2754000 www.citibank.com
2
Daniel J. Connelly Nathan Njoroge Rose Agutu David Abwoga Maryanne Mwaura Esther Ngaine Ignatius Chicha Ali Murat Ozulku Wycliffe Osso Kellen Kariuki Nicholas Kamere
Executive Executive. Executive Executive Executive Executive Executive Executive Executive Executive Executive
KPMG Kenya
10 Commercial Bank of Africa Kenya Ltd P.O. Box 30437-00100 Nairobi Tel 2884000 www.cba.co.ke
19
M.H. da Gama-Rose Muhoho Kenyatta Isaac O. Awuondo Michael O. Bristow John S. Armitage
Chairman Deputy Chairman Managing Director Executive Director Non-Executive
Price Waterhouse Coopers
11 Consolidated Bank of Kenya Ltd. P.O. Box 51133-00200 Nairobi Tel 340551 /340836 www.consolidated-bank.com
17
Eunice Kagane (Ms.) David N. Wachira Shellomith Bobotti (Mrs) Dr. Alloys B.Ayako Dr. Cleopa K. Mailu Mohamed Shidiye Dr. George M. Mugo Methuselah L. Rono PS – Treasury Managing Trustee NSSF
Chairperson Executive Director Non-Executive Non-Executive Non-Executive Non Executive Non Executive Non Executive Non Executive Non Executive
Deloitte & Touche
12 Co-operative Bank of Kenya Ltd. P.O. Box 48231-00100 Nairobi Tel 3276100 www.co-opbank.co.ke
106
Stanley .C. Muchiri Julius Riungu Dr. Gideon Muriuki Julius K. Sitinei Maj (Rtd) G.Wakasyaka Macloud Malonza Wilfred Ongoro RichardL. Kimanthi John K. Murugu Fredrick Odhiambo Rose K. Simani (Mrs) Donald K Kibera
Group Chairman Group Vice Chairman Group MD & CEO Non-Executive Non-Executive Non-Executive Non-Executive Non-Executive Non-Executive Non-Executive Non-Executive Non-Executive
Ernst & Young
12
The
Year
un
der
Rev
iew
23Corporate Social Responsibility
12
The
Year
un
der
Rev
iew
54
Ap
pen
dix
I
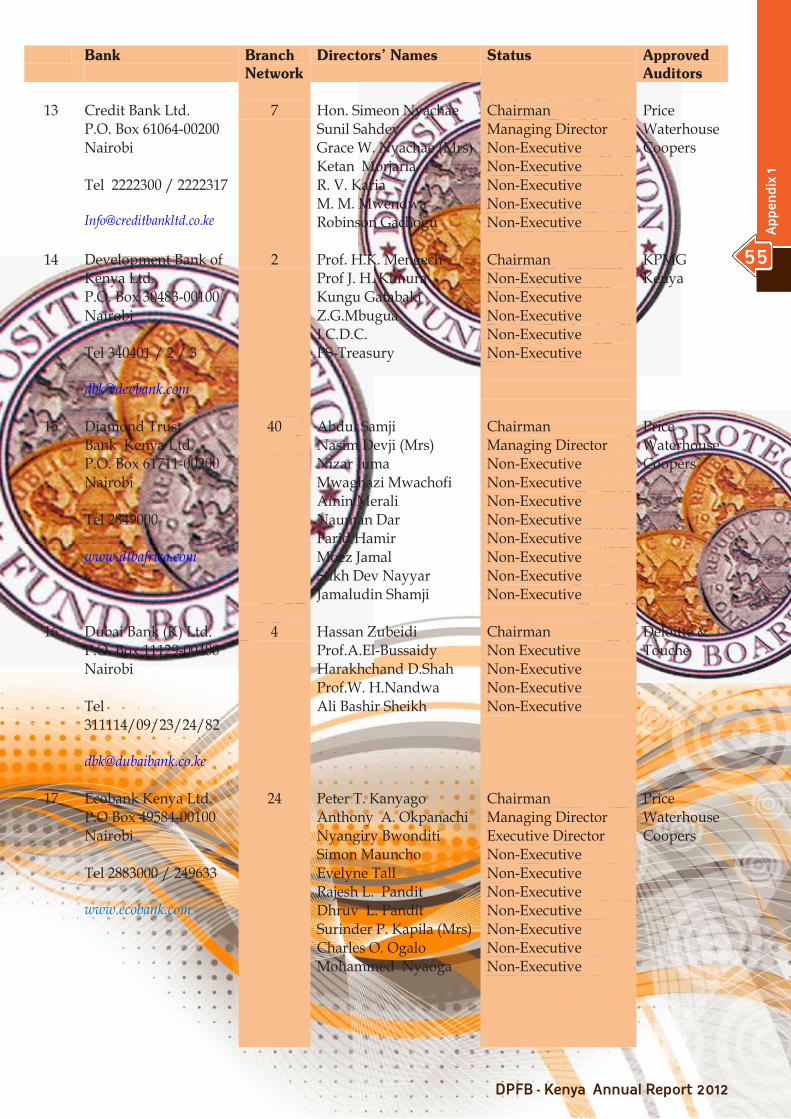
Bank
Branch Network
Directors’ Names Status Approved Auditors
13
Credit Bank Ltd. P.O. Box 61064-00200 Nairobi Tel 2222300 / 2222317 [email protected]
7
Hon. Simeon Nyachae Sunil Sahdev Grace W. Nyachae (Mrs) Ketan Morjaria R. V. Karia M. M. Mwendwa Robinson Gachogu
Chairman Managing Director Non-Executive Non-Executive Non-Executive Non-Executive Non-Executive
Price Waterhouse Coopers
14 Development Bank of Kenya Ltd. P.O. Box 30483-00100 Nairobi Tel 340401 / 2 / 3 [email protected]
2 Prof. H.K. Mengech Prof J. H. Kimura Kungu Gatabaki Z.G.Mbugua I.C.D.C. PS-Treasury
Chairman Non-Executive Non-Executive Non-Executive Non-Executive Non-Executive
KPMG Kenya
15 Diamond Trust Bank Kenya Ltd. P.O. Box 61711-00200 Nairobi Tel 2849000 www.dtbafrica.com
40
Abdul Samji Nasim Devji (Mrs) Nizar Juma Mwaghazi Mwachofi Amin Merali Nauman Dar Farid Hamir Moez Jamal Sukh Dev Nayyar Jamaludin Shamji
Chairman Managing Director Non-Executive Non-Executive Non-Executive Non-Executive Non-Executive Non-Executive Non-Executive Non-Executive
Price Waterhouse Coopers
16
Dubai Bank (K) Ltd. P.O. Box 11129-00400 Nairobi Tel 311114/09/23/24/82 [email protected]
4
Hassan Zubeidi Prof.A.El-Bussaidy Harakhchand D.Shah Prof.W. H.Nandwa Ali Bashir Sheikh
Chairman Non Executive Non-Executive Non-Executive Non-Executive
Deloitte & Touche
17
Ecobank Kenya Ltd. P.O Box 49584-00100 Nairobi Tel 2883000 / 249633 www.ecobank.com
24
Peter T. Kanyago Anthony A. Okpanachi Nyangiry Bwonditi Simon Mauncho Evelyne Tall Rajesh L. Pandit Dhruv L. Pandit Surinder P. Kapila (Mrs) Charles O. Ogalo Mohammed Nyaoga
Chairman Managing Director Executive Director Non-Executive Non-Executive Non-Executive Non-Executive Non-Executive Non-Executive Non-Executive
Price Waterhouse Coopers
12
The Year under Review
23
Corp
orat
e S
oci
al R
esp
onsi
bili
ty
12
The Year under Review
55
Ap
pen
dix
1
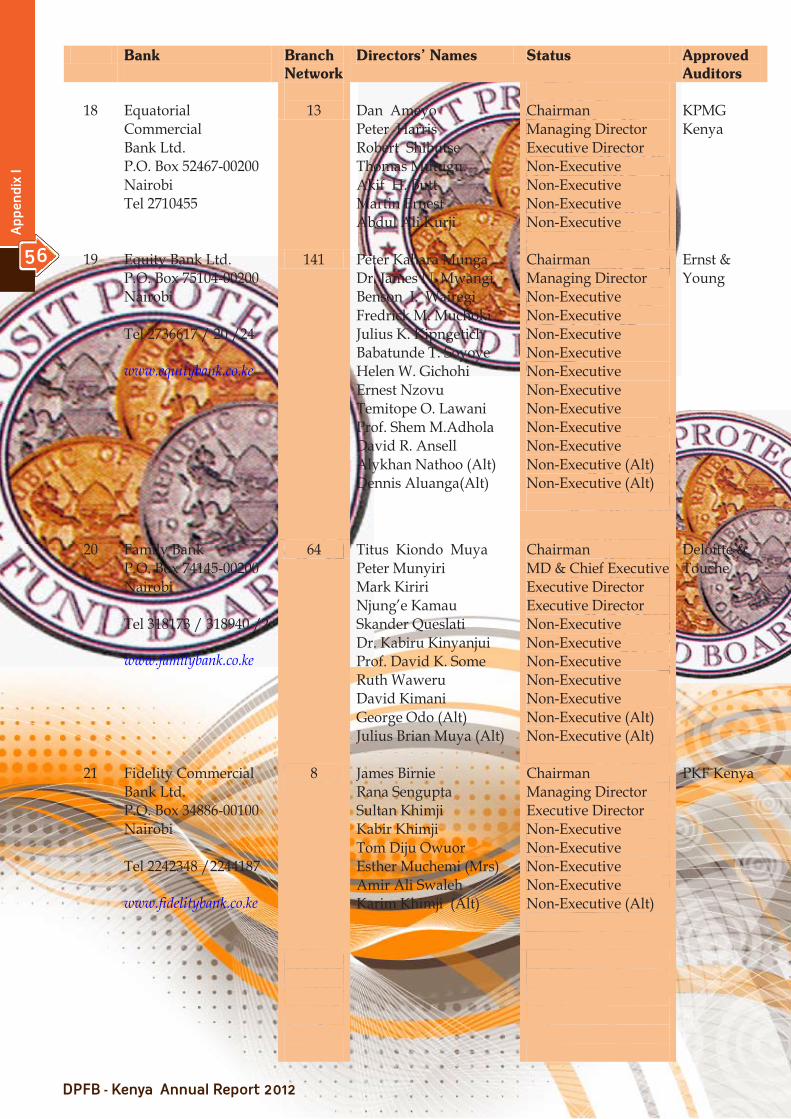
Bank
Branch Network
Directors’ Names Status Approved Auditors
18
Equatorial Commercial Bank Ltd. P.O. Box 52467-00200 Nairobi Tel 2710455
13
Dan Ameyo Peter Harris Robert Shibutse Thomas Mutugu Akif H. Butt Martin Ernest Abdul Ali Kurji
Chairman Managing Director Executive Director Non-Executive Non-Executive Non-Executive Non-Executive
KPMG Kenya
19 Equity Bank Ltd. P.O. Box 75104-00200 Nairobi Tel 2736617 / 20 /24 www.equitybank.co.ke
141 Peter Kahara Munga Dr. James N. Mwangi Benson I. Wairegi Fredrick M. Muchoki Julius K. Kipngetich Babatunde T. Soyoye Helen W. Gichohi Ernest Nzovu Temitope O. Lawani Prof. Shem M.Adhola David R. Ansell Alykhan Nathoo (Alt) Dennis Aluanga(Alt)
Chairman Managing Director Non-Executive Non-Executive Non-Executive Non-Executive Non-Executive Non-Executive Non-Executive Non-Executive Non-Executive Non-Executive (Alt) Non-Executive (Alt)
Ernst & Young
20 Family Bank P.O. Box 74145-00200 Nairobi Tel 318173 / 318940 /2 www.familybank.co.ke
64 Titus Kiondo Muya Peter Munyiri Mark Kiriri Njung’e Kamau Skander Queslati Dr. Kabiru Kinyanjui Prof. David K. Some Ruth Waweru David Kimani George Odo (Alt) Julius Brian Muya (Alt)
Chairman MD & Chief Executive Executive Director Executive Director Non-Executive Non-Executive Non-Executive Non-Executive Non-Executive Non-Executive (Alt) Non-Executive (Alt)
Deloitte & Touche
21
Fidelity Commercial Bank Ltd. P.O. Box 34886-00100 Nairobi Tel 2242348 /2244187 www.fidelitybank.co.ke
8
James Birnie Rana Sengupta Sultan Khimji Kabir Khimji Tom Diju Owuor Esther Muchemi (Mrs) Amir Ali Swaleh Karim Khimji (Alt)
Chairman Managing Director Executive Director Non-Executive Non-Executive Non-Executive Non-Executive Non-Executive (Alt)
PKF Kenya
12
The
Year
un
der
Rev
iew
23Corporate Social Responsibility
12
The
Year
un
der
Rev
iew
56
Ap
pen
dix
I

Bank
Branch Network
Directors’ Names Status Approved Auditors
22 Fina Bank Ltd. P.O. Box 20613-00200 Nairobi Tel 3284000 www.finabank.com
13 Dhanu H. Chandaria Bhaskar Ghose Rajesh Kapoor Rajesh Kumar Nalinkumar N. Shah Hanish D. Chandaria Ramesh Kumar Patel Steve Omende Mainda Macharia Njeru
Chairman CEO Executive Director Executive Director Non-Executive Non-Executive Non-Executive Non-Executive Non-Executive
Price Waterhouse Coopers
23 First Community Bank P.O.Box 26219- 00100 Nairobi, Kenya Tel 2843000 www.firstcommunitybank.co.ke
17 Hassan Varvani Abdullatiff Essajee Nathif Jama Adam Dr. Musa J. Assad Abdulhamid Aboo Jama Mohammed Issa Mohamed Mbaye
Chairman Executive Non-Executive Non-Executive Non-Executive Non-Executive Non-Executive
Price Waterhouse Coopers
24 Giro Commercial Bank Ltd P.O. Box 13400-00800 Nairobi Tel 020 - 4229000
7 C.J. Gidoomal T.K.Krishnan B.K.Patel P.J. Gidoomal Carey M. Ngini M. S. Shah
Chairman Managing Director Executive Non-Executive Non-Executive Non-Executive
Deloitte & Touche
25 Guardian Bank. P.O. Box 67681-00200 Nairobi Tel 8560548 / 8561411 [email protected]
6 Magan Chandaria Vasant K. Shetty Mahesh Chandaria Harban Rajesh Sahi Shantilal Shah Hetul Chandaria Diamond Jamal
Chairman Managing Director Non-Executive Non-Executive Non-Executive Non- Executive Non- Executive
KPMG Kenya
26 Gulf African Bank Ltd P.O.Box 43683-00100 Nairobi Tel 2718608 / 9
14
Suleiman S. S. Shahbal Mustafa Beg Ahmed Said Bajaber Ahmed M. A. Al Abri Jamal Al Hazeem
Chairman Non-Executive Non-Executive Non-Executive Non-Executive
KPMG Kenya
27 Habib Bank AG Zurich P.O. Box 30584-00100 Nairobi. Tel 341172 / 6 / 7 habibbank@wananchi com
4 N. A. Mohammed M.A. Hussain Zarir Somjee Mohammed Arif Iqbal Somani Simon K. Murigi
Local Committee Local Committee Local Committee Local Committee Local Committee Local Committee
KPMG Kenya
12
The Year under Review
23
Corp
orat
e S
oci
al R
esp
onsi
bili
ty
12
The Year under Review
57
Ap
pen
dix
I
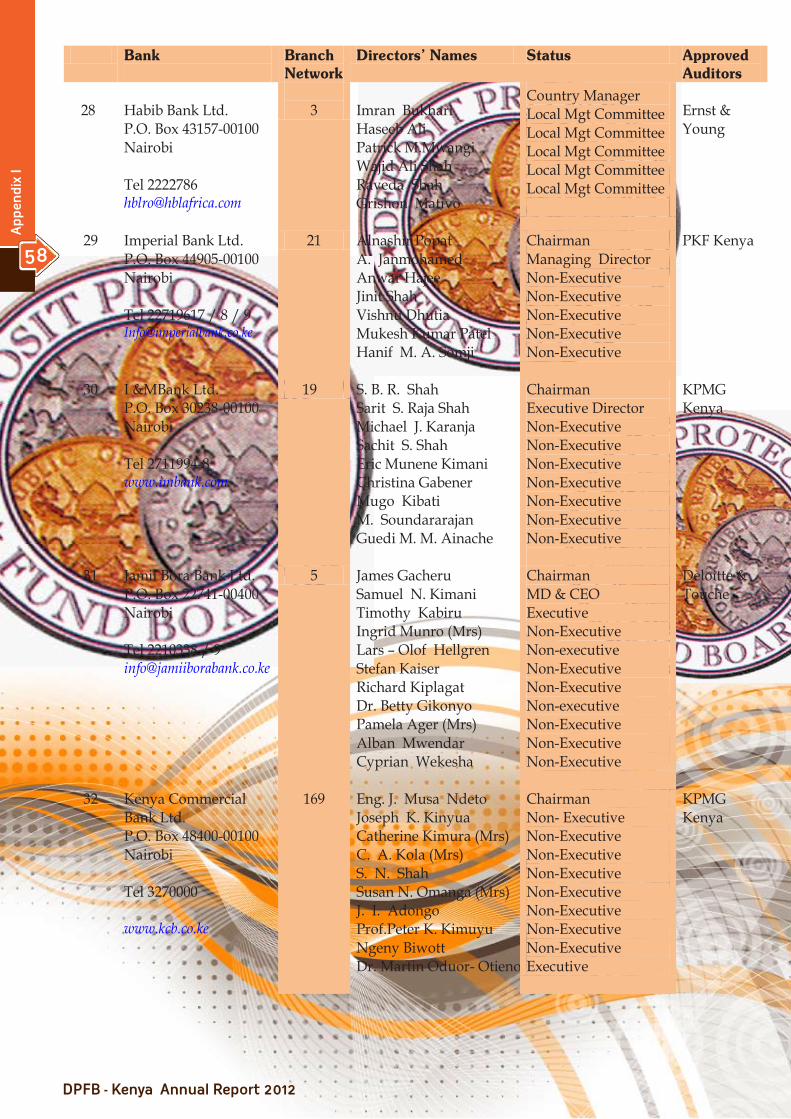
Bank
Branch Network
Directors’ Names Status Approved Auditors
28
Habib Bank Ltd. P.O. Box 43157-00100 Nairobi Tel 2222786 [email protected]
3
Imran Bukhari Haseeb Ali Patrick M.Mwangi Wajid Ali Shah Raveda Shah Grishon Mativo
Country Manager Local Mgt Committee Local Mgt Committee Local Mgt Committee Local Mgt Committee Local Mgt Committee
Ernst & Young
29 Imperial Bank Ltd. P.O. Box 44905-00100 Nairobi Tel 22719617 / 8 / 9 [email protected]
21 Alnashir Popat A. Janmohamed Anwar Hajee Jinit Shah Vishnu Dhutia Mukesh Kumar Patel Hanif M. A. Somji
Chairman Managing Director Non-Executive Non-Executive Non-Executive Non-Executive Non-Executive
PKF Kenya
30 I &MBank Ltd. P.O. Box 30238-00100 Nairobi Tel 2711994-8 www.imbank.com
19 S. B. R. Shah Sarit S. Raja Shah Michael J. Karanja Sachit S. Shah Eric Munene Kimani Christina Gabener Mugo Kibati M. Soundararajan Guedi M. M. Ainache
Chairman Executive Director Non-Executive Non-Executive Non-Executive Non-Executive Non-Executive Non-Executive Non-Executive
KPMG Kenya
31 Jamii Bora Bank Ltd. P.O. Box 22741-00400 Nairobi Tel 2210338 / 9 [email protected]
5 James Gacheru Samuel N. Kimani Timothy Kabiru Ingrid Munro (Mrs) Lars – Olof Hellgren Stefan Kaiser Richard Kiplagat Dr. Betty Gikonyo Pamela Ager (Mrs) Alban Mwendar Cyprian Wekesha
Chairman MD & CEO Executive Non-Executive Non-executive Non-Executive Non-Executive Non-executive Non-Executive Non-Executive Non-Executive
Deloitte & Touche
32
Kenya Commercial Bank Ltd. P.O. Box 48400-00100 Nairobi Tel 3270000 www.kcb.co.ke
169 Eng. J. Musa Ndeto Joseph K. Kinyua Catherine Kimura (Mrs) C. A. Kola (Mrs) S. N. Shah Susan N. Omanga (Mrs) J. I. Adongo Prof.Peter K. Kimuyu Ngeny Biwott Dr. Martin Oduor- Otieno
Chairman Non- Executive Non-Executive Non-Executive Non-Executive Non-Executive Non-Executive Non-Executive Non-Executive Executive
KPMG Kenya
12
The
Year
un
der
Rev
iew
23Corporate Social Responsibility
12
The
Year
un
der
Rev
iew
58
Ap
pen
dix
I

Bank
Branch Network
Directors’ Names Status Approved Auditors
33
K-Rep Bank Ltd P.O. Box 25363-00603 Nairobi Tel 3906000 www.k-repbank.com
34
Kenny Nwosu Albert Ruturi George W.Okado Mwenda Thiribi Mildred Awour Phyllis Kandie Patricia Kiwanuka Rafael Jabba Willem Enklaar
Chairman Managing Director Non-Executive Non-Executive Non-Executive Non-Executive Non-Executive Non-Executive Non-Executive
Ernst & Young
34
Middle East Bank Kenya Ltd. P.O. Box 47387-00100 Nairobi Tel 2723120 [email protected]
3 A. A. K. Esmail Philip Ilako Sakwa J. Bunyasi Anil Raja Nancy N. Kaminchia
Chairman Managing Director Non-Executive Non-Executive Non-Executive
Price Waterhouse Coopers
35 National Bank of Kenya Ltd. P.O. Box 72866-00200 Nairobi Tel 2828000 / 2226471 www.nationalbank.co.ke
60
M.A. Hassan R.M. Marambii S. M. Kitonga (Ms) M.E.G. Muhindi Eng. E. K. Mwongera F.L. Atwoli NSSF PS-Treasury Isaiah M. Mworia A. N. Ismail Munir S. Ahmed
Chairman Managing Director Non Executive Non Executive Non Executive Non Executive Non-Executive Non-Executive Executive Director Executive Director Executive Director
Deloitte & Touche
36
NIC Bank Ltd P.O. Box 44599-00100 Nairobi Tel 2888000 www.nic-bank.com
19
James P. M. Ndegwa James W. Macharia Alan J. Dodd Fred M. Mbiru I. Ocholla-Wilson (Mrs) George A. Maina Michael L. Somen Andrew S. M. Ndegwa Francis N. Mwanzia Paras V. Shah
Chairman Managing Director Executive Director Vice-Chairman Non-Executive Non-Executive Non-Executive Non- Executive Non-Executive Non-Executive
Deloitte & Touche
12
The Year under Review
23
Corp
orat
e S
oci
al R
esp
onsi
bili
ty
12
The Year under Review
59
Ap
pen
dix
I
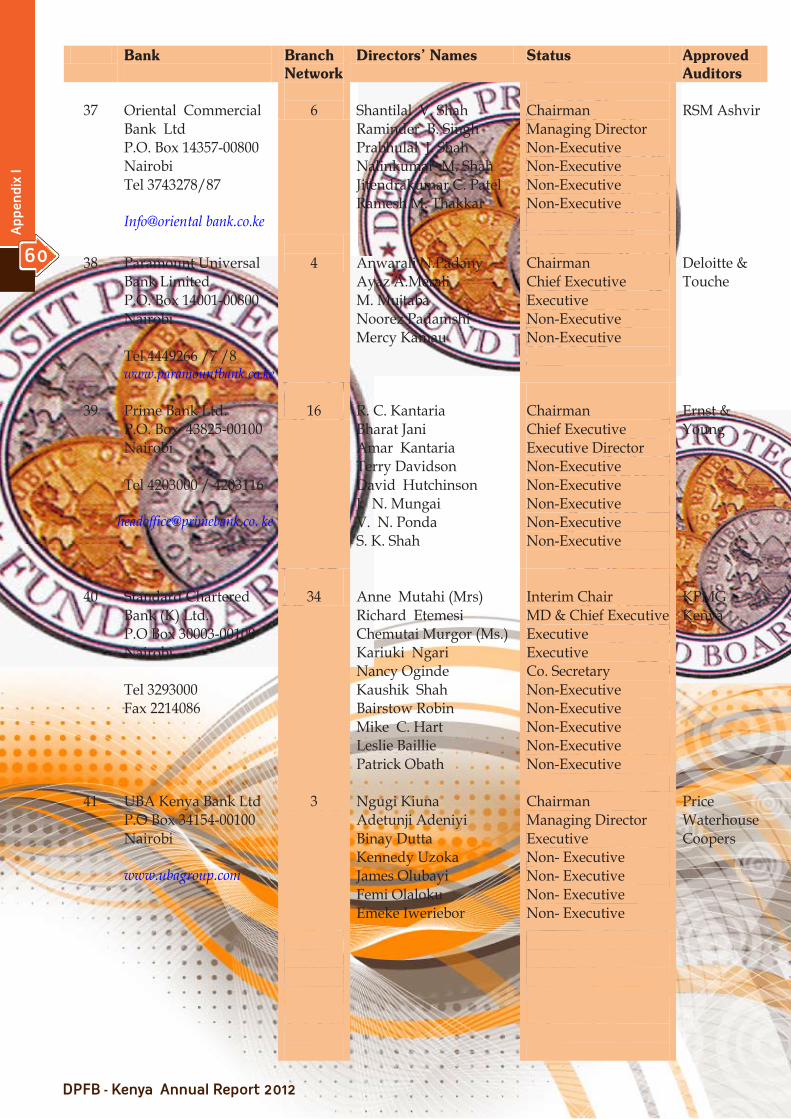
Bank
Branch Network
Directors’ Names Status Approved Auditors
37
Oriental Commercial Bank Ltd P.O. Box 14357-00800 Nairobi Tel 3743278/87 Info@oriental bank.co.ke
6
Shantilal V. Shah Raminder B. Singh Prabhulal J. Shah Nalinkumar M. Shah Jitendrakumar C. Patel Ramesh M. Thakkar
Chairman Managing Director Non-Executive Non-Executive Non-Executive Non-Executive
RSM Ashvir
38
Paramount Universal Bank Limited P.O. Box 14001-00800 Nairobi Tel 4449266 /7 /8 www.paramountbank.co.ke
4
Anwarali N.Padany Ayaz A.Merali M. Mujtaba Noorez Padamshi Mercy Kamau
Chairman Chief Executive Executive Non-Executive Non-Executive
Deloitte & Touche
39
Prime Bank Ltd. P.O. Box 43825-00100 Nairobi Tel 4203000 / 4203116
16
R. C. Kantaria Bharat Jani Amar Kantaria Terry Davidson David Hutchinson J. N. Mungai V. N. Ponda S. K. Shah
Chairman Chief Executive Executive Director Non-Executive Non-Executive Non-Executive Non-Executive Non-Executive
Ernst & Young
40
Standard Chartered Bank (K) Ltd. P.O Box 30003-00100 Nairobi. Tel 3293000 Fax 2214086
34
Anne Mutahi (Mrs) Richard Etemesi Chemutai Murgor (Ms.) Kariuki Ngari Nancy Oginde Kaushik Shah Bairstow Robin Mike C. Hart Leslie Baillie Patrick Obath
Interim Chair MD & Chief Executive Executive Executive Co. Secretary Non-Executive Non-Executive Non-Executive Non-Executive Non-Executive
KPMG Kenya
41 UBA Kenya Bank Ltd P.O Box 34154-00100 Nairobi www.ubagroup.com
3 Ngugi Kiuna Adetunji Adeniyi Binay Dutta Kennedy Uzoka James Olubayi Femi Olaloku Emeke Iweriebor
Chairman Managing Director Executive Non- Executive Non- Executive Non- Executive Non- Executive
Price Waterhouse Coopers
12
The
Year
un
der
Rev
iew
23Corporate Social Responsibility
12
The
Year
un
der
Rev
iew
60
Ap
pen
dix
I
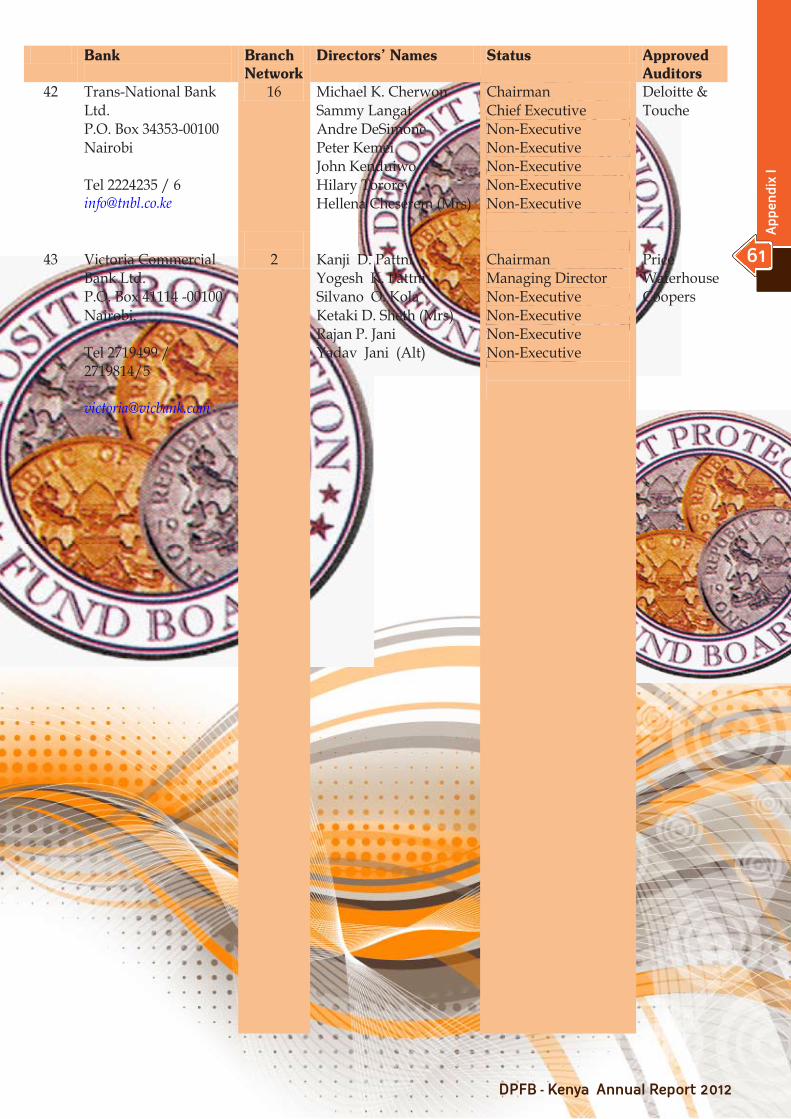
Bank
Branch Network
Directors’ Names Status Approved Auditors
42 Trans-National Bank Ltd. P.O. Box 34353-00100 Nairobi Tel 2224235 / 6 [email protected]
16 Michael K. Cherwon Sammy Langat Andre DeSimone Peter Kemei John Kenduiwo Hilary Tororey Hellena Cheserem (Mrs)
Chairman Chief Executive Non-Executive Non-Executive Non-Executive Non-Executive Non-Executive
Deloitte & Touche
43
Victoria Commercial Bank Ltd. P.O. Box 41114 -00100 Nairobi. Tel 2719499 / 2719814/5 [email protected]
2
Kanji D. Pattni Yogesh K. Pattni Silvano O. Kola Ketaki D. Sheth (Mrs) Rajan P. Jani Yadav Jani (Alt)
Chairman Managing Director Non-Executive Non-Executive Non-Executive Non-Executive
Price Waterhouse Coopers
12
The Year under Review
23
Corp
orat
e S
oci
al R
esp
onsi
bili
ty
12
The Year under Review
61
Ap
pen
dix
I
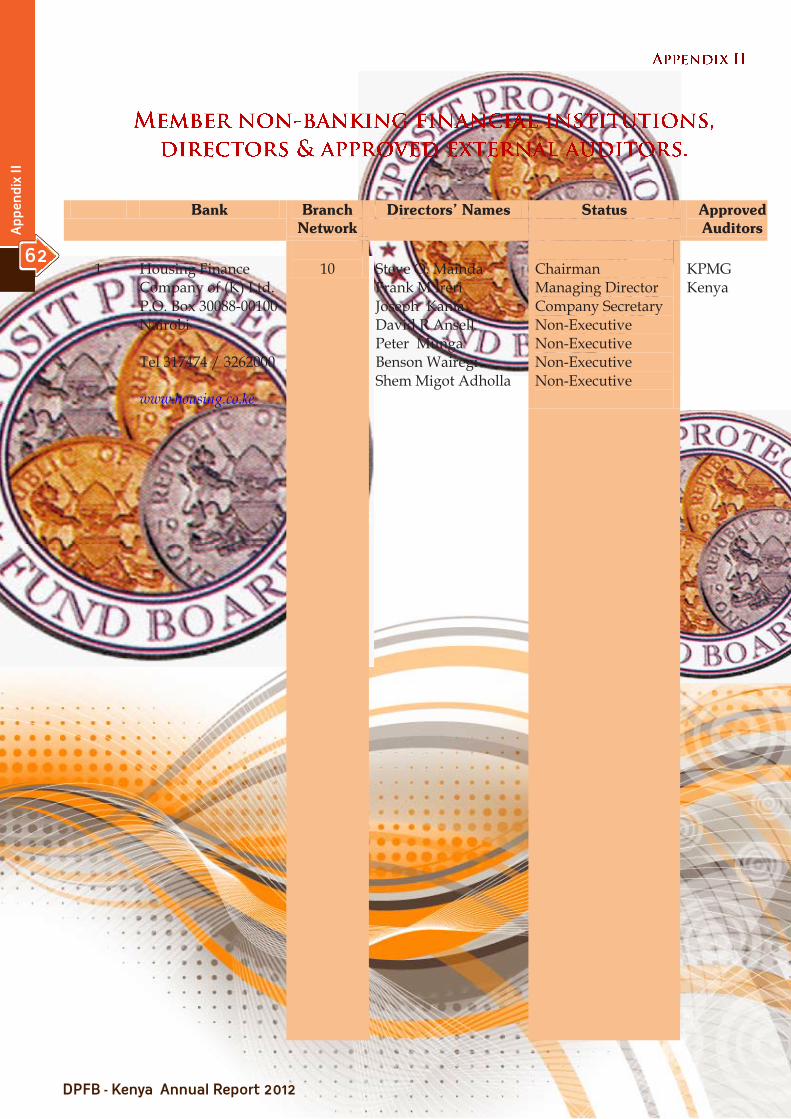
Bank Branch Network
Directors’ Names Status Approved Auditors
1
Housing Finance Company of (K) Ltd. P.O. Box 30088-00100 Nairobi Tel 317474 / 3262000 www.housing.co.ke
10
Steve O. Mainda Frank M Ireri Joseph Kania David R Ansell Peter Munga Benson Wairegi Shem Migot Adholla
Chairman Managing Director Company Secretary Non-Executive Non-Executive Non-Executive Non-Executive
KPMG Kenya
12
The
Year
un
der
Rev
iew
23Corporate Social Responsibility
12
The
Year
un
der
Rev
iew
62
Ap
pen
dix
II
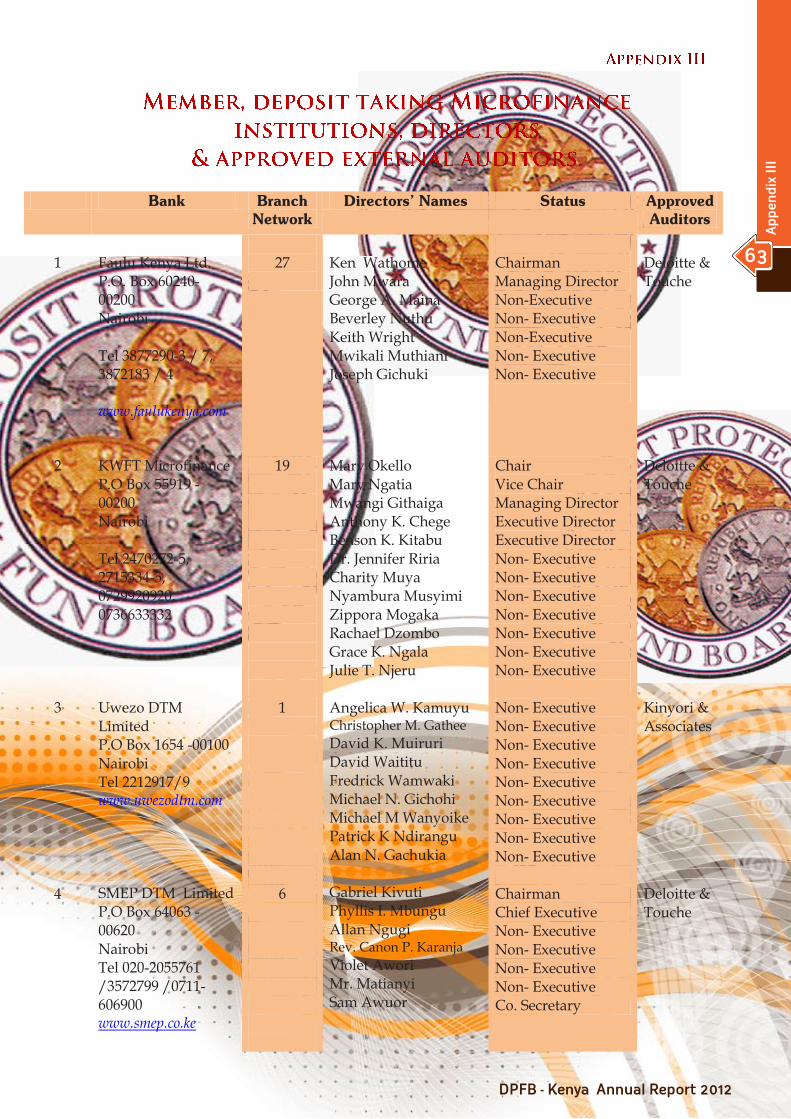
Bank Branch
Network Directors’ Names Status Approved
Auditors
1
Faulu Kenya Ltd. P.O. Box 60240-00200 Nairobi Tel 3877290-3 / 7, 3872183 / 4 www.faulukenya.com
27
Ken Wathome John Mwara George A. Maina Beverley Nuthu Keith Wright Mwikali Muthiani Joseph Gichuki
Chairman Managing Director Non-Executive Non- Executive Non-Executive Non- Executive Non- Executive
Deloitte & Touche
2 3 4
KWFT Microfinance P.O Box 55919 -00200 Nairobi Tel 2470272-5, 2715334-5, 0729920920, 0736633332 Uwezo DTM Limited P.O Box 1654 -00100 Nairobi Tel 2212917/9 www.uwezodtm.com SMEP DTM Limited P.O Box 64063 -00620 Nairobi Tel 020-2055761 /3572799 /0711-606900 www.smep.co.ke
19 1 6
Mary Okello Mary Ngatia Mwangi Githaiga Anthony K. Chege Benson K. Kitabu Dr. Jennifer Riria Charity Muya Nyambura Musyimi Zippora Mogaka Rachael Dzombo Grace K. Ngala Julie T. Njeru Angelica W. Kamuyu Christopher M. Gathee David K. Muiruri David Waititu Fredrick Wamwaki Michael N. Gichohi Michael M Wanyoike Patrick K Ndirangu Alan N. Gachukia Gabriel Kivuti Phyllis I. Mbungu Allan Ngugi Rev. Canon P. Karanja Violet Awori Mr. Matianyi Sam Awuor
Chair Vice Chair Managing Director Executive Director Executive Director Non- Executive Non- Executive Non- Executive Non- Executive Non- Executive Non- Executive Non- Executive Non- Executive Non- Executive Non- Executive Non- Executive Non- Executive Non- Executive Non- Executive Non- Executive Non- Executive Chairman Chief Executive Non- Executive Non- Executive Non- Executive Non- Executive Co. Secretary
Deloitte & Touche Kinyori & Associates Deloitte & Touche
12
The Year under Review
23
Corp
orat
e S
oci
al R
esp
onsi
bili
ty
12
The Year under Review
63
Ap
pen
dix
III
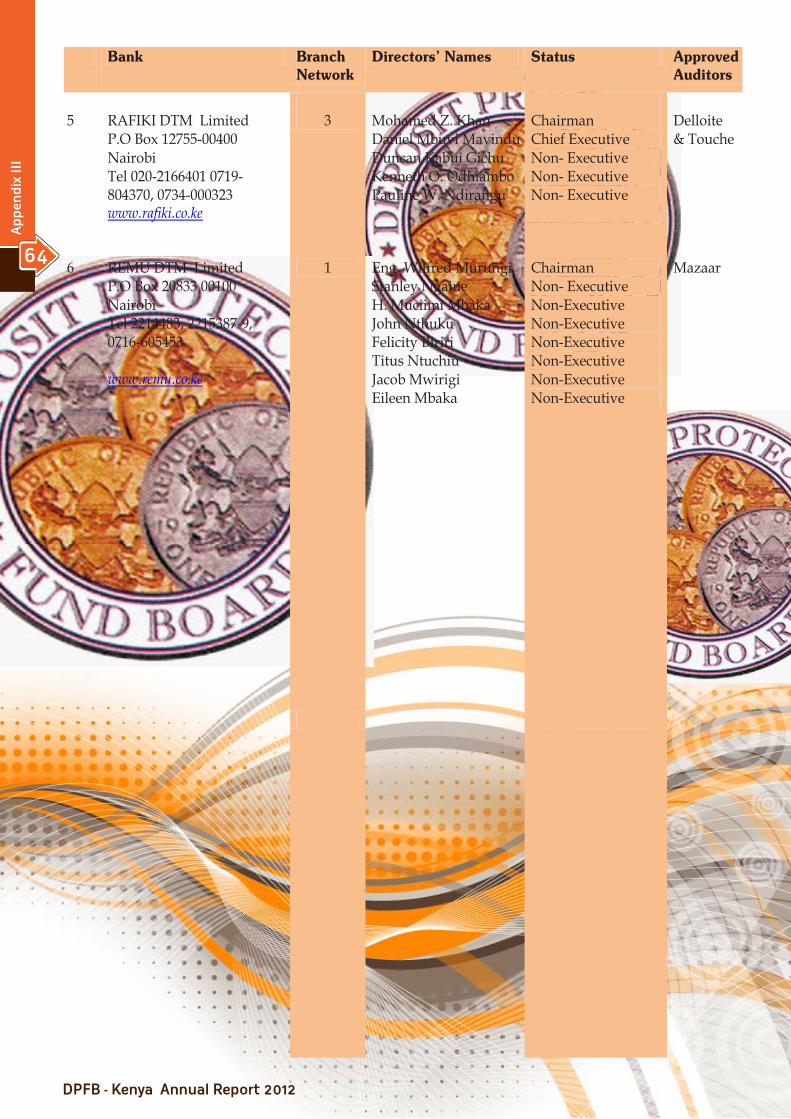
Bank Branch Network
Directors’ Names Status Approved Auditors
5
RAFIKI DTM Limited P.O Box 12755-00400 Nairobi Tel 020-2166401 0719-804370, 0734-000323 www.rafiki.co.ke
3
Mohamed Z. Khan Daniel Mbuvi Mavindu Duncan Kabui Gichu Kenneth O. Odhiambo Pauline W. Ndirangu
Chairman Chief Executive Non- Executive Non- Executive Non- Executive
Delloite & Touche
6 REMU DTM Limited P.O Box 20833 00100 Nairobi Tel 2214483, 2215387-9, 0716-605453 www.remu.co.ke
1 Eng. Wilfred Murungi Stanley Ngaine H. Muciimi Mbaka John Nthuku Felicity Biriri Titus Ntuchiu Jacob Mwirigi Eileen Mbaka
Chairman Non- Executive Non-Executive Non-Executive Non-Executive Non-Executive Non-Executive Non-Executive
Mazaar
12
The
Year
un
der
Rev
iew
23Corporate Social Responsibility
12
The
Year
un
der
Rev
iew
64
Ap
pen
dix
III