Embed Size (px)
Citation preview
Annex 4: news consumption in the UK
Annex 4: News consumption in the UK
Annex to Ofcom’s advice to the Secretary of State for Culture, Olympics, Media and Sport
Date: 29 June 2012
Annex 4: news consumption in the UK
1
Contents
Page
Introduction 2
Part 1: News consumption in the UK 3
Part 2: Industry measures 23
Part 3: Metric sources, methodologies and evaluation 31
Annex 4: news consumption in the UK
2
Introduction
A4.1 This annex provides an overview of news media content consumption in the UK, using robust sources of industry and survey data. It provides an account of people’s use of news sources and their attitudes towards news in the UK.
i) Part 1 of the annex summarises the new consumer research commissioned by Ofcom and conducted by Kantar Media (see page 3).
ii) Part 2 provides an overview of various industry metrics for television (BARB), radio (RAJAR1), newspapers (ABC, NRS) and online (UKOM/Nielsen) (page 23).
iii) Part 3 describes the different methodologies of these industry measurement systems (page 31).
A4.2 Any direct comparisons between the quantitative research we have commissioned from Kantar Media (see Part 1 for a summary and Annex 5 for the full report), and official industry data (Part 2) should be treated with caution because of:
methodological differences e.g. claimed or measured consumption, face-to- face surveys or diary-based methods, and differing sample sizes and data collection periods;
time period differences e.g. “nowadays” is used in the Kantar Media survey compared to real-time recorded consumption (BARB) or recency (average issue readership) for newspapers; and
differing definitions of news e.g. set by the provider (as in BARB or UKOM) or self-defined by the people we questioned.
1 Listening figures for radio news are provided from estimates from Hallett Arendt, based on data from radio industry measurement body RAJAR.
Annex 4: news consumption in the UK
3
Part 1: News consumption in the UK
Introduction
A4.3 The Kantar Media research involved a two-phased approach:
A qualitative phase with eleven focus groups across the UK in December 2011, including groups in the devolved nations. The purpose of the qualitative research was to understand in detail people’s use of, and attitudes towards, news and to inform development of the quantitative survey design. The qualitative phase was also used to explore whether people understood, and could discuss the influence of news on their opinions, to help inform our thinking in this area.
A quantitative face-to-face survey of 2,379 respondents in February/March 2012. This involved a 30 minute face-to-face survey with a representative UK sample. Interviews in the devolved nations were boosted to allow sufficient base sizes for analysis. The core purpose of this phase of the research was to quantify use of, and attitudes towards, news among people in the UK, and to compare these, where applicable, to our 2007 New News Future News analysis2. The survey also investigated the possibility of measuring the impact of news on people’s opinions.
A4.4 This section provides an overview of the results conducted by Kantar Media, and is organised as follows.
a) An overview of the UK news market;
b) Personal and societal importance of news topics;
a) Sources of news consumed;
b) Cross-media consumption metrics; and
c) A discussion of impact metrics.
A4.5 The full Kantar Media research report can be found in Annex 5.
a) An overview of the UK news market
Platform used for news
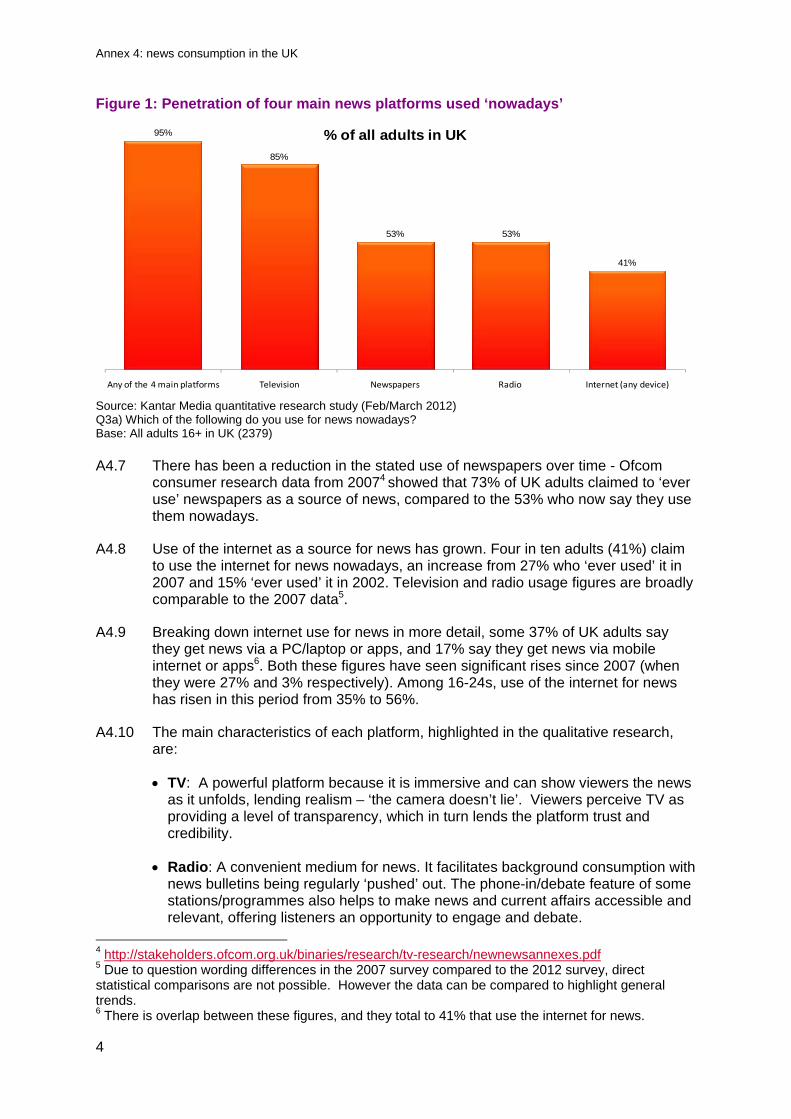
A4.6 The vast majority of the UK population (95%) use one or more of the four main platforms (television, radio, newspapers, internet) for news ‘nowadays’3 – 85% say they use TV, 53% say they use newspapers, 53% say they use radio, and 41% say they use the internet.
2 http://stakeholders.ofcom.org.uk/binaries/research/tv-research/newnewsannexes.pdf 3 It is important to note that use ‘nowadays’ is effectively synonymous with ‘used in last week’, based on comparisons between how consumers respond to each term, with differences in response of only 1 percentage point across all media, except magazines where the difference is 3 percentage points.
Annex 4: news consumption in the UK
4
Figure 1: Penetration of four main news platforms used ‘nowadays’
Source: Kantar Media quantitative research study (Feb/March 2012) Q3a) Which of the following do you use for news nowadays? Base: All adults 16+ in UK (2379) A4.7 There has been a reduction in the stated use of newspapers over time - Ofcom
consumer research data from 20074 showed that 73% of UK adults claimed to ‘ever use’ newspapers as a source of news, compared to the 53% who now say they use them nowadays.
A4.8 Use of the internet as a source for news has grown. Four in ten adults (41%) claim to use the internet for news nowadays, an increase from 27% who ‘ever used’ it in 2007 and 15% ‘ever used’ it in 2002. Television and radio usage figures are broadly comparable to the 2007 data5.
A4.9 Breaking down internet use for news in more detail, some 37% of UK adults say they get news via a PC/laptop or apps, and 17% say they get news via mobile internet or apps6. Both these figures have seen significant rises since 2007 (when they were 27% and 3% respectively). Among 16-24s, use of the internet for news has risen in this period from 35% to 56%.
A4.10 The main characteristics of each platform, highlighted in the qualitative research, are:
TV: A powerful platform because it is immersive and can show viewers the news as it unfolds, lending realism – ‘the camera doesn’t lie’. Viewers perceive TV as providing a level of transparency, which in turn lends the platform trust and credibility.
Radio: A convenient medium for news. It facilitates background consumption with news bulletins being regularly ‘pushed’ out. The phone-in/debate feature of some stations/programmes also helps to make news and current affairs accessible and relevant, offering listeners an opportunity to engage and debate.
4 http://stakeholders.ofcom.org.uk/binaries/research/tv-research/newnewsannexes.pdf 5 Due to question wording differences in the 2007 survey compared to the 2012 survey, direct statistical comparisons are not possible. However the data can be compared to highlight general trends. 6 There is overlap between these figures, and they total to 41% that use the internet for news.
95%
85%
53% 53%
41%
Any of the 4 main platforms Television Newspapers Radio Internet (any device)
% of all adults in UK
Annex 4: news consumption in the UK
5
Newspapers: Allow in-depth analysis, a reflection on events, and help people understand issues. They are also considered to be ‘yesterday’s news’ and therefore less relevant for breaking stories/unfolding of events. Tabloids have a clear and distinct positioning and are seen as partial and headline-grabbing. They also offer broad entertainment appeal and so may not be purchased for the sole purpose of consuming news.
Internet: Growing in popularity as a source of news. Among users, it is felt to provide the ultimate convenience which drives use. It acts as both a push and pull mechanism for news stories and allows users to tailor their own news interests. Within online, social media is becoming a valuable source for breaking news in its ‘word-of-mouth’ role, as many users learn of breaking news through friends’ posts. It also offers a space to contribute to the story or debate with others.
Importance of platforms for news
A4.11 TV is considered to be the most important platform source for news. When asked how important each platform is as a source of news (using ratings on a scale of 1 - 10), TV rated the highest with an average importance score of 7.7. Around three-quarters (76%) of people who use TV as a source of news rated it highly (between 7 and 10) on importance. TV is rated high among those people who use it as a single source, as well as those who use it in combination with other platforms.
A4.12 The importance of radio, the internet and newspapers are rated in broadly similar terms by people who use these platforms for news (7.2, 7.1 and 6.9 respectively). Around six in ten people who use these platforms for news rated them highly (between 7 and 10) on importance.
A4.13 When individual newspaper titles are rated in terms of their importance by their readers, there are some clear differences by types of newspaper. Readers of tabloid titles rate newspapers lower on importance as a source of news (with a mean score of 6.5) than readers of broadsheet titles (mean score of 7.4)7.
Average number of platforms used
A4.14 Overall, news users access an average 2.4 platforms across TV, radio, online and press. But 14% of people who consume news use only one platform, and of those most (10%) use only TV. Among people in Scotland a significantly higher proportion, 22%, rely on one platform and those using just TV stands at 17%; the comparable figures for those in the C2DE group are 20% and 15%, and for ABC1s, 9% and 6%. Two per cent of people who follow the news do so only via the internet, rising to 4% of 16-24s and 5% of 25-34s.
Reasons for using different platforms
A4.15 In terms of how news is followed, our qualitative research underlined the often habitual nature of consumption. News consumption fits into the rhythms of daily
7 While the newspaper industry uses the terms Quality and Popular for its categorisation, we have avoided these terms as they imply a judgement about the content of the title. Our own categories are not strictly literal given changes in recent years to the format of some titles, but we have chosen them as more neutral labels. Tabloids include titles such as The Sun and The Mirror. Mid-market titles include the Daily Mail and Daily Express. Broadsheets include titles such as The Times, The Daily Telegraph, The Guardian and The Independent.
Annex 4: news consumption in the UK
6
routines and can help to define those routines. News is provided in a variety of ways throughout the day. Its consumption can be immersive and engaging with people actively seeking out news, either out of interest, necessity, or simply for entertainment. Its ubiquity and convenience can also give it an ambient quality with some consumption occurring as a backdrop to other activities.
A4.16 The quantitative survey asked people their main reasons for using multiple platforms for news (from a prompted list). The most common mention is one of convenience: ‘to suit where I am and what I’m doing’ (59%). Just over a quarter (28%) say they use different platforms ‘to get a range of viewpoints on a story and using different ways helps me do this’, and around one quarter (24%) say they use different ways for different kinds of news (e.g. breaking news stories versus in-depth coverage).
Use of platforms for different types of news
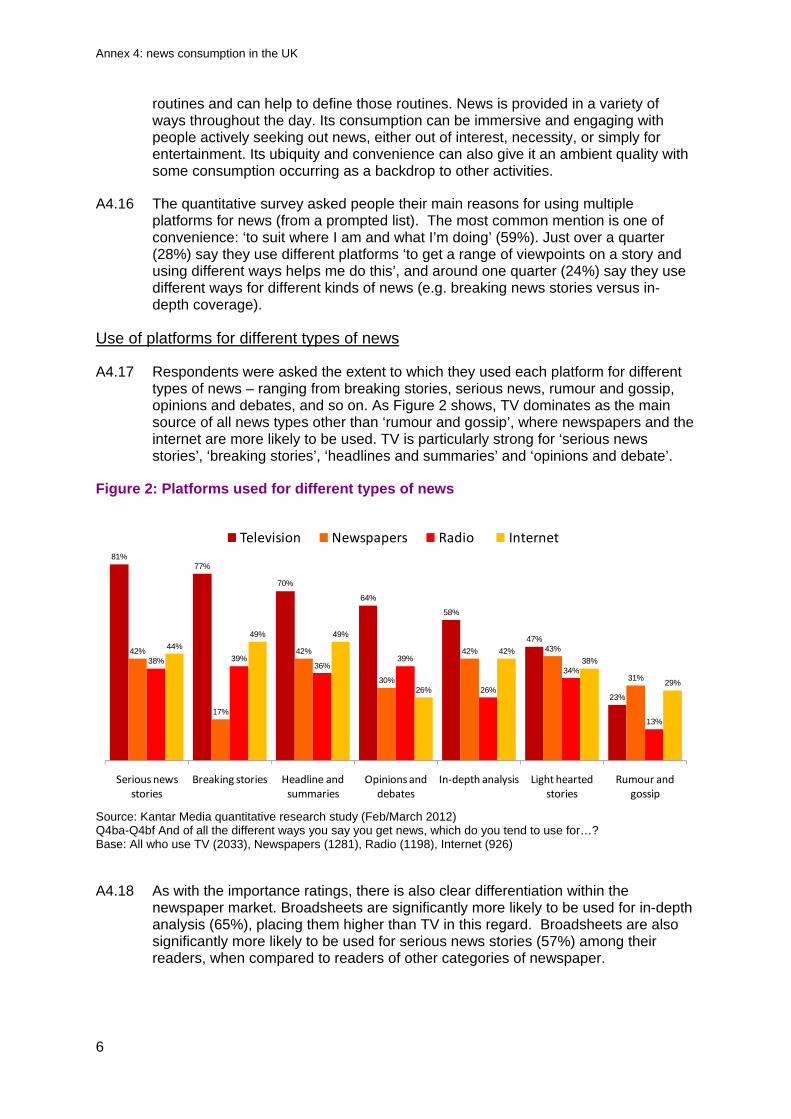
A4.17 Respondents were asked the extent to which they used each platform for different types of news – ranging from breaking stories, serious news, rumour and gossip, opinions and debates, and so on. As Figure 2 shows, TV dominates as the main source of all news types other than ‘rumour and gossip’, where newspapers and the internet are more likely to be used. TV is particularly strong for ‘serious news stories’, ‘breaking stories’, ‘headlines and summaries’ and ‘opinions and debate’.
Figure 2: Platforms used for different types of news
Source: Kantar Media quantitative research study (Feb/March 2012) Q4ba-Q4bf And of all the different ways you say you get news, which do you tend to use for…? Base: All who use TV (2033), Newspapers (1281), Radio (1198), Internet (926)
A4.18 As with the importance ratings, there is also clear differentiation within the newspaper market. Broadsheets are significantly more likely to be used for in-depth analysis (65%), placing them higher than TV in this regard. Broadsheets are also significantly more likely to be used for serious news stories (57%) among their readers, when compared to readers of other categories of newspaper.
81%77%
70%
64%
58%
47%
23%
42%
17%
42%
30%
42% 43%
31%
38% 39%36%
39%
26%
34%
13%
44%
49% 49%
26%
42%38%
29%
Serious news stories
Breaking stories Headline and summaries
Opinions and debates
In‐depth analysis Light hearted stories
Rumour and gossip
Television Newspapers Radio Internet
Annex 4: news consumption in the UK
7
A4.19 Tabloids are more likely to be used for light-hearted stories and rumour and gossip by their readers, when compared to the other categories of newspaper. They are also used by a significant minority (46%) for headlines and summaries.
b) Personal and societal importance of news topics
A4.20 The quantitative survey explored people’s views about various types of news topic. It asked respondents to say whether the news topics were of personal interest, and whether they were important for people across the UK to know about.
A4.21 Figure 3 illustrates the responses for personal interest compared to societal importance. In many cases levels of personal interest are lower than levels of societal importance.
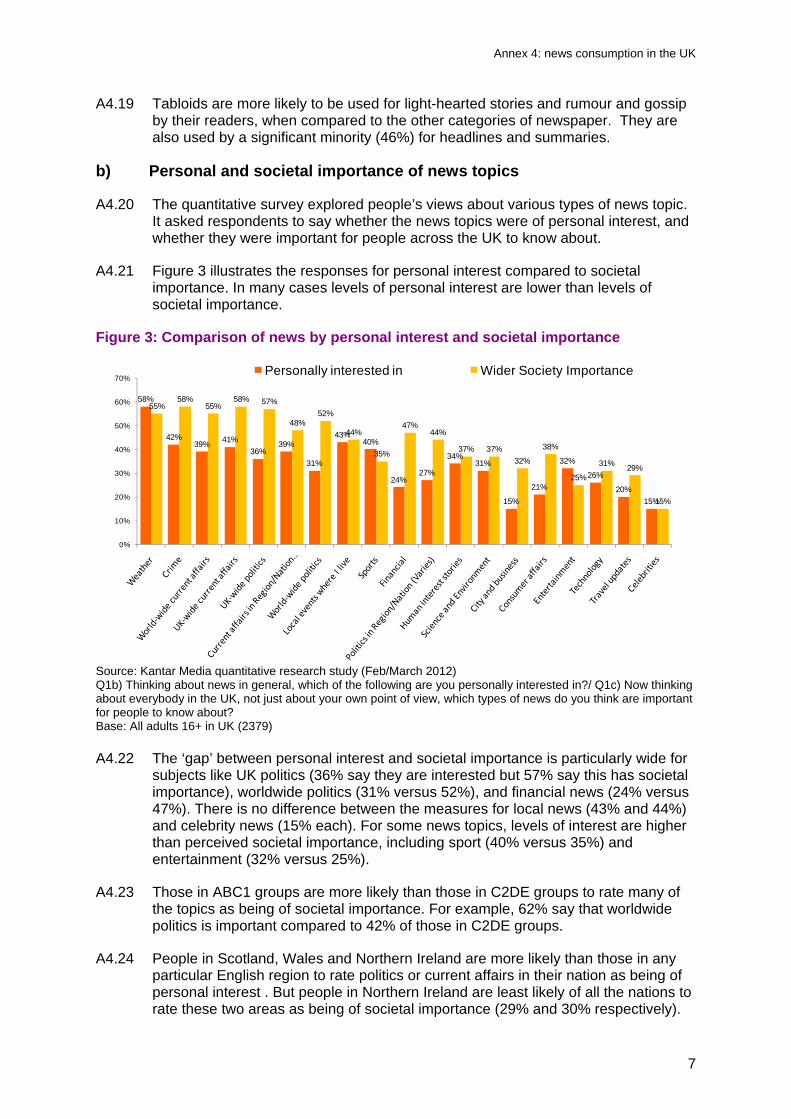
Figure 3: Comparison of news by personal interest and societal importance
Source: Kantar Media quantitative research study (Feb/March 2012) Q1b) Thinking about news in general, which of the following are you personally interested in?/ Q1c) Now thinking about everybody in the UK, not just about your own point of view, which types of news do you think are important for people to know about? Base: All adults 16+ in UK (2379) A4.22 The ‘gap’ between personal interest and societal importance is particularly wide for
subjects like UK politics (36% say they are interested but 57% say this has societal importance), worldwide politics (31% versus 52%), and financial news (24% versus 47%). There is no difference between the measures for local news (43% and 44%) and celebrity news (15% each). For some news topics, levels of interest are higher than perceived societal importance, including sport (40% versus 35%) and entertainment (32% versus 25%).
A4.23 Those in ABC1 groups are more likely than those in C2DE groups to rate many of the topics as being of societal importance. For example, 62% say that worldwide politics is important compared to 42% of those in C2DE groups.
A4.24 People in Scotland, Wales and Northern Ireland are more likely than those in any particular English region to rate politics or current affairs in their nation as being of personal interest . But people in Northern Ireland are least likely of all the nations to rate these two areas as being of societal importance (29% and 30% respectively).
58%
42%39%
41%
36%39%
31%
43%40%
24%27%
34%31%
15%
21%
32%
26%
20%
15%
55%58%
55%58% 57%
48%52%
44%
35%
47%44%
37% 37%
32%
38%
25%
31%29%
15%
0%
10%
20%
30%
40%
50%
60%
70%Personally interested in Wider Society Importance
Annex 4: news consumption in the UK
8
Figure 4: Personal/societal importance of politics/current affairs by nation/region
Source: Kantar Media quantitative research study (Feb/March 2012); Base: All adults 16+ in UK (2379) c) Sources of news used
Cross-platform sources
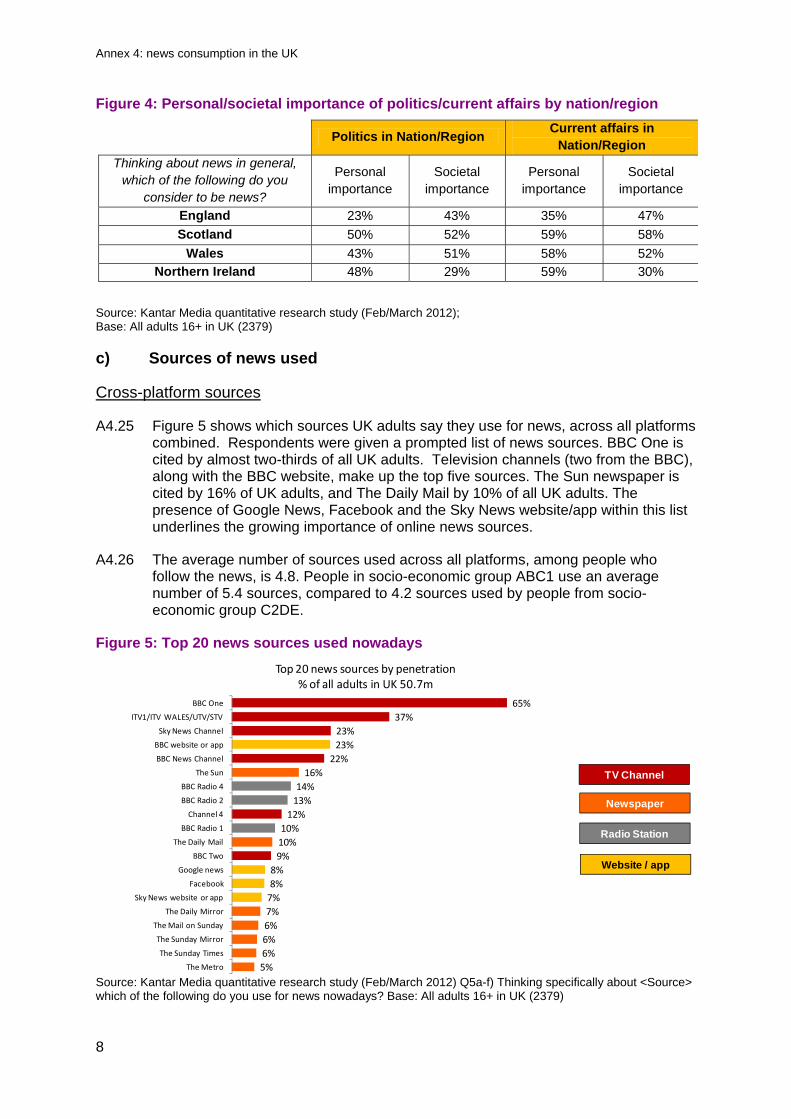
A4.25 Figure 5 shows which sources UK adults say they use for news, across all platforms combined. Respondents were given a prompted list of news sources. BBC One is cited by almost two-thirds of all UK adults. Television channels (two from the BBC), along with the BBC website, make up the top five sources. The Sun newspaper is cited by 16% of UK adults, and The Daily Mail by 10% of all UK adults. The presence of Google News, Facebook and the Sky News website/app within this list underlines the growing importance of online news sources.
A4.26 The average number of sources used across all platforms, among people who follow the news, is 4.8. People in socio-economic group ABC1 use an average number of 5.4 sources, compared to 4.2 sources used by people from socio-economic group C2DE.
Figure 5: Top 20 news sources used nowadays
Source: Kantar Media quantitative research study (Feb/March 2012) Q5a-f) Thinking specifically about <Source> which of the following do you use for news nowadays? Base: All adults 16+ in UK (2379)
Politics in Nation/Region
Current affairs inNation/Region
Thinking about news in general, which of the following do you
consider to be news?
Personal importance
Societal importance
Personal importance
Societal importance
England 23% 43% 35% 47%
Scotland 50% 52% 59% 58%
Wales 43% 51% 58% 52%
Northern Ireland 48% 29% 59% 30%
65%
37%
23%
23%
22%
16%
14%
13%
12%
10%
10%
9%
8%
8%
7%
7%
6%
6%
6%
5%
BBC One
ITV1/ITV WALES/UTV/STV
Sky News Channel
BBC website or app
BBC News Channel
The Sun
BBC Radio 4
BBC Radio 2
Channel 4
BBC Radio 1
The Daily Mail
BBC Two
Google news
Sky News website or app
The Daily Mirror
The Mail on Sunday
The Sunday Mirror
The Sunday Times
The Metro
Top 20 news sources by penetration% of all adults in UK 50.7m
TV Channel
Newspaper
Radio Station
Website / app
Annex 4: news consumption in the UK
9
Television sources
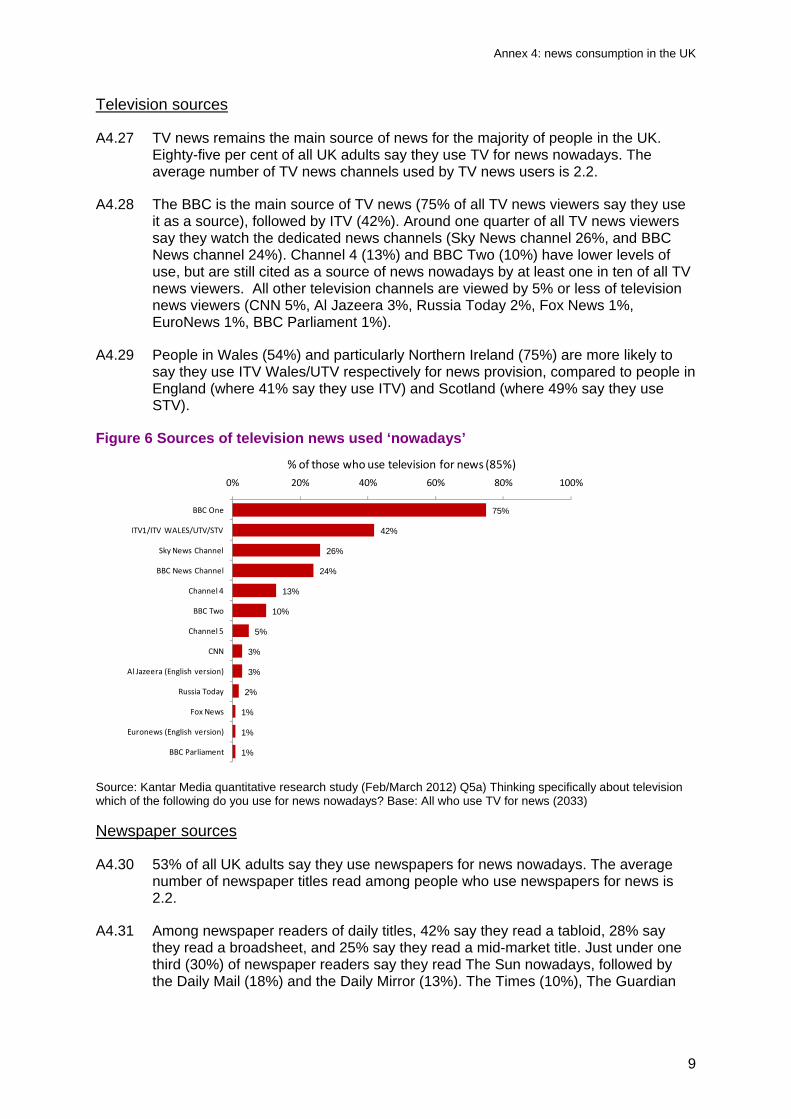
A4.27 TV news remains the main source of news for the majority of people in the UK. Eighty-five per cent of all UK adults say they use TV for news nowadays. The average number of TV news channels used by TV news users is 2.2.
A4.28 The BBC is the main source of TV news (75% of all TV news viewers say they use it as a source), followed by ITV (42%). Around one quarter of all TV news viewers say they watch the dedicated news channels (Sky News channel 26%, and BBC News channel 24%). Channel 4 (13%) and BBC Two (10%) have lower levels of use, but are still cited as a source of news nowadays by at least one in ten of all TV news viewers. All other television channels are viewed by 5% or less of television news viewers (CNN 5%, Al Jazeera 3%, Russia Today 2%, Fox News 1%, EuroNews 1%, BBC Parliament 1%).
A4.29 People in Wales (54%) and particularly Northern Ireland (75%) are more likely to say they use ITV Wales/UTV respectively for news provision, compared to people in England (where 41% say they use ITV) and Scotland (where 49% say they use STV).
Figure 6 Sources of television news used ‘nowadays’
Source: Kantar Media quantitative research study (Feb/March 2012) Q5a) Thinking specifically about television which of the following do you use for news nowadays? Base: All who use TV for news (2033)
Newspaper sources
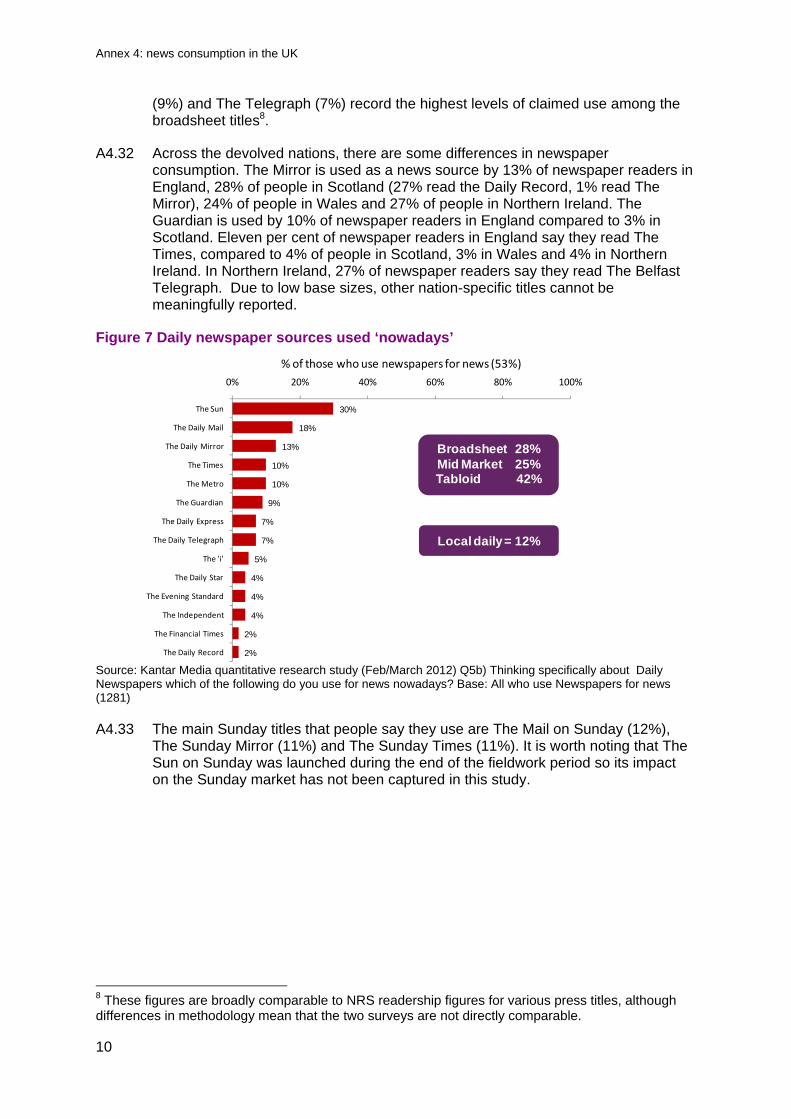
A4.30 53% of all UK adults say they use newspapers for news nowadays. The average number of newspaper titles read among people who use newspapers for news is 2.2.
A4.31 Among newspaper readers of daily titles, 42% say they read a tabloid, 28% say they read a broadsheet, and 25% say they read a mid-market title. Just under one third (30%) of newspaper readers say they read The Sun nowadays, followed by the Daily Mail (18%) and the Daily Mirror (13%). The Times (10%), The Guardian
75%
42%
26%
24%
13%
10%
5%
3%
3%
2%
1%
1%
1%
0% 20% 40% 60% 80% 100%
BBC One
ITV1/ITV WALES/UTV/STV
Sky News Channel
BBC News Channel
Channel 4
BBC Two
Channel 5
CNN
Al Jazeera (English version)
Russia Today
Fox News
Euronews (English version)
BBC Parliament
% of those who use television for news (85%)
Annex 4: news consumption in the UK
10
(9%) and The Telegraph (7%) record the highest levels of claimed use among the broadsheet titles8.
A4.32 Across the devolved nations, there are some differences in newspaper consumption. The Mirror is used as a news source by 13% of newspaper readers in England, 28% of people in Scotland (27% read the Daily Record, 1% read The Mirror), 24% of people in Wales and 27% of people in Northern Ireland. The Guardian is used by 10% of newspaper readers in England compared to 3% in Scotland. Eleven per cent of newspaper readers in England say they read The Times, compared to 4% of people in Scotland, 3% in Wales and 4% in Northern Ireland. In Northern Ireland, 27% of newspaper readers say they read The Belfast Telegraph. Due to low base sizes, other nation-specific titles cannot be meaningfully reported.
Figure 7 Daily newspaper sources used ‘nowadays’
Source: Kantar Media quantitative research study (Feb/March 2012) Q5b) Thinking specifically about Daily Newspapers which of the following do you use for news nowadays? Base: All who use Newspapers for news (1281)
A4.33 The main Sunday titles that people say they use are The Mail on Sunday (12%), The Sunday Mirror (11%) and The Sunday Times (11%). It is worth noting that The Sun on Sunday was launched during the end of the fieldwork period so its impact on the Sunday market has not been captured in this study.
8 These figures are broadly comparable to NRS readership figures for various press titles, although differences in methodology mean that the two surveys are not directly comparable.
30%
18%
13%
10%
10%
9%
7%
7%
5%
4%
4%
4%
2%
2%
0% 20% 40% 60% 80% 100%
The Sun
The Daily Mail
The Daily Mirror
The Times
The Metro
The Guardian
The Daily Express
The Daily Telegraph
The 'i'
The Daily Star
The Evening Standard
The Independent
The Financial Times
The Daily Record
% of those who use newspapers for news (53%)
Broadsheet 28%Mid Market 25%Tabloid 42%
Local daily = 12%
Annex 4: news consumption in the UK
11
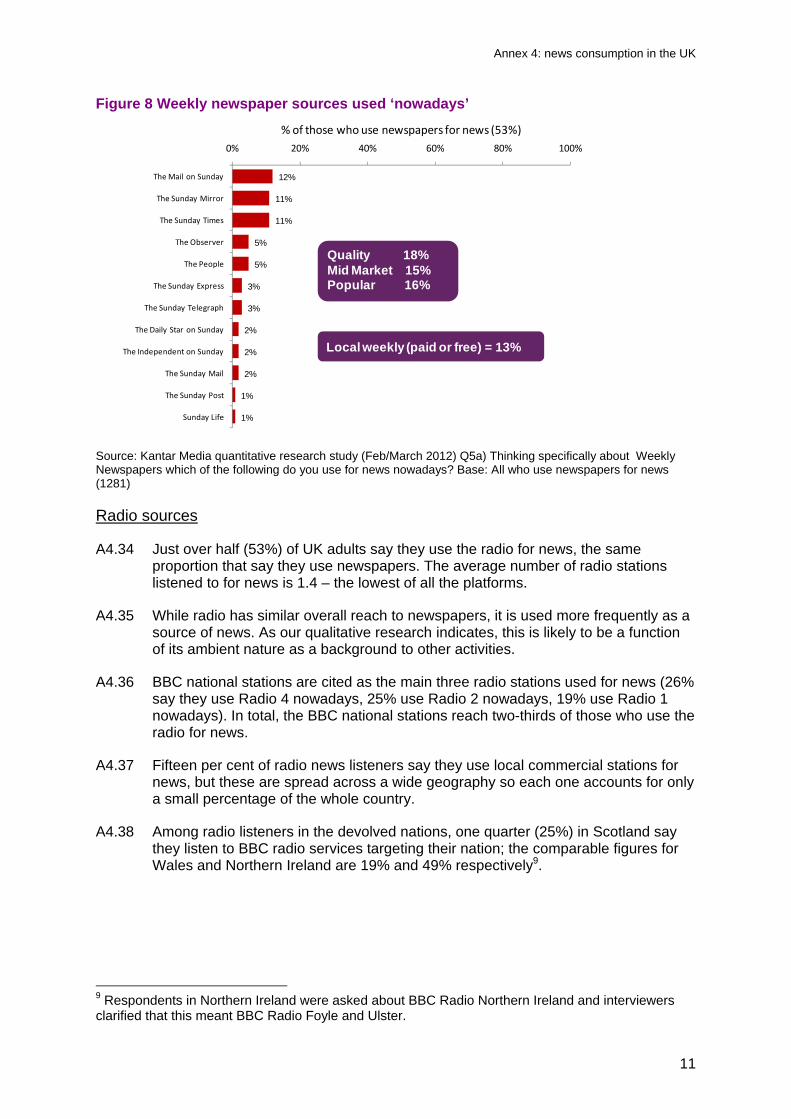
Figure 8 Weekly newspaper sources used ‘nowadays’
Source: Kantar Media quantitative research study (Feb/March 2012) Q5a) Thinking specifically about Weekly Newspapers which of the following do you use for news nowadays? Base: All who use newspapers for news (1281)
Radio sources
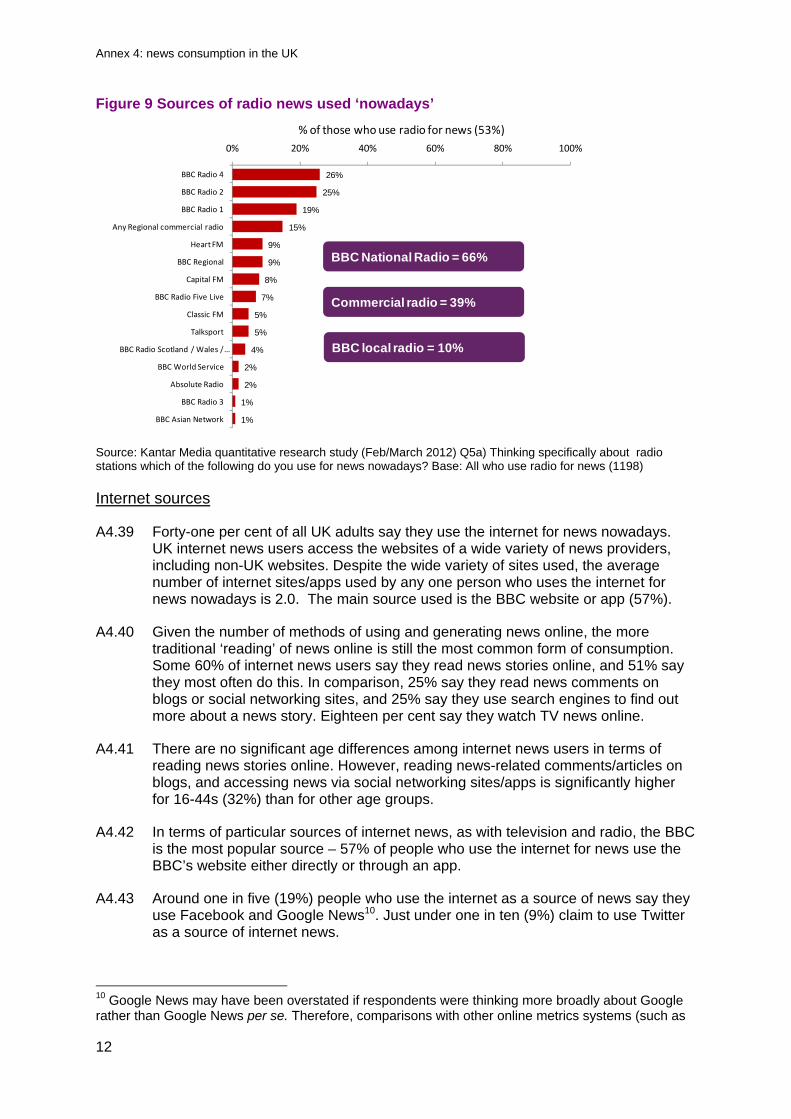
A4.34 Just over half (53%) of UK adults say they use the radio for news, the same proportion that say they use newspapers. The average number of radio stations listened to for news is 1.4 – the lowest of all the platforms.
A4.35 While radio has similar overall reach to newspapers, it is used more frequently as a source of news. As our qualitative research indicates, this is likely to be a function of its ambient nature as a background to other activities.
A4.36 BBC national stations are cited as the main three radio stations used for news (26% say they use Radio 4 nowadays, 25% use Radio 2 nowadays, 19% use Radio 1 nowadays). In total, the BBC national stations reach two-thirds of those who use the radio for news.
A4.37 Fifteen per cent of radio news listeners say they use local commercial stations for news, but these are spread across a wide geography so each one accounts for only a small percentage of the whole country.
A4.38 Among radio listeners in the devolved nations, one quarter (25%) in Scotland say they listen to BBC radio services targeting their nation; the comparable figures for Wales and Northern Ireland are 19% and 49% respectively9.
9 Respondents in Northern Ireland were asked about BBC Radio Northern Ireland and interviewers clarified that this meant BBC Radio Foyle and Ulster.
12%
11%
11%
5%
5%
3%
3%
2%
2%
2%
1%
1%
0% 20% 40% 60% 80% 100%
The Mail on Sunday
The Sunday Mirror
The Sunday Times
The Observer
The People
The Sunday Express
The Sunday Telegraph
The Daily Star on Sunday
The Independent on Sunday
The Sunday Mail
The Sunday Post
Sunday Life
% of those who use newspapers for news (53%)
Quality 18%Mid Market 15%Popular 16%
Local weekly (paid or free) = 13%
Annex 4: news consumption in the UK
12
Figure 9 Sources of radio news used ‘nowadays’
Source: Kantar Media quantitative research study (Feb/March 2012) Q5a) Thinking specifically about radio stations which of the following do you use for news nowadays? Base: All who use radio for news (1198)
Internet sources
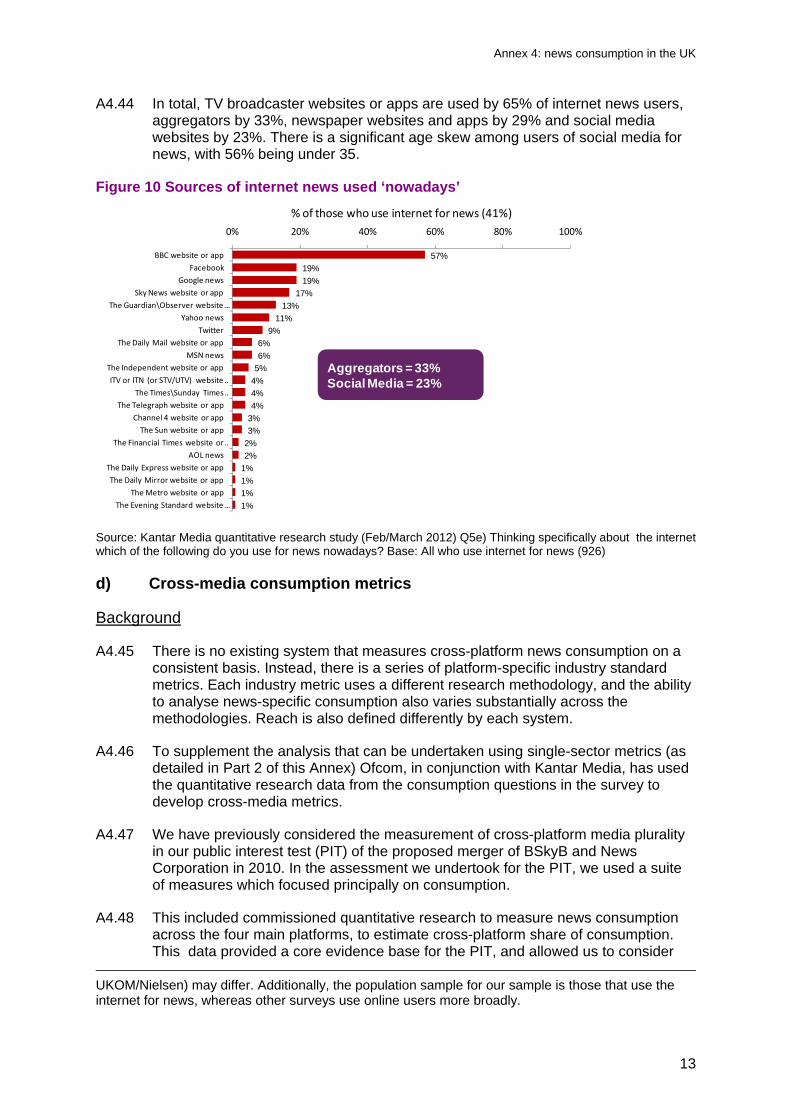
A4.39 Forty-one per cent of all UK adults say they use the internet for news nowadays.
UK internet news users access the websites of a wide variety of news providers, including non-UK websites. Despite the wide variety of sites used, the average number of internet sites/apps used by any one person who uses the internet for news nowadays is 2.0. The main source used is the BBC website or app (57%).
A4.40 Given the number of methods of using and generating news online, the more traditional ‘reading’ of news online is still the most common form of consumption. Some 60% of internet news users say they read news stories online, and 51% say they most often do this. In comparison, 25% say they read news comments on blogs or social networking sites, and 25% say they use search engines to find out more about a news story. Eighteen per cent say they watch TV news online.
A4.41 There are no significant age differences among internet news users in terms of reading news stories online. However, reading news-related comments/articles on blogs, and accessing news via social networking sites/apps is significantly higher for 16-44s (32%) than for other age groups.
A4.42 In terms of particular sources of internet news, as with television and radio, the BBC is the most popular source – 57% of people who use the internet for news use the BBC’s website either directly or through an app.
A4.43 Around one in five (19%) people who use the internet as a source of news say they use Facebook and Google News10. Just under one in ten (9%) claim to use Twitter as a source of internet news.
10 Google News may have been overstated if respondents were thinking more broadly about Google rather than Google News per se. Therefore, comparisons with other online metrics systems (such as
26%
25%
19%
15%
9%
9%
8%
7%
5%
5%
4%
2%
2%
1%
1%
0% 20% 40% 60% 80% 100%
BBC Radio 4
BBC Radio 2
BBC Radio 1
Any Regional commercial radio
Heart FM
BBC Regional
Capital FM
BBC Radio Five Live
Classic FM
Talksport
BBC Radio Scotland / Wales / …
BBC World Service
Absolute Radio
BBC Radio 3
BBC Asian Network
% of those who use radio for news (53%)
BBC National Radio = 66%
Commercial radio = 39%
BBC local radio = 10%
Annex 4: news consumption in the UK
13
A4.44 In total, TV broadcaster websites or apps are used by 65% of internet news users, aggregators by 33%, newspaper websites and apps by 29% and social media websites by 23%. There is a significant age skew among users of social media for news, with 56% being under 35.
Figure 10 Sources of internet news used ‘nowadays’
Source: Kantar Media quantitative research study (Feb/March 2012) Q5e) Thinking specifically about the internet which of the following do you use for news nowadays? Base: All who use internet for news (926)
d) Cross-media consumption metrics
Background
A4.45 There is no existing system that measures cross-platform news consumption on a consistent basis. Instead, there is a series of platform-specific industry standard metrics. Each industry metric uses a different research methodology, and the ability to analyse news-specific consumption also varies substantially across the methodologies. Reach is also defined differently by each system.
A4.46 To supplement the analysis that can be undertaken using single-sector metrics (as detailed in Part 2 of this Annex) Ofcom, in conjunction with Kantar Media, has used the quantitative research data from the consumption questions in the survey to develop cross-media metrics.
A4.47 We have previously considered the measurement of cross-platform media plurality in our public interest test (PIT) of the proposed merger of BSkyB and News Corporation in 2010. In the assessment we undertook for the PIT, we used a suite of measures which focused principally on consumption.
A4.48 This included commissioned quantitative research to measure news consumption across the four main platforms, to estimate cross-platform share of consumption. This data provided a core evidence base for the PIT, and allowed us to consider
UKOM/Nielsen) may differ. Additionally, the population sample for our sample is those that use the internet for news, whereas other surveys use online users more broadly.
57%
19%
19%
17%
13%
11%
9%
6%
6%
5%
4%
4%
4%
3%
3%
2%
2%
1%
1%
1%
1%
0% 20% 40% 60% 80% 100%
BBC website or app
Google news
Sky News website or app
The Guardian\Observer website …
Yahoo news
The Daily Mail website or app
MSN news
The Independent website or app
ITV or ITN (or STV/UTV) website …
The Times\Sunday Times …
The Telegraph website or app
Channel 4 website or app
The Sun website or app
The Financial Times website or …
AOL news
The Daily Express website or app
The Daily Mirror website or app
The Metro website or app
The Evening Standard website …
% of those who use internet for news (41%)
Aggregators = 33%Social Media = 23%
Annex 4: news consumption in the UK
14
the share of voice accounted for on each platform as well as across platforms. It also enabled us to determine how many news providers each individual used, creating a multi-sourcing metric.
A4.49 For our quantitative survey in the original PIT, we did not measure impact or the frequency with which people consumed different sources of news. Our ‘share of references’ metric was therefore based on whether respondents had consumed a title or source on a self-defined ‘regular’ basis. We also potentially underestimated the number of sources that consumers use, as some titles were grouped under the heading ‘other’ and so accounted for as one source, when in fact a number of sources may have been cited here.
A4.50 To improve the measurement of cross-media news consumption in our ‘share of references’ analysis, the survey commissioned for this project asked respondents about their frequency of consumption of different sources – i.e. daily, 2 or 3 times a week etc. It also attempted to capture all the sources of news cited by respondents, to provide a more accurate estimate for multi-sourcing. As a result, we have improved our ‘share of references’ estimates to reflect the frequency with which UK adults say they consume each news source.
A4.51 The methodology still has some limitations. It relies on consumer recollection of both the sources of news an individual uses, and their frequency of use. Moreover, there is a risk of people responding with the answers that they believe are ‘correct’. Finally, the research does not quantify the attention that any medium commands, nor the impact that it has on opinion forming. For these reasons, we believe that a range of consumption methodologies should be examined, that use both actual and claimed consumption.
A4.52 The metrics developed are an aggregation of consumption data across the four main platforms (TV, radio, newspapers, online). They are detailed at both the wholesale and retail level.
Wholesale – classified as the company that provides the news for the given source.
Retail – classified as the owner of the branded title/service through which the news is provided (except the three generic categories ‘commercial radio’, ‘aggregators’ and ‘social media’).
Cross-platform audience reach
A4.53 Cross-platform audience reach is derived by grouping overall reach for each news provider (e.g. the BBC) across all platforms, to show overall reach. This represents a de-duplicated reach result, i.e. if a respondent mentioned more than one source for the same organisation, these are counted only once in the reach calculation.
A4.54 The data in Figure 11 show that the BBC has substantial reach across all its news sources, equating to 86% of all adults who follow the news nowadays. ITN reaches just under half (47%) of adults who use news in the UK, while Sky reaches four in ten consumers.
A4.55 At the wholesale (provider) level Sky provides news for Sky News and the Sky News website and, until 20th February 2012, Channel 5 news and the Channel 5 website. The analysis in Figure 11 assumes that Sky is the wholesale provider of Channel 5 news; see paragraph A4.57 for the comparable analysis with ITN as
Annex 4: news consumption in the UK
15
Channel 5’s news supplier. Sky also supplies radio news to Classic FM, Absolute Radio, and other commercial radio stations (including TalkSport).
A4.56 At the wholesale level, ITN provides news for both ITV and Channel 4, so these channels are split out when considering the retail figures. The respective reach figures for these channels are 40% for ITV and 13% for Channel 4. Note that ITN took over the contract to supply Channel 5 news in February 2012; the wholesale analysis in Figure 11 assumes that Sky is the supplier. The ‘other’ category reduces from 42% to 28% at the retail level, due to radio, aggregators and social media brands splitting out.
A4.57 The effect of allocating Channel 5 news to ITN at the wholesale level reduces Sky’s wholesale reach by 3 percentage points, to 37%, and boosts ITN’s reach by 1pp to 48%.
Figure 11: Cross-platform audience reach for news: wholesale level
Base: All who use a news source nowadays (2254) Source: Kantar Media quantitative research study (Feb/March 2012) Note: The contract to supply Channel 5’s news bulletins was taken over by ITN during the period when the quantitative research was undertaken. The wholesale analysis in this chart, and in Annex 5, allocates Channel 5 news at the wholesale level to Sky.
A4.58 At the retail level Sky provides news only for Sky News and the Sky News website, and as such its reach reduces from 40% to 28%. Channel 5 goes into Northern Shell at the retail level and so that figure increases from 7% to 12%.
86%
47%40%
27%21%
15%9% 9% 7% 6%
2%
42%
0%
10%
20%
30%
40%
50%
60%
70%
80%
90%
100%Other included 334 sources (all below 2%)
22 TV stations (Mostly non‐UK) 66 local daily papers (Not Northcliffe or Trinity)
112 local weekly papers (Not Northcliffe or Trinity) 61 Websites
Annex 4: news consumption in the UK
16
Figure 12 Cross-platform audience reach for news: retail level
Base: All who use a news source nowadays (2254) Source: Kantar Media quantitative research study (Feb/March 2012)
Cross-platform share of references11
A4.59 Share of references (SoR) is a bespoke metric designed to measure the share of individual news sources consumed across all platforms. This measure is calculated from a combination of ‘sources used nowadays’ and their frequency of consumption. The number of mentions for each news source, weighted by their frequency of consumption, are aggregated and then expressed as a share of total responses across all platforms.
A4.60 Figure 13 shows that 47% of all news consumption in the UK at the wholesale level is through the BBC. It has a platform share of 56% for TV, 66% for radio, and 29% for the internet. This compares to a cross-platform figure of 16% for Sky and 11% for ITN. All the other companies evaluated were shown to have 5% share or less. The ‘other’ category consists of 334 sources, all of which have less than a 2% share.
A4.61 Once again, Figure 13 allocates Channel 5 news’ references to Sky. The effect of allocating them instead to ITN at the wholesale level is to reduce Sky’s share of references by one percentage point to 15% and to boost ITN’s share by 1pp to 12%.
11 Please see paragraphs A4.121 to A4.125 for further discussion of Share of References.
86%
40%
28% 27%21%
15% 14% 14% 13% 12% 10% 9% 9% 6% 2%
28%
0%10%20%30%40%50%60%70%80%90%
100%
Other includes 223 sources (all below 2%)
22 TV stations (Mostly foreign)66 local daily papers (Not Northcliffe or Trinity)
112 local weekly papers (Not Northcliffe or Trinity)59 Websites
Annex 4: news consumption in the UK
17
Figure 13: Share of references: wholesale level
Base: All who use a news source nowadays (2254) Source: Kantar Media quantitative research study (Feb/March 2012) Note: The contract to supply Channel 5’s news bulletins was taken over by ITN during the period when the quantitative research was undertaken. The wholesale analysis in this chart, and in Annex 5, allocates Channel 5 news at the wholesale level to Sky.
A4.62 At the retail level the BBC’s share remains the same but Sky’s share reduces from 16% to 7%, due to the exclusion of its provision of news to Channel 5 and commercial radio. Commercial radio has the same share as Sky at the retail level. ITV has a 9% share of references at the retail level.
Figure 14 Share of references: retail level
Base: All who use a news source nowadays (2254) Source: Kantar Media quantitative research study (Feb/March 2012)
47%
16%11%
4% 1% 3% 2% 1% 2% 1% 0%
12%
0%
10%
20%
30%
40%
50%
60%
70%
80%
90%
100%
47%
9% 7% 7% 4% 4% 4% 3% 2% 2% 2% 2% 1% 1% 0% 4%
0%
10%
20%
30%
40%
50%
60%
70%
80%
90%
100%Other includes 223 sources (all below 2%)
22 TV stations (Mostly foreign)66 local daily papers (Not Northcliffe or Trinity)
112 local weekly papers (Not Northcliffe or Trinity)59 Websites
Other included 334 sources (all below 2%)22 TV stations (Mostly non‐UK)
66 local daily papers (Not Northcliffe or Trinity) 112 local weekly papers (Not Northcliffe or Trinity)
61 Websites
Annex 4: news consumption in the UK
18
Multi-sourcing across news provider
A4.63 We have already described the average number of platforms used among UK news users, and the average number of sources used within each platform. The following analysis looks at the average number of wholesale news providers used by UK news users.
A4.64 On average, UK news users use 3.1 news providers across all the news sources that they use. This increases to 3.3 at the retail level as the number of providers at the retail level is higher than at the wholesale level.
A4.65 In terms of individual news providers, among people who consume news nowadays 14% use only one provider, 39% use one or two providers, and 65% use three or fewer providers. Close to one in ten (9%) of news users use the BBC as their sole provider of news (and this is predominantly BBC One). No other provider has more than a 2% share of sole use.
Figure 15: Number of providers used at wholesale level
Source: Kantar Media quantitative research study (Feb/March 2012) Base: All who use a news source nowadays (2244) A4.66 At the retail level, the degree of multi-sourcing is a little higher owing to the
presence of a greater number of news sources/titles when compared to underlying providers.
14%
39%
65%
83%93% 98% 100%
14%
25%
26%
18%
10%
5% 2%
0%
20%
40%
60%
80%
100%
1 provider 2 providers 3 providers 4 providers 5 providers 6 providers 7 providers 8+ providers
65% use 3 or less
39% use 1 or 2 providers
36% use 4 or more providers
Annex 4: news consumption in the UK
19
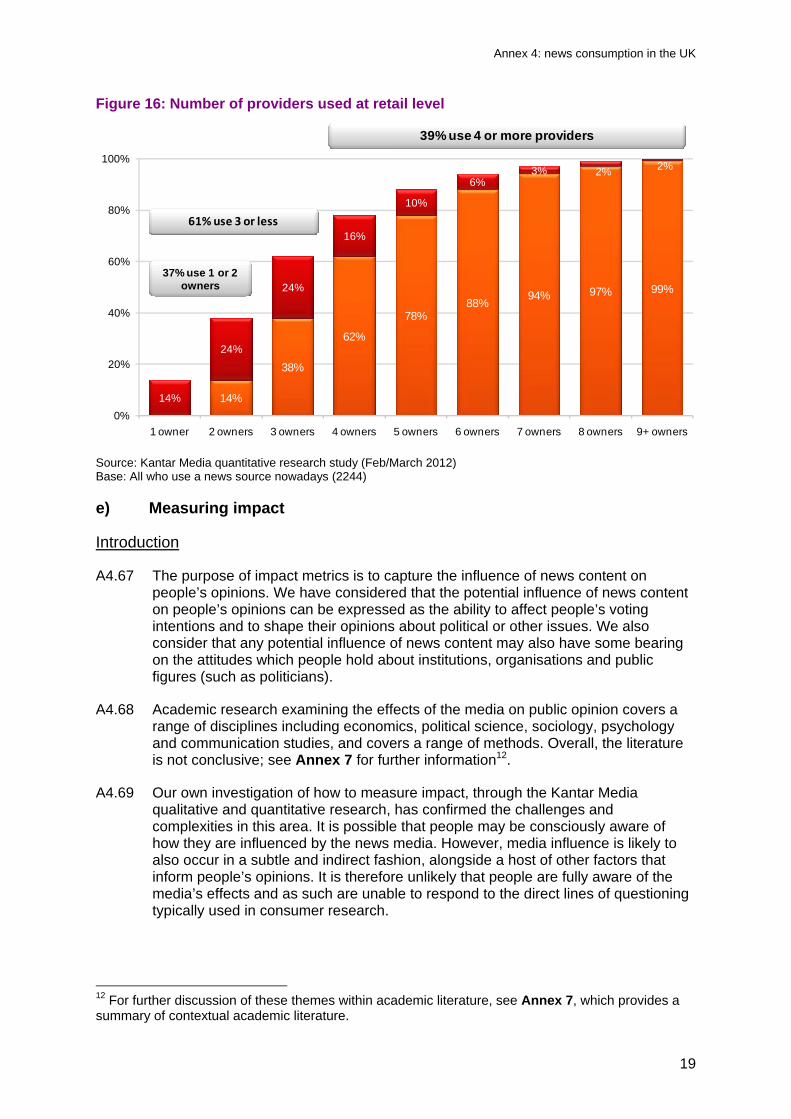
Figure 16: Number of providers used at retail level
Source: Kantar Media quantitative research study (Feb/March 2012) Base: All who use a news source nowadays (2244) e) Measuring impact
Introduction
A4.67 The purpose of impact metrics is to capture the influence of news content on people’s opinions. We have considered that the potential influence of news content on people’s opinions can be expressed as the ability to affect people’s voting intentions and to shape their opinions about political or other issues. We also consider that any potential influence of news content may also have some bearing on the attitudes which people hold about institutions, organisations and public figures (such as politicians).
A4.68 Academic research examining the effects of the media on public opinion covers a range of disciplines including economics, political science, sociology, psychology and communication studies, and covers a range of methods. Overall, the literature is not conclusive; see Annex 7 for further information12.
A4.69 Our own investigation of how to measure impact, through the Kantar Media qualitative and quantitative research, has confirmed the challenges and complexities in this area. It is possible that people may be consciously aware of how they are influenced by the news media. However, media influence is likely to also occur in a subtle and indirect fashion, alongside a host of other factors that inform people’s opinions. It is therefore unlikely that people are fully aware of the media’s effects and as such are unable to respond to the direct lines of questioning typically used in consumer research.
12 For further discussion of these themes within academic literature, see Annex 7, which provides a summary of contextual academic literature.
14%
38%
62%
78%88%
94% 97% 99%
14%
24%
24%
16%
10%
6%3% 2% 2%
0%
20%
40%
60%
80%
100%
1 owner 2 owners 3 owners 4 owners 5 owners 6 owners 7 owners 8 owners 9+ owners
61% use 3 or less
37% use 1 or 2 owners
39% use 4 or more providers
Annex 4: news consumption in the UK
20
A4.70 Our qualitative research confirmed that while participants could talk about the different sources that may inform their opinions on news and current affairs, there was no easy way to capture opinion-forming directly.
A4.71 Rather, influence can come from a combination of many elements, including the type of news story, the trust and perceived accuracy of the source, and a range of other factors. We can explore a range of potentially influential indirect measures although these are inherently variable and difficult to capture directly. In the Kantar Media quantitative research (see Annex 5 for details) we asked respondents about the following components in order to test which might work best as possible proxies for people’s conscious awareness of influence13:
Personal importance of individual news sources;
Accuracy and reliability;
Trustworthiness;
Impartial and unbiased;
Has in-depth analysis;
Is up-to-the-minute;
Offers a view that reflects your own outlook;
Gives you what you need to make your mind up about a news story;
Offers a range of opinions; and
Offers an alternative to the mainstream.
A4.72 We report below on responses to the question about personal importance of news sources.
Personal importance of individual sources
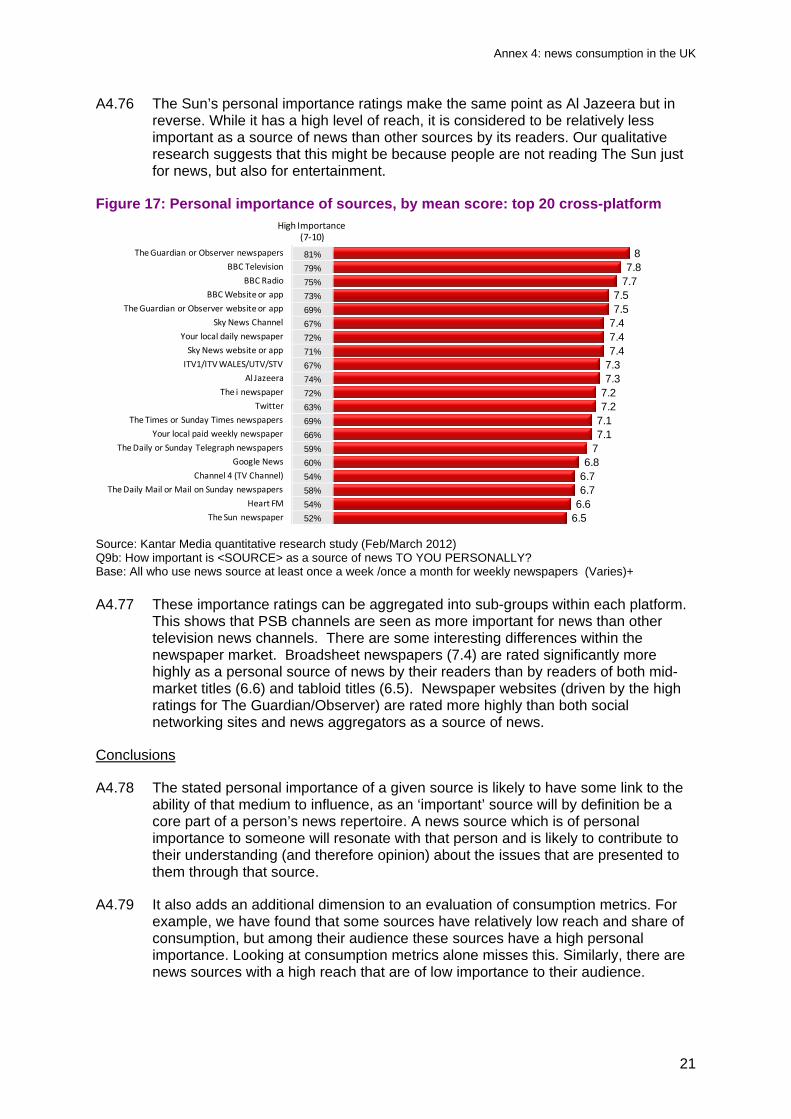
A4.73 Respondents were asked to rate the importance of each source of news to them personally, on a scale of 1 – 10. Figure 17 shows the mean scores of the top 20 rankings across all four platforms, based on the consumers of each individual news source. It also shows the percentage of people rating each brand between 7 and 10, to give an indication of the proportion of people giving a ‘high’ rating of personal importance.
A4.74 The Guardian/The Observer newspapers are the most likely to be considered as an important source of news by their readers. The BBC (across all three platforms it operates on) is also rated highly as a source of news by its users.
A4.75 Al Jazeera is also of high personal importance to its users, illustrating that its personal importance as a news source is not necessarily correlated to market size. The qualitative research supports this finding: whilst there were very few viewers of Al Jazeera across the focus groups, those people who did view it considered it to offer an alternative important viewpoint to the mainstream, and to be a credible alternative.
13 These components are not an exhaustive list, but provide a useful range of elements to compare with each other.
Annex 4: news consumption in the UK
21
A4.76 The Sun’s personal importance ratings make the same point as Al Jazeera but in reverse. While it has a high level of reach, it is considered to be relatively less important as a source of news than other sources by its readers. Our qualitative research suggests that this might be because people are not reading The Sun just for news, but also for entertainment.
Figure 17: Personal importance of sources, by mean score: top 20 cross-platform
Source: Kantar Media quantitative research study (Feb/March 2012) Q9b: How important is <SOURCE> as a source of news TO YOU PERSONALLY? Base: All who use news source at least once a week /once a month for weekly newspapers (Varies)+
A4.77 These importance ratings can be aggregated into sub-groups within each platform. This shows that PSB channels are seen as more important for news than other television news channels. There are some interesting differences within the newspaper market. Broadsheet newspapers (7.4) are rated significantly more highly as a personal source of news by their readers than by readers of both mid-market titles (6.6) and tabloid titles (6.5). Newspaper websites (driven by the high ratings for The Guardian/Observer) are rated more highly than both social networking sites and news aggregators as a source of news.
Conclusions
A4.78 The stated personal importance of a given source is likely to have some link to the ability of that medium to influence, as an ‘important’ source will by definition be a core part of a person’s news repertoire. A news source which is of personal importance to someone will resonate with that person and is likely to contribute to their understanding (and therefore opinion) about the issues that are presented to them through that source.
A4.79 It also adds an additional dimension to an evaluation of consumption metrics. For example, we have found that some sources have relatively low reach and share of consumption, but among their audience these sources have a high personal importance. Looking at consumption metrics alone misses this. Similarly, there are news sources with a high reach that are of low importance to their audience.
87.8
7.77.57.5
7.47.47.4
7.37.3
7.27.2
7.17.1
76.8
6.76.7
6.66.5
The Guardian or Observer newspapers
BBC Television
BBC Radio
BBC Website or app
The Guardian or Observer website or app
Sky News Channel
Your local daily newspaper
Sky News website or app
ITV1/ITV WALES/UTV/STV
Al Jazeera
The i newspaper
The Times or Sunday Times newspapers
Your local paid weekly newspaper
The Daily or Sunday Telegraph newspapers
Google News
Channel 4 (TV Channel)
The Daily Mail or Mail on Sunday newspapers
Heart FM
The Sun newspaper
81%
79%
75%
73%
69%
67%
72%
71%
67%
74%
72%
63%
69%
66%
59%
60%
54%
58%
54%
52%
High Importance (7‐10)
Annex 4: news consumption in the UK
22
A4.80 We have identified perceived ‘importance’ as an easy concept for respondents to understand and we have also found, through statistical correlation analysis, that the perceived importance of a source correlates closely to the range of the other components listed in paragraph A4.71.
A4.81 This leads us to conclude that ’importance’ is a useful summary measure, while noting its limitations; that it is an overt, conscious measure and as such provides only part of the picture.
Annex 4: news consumption in the UK
23
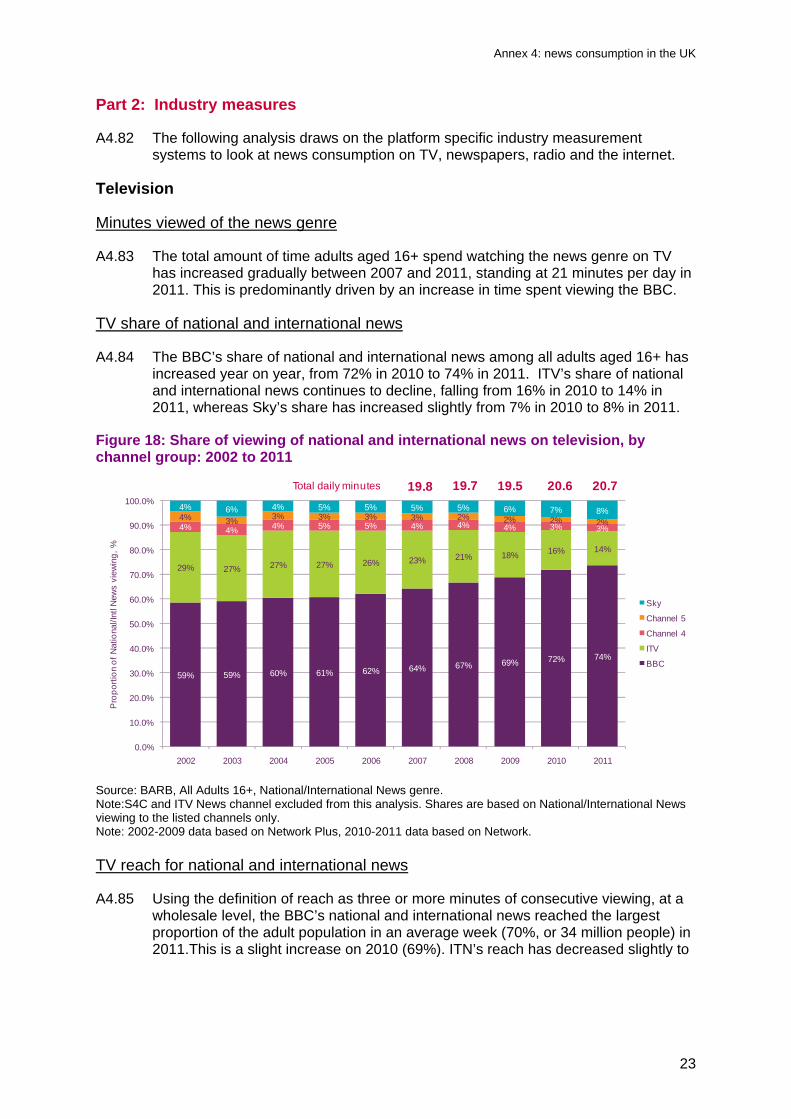
Part 2: Industry measures
A4.82 The following analysis draws on the platform specific industry measurement systems to look at news consumption on TV, newspapers, radio and the internet.
Television
Minutes viewed of the news genre
A4.83 The total amount of time adults aged 16+ spend watching the news genre on TV has increased gradually between 2007 and 2011, standing at 21 minutes per day in 2011. This is predominantly driven by an increase in time spent viewing the BBC.
TV share of national and international news
A4.84 The BBC’s share of national and international news among all adults aged 16+ has increased year on year, from 72% in 2010 to 74% in 2011. ITV’s share of national and international news continues to decline, falling from 16% in 2010 to 14% in 2011, whereas Sky’s share has increased slightly from 7% in 2010 to 8% in 2011.
Figure 18: Share of viewing of national and international news on television, by channel group: 2002 to 2011
Source: BARB, All Adults 16+, National/International News genre. Note:S4C and ITV News channel excluded from this analysis. Shares are based on National/International News viewing to the listed channels only. Note: 2002-2009 data based on Network Plus, 2010-2011 data based on Network.
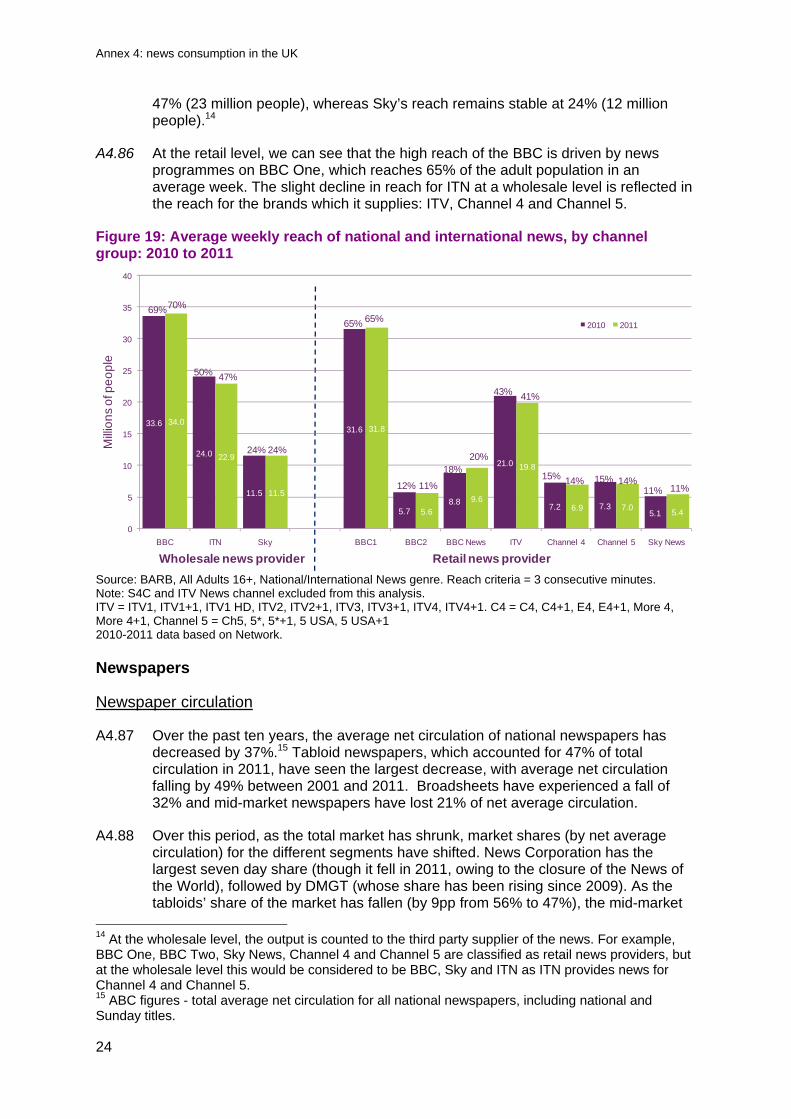
TV reach for national and international news
A4.85 Using the definition of reach as three or more minutes of consecutive viewing, at a wholesale level, the BBC’s national and international news reached the largest proportion of the adult population in an average week (70%, or 34 million people) in 2011.This is a slight increase on 2010 (69%). ITN’s reach has decreased slightly to
59% 59% 60% 61% 62% 64% 67% 69% 72% 74%
29% 27% 27% 27% 26% 23% 21% 18% 16% 14%
4% 4% 4% 5% 5% 4% 4% 4% 3% 3%4% 3% 3% 3% 3% 3% 2% 2% 2% 2%
4% 6% 4% 5% 5% 5% 5% 6% 7% 8%
0.0%
10.0%
20.0%
30.0%
40.0%
50.0%
60.0%
70.0%
80.0%
90.0%
100.0%
2002 2003 2004 2005 2006 2007 2008 2009 2010 2011
Pro
po
rtio
n o
f N
atio
nal/I
ntl N
ews
view
ing
, %
Sky
Channel 5
Channel 4
ITV
BBC
20.719.8Total daily minutes 19.7 19.5 20.6
Annex 4: news consumption in the UK
24
47% (23 million people), whereas Sky’s reach remains stable at 24% (12 million people).14
A4.86 At the retail level, we can see that the high reach of the BBC is driven by news programmes on BBC One, which reaches 65% of the adult population in an average week. The slight decline in reach for ITN at a wholesale level is reflected in the reach for the brands which it supplies: ITV, Channel 4 and Channel 5.
Figure 19: Average weekly reach of national and international news, by channel group: 2010 to 2011
Source: BARB, All Adults 16+, National/International News genre. Reach criteria = 3 consecutive minutes. Note: S4C and ITV News channel excluded from this analysis. ITV = ITV1, ITV1+1, ITV1 HD, ITV2, ITV2+1, ITV3, ITV3+1, ITV4, ITV4+1. C4 = C4, C4+1, E4, E4+1, More 4, More 4+1, Channel 5 = Ch5, 5*, 5*+1, 5 USA, 5 USA+1 2010-2011 data based on Network. Newspapers
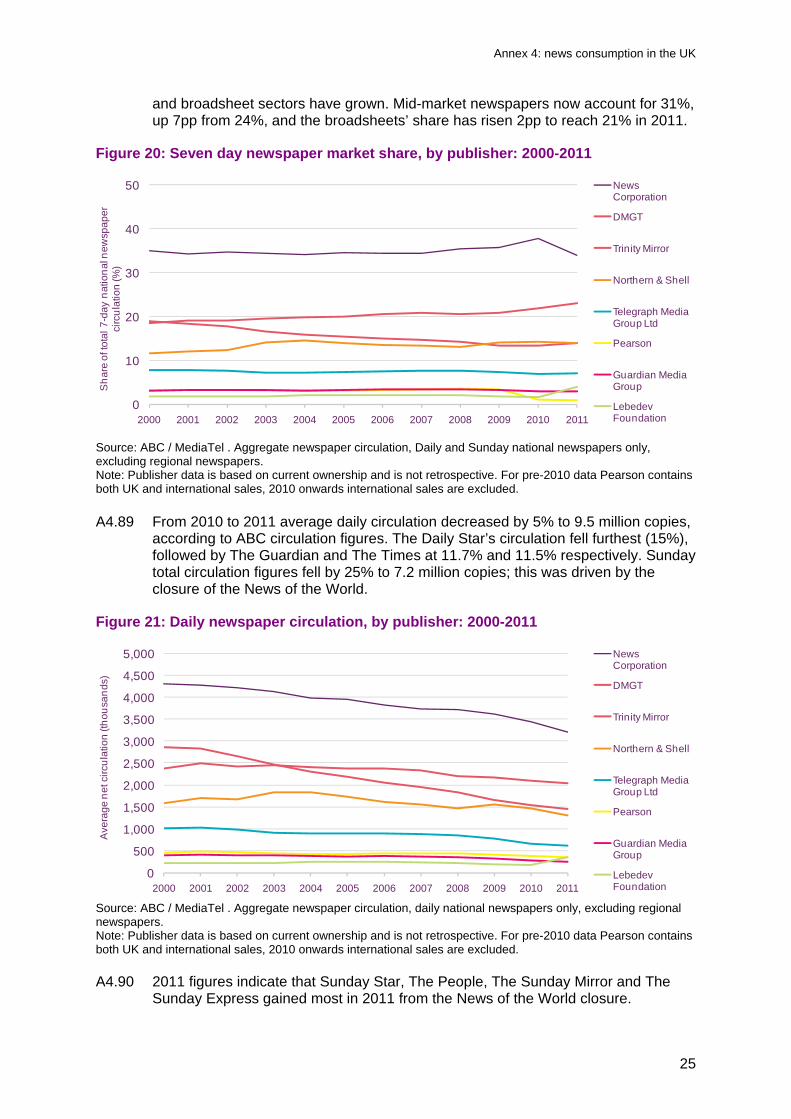
Newspaper circulation
A4.87 Over the past ten years, the average net circulation of national newspapers has decreased by 37%.15 Tabloid newspapers, which accounted for 47% of total circulation in 2011, have seen the largest decrease, with average net circulation falling by 49% between 2001 and 2011. Broadsheets have experienced a fall of 32% and mid-market newspapers have lost 21% of net average circulation.
A4.88 Over this period, as the total market has shrunk, market shares (by net average circulation) for the different segments have shifted. News Corporation has the largest seven day share (though it fell in 2011, owing to the closure of the News of the World), followed by DMGT (whose share has been rising since 2009). As the tabloids’ share of the market has fallen (by 9pp from 56% to 47%), the mid-market
14 At the wholesale level, the output is counted to the third party supplier of the news. For example, BBC One, BBC Two, Sky News, Channel 4 and Channel 5 are classified as retail news providers, but at the wholesale level this would be considered to be BBC, Sky and ITN as ITN provides news for Channel 4 and Channel 5. 15 ABC figures - total average net circulation for all national newspapers, including national and Sunday titles.
Wholesale news provider Retail news provider
Mill
ion
s o
f pe
op
le
33.6
24.0
11.5
31.6
5.78.8
21.0
7.2 7.35.1
34.0
22.9
11.5
31.8
5.6
9.6
19.8
6.9 7.05.4
0
5
10
15
20
25
30
35
40
BBC ITN Sky BBC1 BBC2 BBC News ITV Channel 4 Channel 5 Sky News
2010 2011
69%70%
50% 47%
24% 24%
65% 65%
12% 11%
18%20%
43% 41%
15% 14% 15% 14%11% 11%
Annex 4: news consumption in the UK
25
and broadsheet sectors have grown. Mid-market newspapers now account for 31%, up 7pp from 24%, and the broadsheets’ share has risen 2pp to reach 21% in 2011.
Figure 20: Seven day newspaper market share, by publisher: 2000-2011
Source: ABC / MediaTel . Aggregate newspaper circulation, Daily and Sunday national newspapers only, excluding regional newspapers. Note: Publisher data is based on current ownership and is not retrospective. For pre-2010 data Pearson contains both UK and international sales, 2010 onwards international sales are excluded.
A4.89 From 2010 to 2011 average daily circulation decreased by 5% to 9.5 million copies, according to ABC circulation figures. The Daily Star’s circulation fell furthest (15%), followed by The Guardian and The Times at 11.7% and 11.5% respectively. Sunday total circulation figures fell by 25% to 7.2 million copies; this was driven by the closure of the News of the World.
Figure 21: Daily newspaper circulation, by publisher: 2000-2011
Source: ABC / MediaTel . Aggregate newspaper circulation, daily national newspapers only, excluding regional newspapers. Note: Publisher data is based on current ownership and is not retrospective. For pre-2010 data Pearson contains both UK and international sales, 2010 onwards international sales are excluded. A4.90 2011 figures indicate that Sunday Star, The People, The Sunday Mirror and The
Sunday Express gained most in 2011 from the News of the World closure.
0
10
20
30
40
50
2000 2001 2002 2003 2004 2005 2006 2007 2008 2009 2010 2011
Sh
are
of t
ota
l 7
-day
nat
ion
al n
ewsp
aper
ci
rcu
latio
n (%
)
News Corporation
DMGT
Trinity Mirror
Northern & Shell
Telegraph Media Group Ltd
Pearson
Guardian Media Group
Lebedev Foundation
0
500
1,000
1,500
2,000
2,500
3,000
3,500
4,000
4,500
5,000
2000 2001 2002 2003 2004 2005 2006 2007 2008 2009 2010 2011
Ave
rag
e n
et c
ircu
latio
n (t
hou
san
ds)
News Corporation
DMGT
Trinity Mirror
Northern & Shell
Telegraph Media Group Ltd
Pearson
Guardian Media Group
Lebedev Foundation
Annex 4: news consumption in the UK
26
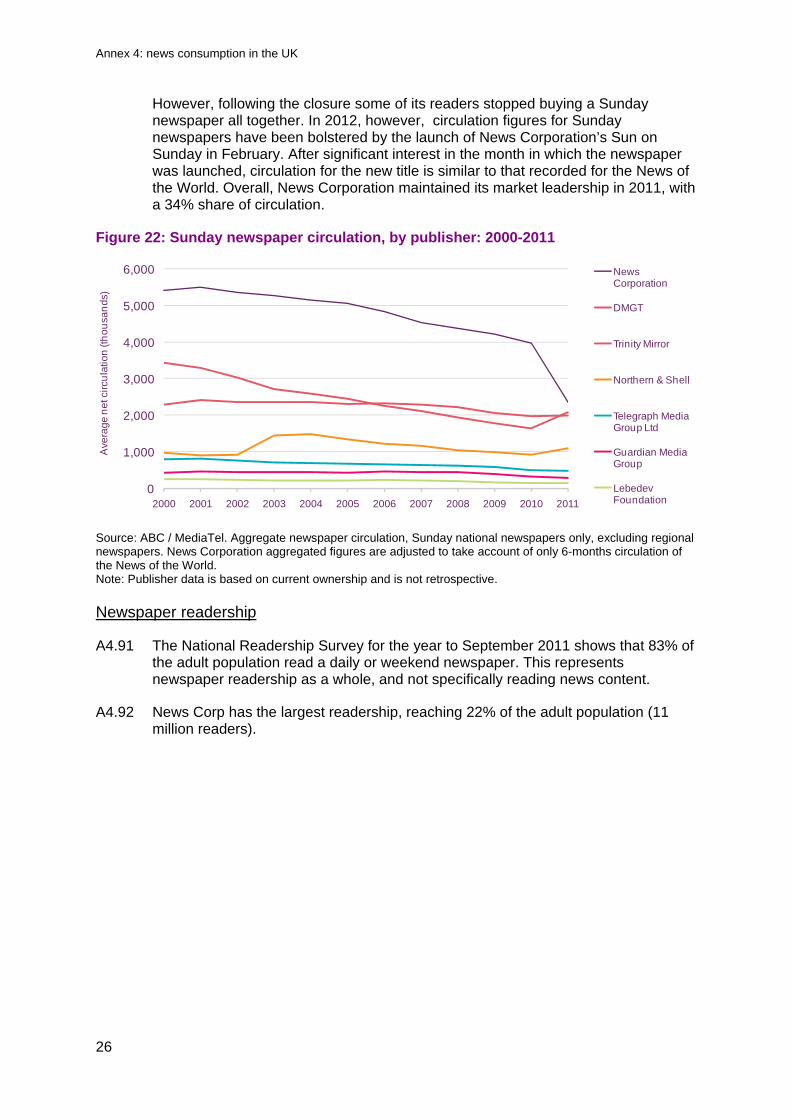
However, following the closure some of its readers stopped buying a Sunday newspaper all together. In 2012, however, circulation figures for Sunday newspapers have been bolstered by the launch of News Corporation’s Sun on Sunday in February. After significant interest in the month in which the newspaper was launched, circulation for the new title is similar to that recorded for the News of the World. Overall, News Corporation maintained its market leadership in 2011, with a 34% share of circulation.
Figure 22: Sunday newspaper circulation, by publisher: 2000-2011
Source: ABC / MediaTel. Aggregate newspaper circulation, Sunday national newspapers only, excluding regional newspapers. News Corporation aggregated figures are adjusted to take account of only 6-months circulation of the News of the World. Note: Publisher data is based on current ownership and is not retrospective. Newspaper readership
A4.91 The National Readership Survey for the year to September 2011 shows that 83% of the adult population read a daily or weekend newspaper. This represents newspaper readership as a whole, and not specifically reading news content.
A4.92 News Corp has the largest readership, reaching 22% of the adult population (11 million readers).
0
1,000
2,000
3,000
4,000
5,000
6,000
2000 2001 2002 2003 2004 2005 2006 2007 2008 2009 2010 2011
Ave
rage
ne
t circ
ula
tion
(th
ou
san
ds)
News Corporation
DMGT
Trinity Mirror
Northern & Shell
Telegraph Media Group Ltd
Guardian Media Group
Lebedev Foundation
Annex 4: news consumption in the UK
27
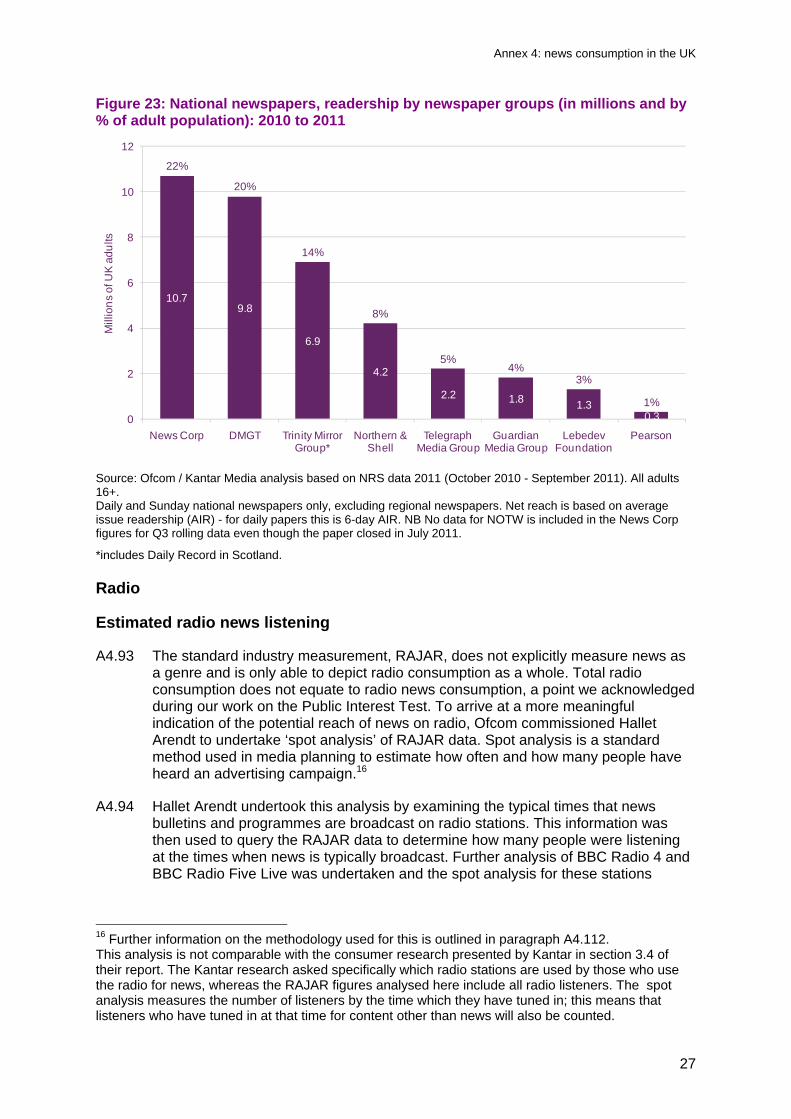
Figure 23: National newspapers, readership by newspaper groups (in millions and by % of adult population): 2010 to 2011
Source: Ofcom / Kantar Media analysis based on NRS data 2011 (October 2010 - September 2011). All adults 16+. Daily and Sunday national newspapers only, excluding regional newspapers. Net reach is based on average issue readership (AIR) - for daily papers this is 6-day AIR. NB No data for NOTW is included in the News Corp figures for Q3 rolling data even though the paper closed in July 2011.
*includes Daily Record in Scotland. Radio
Estimated radio news listening
A4.93 The standard industry measurement, RAJAR, does not explicitly measure news as a genre and is only able to depict radio consumption as a whole. Total radio consumption does not equate to radio news consumption, a point we acknowledged during our work on the Public Interest Test. To arrive at a more meaningful indication of the potential reach of news on radio, Ofcom commissioned Hallet Arendt to undertake ‘spot analysis’ of RAJAR data. Spot analysis is a standard method used in media planning to estimate how often and how many people have heard an advertising campaign.16
A4.94 Hallet Arendt undertook this analysis by examining the typical times that news bulletins and programmes are broadcast on radio stations. This information was then used to query the RAJAR data to determine how many people were listening at the times when news is typically broadcast. Further analysis of BBC Radio 4 and BBC Radio Five Live was undertaken and the spot analysis for these stations
16 Further information on the methodology used for this is outlined in paragraph A4.112. This analysis is not comparable with the consumer research presented by Kantar in section 3.4 of their report. The Kantar research asked specifically which radio stations are used by those who use the radio for news, whereas the RAJAR figures analysed here include all radio listeners. The spot analysis measures the number of listeners by the time which they have tuned in; this means that listeners who have tuned in at that time for content other than news will also be counted.
10.79.8
6.9
4.2
2.2 1.8 1.30.3
22%
20%
14%
8%
5%4%
3%
1%
0
2
4
6
8
10
12
News Corp DMGT Trinity Mirror Group*
Northern & Shell
Telegraph Media Group
Guardian Media Group
Lebedev Foundation
Pearson
Mill
ion
s o
f UK
ad
ults
Annex 4: news consumption in the UK
28
adjusted to account for the greater amount of news-specific programmes which are broadcast on these stations.
A4.95 This analysis suggests that news broadcasts across all of the BBC Radio services in the typical week in Q1 2012 reached over six in ten of the UK population (64%). The comparable figure for commercial radio was 60%.
A4.96 News on local commercial stations is heard by 47% of the population on a weekly basis, with news broadcasts on national commercial stations’ estimated to be heard by 27% of the population. The larger audience for news on local commercial stations compared to national commercial stations is a result of the higher overall listenership for local commercial stations.
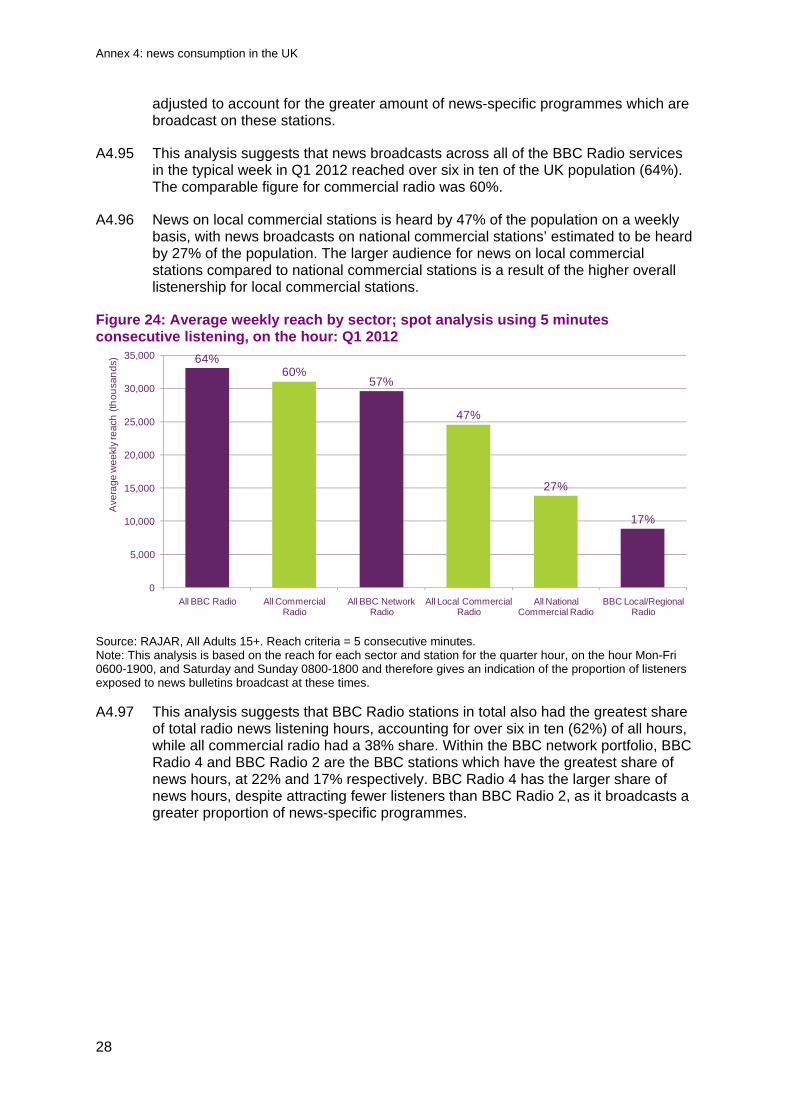
Figure 24: Average weekly reach by sector; spot analysis using 5 minutes consecutive listening, on the hour: Q1 2012
Source: RAJAR, All Adults 15+. Reach criteria = 5 consecutive minutes. Note: This analysis is based on the reach for each sector and station for the quarter hour, on the hour Mon-Fri 0600-1900, and Saturday and Sunday 0800-1800 and therefore gives an indication of the proportion of listeners exposed to news bulletins broadcast at these times. A4.97 This analysis suggests that BBC Radio stations in total also had the greatest share
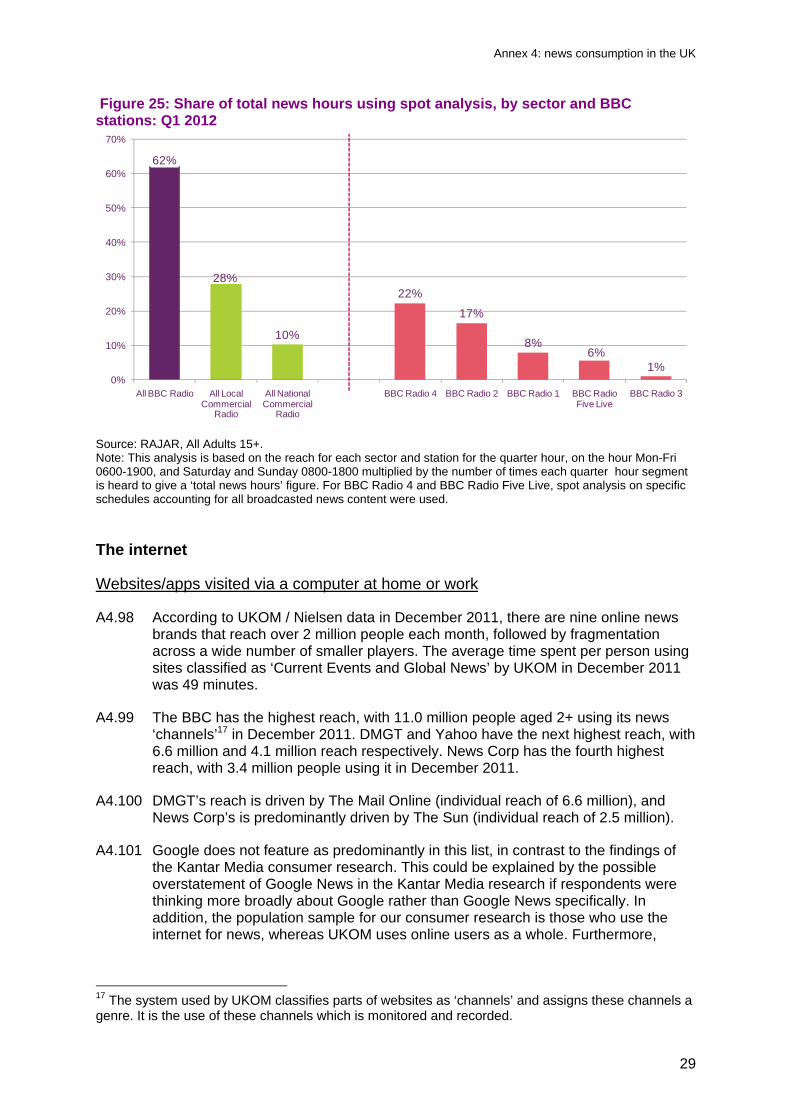
of total radio news listening hours, accounting for over six in ten (62%) of all hours, while all commercial radio had a 38% share. Within the BBC network portfolio, BBC Radio 4 and BBC Radio 2 are the BBC stations which have the greatest share of news hours, at 22% and 17% respectively. BBC Radio 4 has the larger share of news hours, despite attracting fewer listeners than BBC Radio 2, as it broadcasts a greater proportion of news-specific programmes.
64%60%
57%
47%
27%
17%
0
5,000
10,000
15,000
20,000
25,000
30,000
35,000
All BBC Radio All Commercial Radio
All BBC Network Radio
All Local Commercial Radio
All National Commercial Radio
BBC Local/Regional Radio
Ave
rag
e w
ee
kly
rea
ch (
tho
usa
nd
s)
Annex 4: news consumption in the UK
29
Figure 25: Share of total news hours using spot analysis, by sector and BBC stations: Q1 2012
Source: RAJAR, All Adults 15+. Note: This analysis is based on the reach for each sector and station for the quarter hour, on the hour Mon-Fri 0600-1900, and Saturday and Sunday 0800-1800 multiplied by the number of times each quarter hour segment is heard to give a ‘total news hours’ figure. For BBC Radio 4 and BBC Radio Five Live, spot analysis on specific schedules accounting for all broadcasted news content were used.
The internet
Websites/apps visited via a computer at home or work
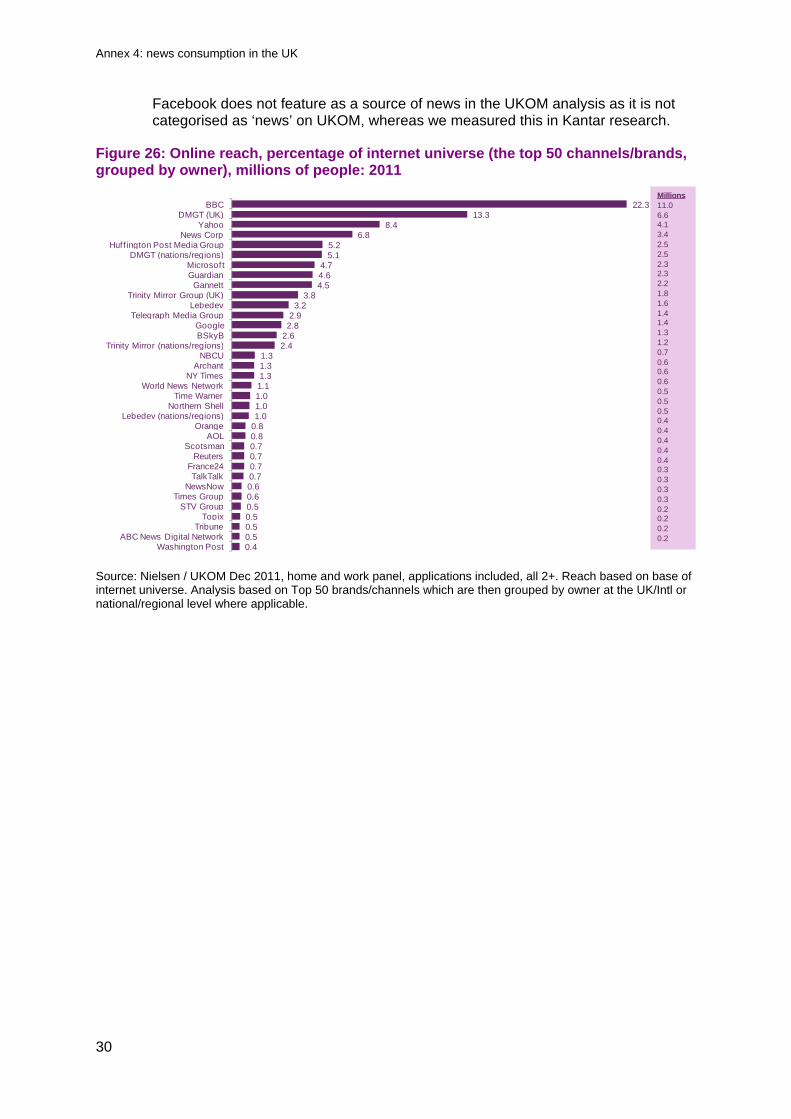
A4.98 According to UKOM / Nielsen data in December 2011, there are nine online news brands that reach over 2 million people each month, followed by fragmentation across a wide number of smaller players. The average time spent per person using sites classified as ‘Current Events and Global News’ by UKOM in December 2011 was 49 minutes.
A4.99 The BBC has the highest reach, with 11.0 million people aged 2+ using its news ‘channels’17 in December 2011. DMGT and Yahoo have the next highest reach, with 6.6 million and 4.1 million reach respectively. News Corp has the fourth highest reach, with 3.4 million people using it in December 2011.
A4.100 DMGT’s reach is driven by The Mail Online (individual reach of 6.6 million), and News Corp’s is predominantly driven by The Sun (individual reach of 2.5 million).
A4.101 Google does not feature as predominantly in this list, in contrast to the findings of the Kantar Media consumer research. This could be explained by the possible overstatement of Google News in the Kantar Media research if respondents were thinking more broadly about Google rather than Google News specifically. In addition, the population sample for our consumer research is those who use the internet for news, whereas UKOM uses online users as a whole. Furthermore,
17 The system used by UKOM classifies parts of websites as ‘channels’ and assigns these channels a genre. It is the use of these channels which is monitored and recorded.
62%
28%
10%
22%
17%
8%6%
1%0%
10%
20%
30%
40%
50%
60%
70%
All BBC Radio All Local Commercial
Radio
All National Commercial
Radio
BBC Radio 4 BBC Radio 2 BBC Radio 1 BBC Radio Five Live
BBC Radio 3
Annex 4: news consumption in the UK
30
Facebook does not feature as a source of news in the UKOM analysis as it is not categorised as ‘news’ on UKOM, whereas we measured this in Kantar research.
Figure 26: Online reach, percentage of internet universe (the top 50 channels/brands, grouped by owner), millions of people: 2011
Source: Nielsen / UKOM Dec 2011, home and work panel, applications included, all 2+. Reach based on base of internet universe. Analysis based on Top 50 brands/channels which are then grouped by owner at the UK/Intl or national/regional level where applicable.
0.40.50.50.50.50.60.60.70.70.70.70.80.81.01.01.01.11.31.31.3
2.42.62.82.9
3.23.8
4.54.64.7
5.15.2
6.88.4
13.322.3
Washington PostABC News Digital Network
TribuneTopix
STV GroupTimes Group
NewsNowTalkTalk
France24Reuters
ScotsmanAOL
OrangeLebedev (nations/regions)
Northern ShellTime Warner
World News NetworkNY Times
ArchantNBCU
Trinity Mirror (nations/regions)BSkyBGoogle
Telegraph Media GroupLebedev
Trinity Mirror Group (UK)Gannett
GuardianMicrosoft
DMGT (nations/regions)Huff ington Post Media Group
News CorpYahoo
DMGT (UK)BBC
Millions11.0 6.6 4.1 3.4 2.5 2.5 2.3 2.3 2.2 1.8 1.6 1.4 1.4 1.3 1.2 0.7 0.60.6 0.6 0.50.5 0.5 0.4 0.4 0.4 0.4 0.4 0.3 0.3 0.3 0.3 0.2 0.2 0.2 0.2
Annex 4: news consumption in the UK
31
Part 3: Metric sources, methodologies and evaluation
Introduction
A4.102 This section outlines the methodologies used by the industry measurement systems to collect the platform-specific consumption data that are illustrated in this annex. It also summarises the methodology for the cross-media metrics derived from our bespoke research, which are included in the main report (see paragraph 4.5 and Figure 1 on page 13).
Cross-platform vs. platform approaches
A4.103 There is no existing system that measures cross-platform news consumption on a consistent basis. Instead, there is a series of separate industry-standard metrics available on a platform-by-platform basis. It is important to note that each uses a different research methodology (as outlined below) and that their ability to analyse news-specific consumption also varies substantially across the methodologies; reach is also defined differently by each system. To supplement the analysis that these industry metrics make possible, Ofcom commissioned primary quantitative research to understand consumers’ use of news across media platforms (see Annex 5 for the full research results).
A4.104 This section sets of the main features, both of the standard industry measurement systems (BARB, RAJAR, NRS, ABC, UCOM), and of the quantitative research that Ofcom commissioned.
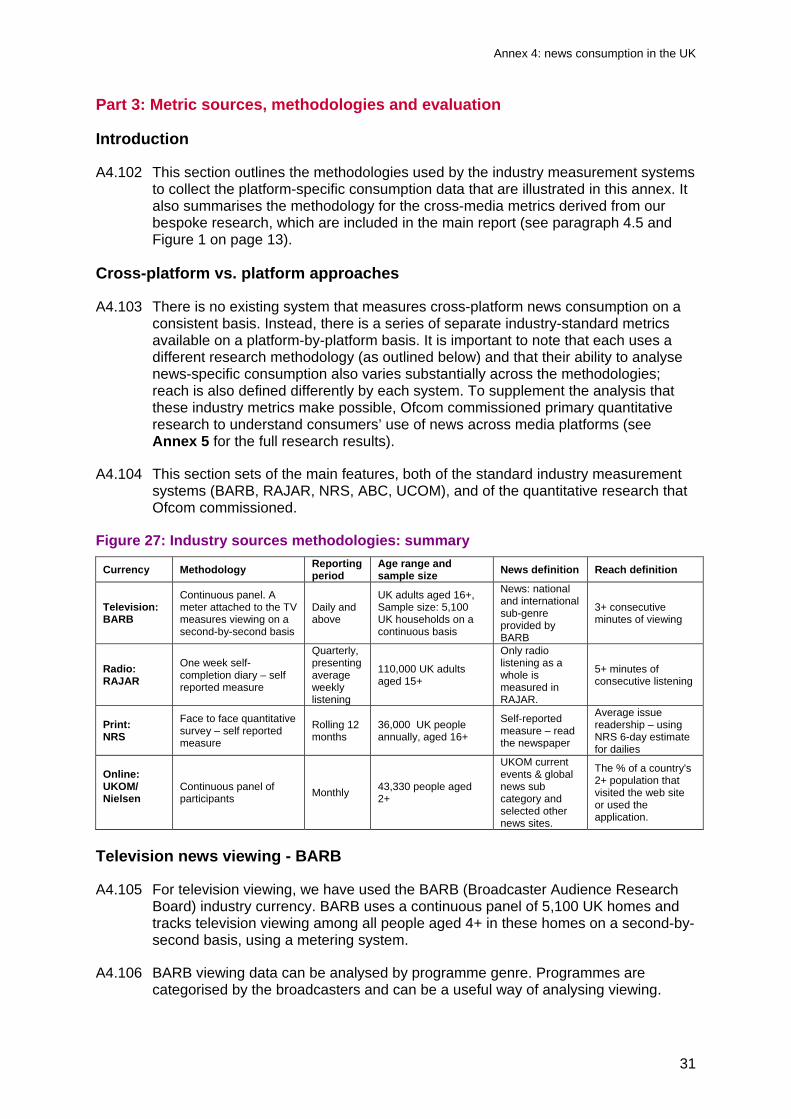
Figure 27: Industry sources methodologies: summary
Currency Methodology Reporting period
Age range and sample size
News definition Reach definition
Television: BARB
Continuous panel. A meter attached to the TV measures viewing on a second-by-second basis
Daily and above
UK adults aged 16+, Sample size: 5,100 UK households on a continuous basis
News: national and international sub-genre provided by BARB
3+ consecutive minutes of viewing
Radio: RAJAR
One week self-completion diary – self reported measure
Quarterly, presenting average weekly listening
110,000 UK adults aged 15+
Only radio listening as a whole is measured in RAJAR.
5+ minutes of consecutive listening
Print: NRS
Face to face quantitative survey – self reported measure
Rolling 12 months
36,000 UK people annually, aged 16+
Self-reported measure – read the newspaper
Average issue readership – using NRS 6-day estimate for dailies
Online: UKOM/ Nielsen
Continuous panel of participants
Monthly 43,330 people aged 2+
UKOM current events & global news sub category and selected other news sites.
The % of a country's 2+ population that visited the web site or used the application.
Television news viewing - BARB
A4.105 For television viewing, we have used the BARB (Broadcaster Audience Research Board) industry currency. BARB uses a continuous panel of 5,100 UK homes and tracks television viewing among all people aged 4+ in these homes on a second-by-second basis, using a metering system.
A4.106 BARB viewing data can be analysed by programme genre. Programmes are categorised by the broadcasters and can be a useful way of analysing viewing.
Annex 4: news consumption in the UK
32
However, the genre classifications are provided on a voluntary basis by broadcasters, and there is no independent verification of them.
A4.107 The ‘news and weather’ genre contains four sub-genres – ‘national/international news’, ‘weather’, ‘regional news’ and ‘miscellaneous’. Analysis in this report is based on viewing to the sub-genre of ‘national/international news’. The other sub-genres were excluded as we deemed them less relevant to an understanding of consumption of TV national and international news. We also excluded the BARB genre of current affairs, as it contains a wide range of programme titles, including some that we thought not very relevant to an understanding of the consumption of news and current affairs (such as The One Show, and Helicopter Heroes).
A4.108 In this report, we have analysed data on viewers aged 16+. Reach (that is, the proportion of the population who have consumed a defined number of minutes of national/international news in a given period) is based on anyone who has watched at least three consecutive minutes of the sub-genre in an average week. Ofcom decided to run the TV news analysis on 3+ minutes, due to the varying duration of news programmes (e.g. short news bulletins, hour-long programmes or 24-hour channels).
A4.109 Share of news viewing is based on the following three providers – BBC (BBC One, BBC Two, BBC News); ITN (ITV1, C4); Sky (Sky News, Channel 5) – and relates to 2011. Other channels measured by BARB that provide short news bulletins and/or generate a small proportion of total viewing of news are not included in this analysis. These include Euronews, Al Jazeera English, Fox News, BBC Parliament, ITV2, ITV3, BBC Three and BBC Four.
A4.110 There are other dedicated news channels that broadcast in the UK. However, as these are not individually measured or reported by BARB (which is indicative of their relatively small channel shares) the viewing minutes they attract cannot be allocated to the ‘news’ category. These channels include CNN, Russia Today and France 24. We consider that these non-BARB-reported channels represent a very small proportion of total national/international news viewing.
Radio news listening – RAJAR
A4.111 For radio listening we have used the RAJAR (Radio Joint Industry Research) industry currency. RAJAR interviews approximately 110,000 adults aged 16+ over 50 weeks per year. The survey operates as a sweep, not a panel, which means that respondents participate for only one week. Respondents are asked to complete a one-week diary showing all the stations they listened to, for at least five minutes, recorded in quarter-hour time blocks. Data are compiled and released on a quarterly basis.
A4.112 As RAJAR does not measure listening to genres, we commissioned Hallet Arendt to undertake some “spot analysis” of RAJAR figures to produce some broad estimates of total news consumption. In a similar way to the measurement of advertising campaigns, this identifies the times at which the ‘spot’ (in this case news content) is broadcast, and then measures the number of listeners for each of these time periods. We identified the quarter hour, on the hour Mon-Fri 0600-1900, and Saturday and Sunday 0800-1800 as the relevant time periods. For BBC Radio 4 and BBC Radio Five Live, which broadcast regularly scheduled news-specific programmes outside these times, we have applied further specific time periods, based on published schedules, to allow for the greater proportion of news content on these stations.
Annex 4: news consumption in the UK
33
A4.113 We have focused the analysis here on the sectors of radio as defined by RAJAR (All BBC, BBC network, national commercial and local commercial), providing a broad overview of radio news consumption in the UK.
Newspaper readership – NRS
A4.114 Newspaper-specific analysis uses the industry currency – the National Readership Survey (NRS). This is a rolling face-to-face quantitative survey, drawing on a monthly sample of 3,000 respondents, interviewing 36,000 respondents each year.
A4.115 A respondent is deemed to have read a paper if they spent more than two minutes reading or looking at it. Average issue readership (AIR) is based on whether respondents say if they have read each title within the issue period of the title. For example, for daily newspapers respondents are asked whether they have read each daily paper in the past day.
A4.116 The titles analysed are the 20 newspapers that are available on a national basis: The Sun, The Mirror, The Daily Star, The Express, The Daily Mail, The Times, The Daily Telegraph, The Guardian, The Independent, The FT, The News of the World, The Daily Star Sunday, The Sunday Express, The Sunday Mirror, The People, The Mail on Sunday, The Sunday Times, The Sunday Telegraph, The Observer, The Independent on Sunday.
Newspaper circulation – ABC
A4.117 Newspaper circulation figures are from the Audit Bureau of Circulation (ABC). All UK national newspapers report circulation figures to the ABC. Circulation figures are reported according to predetermined standards and are audited once a month. The latest circulation data that we have used is for the full year 2011 and therefore does not include the Sun on Sunday.
Online – UKOM / Nielsen
A4.118 Online-specific consumption is measured using data supplied by UKOM (UK Online Measurement) / Nielsen, which monitors consumers’ active use of online sites on PCs and laptops at home and at work. The UKOM / Nielsen panel consists of 43,330 individuals aged 2+. Standard survey metrics provided by this panel include monthly active users and population reach of online sites/groups of sites, page views and time spent on a site per session.
A4.119 Nielsen groups websites into categories and sub-categories. In this annex we have performed our online analysis on its ‘current events and global news’ sub-category. This includes the overwhelming majority, although not all, of the sites pertinent to this analysis. To correct for this, we have combined this sub-category with a small number of sites found under other sub-categories – FT.com, Reuters, Wall Street Journal Digital, Metro.co.uk, Archant Regional Network and Northcliffe Newspapers. Our share of page views and time spent analysis is based on the top 50 sites by unique audience from this combined list of sites.
A4.120 Following the outcome of a competitive tender process, from 2013 onwards, comScore will replace Nielsen as UKOM’s measurement partner.
Annex 4: news consumption in the UK
34
Cross-media research
A4.121 Ofcom commissioned Kantar Media to undertake a quantitative survey. This was a face-to-face survey among a representative sample of 2,379 adults in the UK. Respondents were asked which platforms and sources they used ‘nowadays’ for news and the frequency which they used each source.
A4.122 The analysis in this report groups responses by wholesale news provider (Sky, ITN, BBC etc) and retail news providers (BBC, ITV1, Sky News etc). The quantitative consumer research includes analysis of the share of each cross-platform news provider, based on the number of times each individual news source is cited by respondents, and the frequency with which each is used. An individual news source is, for example, a specific television station, radio station, newspaper title or website.
A4.123 Each provider’s share is based on the total number of responses for each individual source, across television, radio, daily and weekly newspapers and the internet. If a respondent uses more than one source from a particular provider, it is counted each time. The share of each provider is then calculated as the aggregated number of responses in thousands for that provider, expressed as a proportion of all responses for all news sources measured in the survey. Frequency is used to weight the references. Sources are up-weighted if they are used more frequently and down-weighted if they are used less often.
A4.124 Reach describes the proportion of respondents who say that they use each news source, platform, or provider on a regular basis. The reach figures for media providers are calculated based on the proportion of respondents who say they use at least one news source provided by each media group ‘nowadays’. For example, if a respondent says that they use both the BBC One and BBC website for their news on a regular basis, they will be represented once in the reach figure for the BBC. The reach figures for media owners are calculated in a similar way.
A4.125 The statement uses analysis by both wholesale news providers and retail providers. Information on how these categories are grouped can be found in the appendix to Kantar Media’s research report.