Embed Size (px)
Citation preview

1 Non- Confidential
Annex 1
Confidential
Critique of Ofcom analysis of UMTS site counts at different operating frequencies

1 Non- Confidential
Annex 2
Confidential
Critique of the cost of clearing and releasing 900MHz spectrum

1 Non- Confidential
Annex 3
Confidential
The benefit from competition

1 Non- Confidential
Annex 4
In the low scenario, it is not cost effective for any operator to deploy UMTS at 900MHz – primarily because in Ofcom’s view the level of demand for mobile data is insufficient to require deployment as 900MHz in preference to 2100MHz, so all operators provide such services at 2100MHz.
Break points
This annex analyses in more detail the subject matter of the breakpoints section in Part 2 of the main body of Vodafone’s response.
A key component in Ofcom’s analysis is the concept of breakpoints – the levels of demand at which the likely behaviour of the five mobile operators vary. In principle the behaviours vary as follows:
In the medium scenario, the 900 MHz incumbents deploy UMTS 900, and the 2100MHz operators (some or all depending on the volume) can supply an equivalent mobile data service at 2100MHz, although there may or may not be a cost advantage in the 2100MHz operators having access to 900MHz spectrum.
In the high scenario, the level of demand for high speed data services is such that the 2100MHz operators cannot compete1
Clearly the set of consumer benefits and detriments that arise from the significant variations in outcomes vary substantially, so it is important to establish in what circumstances each of the significance scenarios are likely to arise. The boundaries between the low and the medium significance scenarios, and between the two versions of the medium (distinguished by whether all 2100MHz operators or just the RAN pair will match at 2100MHz) and between the medium and the high are established by Ofcom in terms of the relative extent of roll-out required at 900MHz and 2100MHz, which is a product of the anticipated level of demand for data services.
This annex addresses two issues in turn: do the breakpoints correspond to any particular level of demand, and how has Ofcom calculated the locations of the breakpoints? In both issues, Ofcom’s work is found to be lacking.
, so high quality data services are only provided by the 900MHz incumbents, restricting the level of competition and increasing the cost to the consumer.
1 Vodafone annex 3 discusses what an inability to compete, and exiting the high quality data market may actually mean
Do the breakpoints correspond to any particular level of demand?
One problem with Ofcom’s scenario analysis is that it appears to work from a false principle, i.e. that operators will choose to compete in, or “exit” from the market for high quality mobile data depending upon the level of network deployment required, so that on a simplistic basis:

2 Non- Confidential
If less than 4,000 900MHz sites are required, nobody will build them – all UMTS expansion will be at 2100MHz.
If 4,001-4,499 900MHz sites are required, then the two incumbent 900MHz operators will build them, and the other three operators will each choose to build up to 4,500 extra 2100MHz sites instead so that all five operators will compete.
If exactly 4,500 900MHz sites are required, then the two incumbent operators will build them and the RAN pair of operators will build 13,500 sites at 2100MHz, so that four operators will compete, and the fifth operator will “exit” the market.
If more than 4,500 900MHz sites are required, then the two incumbent operators will build them and only these operators will be able to compete – the other three operators will “exit” the high speed mobile data market.
So the breakpoints are a very real expression of where the operators’ behaviour changes. But the number of sites is obviously not an objective breakpoint in itself, merely hopefully a logical expression of the underlying variables defined by Ofcom in annex 11, i.e. the size of the market as in terms of the volume of traffic, the minimum acceptable transmission speed, and the degree of indoor coverage. The diagram shown by Vodafone in Part 2 is repeated here:
1MB 30MB
384kbps 2.4mbps
Less More
breakpoint 1 breakpoint 3
Data volumes per user
Transmission speed
Indoor penetration
LOW MEDIUM HIGH
Figure 1: positioning of the significance scenarios along the data dimensions
Vodafone considers that it is important that an attempt should be made to interpret Ofcom’s breakpoints as currently expressed in relative cell site deployment, into these three underlying dimensions. In fact nowhere in Ofcom’s scenario analysis is this issue considered - further nowhere is there any consideration of what revenue can be achieved in each of the significance scenarios, and in the low, base and medium variants inside them that are used in the scenario analysis. It is the interaction between revenue, traffic volumes, QoS and necessary network deployment that defines more realistically how individual operators will react. So a necessary first step, and one omitted from Ofcom’s analysis, is to attempt to relate Ofcom’s breakpoints into forecasts of traffic demand, to see if these breakpoints might plausibly indicate differentiation of action for the different operator types. In a subsequent section of this annex Vodafone will evaluate Ofcom’s method for determining the breakpoints, but for the moment the question is – where are these breakpoints actually located along the data dimensions of volume, speed and penetration, and
3 Non- Confidential
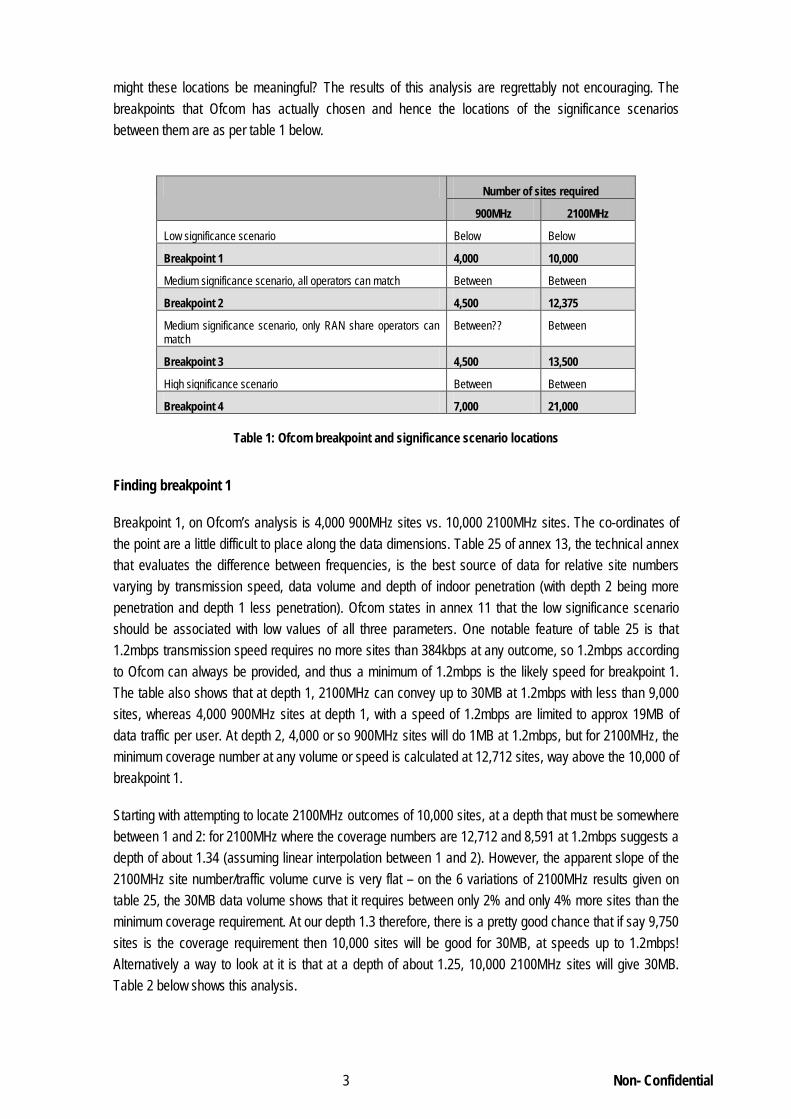
might these locations be meaningful? The results of this analysis are regrettably not encouraging. The breakpoints that Ofcom has actually chosen and hence the locations of the significance scenarios between them are as per table 1 below.
Number of sites required
900MHz 2100MHz
Low significance scenario Below Below
Breakpoint 1 4,000 10,000
Medium significance scenario, all operators can match Between Between
Breakpoint 2 4,500 12,375
Medium significance scenario, only RAN share operators can match
Between?? Between
Breakpoint 3 4,500 13,500
High significance scenario Between Between
Breakpoint 4 7,000 21,000
Table 1: Ofcom breakpoint and significance scenario locations
Finding breakpoint 1
Breakpoint 1, on Ofcom’s analysis is 4,000 900MHz sites vs. 10,000 2100MHz sites. The co-ordinates of the point are a little difficult to place along the data dimensions. Table 25 of annex 13, the technical annex that evaluates the difference between frequencies, is the best source of data for relative site numbers varying by transmission speed, data volume and depth of indoor penetration (with depth 2 being more penetration and depth 1 less penetration). Ofcom states in annex 11 that the low significance scenario should be associated with low values of all three parameters. One notable feature of table 25 is that 1.2mbps transmission speed requires no more sites than 384kbps at any outcome, so 1.2mbps according to Ofcom can always be provided, and thus a minimum of 1.2mbps is the likely speed for breakpoint 1. The table also shows that at depth 1, 2100MHz can convey up to 30MB at 1.2mbps with less than 9,000 sites, whereas 4,000 900MHz sites at depth 1, with a speed of 1.2mbps are limited to approx 19MB of data traffic per user. At depth 2, 4,000 or so 900MHz sites will do 1MB at 1.2mbps, but for 2100MHz, the minimum coverage number at any volume or speed is calculated at 12,712 sites, way above the 10,000 of breakpoint 1.
Starting with attempting to locate 2100MHz outcomes of 10,000 sites, at a depth that must be somewhere between 1 and 2: for 2100MHz where the coverage numbers are 12,712 and 8,591 at 1.2mbps suggests a depth of about 1.34 (assuming linear interpolation between 1 and 2). However, the apparent slope of the 2100MHz site number/traffic volume curve is very flat – on the 6 variations of 2100MHz results given on table 25, the 30MB data volume shows that it requires between only 2% and only 4% more sites than the minimum coverage requirement. At our depth 1.3 therefore, there is a pretty good chance that if say 9,750 sites is the coverage requirement then 10,000 sites will be good for 30MB, at speeds up to 1.2mbps! Alternatively a way to look at it is that at a depth of about 1.25, 10,000 2100MHz sites will give 30MB. Table 2 below shows this analysis.

4 Non- Confidential
2100MHz operator, 2 carriers
Site numbers required at 1.2mbps
Daily usage 30MB vs. coverage
level Coverage 1MB 3MB 10MB 15MB 20MB 30MB
Depth 2 12,712 12,715 12,742 12,836 12,903 12,969 13,103 +3%
Depth 1 8,591 8,593 8,617 8,702 8,763 8,824 8,945 +4%
Difference 4,121 4,122 4,125 4,134 4,140 4,145 4,158
Target site number 10,000 10,000 10,000 10,000 10,000 10,000 10,000
Difference from higher value 2,712 2,715 2,742 2,836 2,903 2,969 3,103
Interpolated depth for target 1.34 1.34 1.34 1.31 1.30 1.28 1.25
Table 2: 2100MHz with 2 carriers, interpolated depths at 1.2mbps
Conducting a similar interpolation for 900MHz, 4,020 sites is the coverage requirement at depth 2, up to 1.2mbps, and 2,901 for depth 1 – thus depth 1.98 or so is possible. But one carrier at 900MHz is more capacity limited than the two carriers at 2100MHz, so if we read along the data volumes at 1.2mbps at the two depths, and linearly interpolate between them, then 1MB gives a depth of 1.96, 10MB a depth of 1.77, but there is no solution above about 19MB, since depth 1 needs 4,000 sites at this point, and above it, depth 1 is no longer possible. This is shown in table 3 below:
900MHz operator, 1 carriers
Site numbers required at 1.2kbps
Daily usage 30MB vs. coverage
level Coverage 1MB 3MB 10MB 15MB 20MB 30MB
Depth 2 4,020 4,039 4,089 4,257 4,379 4,521 6,157 +53%
Depth 1 2,901 2,919 2,968 3,138 3,296 4,105 6,157 +112%
Difference 1,119 1,120 1,119 1,119 1,083 416 0
Target site number 4,000 4,000 4,000 4,000 4,000 4,000 4,000
Difference from higher value 20 39 87 257 379 521 2,157
Interpolated depth for target 1.98 1.97 1.92 1.77 1.65 No solution
Table 3: 900MHz with one carrier, interpolated depths at 1.2mbps
Since at 15MB the interpolated depth is 1.77, and somewhere around 19MB the depth becomes 1, this suggests that the 1.3 depth is achieved at around 17MB. The results for 900MHz and 2100MHz are summarised in table 4 below:
Interpolated depths at 1.2mbps Daily usage
Coverage 1MB 3MB 10MB 15MB 20MB 30MB
2100MHz operator 1.34 1.34 1.34 1.31 1.30 1.28 1.25
900MHz operator 1.98 1.97 1.92 1.77 1.65 N/s N/s
Table 4: 900MHz and 2100MHz, interpolated depths at 1.2mbps

5 Non- Confidential
Fundamentally therefore it appears that the point at which 900MHz at 4,000 sites and 2100MHz at 10,000 sites must intersect is at a depth of about 1.3 or so somewhere around the 17MB daily volume mark. This therefore is the presumed location of Ofcom’s breakpoint 1.
But if this is so, then breakpoint 1, the top end of the low scenario, and the point at which the incumbent 900MHz operators will find apparently it profitable to switch to UMTS 900, exists at a most peculiar place, where traffic could almost double from 17MB to 30MB with minimal investment at 2100MHz, but any increase in traffic would require considerable further investment at 900MHz, reducing substantially the productive efficiency differential, i.e. the incentive to invest in 900MHz. The transmission speed is already at a respectable 1.2mbps, and the depth is a reasonable 1.3 or so (whatever that may mean in practice). The low significance scenario on this analysis looks to extend some way up from Ofcom’s low extreme of 1MB, 384kbps and low penetration, as figure 2 below illustrates.
1MB 30MB
384kbps 2.4mbps
Less More
breakpoint 1 breakpoint 3
Data volumes per user
Transmission speed
Indoor penetration
LOW MEDIUM HIGH
Figure 2: illustrative view of the extent of the low significance scenario
So why could this point be construed to be a significant one for the 900MHz operators? If above this point volumes are likely to increase above a healthy 17MB per day, it is easy to absorb this at 2100MHz rather than at 900MHz. The 900MHz operators could increase the depth of penetration towards 2, but this will be a relatively subtle improvement, and unless it will increase the traffic volumes substantially (which would then significantly increase the cost of the investment, given the slope of the 900MHz curve) or allow them to charge a significant price premium, it is not obviously a good idea.
The 900MHz incumbents could perhaps increase the speed from 1.2mbps towards 2.4mbps, but again they would need to be certain that they could capture a lot of customers and/or charge a substantial premium for this speed. However one must remember that above this breakpoint it is assumed by Ofcom that the medium scenario exists, where the 2100MHz operators would anyway be able to compete at 2100MHz, so the option to the 900MHz operators of capturing additional customers is not really available.
The only opportunity therefore available to the 900MHz incumbents that is cheaper at 900MHz than at 2100MHz is to increase the depth, not the volume – but how would this bring in extra revenue, as compared to an increase in volume, which as can be seen can be accommodated more cheaply at 2100MHz than 900MHz? It is not clear therefore that there is any advantage for the 900MHz operators to commence refarming at this point. Whilst the logic of the existence of a theoretical breakpoint 1 is undeniable, it does not appear to Vodafone that it can be located where Ofcom have put it.
6 Non- Confidential
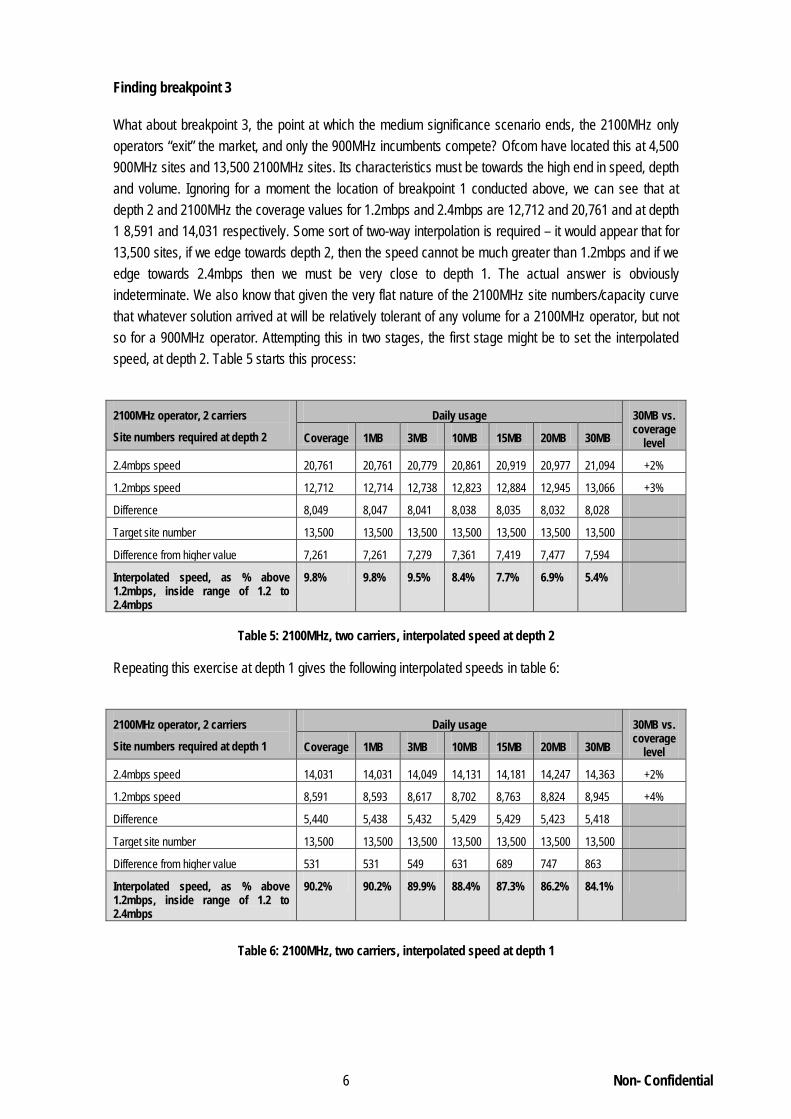
Finding breakpoint 3
What about breakpoint 3, the point at which the medium significance scenario ends, the 2100MHz only operators “exit” the market, and only the 900MHz incumbents compete? Ofcom have located this at 4,500 900MHz sites and 13,500 2100MHz sites. Its characteristics must be towards the high end in speed, depth and volume. Ignoring for a moment the location of breakpoint 1 conducted above, we can see that at depth 2 and 2100MHz the coverage values for 1.2mbps and 2.4mbps are 12,712 and 20,761 and at depth 1 8,591 and 14,031 respectively. Some sort of two-way interpolation is required – it would appear that for 13,500 sites, if we edge towards depth 2, then the speed cannot be much greater than 1.2mbps and if we edge towards 2.4mbps then we must be very close to depth 1. The actual answer is obviously indeterminate. We also know that given the very flat nature of the 2100MHz site numbers/capacity curve that whatever solution arrived at will be relatively tolerant of any volume for a 2100MHz operator, but not so for a 900MHz operator. Attempting this in two stages, the first stage might be to set the interpolated speed, at depth 2. Table 5 starts this process:
2100MHz operator, 2 carriers
Site numbers required at depth 2
Daily usage 30MB vs. coverage
level Coverage 1MB 3MB 10MB 15MB 20MB 30MB
2.4mbps speed 20,761 20,761 20,779 20,861 20,919 20,977 21,094 +2%
1.2mbps speed 12,712 12,714 12,738 12,823 12,884 12,945 13,066 +3%
Difference 8,049 8,047 8,041 8,038 8,035 8,032 8,028
Target site number 13,500 13,500 13,500 13,500 13,500 13,500 13,500
Difference from higher value 7,261 7,261 7,279 7,361 7,419 7,477 7,594
Interpolated speed, as % above 1.2mbps, inside range of 1.2 to 2.4mbps
9.8% 9.8% 9.5% 8.4% 7.7% 6.9% 5.4%
Table 5: 2100MHz, two carriers, interpolated speed at depth 2
Repeating this exercise at depth 1 gives the following interpolated speeds in table 6:
2100MHz operator, 2 carriers
Site numbers required at depth 1
Daily usage 30MB vs. coverage
level Coverage 1MB 3MB 10MB 15MB 20MB 30MB
2.4mbps speed 14,031 14,031 14,049 14,131 14,181 14,247 14,363 +2%
1.2mbps speed 8,591 8,593 8,617 8,702 8,763 8,824 8,945 +4%
Difference 5,440 5,438 5,432 5,429 5,429 5,423 5,418
Target site number 13,500 13,500 13,500 13,500 13,500 13,500 13,500
Difference from higher value 531 531 549 631 689 747 863
Interpolated speed, as % above 1.2mbps, inside range of 1.2 to 2.4mbps
90.2% 90.2% 89.9% 88.4% 87.3% 86.2% 84.1%
Table 6: 2100MHz, two carriers, interpolated speed at depth 1

7 Non- Confidential
Finally, putting these two results together, one can attempt to interpolate a depth when the speed is assumed to be say one third above 1.2mbps (or at least one third along the range between 1.2mbps and 2.4mbps). This gives the following interpolated depths:
2100MHz operator, 2 carriers
Interpolated speeds above 1.2mbps and depths
Daily usage
Coverage 1MB 3MB 10MB 15MB 20MB 30MB
At depth 2 9.8% 9.8% 9.5% 8.4% 7.7% 6.9% 5.4%
At depth 1 90.2% 90.2% 89.9% 88.4% 87.3% 86.2% 84.1%
Target interpolated speed 33.3% 33.3% 33.3% 33.3% 33.3% 33.3% 33.3%
Interpolated depth at this speed 1.71 1.71 1.70 1.69 1.68 1.67 1.64
Table 7: 2100MHz operator, interpolated depth at given speed
This exercise must now be repeated for the 900MHz network, where breakpoint 3 is assessed by Ofcom at 4,500 sites. If we stick with 30MB there is no solution at any speed or depth. At coverage levels at depth 2, 1.2mbps is 4,020 sites, and 2.4mbps 6,566 sites, and at depth 1 site numbers are 2,901 and 4,738 respectively. So initially interpolating speeds at depth 2 in table 8:
900MHz operator, 1 carrier
Site numbers required at depth 2
Daily usage 30MB vs. coverage
level Coverage 1MB 3MB 10MB 15MB 20MB 30MB
2.4mbps speed 6,566 6,579 6,626 6,789 6,905 7,022 7,254 +10%
1.2mbps speed 4,020 4,039 4,087 4,257 4,379 4,521 6,157 +53%
Difference 2,546 2,540 2,539 2,532 2,526 2,501 1,097
Target site number 4,500 4,500 4,500 4,500 4,500 4,500 4,500
Difference from higher value 2,066 2,079 2,126 2,289 2,405 2,522 2,754
Interpolated speed, as % above 1.2mbps, inside range of 1.2 to 2.4mbps
18.9% 18.1% 16.3% 9.6% 4.8% No solution
Table 8: 900MHz operator, interpolated speed at depth 2
Next one can interpolate speeds at depth 1 in table 9:
900MHz operator, 1 carrier
Site numbers required at depth 1
Daily usage 30MB vs. coverage
level Coverage 1MB 3MB 10MB 15MB 20MB 30MB
2.4mbps speed 4,738 4,752 4,798 4,961 5,077 5,194 5,896 +24%
1.2mbps speed 2,901 2,919 2,968 3,138 3,296 4,105 6,157 +112%
Difference 1,837 1,833 1,830 1,823 1,781 1,089 261
Target site number 4,500 4,500 4,500 4,500 4,500 4,500 4,500
Difference from higher value 238 252 298 461 577 694 1,396
Interpolated speed, as % above 1.2mbps, inside range of 1.2 to 2.4mbps
87.0% 86.3% 83.7% 74.7% 67.6% 36.3% N/s
Table 9: 900MHz operator, interpolated speed at depth 1

8 Non- Confidential
Then putting these two together and interpolating a depth at a 33% target speed, as for 2100MHz, gives the following:
900MHz operator, 1 carrier
Interpolated speeds above 1.2mbps and depths
Daily usage
Coverage 1MB 3MB 10MB 15MB 20MB 30MB
At depth 2 18.9% 18.1% 16.3% 9.6% 4.8% N/s N/s
At depth 1 87.0% 86.3% 83.7% 74.7% 67.6% 36.3% N/s
Target interpolated speed 33.3% 33.3% 33.3% 33.3% 33.3% 33.3% 33.3%
Interpolated depth at this speed 1.79 1.78 1.75 1.64 1.55 N/s N/s
Table 10: 900MHz operator, interpolated depth at a given speed
Finally then plotting the two interpolated depth curves at 900MHz and 2100MHz in table 11gives the following:
Interpolated depths at 33% above 1.2mbps Daily usage
Coverage 1MB 3MB 10MB 15MB 20MB 30MB
2100MHz operator 1.71 1.71 1.70 1.69 1.68 1.67 1.64
900MHz operator 1.79 1.78 1.75 1.64 1.55 N/s N/s
Table 11: 2100MHz and 900MHz depths at a given speed
The two lines intersect somewhere around 7MB. Varying the speed to 20%, 50% and 75% of the range between 1.2mpbs and 2.4mbps gives alternative results as in table 12 below:
Interpolated depths above 1.2mbps
4,500 vs. 13,500 sites solution
Daily usage
Coverage 1MB 3MB 7MB 10MB 15MB 20MB 30MB
At 20% above
1.2mbps
2100MHz operator 1.87 1.87 1.87 1.86 1.86 1.85 1.83 1.81
900MHz operator 1.98 1.97 1.94 1.88 1.84 1.76 N/s N/s
At 33% above
1.2mbps
2100MHz operator 1.71 1.71 1.70 1.69 1.69 1.68 1.67 1.64
900MHz operator 1.79 1.78 1.75 1.68 1.64 1.55 N/s N/s
At 50% above
1.2mbps
2100MHz operator 1.50 1.50 1.50 1.49 1.48 1.47 1.46 1.43
900MHz operator 1.54 1.53 1.50 1.43 1.38 1.28 N/s N/s
At 75% above
1.2mbps
2100MHz operator 1.19 1.19 1.19 1.17 1.17 1.15 1.14 1.12
900MHz operator 1.18 1.17 1.13 1.05 N/s N/s N/s N/s
Table 12: 2100MHz and 900MHz depths at varying speeds
So at a 20% premium above 1.2mbps, the breakpoint appears to exist at around 9MB, at 33% at around 7MB, at 50% at around 3MB, and at 75% there is no intersection point. Some mid-point value of this might be a speed premium of 40%, a data volume of 5-6MB and a depth of 1.6. This is a very strange point for breakpoint 3 to sit, however.

9 Non- Confidential
The location of breakpoint 3 is, under Ofcom’s analysis, where the data demands become too great in speed, depth and volume so that the 2100MHz operators choose not to compete, and exit the high speed data market. It is very difficult to see that 4,500 900MHz sites and 13,500 2100MHz sites is the right point for this – if we assume the constraint imposed by the 4,500 sites at 900MHz of 5-6MB applies to the breakpoint location, a very significant five-fold increase of volume above this could be accommodated with minimal increase in cell site deployment at 2100MHz, so exiting the market would not be a rational decision.
But the crux of Ofcom’s approach is not so much that these operators voluntarily exit the market. It is rather that above breakpoint 3, the data demands of customers sensitive to “high quality data” are such that these customers will all leave the 2100MHz operators for the 900MHz operators. But why should they at this point, when it is clear that the 2100MHz operators could increase the throughput of their network by 400% to 30MB with minimal further investment?
Comparing breakpoints 1 and 3, breakpoint 1 thus might be at 17MB, depth 1.3 and speed 1.2mbps, and breakpoint 3 at 5-6MB, (a third of the volume), depth 1.6 (25% deeper), and a 40% or so premium on speed2. These breakpoints do not appear mutually coherent. They would appear to suggest that as one moves across the medium significance scenario from the low end to the high end, the volume of data transmitted falls by two-thirds, whilst the speed increases by a relatively small 40% and the depth by 25%3. This does not appear to make much sense.
Therefore Vodafone concludes that the fundamental starting point for Ofcom’s scenario analysis, the breakpoints at which operators’ actions change from competing at 2100MHz, deploying 900MHz and competing at 2100MHz, and deploying at 900MHz and not competing do not appear to be valid in terms of differentiation of data volumes, speed and depth of penetration. This undermines therefore the whole of Ofcom’s scenario analysis.
Break point 1, the lower end, is the balance point at which the incumbent 900MHz operators would/would not find it profitable to rollout UMTS 900. Ofcom arrives at this point by comparing the cost of clearance for
Ofcom’s method for locating the boundaries between the scenarios
Having concluded that Ofcom’s breakpoints are improperly located, it is worth reviewing how Ofcom has actually identified and positioned the breakpoints, because it turns out that the work is riddled with errors and inconsistencies. The method Ofcom has used is totally reliant on a few simple balances between disparate cost/benefit elements that in Vodafone’s view are interpreted in a manner inconsistent with Ofcom’s own analysis in other annexes of the consultation.
The break points at either end of the medium significance scenario are defined by Ofcom in A7.37 onwards:
2 It proved too difficult to even attempt to find breakpoint 2! 3 Given that the depth/sites and speed/sites relationship between 1 and 2 and 1.2mbps and 2.4mpbs is probably not a straight line but a rising curve, the gap between the two breakpoints in terms of speed and depth is probably even less than the simple linear comparison suggests.

10 Non- Confidential
own use (£40-60m per operator) from annex 16 with the relative costs of 900MHz vs. 2100MHz rollout, or profile A minus profile C from table 3 of annex 7. “We think it is plausible that when the additional cost of matching in the interim using 2100MHz spectrum is less than £150m, the 900MHz operators will not clear 900MHz. Although this is significantly higher than the high estimate of the cost of clearing one block, we feel that this takes account of the uncertainty over the level of consumer interest in improved mobile broadband networks under the low significance scenario.4
Break point 3 is the cost difference above which Ofcom believes no 2100MHz operator will match the 900MHz operators’ UMTS rollout. Ofcom defines two alternative reasons, affordability and practicality. “The affordability constraint for an operator is the point at which the cost difference is likely to be comparable to the operator’s gross profits from providing improved mobile broadband services
” Effectively Ofcom have included on the “don’t deploy UMTS 900” side of the balance an uncertainty allowance of around £100m.
Tables 3 and 4 of annex 7 show this break point as being around 4,000 sites at 900MHz, and its equivalent of 10,000 sites at 2100MHz. In fact substituting these values into the Ofcom cost differences model (as modified for annex 7 purposes by Ofcom’s letter to Vodafone dated 16th March as discussed in Vodafone annex 5 below) actually gives the costs at this point as £512m for 900MHz and £685m for 2100MHz, a difference of £173m, not the £150m quoted.
5
Ofcom saves itself from having to use this very theoretically defined constraint by the level established by the practicality constraint, which is defined as follows. “The practicality break point represents the maximum cost difference at which it is feasible for the 2100MHz operator to match. We estimate this cost difference by capping the site difference with the maximum number of 2100MHz sites that can be deployed
”. Ofcom calculates this level using the Cournot benefits model from annex 9. For the RAN sharing operator, this is calculated as the gross profits of the two operators in a four player market. Ofcom quotes these numbers as £900m on a commercial discount rate basis, or £1.4bn using a social discount rate. These numbers do not naturally fall out of the impacts.xls spreadsheet developed for annex 9, but by hunting for them, they can be found.
6.” Ofcom estimates the maximum annual throughput of new site builds at 1,500, so starting from 9,000 sites in 2010, by the end of the three year interim period a 2100MHz operator could have 13,500 sites in service. From annex 13, a ratio of 1:3 sites gives an approximate requirement of 4,500 sites. Ofcom states in A7.52.1 that from the cost differences model, the difference between UMTS 900 deployment of 4,500 sites and UMTS 2100 deployment of 13,500 sites for the RAN operator is £1.3bn: “this is the difference between the combined costs of both RAN shared 2100MHz operators and a single 900MHz operator”. Vodafone believes that Ofcom has got this principle wrong – Ofcom should be comparing the RAN pair at both 900MHz and 2100MHz, i.e. two operators at both frequencies7
4 A7.39 & 40 of the consultation 5 A7.45 of the consultation 6 A7.50.1 of the consultation 7 Indeed elsewhere in annex 7 Ofcom, when comparing 900MHz against 2100MHz for the RAN pair, is comparing the cost of two RAN sharing operators at 2100MHz with the cost of two RAN sharing operators at 900MHz (see Ofcom tables 3, and 7 of annex 7 for example)
, so the productive efficiency difference is £902m, not the £1.3bn reported by Ofcom, but as in either case this is below the affordability constraint level of £1.4bn, the practicability constraint applies.
11 Non- Confidential
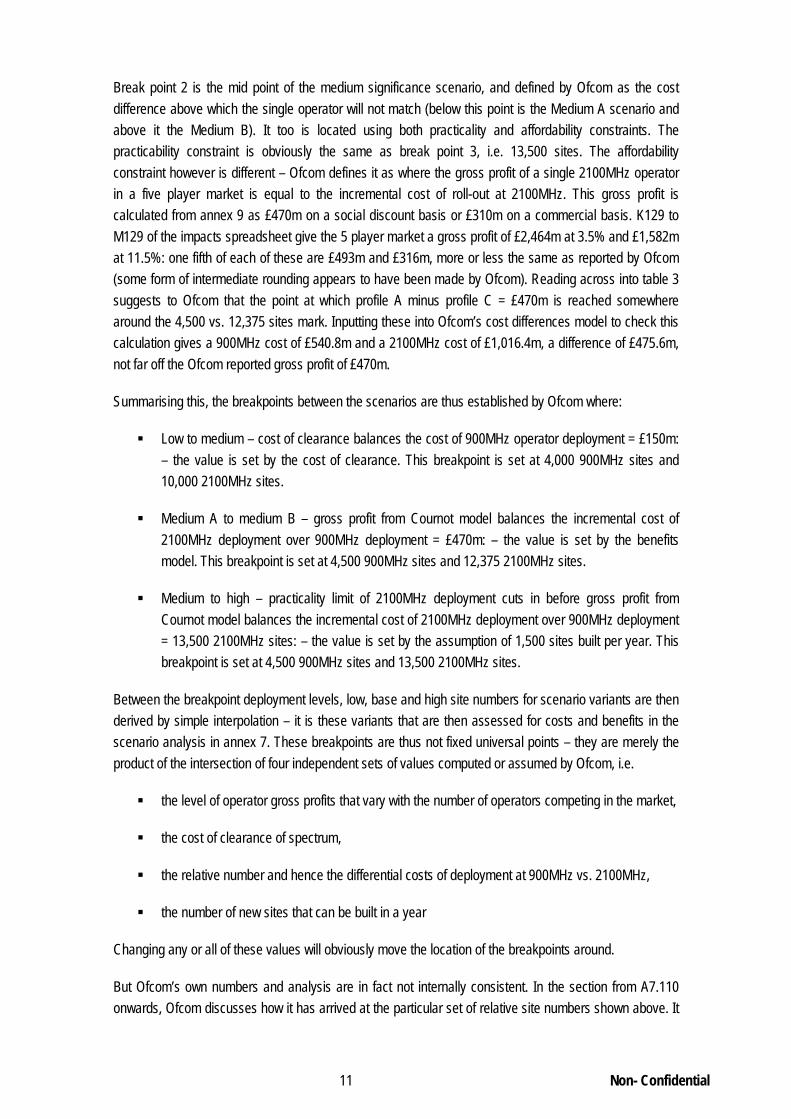
Break point 2 is the mid point of the medium significance scenario, and defined by Ofcom as the cost difference above which the single operator will not match (below this point is the Medium A scenario and above it the Medium B). It too is located using both practicality and affordability constraints. The practicability constraint is obviously the same as break point 3, i.e. 13,500 sites. The affordability constraint however is different – Ofcom defines it as where the gross profit of a single 2100MHz operator in a five player market is equal to the incremental cost of roll-out at 2100MHz. This gross profit is calculated from annex 9 as £470m on a social discount basis or £310m on a commercial basis. K129 to M129 of the impacts spreadsheet give the 5 player market a gross profit of £2,464m at 3.5% and £1,582m at 11.5%: one fifth of each of these are £493m and £316m, more or less the same as reported by Ofcom (some form of intermediate rounding appears to have been made by Ofcom). Reading across into table 3 suggests to Ofcom that the point at which profile A minus profile C = £470m is reached somewhere around the 4,500 vs. 12,375 sites mark. Inputting these into Ofcom’s cost differences model to check this calculation gives a 900MHz cost of £540.8m and a 2100MHz cost of £1,016.4m, a difference of £475.6m, not far off the Ofcom reported gross profit of £470m.
Summarising this, the breakpoints between the scenarios are thus established by Ofcom where:
Low to medium – cost of clearance balances the cost of 900MHz operator deployment = £150m: – the value is set by the cost of clearance. This breakpoint is set at 4,000 900MHz sites and 10,000 2100MHz sites.
Medium A to medium B – gross profit from Cournot model balances the incremental cost of 2100MHz deployment over 900MHz deployment = £470m: – the value is set by the benefits model. This breakpoint is set at 4,500 900MHz sites and 12,375 2100MHz sites.
Medium to high – practicality limit of 2100MHz deployment cuts in before gross profit from Cournot model balances the incremental cost of 2100MHz deployment over 900MHz deployment = 13,500 2100MHz sites: – the value is set by the assumption of 1,500 sites built per year. This breakpoint is set at 4,500 900MHz sites and 13,500 2100MHz sites.
Between the breakpoint deployment levels, low, base and high site numbers for scenario variants are then derived by simple interpolation – it is these variants that are then assessed for costs and benefits in the scenario analysis in annex 7. These breakpoints are thus not fixed universal points – they are merely the product of the intersection of four independent sets of values computed or assumed by Ofcom, i.e.
the level of operator gross profits that vary with the number of operators competing in the market,
the cost of clearance of spectrum,
the relative number and hence the differential costs of deployment at 900MHz vs. 2100MHz,
the number of new sites that can be built in a year
Changing any or all of these values will obviously move the location of the breakpoints around.
But Ofcom’s own numbers and analysis are in fact not internally consistent. In the section from A7.110 onwards, Ofcom discusses how it has arrived at the particular set of relative site numbers shown above. It

12 Non- Confidential
makes the point that “multiple combinations of 900MHz and 2100MHz site numbers can produce the same cost difference. We have therefore selected site numbers (and ratio of 2100MHz to 900MHz site numbers) that appear reasonable and consistent with a particular outcome.8
Break point 1: 4,000 vs. 10,000 (ratio = 2.5)
” The starting point for this analysis, as Ofcom makes clear is breakpoint 3, which has 13,500 and 4,500 sites. The site ratios for breakpoints 1 and 2 are then set with reference to the ratio at breakpoint 3. Whilst the 13,500 is an outcome of the practicality constraint (9,000 sites plus 3 years of 1,500 sites per year), A7.50.3 explicitly says “from the technical analysis (set out in annex 13) we know that a ratio of 3:1 for 2100MHz sites to 900MHz sites is plausible”. So the 4,500 sites result has been created by simple division of 13,500 by 3.
The next stage is described in A7.111.2: “as we move to lower cost differences, low frequency spectrum becomes less significant, so it is intuitive that the ratio of 2100MHz to 900MHz site numbers should fall. The number of sites should also fall. Using these two conditions, we are limited to a few combinations of 2100MHz and 900MHz sites numbers that produce the cost differences at break points 1 and 2.” In 7.111.3 “using this approach we arrive at the following site numbers (900MHz vs. 2100MHz) at each break point:
Break point 2: 4,500 vs. 12,375 (ratio = 2.75)
Breakpoint 3: 4,500 vs. 13,500 (ratio = 3)”
In other words, the entirety of the sophisticated detail of annex 13 to determine the real difference in site numbers between the frequencies has been condensed into a single ratio of 1:3 where 13,500 2100MHz sites is the independent variable, with its value derived from an estimate that 1,500 new sites is the practical limit for an operator, and then alternative ratios and results derived at lower levels to back-solve a predetermined cost difference required in break points 1 and 2, i.e. £150m and £470m respectively. The phrase “house of cards” comes to mind.
One point that Ofcom does not appear to consider is the fact that this smoothed ratio gives the somewhat perplexing result that breakpoints 2 and 3 require exactly the same number of 900MHz sites. To recap, inside breakpoints 2 and 3 is the medium B significance scenario, defined as that level of demand where only the RAN share pair will choose to match at 2100MHz. Below breakpoint 2 all 2100MHz operators can match. Above breakpoint 3 the level of demand is too great for any 2100MHz operator to attempt to match. But is it clearly established in the technical annex that as the volume of demand rises, the number of sites required rises. So how is it simultaneously possible for breakpoints 2 and 3 to have the same number of 900MHz sites and for the level of demand to be greater at breakpoint 3 than at breakpoint 2? This is made more troublesome from the fact on Ofcom’s own analysis the site deployment/traffic volume curve rises fairly steeply for 900MHz and much less so for 2100MHz, so to assume the reverse is a bit problematic.
The only apparent way to resolve this paradox is to assume that 4,500 sites is a minimum coverage number for a particular level of service, so that as demand rises from point 2 to point 3 the number of 900MHz sites does not change – and somehow also assume there is not a matching position on 2100MHz
8 A7.111 of the consultation

13 Non- Confidential
so that the number of 2100MHz sites does increase. Ofcom however has made no such unlikely argument. Vodafone is more inclined to the view that Ofcom has simply made an error in logic – its scenario analysis has become too unwieldy to understand!
As mentioned above, the starting point for all the site numbers is Ofcom’s judgement that a 1:3 ratio applies at 13,500 2100MHz sites. Vodafone is however not as sanguine as Ofcom that a ratio of 1:3 can actually be applied. Ofcom refers9 to table 5 of annex 13 for corroboration. This table actually supplies 9 alternative values with individual and average ratios as shown on table 13 below:
Scenario Sites required Relative ratio
Data rate Usage Depth 900 MHz, 1 carrier 2100MHz, 2 carriers
A 0.4mbps 1MB 1 2,900 8,600 1:2.97
B 0.4mbps 30MB 1 6,800 9,000 1:1.32
C 0.4mbps 1MB 2 4,000 12,700 1:3.18
D 2.4mbps 30MB 2 7,300 21,100 1:2.89
E 0.4mbps 30MB 2 6,800 13,100 1:1.93
F 2.4mbps 30MB 1 5,900 14,400 1:2.44
G 2.4mbps 40MB 2 7,900 21,200 1:2.68
H 2.4mbps 60MB 2 11,800 21,400 1:1.81
I 2.4mbps 30MB 2 5,900 13,400 1:2.27
Average 6,588 14,989 1:2.27
Table 13: Ofcom view of relative number of sites required under varying demand and supply assumptions
In Vodafone’s view, these results do not justify the somewhat cavalier assumption of a 1:3 ratio. The average of the 9 scenarios is 1:2.27, and the only result that approximates Ofcom’s breakpoint 3 is C – but this is a situation with a low transmission speed and a low data volume. It should be remembered that breakpoint 3 is between the medium and high significance scenarios, i.e. it should be assumed that both the speed of transmission and the data volumes are reasonably high. The closest option that satisfies this would appear to be option I, where the site numbers are 5,900 & 13,400. This suggests to Vodafone that the 1:3 site ratio of breakpoint 3 is simply wrong – on any reasonable analysis, given that data values10 must be on the high rather than the low side, when the number of 2100MHz sites is assumed to be 13,500 the number of 900MHz sites should be around 5,900 to 6,100. This correction should also resolve the anomaly of the 4,500 site number being common to both breakpoints 2 and 3. Looking at the Ofcom cost differences model, a 6,000 to 13,500 sites result would give a 900MHz cost of £627.6m and a 2100MHz cost of £1,270.9m for a single operator, so when comparing on a 145% uplift for the RAN pair the difference is £933m, still comfortably below the other potential breakpoint constraint of affordability, which Ofcom calculated as £1.4bn11
Further, a large part of the breakpoint analysis appears to be generated from the assumption that an operator can build 1,500 new sites every year. This is not an absolute number, except in annex 7: annex
.
9 In A7.50.3 of the consultation 10 In terms of volume, speed and penetration 11 But actually slightly above the value calculated by Vodafone of £901.6m, as above

14 Non- Confidential
12 actually considers two alternatives, 1,000 and 1,500. However by the time the writer of annex 7 starts work, this qualification disappears, and the 1,500 sites per year, or 13,500 by end 2013 becomes the only option. Switching to 1,000 sites per year would reduce breakpoint 3 (and 2 for that matter, since the practicality constraint would now cut in before the affordability constraint) to 12,000 2100 MHz sites. This would substantially revise the scenario analysis.
The other significant observation that can be made from the tables of site numbers at alternate frequencies is that Ofcom’s statement captured above “as we move to lower cost differences, low frequency spectrum becomes less significant, so it is intuitive that the ratio of 2100MHz to 900MHz site numbers should fall” is the exact opposite of the output from Ofcom’s technical analysis. This again points to the lack of coherence between the different strands of Ofcom’s case. To Vodafone the intuition is that more sites are needed for coverage at 2100MHz than at 900MHz, but that this greater number of sites gives more capacity, so that as demand rises, the number of additional sites required at 900MHz rises much faster than at 2100MHz, particularly as each operator has at least two carriers available at 2100MHz and there is only one available at 900MHz. The implication of this is that the site ratio is greatest when the number of sites is lowest, and flattens as the number of sites rises. This is a trend that can be seen in the tables of relative deployment above. So, if one assumes that breakpoint 3 is somewhere around scenario I above, with a 1:2.25 ratio, then as traffic and site numbers decrease from this the ratio will rise: the breakpoint 2 ratio might be around 1:2.6, and breakpoint 1 around 1:3, not the 1:2.5 assumed by Ofcom.
Given that in Ofcom’s analysis breakpoint 2 is where the costs of A - C are around £475m and breakpoint 1 where A-C is £150m, it is possible to look for solutions in the model12
12 Using Ofcom’s cost difference model as is, rather than attempting to adjust it for the errors identified by Vodafone in subsequent sections
where these ratios and results coincide. Breakpoint 2 might thus be 4,750 & 12,350 sites, and breakpoint 1 3,250 and 9,750 sites. The intervening points between the breakpoints can then be derived by interpolation, as in Ofcom’s table 4 of annex 7. Breakpoint 4, the theoretical upper limit of the high significance scenario has not been reviewed or adjusted by Vodafone at this stage, since it is of limited practical effect. Table 14 below also shows possible outputs where breakpoint 3 is constrained to 12,000 sites, although as breakpoints 2 and 3 are then at the same location, presumably there cannot be viable scenarios between them, i.e. in the Medium B significance scenario.

15 Non- Confidential
Ofcom no. of sites, @1,500 new sites pa
Vodafone no. of sites @1,500 new sites pa
Vodafone no. of sites @1,000 new sites pa
At 800/900M
Hz
At 2100
MHz
At 800/900
MHz
At 2100
MHz
At 800/900
MHz
At 2100
MHz
Breakpoint 1 4,000 10,000 3,250 9,750 3,250 9,750
Medium significance scenario
Where all 2100MHz operators can match
Low 4,125 10,594 3,625 10,400 3,750 10,312
Base 4,250 11,188 4,000 11,050 4,250 10,875
High 4,375 11,781 4,375 11,700 4,750 11,438
Breakpoint 2 4,500 12,375 4,750 12,350 5,250 12,000
Medium significance scenario,
where only the RAN pair can match
Low 4,500 12,656 5,062 12,637 No solution No solution
Base 4,500 12,938 5,375 12,925 No solution No solution
High 4,500 13,219 5,687 13,212 No solution No solution
Breakpoint 3 4,500 13,500 6,000 13,500 5,250 12,000
High significance scenario Low 5,125 15,375 6,250 15,375 6,250 15,375
Base 5,750 17,250 6,500 17,250 6,500 17,250
High 6,375 19,125 6,750 19,125 6,750 19,125
Breakpoint 4 7,000 21,000 7,000 21,000 7,000 21,000
Table 14: Ofcom and illustrative Vodafone breakpoint and significance scenario positioning
This substantially revised set of scenarios could produce very different costs of deployment (that are inputs to the scenario analysis) for the 6 (or perhaps only 3) alternatives that sit between breakpoints 1 and 3.
There is one further point on the location of the breakpoints that is most confusing and further undermines Ofcom’s work. Annex 13 primarily examines the relative site deployment between one carrier at 900MHz and two carriers at 2100MHz. Annex 7 as described above uses this information, however imperfectly, to generate pairs of site deployment numbers that are then used in the scenario analysis. But in fact careful scrutiny of annexes 12, 15 and most significantly the cost of deployment model make it clear that what is actually being contemplated is that, not unreasonably, although an operator deploying at 900MHz or 800MHz reduces its stock of 2100MHz equipment, it retains 2100MHz equipment on all sites where UMTS 900 is deployed – this can be readily seen from inspection of the rollout profiles A, B and C in figures 4-6 of annex 7. It is clear that the financial comparison of the cost differences spreadsheet is constructed in the same basis – so the comparison between the deployment profiles is in cost terms between one carrier at 900MHz plus two carriers at 2100MHz and two carriers at 2100MHz.
In reality therefore all deployment models are considering a 900MHz deployment where 2100MHz is retained, i.e. a deployment of one carrier of 900MHz plus two carriers of 2100MHz. But the two plus one vs. two scenario is not a scenario apparently envisaged in the technical model at all, so whilst it is reasonable to expect the minimum coverage site number to be the same in this situation as for a single carrier of 900MHz, there is no indication in the technical model as to how the site deployment/data demand curve for this will be likely to change above the coverage point – so Ofcom has no basis for using the site numbers for the 900MHz operator that it has adopted.
16 Non- Confidential
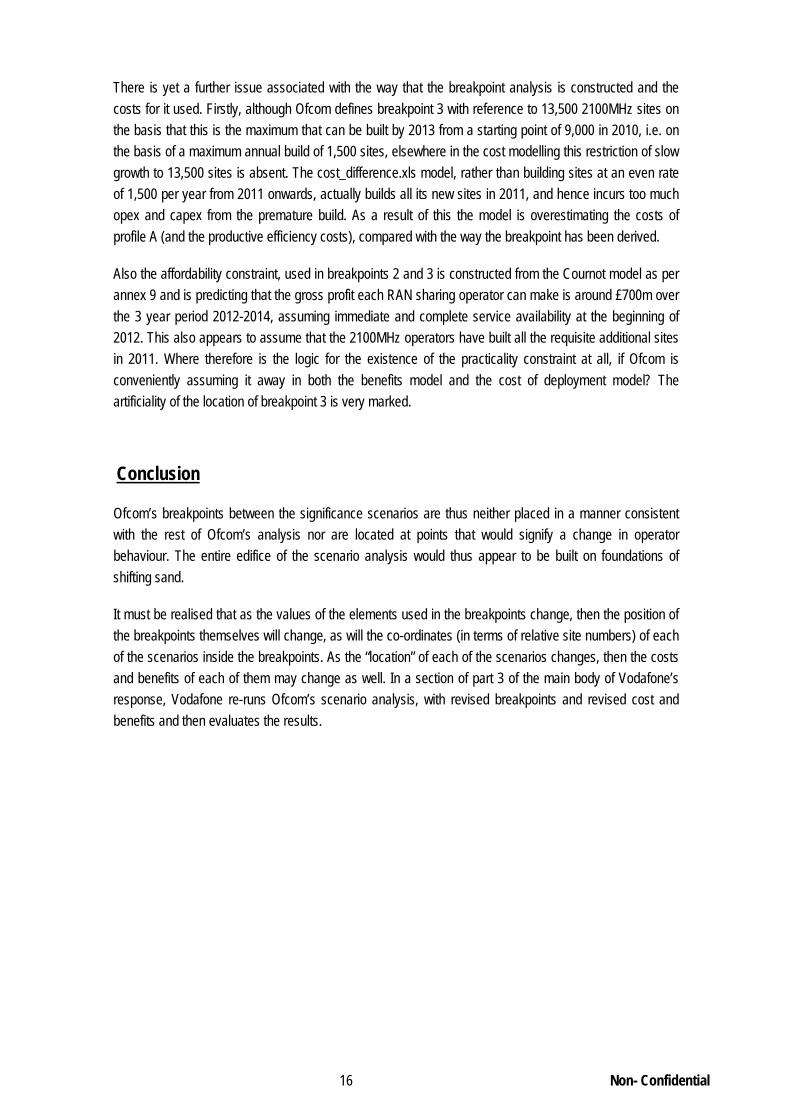
There is yet a further issue associated with the way that the breakpoint analysis is constructed and the costs for it used. Firstly, although Ofcom defines breakpoint 3 with reference to 13,500 2100MHz sites on the basis that this is the maximum that can be built by 2013 from a starting point of 9,000 in 2010, i.e. on the basis of a maximum annual build of 1,500 sites, elsewhere in the cost modelling this restriction of slow growth to 13,500 sites is absent. The cost_difference.xls model, rather than building sites at an even rate of 1,500 per year from 2011 onwards, actually builds all its new sites in 2011, and hence incurs too much opex and capex from the premature build. As a result of this the model is overestimating the costs of profile A (and the productive efficiency costs), compared with the way the breakpoint has been derived.
Also the affordability constraint, used in breakpoints 2 and 3 is constructed from the Cournot model as per annex 9 and is predicting that the gross profit each RAN sharing operator can make is around £700m over the 3 year period 2012-2014, assuming immediate and complete service availability at the beginning of 2012. This also appears to assume that the 2100MHz operators have built all the requisite additional sites in 2011. Where therefore is the logic for the existence of the practicality constraint at all, if Ofcom is conveniently assuming it away in both the benefits model and the cost of deployment model? The artificiality of the location of breakpoint 3 is very marked.
Ofcom’s breakpoints between the significance scenarios are thus neither placed in a manner consistent with the rest of Ofcom’s analysis nor are located at points that would signify a change in operator behaviour. The entire edifice of the scenario analysis would thus appear to be built on foundations of shifting sand.
Conclusion
It must be realised that as the values of the elements used in the breakpoints change, then the position of the breakpoints themselves will change, as will the co-ordinates (in terms of relative site numbers) of each of the scenarios inside the breakpoints. As the “location” of each of the scenarios changes, then the costs and benefits of each of them may change as well. In a section of part 3 of the main body of Vodafone’s response, Vodafone re-runs Ofcom’s scenario analysis, with revised breakpoints and revised cost and benefits and then evaluates the results.
1 Non- Confidential
Annex 5
Annex 7, 12 and 15 assume that in 2010 all five operators have a common starting position in the 80% population coverage area, and then in paragraphs A7.71 onwards Ofcom lays out three scenarios that a 2100MHz operator might choose to adopt in the face of UMTS 900 deployment by the incumbents
The cost differences between the frequencies
This annex covers in more depth the subject matter of the cost differences section included in Part 2 of the main body of Vodafone’s response.
A major component of Ofcom’s scenario analysis, given the relative site numbers at each frequency as determined for each variant (low, base and medium) from the breakpoint work (see Vodafone annex 4) is to derive the alternative cost of deployment at each frequency. It is thus necessary to examine the internal logic and consistency of how Ofcom has converted the results of its breakpoint analysis, into the cost differences that it has used in its scenario analysis of its annex 7.
The input of the difference in site numbers is converted into a NPV cost difference between the frequencies by the calculation in the cost differences spreadsheet of a set of alternative deployment profiles, and then costing these using the same basic cost methodology (of capex and opex over time) as the cost of release model. The difference in cost between pairs of deployment profiles for a given significance variant is then fed into the overall scenario analysis used for evaluating regulatory options.
One issue with this analysis is that the output of these cost differences is both an input to, and an output from the scenario analysis, in that Ofcom as discussed in our annex 4 uses the cost differences between the deployment profiles to define breakpoints in deployment, which then define the scenario variants which are input to the cost differences model, which in turn generate productive efficiency values which are fed into the scenario analysis. These deployment profiles need to be examined in a little detail.
UMTS deployment profiles
1
Profile A, matching using 2100MHz spectrum in the intervening period (2011-2013), followed by 800MHz deployment from 2014 (note that annex 12 makes it clear that this timing is based on LTE not UMTS being deployed at 800MHz). This profile shows an increase in 2100MHz sites from 2010, followed by a decrease to below 2010 levels once 800MHz services are in use.
:
Profile B, no deployment in the interim period, followed by 800MHz deployment from 2014. The profile is thus flat from 2010 to beyond 2014, and then declines with 800MHz adoption.
Profile C, use liberated 900MHz spectrum as soon as possible. This leads to an early decline in site numbers after 2010.
Profile C is also the path followed by the incumbent 900MHz operators where they choose to deploy UMTS 900 (although the level of costs and the timing for the incumbent 900MHz operators and a 2100MHz operator obtaining 900MHz spectrum are not necessarily the same, as per Ofcom’s annex 12). 1 These are assembled in more detail in Ofcom’s annex 12

2 Non- Confidential
All profiles are identical up to 2010, and also after 2017 (or so). They are shown in a little more detail on tables 1 and 2 and charts 1 to 3 below, using for consistency with Vodafone annex 4 Ofcom’s scenarios 5 and 142 from the amended cost differences model, i.e. where 4,500 sites are deployed at the lower frequency and 12,938 at 2100MHz.
Stock of UMTS
sites at year end
Profile A – operator without 900MHz, rolls out at 2100MHZ but
gets 800MHz
Profile B – operator without 900MHz,no further deployment at
2100MHz, but gets 800MHz
Profile C – operator with early 900MHz access
Total sites
UMTS 2100 only
sites
UMTS 800 + 2100 sites
Total sites
UMTS 2100 only
sites
UMTS 800 + 2100 sites
Total sites
UMTS 2100 only sites
UMTS 900 + 2100 sites
2010 9,000 9,000 0 9,000 9,000 0 9,000 7,412 1,588
2011 12,938 12,938 0 9,000 9,000 0 9,000 5,412 3,588
2012 12,938 12,938 0 9,000 9,000 0 9,000 4,500 4,500
2013 12,938 12,938 0 9,000 9,000 0 6,750 2,250 4,500
2014 12,938 10,938 2,000 9,000 7,000 2,000 4,500 0 4,500
2015 12,938 8,938 4,000 9,000 5,000 4,000 4,500 0 4,500
2016 8,719 4,219 4,500 6,750 2,250 4,500 4,500 0 4,500
2017 4,500 0 4,500 4,500 0 4,500 4,500 0 4,500
2018 4,500 0 4,500 4,500 0 4,500 4,500 0 4,500
Table 1: deployment profiles A, B, and C
From this table, diagrams of the three profiles can be drawn, as follows:
Rollout Profile A - expand 2100MHz
-
2,000
4,000
6,000
8,000
10,000
12,000
14,000
2008 2009 2010 2011 2012 2013 2014 2015 2016 2017 2018
Site
s
UMTS 2100 only UMTS 800 + 2100
Chart 1: Typical profile A
2 As per the letter to Vodafone from Ofcom dated 16th March 2009: this is the base variant of the medium B significance scenario

3 Non- Confidential
Rollout Profile B - hold at 2100MHz
-
2,000
4,000
6,000
8,000
10,000
2008 2009 2010 2011 2012 2013 2014 2015 2016 2017 2018
Site
s
UMTS 2100 only UMTS 800 + 2100
Chart 2: typical profile B
Rollout Profile C - deploy 900MHz
-
2,000
4,000
6,000
8,000
10,000
2008 2009 2010 2011 2012 2013 2014 2015 2016 2017 2018
Site
s
UMTS 2100 only UMTS 900 + 2100
Chart 3: typical profile C
Overall, the differences between profiles A and C and B and C are given in table 2 below:

4 Non- Confidential
Total site numbers
by year
Profile A Profile C A vs. C Profile B Profile C B vs. C
2010 9,000 9,000 0 9,000 9,000 0
2011 12,938 9,000 3,938 9,000 9,000 0
2012 12,938 9,000 3,938 9,000 9,000 0
2013 12,938 6,750 6,188 9,000 6,750 2,250
2014 12,938 4,500 8,438 9,000 4,500 4,500
2015 12,938 4,500 8,438 9,000 4,500 4,500
2016 8,719 4,500 4,219 6,750 4,500 2,250
2017 4,500 4,500 0 4,500 4,500 0
2018 4,500 4,500 0 4,500 4,500 0
Table 2: difference in site numbers between deployment profiles
It should be made clear that Ofcom’s profiles, as per figures 4 - 6 of annex 7, and as evaluated as differential costs in the cost differences spreadsheet, do not remove the 2100MHz equipment from any UMTS sites that are retained, so that the final configuration in all three profiles given above is 4,500 sites with both lower frequency (800MHz or 900MHz) and 2100MHz capability. Strangely however, this is not how Ofcom in the technical annex 13 have evaluated the relative difference between frequencies, where for example in table 25 comparison is made between site numbers required where an average operator has either one carrier at 900MHz, two carriers at 900MHz or two carriers at 2100MHz – the number of sites required where the operator has one carrier at 900MHz and two carriers at 2100MHz is not evaluated. This point is considered in more detail in the Part 2 of the main body of Vodafone’s response.
The differences between the three profiles are limited to the period 2011 to 2017, and are that profile A implies expenditure at 2100MHz followed by investment at lower frequencies coupled with site and equipment clearance, whilst B and C both merely invest in lower frequency assets (B some years after C) and clear 2100MHz sites and equipment (again B some time after C). Profile A is the most expensive, with B different from C by the trade off between earlier investment and earlier opex reduction through site clearance. A common thread through all is that it is assumed that rapid abandonment of “surplus” 2100MHz sites and equipment follows adoption of the lower frequency technology.
The concept of profile A, i.e. that an operator without access to 900MHz will match UMTS 900 deployment at 2100MHz is assumed to be valid in the medium significance scenario. This is by Ofcom definition – at lower levels i.e. the lower significance scenario it is assumed that the data demand is too low for the incumbent 900MHz operators to deploy UMTS 900, and at higher levels the demand is deemed to be too great for the 2100MHz operators to be able to match the UMTS 900 deployment, either through an affordability constraint, or through a practicality constraint (the site numbers required at 2100MHz are too great to be built inside the time window before 800MHz availability).
It is the cost differences spreadsheet model as described in annex 15 that attempts to quantify the rollout profiles, using as inputs the relative numbers of sites required at high and low frequencies from the technical model and annex 13, and taking for unit costs a similar methodology, but not identical levels (as discussed above) to those used in the cost of clearance model. However there is a problem, in that the model as shipped, and the set of assumptions described in annex 15, will not actually produce the cost

5 Non- Confidential
results for profiles A, B and C that are used in annex 7, where the scenario analysis is developed using the cost differentials between A and C, and B and C. Annex 7 is quite candid about this in A7.89 “we do not always want to capture the cost difference using the same assumptions as used in annex 15”. To Vodafone this emphasises the lack of co-ordination of this consultation – what is the function of annex 15 except to feed cost differences into the scenario analysis? In a few paragraphs from A7.114 onwards Ofcom attempts to explain how to modify the published version of the spreadsheet that accompanies the consultation document in order to be able to use it for annex 7 of the consultation.
Vodafone was in fact unable to follow these cryptic clues, and had to request Ofcom’s assistance in amending the model to reproduce the results of the cost differences model shown in table 3 of annex 7 – this table is key to the alternative costs of 900MHz and 2100MHz to the 2100MHz operators as used in the scenario analysis. This Ofcom duly supplied in a letter dated 16th March, where a series of values that needed to be pasted into different parts of the cost differences model were given. With this, Vodafone was able to use Ofcom’s model to generate the results shown in table 3, subject to some reservations.
The model with the amendments supplied to Vodafone by Ofcom on 16th March clearly identifies, on the results sheet of the spreadsheet, that for scenarios 1-9 the output from what the model describes as the 900MHz operator is to be taken as Profile C, and that the output from the 2100MHz operator is to be taken as Profile A. Profile B is also sourced from the 900MHz operator output, for scenarios 10 - 18, as the table supplied to Vodafone shows below:

6 Non- Confidential
Scenario Scenario No
900MHz operator
UMTS 900 site
numbers
2100MHz operator
UMTS 2100 site
numbers
2100MHz operator UMTS
900/800 site numbers
Sensitivity
Medium significance A scenario Low - Profiles A and C 1 4,125 10,594 4,125 1
Medium significance A scenario Base - Profiles A and C 2 4,250 11,188 4,250 1
Medium significance A scenario High - Profiles A and C 3 4,375 11,781 4,375 1
Medium significance B scenario Low - Profiles A and C 4 4,500 12,656 4,500 1
Medium significance B scenario Base - Profiles A and C 5 4,500 12,938 4,500 1
Medium significance B scenario High - Profiles A and C 6 4,500 13,219 4,500 1
High significance scenario Low - Profiles A and C 7 5,125 15,375 5,125 1
High significance scenario Base - Profiles A and C 8 5,750 17,250 5,750 1
High significance scenario High - Profiles A and C 9 6,375 19,125 6,375 1
Medium significance A scenario Low - Profile B 10 4,125 10,594 4,125 2
Medium significance A scenario Base - Profile B 11 4,250 11,188 4,250 2
Medium significance A scenario High - Profile B 12 4,375 11,781 4,375 2
Medium significance B scenario Low - Profile B 13 4,500 12,656 4,500 2
Medium significance B scenario Base - Profile B 14 4,500 12,938 4,500 2
Medium significance B scenario High - Profile B 15 4,500 13,219 4,500 2
High significance scenario Low - Profile B 16 5,125 15,375 5,125 2
High significance scenario Base - Profile B 17 5,750 17,250 5,750 2
High significance scenario High - Profile B 18 6,375 19,125 6,375 2
Table 3: Ofcom’s annex 7 cell site deployment profiles
In order to understand the costing of the profiles in a little more detail, it is worth working through a couple of examples from the cost differences model. Table 4 below attempts to show scenario 5 from Ofcom’s reworked model as above, with an end point of 4,500 of 900MHz or 800MHz sites, and 12,938 equivalent 2100MHz sites. This is the mid-point solution for the RAN sharing medium significance scenario, as per table 3 of annex 7. This scenario develops alternative network costs, from a 2007/08 PV viewpoint of Profile A (matching in 2100MHz, running up to 12,938 2100MHz sites before dropping to 4,500 sites at the lower frequency in 2017) and Profile C (with early access to UMTS at 900MHz, falling to 4,500 sites by 2014). Both Profile A and Profile C start from 9,000 sites in 2010, which are 3,000 2100MHz only sites, and 6,000 2100MHz plus GSM sites. In addition there are assumed to be 250 GSM only sites for each operator, so that the total of GSM sites in the relevant area is 6,250.

7 Non- Confidential
Activity by site type
Profile C Profile A A minus
C Early use of low frequency spectrum
Deferred use of low frequency spectrum with expansion of 2100MHz in the interregnum
Sites £m Sites £m £m
2100MHz only sites: kept 950 207.0 - -
2100MHz only sites, removed 13/14 and 16/17 respectively 2,050 73.3 3,000 267.1
Subtotal 3,000 280.3 3,000 267.1 -13.2
2100MHz+ GSM sites: kept 3,550 187.0 4,346 223.0
2100MHz+GSM sites: equipment removed 13/14 and 16/17 respectively
2,450 40.9 1,654 56.2
Subtotal 6,000 227.9 6,000 279.2 51.3
Running total 9,000 508.2 9,000 546.3 38.1
Upgrade GSM only sites with 2100MHz – kept n/a n/a 154 9.2
Upgrade GSM only sites with 2100MHz – equipment removed 16/17
n/a n/a 59 2.4
New 2100MHz only sites – build 11/12, remove 16/17 n/a n/a 3,726 484.0
Sub total incremental sites n/a n/a 3,939 495.6 495.6
Upgrades to 900MHz or 800MHz – simultaneous with 2100MHz expansion in 2010
1,588 63.7 n/a n/a
Upgrades to 900MHz or 800MHz – separate from other activity, 11/12 or 14/16
2,913 83.5 4,500 162.2
Subtotal of upgrade cost 4,501 147.2 4,500 162.2 15.0
Less pre-committed 2010 cost (114.5) (114.5)
Total cost 540.8 1,089.6 548.7
Table 4: Profiles A and C detail, Ofcom scenario 5
Thus in this particular scenario the cost difference between profiles A and C is calculated to be £548.7m.
The third Profile is B. Here it is assumed that the operator does not have access to 900MHz spectrum, but equally does not attempt to match the 900MHz incumbents when they re-farm by building out at 2100MHz. Ofcom paints this as the high significance scenario, the outcome where the level of demand for high quality data is such that it is not possible financially or practically to build sufficient 2100MHz sites to keep up with an operator with 900MHz. In this case the operator is assumed to continue with the existing stock of 9,000 2100MHz sites, and then acquire 800MHz spectrum (to the same timeline as Profile A). Acquisition of the lower frequency technology enables the Profile B operator to decommission sites on a par with Profile A.
Table 5 below compares profile B with profile C, using the same site numbers, i.e. that implied by the base case, or the mid point of the medium significance scenario when only the RAN operator can match.

8 Non- Confidential
Activity by site type
Profile C Profile B B minus C
Early use of low frequency spectrum
Deferred use of low frequency spectrum without expansion of 2100MHz in the interregnum
Sites £m Sites £m £m
2100MHz only sites: kept 950 207.0 - -
2100MHz only sites, removed 13/14 and 16/17 respectively 2,050 73.3 3,000 267.1
Subtotal 3,000 280.3 3,000 267.1 -13.2
2100MHz+ GSM sites: kept 3,550 187.0 4,500 230.9
2100MHz+GSM sites: equipment removed 13/14 and 16/17 respectively
2,450 40.9 1,500 51.0
Subtotal 6,000 227.9 6,000 281.9 54.0
Running total 9,000 508.2 9,000 549.0 40.8
Upgrade GSM only sites with 2100MHz – kept n/a n/a n/a n/a
Upgrade GSM only sites with 2100MHz – equipment removed 16/17
n/a n/a n/a n/a
New 2100MHz only sites – build 11/12, remove 16/17 n/a n/a n/a n/a
Sub total incremental sites n/a n/a n/a n/a n/a
Upgrades to 900MHz or 800MHz – simultaneous with 2100MHz expansion in 2010
1,588 63.7 n/a n/a
Upgrades to 900MHz or 800MHz – separate from other activity, 11/12 or 14/16
2,913 83.5 4,500 81.1
Subtotal of upgrade cost 4,501 147.2 4,500 81.1 -66.1
Less pre-committed 2010 cost (114.5) (114.5)
Total cost 540.8 515.6 -25.3
Table 5: Profiles C and B detail, Ofcom scenario 5
Summarising this detail of these two tables, in the first, table 4, C vs. A, where the 2100MHz operators do attempt to match 900MHz with 2100MHz , A is more expensive than C in three ways:
reduction of the existing stock of 9,000 sites to the end point of 4,500 sites occurs 3 years later – cost difference £38.1m,
a large number of new 2100MHz sites are built in 2011 and removed in 2016/17 – cost difference £495.6m, and
although the site upgrades to the lower frequency take place later for profile A, the cost is deemed to be greater by £15m, since the model assumes that an upgrade of UMTS 900 on a site that already has GSM 900 and UMTS 2100 will attract a 50% discount for profile C.
In the second table, table 5, C vs. B, where the 2100MHz operators do not expand their 2100MHz network, but wait for the arrival of the lower frequency spectrum in 2014, the higher costs of retaining all 9,000 2100MHz sites for a longer period in Profile B than C are more than offset by the reduction in cost from the delay in lower frequency implementation. But here for both B and C, the model is assuming a 50% discount when the UMTS 900 deployment is on sites that already have GSM 900 and UMTS 2100.
9 Non- Confidential
Ofcom explains in annex 15 that this saving arises by sharing of common frequency equipment (e.g. antennas) between GSM and UMTS at 900MHz. Vodafone is not convinced that in this discount is appropriate. . The removal of this mistaken discount would increase the cost for the 900MHz operator in profile C by £99.5m in the situation modelled above.
But in any event, it is clear that even in Ofcom’s logic, this 50% discount can only apply to the incumbent 900MHz operators, and not to a non GSM 900 operator being awarded 900MHz spectrum, since this operator has no pre-existing 900MHz equipment on its cell sites. (These operators will have deployed GSM at 1800MHz, or not at all.) It can be seen from the labelling of the cost differences model that was developed for annex 15, that it is the cost of the incumbent 900MHz operator that Ofcom was seeking to model in the spreadsheet. By adopting the model’s calculated costs for this operator type as Profile C for a 2100MHz operator in the annex 7 analysis Ofcom has misinterpreted its own model. Ofcom makes it clear in A7.90 that what it is concerned with in the scenario modelling is “the efficiency effect realised when a single 2100MHz operator or two RAN shared 2100MHz operators acquire 900MHz spectrum as a result of a policy option (i.e. under our spectrum release policy options) depend on what they do in the counterfactual as described by one of the rollout profiles described above.” In other words what needs to be compared in the profiles is the cost of the non GSM 900 operator obtaining either early access to the low frequency spectrum i.e. 900MHz in 2010/11, or delayed access to such spectrum i.e. 800MHz in 2014. Therefore any discount calculated by the model specific to the operator that has both GSM 900 and UMTS 900 cannot be relevant to such a comparison. Thus profile C needs to be reworked with the 50% discount removed. Similarly it appears to Vodafone that Ofcom have misunderstood their model for Profile B (the “wait until 800MHz is available” option), since although the model calculates the cost for both a 900MHz operator as £515.6m (with the GSM 900/UMTS 900 discount), and for a 2100MHz operator where no GSM 900 discount is applied as £596.7m, it is the £515.6m which appears to have been used in table 3 for the 2100MHz (rounded to £525m) Hence all the results of Profiles C and B shown in table 3 of annex 7, and consequently all the productive efficiency calculations used by Ofcom in the scenario analysis are simply wrong.
Vodafone supplies below for the single 2100MHz operator the rounded values supplied by Ofcom for profiles A, B and C in table 3 of annex 7, the underlying results obtained from the model, and the corrected results when the 50% shared GSM and UMTS 900 frequency discount is removed. The cost of profiles B and C generally increases by £75-100m, (and thus the difference between them and A, i.e. the productive efficiency cost, declines by a similar sum). In table 6 below Medium A describes the medium significance scenario where all 2100MHz operators acting individually can match the 900MHz deployment, whereas Medium B relates to where the data demand and hence the site requirements at 2100MHz are higher, and only the RAN pair of operators can manage to match. These scenarios, and the breakpoints between them, are discussed in more detail in Part 2 of the main body of Vodafone’s response and in Vodafone annex 4.

10 Non- Confidential
Scenario for single 2100MHz operator, adopting any of the three alternative profiles
Site numbers Profile A (match at 2100MHz)
Profile B no match, subsequent deploy of 800MHz
Profile C deploy 900MHz
Lower freq
Higher freq
Ofcom table 3
Model result
Ofcom table 3
Model result
Corrected model result
Ofcom table 3
Model result
Corrected model result
No. No. £m £m £m £m £m £m £m £m
Medium A Low 4,125 10,594 775 768 500 504 579 525 519 608
Medium A Base 4,250 11,188 850 851 500 508 585 525 526 619
Medium A High 4,375 11,781 925 933 500 512 591 525 533 630
Medium B Low 4,500 12,656 1,100 1,053 525 516 597 550 541 640
Medium B Base 4,500 12,938 1,100 1,090 525 516 597 550 541 640
Medium B High 4,500 13,219 1,100 1,126 525 516 597 550 541 640
High Low 5,125 15,375 1,400 1,435 525 536 627 575 578 693
High Base 5,750 17,250 1,800 1,753 600 596 696 625 614 745
High High 6,375 19,125 2,100 2,100 675 682 778 675 668 805
Table 6: Outputs for profiles A-C, removing incorrect discount
RAN sharing
Since the particular scenario illustrated in detail above in tables 4 and 5 (scenario 5) is one where it is assumed that only the RAN shared operators can compete at 2100MHz with the incumbent operators, the scenario analysis developed by Ofcom then assumes that these operators can jointly follow option A, but that there is a reduction in each individual operator’s costs of 27.5% from the single operator cost of £1,089.6m shown above, so that the combined costs for the pair of operators are 2*72.5% or 145% of this cost, i.e. £1,580m. This number is reported in table 3 of annex 7 as £1,600m. The same row reports the alternative of Profile C, i.e. that the RAN pair secure UMTS 900, as 145% of the single Profile C cost of £540.8m or £784m (shown as £800m). Ofcom thus adopts in the scenario analysis the proposition that the difference between the RAN pair securing 900MHz spectrum and deploying at 2100MHz is £1,600 - £800m, or £800m. The value of this cost avoidance can then be seen in for example table 59 of annex 7 as the major benefit of ensuring that the RAN pair do in fact secure access to 900MHz.
But this simple application of a 27.5% discount to all the costs incurred under both profiles A and C is not really the right way to approach the identification of the differential cost between A and C. The difference between the two profiles is almost entirely the £500m or so spent on new 2100MHz only sites (using the medium cost assumption of £60k for the site build and £45k for the electronics). Given that the two RAN sharing operators, T-Mobile and H3G are sharing both sites and 3G radio network equipment3
3 T-Mobile and H3G, joint press release 18th December 2007
there is no particular reason why a new 2100MHz site that is shared will cost them jointly a premium of 45% over the whole £105k. Perhaps there may be a premium for the equipment cost, with some additional equipment being required for the two operators over that required for a single operator, but it is unclear why the site cost should be any different from £60k. As a working hypothesis, it might be reasonable to assume in the circumstances where the single operator has a cost of £60k site build and £45k electronics, that the combined unit costs for the RAN pair will be £60k site build and £60k for the electronics. Inputting these into the cost differences model changes the result for Profile A to a joint cost of £1,305.6m. But the costs
11 Non- Confidential
of Profile C should also change. As can be seen from the detailed tables above, the modelled costs of Profile C are twofold:
The costs of the existing stock of sites, being reduced from 9,000 down to 4,500, with UMTS equipment removed and some sites decommissioned. This cost head is common to both profiles A and C, and differ only in timing.
The costs of deploying UMTS 900 equipment.
What is being envisaged in Profile C by Ofcom is that the RAN pair will jointly use a single carrier at 900MHz – it is appropriate therefore that the upgrade to the existing stock of sites with UMTS 900 equipment should also use the £60k unit cost assumed for the electronics. Equally to maintain comparability between Profiles C and A (and correctly identify the cost difference between them), the costs of the existing stock of 9,000 sites should be consistently calculated. Therefore it is reasonable to recalculate the cost of Profile C using the same £60k site build and £60k electronics cost as Profile A – the result should give the joint cost of operating at 900MHz from an early implementation date as opposed to the joint cost of matching at 2100MHz and then operating at 800MHz subsequently as is assumed in Profile A. Table 7 below gives the result for both, using the same scenario’s (number 5 from above) site numbers assumption of 4,500 sites at 800/900MHz and 12,938 sites at 2100MHz (after also removing the 50% discount calculation from the model).
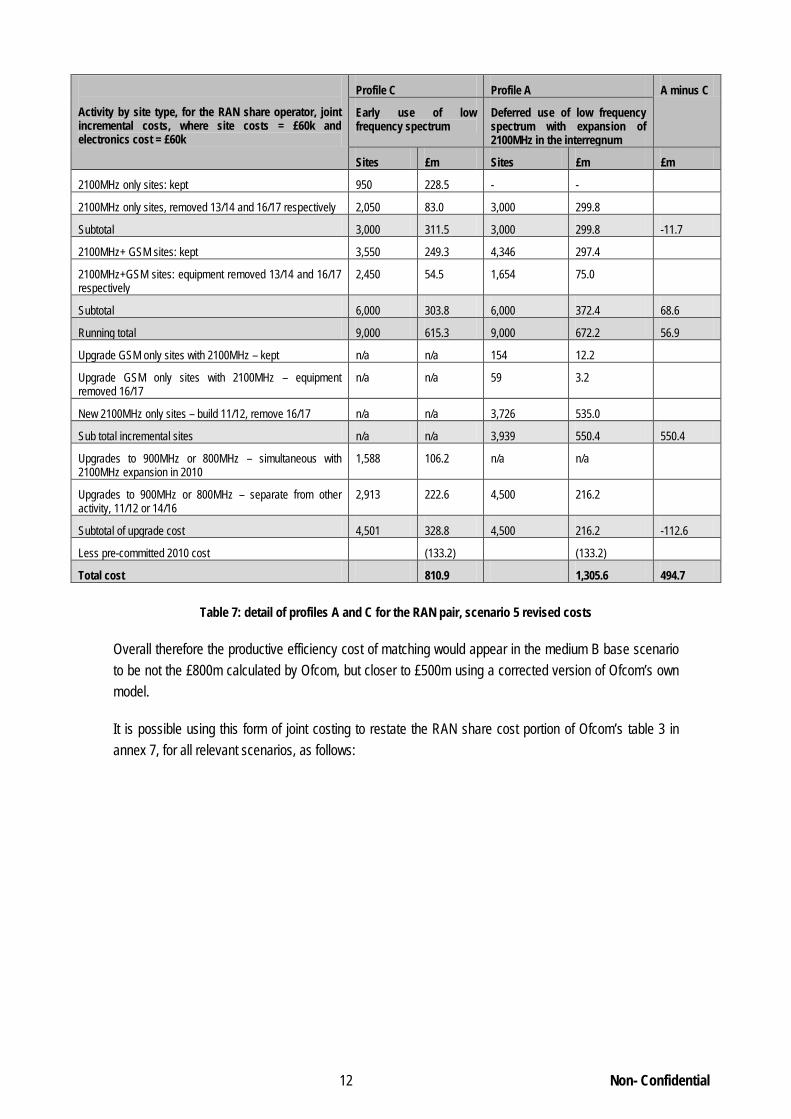
12 Non- Confidential
Activity by site type, for the RAN share operator, joint incremental costs, where site costs = £60k and electronics cost = £60k
Profile C Profile A A minus C
Early use of low frequency spectrum
Deferred use of low frequency spectrum with expansion of 2100MHz in the interregnum
Sites £m Sites £m £m
2100MHz only sites: kept 950 228.5 - -
2100MHz only sites, removed 13/14 and 16/17 respectively 2,050 83.0 3,000 299.8
Subtotal 3,000 311.5 3,000 299.8 -11.7
2100MHz+ GSM sites: kept 3,550 249.3 4,346 297.4
2100MHz+GSM sites: equipment removed 13/14 and 16/17 respectively
2,450 54.5 1,654 75.0
Subtotal 6,000 303.8 6,000 372.4 68.6
Running total 9,000 615.3 9,000 672.2 56.9
Upgrade GSM only sites with 2100MHz – kept n/a n/a 154 12.2
Upgrade GSM only sites with 2100MHz – equipment removed 16/17
n/a n/a 59 3.2
New 2100MHz only sites – build 11/12, remove 16/17 n/a n/a 3,726 535.0
Sub total incremental sites n/a n/a 3,939 550.4 550.4
Upgrades to 900MHz or 800MHz – simultaneous with 2100MHz expansion in 2010
1,588 106.2 n/a n/a
Upgrades to 900MHz or 800MHz – separate from other activity, 11/12 or 14/16
2,913 222.6 4,500 216.2
Subtotal of upgrade cost 4,501 328.8 4,500 216.2 -112.6
Less pre-committed 2010 cost (133.2) (133.2)
Total cost 810.9 1,305.6 494.7
Table 7: detail of profiles A and C for the RAN pair, scenario 5 revised costs
Overall therefore the productive efficiency cost of matching would appear in the medium B base scenario to be not the £800m calculated by Ofcom, but closer to £500m using a corrected version of Ofcom’s own model.
It is possible using this form of joint costing to restate the RAN share cost portion of Ofcom’s table 3 in annex 7, for all relevant scenarios, as follows:

13 Non- Confidential
Scenario for RAN pair of 2100MHz operators, giving joint costs of adopting any of the three alternative profiles
Site numbers Profile A (match at 2100MHz)
Profile B no match, subsequent deploy of
800MHz
Profile C deploy 900MHz
Lower freq
Higher freq
Ofcom table 3
Model result
Corrected model result
Ofcom table 3
Model result
Corrected model result
Ofcom table 3
Model result
Corrected model result
No. No. £m £m £m £m £m £m £m £m £m
Medium A Low 4,125 10,594 1,100 1,114 946 750 731 735 750 753 768
Medium A Base 4,250 11,188 1,250 1,234 1,039 750 737 743 750 763 783
Medium A High 4,375 11,781 1,350 1,353 1,132 750 742 751 750 773 797
Medium B Low 4,500 12,656 1,550 1,527 1,265 750 748 759 800 784 811
Medium B Base 4,500 12,938 1,600 1,581 1,306 750 748 759 800 784 811
Medium B High 4,500 13,219 1,650 1,633 1,346 750 748 759 800 784 811
High Low 5,125 15,375 2,000 2,081 1,694 800 777 799 850 838 882
High Base 5,750 17,250 2,600 2,542 2,048 850 864 878 900 890 951
High High 6,375 19,125 3,000 3,045 2,432 1000 989 972 950 969 1,027
Table 8: RAN share pair, profiles A-C, revised costs
It can be seen that the difference between the profiles, particularly A – C has reduced.
It is possible from this work to produce a revised version of Ofcom’s table 3, but it is perhaps simpler to look at where these numbers are then being used in subsequent tables of annex 7. The primary source for this is table 7 “the productive efficiency benefit of rolling out 900MHz instead of 2100MHz and 800MHz (profile A compared to profile C).” The original Ofcom numbers supplied and the revised calculations from the workings above are shown in table 9 below.
Scenario Low
£m Base £m
High £m
Single operator, medium significance, all operators can match, difference between profiles A and C
Ofcom 250 325 400
Vodafone 160 232 303
Difference 90 93 97
RAN shared pair, medium significance, where all operators can match, difference between profiles A and C
Ofcom 350 475 575
Vodafone 178 256 335
Difference 172 219 240
RAN shared pair, medium significance, where only the RAN pair can match, difference between profiles A and C
Ofcom 750 800 850
Vodafone 454 495 535
Difference 296 305 315
Table 9: profiles A minus C, Ofcom vs. Vodafone
A similar adjustment would apply to Ofcom’s table 8 of annex 7, where the B-C differences are given, and to table 9, where A-B differences are shown.

14 Non- Confidential
But there is a further qualification to the use of the numbers for the RAN pair that suggests that the Vodafone productive efficiency calculations above are still too high. Common to both the original Ofcom approach to RAN share and the adjustments worked through above is the assumption that the RAN share pair, with double the traffic demand, uses exactly the same number of sites as the single operator at 900MHz. Whilst this is a convenient assumption for modelling purposes, as a point of principle it is not tenable. It is in total contradiction to the technical modelling and to the analysis in the costing above, which employs the basic hypothesis that as the data demand rises, so does the volume of sites required. Table 25 of annex 13 plots the number of sites required on a range of assumptions as demand rises. For example at depth 2, and a transmission speed of 1.2Mbps the following results are given in table 25.
Data volume in
MB/user/day
Depth 2, 1.2mbps, no of sites at:
900MHz
with 1 carrier
2100MHz
with 2 carriers
0.1 4,020 12,712
0.3 4,022 12,712
0.7 4,031 12,712
1 4,039 12,714
3 4,087 12,738
7 4,184 12,787
10 4,257 12,823
15 4,379 12,884
20 4,521 12,945
25 5,131 13,005
30 6,157 13,066
Table 10: Ofcom sites under rising traffic loads (from Ofcom table 25, annex 13)
It can be seen that where the traffic volumes are low, coverage, not capacity is the controlling factor, so that a doubling of traffic makes very little or no difference to the number of sites required, but at higher levels of traffic as capacity rather than coverage starts to become of more relevance, the number of sites becomes much more volume sensitive, particularly at 900MHz. So assuming for the sake of demonstration, that this table represents the usage scenarios modelled in the scenario analysis, then an increase of traffic from 0.1MB per day to 0.2MB per day might increase the required number of sites by 1. At larger traffic levels, Ofcom’s medium A low site number of 4,125 sites at 900MHz is roughly equivalent to 5MB per day on table 10 above. Doubling this might suggest that 4,257 sites were instead required for the paired RAN share operators, which would increase the cost of Profile C by about £15m. Alternatively, taking the medium B site number of 4,500 would give a daily usage of 20MB – doubling this is not on the table above, but merely a 50% increase would require 1,550 sites or possibly a £200m increase in Profile C costs.
From the other point of view, the RAN share operators will jointly have five carriers available to them at 2100MHz. It is not quite clear what impact this will have on comparative site numbers at 2100MHz, but it

15 Non- Confidential
can be expected that the availability of extra carriers at 2100MHz4
Overall therefore the profile A to profile C comparison for the joint RAN pair should not be made on the basis of comparing one 900MHz carrier to two 2100MHz carriers, but on the basis of a doubled traffic load on one 900MHz carrier to the same load on five 2100MHz carriers
will damp down somewhat the rate of increase of sites with increasing traffic, tending to reduce the cost of profile A to some extent for the RAN pair.
5
. This will undoubtedly serve under certain traffic volume scenarios to decrease the cost of Profile A and increase the cost of Profile C, decreasing the productive efficiency cost by a measurable extent.
Further issues with the profiles, and their relative costs
One thing that is striking about the profiles is that the same number of sites at the lower frequency is required in 2016 as it is in 2012, i.e. 4,500 in this case. There are two implications of this: firstly that demand is both flat and certain, and second that the later deployment in 2016 is at the same level of technology as UMTS 900. The fact that the level of demand is assumed to be flat is probably more a result of the need for comparability between Profiles A, B and C rather than an expectation of the real outcome, but it does give rise to a concern on the principles underlying equipment and site decommissioning.
Site decommissioning
Overall, the model is very cavalier with equipment and site decommissioning. In the abrupt fall in site numbers, over 2013 and 2014 for Profile C, and 2016 and 2017 for Profiles A and B, several assumptions are being implicitly made. Whilst 2100MHz is retained on all lower frequency sites, given that Ofcom is confident that the 2100MHz equipment has a smaller coverage reach, at the edge of every site there will be an area that can only be reached by the UMTS 900 carrier (or at least if there is 2100MHz coverage it will be to a lesser indoor penetration and to a lower transmission speed).
So diagrammatically, whilst 900MHz might cover areas A and B below, the reach of 2100MHz might extend only to area A, leaving customers in area B only supportable by 900MHz.
4 I.e. the fact that profile A for the single operator is being calculated for two carriers, whereas for the RAN pair there would be double the traffic with five, not four carriers 5 Arguably though in the context of annex 7 and the way the cost difference model works, the comparison between C and A for the RAN pair should actually be between site deployments required under C with one carrier of 900MHz plus five carriers of 2100MHz, and A with five carriers of 2100MHz. Vodafone is not aware that Ofcom has attempted such a comparison.
Area A, covered by 2100MHZ & 900MHz
Area B, covered by 900MHz only

16 Non- Confidential
Figure 1: illustrative areas covered by 2100MHz and by 900MHz
By reducing the number of sites with 2100MHz equipment, it is presumably assumed by Ofcom that there are no customers in area B who from the decommissioning date of 2013 for 900MHz and 2016 for 800MHz6 need to be served by this equipment, since presumably all customers (of the network itself and visitors to the network) have a device that can use the lower frequency or that customers who do not have such a device are not valued. It is not clear that such a conclusion is warranted – there is a risk that a not insignificant proportion of customers will still have 2100MHz only devices, and would thus effectively be disenfranchised from area B by early decommissioning. The consequences in terms of poor quality of service for these customers and loss of reputation for the 900MHz incumbents would not be good – unless Ofcom is assuming some form of forced migration to UMTS 900 capable devices, but if so, one would expect to see this being costed as part of profile C.
The decommissioning date of 2013-14 that Ofcom has adopted for profile C is apparently derived from annex 12. Table 7 of annex 12 calculated the decommissioning point as the period 2013 - 2014 on the basis that this is the “point at which user equipment is in hands of most data users and there is a full level of service” but in fact concludes that the date for penetration of suitable devices for most data users is “no later than end 2013” (and the secondary constraint of full service being mid 2013 and end
6 See Vodafone table 2 of this annex above
2013 in GANTT charts C and D respectively), so the removal of 50% of the decommissioned sites in 2013 for the 900MHz operator might be one year premature. By contrast the timing of profile A for 800MHz deployment in table 8 of annex 12 concludes that the equivalent date for handset deployment is end 2015, and then proceeds to decommission in 2016 and 2017. This suggests to Vodafone that to be consistent between the assumptions for A and C, even on its own logic Ofcom should delay the 2100MHz decommissioning for the 900MHz incumbent under Profile C by one year.
More significantly however, inspection of the GANTT charts in annex 12 reveals that the charts C and D that give a full service start date of UMTS 900 as end 2013 actually relate to the incumbent 900MHz operators. It is charts E and F that relate to profile C of an acquirer of 900MHz spectrum. Here whilst the first criterion, that of device penetration is unchanged as end 2013, the date of full service is now end 2014. This suggests that for such an operator, decommissioning should not start earlier than 2015, i.e. two years later than annex 7 is assuming.
Incidentally, almost as a throw-away comment, A12.79 states” UMTS 2100 equipment is kept in sites shared with 900MHz or 800MHz equipment. This is intended to reflect the likely desire of operators to provide continuing service for legacy users.” The fact that these two (or three) carriers provide a considerable capacity boost is ignored by the writer of annex 12, as is the fact that any legacy user would not be able to obtain service in the area B described in the figure above.
It is necessary therefore to redo Profile C for the 2100MHz operator for both the single and RAN sharing operators, delaying the decommissioning by two years, and for the 900MHz operators, delaying decommissioning by one year, by changing the appropriate dates in the sensitivities sheet of the cost differences model. The results of this exercise are shown in table 11 below:

17 Non- Confidential
Scenario for profile C, with the decommissioning of 2100MHz delayed by one year for the incumbent 900MHz operator, and by two years for the acquirer 900MHz operator
Site numbers Single 2100MHz operator acquiring 900MHz
900MHz incumbent refarming for UMTS
RAN pair 2100MHz operators acquiring
900MHz
Lower freq
Higher freq
Previously calc above
Impact of delay
Previously calc above
Impact of delay
Previously calc above
Impact of delay
No. No. £m £m £m £m £m £m
Medium A Low 4,125 10,594 608 679 608 645 768 855
Medium A Base 4,250 11,188 619 688 619 655 783 867
Medium A High 4,375 11,781 630 698 630 665 797 880
Medium B Low 4,500 12,656 640 707 640 675 811 892
Medium B Base 4,500 12,938 640 707 640 675 811 892
Medium B High 4,500 13,219 640 707 640 675 811 892
High Low 5,125 15,375 693 753 693 724 882 954
High Base 5,750 17,250 745 798 745 773 951 1,014
High High 6,375 19,125 805 852 805 829 1,027 1,083
Table 11: revised cost of profile C with delayed decommissioning date
Site removal
There is a further point on site removal. Ofcom is not only decommissioning equipment, but also completely decommissioning some of the stock of sites that only hold 2100MHz equipment, up to 3,000 in the case of profiles B and C, and potentially considerably more than that in the case of profile A. In the case of site removal, it is effectively being assumed that there is no future use at any frequency for a site at this particular location. This means that Ofcom is assuming on the operators’ behalf that sufficient capacity can always be provided in the foreseeable future by a less dense network of sites.
In the example above, Profile C is assuming that the operator acquiring 900MHz spectrum can remove 2,050 2100MHz only sites, permanently decommissioning not only the 2100MHz equipment, but also the cell site itself in the designated years. These sites would only be decommissioned in the real world if the operator can be certain that the stock of remaining sites, effectively the total of 6,250 GSM sites, are sufficient to allow for future growth of demand7
So, in a real world outcome where data demand continues to rise during the next decade, if one of the 900MHz incumbents decommissions sites when the level of demand is equivalent to the medium significance scenario, they will be forced to acquire further new sites when in due course the level of demand rises towards the high scenario – this is both expensive and uncertain. Removal of currently surplus sites in the expectation that they will never be needed is therefore a somewhat challenging assumption of cost saving. A non GSM 900 incumbent, under either profile B or A will not face this problem until a later date than a GSM operator, since they will still have a stock of (as a minimum) 9,000
. It is not clear that this is a valid assumption. Looking at the technical annex 13, table 5, it is not difficult to discern Ofcom scenarios where more than 6,000 sites are in due course required for UMTS 900.
7 Given that most of the GSM only sites do not have 2100MHz for technical reasons which probably also will restrict their use for UMTS 900, the real available pool is limited to not much more than 6,000 sites

18 Non- Confidential
UMTS sites available for UMTS 900 deployment, and hence would be less exposed to traffic volume increases over time. This point is particularly relevant given the rising cost of site builds and the falling cost of site equipment modelled by Ofcom. In effect therefore, Ofcom’s simple profile analysis is assuming both perfect knowledge and flat data volumes from 2012 or so.
Vodafone does not attempt to formally adjust for this in the model, but it is clear that allowing in Ofcom’s model for rising traffic volumes over time (without removing the assumption of perfect knowledge) towards a particular significance scenario will tend to reduce the differences between the profiles. The early decommissioning of sites in Profile B would be damped down, increasing its costs. Also, the number of 2100MHz sites required to match 900MHz in the period 2011-2014 would be lower than in the end state (or at least delayed in timing), reducing the peak cost of Profile A. Hence the productive efficiency cost, i.e. A minus C will tend to be smaller in the real world than the outputs of Ofcom’s model even when amended as outlined above suggest.
Common number of sites
The second issue associated with the common number of sites required at the lower frequency irrespective of the year relates to the assumption that the technology deployed at 800MHz is identical in site requirements to UMTS 900MHz. Vodafone has discussed in Part 4 of the main body of the response the potential advantage of LTE over UMTS. Not only is LTE likely to offer a superior performance in terms of transmission speed (in average and at the cell edge) and capacity per cell, but also it is likely to be available in 10MHz units, equivalent to two UMTS carriers, when only one 900MHz carrier is likely to be available (in Ofcom’s currently preferred outcome). Ofcom does briefly consider the point of superiority of LTE in annex 12 “it is possible that the technology that will be used to deliver services at 800MHz (such as LTE) being more distant in the future, will be more advanced and efficient than that at 900MHz. Therefore, the number of sites required at 800MHz may be smaller than that required at 900MHz8”. Unfortunately however this point does not transfer across to annex 7, so that this is not considered in the costed versions of the profiles, where the assumption is made that deployment at 800MHz will be identical in site numbers to that at 900MHz.
Even ignoring the impact of the likely superiority of LTE over UMTS over the same quantum of spectrum, the effect of twice the spectrum is not insignificant when data loads are high. This can be clearly seen for UMTS in table 25 in annex 13, an extract of which is provided below.
No of sites required Depth 2, 1.2Mbps Depth 1, 1.2Mbps
Daily data demands per user
in MB
one 900MHz
carrier
two 900MHz
carriers
one 900MHz
carrier
two 900MHz
carriers
1 4,039 4,026 2,919 2,907
10 4,257 4,136 3,138 3,017
15 4,379 4,197 3,296 3,077
20 4,521 4,257 4,105 3,138
8 A12.66 of the consultation

19 Non- Confidential
25 5,131 4,318 5,1319 3,199
30 6,157 4,379 6,157 3,296
Table 12: change in site requirement when number of carriers is increased
Table 12 unequivocally establishes the advantage of a second low frequency carrier for UMTS as traffic volumes expand significantly over the coverage levels. A clear presumption therefore must be that at data demands that are above coverage levels, fewer sites will be required under LTE 800 with two equivalent carriers than under UMTS 900 with one. So, reverting to Ofcom’s assumption of perfect knowledge and flat traffic, if say purely for illustration 4,000 LTE sites might be needed vs. 4,500 one UMTS 900 carrier, the costs of Profile A for the low frequency expansion would in the worked example above fall by £25m. The cost of Profile B, the wait for 800MHz option, will also fall.
.
Flexing the unit costs
Overall therefore it would appear that the productive efficiency differentials calculated by Ofcom, when corrected for internal errors and inconsistencies are substantially overstated. But one final criticism needs to be made in this section. Ofcom have described in table 7 of annex 7 (as shown in table 9 above) three possible outcomes for each scenario:
“low benefit/high cost”
“base case benefit/cost”
“high benefit/low cost”
This is potentially misleading since it seems to suggest these are upper and lower bands of possible results, obtained by varying multiple parameters. This is in fact not so – the results of different productive efficiency as shown in annex 7 are obtained by varying one parameter only, the number of cell sites, low vs. high frequency, as shown in Ofcom’s scenarios in the table 3 above, and summarised in table 13 below:
Site numbers Low Base High
Medium all operators matching
“medium A”
800/900MHz 4,125 4,250 4,375
2100MHz 10,594 11,188 11,781
Medium only RAN pair matching
“medium B”
800/900MHz 4,500 4,500 4,500
2100MHz 12,656 12,938 13,219
Table 13: Ofcom deployment numbers, medium significance scenarios A and B
At all times the level of unit costs is unchanged. By juxtaposing the words “benefit” and “cost” one might think that cost levels, as well as site numbers are being varied to produce the high and low outcomes. 9 Vodafone questions whether the 5,131 and 6,157 values for the 1 carrier depth 1 solution given by Ofcom are correct since they are identical to the depth 2 result

20 Non- Confidential
Ofcom does discuss in annex 15 the idea of varying the level of costs, as low, base and high, and the cost differences model specifically allows this, but regrettably this variation is not carried forward into the scenario analysis of annex 7.
Vodafone has previously noted10 the discontinuity in the level of unit costs between that adopted in the cost of spectrum clearance and the cost of UMTS deployment, with the high cost outcome of the cost of clearance being the same as the medium cost outcome of UMTS deployment. Arguably from Ofcom’s own work there are four possible cost levels therefore:
Costs of release model “Low” “Medium” “High”
New site cost £40k £50k £60k
New equipment cost £15k £25k £45k
Difference between frequencies model “Low” “Medium” “High”
New site cost £50k £60k £75k
New equipment cost £25k £45k £65k
Table 14: Ofcom unit costs, clearance and deployment profile models
Vodafone considers the high UMTS outcome to be too high, so it is probably more realistic to consider the mid point of the four to be somewhere between the medium/low of £50k and £25k, and the high/medium of £60k and £45k, but all four outcomes, including the very low of £40k and £15k, and the very high of £75k and £65k are easily calculated and are shown in the tables 15 – 18 below.
For profile C, two alternative results are given – one relating to the 900MHz operator, with the decommissioning date delayed by one year (and no 50% discount), and the other suitable for the 2100MHz operator, i.e. with the decommissioning date delayed by two years, to 2015-2016, and no 50% discount.
First, the results are shown in table 15 for the lowest set of costs used by Ofcom, £40k for site costs and £15k for equipment costs, the “very low” scenario.
10 In Part 2 of the main body of Vodafone’s response
21 Non- Confidential
Scenario for single 2100MHz operator, adopting any of the three alternative profiles, with costs of site = £40k, and equipment = £15k, i.e. “very low”
Site numbers Profile A (match at 2100MHz)
Profile B no match, subsequent deploy of
800MHz
Profile C deploy 900MHz
Lower freq
Higher freq
Ofcom original table 3
Model result
Ofcom original table 3
Model result
Ofcom original table 3
Incumbent 900MHz operator
Acquiring 900MHz operator
No. No. £m £m £m £m £m £m £m
Medium A Low 4,125 10,594 775 334 500 230 525 262 277
Medium A Base 4,250 11,188 850 379 500 232 525 265 280
Medium A High 4,375 11,781 925 424 500 234 525 268 283
Medium B Low 4,500 12,656 1,100 490 525 236 550 272 286
Medium B Base 4,500 12,938 1,100 510 525 236 550 272 286
Medium B High 4,500 13,219 1,100 531 525 236 550 272 286
High Low 5,125 15,375 1,400 698 525 246 575 288 302
High Base 5,750 17,250 1,800 873 600 274 625 304 317
High High 6,375 19,125 2,100 1,069 675 318 675 326 337
Table 15: profiles A – C, single operator, “very low” unit costs
The next set of results, table 16, is for the other set of costs described by Ofcom as low, i.e. £50k site costs and £25k equipment costs, the “low/medium” scenario.
Scenario for single 2100MHz operator, adopting any of the three alternative profiles, with costs of site = £50k, and equipment = £25k, i.e. the “low/medium”
Site numbers Profile A (match at 2100MHz)
Profile B no match, subsequent deploy of
800MHz
Profile C deploy 900MHz
Lower freq
Higher freq
Ofcom original table 3
Model result
Ofcom original table 3
Model result
Ofcom original table 3
Incumbent 900MHz operator
Acquiring 900MHz operator
No. No. £m £m £m £m £m £m £m
Medium A Low 4,125 10,594 775 491 500 353 525 397 419
Medium A Base 4,250 11,188 850 552 500 356 525 403 425
Medium A High 4,375 11,781 925 613 500 359 525 408 430
Medium B Low 4,500 12,656 1,100 701 525 362 550 414 435
Medium B Base 4,500 12,938 1,100 728 525 362 550 414 435
Medium B High 4,500 13,219 1,100 755 525 362 550 414 435
High Low 5,125 15,375 1,400 980 525 379 575 441 460
High Base 5,750 17,250 1,800 1,215 600 418 625 468 486
High High 6,375 19,125 2,100 1,474 675 478 675 502 518
Table 16: profiles A – C, single operator, “low/medium” unit costs
Table 17 below supplies the outcome as Ofcom’s very high costs, i.e. £75k for site build, and £65k for equipment.
22 Non- Confidential
Scenario for single 2100MHz operator, adopting any of the three alternative profiles, with costs of site = £75k, and equipment = £65k, i.e. “very high”
Site numbers Profile A (match at 2100MHz)
Profile B no match, subsequent deploy
of 800MHz
Profile C deploy 900MHz
Lower freq
Higher freq
Ofcom original table 3
Model result
Ofcom original table 3
Model result
Ofcom original table 3
Incumbent 900MHz operator
Acquiring 900MHz operator
No. No. £m £m £m £m £m £m £m
Medium A Low 4,125 10,594 775 1,063 500 815 525 905 952
Medium A Base 4,250 11,188 850 1,173 500 824 525 919 965
Medium A High 4,375 11,781 925 1,282 500 832 525 933 978
Medium B Low 4,500 12,656 1,100 1,440 525 840 550 948 992
Medium B Base 4,500 12,938 1,100 1,488 525 840 550 948 992
Medium B High 4,500 13,219 1,100 1,536 525 840 550 948 992
High Low 5,125 15,375 1,400 1,945 525 884 575 1,019 1,058
High Base 5,750 17,250 1,800 2,364 600 976 625 1,089 1,123
High High 6,375 19,125 2,100 2,819 675 1,086 675 1,169 1,200
Table 17: profiles A – C, single operator, “very high” unit costs
Finally, for completeness, the results are shown again at £60k site cost and £45k equipment cost, the “high/medium” scenario.
Scenario for single 2100MHz operator, adopting any of the three alternative profiles, with costs of site = £60k, and equipment = £45k, i.e. “high/medium”
Site numbers Profile A (match at 2100MHz)
Profile B no match, subsequent deploy
of 800MHz
Profile C deploy 900MHz
Lower freq
Higher freq
Ofcom original table 3
Model result
Ofcom original table 3
Model result
Ofcom original table 3
Incumbent 900MHz operator
Acquiring 900MHz operator
No. No. £m £m £m £m £m £m £m
Medium A Low 4,125 10,594 775 768 500 579 525 645 679
Medium A Base 4,250 11,188 850 851 500 585 525 655 688
Medium A High 4,375 11,781 925 933 500 591 525 665 698
Medium B Low 4,500 12,656 1,100 1,053 525 597 550 675 707
Medium B Base 4,500 12,938 1,100 1,190 525 597 550 675 707
Medium B High 4,500 13,219 1,100 1,126 525 597 550 675 707
High Low 5,125 15,375 1,400 1,435 525 626 575 724 753
High Base 5,750 17,250 1,800 1,753 600 696 625 773 798
High High 6,375 19,125 2,100 2,100 675 778 675 829 852
Table 18: profiles A – C, single operator, “high/medium” unit costs
Similarly, for the RAN pair of operators, Vodafone used above a set of costs of £60k for site build and £60k for equipment costs as a joint cost. Applying similar principles to flex all four of the possible sets of unit costs gives the following scenarios:
“Very low” – site costs £40k and equipment costs £20k (was £15k for single operator)
23 Non- Confidential
“Low/medium” – site costs £50k and equipment costs £33k (£25k)
“Medium/high” – site costs £60k and equipment costs £60k – version already calculated
“High/very high” – site costs £75k and equipment costs £86k (£65k)
The results of the Ofcom deployment profile scenarios calculated for each of these unit costs are shown below as tables 19-22.
Scenario for RAN pair of 2100MHz operators, giving joint costs of adopting any of the three alternative profiles, costs £40k and £20k, i.e. “very low”
Site numbers Profile A (match at 2100MHz)
Profile B no match,
subsequent deploy of 800MHz
Profile C deploy 900MHz
Lower freq
Higher freq
Ofcom table 3
Model result
Ofcom table 3
Model result
Ofcom table 3
Incumbent 900MHz operator
Acquiring 900MHz operator
No. No. £m £m £m £m £m £m £m
Medium A Low 4,125 10,594 1,100 393 750 282 750 318 336
Medium A Base 4,250 11,188 1,250 442 750 285 750 322 340
Medium A High 4,375 11,781 1,350 490 750 287 750 327 344
Medium B Low 4,500 12,656 1,550 561 750 290 800 331 348
Medium B Base 4,500 12,938 1,600 582 750 290 800 331 348
Medium B High 4,500 13,219 1,650 604 750 290 800 331 348
High Low 5,125 15,375 2,000 784 800 303 850 353 368
High Base 5,750 17,250 2,600 972 850 335 900 375 388
High High 6,375 19,125 3,000 1,179 1,000 383 950 401 414
Table 19: profiles A – C, RAN pair, “very low” unit costs

24 Non- Confidential
Scenario for RAN pair of 2100MHz operators, giving joint costs of adopting any of the three alternative profiles, costs £50k and £33k, i.e. “low/medium”
Site numbers Profile A (match at 2100MHz)
Profile B no match,
subsequent deploy of 800MHz
Profile C deploy 900MHz
Lower freq
Higher freq
Ofcom table 3
Model result
Ofcom table 3
Model result
Ofcom table 3
Incumbent 900MHz operator
Acquiring 900MHz operator
No. No. £m £m £m £m £m £m £m
Medium A Low 4,125 10,594 1,100 586 750 436 750 487 513
Medium A Base 4,250 11,188 1,250 652 750 440 750 494 520
Medium A High 4,375 11,781 1,350 718 750 444 750 502 527
Medium B Low 4,500 12,656 1,550 814 750 449 800 509 534
Medium B Base 4,500 12,938 1,600 843 750 449 800 509 534
Medium B High 4,500 13,219 1,650 872 750 449 800 509 534
High Low 5,125 15,375 2,000 1,118 800 470 850 545 567
High Base 5,750 17,250 2,600 1,372 850 515 900 581 600
High High 6,375 19,125 3,000 1,651 1,000 582 950 623 641
Table 20: profiles A – C, RAN pair, “low/medium” unit costs
Scenario for RAN pair of 2100MHz operators, giving joint costs of adopting any of the three alternative profiles, costs £60k and £60k, i.e. “high/medium”
Site numbers Profile A (match at 2100MHz)
Profile B no match,
subsequent deploy of 800MHz
Profile C deploy 900MHz
Lower freq
Higher freq
Ofcom table 3
Model result
Ofcom table 3
Model result
Ofcom table 3
Incumbent 900MHz operator
Acquiring 900MHz operator
No. No. £m £m £m £m £m £m £m
Medium A Low 4,125 10,594 1,100 946 750 735 750 814 855
Medium A Base 4,250 11,188 1,250 1,039 750 743 750 827 867
Medium A High 4,375 11,781 1,350 1,132 750 751 750 840 880
Medium B Low 4,500 12,656 1,550 1,265 750 759 800 853 892
Medium B Base 4,500 12,938 1,600 1,306 750 759 800 853 892
Medium B High 4,500 13,219 1,650 1,346 750 759 800 853 892
High Low 5,125 15,375 2,000 1,695 800 798 850 919 954
High Base 5,750 17,250 2,600 2,049 850 866 900 984 1,014
High High 6,375 19,125 3,000 2,432 1,000 962 950 1,056 1,083
Table 21: profiles A – C, RAN pair, “high/medium” unit costs

25 Non- Confidential
Scenario for RAN pair of 2100MHz operators, giving joint costs of adopting any of the three alternative profiles, costs £75k and £86k, i.e. “very high”
Site numbers Profile A (match at 2100MHz)
Profile B no match,
subsequent deploy of 800MHz
Profile C deploy 900MHz
Lower freq
Higher freq
Ofcom table 3
Model result
Ofcom table 3
Model result
Ofcom table 3
Incumbent 900MHz operator
Acquiring 900MHz operator
No. No. £m £m £m £m £m £m £m
Medium A Low 4,125 10,594 1,100 1,313 750 1,034 750 1,141 1,198
Medium A Base 4,250 11,188 1,250 1,436 750 1,045 750 1,159 1,216
Medium A High 4,375 11,781 1,350 1,560 750 1,056 750 1,178 1,233
Medium B Low 4,500 12,656 1,550 1,737 750 1,067 800 1,197 1,251
Medium B Base 4,500 12,938 1,600 1,791 750 1,067 800 1,197 1,251
Medium B High 4,500 13,219 1,650 1,844 750 1,067 800 1,197 1,251
High Low 5,125 15,375 2,000 2,308 800 1,123 850 1,292 1,339
High Base 5,750 17,250 2,600 2,777 850 1,217 900 1,384 1,425
High High 6,375 19,125 3,000 3,283 1,000 1,345 950 1,486 1,523
Table 22: profiles A – C, RAN pair, “very high” unit costs
It is possible from these results to build table 23 below that more reasonably shows the range of possible outcomes from the eight tables above, and how these outcomes differ from those shown by Ofcom in table 7 of annex 7 – for consistency with Ofcom’s work on productive efficiency costs the base result has been shown using the “high/medium” site costs of £60k + £45k, although as noted above to be consistent with the costs of clearance, the lower site costs of £50k + £25k, the low/medium scenario shown below, should perhaps have been used as the base result (this would obviously have further increased the difference between Vodafone and Ofcom on the base result).

26 Non- Confidential
Scenario Costs used Site volumes
Low £m
Base £m
High £m
Single operator, medium significance, all operators can match, difference between profiles A and C
Vodafone very low 57 99 141
Vodafone low/medium 72 127 183
Vodafone base/high 89 163 235
Vodafone very high 111 208 304
Vodafone max/min 57 163 304
Ofcom base/high (as previously used)
250 325 400
Reduction from Ofcom 193 162 96
% reduction 77% 50% 24%
RAN shared pair, medium significance, where all operators can match, difference between profiles A and C
Vodafone very low 57 102 146
Vodafone low/medium 73 132 191
Vodafone base/high 91 172 252
Vodafone very high 115 220 327
Vodafone max/min 57 172 327
Ofcom base/high (as previously used)
350 475 575
Reduction from Ofcom 293 303 248
% reduction 84% 64% 43%
RAN shared pair, medium significance, where only the RAN pair can match, difference between profiles A and C
Vodafone very low 213 234 256
Vodafone low/medium 280 309 338
Vodafone base/high 373 414 454
Vodafone very high 486 540 593
Vodafone max/min 213 414 593
Ofcom base/high (as previously used)
750 800 850
Reduction from Ofcom 537 386 257
% reduction 72% 52% 30%
Table 23: Differential cost A minus C, Ofcom vs. Vodafone
Thus the very simple and logical changes suggested by Vodafone have very substantially reduced the productive efficiency differences between Profiles A and C for the 2100MHz operator.
But the difference between profiles A and C is not the only output from the cost differences model into the scenario analysis. Ofcom also presents in table 8 of annex 7 the productivity efficiency loss arising from earlier investment in a low frequency network, i.e. C vs. B, and in table 9 the productivity efficiency benefit from no longer deploying so many sites at 2100MHz, i.e. A vs. B. It is worth examining how these two tables have changed.
27 Non- Confidential
For B vs. C, i.e. “the wait for 800MHz vs. the rush to 900MHz” the absolute values of the results are relatively small, so only a sample of the outputs are shown in table 24 below:
Scenario Costs used Site volumes
Low £m
Base £m
High £m
Single operator, medium significance, all operators can match, difference between profiles B and C, i.e. the efficiency cost of investing in a low frequency network earlier
Vodafone very low 47 48 49
Vodafone low/medium 66 69 71
Vodafone base/high 100 103 107
Vodafone very high 137 141 146
Vodafone max/min 47 103 146
Ofcom base/high (as previously used)
15 20 20
Increase from Ofcom 32 83 126
RAN shared pair, medium significance, where all operators can match, difference between profiles B and C
Vodafone very low 54 55 57
Vodafone low/medium 77 80 83
Vodafone base/high 120 124 129
Vodafone very high 164 171 177
Vodafone max/min 54 124 177
Ofcom base/high (as previously used)
20 25 30
Increase from Ofcom 34 99 147
RAN shared pair, medium significance, where only the RAN pair can match, difference between profiles B and C
Vodafone very low 58 58 58
Vodafone low/medium 85 85 85
Vodafone base/high 133 133 133
Vodafone very high 184 184 184
Vodafone max/min 58 133 184
Ofcom base/high (as previously used)
35 35 35
Increase from Ofcom 23 98 149
Table 24: Differential cost B and C, Ofcom vs. Vodafone
Thus the productive efficiency benefit of later lower spectrum deployment have increased – the homogeneity of the results of the third set of scenarios above arises from the fact that as noted in Part 2 of the main body of Vodafone’s response the low, base and high variants all somewhat incongruously use the same number of sites for low frequency deployment, i.e. 4,500.
Table 25 below compares the results between Ofcom and Vodafone on the difference between A and B, i.e. the benefit of not attempting to match at 2100MHz.
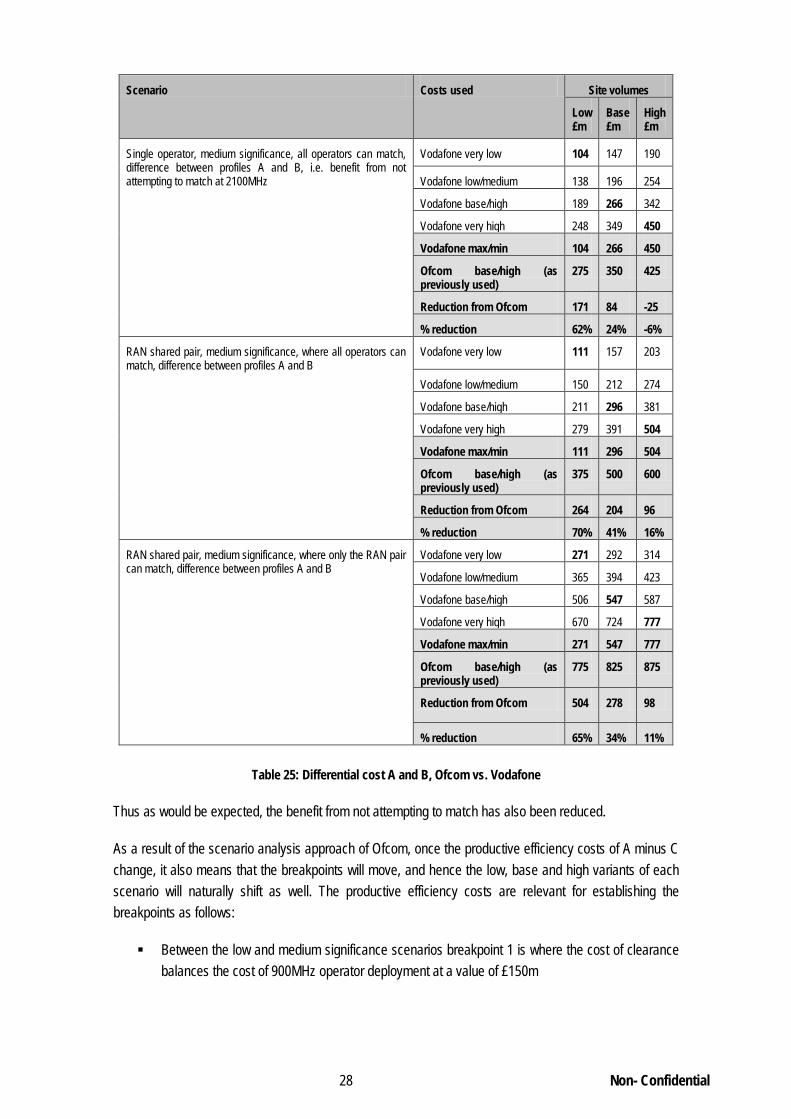
28 Non- Confidential
Scenario Costs used Site volumes
Low £m
Base £m
High £m
Single operator, medium significance, all operators can match, difference between profiles A and B, i.e. benefit from not attempting to match at 2100MHz
Vodafone very low 104 147 190
Vodafone low/medium 138 196 254
Vodafone base/high 189 266 342
Vodafone very high 248 349 450
Vodafone max/min 104 266 450
Ofcom base/high (as previously used)
275 350 425
Reduction from Ofcom 171 84 -25
% reduction 62% 24% -6%
RAN shared pair, medium significance, where all operators can match, difference between profiles A and B
Vodafone very low 111 157 203
Vodafone low/medium 150 212 274
Vodafone base/high 211 296 381
Vodafone very high 279 391 504
Vodafone max/min 111 296 504
Ofcom base/high (as previously used)
375 500 600
Reduction from Ofcom 264 204 96
% reduction 70% 41% 16%
RAN shared pair, medium significance, where only the RAN pair can match, difference between profiles A and B
Vodafone very low 271 292 314
Vodafone low/medium 365 394 423
Vodafone base/high 506 547 587
Vodafone very high 670 724 777
Vodafone max/min 271 547 777
Ofcom base/high (as previously used)
775 825 875
Reduction from Ofcom 504 278 98
% reduction 65% 34% 11%
Table 25: Differential cost A and B, Ofcom vs. Vodafone
Thus as would be expected, the benefit from not attempting to match has also been reduced.
As a result of the scenario analysis approach of Ofcom, once the productive efficiency costs of A minus C change, it also means that the breakpoints will move, and hence the low, base and high variants of each scenario will naturally shift as well. The productive efficiency costs are relevant for establishing the breakpoints as follows:
Between the low and medium significance scenarios breakpoint 1 is where the cost of clearance balances the cost of 900MHz operator deployment at a value of £150m

29 Non- Confidential
Between the two medium scenarios, A and B, breakpoint 2 is where the gross profit from Cournot model balances the incremental cost of 2100MHz deployment over 900MHz deployment at a value of £470m
Between the medium and high significance scenarios breakpoint 3 is where the practicality limit of 2100MHz deployment i.e. 13,500 sites at present cuts in before the gross profit from Cournot model balances the incremental cost of 2100MHz deployment over 900MHz deployment at £1.4bn
Keeping the other three variables, i.e. the cost of clearance, the competition benefits and the rate of deployment as per the values adopted by Ofcom, it is clear that breakpoints 1 and 2 may have changed as a result of Vodafone’s revision to Ofcom’s calculation of the productive efficiency costs.
Breakpoint 1 needs a profile A minus profile C cost for the 900MHz operator of £150m. Inspection of the tables above suggests it will be somewhat above the Ofcom level of 4,000 900MHz sites and 10,000 2100MHz sites. Taking Vodafone’s expectation from the breakpoint analysis in Part 2 of the main body of Vodafone’s response that it would be reasonable to expect a site ratio of 1:3 at the lower traffic levels (rather than Ofcom’s expectation of 1:2.5) and goal-seeking into Vodafone’s version of the cost differences model from above gives a result of 3,450 900MHz sites against 10,350 2100MHz sites. Note that for the purposes of breakpoint 1 it is the behaviour of (and thus the cost implications for) the incumbent 900MHz operator, not the 2100MHz operator that is of relevance. This result was obtained using the input costs of £60k and £45k, the high/medium scenario already established as being inconsistent with the unit costs used for the site clearance exercise. When the consistent level of costs is used in the cost differences model, i.e. the low/medium of £50k and £25k, the result is that breakpoint 1 moves up to 3,700 900MHz sites and 11,100 2100MHz sites.
Breakpoint 2 relates to the 2100MHz operators’ behaviour, where the difference for them between profiles A and C is given as £470m. Assuming a 1:2.6 ratio for this point, as the ratio between 900MHz and 2100MHz starts to flatten as traffic volumes rise, then a cost difference of £470m is reached at a relative site build position of 5,300 and 13,780, using input costs as Ofcom of £60k and £45k. Unfortunately this takes the 2100MHz build above Ofcom’s practicality limit of 13,500. If we assume as in Part 2 that at this volume of site build the ratio should be not 1:2.6, but closer to 1:2.25, then a breakpoint 2 solution could be arrived at around 6,050 900MHz sites, and 13,613 2100MHz sites, but this is still above the practicality breakpoint defined in breakpoint 3, suggesting that on this analysis breakpoints 2 and 3 are identical, and hence that Ofcom’s medium significance scenario B might not exist in reality. Switching to the use of unit input costs of £50k and £25k, to be consistent with the cost of clearance work, gives results of 6,600 vs. 14,850 sites with a ratio of 1:2.25, or 5,700 vs. 14,820 sites at a ratio of 1:2.6. Both results for the 2100MHz sites are again comfortably above the 13,500 practicality limit of breakpoint 3.
Therefore on this analysis, breakpoints 2 and 3 should be at the same place, with 13,500 2100MHz sites, and say 6,000 900MHz sites (using a 2.25 ratio), and the medium B scenario cannot exist. If the medium B scenario cannot exist, then the very considerable benefit claimed for it by Ofcom, for example in table 59 of annex 7, disappears, and the assessment by Ofcom in table 112 of that annex of the benefits of one block release in the medium scenario, the average of tables 59 and 64, falls from the base variant £450m average to the £250m result of table 64. (But table 64 employs a gross productive efficiency benefit of

30 Non- Confidential
£475m – Vodafone table 23 above suggests that this is overstated by £303m – so adjusting for this will mean that table 64 will give a negative, not a positive result.)
Table 26 below tabulates these possible revisions to the breakpoints, from the correction to the A-C costs above.
Ofcom no. of sites Vodafone no. of sites,
revised A-C costs, “high/medium” unit costs
Vodafone no. of sites, revised A-C costs,
“low/medium” unit costs
At 800/900M
Hz
At 2100
MHz
At 800/900
MHz
At 2100
MHz
At 800/900
MHz
At 2100
MHz
Breakpoint 1 4,000 10,000 3,575 10,725 3,700 11,100
Medium significance scenario, where all 2100MHz operators can match
Low 4,125 10,594 4,181 11,419 4,275 11,700
Base 4,250 11,188 4,787 12,113 4,850 12,300
High 4,375 11,781 5,393 12,807 5,425 12,900
Breakpoint 2 4,500 12,375 6,000 13,500 6,000 13,500
Medium significance scenario, where only the RAN pair can match
Low 4,500 12,656 No solution No solution No solution No solution
Base 4,500 12,938 No solution No solution No solution No solution
High 4,500 13,219 No solution No solution No solution No solution
Breakpoint 3 4,500 13,500 6,000 13,500 6,000 13,500
High significance scenario Low 5,125 15,375 6,250 15,375 6,250 15,375
Base 5,750 17,250 6,500 17,250 6,500 17,250
High 6,375 19,125 6,750 19,125 6,750 19,125
Breakpoint 4 7,000 21,000 7,000 21,000 7,000 21,000
Table 26: Ofcom breakpoints and possible Vodafone alternatives
This result comes out of the perfectly reasonable and simple adjustments to the Ofcom cost modelling explored in this annex, to improve internal consistency with the rest of the spectrum consultation. Vodafone has not attempted the next stage in the circle, i.e. to go back into the cost differences model and re-populate tables 15 – 26 above with revised costs for the re-located low, base and high points of each of the significance scenarios, since annexes 1 - 3 above bring into question all of the values Ofcom has used to define the breakpoints, making the results of table 26 above rendered irrelevant. At the end of Part 3 of the main body of work Vodafone does attempt to re-run Ofcom’s scenario analysis with a full set of Vodafone inputs.
The point of the exercise just conducted however was to illustrate the volatility of Ofcom’s results, and that the very significant changes to the breakpoints and the variants of each of the significance scenarios that arise from the work in this annex further puts in question the robustness of Ofcom’s reported results of its scenario analysis.

1 Non- Confidential
Annex 6
Data Markets
Confidential

1 Non- Confidential
Annex 7
Confidential
Ofcom’s volume scenarios