Embed Size (px)
Citation preview

Oxera Draft for Comment: Strictly Confidential i
The cost of capital of BT
An assessment in relation to Ofcom’s WBA charge control consultation
Report prepared for BT
April 2011

Oxera Consulting Ltd is registered in England No. 2589629 and in Belgium No. 0883.432.547. Registered offices at Park Central, 40/41 Park End Street, Oxford, OX1 1JD, UK, and Stephanie Square Centre, Avenue Louise 65, Box 11, 1050 Brussels, Belgium. Although every effort has been made to ensure the accuracy of the material and the integrity of the analysis presented herein, the Company accepts no liability for any actions taken on the basis of its contents.
Oxera Consulting Ltd is not licensed in the conduct of investment business as defined in the Financial Services and Markets Act 2000. Anyone considering a specific investment should consult their own broker or other investment adviser. The Company accepts no liability for any specific investment decision, which must be at the investor’s own risk.
© Oxera, 2011. All rights reserved. Except for the quotation of short passages for the purposes of criticism or review, no part may be used or reproduced without permission.

Oxera The cost of capital of BT i
Executive summary
In January 2011, Ofcom issued a consultation document on its ‘Proposals for WBA charge control’,1 which contains a detailed discussion of its estimation of BT’s cost of capital for the period April 2013–March 2014. Ofcom’s point estimate of the pre-tax nominal cost of capital for this period is 8.9%, which is significantly lower than its previous estimate in May 2009,2 which was 10.6%. As acknowledged by Ofcom, considerable uncertainty continues to surround certain key parameters, so the most recent consultation covers a range for the cost of capital estimates of between 8.2% and 9.7%.
In this context, BT commissioned Oxera to undertake an independent assessment of the overall cost of capital of BT Group and the underlying parameters, taking into account the market data available up to March 2011, the regulatory precedents and other relevant information.
Based on Oxera’s assessment, an appropriate range for BT’s cost of capital for the 2013/14 period would be 10.4–10.8%.3 This is above Ofcom’s proposed range in the January 2011 consultation document, but similar to Ofcom’s May 2009 determination.
Table 1 Cost of capital estimation for BT
Weighted average cost of capital (WACC) parameter
Ofcom May 2009
Ofcom January 2011
Oxera March 2011
Real risk-free rate (%) 2 1.5 1.5–2
Inflation (%) 2.5 2.5 2.5–3
Nominal risk-free rate (%) 4.5 4 4–5
Equity risk premium (%) 5 5 4.5–5.5
Equity beta (estimated) 0.9 0.78-1.08 0.9–1.0
Gearing for de-levering (%) 38 50–53 40
Asset beta1 0.61 0.45–0.60 0.59–0.65
Gearing for re-levering (%) 35 50 40
Equity beta (re-levered) 0.86 0.78–1.08 0.90–1.0
Debt premium (%) 3 2–2.5
Cost of debt (%) 8.02
Tax (%) 28 25 25
WACC (pre-tax nominal) (%) 10.6 8.2–9.73 10.4–10.84 Note: 1 The asset beta is estimated based on the assumption that the debt beta is 0.125, which is consistent with Ofcom’s proposal in its January 2011 consultation document. 2 This is the weighted average cost of new and embedded debt. 3 This is the extended range considered by Ofcom, not the range implied by the parameters shown in the column (which is 8.3–9.5%). 4 The WACC estimation is based on the point estimates of the nominal risk-free rate (4.5%) and ERP (5%). Source: Ofcom (2009), ‘A new pricing framework for Openreach’, May, p. 24, Table 4.4. Ofcom (2011), ‘Proposals for WBA charge control—Consultation document and draft notification of decisions on charge control in WBA Market’, January 20th, p. 83, Table 6.3. Oxera calculations.
1 Ofcom (2011), ‘Proposals for WBA charge control—Consultation document and draft notification of decisions on charge control in WBA Market’, January 20th. 2 Ofcom (2009), ‘A new pricing framework for Openreach’, May. 3 The results presented in this report are based on market data up to March 11th 2011. The market data has since evolved, but this does not affect the conclusions of the report.

Oxera The cost of capital of BT ii
The assessment of the key parameters discussed in this report can be summarised as follows.
Risk-free rate
Given that the cost of capital estimation is for the period of 2013/14, the real risk-free rate expected for this period is the most relevant starting point for the analysis. The current market data implies that the market expects the real risk-free rate for five-year borrowing to be 1.23% by September 2013.4 This is substantially higher than the current yields on index-linked gilts (ILGs).
Moreover, the implied future yields are very volatile. For example, the market data of the past three months shows that the implied future yields on five- and ten-year ILGs for 2013/14 fluctuated in a range of 1.2–1.6%. This evidence suggests that the real risk-free rate assumption of Ofcom (1.5%) provides little headroom for this parameter.
To address the uncertainty in forecasting the risk-free rate and lessen the risk of underestimating the rate that might prevail during the price control period, regulators have tended to allow for headroom by assuming a risk-free rate higher than the level implied by the market rates. Applying conservative headroom to the expected real risk-free rate implied by the market data suggests that an appropriate estimate of the rate for 2013/14 would be a range of 1.5–2%. The top end of this range is consistent with the August 2010 decision of the Competition Commission (CC) in the Bristol Water reference, where the CC adopted 2% as the point estimate for the real risk-free rate.5
In addition to high actual inflation, evidence from forecasts of RPI inflation for 2013/14, as well as the implied future RPI inflation based on five-year gilts and swaps contracts, suggests that the 2.5% inflation rate assumption proposed by Ofcom may be too low for 2013/14. A more appropriate estimate would be a range from 2.5–3% (with a point estimate at the upper end).
Overall, this suggests that the nominal risk-free rate would be in the range of 4–5%, with a point estimate of 4.5%, which is higher than Ofcom’s 4% assumption.
Equity risk premium
There is still much uncertainty in capital markets, and the impact of the recent financial crisis on required equity returns remains unclear. As a result, there is a considerable amount of uncertainty surrounding the future equity risk premium (ERP). Based on evidence from historical market returns, forward-looking estimates, and surveys of industry practitioners and other experts, an appropriate ERP assumption for estimating the cost of capital for 2013/14 is a range of 4.5–5.5%, with a point estimate of 5%. This corresponds to the ERP assumption in Ofcom’s consultation document.
The 5% ERP point estimate is also consistent with the ERP used by the CC in its 2010 decisions on the LLU Appeal6 and Bristol Water reference,7 but is somewhat lower than the 5.25% used in the NATS determination by the Civil Aviation Authority.8
4 September 2013 is used as a reference date for the cost of capital estimation for BT for 2013/14. 5 Competition Commission (2010), ‘Bristol Water plc—A reference under section 12(3)(a) of the Water Industry Act 1991’, August 4th, p. 65, para 9.14 and Table 1. 6 Competition Commission (2010), ‘The Carphone Warehouse Group plc v Office of Communications: Reference under section 193 of the Communications Act 2003’, August, para 2.387. 7 Competition Commission (2010), ‘Bristol Water plc—A reference under section 12(3)(a) of the Water Industry Act 1991’, August 4th, p. N27, para 164. 8 CAA (2010), ‘NATS plc price control: CAA formal proposals for control period 3 (2011-2014): under section 11 of transport act 2000’, October, p. 156.

Oxera The cost of capital of BT iii
Equity and asset beta
Since the start of the financial crisis, BT’s gearing has experienced a substantial swing, rising from below 40% to over 60% in the one-year period ending March 2009 and then declining steadily to just under 38% by March 2011. Despite this, the estimated equity beta for BT has remained relatively stable over this period.
A review of brokers and analysts’ reports on BT published between 2009 and 2011 suggests that there is no reliable evidence to support the premise that the systematic business risk of BT has declined in the past two years.
Moreover, evidence from different market sources provides strong support to the view that the actual high gearing level in the past few years was expected to be temporary. For example, since 2009, BT has actively communicated with the market about its intention to reduce net debt; BT’s gearing has declined steadily in the past two years; professional analysts who follow BT regularly have forecast lower net debt and, in some cases, made explicit gearing assumptions in their valuation models that are more consistent with BT’s historical gearing levels. All this suggests that the market did not change its view of the long-run gearing level for BT and that the gearing level reflected in BT’s share price was the forward-looking (rather than the actual) gearing.
Equity beta is estimated to be in the range of 0.9–1.0. Since BT’s share prices over the past few years appear to have reflected a forward-looking gearing, the same forward-looking gearing (which is conservatively estimated to be 40%) is used to de-lever the estimated equity beta and to re-lever the resulting asset beta. The resulting asset beta estimates of 0.59–0.65 are higher than those contained in Ofcom’s January 2011 consultation, but similar to those of Ofcom’s May 2009 determination. These estimates are consistent with the evidence that the business risk of BT did not experience an identifiable decline during the past two years.
Cost of debt
Focusing solely on the cost of new debt, the evidence on the spreads of BT’s bonds and the BBB rated bond index suggests that the 2–2.5% range of the debt premium proposed by Ofcom is appropriate. Combining the range of debt premium estimates with the point estimate for the nominal risk-free rate (4.5%) implies that the cost of new debt is in the range of 6.5–7%.
However, following the CC’s approach to estimate the cost of debt as the weighted average cost of new and embedded debt would result in a much higher cost of debt estimate.9 This approach ensures that regulated companies earn sufficient revenue to service their existing debt that is incurred efficiently and prudently. The cost of the embedded debt for BT in 2013/14 is estimated conservatively to be 8.0%, which is significantly higher than the cost of new debt.
9 Competition Commission (2010), ‘Bristol Water plc—A reference under section 12(3)(a) of the Water Industry Act 1991’, August 4th, p. 65, para 9.13. Competition Commission (2008), ‘Stansted Airport Ltd, Q5 price control review’, Appendix L, October 23rd, pp L8–L11. Competition Commission (2007), ‘BAA Ltd: A report on the economic regulation of the London airport companies (Heathrow Airport Ltd and Gatwick Airport Ltd), appendix F, September, p. F11.

Oxera The cost of capital of BT
Oxera The cost of capital of BT
Contents
1 Introduction 1
2 Risk-free rate 2 2.1 Real risk-free rate 2 2.2 Inflation 6 2.3 Nominal risk-free rate 13 2.4 Summary 14
3 Equity risk premium 15 3.1 Historical evidence 15 3.2 Forward-looking evidence 17 3.3 Survey-based evidence 20 3.4 Summary 21
4 Equity and asset beta 22 4.1 Methodological approach 22 4.2 Gearing 26 4.3 BT’s asset beta and business risk 34 4.4 Summary 35
5 Cost of debt 37 5.1 Cost of new debt for BT 37 5.2 The CC’s approach to the cost of debt 40 5.3 Summary 41
6 Overall estimation of BT’s cost of capital 42
List of tables Table 1 Cost of capital estimation for BT i Table 2.1 UK ILG yields (%) 3 Table 2.2 HM Treasury averages of independent medium-term inflation forecasts 10 Table 2.3 Implied inflation rates based on five-year gilts and five-year swaps 12 Table 2.4 Advantages and disadvantages of the different inflation measures 13 Table 3.1 Dimson, Marsh and Staunton 2011 ERP estimates (%) 16 Table 3.2 ERP forecasts based on a one-stage dividend growth model 19 Table 3.3 Survey evidence on the ERP 20 Table 4.1 Equity beta of BT as at March 11th 2011 26 Table 4.2 Equity beta estimates of BT from May 2009 to March 11th 2011 26 Table 4.3 BT net debt estimation (£m) 28 Table 4.4 Net debt forecast by analysts (£m) 31 Table 4.5 Equity beta and asset beta used for BT’s cost of capital estimation 36 Table 5.1 Spread on BT’s sterling-denominated bonds 38 Table 5.2 Estimates of spread on bond indices, by credit ratings 39 Table 5.3 Effective cost of BT’s fixed-rate bonds in 2013/14 41 Table 6.1 Cost of capital estimation for BT 42
Oxera The cost of capital of BT
List of figures Figure 2.1 UK ILG yields (%) 3 Figure 2.2 Current and future real yield curve implied for September 2013 (%) 4 Figure 2.3 Implied future yields on five- and ten-year ILGs in 2.5 and 3 years’ time 5 Figure 2.4 Inflation—year-on-year growth rate in the RPI and CPI 8 Figure 2.5 CPI inflation projections as at May 2009 and February 2011 9 Figure 2.6 Implied inflation rates from five-year gilts 10 Figure 2.7 Implied inflation rates from gilts of different maturities 11 Figure 2.8 Implied inflation rates from inflation-linked swaps 12 Figure 2.9 Implied future nominal yields on five- and ten-year gilts in 2.5 and 3 years’
time 14 Figure 3.1 UK equity risk premia 18 Figure 3.2 Implied volatility of the FTSE 100 index (%) 19 Figure 4.1 One-year equity beta against alternative market benchmarks 24 Figure 4.2 Two-year equity beta against alternative market benchmarks 25 Figure 4.3 Five-year equity beta against alternative market benchmarks 25 Figure 4.4 Gearing estimates based on Bloomberg net debt and BT adjusted net debt 29 Figure 4.5 BT’s share price and gearing 30 Figure 4.6 One-year rolling equity beta and gearing averages 32 Figure 4.7 Two-year rolling equity beta and gearing averages 32 Figure 4.8 Five-year rolling equity beta and gearing averages 33 Figure 4.9 BT’s asset beta under different de-levering assumptions 35 Figure 5.1 Spreads on BT’s outstanding bonds 38 Figure 5.2 Spread on UK corporate bond indices, by credit rating 39

Oxera The cost of capital of BT 1
1 Introduction
Following Ofcom’s January 2011 consultation on BT’s cost of capital as part of the WBA price control (‘Proposals for WBA Charge Control’),10 BT has commissioned Oxera to provide an independent assessment of BT Group’s cost of capital.
This report combines data from financial markets with regulatory precedents and other relevant information to provide an estimate of BT’s cost of capital. An estimate for each of the individual cost of capital parameters is provided in this report, together with an overall estimate of BT’s cost of capital. Consistent with Ofcom’s approach, an estimate of the pre-tax nominal cost of capital is estimated for the period April 2013–March 2014.
The report is structured as follows.
– Estimates of the risk-free rate are discussed in section 2. This includes an assessment of yields on index-linked gilts (ILGs) as well as various sources of inflation.
– Estimates of the equity risk premium (ERP) are presented in section 3. This includes a review of historical-looking estimates as well as forward-looking and survey-based evidence.
– Estimates of the equity beta are discussed in section 4, together with an analysis of the appropriate gearing level for deriving estimates of the asset beta for BT.
– Estimates of the cost of debt are reported in section 5. This includes an assessment of the cost of BT’s new debt as well as existing debt.
– An overall estimate of the cost of capital is reported in section 6.
10 Ofcom (2011), ‘Proposals for WBA charge control—Consultation document and draft notification of decisions on charge control in WBA Market’, January 20th.

Oxera The cost of capital of BT 2
2 Risk-free rate
In its January 2011 consultation document, Ofcom proposes a real risk-free rate of 1.5% and an inflation rate of 2.5% for 2013/14.11 Together, these imply a nominal risk-free rate of 4.0%.
Since the recent financial crisis, capital markets have experienced greater volatility than previously. This market volatility affects the yields on government bonds and gilts and presents a significant challenge for regulators seeking to determine the risk-free rate in price controls. This challenge also applies in relation to Ofcom’s charge control when estimating BT’s cost of capital for the 2013/14 period.
Spot yields on ILGs have fallen due to a combination of factors, such as loosened monetary policy and increased demand by investors for UK government bonds relative to other asset classes. However, both actual inflation and inflation expectations have increased, resulting in pressures for tighter monetary policy and higher interest rates in the future.
This section reviews the evidence on the (nominal) risk-free rate, including the yields on government bonds and gilts that are commonly used to estimate the risk-free rate, as well as the levels of actual and forecast inflation. The evidence discussed here suggests that Ofcom’s estimates of the real risk-free rate and the inflation rate are too low and do not incorporate sufficient headroom for market volatility. More appropriate estimates for the nominal risk-free rate would be in the range of 4–5%, with a point estimate of 4.5%.
2.1 Real risk-free rate
The risk-free rate measures the expected return on an investment free of default risk—ie, where the realised return on the investment will be equal to the expected return. In developed economies with minimal sovereign default risk, the risk-free rate is typically estimated with reference to government bond yields.
The following presents evidence on current yields, based on spot rates in the market, as well as implied forward yields, which are particularly relevant because the cost of capital in Ofcom’s charge control is estimated for 2013/14.
2.1.1 Spot rates Figure 2.1 below shows current yields on ILGs, based on spot rates in the market
11 Ofcom (2011), op. cit., pp. 89 and 90.

Oxera The cost of capital of BT 3
Figure 2.1 UK ILG yields (%)
Source: Bank of England.
Figure 2.1 shows that, in contrast to the relative stability over the 2006–08 period, since mid-2008 there have been extremely large movements in yields on ILGs—in particular, there has been a marked decline in yields on shorter-dated indices (see, for example, the yields of the five-year ILG). This effect is evident when comparing the current and two-year average yields against the five- and ten-year average yields of ILGs of different maturities—see Table 2.1.
Table 2.1 UK ILG yields (%)
5-year ILGs 10-year ILSs 20-year ILGs
Current (March 11th 20111) –0.37 0.54 0.80
2-year average 0.23 0.82 0.90
5-year average 1.26 1.30 1.06
10-year average 1.63 1.67 1.49 Note: 1 March 11th 2011 is used throughout the report as the cut-off point for the analysis. Source: Bank of England and Oxera calculations.
There are a number of possible explanations for the marked departure of yields in the past couple of years from their levels in the period preceding the financial crisis:
– loose monetary policy—official interest rates have been at a very low level of 0.5% since March 2009. The Bank of England has also completed significant asset purchases (in a programme referred to as ‘quantitative easing’), which has put additional downward pressure on government bond yields.12 There are some indications in the market that the interest rate is expected to increase, although it is currently unclear how soon this will be (see section 2.1.2 below);
12 See, for example, Joyce, M., Lasaosa, A., Stevens, I. and Tong, M. (2010), ‘The financial impact of quantitative easing’, Bank of England, Working paper No. 393, July.
-1.0
0.0
1.0
2.0
3.0
4.0
5.0
Mar 06 Sep 06 Mar 07 Sep 07 Mar 08 Sep 08 Mar 09 Sep 09 Mar 10 Sep 10 Mar 11
5-year real 10-year real 20-year real

Oxera The cost of capital of BT 4
– increased demand for government bonds—a reduction in investors’ ‘risk appetite’ meant that there has been a flight to quality into the sovereign debt markets;
– sovereign debt concerns in Continental Europe—increased demand for UK government bonds, which are perceived as less risky than government bonds of other European economies with more severe public debt problems.
Given that the cost of capital estimation for BT is for the future period of 2013/14 and that the current spot rates are unusually low, it is important to examine where the market expects the real risk-free rate to be in 2013/14. This can be done by looking at the implied forward rates.
2.1.2 Forward rates The implied forward rates are the interest rates of borrowing for a specified maturity as of a future point in time.13 Using the current yield curve, the entire expected term structure of interest rates for September 2013 (which is used as a reference date for the cost of capital estimation for BT for 2013/14) can be constructed.14
Figure 2.2 compares the current yield curve with the implied yield curve for September 2013. It shows that interest rates are expected to increase significantly from now to September 2013 across all maturities. The gap between the current and the implied future yield curve for September 2013 is particularly large for short- to medium-term borrowing.
Figure 2.2 Current and future real yield curve implied for September 2013 (%)
Source: Bank of England and Oxera calculations.
As noted above, the short end of the current yield curve may currently be distorted due to quantitative easing—an effect that has been recognised by the Competition Commission
13 The forward rate, denoted ft,T, is the return on the investment made at time t maturing at time T. In other words, it is the interest rate expected at time t for a period of (T – t). It can be derived from spot interest rates for maturities t and T, denoted
and using the no arbitrage condition. Mathematically, ft,T= (1+rT)T
(1+rt)t
1T-t
-1. 14 The Bank of England provides data on the zero-coupon real spot yield curve for maturities from 2.5 up to 25 years. The implied future yield curve is constructed using forward rates derived based on the formula in the previous footnote, with t = 2.5 years and T = 3.5 to 25 years.
-2.0%
-1.5%
-1.0%
-0.5%
0.0%
0.5%
1.0%
1.5%
0 1 2 3 4 5 6 7 8 9 10 11 12 13 14 15 16 17 18 19 20 21 22Maturity in years
Implied future yield curve ( September 11th 2013)
Spot yield curve (March 11th 2011)

Oxera The cost of capital of BT 5
(CC).15 However, the CC has also previously noted that the longer end of the yield curve may be distorted due to accounting rules and strong demand by institutional investors.16 This suggests that, in the current market, medium-term gilts may provide the most suitable basis for estimating the risk-free rate.
Based on the implied future yield curve shown in Figure 2.2, the five-year ILG yield that markets are currently (as at March 11th 2011) forecasting for September 11th 2013 is 1.23%. The markets’ forecast of the ten-year ILG yield for September 11th 2013 is 1.32%. These yields are 160 and 78 basis points (bp) higher than the current five- and ten-year spot yields of –0.37% and 0.54%, respectively.
Figure 2.2 above showed the implied future interest rates for different maturities as of September 2013. However, it would also be relevant to examine their likely stability as well as the range of the implied future interest rates of five- and ten-year gilts for the 2013/14 period,
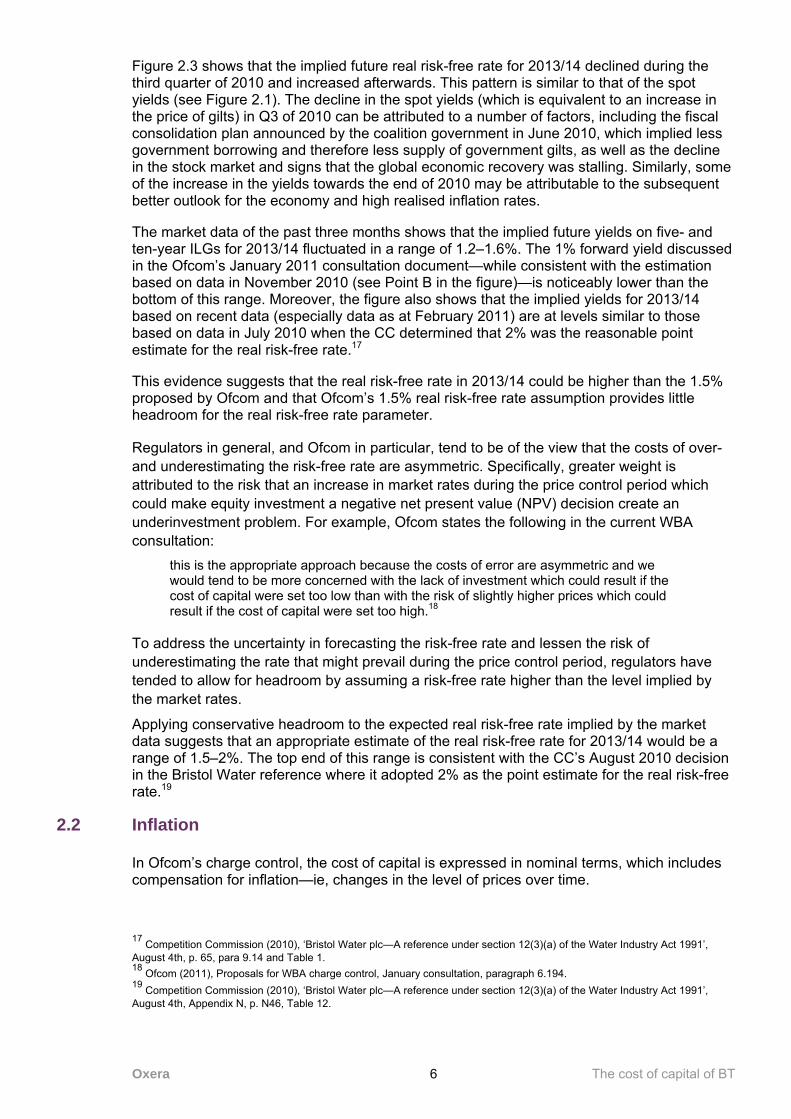
Figure 2.3 below shows the implied future yields on five- and ten-year ILGs in 2.5 and 3 years’ time, based on the market data on the date shown on the horizontal axis. For example, point A shows that, as at July 9th 2010, the implied yields on five- and ten-year ILGs for July 9th 2013 (3 years in the future) would be 1.48% and 1.54%, respectively. Point C shows that, as at February 9th 2011, the implied yields on five- and ten-year ILGs for August 9th 2013 (2.5 years in the future) would be 1.53% and 1.51%, respectively, and the implied yields on five- and ten-year ILGs for February 9th 2014 (3 years in the future) would be 1.60% and 1.52%, respectively.
Figure 2.3 Implied future yields on five- and ten-year ILGs in 2.5 and 3 years’ time
Source: Bank of England, and Oxera calculations.
15 Competition Commission (2010), ‘Bristol Water plc—A reference under section 12(3)(a) of the Water Industry Act 1991’, August 4th, Appendix N, p. N19. 16 See, for example, Competition Commission (2008), ‘Stansted Airport Ltd—Q5 price control review’, Appendix L, Cost of Capital, p. L11.
0.6%
0.8%
1.0%
1.2%
1.4%
1.6%
1.8%
2.0%
09 Jul 10 09 Aug 10 09 Sep 10 09 Oct 10 09 Nov 10 09 Dec 10 09 Jan 11 09 Feb 11 09 Mar 11
Future yield in 2.5 years on 10-year maturity ILGs Future yield in 3 years on 10-year maturity ILGsFuture yield in 2.5 years on 5-year maturity ILGs Future yield in 3 years on 5-year maturity ILGs
(A) Expected yield on July 9th 2013 as at July 9th 2010 (+3 years) for 5-year (1.48%) and 10-year (1.54%) ILGs
(B) Expected yield on November 9th 2013 as at November 9th 2010 (+3 years) for 5-year (0.98%) and 10-year (1.18%) ILGs
(C) Expected yield on August 9th 2013 as at February 9th 2011 (+2.5 years) for 5-year (1.53%) and 10-year (1.51%) ILGs
(D) Expected yield on September 11th 2013 as at March 11th 2011 (+2.5 years) for 5-year (1.23%) and 10-year (1.32%) ILGs
Oxera The cost of capital of BT 6
Figure 2.3 shows that the implied future real risk-free rate for 2013/14 declined during the third quarter of 2010 and increased afterwards. This pattern is similar to that of the spot yields (see Figure 2.1). The decline in the spot yields (which is equivalent to an increase in the price of gilts) in Q3 of 2010 can be attributed to a number of factors, including the fiscal consolidation plan announced by the coalition government in June 2010, which implied less government borrowing and therefore less supply of government gilts, as well as the decline in the stock market and signs that the global economic recovery was stalling. Similarly, some of the increase in the yields towards the end of 2010 may be attributable to the subsequent better outlook for the economy and high realised inflation rates.
The market data of the past three months shows that the implied future yields on five- and ten-year ILGs for 2013/14 fluctuated in a range of 1.2–1.6%. The 1% forward yield discussed in the Ofcom’s January 2011 consultation document—while consistent with the estimation based on data in November 2010 (see Point B in the figure)—is noticeably lower than the bottom of this range. Moreover, the figure also shows that the implied yields for 2013/14 based on recent data (especially data as at February 2011) are at levels similar to those based on data in July 2010 when the CC determined that 2% was the reasonable point estimate for the real risk-free rate.17
This evidence suggests that the real risk-free rate in 2013/14 could be higher than the 1.5% proposed by Ofcom and that Ofcom’s 1.5% real risk-free rate assumption provides little headroom for the real risk-free rate parameter.
Regulators in general, and Ofcom in particular, tend to be of the view that the costs of over- and underestimating the risk-free rate are asymmetric. Specifically, greater weight is attributed to the risk that an increase in market rates during the price control period which could make equity investment a negative net present value (NPV) decision create an underinvestment problem. For example, Ofcom states the following in the current WBA consultation:
this is the appropriate approach because the costs of error are asymmetric and we would tend to be more concerned with the lack of investment which could result if the cost of capital were set too low than with the risk of slightly higher prices which could result if the cost of capital were set too high.18
To address the uncertainty in forecasting the risk-free rate and lessen the risk of underestimating the rate that might prevail during the price control period, regulators have tended to allow for headroom by assuming a risk-free rate higher than the level implied by the market rates.
Applying conservative headroom to the expected real risk-free rate implied by the market data suggests that an appropriate estimate of the real risk-free rate for 2013/14 would be a range of 1.5–2%. The top end of this range is consistent with the CC’s August 2010 decision in the Bristol Water reference where it adopted 2% as the point estimate for the real risk-free rate.19
2.2 Inflation
In Ofcom’s charge control, the cost of capital is expressed in nominal terms, which includes compensation for inflation—ie, changes in the level of prices over time.
17 Competition Commission (2010), ‘Bristol Water plc—A reference under section 12(3)(a) of the Water Industry Act 1991’, August 4th, p. 65, para 9.14 and Table 1. 18 Ofcom (2011), Proposals for WBA charge control, January consultation, paragraph 6.194. 19 Competition Commission (2010), ‘Bristol Water plc—A reference under section 12(3)(a) of the Water Industry Act 1991’, August 4th, Appendix N, p. N46, Table 12.

Oxera The cost of capital of BT 7
Two measures that are commonly used for calculating inflation are the Retail Prices Index (RPI) and the Consumer Prices Index (CPI). There are a number of differences between the CPI and the RPI: for example, the two indices are based on different baskets of goods and services; they use different expenditure data sources to estimate the weights applied to different goods and services; and they use different formulae for constructing the respective indices.20 The CPI assumes that consumers buy less of something when its relative price rises. While the CPI may therefore reflect more closely changes in the cost of living, the RPI may be seen as a better measure for the underlying rate of inflation in the economy.21
Given that Ofcom’s standard approach to charge controls is to use RPI – X to compute a ‘glide path’ to bring the controlled charges in line with costs over a number of years,22 and that it attaches considerable weight to the inflation rate implied by the difference between nominal and real yields on government gilts—which reflects the market forecast of RPI—when estimating inflation, it seems appropriate to focus on RPI inflation.
Investors are likely to form their expectations of inflation on the basis of different observations: actual inflation observed in previous years; inflation targets used by the Bank of England; independent forecasts published by monetary authorities or research centres; and implied inflation inferred from the differences between real and nominal yields. Each of these sources of information has its conceptual and practical advantages and disadvantages. In practice, they can yield different estimates of inflation over the short to medium term. To capture the uncertainty attached to the inflation parameter, it seems reasonable to look at different sources of information and to consider a range rather than a point estimate for inflation.
In the consultation document, Ofcom proposes a point estimate of 2.5% for inflation for the 2013/14 period, but acknowledges the availability of different inflation estimates and the need to review the final estimate in light of the latest forecasts. The following summarises the evidence from different sources of inflation assumptions—realised, target, forecast and implied inflation—and draws conclusions about the plausible range.
2.2.1 Realised inflation Figure 2.4 shows year-on-year growth in RPI and CPI in the UK. It indicates the large fluctuations in realised inflation rates and the current high level of inflation rates.
20 The RPI uses the arithmetic mean of the inflation rates for each item included in the basket of goods, whereas the CPI uses the geometric mean. 21 Oxera (2010), ‘Choosing an inflation index: RPI, CPI and regulated utilities’, Agenda, December; and Office for National Statistics, various articles available at http://www.statistics.gov.uk/CCI/nugget.asp?ID=19. 22 Ofcom (2011), op. cit., p. 13.
Oxera The cost of capital of BT 8
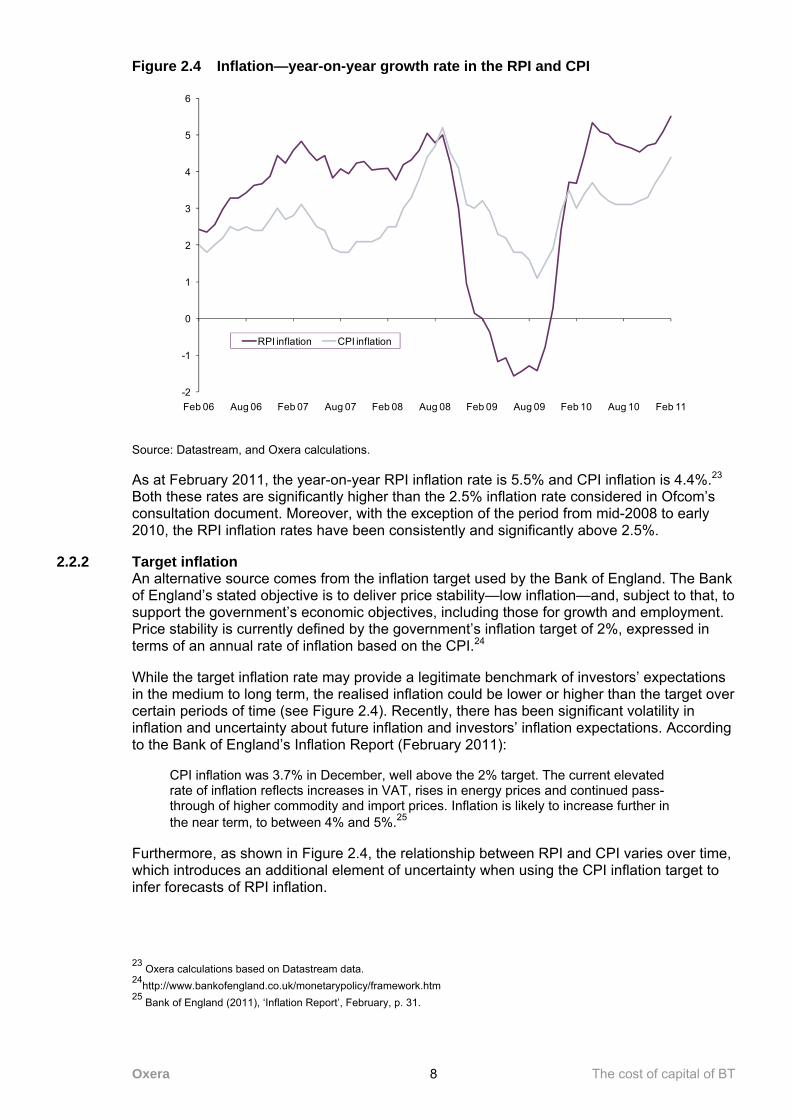
Figure 2.4 Inflation—year-on-year growth rate in the RPI and CPI
Source: Datastream, and Oxera calculations.
As at February 2011, the year-on-year RPI inflation rate is 5.5% and CPI inflation is 4.4%.23 Both these rates are significantly higher than the 2.5% inflation rate considered in Ofcom’s consultation document. Moreover, with the exception of the period from mid-2008 to early 2010, the RPI inflation rates have been consistently and significantly above 2.5%.
2.2.2 Target inflation An alternative source comes from the inflation target used by the Bank of England. The Bank of England’s stated objective is to deliver price stability—low inflation—and, subject to that, to support the government’s economic objectives, including those for growth and employment. Price stability is currently defined by the government’s inflation target of 2%, expressed in terms of an annual rate of inflation based on the CPI.24
While the target inflation rate may provide a legitimate benchmark of investors’ expectations in the medium to long term, the realised inflation could be lower or higher than the target over certain periods of time (see Figure 2.4). Recently, there has been significant volatility in inflation and uncertainty about future inflation and investors’ inflation expectations. According to the Bank of England’s Inflation Report (February 2011):
CPI inflation was 3.7% in December, well above the 2% target. The current elevated rate of inflation reflects increases in VAT, rises in energy prices and continued pass-through of higher commodity and import prices. Inflation is likely to increase further in the near term, to between 4% and 5%.25
Furthermore, as shown in Figure 2.4, the relationship between RPI and CPI varies over time, which introduces an additional element of uncertainty when using the CPI inflation target to infer forecasts of RPI inflation.
23 Oxera calculations based on Datastream data. 24http://www.bankofengland.co.uk/monetarypolicy/framework.htm 25 Bank of England (2011), ‘Inflation Report’, February, p. 31.
-2
-1
0
1
2
3
4
5
6
Feb 06 Aug 06 Feb 07 Aug 07 Feb 08 Aug 08 Feb 09 Aug 09 Feb 10 Aug 10 Feb 11
RPI inflation CPI inflation

Oxera The cost of capital of BT 9
2.2.3 Forecast inflation Independent forecasts of inflation are published by government agencies, central banks and research centres. The following discusses the forecasts presented in the Bank of England’s Inflation Report, as well as those contained in HM Treasury’s summary of independent forecasts for the UK economy.
The February 2011 Inflation Report by the Bank of England suggests that inflation is likely to be above 2% throughout 2011. Going forward:
inflation is likely to fall back during 2012, but the timing and extent of that fall are both uncertain, and will depend on the evolution of global prices, on the degree to which inflation expectations rise following a sustained period of elevated inflation, and on how much businesses seek to restore profit margins.26
Figure 2.5 shows the range of inflation projections based on the Bank of England’s Monetary Policy Committee (MPC) projections in May 2009 and February 2011.27
Figure 2.5 CPI inflation projections as at May 2009 and February 2011
Note: The charts are based on the assumption that the stock of purchased assets financed by the issuance of central bank reserves reaches £125 billion (2009) and £200 billion (2011) and remains at these levels throughout the forecast period. In any particular quarter of the forecast period, inflation is expected to lie somewhere within the fans on 90 out of 100 occasions if economic circumstances identical to today’s were to prevail (respectively in 2009 and 2011). The bands widen as the time horizon is extended, indicating the increasing uncertainty about outcomes. The dashed lines are drawn at the respective two-year points. Source: The CPI inflation projection as at 2009 (the chart on the left) is taken from Bank of England (2009), ‘Inflation Report’, May. The CPI inflation projection for 2011 (the chart on the right) is taken from Bank of England (2011), ‘Inflation Report’, February.
The February 2011 projections show that there is a significant risk that the CPI inflation in 2013/14 could be higher than the official target of 2%. Moreover, the inflation projections as at February 2011 are in a much wider range and have a higher central forecast than the projections made in May 2009. Given that Ofcom assumed an inflation rate of 2.5% in May 2009 when it estimated BT’s cost of capital previously, this evidence suggests that a higher inflation assumption than 2.5% would be more appropriate based on the current forecasts.
HM Treasury also provides medium-term forecasts of inflation, including for RPI inflation. The average forecasts for inflation for the next few years are reported in Table 2.2 below.
26 Bank of England (2011), ‘Inflation Report’, February, p. 40. 27 Bank of England (2009) ‘Inflation Report’, May, p. 42, Figure 5.3, and Bank of England (2011), ‘Inflation Report’, February, p. 40, Figure 5.1.

Oxera The cost of capital of BT 10
Table 2.2 HM Treasury averages of independent medium-term inflation forecasts
Inflation rate (%) 2011 2012 2013 2014 2015
RPI 4.1 2.9 2.9 3.1 2.8
CPI 3.3 1.8 2.0 2.0 2.0 Source: HM Treasury (2011), ‘Forecasts for the UK economy: a comparison of independent forecasts’, February, p. 25.
Focusing on the RPI inflation as the relevant measure of underlying inflation—especially in the context of an RPI – X charge control—the average RPI forecast for 2013/14 is 3%, as shown in Table 2.2. However, HM Treasury reports that there is significant variation around the averages, with individual independent forecasts for RPI varying from 1.6% to 3.8% for 2013, and from 2.0% to 4.0% for 2014.28 While Ofcom’s point estimate of 2.5% is within this range, it is below the central forecast for 2013/14.
2.2.4 Implied inflation In its consultation document, Ofcom focuses on implied RPI inflation rates derived from the nominal and real yields on gilts of five- and ten-year maturities. The main attraction of this approach is that it provides a direct measure of the inflation expectations that investors have incorporated into their pricing decisions—the implied inflation is objective and transparent.
Figure 2.6 presents nominal and real yields on five-year gilts, as well as the implied inflation rates. Implied inflation was stable at around 3% prior to the onset of the financial crisis in 2008. It declined sharply during the crisis period and has since increased. The current implied RPI inflation based on yields on five-year gilt is 2.94% (as at March 2011). This is substantially higher than the 2.3% implied inflation that Ofcom presented in its January 2011 consultation document, which is based on the market data as at November 2010. Moreover, the current implied inflation of 2.94% is also significantly higher than the 2.5% inflation proposed in Ofcom’s consultation document.
Figure 2.6 Implied inflation rates from five-year gilts
Source: Datastream, and Oxera calculations. 28 HM Treasury (2011), ‘Forecasts for the UK economy: a comparison of independent forecasts’, February, p. 25.
-1
0
1
2
3
4
5
6
Mar-06 Sep-06 Mar-07 Sep-07 Mar-08 Sep-08 Mar-09 Sep-09 Mar-10 Sep-10 Mar-11
Yiel
d (%
)
5-year nominal 5-year real Implied inflation
Oxera The cost of capital of BT 11
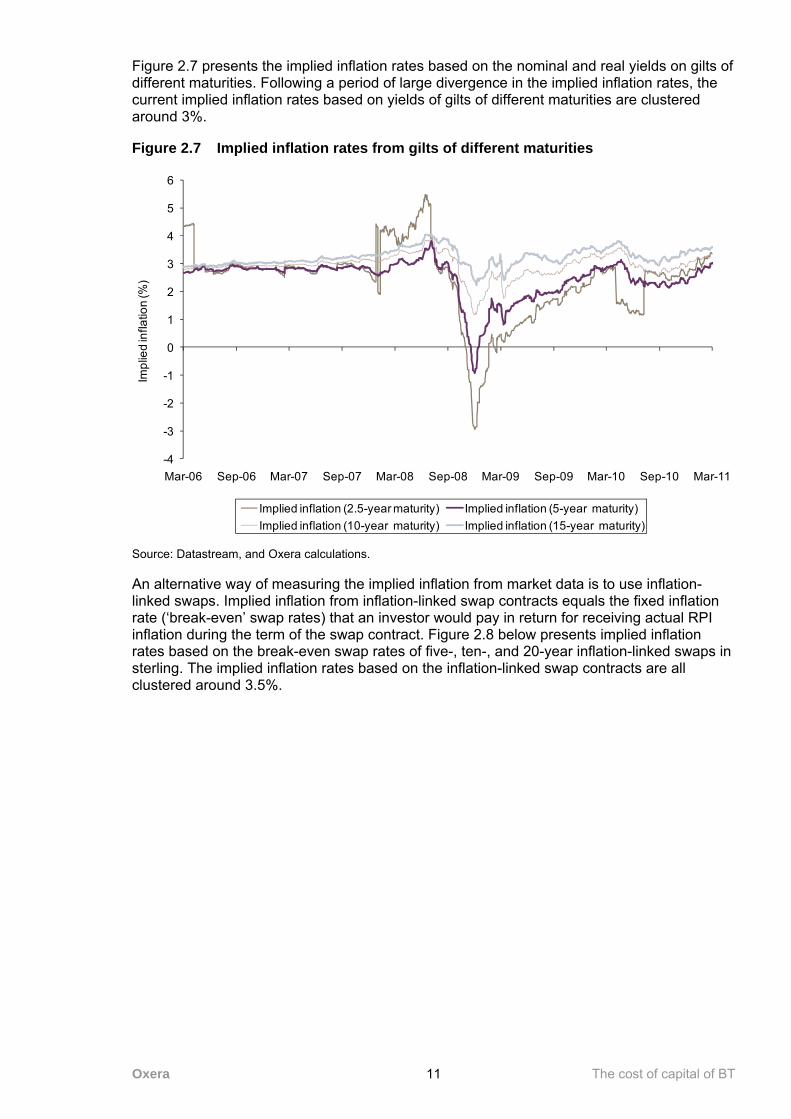
Figure 2.7 presents the implied inflation rates based on the nominal and real yields on gilts of different maturities. Following a period of large divergence in the implied inflation rates, the current implied inflation rates based on yields of gilts of different maturities are clustered around 3%.
Figure 2.7 Implied inflation rates from gilts of different maturities
Source: Datastream, and Oxera calculations.
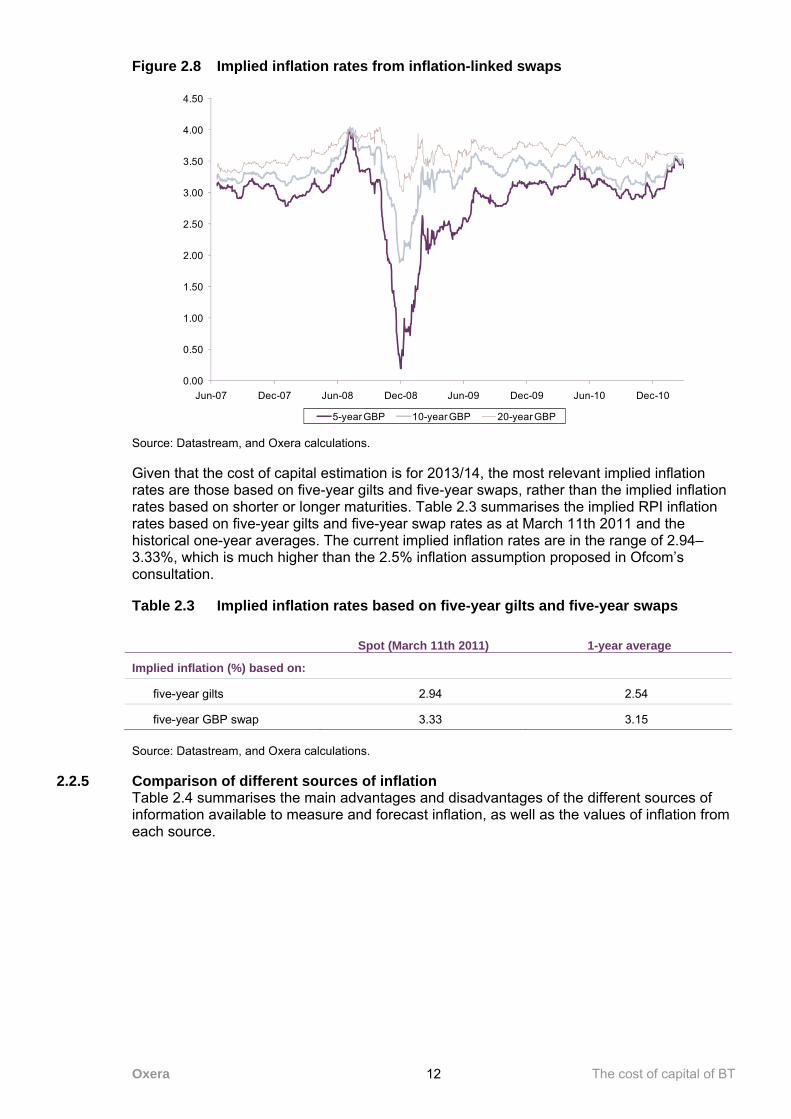
An alternative way of measuring the implied inflation from market data is to use inflation-linked swaps. Implied inflation from inflation-linked swap contracts equals the fixed inflation rate (‘break-even’ swap rates) that an investor would pay in return for receiving actual RPI inflation during the term of the swap contract. Figure 2.8 below presents implied inflation rates based on the break-even swap rates of five-, ten-, and 20-year inflation-linked swaps in sterling. The implied inflation rates based on the inflation-linked swap contracts are all clustered around 3.5%.
-4
-3
-2
-1
0
1
2
3
4
5
6
Mar-06 Sep-06 Mar-07 Sep-07 Mar-08 Sep-08 Mar-09 Sep-09 Mar-10 Sep-10 Mar-11
Impl
ied
infla
tion
(%)
Implied inflation (2.5-year maturity) Implied inflation (5-year maturity)Implied inflation (10-year maturity) Implied inflation (15-year maturity)
Oxera The cost of capital of BT 12
Figure 2.8 Implied inflation rates from inflation-linked swaps
Source: Datastream, and Oxera calculations.
Given that the cost of capital estimation is for 2013/14, the most relevant implied inflation rates are those based on five-year gilts and five-year swaps, rather than the implied inflation rates based on shorter or longer maturities. Table 2.3 summarises the implied RPI inflation rates based on five-year gilts and five-year swap rates as at March 11th 2011 and the historical one-year averages. The current implied inflation rates are in the range of 2.94– 3.33%, which is much higher than the 2.5% inflation assumption proposed in Ofcom’s consultation.
Table 2.3 Implied inflation rates based on five-year gilts and five-year swaps
Spot (March 11th 2011) 1-year average
Implied inflation (%) based on:
five-year gilts 2.94 2.54
five-year GBP swap 3.33 3.15 Source: Datastream, and Oxera calculations.
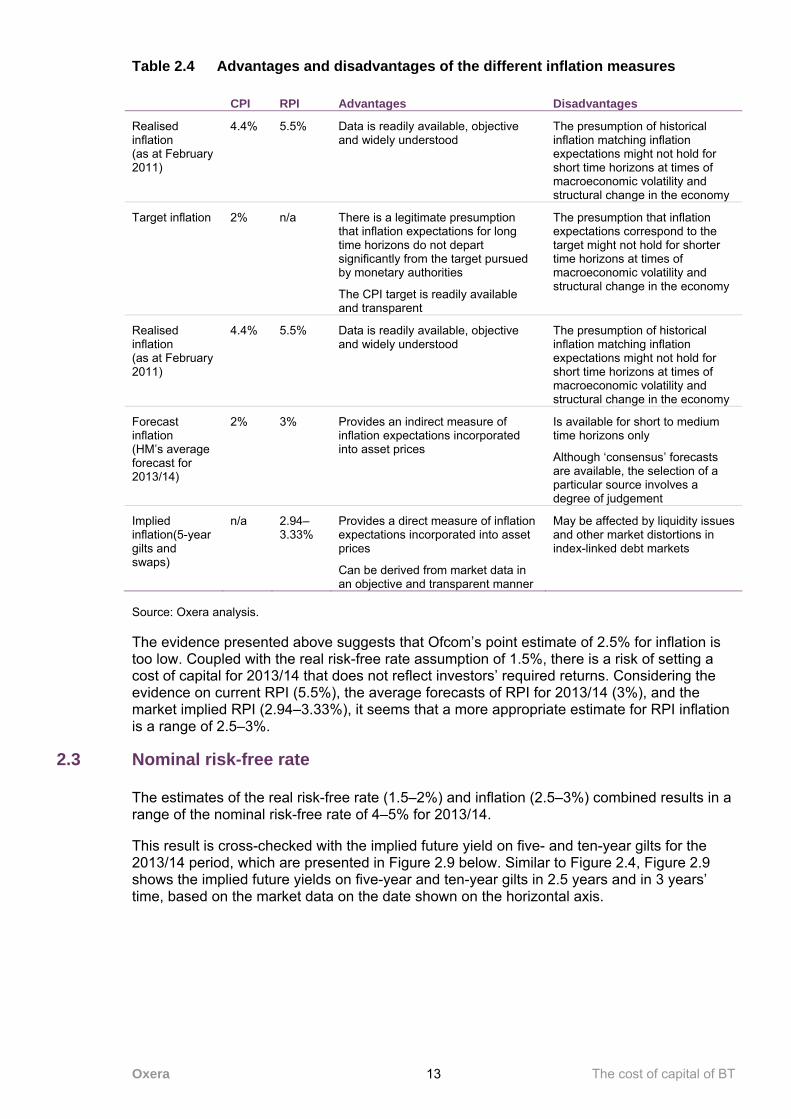
2.2.5 Comparison of different sources of inflation Table 2.4 summarises the main advantages and disadvantages of the different sources of information available to measure and forecast inflation, as well as the values of inflation from each source.
0.00
0.50
1.00
1.50
2.00
2.50
3.00
3.50
4.00
4.50
Jun-07 Dec-07 Jun-08 Dec-08 Jun-09 Dec-09 Jun-10 Dec-10
5-year GBP 10-year GBP 20-year GBP
Oxera The cost of capital of BT 13
Table 2.4 Advantages and disadvantages of the different inflation measures
CPI RPI Advantages Disadvantages
Realised inflation (as at February 2011)
4.4% 5.5% Data is readily available, objective and widely understood
The presumption of historical inflation matching inflation expectations might not hold for short time horizons at times of macroeconomic volatility and structural change in the economy
Target inflation 2% n/a There is a legitimate presumption that inflation expectations for long time horizons do not depart significantly from the target pursued by monetary authorities
The CPI target is readily available and transparent
The presumption that inflation expectations correspond to the target might not hold for shorter time horizons at times of macroeconomic volatility and structural change in the economy
Realised inflation (as at February 2011)
4.4% 5.5% Data is readily available, objective and widely understood
The presumption of historical inflation matching inflation expectations might not hold for short time horizons at times of macroeconomic volatility and structural change in the economy
Forecast inflation (HM’s average forecast for 2013/14)
2% 3% Provides an indirect measure of inflation expectations incorporated into asset prices
Is available for short to medium time horizons only
Although ‘consensus’ forecasts are available, the selection of a particular source involves a degree of judgement
Implied inflation(5-year gilts and swaps)
n/a 2.94–3.33%
Provides a direct measure of inflation expectations incorporated into asset prices
Can be derived from market data in an objective and transparent manner
May be affected by liquidity issues and other market distortions in index-linked debt markets
Source: Oxera analysis.
The evidence presented above suggests that Ofcom’s point estimate of 2.5% for inflation is too low. Coupled with the real risk-free rate assumption of 1.5%, there is a risk of setting a cost of capital for 2013/14 that does not reflect investors’ required returns. Considering the evidence on current RPI (5.5%), the average forecasts of RPI for 2013/14 (3%), and the market implied RPI (2.94–3.33%), it seems that a more appropriate estimate for RPI inflation is a range of 2.5–3%.
2.3 Nominal risk-free rate
The estimates of the real risk-free rate (1.5–2%) and inflation (2.5–3%) combined results in a range of the nominal risk-free rate of 4–5% for 2013/14.
This result is cross-checked with the implied future yield on five- and ten-year gilts for the 2013/14 period, which are presented in Figure 2.9 below. Similar to Figure 2.4, Figure 2.9 shows the implied future yields on five-year and ten-year gilts in 2.5 years and in 3 years’ time, based on the market data on the date shown on the horizontal axis.

Oxera The cost of capital of BT 14
Figure 2.9 Implied future nominal yields on five- and ten-year gilts in 2.5 and 3 years’ time
Source: Bank of England and Oxera calculations
Figure 2.9 shows that the implied future nominal yields for 2013/14 have fluctuated in the broad range of 4-5%, consistent with the estimation discussed above. The current (as at March 11 2011) implied future nominal yields on five- and ten-year gilts for September 11th 2013 (2.5 years in the future) are 4.26% and 4.83%, respectively, and the current implied future yields for March 11 2014 (3 years in the future) are 4.5% on five-year gilts and 4.9% on ten-year gilts. This evidence suggests that 4.5% would be a conservative point estimate of the nominal risk-free rate for 2013/14.
2.4 Summary
Current market data implies that the market expects the real risk-free rate for five-year (ten-year) borrowing to be approximately 1.23% (1.32%) by September 2013. This is substantially higher than the current yield on ILGs. It is important to note that the current implied forward yields are the current forecast of the real risk-free rate as at September 2013; they do not incorporate any allowance for the possibility that the real risk-free rate in 2013/14 could be higher.
Based on an assessment that the costs of underestimating the risk-free rate and discouraging investment exceed the costs of overestimating the risk-free rate and setting prices too high, applying conservative headroom to the expected real risk-free rate implied by the market data suggests that an appropriate estimate of the real risk-free rate for 2013/14 would be in the range of 1.5–2%.
As regards inflation, the evidence on current RPI (5.5%), the average forecast of RPI for 2013/14 (3%), and the implied future RPI based on five-year gilts and swaps contracts (2.94–3.33%) all suggests that the 2.5% inflation rate assumption proposed by Ofcom is too low for 2013/14. A more appropriate estimate would be a range from 2.5% to 3%.
Overall, the evidence discussed above suggests that the nominal risk-free rate would be in the range of 4–5%, with a point estimate of 4.5%.
2.0%
2.5%
3.0%
3.5%
4.0%
4.5%
5.0%
5.5%
09 Jul 10 09 Aug 10 09 Sep 10 09 Oct 10 09 Nov 10 09 Dec 10 09 Jan 11 09 Feb 11 09 Mar 11
Future yield in 2.5 years on 10-year maturity gilts Future yield in 3 years on 10-year maturity giltsFuture yield in 2.5 years on 5-year maturity gilts Future yield in 3 years on 5-year maturity gilts
(A) Expected yield on July 9th 2013 as at July 9th 2010 (+3 years) for 5-year (4.20%) and 10-year (4.78%) gilts
(B) Expected yield on November 9th 2013 as at November 9th 2010 (+3 years) ) for 5-year (3.78%) and 10-year (4.56%) gilts
(C) Expected yield on August 9th 2013 as at February 9th 2011 (+2.5 years) ) for 5-(4.57%) and 10-year (5.05%) gilts
(D) Expected yield on September 11th 2013 as at March 11th 2011 (+2.5 years) for 5- (4.26%) and 10-year (4.83%) gilts

Oxera The cost of capital of BT 15
3 Equity risk premium
The equity risk premium (ERP) represents the extra return that investors require from investing in equities rather than risk-free assets. The ERP is not directly observable and must be inferred from the evidence. An additional challenge with estimating the ERP to use for current and future periods is to determine how the financial crisis has affected the returns required by investors as compensation for taking on exposure to equity risk. Moreover, volatility in equity markets has increased significantly as a result of the crisis, and although it has declined since the peak of the crisis, it remains higher than it was in the pre-crisis years.
In the January 2011 consultation document, Ofcom acknowledges that the recent financial crisis may have resulted in a higher ERP:
We have reviewed evidence from market commentators and the Bank of England, and believe that the prolonged downturn in equity markets and high levels of volatility suggest that the equity risk premium may have increased in recent years.29
Due to the greater volatility in equity markets and Ofcom’s view that ‘the downside of setting an ERP too low is worse than the downside of setting the ERP too high’, Ofcom proposes a point estimate of 5.0% for the ERP, the top end of the 4.5–5% range.30
This section reviews the most recent estimates from the three main sources that are commonly used to estimate the ERP for mature equity markets:
– historical evidence—estimated using long-run averages of realised equity returns in excess of the risk-free rate;
– forward-looking evidence—inferred from the current prices of traded assets using dividend and earnings growth models;
– survey-based evidence—based on surveys of practitioners and investors on their expectations for future required returns to equity.
The evidence reviewed and discussed in this section suggests that a range of 4.5–5.5% for the ERP is appropriate for the cost of capital estimation for BT for 2013/14, with a midpoint consistent with Ofcom’s point estimate for the ERP of 5%.
3.1 Historical evidence
The most widely cited source of historical evidence on the ERP is the annual publication by Dimson, Marsh and Staunton (DMS) which estimates historical ERP for 19 countries using a comprehensive dataset on annual excess equity returns since 1900.
The precision of the ERP estimates increases as the sample size increases (in this case, as the time horizon over which historical market returns are averaged increases). However, even with 111 years of data, the DMS estimates of ERP have a standard error of 1.6%, which is large relative to the value of the point estimates. This is because annual equity returns are highly volatile—over the entire DMS data sample, the minimum and maximum
29 Ofcom (2011), op. cit., p. 94, para 6.105. 30 Ofcom (2011), op. cit., p. 94, paras 6.105–6.107.

Oxera The cost of capital of BT 16
returns on the UK stock market were –38.4% and 80.8% respectively.31 This is why it is important to consider a very long time horizon when estimating the historical ERP and why the DMS estimates are often used, given the size of their dataset.
Table 3.1 shows the latest historical ERP estimates for a selected group of mature financial markets. The estimated ERP for the UK relative to bonds is 3.9% and 5.2% based on geometric and arithmetic averages, respectively.
Table 3.1 Dimson, Marsh and Staunton 2011 ERP estimates (%)
Country Geometric mean Arithmetic mean Standard error
Belgium 2.6 4.9 2.0
France 3.2 5.6 2.2
Germany 5.4 8.8 2.7
Ireland 2.9 4.9 1.9
Italy 3.7 7.2 2.8
Netherlands 3.5 5.8 2.1
Spain 2.3 4.3 2.0
UK 3.9 5.2 1.6
USA 4.4 6.4 1.9
Europe 3.9 5.2 1.6
World 3.8 5.0 1.5 Note: The ERP is estimated relative to returns of long-term bonds. Source: Dimson, Marsh and Staunton (2011), op. cit., Table 10.
Historical ERP can be calculated as a geometric or an arithmetic average of past excess returns. Geometric averages are by construction lower than arithmetic averages as volatility of annual excess returns over the averaging period raises arithmetic means relative to geometric means. While there is debate around which is the most appropriate averaging method in any given context, the weight of opinion is supportive of using arithmetic averages for estimating the ERP. Indeed, Dimson, Marsh and Staunton (2011) themselves recommend the arithmetic average ‘for use in asset allocation, stock valuation, and corporate budgeting applications’.32 This is consistent with a number of analytical studies that suggest that greater weight should be placed on arithmetic rather than on geometric estimates of returns. Cooper (1996) noted:
The use of the arithmetic mean ignores estimation error and serial correlation in returns. Unbiased discount factors have been derived that correct for both these effects. In all cases, the corrected discount rates are closer to the arithmetic than the geometric mean.33
Cooper (1996) referred to Blume (1974)34 who derived an ‘approximately unbiased estimator of MN, the true expected return over N periods’, which is a ‘weighted average of the compounded geometric and arithmetic means’.35 The weight on the arithmetic average is:
31 Dimson, E., Marsh, P. and Staunton, M. (2011), ‘Credit Suisse Global Investment Returns Sourcebook 2011’, February, Table 10. 32 Ibid., p. 34. 33 Cooper, I. (1996), ‘Arithmetic versus geometric mean estimators: Setting discount rates for capital budgeting’, European Financial Management, 2:2, p. 157. 34 Blume, M.E. (1974), ‘Unbiased estimators of long-run expected rates of return’, Journal of the American Statistical Association, 69:347. 35 Cooper (1996), op. cit., p. 157.

Oxera The cost of capital of BT 17
)1T()NT(
−−
=α
where T is the number of years used to calculate the estimated average return and N is the number of years in the forecast horizon. The weight on the geometric average is (1 – α).
Therefore, when forecasting the return for one year, all the weight should be on the arithmetic mean. As the forecast horizon increases, more weight should be placed on the geometric mean. With a three-year forecast horizon being relevant for Ofcom’s charge control period and 111 years of data used by DMS to calculate their estimates, α is approximately 98%. As Cooper (1996) noted, ‘although the arithmetic mean is biased, the bias is small for most practical applications.’
Jacquier, Kane and Marcus (2005) further examine the statistical properties of arithmetic and geometric estimators and reach a conclusion on optimal weighting similar to that of Cooper (1996).36 In addition, the authors find that when the ratio of N/T is less than 0.1, the arithmetic average estimator is more efficient (precise) than the geometric estimator. In the context of Ofcom’s charge control consultation, N/T is 0.03.
The DMS dataset therefore suggests that an ERP of about 5% would be an appropriate assumption for the estimation of BT’s cost of capital.
3.2 Forward-looking evidence
The main weakness of using historical returns to estimate the ERP is that this approach is inherently backward-looking. Historical performance may not necessarily be a good indicator of the risk premium required by investors to hold equities going forward.
In particular in times of heightened market volatility, historical estimates of the ERP may provide counterintuitive results. As an example, 2008 was one of the worst years for equity markets on record. However, the inclusion of the significant negative equity return of 2008 in the calculation of historical ERP lowers the premium significantly. Between 2008 and 2009, the DMS ERP estimate based on arithmetic averages for the UK decreased from 5.4% to 5%.37 As noted by Damodaran (2010), this result is counterintuitive:
In effect, the historical risk premium approach would lead investors to conclude, after one of worst stock market crisis in several decades, that stocks were less risky than they were before the crisis and that investors should therefore demand lower premiums.38
This is why forward-looking models can provide a useful cross-check on the historical estimates. Using current, rather than historical, market data may provide estimates that are more representative of the forward-looking ERP.
The basic assumption behind forward-looking models is that the current market price of an asset represents the expected discounted value of all future cash flows to this asset. The general multi-period dividend discount model is formulated as follows:
P0=D1
(1+r)1 +D2
(1+r)2 +…+Dt
(1+r)t + Dt+1
r-g × (1+r)t
36Jacquier, E., Kane, A. and Marcus, A. (2005), ‘Optimal estimation of the Risk Premium for the Long Run and Asset Allocation: A Case of Compounded Estimation Risk’, Journal of Financial Econometrics, 3:1. 37 Dimson, E., Marsh, P. and Staunton, M. (2008), ‘London Business School / ABN AMRO Global Investment Returns Yearbook 2008’, February. Dimson, E., Marsh, P. and Staunton, M. (2009), ‘Credit Suisse Global Investment Returns Sourcebook 2009’, February. 38 Damodaran, A. (2010), ‘Equity Risk Premiums (ERP): Determinants, Estimation and Implications – The 2010 Edition’, February, New York University - Stern School of Business, p. 26.
Oxera The cost of capital of BT 18
where P0 is the current market price; Dn is the n-year ahead dividend forecast; r is the cost (expected return) of equity; and g is the long-term dividend growth rate.
To estimate the ERP, this equation is implemented for a broadly diversified market index (‘the market portfolio’) and is solved for r, the expected market return. As inputs, the model requires the current index value, dividend forecasts for the index, and a long-term growth rate assumption. The ERP is then calculated by subtracting a measure of the risk-free rate from the estimate of the expected market return.
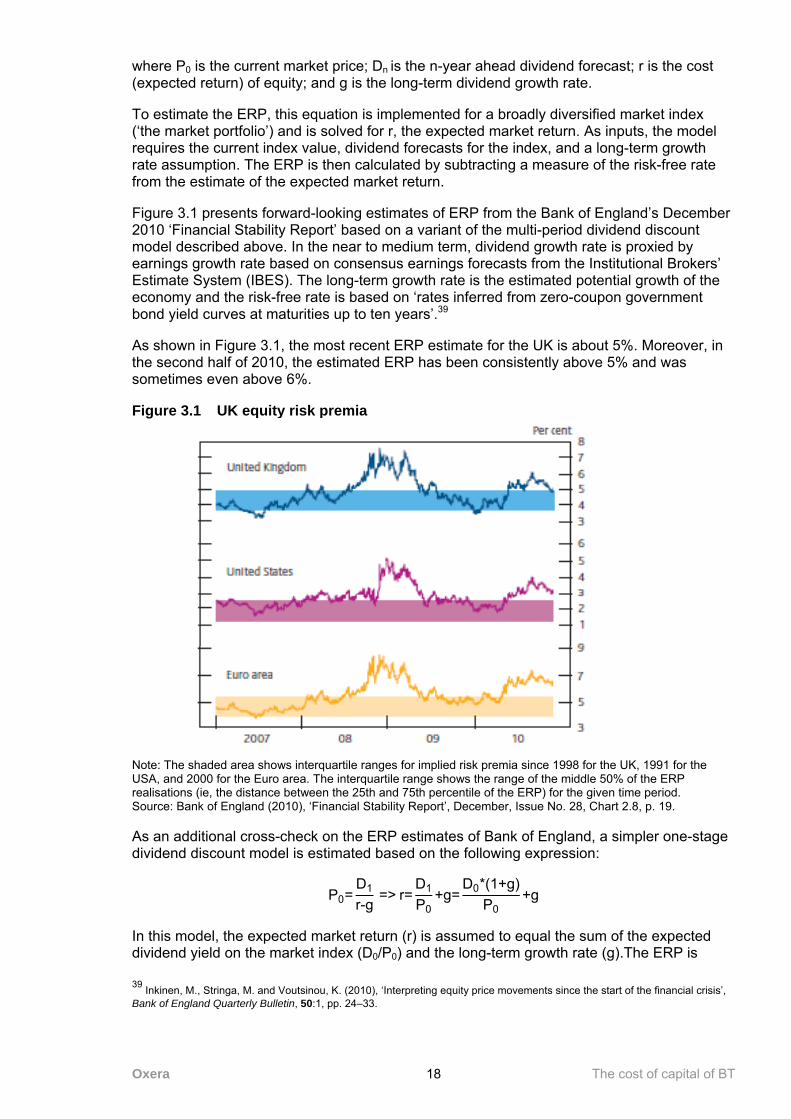
Figure 3.1 presents forward-looking estimates of ERP from the Bank of England’s December 2010 ‘Financial Stability Report’ based on a variant of the multi-period dividend discount model described above. In the near to medium term, dividend growth rate is proxied by earnings growth rate based on consensus earnings forecasts from the Institutional Brokers’ Estimate System (IBES). The long-term growth rate is the estimated potential growth of the economy and the risk-free rate is based on ‘rates inferred from zero-coupon government bond yield curves at maturities up to ten years’.39
As shown in Figure 3.1, the most recent ERP estimate for the UK is about 5%. Moreover, in the second half of 2010, the estimated ERP has been consistently above 5% and was sometimes even above 6%.
Figure 3.1 UK equity risk premia
Note: The shaded area shows interquartile ranges for implied risk premia since 1998 for the UK, 1991 for the USA, and 2000 for the Euro area. The interquartile range shows the range of the middle 50% of the ERP realisations (ie, the distance between the 25th and 75th percentile of the ERP) for the given time period. Source: Bank of England (2010), ‘Financial Stability Report’, December, Issue No. 28, Chart 2.8, p. 19.
As an additional cross-check on the ERP estimates of Bank of England, a simpler one-stage dividend discount model is estimated based on the following expression:
P0=D1
r-g => r=
D1
P0+g=
D0*(1+g)P0
+g
In this model, the expected market return (r) is assumed to equal the sum of the expected dividend yield on the market index (D0/P0) and the long-term growth rate (g).The ERP is 39 Inkinen, M., Stringa, M. and Voutsinou, K. (2010), ‘Interpreting equity price movements since the start of the financial crisis’, Bank of England Quarterly Bulletin, 50:1, pp. 24–33.
Oxera The cost of capital of BT 19
calculated as the difference from the expected market return and the spot yield on ten-year ILGs. Table 3.2 presents the results of the ERP forecasts based on this model.
Table 3.2 ERP forecasts based on a one-stage dividend growth model
ERP (%)
March 11th 2011 4.8
Six-month average to March 11th 2011 4.8 Note: The ERP is calculated using a long-term dividend growth assumption of 2.2%. This is based on the average forecasts of GDP growth for the UK over the 2011–14 period provided by the HM Treasury survey of independent forecasters. Dividend yield on the FTSE All-share index is used to proxy the dividend yield of the market. Source: Datastream; HM Treasury (2011), ‘Forecasts for the UK Treasury: a comparison of independent forecasts’, February, p. 23; and Oxera calculations.
The current and six-month average ERP forecasts based on the one-stage dividend growth model (DGM) are both 4.8%, which is broadly in line with the forecasts of the Bank of England.
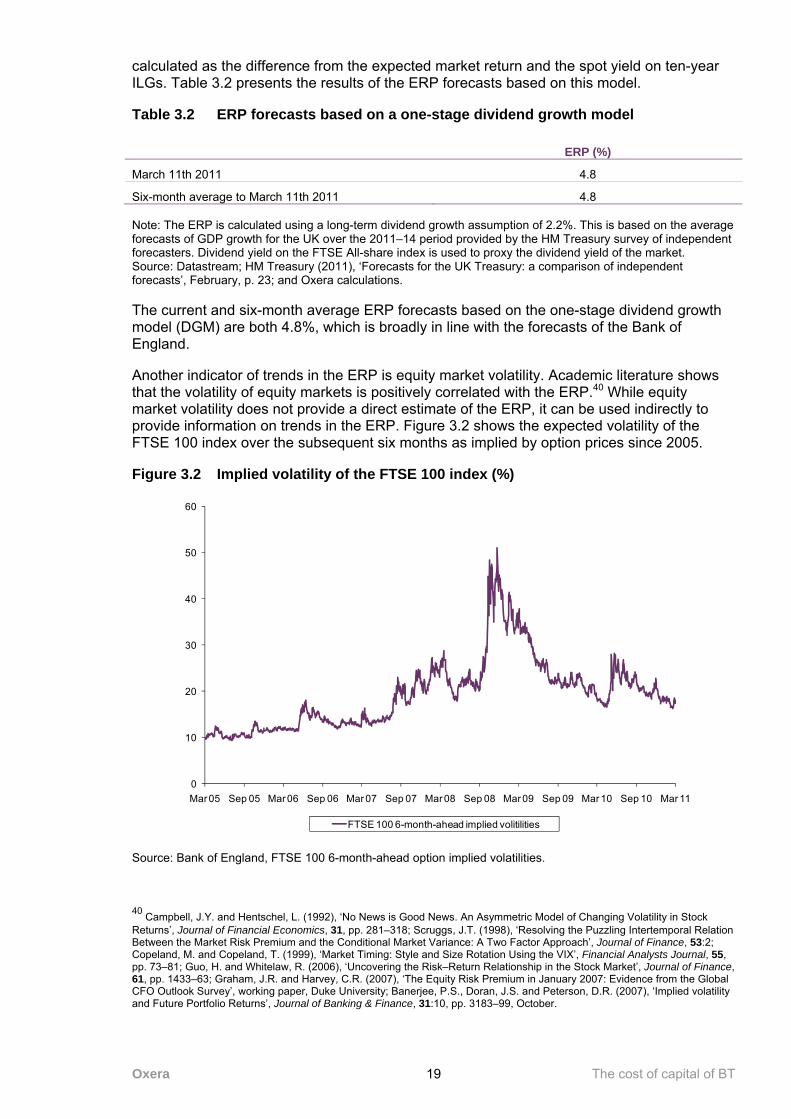
Another indicator of trends in the ERP is equity market volatility. Academic literature shows that the volatility of equity markets is positively correlated with the ERP.40 While equity market volatility does not provide a direct estimate of the ERP, it can be used indirectly to provide information on trends in the ERP. Figure 3.2 shows the expected volatility of the FTSE 100 index over the subsequent six months as implied by option prices since 2005.
Figure 3.2 Implied volatility of the FTSE 100 index (%)
Source: Bank of England, FTSE 100 6-month-ahead option implied volatilities.
40 Campbell, J.Y. and Hentschel, L. (1992), ‘No News is Good News. An Asymmetric Model of Changing Volatility in Stock Returns’, Journal of Financial Economics, 31, pp. 281–318; Scruggs, J.T. (1998), ‘Resolving the Puzzling Intertemporal Relation Between the Market Risk Premium and the Conditional Market Variance: A Two Factor Approach’, Journal of Finance, 53:2; Copeland, M. and Copeland, T. (1999), ‘Market Timing: Style and Size Rotation Using the VIX’, Financial Analysts Journal, 55, pp. 73–81; Guo, H. and Whitelaw, R. (2006), ‘Uncovering the Risk–Return Relationship in the Stock Market’, Journal of Finance, 61, pp. 1433–63; Graham, J.R. and Harvey, C.R. (2007), ‘The Equity Risk Premium in January 2007: Evidence from the Global CFO Outlook Survey’, working paper, Duke University; Banerjee, P.S., Doran, J.S. and Peterson, D.R. (2007), ‘Implied volatility and Future Portfolio Returns’, Journal of Banking & Finance, 31:10, pp. 3183–99, October.
0
10
20
30
40
50
60
Mar 05 Sep 05 Mar 06 Sep 06 Mar 07 Sep 07 Mar 08 Sep 08 Mar 09 Sep 09 Mar 10 Sep 10 Mar 11
FTSE 100 6-month-ahead implied volitilities

Oxera The cost of capital of BT 20
As Figure 3.2 shows, equity market volatility has decreased from the peak levels observed in early 2009, but is still somewhat higher than in the years just before the crisis.
While current market data may provide estimates that are more representative of the forward-looking ERP, this approach can produce volatile results that are sensitive to assumptions about the risk-free rate and long-run growth rates of dividends. Therefore, the ERP estimates from such models are useful mostly as a cross-check on historical estimates.
3.3 Survey-based evidence
A second form of forward-looking evidence on the ERP comes from surveys of market practitioners. However, there are a number of issues with interpreting survey evidence:
– respondents’ answers may be influenced by the way the questions are phrased—for example, whether the question asks about required returns to equity or expected returns on a specified stock market index;
– there is a tendency for respondents to extrapolate from recent realised returns, making the estimates not entirely forward-looking;
– the results are based purely on judgement and are less reliable than estimates based on direct market evidence on pricing.
Given the caveats discussed above, it seems inappropriate to place significant weight on survey-based evidence on ERP. This view is shared by Ofcom:
as in the past, we afford this analysis relatively little weight since participant surveys do not provide the same quality of evidence as market-based measures.41
The above concerns notwithstanding, Table 3.3 summarises the evidence from recent surveys of practitioners and investors.
Table 3.3 Survey evidence on the ERP
Author Survey ERP estimate
(%) Standard
deviation (%)
Fernandez and Campo (2010) Average UK ERP used by analysts (31 answers)
5.2 1.4
Average UK ERP used by companies (30 answers)
5.6 1.8
Average UK ERP used by professors (49 answers)
5.0 1.6
Graham and Harvey (2010) Quarterly survey of US CFOs (June 2010) 3.0 3.07
Welch (2009) Survey of finance or economics professors (143 answers)
5.0–6.0 -
Source: Fernandez, P. and del Campo, J. (2010), ‘Market risk premium in 2010 used by Analysts and Companies: a survey with 2,400 answers’, May 21st; Fernandez, P. and del Campo, J. (2010), ‘Market risk premium in 2010 used by Professors: a survey with 1,500 answers’, May 15th; Graham, J.R. and Harvey, C.R. (2010), ‘The Market Risk Premium in 2010’, August 9th. Welch, I. (2009), ‘Views of Financial Economists On The Equity Premium And Other Issues’, The Journal of Business, October unpublished working paper available at http://welch.econ.brown.edu/academics/equpdate-results2009.html
The Fernandez and Campo survey asks the respondents for the ERP ‘used to calculate the required return on equity’.42 The results of this survey are consistent with both ERP estimates
41 Ofcom (2011), op.cit., p. 93, para. 6.97.

Oxera The cost of capital of BT 21
based on historical evidence and forward-looking estimates based on dividend discount models. In contrast, Graham and Harvey frame the question differently when they survey US CFOs on a quarterly basis about their expectations of the ten-year return on the S&P 500 index. The annual return expected by respondents according to the June 2010 survey is the lowest in the history of the survey, leading to a very low estimate of the ERP. There is also a record high level of disagreement among the survey respondents, as shown by the high standard deviation of 3.07%.43 On the other hand, the survey results by Welch suggested a range of forward estimate of the ERP between 5% and 6%.
Overall, the survey-based evidence is broadly consistent with the historical and forward-looking evidence. Even though more weight is given to the historical and forward-looking evidence when forecasting the ERP, it is comforting to see that the evidence from different sources points to similar values of the ERP.
3.4 Summary
There is still much uncertainty in capital markets, and the impact of the crisis on required equity returns remains unclear. As a result, there is a considerable amount of uncertainty surrounding the future ERP. This uncertainty and the associated risk of setting the ERP too low or too high is acknowledged by Ofcom:
While setting the ERP value too low could lead to discretionary investment by BT being discouraged, setting the value too high could lead to consumers paying prices that are too high (or investments that are not fully justified by demand), or lower levels of investment by BT’s competitors.44
Based on the evidence discussed in this section, an appropriate ERP assumption for estimating the cost of capital for 2013/14 is a range of 4.5–5.5%, with a point estimate of 5%. This is consistent with the ERP assumption in Ofcom’s consultation document.
The 5% point ERP estimate is also consistent with the ERP used by the CC in its recent determinations on the LLU Appeal and Bristol Water,45 but is lower than the 5.25% used in the NATS determination by the Civil Aviation Authority.46
It is worth noting that the real return for equity market implied by Ofcom’s real risk-free rate (1.5%) and ERP (5%) assumptions is 6.5%. This is lower than the CC’s assumption on the real return for the equity market in its Bristol Water determination (7%):
We note that our range for the market return (5 to 7 per cent) and implied range for the ERP (3 to 5 per cent) imply a central figure lower than the figure used by sectoral regulators but that the effect of this is reduced because, in computing Bristol Water’s WACC, we have used a figure at the top of our range (7 per cent for the market return and 5 per cent for the implied ERP).47
42 Fernandez, P. and del Campo, J. (2010), ‘Market risk premium in 2010 used by Analysts and Companies: a survey with 2,400 answers’, May 21st, p. 2. 43 Graham and Harvey (2010), op. cit., pp. 3–4. 44 Ofcom (2011), op.cit., p. 94, para 6.104. 45 Competition Commission (2010), ‘The Carphone Warehouse Group plc v Office of Communications: Reference under section 193 of the Communications Act 2003’, August, pp. 2–59. Competition Commission (2010), ‘Bristol Water plc—A reference under section 12(3)(a) of the Water Industry Act 1991’, August 4th, p. 65, para 9.13. 46 CAA (2010), ‘NATS plc price control: CAA formal proposals for control period 3 (2011-2014): under section 11 of transport act 2000’, October, p. 156. 47 Competition Commission (2010), ‘Bristol Water plc—A reference under section 12(3)(a) of the Water Industry Act 1991’, August 4th, p. N27, para 164.

Oxera The cost of capital of BT 22
4 Equity and asset beta
In May 2009, Ofcom used the observed average gearing of BT (38%) to de-lever the equity beta to arrive at an asset beta estimate of 0.61.48 It then assumed the average gearing of BT over 2001–07, 35%, as the optimal future gearing.49 In its January 2011 consultation document, Ofcom also used the observed average gearing (which has increased to over 50%) to de-lever the equity beta and assumed a similarly high gearing of 50% as ‘a reasonable estimate of BT’s desired level of gearing’. Under this approach, the estimated asset beta of BT decreases to 0.46 (based on a two-year equity beta) or 0.54 (based on a one-year equity beta).50 However, Ofcom increases the upper end of the asset beta range for BT to 0.60 ‘to reflect inherent uncertainly caused by some of the data being affected by the credit crisis’.51
In the past three years, BT’s gearing experienced a large swing, increasing from less than 40% to over 60% in the one-year period ending in March 2009, after which it declined steadily to less than 38% as at March 11th 2011. This section presents several pieces of evidence that support the interpretation that the market believed that BT’s high gearing over the past few years would be temporary, and that there would be no permanent change in BT’s long-run capital structure. Therefore, the evidence suggests that BT’s share prices in the past few years did not incorporate the actual high gearing; instead, they reflected a stable and forward-looking estimate of BT’s gearing, which is likely to be at or slightly higher than the historical average gearing level.
Using a conservative estimate of the gearing level reflected in BT’s share price in the past few years to de-lever the equity beta results in higher estimates of asset beta for BT than those reported by Ofcom in January 2011 (0.59–0.65). However, the resulting asset beta estimates are similar to those of Ofcom’s May 2009 determination. This is consistent with the evidence that there has been no fundamental change in BT’s risk profile over the past two years.
The estimated equity betas of BT have been relatively stable over the past few years despite the large movements in the company’s gearing and changes in market conditions. Going forward, it seems reasonable to expect that the equity betas of BT would remain at similar levels. This, combined with the point estimates of the nominal risk-free rate (4.5%) and the ERP (5%), suggests that the cost of equity for BT would also be similar to that in Ofcom’s May 2009 determination.
4.1 Methodological approach
In the capital asset pricing model (CAPM) framework, the equity beta represents the extent to which the returns on equity of a company are affected by the movements in the returns of the market as a whole. This is also known as the ‘systematic risk’ of the equity investment. More specifically, the CAPM shows that, under a number of assumptions, the expected excess return on any security, i, is linearly related to the expected excess return of the market portfolio, as in the following equation:
E(Ri) - Rf=βi(E(Rm) - Rf) 48 Ofcom (2011), op. cit., p. 96, paragraph 6.113. 49 Ofcom (2011), op. cit., p. 91, footnote 121: ‘An optimal gearing rate of 35% was used because the observed gearing during the period from 2001 – 2007 was in a broad range of around 30% - 40%.’ 50 Ofcom (2011), op. cit., p. 91, paragraph 6.84 and p. 98, Table 6.8. 51 Ofcom (2011), op. cit., p. 83, Table 6.3 and paragraph 6.36.
Oxera The cost of capital of BT 23
The expected excess return of a security is the expected return over and above that provided by holding a risk-free security. The excess return therefore reflects the premium required to take on the risk associated with holding a particular security. To apply the CAPM in practice, historical realised returns replace expected excess returns in the above equation. The beta of the security is then estimated using ordinary least squares regression.
For a publicly traded company, the equity beta can be estimated directly using data on total returns (dividends plus change in price) of the company’s stock and the returns of a suitable market benchmark over a period of time. Return data of different frequencies can in principle be used in the estimation, depending on the liquidity of the stock. For stocks that are actively traded, as BT’s stock is, the use of daily returns data is more preferable because it results in more precise (statistically more robust) estimates of beta.
The estimation of equity beta is also affected by the choice of the length of the returns data series and the choice of the suitable market return index.
Equity betas are commonly estimated using one-, two-, and five-year daily returns data. While the use of shorter data length (eg, one or two years) might result in an equity beta estimate that is more relevant for estimating the cost of capital for the future, the estimate based on longer horizon data has its own advantage: it provides a more robust estimate of the systematic risk of a company because the uncertainty around the point estimate of equity beta is likely to decline as the number of data points increases.
There is another advantage in examining the five-year beta in the current cost of capital estimation for BT. The large swing in BT’s gearing in the past few years is likely to have a greater impact on the equity beta estimated using one or two years of data, and, consequently, the resulting beta estimates need to be interpreted carefully (see discussion below). Given that the impact of the volatile gearing is likely to be small for the five-year equity beta estimate, it is relevant to take that information into consideration when estimating the equity and asset beta. Therefore, estimates of one-, two-, and five- equity betas are presented and discussed below.
The choice of the appropriate market return benchmark is affected by the asset mix of the typical investors in the security, as well as the composition of the investors. Normally, for smaller companies that are not well known outside their home country, it is arguably more reasonable to use the domestic market return index to estimate the equity betas. However, for large international companies with a global investor base whose portfolios tend to comprise both domestic and international investments, it may be more appropriate to use a benchmark index that captures the returns of both domestic and international markets.
BT is a major global company with operations in more than 170 countries. Its stock is well known to investors internationally. In addition to being traded on the London Stock Exchange, its shares are listed on the New York Stock Exchange in the form of American Depository Receipts (ADRs). Moreover, according to Bloomberg, more than half of the BT shares are held by investors from outside the UK.52 All these factors suggest that a weighted index that incorporates the overall stock market movements in the UK as well as outside the UK would be more appropriate for estimating BT’s equity beta.
Wright et al. (2003) discuss the choice of the appropriate benchmark in more detail for UK regulated companies in general, and for BT in particular.53 In the case of BT, they suggest using a composite index that consists of 70% of the returns based on the FTSE All-share index and 30% of the returns based on the FTSE All-world index (excluding the UK). This 70:30 split reflects the usual ‘home bias’ of investors, who tend to invest a greater proportion
52 Bloomberg, Holders of BT/A LN Equity stock. 53 Wright, S., Mason, R. and Miles, D. (2003), ‘A study of certain aspects of the cost of capital for regulated utilities in the UK’, Smithers & Co report.

Oxera The cost of capital of BT 24
of their wealth in the home market than in foreign markets. Cooper and Kaplanis (1994) report that UK investors place 78.5% of their equity portfolios in the domestic market.54 In recent years, there has been a shift, with UK investors investing more globally. Motyl and Sweeting (2007) state that many UK pension plan sponsors have reduced their domestic equity allocations to 50–60% from a typical 75%.55
Overall, the above discussion suggests that a composite return index would be more appropriate than a UK-only index when estimating BT’s equity beta.56
Figures 4.1 to 4.3 show the BT’s one-, two-, and five-year equity betas estimated using the FTSE All-share index and composite index, respectively. The composite index follows Wright et al. (2003) and includes 70% of returns from the FTSE All-share index and 30% from the FTSE All-world excluding UK index.
Figure 4.1 One-year equity beta against alternative market benchmarks
Source: Datastream, and Oxera calculations.
54 Cooper, I. and Kaplanis, E. (1994), ‘Home bias in equity portfolios, inflation hedging and international capital market equilibrium’, Review of Financial Studies, 7, pp. 45–60. 55 Motyl, G.P. and Sweeting C.L. (2007), ‘Why Global Equity’, Franklin Templeton International White Paper. 56 For the equity beta estimated using the composite market index, it would be consistent to use a weighted average of ERPs of different countries with the same country weights as in the composite market index, However, given that the ERPs for the USA, Europe, and the world are 6.4%, 5.2%, and 5%, respectively (see Table 3.1), the consistent ERP measure is likely to be similar to 5.2% (the value for the UK). For the sake of simplicity, no ERP adjustment is made.
0.0
0.2
0.4
0.6
0.8
1.0
1.2
1.4
Mar-07 Sep-07 Mar-08 Sep-08 Mar-09 Sep-09 Mar-10 Sep-10 Mar-11
1-year (FTSE All-share) 1-year (FTSE All-share and FTSE All-world excluding UK)
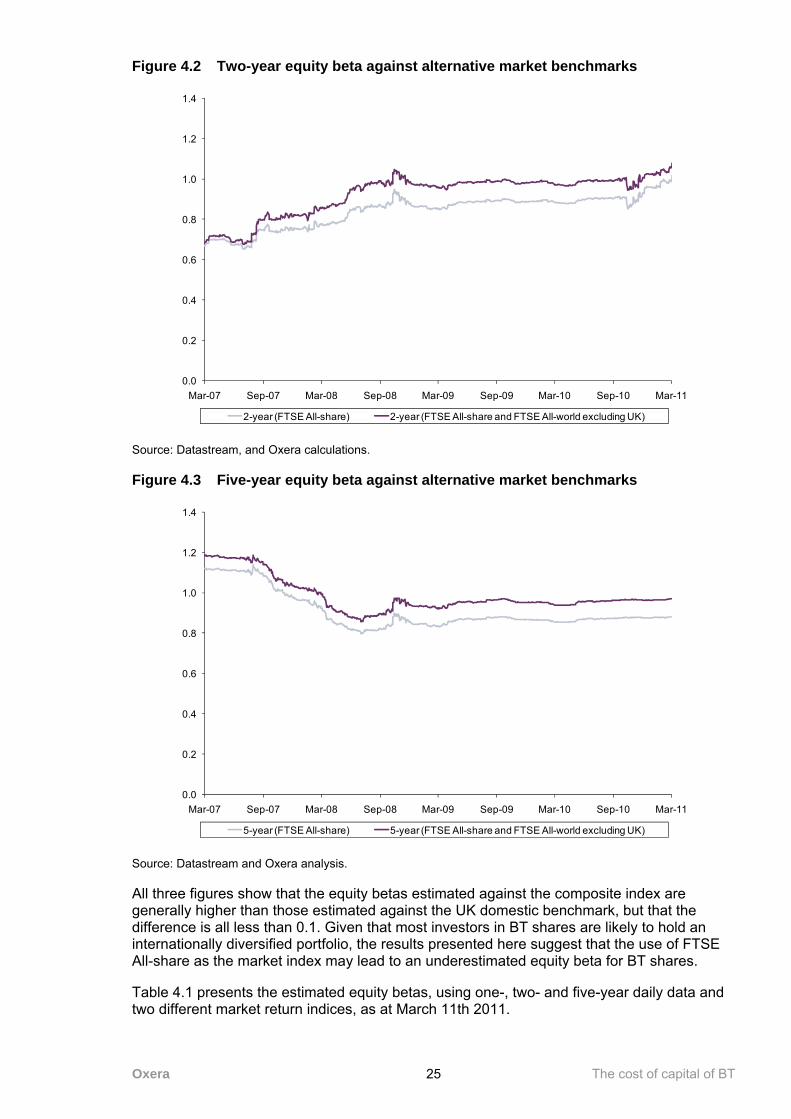
Oxera The cost of capital of BT 25
Figure 4.2 Two-year equity beta against alternative market benchmarks
Source: Datastream, and Oxera calculations.
Figure 4.3 Five-year equity beta against alternative market benchmarks
Source: Datastream and Oxera analysis.
All three figures show that the equity betas estimated against the composite index are generally higher than those estimated against the UK domestic benchmark, but that the difference is all less than 0.1. Given that most investors in BT shares are likely to hold an internationally diversified portfolio, the results presented here suggest that the use of FTSE All-share as the market index may lead to an underestimated equity beta for BT shares.
Table 4.1 presents the estimated equity betas, using one-, two- and five-year daily data and two different market return indices, as at March 11th 2011.
0.0
0.2
0.4
0.6
0.8
1.0
1.2
1.4
Mar-07 Sep-07 Mar-08 Sep-08 Mar-09 Sep-09 Mar-10 Sep-10 Mar-11
2-year (FTSE All-share) 2-year (FTSE All-share and FTSE All-world excluding UK)
0.0
0.2
0.4
0.6
0.8
1.0
1.2
1.4
Mar-07 Sep-07 Mar-08 Sep-08 Mar-09 Sep-09 Mar-10 Sep-10 Mar-11
5-year (FTSE All-share) 5-year (FTSE All-share and FTSE All-world excluding UK)
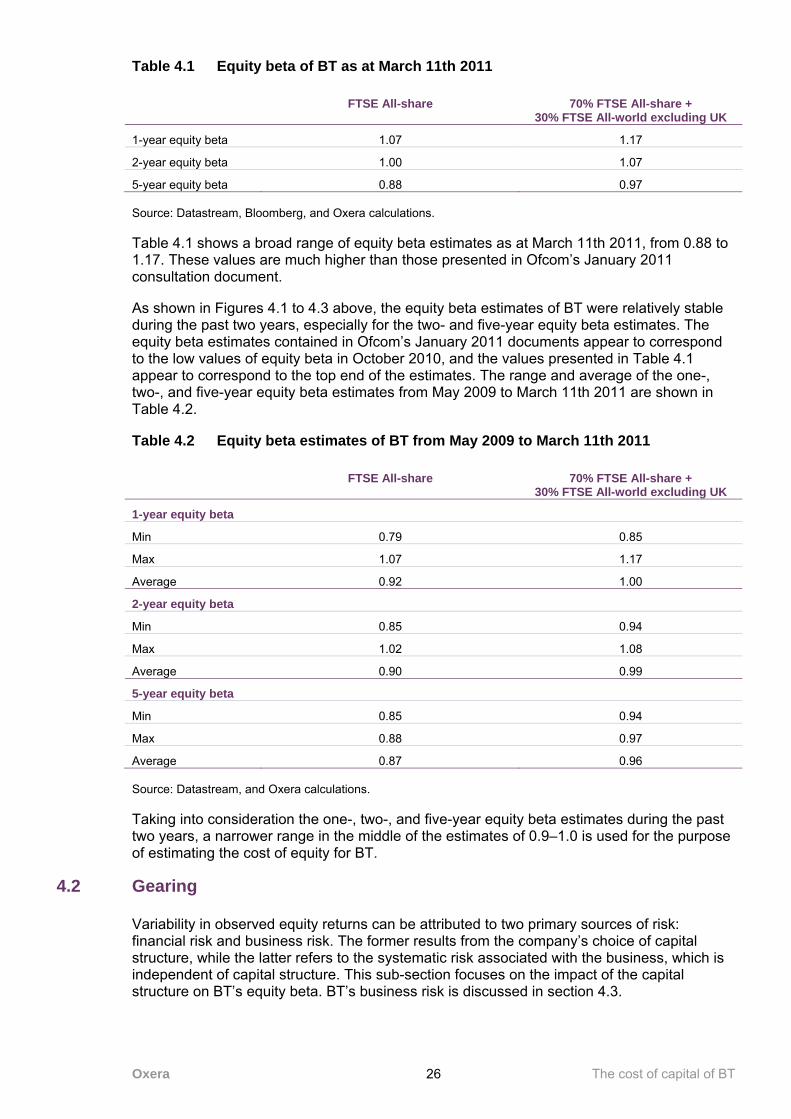
Oxera The cost of capital of BT 26
Table 4.1 Equity beta of BT as at March 11th 2011
FTSE All-share 70% FTSE All-share +
30% FTSE All-world excluding UK
1-year equity beta 1.07 1.17
2-year equity beta 1.00 1.07
5-year equity beta 0.88 0.97 Source: Datastream, Bloomberg, and Oxera calculations.
Table 4.1 shows a broad range of equity beta estimates as at March 11th 2011, from 0.88 to 1.17. These values are much higher than those presented in Ofcom’s January 2011 consultation document.
As shown in Figures 4.1 to 4.3 above, the equity beta estimates of BT were relatively stable during the past two years, especially for the two- and five-year equity beta estimates. The equity beta estimates contained in Ofcom’s January 2011 documents appear to correspond to the low values of equity beta in October 2010, and the values presented in Table 4.1 appear to correspond to the top end of the estimates. The range and average of the one-, two-, and five-year equity beta estimates from May 2009 to March 11th 2011 are shown in Table 4.2.
Table 4.2 Equity beta estimates of BT from May 2009 to March 11th 2011
FTSE All-share 70% FTSE All-share +
30% FTSE All-world excluding UK
1-year equity beta
Min 0.79 0.85
Max 1.07 1.17
Average 0.92 1.00
2-year equity beta
Min 0.85 0.94
Max 1.02 1.08
Average 0.90 0.99
5-year equity beta
Min 0.85 0.94
Max 0.88 0.97
Average 0.87 0.96 Source: Datastream, and Oxera calculations.
Taking into consideration the one-, two-, and five-year equity beta estimates during the past two years, a narrower range in the middle of the estimates of 0.9–1.0 is used for the purpose of estimating the cost of equity for BT.
4.2 Gearing
Variability in observed equity returns can be attributed to two primary sources of risk: financial risk and business risk. The former results from the company’s choice of capital structure, while the latter refers to the systematic risk associated with the business, which is independent of capital structure. This sub-section focuses on the impact of the capital structure on BT’s equity beta. BT’s business risk is discussed in section 4.3.
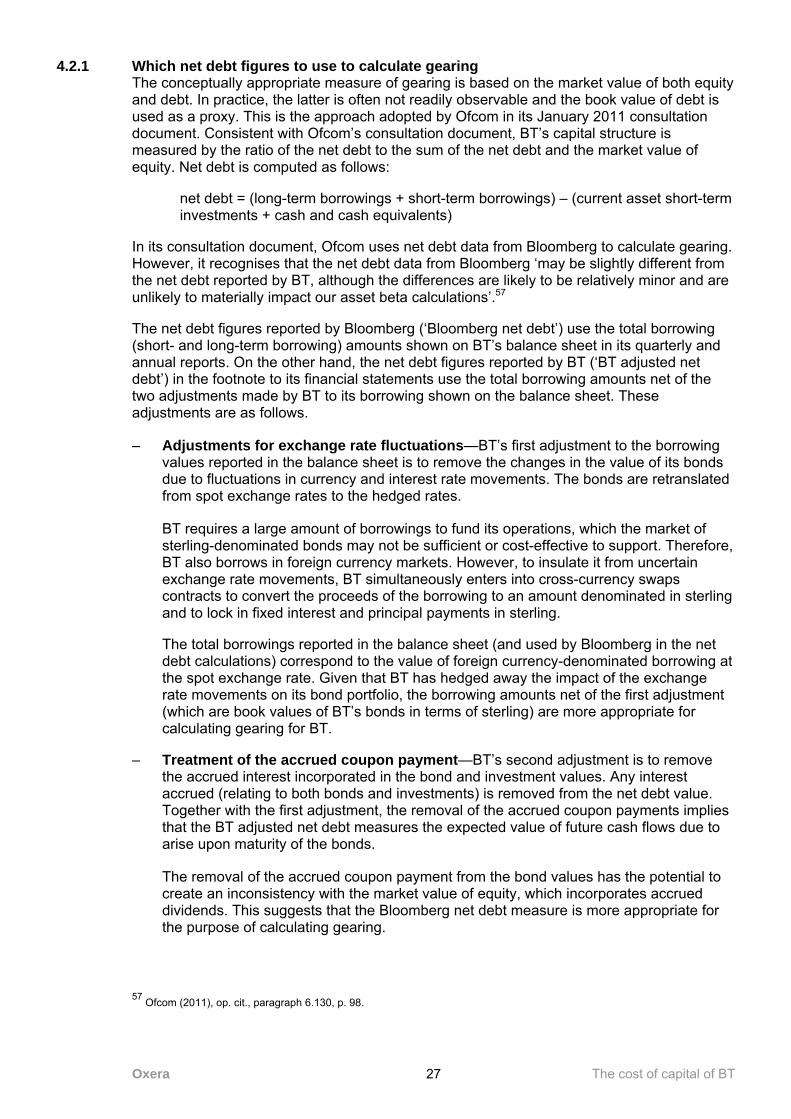
Oxera The cost of capital of BT 27
4.2.1 Which net debt figures to use to calculate gearing The conceptually appropriate measure of gearing is based on the market value of both equity and debt. In practice, the latter is often not readily observable and the book value of debt is used as a proxy. This is the approach adopted by Ofcom in its January 2011 consultation document. Consistent with Ofcom’s consultation document, BT’s capital structure is measured by the ratio of the net debt to the sum of the net debt and the market value of equity. Net debt is computed as follows:
net debt = (long-term borrowings + short-term borrowings) – (current asset short-term investments + cash and cash equivalents)
In its consultation document, Ofcom uses net debt data from Bloomberg to calculate gearing. However, it recognises that the net debt data from Bloomberg ‘may be slightly different from the net debt reported by BT, although the differences are likely to be relatively minor and are unlikely to materially impact our asset beta calculations’.57
The net debt figures reported by Bloomberg (‘Bloomberg net debt’) use the total borrowing (short- and long-term borrowing) amounts shown on BT’s balance sheet in its quarterly and annual reports. On the other hand, the net debt figures reported by BT (‘BT adjusted net debt’) in the footnote to its financial statements use the total borrowing amounts net of the two adjustments made by BT to its borrowing shown on the balance sheet. These adjustments are as follows.
– Adjustments for exchange rate fluctuations—BT’s first adjustment to the borrowing values reported in the balance sheet is to remove the changes in the value of its bonds due to fluctuations in currency and interest rate movements. The bonds are retranslated from spot exchange rates to the hedged rates.
BT requires a large amount of borrowings to fund its operations, which the market of sterling-denominated bonds may not be sufficient or cost-effective to support. Therefore, BT also borrows in foreign currency markets. However, to insulate it from uncertain exchange rate movements, BT simultaneously enters into cross-currency swaps contracts to convert the proceeds of the borrowing to an amount denominated in sterling and to lock in fixed interest and principal payments in sterling.
The total borrowings reported in the balance sheet (and used by Bloomberg in the net debt calculations) correspond to the value of foreign currency-denominated borrowing at the spot exchange rate. Given that BT has hedged away the impact of the exchange rate movements on its bond portfolio, the borrowing amounts net of the first adjustment (which are book values of BT’s bonds in terms of sterling) are more appropriate for calculating gearing for BT.
– Treatment of the accrued coupon payment—BT’s second adjustment is to remove the accrued interest incorporated in the bond and investment values. Any interest accrued (relating to both bonds and investments) is removed from the net debt value. Together with the first adjustment, the removal of the accrued coupon payments implies that the BT adjusted net debt measures the expected value of future cash flows due to arise upon maturity of the bonds.
The removal of the accrued coupon payment from the bond values has the potential to create an inconsistency with the market value of equity, which incorporates accrued dividends. This suggests that the Bloomberg net debt measure is more appropriate for the purpose of calculating gearing.
57 Ofcom (2011), op. cit., paragraph 6.130, p. 98.

Oxera The cost of capital of BT 28
The above discussion indicates that, while the first adjustment results in a more appropriate net debt measure for calculating BT’s gearing, the second adjustment implies that the Bloomberg net debt measure may be more appropriate. Therefore, to determine which of the two net debt measures is overall likely to be better for the calculation of BT’s gearing, the magnitudes of the two adjustments are compared.
Table 4.3 shows the net debt figures as reported by Bloomberg, the two adjustments made by BT, BT adjusted net debt, as well as the percentage difference between the Bloomberg and BT adjusted net debt, from Q1 2008 to date.
Table 4.3 BT net debt estimation (£m)
Q1 2008
Q2 2008
Q3 2008
Q4 2008
Q1 2009
Q2 2009
Q3 2009
Q4 2009
Q1 2010
Q2 2010
Q3 2010
Bloomberg net debt (a) 10,496 11,506 13,445 12,444 11,487 11,387 11,412 10,933 10,229 10,110 9,542
Hedging adjustment1 277 –155 –2,070 –1,766 –728 –1,169 –1,010 –1,326 n/a –1,027 n/a
Accrued interest adjustments2
–192 –323 –315 –317 –242 –340 –290 –324 n/a –379 n/a
BT adjusted net debt (b) 10,581 11,028 11,060 10,361 10,517 9,878 10,112 9,283 8,879 8,704 8,674
% difference between (a) and (b)3
–1% 4% 22% 20% 9% 15% 13% 18% 15% 16% 10%
Note: 1 This adjustment is made in order to re-translate balances of foreign currency-denominated borrowings at the current exchange rate to balances based on the swapped rates when the bonds are hedged. 2 This adjustment is made in order to adjust the bond values net of any accrued interest coupons. 3 The percentage difference is calculated as Bloomberg net debt / BT adjusted net debt – 1. Source: BT quarterly results and announcements.
Table 4.3 indicates that the first adjustment (which removes the impact of currency fluctuations on the value of BT’s bonds) is generally greater than the second adjustment. Moreover, the differences in the net debt measures from these two adjustments combined are substantial—sometimes more than 20%. The relative magnitude of the first adjustment suggests that, of the two measures, BT adjusted net debt is likely to be a better measure for estimating the gearing of BT.
As an additional cross check, the net debt measure used by professional analysts and brokers who follow BT on a regular basis is identified. The analysis of the net debt measure adopted by analysts and brokers suggests that the BT adjusted net debt figures are used in their evaluation of BT, which provides another reason for relying on BT adjusted net debt for calculating BT’s gearing.58
To evaluate the impact of using different net debt measures for calculating gearing, Figure 4.4 presents quarterly estimates of BT’s gearing based on Bloomberg’s net debt and the BT adjusted net debt measures from 2008 to date.
58 Based on analysis of about 40 analysts’ reports on BT issued in the past three years.

Oxera The cost of capital of BT 29
Figure 4.4 Gearing estimates based on Bloomberg net debt and BT adjusted net debt
Source: BT quarterly reports and Bloomberg data
As shown in Figure 4.4, the gearing estimates based on the two sets of net debt figures started to diverge in September 2008. Since then, the gearing levels based on Bloomberg net debt values have been consistently higher than those based on the BT adjusted net debt. In March 2009, when BT’s gearing reached the peak level, gearing was 67% and 63% based on Bloomberg net debt and the BT adjusted net debt measures, respectively. The two-year average quarterly gearing level as at March 11th 2011 is 52% and 50% based on Bloomberg net debt and the BT adjusted net debt figures, respectively.
In sum, the above discussion suggests that the gearing levels computed using the BT adjusted net debt tends to be more appropriate than those based on Bloomberg net debt. Therefore, in the remainder of the discussion below, gearing will be computed using the BT adjusted net debt.
As shown in Figure 4.5 below, in the period of 2001 to 2007, BT’s gearing levels fluctuated around 35%. However, during the financial crisis, mostly as a result of the sharp decline in BT’s stock price, the company’s gearing experienced a large swing, increasing from 36% in March 2008 to 63% in March 2009. Since then, gearing has declined steadily due both to the recovery of BT’s stock price and BT’s active debt-reduction programme. Currently, BT’s gearing is less than 38%.
0%
10%
20%
30%
40%
50%
60%
70%
80%
Mar-08 Jun-08 Sep-08 Dec-08 Mar-09 Jun-09 Sep-09 Dec-09 Mar-10 Jun-10 Sep-10 Dec-10
Gearing based on BT-adjusted net debt Gearing based on Bloomberg net debt
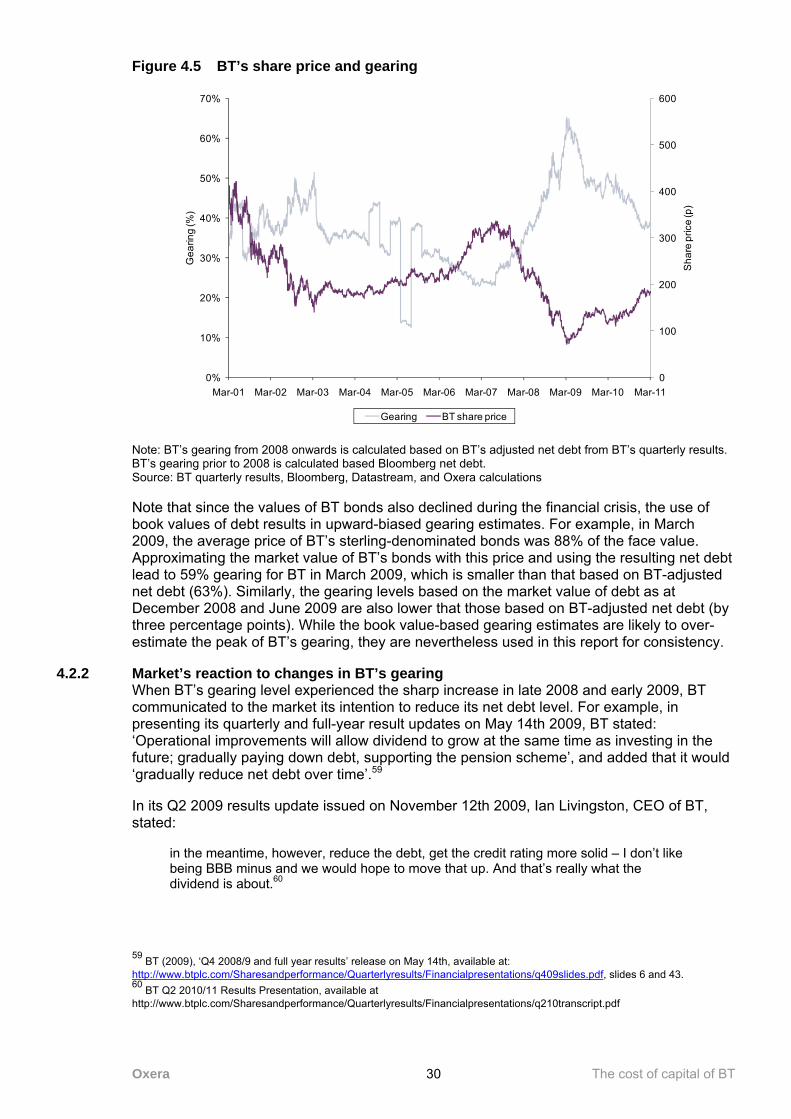
Oxera The cost of capital of BT 30
Figure 4.5 BT’s share price and gearing
Note: BT’s gearing from 2008 onwards is calculated based on BT’s adjusted net debt from BT’s quarterly results. BT’s gearing prior to 2008 is calculated based Bloomberg net debt. Source: BT quarterly results, Bloomberg, Datastream, and Oxera calculations
Note that since the values of BT bonds also declined during the financial crisis, the use of book values of debt results in upward-biased gearing estimates. For example, in March 2009, the average price of BT’s sterling-denominated bonds was 88% of the face value. Approximating the market value of BT’s bonds with this price and using the resulting net debt lead to 59% gearing for BT in March 2009, which is smaller than that based on BT-adjusted net debt (63%). Similarly, the gearing levels based on the market value of debt as at December 2008 and June 2009 are also lower that those based on BT-adjusted net debt (by three percentage points). While the book value-based gearing estimates are likely to over-estimate the peak of BT’s gearing, they are nevertheless used in this report for consistency.
4.2.2 Market’s reaction to changes in BT’s gearing When BT’s gearing level experienced the sharp increase in late 2008 and early 2009, BT communicated to the market its intention to reduce its net debt level. For example, in presenting its quarterly and full-year result updates on May 14th 2009, BT stated: ‘Operational improvements will allow dividend to grow at the same time as investing in the future; gradually paying down debt, supporting the pension scheme’, and added that it would ‘gradually reduce net debt over time’.59
In its Q2 2009 results update issued on November 12th 2009, Ian Livingston, CEO of BT, stated:
in the meantime, however, reduce the debt, get the credit rating more solid – I don’t like being BBB minus and we would hope to move that up. And that’s really what the dividend is about.60
59 BT (2009), ‘Q4 2008/9 and full year results’ release on May 14th, available at: http://www.btplc.com/Sharesandperformance/Quarterlyresults/Financialpresentations/q409slides.pdf, slides 6 and 43. 60 BT Q2 2010/11 Results Presentation, available at http://www.btplc.com/Sharesandperformance/Quarterlyresults/Financialpresentations/q210transcript.pdf
0
100
200
300
400
500
600
0%
10%
20%
30%
40%
50%
60%
70%
Mar-01 Mar-02 Mar-03 Mar-04 Mar-05 Mar-06 Mar-07 Mar-08 Mar-09 Mar-10 Mar-11
Sha
re p
rice
(p)
Gea
ring
(%)
Gearing BT share price

Oxera The cost of capital of BT 31
On May 13th 2010, BT presented an outlook of the net debt of less than £9 billion for 2010/11 in its ‘Q4/full year 2009/10 Results and Investor Day’ presentation.61
A review of analysts’ reports on BT issued over the past two years allows further assessment of how the general investing market approached the volatile gearing levels of BT. A significant number of professional analysts who follow BT on a regular basis forecast reduced net debt levels for BT going forward, starting as early as 2009 when BT’s actual gearing reached the peak level. Table 4.4 gives some examples of the net debt forecasts by the analysts.
Table 4.4 Net debt forecast by analysts (£m)
The evidence in Table 4.4 suggests that, in the past few years, the market has been forecasting a reduction in BT’s net debt. Compared with the net debt level at the peak of the gearing in March 2009 (£10,360m), the average forecast net debt level for 2011 is lower and that for 2012 is lower. Moreover, the forecast of the net debt level for a given future point in time has been declining steadily—for example, the net debt forecast for 2012 reduced from about in May 2009 to less than in 2010. These forecasts are consistent with BT’s contemporaneous communication to the market about reducing its net debt, as well as the actual declining trend of BT’s gearing since March 2009. Therefore, this evidence suggests that the market believed that the large swing in BT’s gearing in the past few years would be temporary and that there has been no permanent change in BT’s capital structure.
In addition to forecasting lower net debt figures for BT, some analysts’ reports contain explicit gearing assumptions. For example, a report by in assumes a debt to equity ratio of 33% in its estimation of BT’s WACC, which is equivalent to a gearing level of 25%.62 Similarly, in its analyst reports, used the same gearing level of 35% from 2009 to 2011 for its WACC estimation for BT; it did not increase the gearing assumptions to reflect the increase in actual gearing.63
Moreover, the comments by rating agency, Standard & Poor’s (S&P), on BT’s gearing level also imply that the actual high gearing in the past few years was higher than BT’s long-term gearing level:
Furthermore, BT’s leverage ratios are currently higher than we anticipate in the long term, although the group has shown progress in reducing debt levels though lower dividends, working capital efficiencies, and pension deficit repair payments that will reduce the pension deficit over time.64
Given that this evidence is consistent with the market forecasting a lower future gearing for BT and that stock prices are forward-looking in nature, it would be logical to infer that the forecast lower future gearing (rather than the actual high gearing) was incorporated in BT’s share price over the period.
Another piece of evidence supporting the assumption that BT’s share prices reflected the forecast lower future gearing is the relationship between estimated equity beta and actual gearing. Standard finance theory implies that, all else equal, the riskiness of the equity investment increases as a company increases its borrowing. This is because debt investors have the first claim on the cash flow generated by the company, and equity investors are the 61BT Q4/full year 2009/10 Results and Investor Day presentation, available at: http://www.btplc.com/Sharesandperformance/Quarterlyresults/Financialpresentations/q410slides.pdf 62 63 64 BT Group plc, Standard & Poor’s, August 18, 2010, p. 2.

Oxera The cost of capital of BT 32
residual claimants. As a company’s gearing level increases, a greater amount of the cash flows would go to debt investors, resulting in higher volatility for the remaining cash flows. Therefore, the equity beta of a company is expected to increase as its gearing level rises.
However, as shown in Figures 4.6 and 4.7 below, rolling estimates of one- and two-year equity betas of BT were relatively stable from 2007 to 2011, whereas BT’s gearing experienced a large swing.
Figure 4.6 One-year rolling equity beta and gearing averages
Source: Datastream, and Oxera calculations.
Figure 4.7 Two-year rolling equity beta and gearing averages
Source: Datastream, and Oxera calculations.
0%
10%
20%
30%
40%
50%
60%
0.0
0.2
0.4
0.6
0.8
1.0
1.2
1.4
Dec 07 Jun 08 Dec 08 Jun 09 Dec 09 Jun 10 Dec 10
Gea
ring
(%)
Equ
ity b
eta
1-year (FTSE All-share)—rolling equity beta1-year (FTSE All-share and FTSE All-world excluding UK)—rolling equity beta1-year gearing average
0%
10%
20%
30%
40%
50%
60%
0.0
0.2
0.4
0.6
0.8
1.0
1.2
1.4
Dec 07 Jun 08 Dec 08 Jun 09 Dec 09 Jun 10 Dec 10
Gea
ring
(%)
Equ
ity b
eta
2-year (FTSE All-share)—rolling equity beta2-year (FTSE All-share and FTSE All-world excluding UK)—rolling equity beta2-year gearing average

Oxera The cost of capital of BT 33
In contrast, both the five-year equity beta and five-year average gearing have been stable over the same period, as shown in Figure 4.8.
Figure 4.8 Five-year rolling equity beta and gearing averages
Source: Datastream, and Oxera calculations.
The relatively stable one- and two-year equity beta estimates and the highly volatile gearing levels of BT would be consistent with each other under the assumption that the stock price of BT in the past three years did not reflect the actual gearing, but instead reflected a forward-looking more stable gearing.
To assess the potential level of gearing incorporated in BT’s share prices, the following evidence is relevant.
– BT’s historical gearing level: before the onset of the large swing in the gearing, BT’s gearing fluctuated around 35% from 2001 to 2007. Indeed, this was the reason why, in its May 2009 cost of capital determination for BT, Ofcom assumed that the optimal gearing level for BT was 35%.65
– The reason behind the gearing hike in 2008/09: rather than a deliberate change in capital structure adopted by BT, the evidence suggests that the large increase in BT’s gearing in 2008/09 was largely the result of the significant decline in BT’s share prices due to the poor performance of BT global services amid the financial crisis.
– BT’s response since the gearing hike in 2008/09: almost as soon as BT’s gearing reached the peak in 2009, BT began actively to communicate to the market its intention to reduce net debt and its desire to maintain a solid credit rating. Consistent with this communication, since March 2009 BT’s gearing has been declining steadily. The current gearing level of less than 38% is similar to the historical average from 2001 to 2007.
65 Ofcom (2009), ‘A New Pricing Framework for Openreach’ May, p. 258. In Ofcom’s 2005 cost of capital determination for BT, Ofcom used two gearing levels, 30% and 35%, to estimate the cost of capital and used the average of the two resulting WACCs as its cost of capital estimation for BT. Ofcom (2005), ‘Ofcom’s approach to risk in the assessment of the cost of capital’, August, pp. 90 and 91.
-10%
0%
10%
20%
30%
40%
50%
60%
0.0
0.2
0.4
0.6
0.8
1.0
1.2
1.4
Dec 07 Jun 08 Dec 08 Jun 09 Dec 09 Jun 10 Dec 10
Gea
ring
(%)
Equ
ity b
eta
5-year (FTSE All-share)5-year (FTSE All-share and FTSE All-world excluding UK)5 year average gearing

Oxera The cost of capital of BT 34
The above suggests that a reasonable estimate of the potential gearing level that was incorporated into BT’s share prices in the past few years is probably close to the historical average prior to the spike in 2009. To the extent that the market may have incorporated the possibility that BT’s gearing might increase permanently, it is reasonable to assume that the potential gearing incorporated in the stock price was in the range of 35–40%. The lower end of this range (35%) reflects more the average gearing before the financial crisis, while the upper end (40%) reflects the potentially higher gearing for BT than the historical average. To be conservative, the top end of this range—40% gearing—is used in the discussion below to de-lever the equity beta.
4.3 BT’s asset beta and business risk
In addition to gearing, equity beta is affected by the systematic risk of the company (business risk). For a given capital structure of a company, higher business risk leads to higher equity beta, and this business risk is commonly measured by the asset beta.
An estimate of the asset beta can be obtained by de-levering the equity beta estimated from stock returns data, using the following formula:
βasset= 1-gearing *βequity+ gearing*βdebt
where gearing is the level of gearing to which the equity beta corresponds.
According to the finance textbook by Brealey, Myers, and Allen:66
The formulas for WACC and for unlevering and relevering expected returns are simple, but we must be careful to remember the underlying assumptions. The most important point is rebalancing.
Calculating WACC for a company at its existing capital structure requires that the capital structure not changed; in other words, the company must rebalance its capital structure to maintain the same market-value debt ratio for the relevant future.
This suggests that, if the future expected capital structure is significantly different from the current and historical one, it would be incorrect to de-lever equity beta estimates using actual historical gearing. This seems to apply in the case of BT for the past few years.
The discussion in the previous section suggests that the market may not have factored in the actual high gearing levels in BT’s share prices. Instead, the evidence presented supports the assumption that a forward-looking gearing level—that is likely to be similar or slightly higher than the historical average gearing—was incorporated in the share prices.
Therefore, to de-lever the equity beta, it is more appropriate to use the gearing level that was factored into the share prices than the observed gearing. The previous section suggests that a reasonable estimate of the gearing factored into BT’s share prices in the past few years is in the range of 35–40%. To be conservative, the top end of this range (ie, 40% gearing) is used in de-levering the equity beta estimates. Moreover, consistent with the assumption that 40% gearing was the market’s expected gearing for BT going forward, the same 40% gearing level is also used to calculate the WACC for BT for 2013/14.
Figure 4.9 compares the asset beta obtained from de-levering using the actual gearing and the assumed forward-looking gearing of 40%. The asset beta estimated based on the actual gearing declined steadily from 2008 to the end of 2010, whereas the asset beta based on a constant forward-looking gearing was more stable over this period.
66 Brealey, R., Myers, S. and Allen, F. (2008), Principles of Corporate Finance, ninth edition.
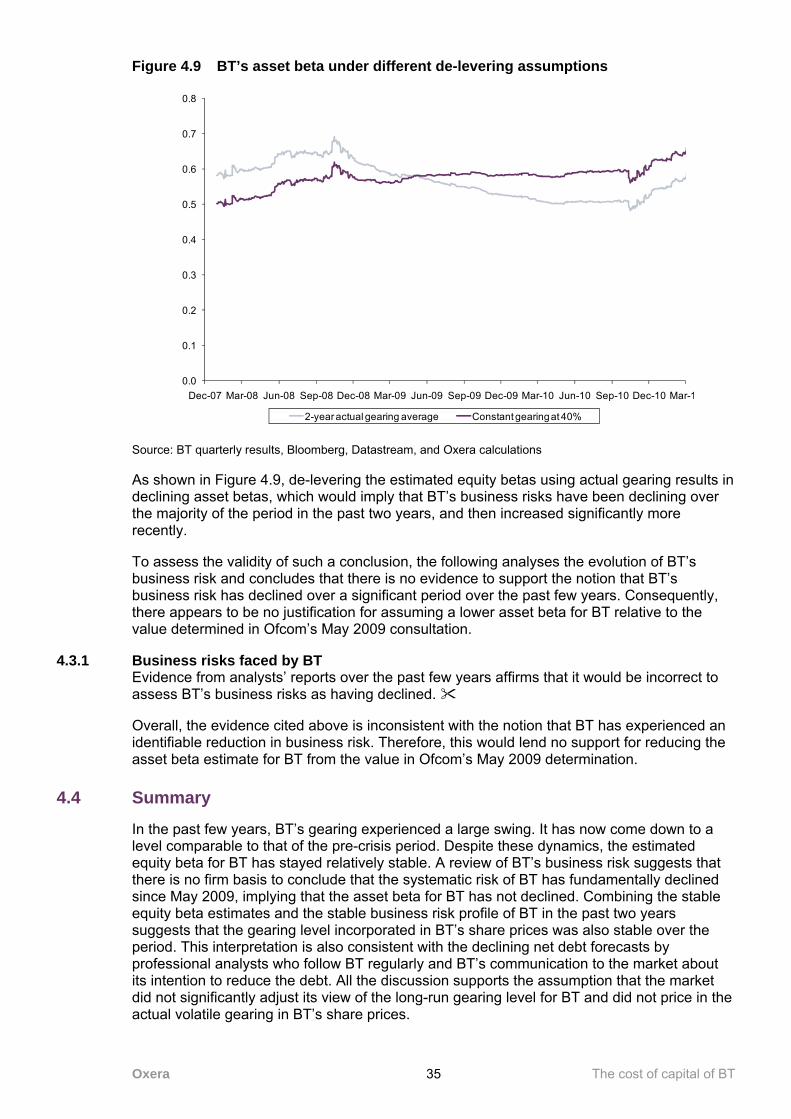
Oxera The cost of capital of BT 35
Figure 4.9 BT’s asset beta under different de-levering assumptions
Source: BT quarterly results, Bloomberg, Datastream, and Oxera calculations
As shown in Figure 4.9, de-levering the estimated equity betas using actual gearing results in declining asset betas, which would imply that BT’s business risks have been declining over the majority of the period in the past two years, and then increased significantly more recently.
To assess the validity of such a conclusion, the following analyses the evolution of BT’s business risk and concludes that there is no evidence to support the notion that BT’s business risk has declined over a significant period over the past few years. Consequently, there appears to be no justification for assuming a lower asset beta for BT relative to the value determined in Ofcom’s May 2009 consultation.
4.3.1 Business risks faced by BT Evidence from analysts’ reports over the past few years affirms that it would be incorrect to assess BT’s business risks as having declined.
Overall, the evidence cited above is inconsistent with the notion that BT has experienced an identifiable reduction in business risk. Therefore, this would lend no support for reducing the asset beta estimate for BT from the value in Ofcom’s May 2009 determination.
4.4 Summary
In the past few years, BT’s gearing experienced a large swing. It has now come down to a level comparable to that of the pre-crisis period. Despite these dynamics, the estimated equity beta for BT has stayed relatively stable. A review of BT’s business risk suggests that there is no firm basis to conclude that the systematic risk of BT has fundamentally declined since May 2009, implying that the asset beta for BT has not declined. Combining the stable equity beta estimates and the stable business risk profile of BT in the past two years suggests that the gearing level incorporated in BT’s share prices was also stable over the period. This interpretation is also consistent with the declining net debt forecasts by professional analysts who follow BT regularly and BT’s communication to the market about its intention to reduce the debt. All the discussion supports the assumption that the market did not significantly adjust its view of the long-run gearing level for BT and did not price in the actual volatile gearing in BT’s share prices.
0.0
0.1
0.2
0.3
0.4
0.5
0.6
0.7
0.8
Dec-07 Mar-08 Jun-08 Sep-08 Dec-08 Mar-09 Jun-09 Sep-09 Dec-09 Mar-10 Jun-10 Sep-10 Dec-10 Mar-1
2-year actual gearing average Constant gearing at 40%

Oxera The cost of capital of BT 36
Estimates of equity beta are affected by the choice of market index and the length of data period used in the estimation. Taking into consideration the one-, two-, and five-year equity beta estimates during the past two years, a narrow range of 0.9–1.0 is used for the purpose of estimating the cost of equity for BT.
De-levering this range of equity beta estimates with a conservative estimate of the gearing level reflected in BT’s share price in the past few years (40%) results in a range for the asset beta estimates of 0.59–0.65 (see Table 4.5). These asset beta estimates are similar to Ofcom’s May 2009 determination67 and are consistent with the evidence discussed above that there has been no identifiable decline in BT’s business risk during the past two years.
Table 4.5 Equity beta and asset beta used for BT’s cost of capital estimation
Low High
Estimated equity beta 0.9 1.0
Asset beta using forward gearing of 40% 0.59 0.65
Future equity beta 0.9 1.0 Source: Oxera.
To estimate the cost of equity for BT, the asset beta estimates would need to be re-levered using the forward gearing for 2013/14 to arrive at an estimate of future equity beta. Since BT’s share prices over the past few years appear to have reflected a forward-looking gearing, this same forward-looking gearing is used to de-lever the estimated equity beta and to re-lever the resulting asset beta. Given that the estimated equity betas are de-levered and re-levered at the same gearing level, the resulting estimate of the future equity beta is the same as the estimated equity beta.
The assumption that BT’s future equity beta would be the same as the current equity beta appears reasonable given that BT’s equity beta has remained relatively stable in the past two years, despite large changes in the company’s gearing and market conditions.
67 In May 2009, Ofcom proposed an equity beta range of 0.8–1.0 for BT Group, which combined with a 38% gearing and 0.15 debt beta yields an asset beta range of 0.55–0.68. See Ofcom (2009), ‘A new pricing framework for Openreach’, Annexes, paragraph A8.61, May.

Oxera The cost of capital of BT 37
5 Cost of debt
Ofcom’s consultation document proposes a range of 2–2.5% for the debt premium on BT’s bonds for 2013/14.68 Combining the range of the debt premium with Ofcom’s estimate of the nominal risk-free rate of 4% implies that Ofcom’s estimate of the cost of debt for BT is between 6% and 6.5%.
The evidence reviewed suggests that the 2–2.5% range of the debt premium proposed by Ofcom is a reasonable estimate for the debt premium of BT’s new debt.
However, the CC has adopted a different approach to estimate the cost of debt and used the weighted average cost of new and embedded (existing) debt. This approach ensures that regulated companies earn sufficient revenue to service their existing debt that is incurred efficiently and prudently. Following this approach, the weighted average cost of new and embedded debt is estimated for BT for 2013/14. BT’s cost of debt is significantly higher under this approach because the cost of BT’s existing debt is much higher than the cost of new debt.
This section discusses first the cost of new debt and then the cost of embedded debt. The cost of debt estimate based on the CC’s approach is 8.0%, which is significantly above Ofcom’s cost of debt estimate.
5.1 Cost of new debt for BT
To estimate the appropriate premium on BT’s debt, two sources of evidence are reviewed:
– spreads on bonds issued by BT—spreads on BT’s sterling-denominated bonds that are currently in issue;
– spreads on corporate bond indices, by credit rating—spreads on sterling-denominated bond indices, by credit rating, are examined to provide a cross-check on the estimates of the debt premium.
5.1.1 Spreads on sterling-denominated bonds issued by BT As discussed in section 4, BT’s bond portfolio consists of bonds denominated in sterling, euros and US dollars. BT engages in currency and interest rate swap contracts to convert most of the exposure of its bond portfolio into sterling-denominated fixed-rate liabilities. For example, according to BT’s 2010 Annual Report, 91% of BT’s bonds in 2010 effectively incur fixed interest payments in sterling.69 As a result of BT’s hedging strategy, the market spreads of BT’s bonds that are not denominated in sterling are less relevant for evaluating the cost of BT’s debt. Therefore, this section focuses on BT’s sterling-denominated fixed-rate bonds and examines the level and evolution of their spreads.
Table 5.1 presents information on the current and historical average spreads on BT’s sterling-denominated fixed-rate bonds. The spreads on the different bonds are very similar to each other and are around 200bp as at March 11th 2011. The one- and two-year average spreads of these bonds are higher, at around 229bp and 287bp, respectively.70 As the two-year average spread is still somewhat affected by the unusually high spreads at the end of the financial crisis, it is given less weight in determining the appropriate debt premium for BT.
68 Ofcom (2011), op. cit., pp 101, paragraph 6.150. 69 BT (2010), Annual report, page 119, footnote 18 to the financial statements. 70 The average spreads are calculated across all the bonds shown in Table 5.1.

Oxera The cost of capital of BT 38
Table 5.1 Spread on BT’s sterling-denominated bonds
Figure 5.1 shows the evolution of spreads on BT’s sterling-denominated fixed-rate bonds from 2007 to date, as well as the spreads on the BBB rated bond index. The spreads on BT’s bonds reached extremely high levels during the peak of the financial crisis, but have been relatively stable since. The spreads on BT’s different bonds are in the range of 180–280bp in the past year, with an average of 229bp. This evidence suggests that the debt premium of 2–2.5% proposed in Ofcom’s consultation document is appropriate.
It is useful to compare the spreads on BT’s bonds with those on the BBB rated corporate bond index. In the period prior to the financial crisis, BT’s bonds were rated BBB+. S&P lowered the rating on BT’s long-term bonds to BBB in March 2009 and again to BBB– in February 2010.71 In December 2010, S&P issued a positive outlook on BT’s bonds, which may suggest a possible return in BT’s bond rating to BBB in the next 18 months.72 This latest development is in line with BT’s debt-reduction strategy and its goal of obtaining a BBB credit rating, as discussed in section 4.
Despite the change in the credit rating of BT’s long-term bond in the past three years, the spreads on its bonds have broadly tracked the spreads on the BBB rated corporate bond index—indeed, even when its gearing was at its peak in 2009, these spreads were comparable.73 The fact that the spreads remained similar despite the increase in BT’s gearing at the time may be taken as further evidence that the market may have assumed that the gearing increase would be temporary only, rather than reflecting a long-term change in BT’s capital structure and associated higher default risk.
Figure 5.1 Spreads on BT’s outstanding bonds
71 S&P (2010), ‘Examining the factors behind the downgrade of BT Group to BBB-,’ February. S&P (2009), ‘BT Group Plc Long-Term Rating Lowered to ‘BBB’ From ‘BBB+’, On Weak Cash Flows, S-T ‘A-2’ Rating Affirmed; Outlook Stable’, March. The downgrade to BBB– in 2010 was due mostly to the increased pension payment BT agreed with the pension trust and the downgrade to BBB in 2009 was due mostly to cash-flow concerns related to the poor performance of BT global services. 72 S&P (2010), ‘UK Telecom providers BT outlook revised to positive in improved cash flow and leverage: Affirmed at BBB-/A-3’, December. 73 There is no bond index for corporate bonds rated BBB minus.
0
100
200
300
400
500
600
Jun-07 Dec-07 Jun-08 Dec-08 Jun-09 Dec-09 Jun-10 Dec-10
Spr
ead
(bp)
BT plc 1994 8 5/8% 26/03/20 - SPREADBMRKCURVEBT plc 1999 5 3/4% 07/12/28 - SPREADBMRKCURVEBT plc 2001 G/R 07/12/16 REG.S - SPREAD BMRKCURVEBT plc 2007 6 3/8% 23/06/37 REG.S - SPREAD BMRKCURVEBT plc 2007 6 5/8% 23/06/17 REG.S - SPREAD BMRKCURVESpread on IBOXX £ CORP.NON-FIN 7-10Y BBB - RED. YIELD
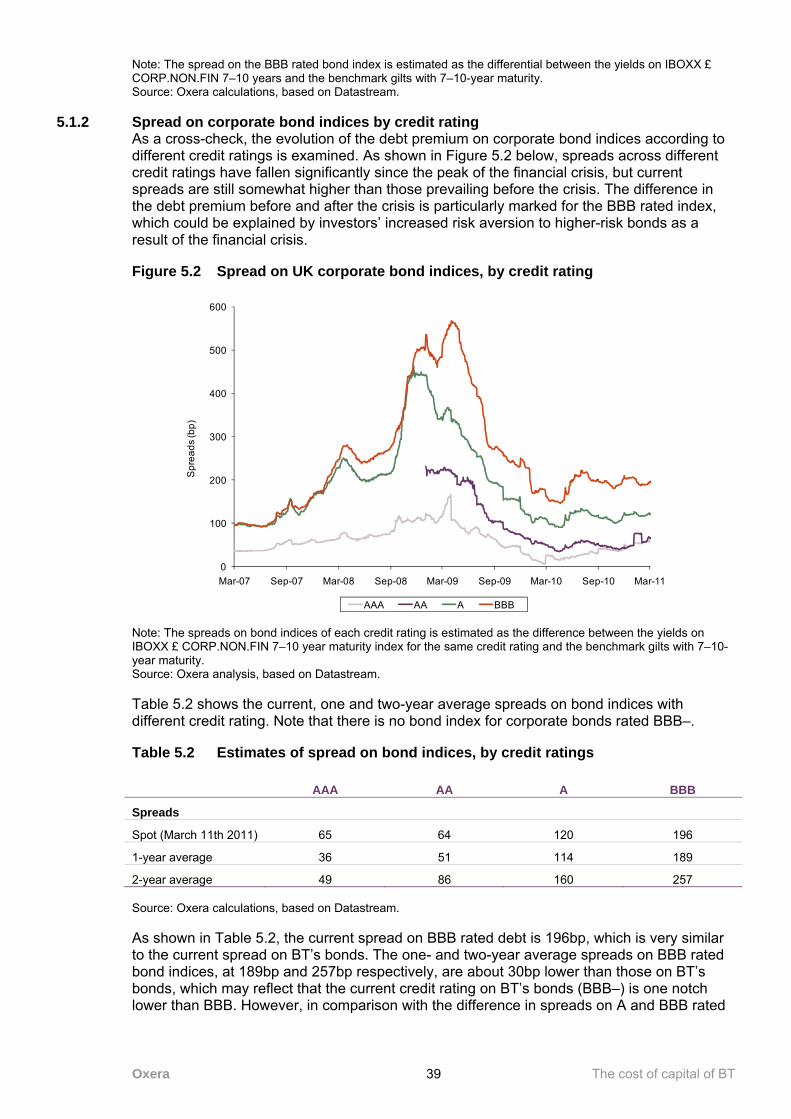
Oxera The cost of capital of BT 39
Note: The spread on the BBB rated bond index is estimated as the differential between the yields on IBOXX £ CORP.NON.FIN 7–10 years and the benchmark gilts with 7–10-year maturity. Source: Oxera calculations, based on Datastream.
5.1.2 Spread on corporate bond indices by credit rating As a cross-check, the evolution of the debt premium on corporate bond indices according to different credit ratings is examined. As shown in Figure 5.2 below, spreads across different credit ratings have fallen significantly since the peak of the financial crisis, but current spreads are still somewhat higher than those prevailing before the crisis. The difference in the debt premium before and after the crisis is particularly marked for the BBB rated index, which could be explained by investors’ increased risk aversion to higher-risk bonds as a result of the financial crisis.
Figure 5.2 Spread on UK corporate bond indices, by credit rating
Note: The spreads on bond indices of each credit rating is estimated as the difference between the yields on IBOXX £ CORP.NON.FIN 7–10 year maturity index for the same credit rating and the benchmark gilts with 7–10-year maturity. Source: Oxera analysis, based on Datastream.
Table 5.2 shows the current, one and two-year average spreads on bond indices with different credit rating. Note that there is no bond index for corporate bonds rated BBB–.
Table 5.2 Estimates of spread on bond indices, by credit ratings
AAA AA A BBB
Spreads
Spot (March 11th 2011) 65 64 120 196
1-year average 36 51 114 189
2-year average 49 86 160 257 Source: Oxera calculations, based on Datastream.
As shown in Table 5.2, the current spread on BBB rated debt is 196bp, which is very similar to the current spread on BT’s bonds. The one- and two-year average spreads on BBB rated bond indices, at 189bp and 257bp respectively, are about 30bp lower than those on BT’s bonds, which may reflect that the current credit rating on BT’s bonds (BBB–) is one notch lower than BBB. However, in comparison with the difference in spreads on A and BBB rated
0
100
200
300
400
500
600
Mar-07 Sep-07 Mar-08 Sep-08 Mar-09 Sep-09 Mar-10 Sep-10 Mar-11
AAA AA A BBB
Spr
eads
(bp)
Oxera The cost of capital of BT 40
bond indices (about 80bp), this difference appears to be small. Moreover, the spreads on BT’s bonds were also similarly higher than the spread on the BBB bond index in 2007, when BT’s bonds were rated BBB+.
This evidence suggests that, even though BT’s actual gearing was relatively high in the past few years, there was no increase in the spreads of BT’s bonds relative to the benchmark of the BBB bond index. This in turn is consistent with the discussion in section 4 that the (bond) market does not appear to have priced in a permanently higher gearing for BT. Instead, the evidence supports the interpretation that a forward-looking estimate of gearing (similar to the historical levels of gearing) is likely to have been priced in the spreads of BT’s bonds over the past three years.
Overall, the evidence reviewed suggests that Ofcom’s proposed range of 2–2.5% for the debt premium on BT’s bonds is reasonable. Combining this range with the point estimate of the nominal risk-free rate (4.5%), the cost of new debt would be in the range of 6.5–7%. This estimate is higher than the cost of debt proposed by Ofcom (6–6.5%) due to the higher nominal risk-free rate assumption.
5.2 The CC’s approach to the cost of debt
The CC’s approach to estimate the cost of debt is to calculate a weighted average of the cost of embedded (existing) debt and the cost of new debt. The CC summarised its applications of this approach in its cost of capital determination for Bristol Water in 2010 as follows:74
In recent airports regulatory inquiries, the CC indicated that it would normally factor a company’s existing fixed-rate debt costs into its calculation of the cost of debt. Similarly, in the 2000 Mid Kent Water inquiry, the CC included the additional cost of fixed-rate debt (the position at that time was that existing fixed-rate debt tended to be more expensive than new debt—the opposite of the current position for Bristol Water (see Table 2)). The CC has therefore calculated the cost of debt as a weighted average of the cost of existing debt and the cost of new debt (with the amount of new debt depending on the assumed level of gearing).
The CC’s 2007 recommendations for Heathrow and Gatwick also suggest that it is appropriate to consider the cost of existing debt when estimating the cost of capital:75
At future CC reviews, provided that fixed-rate debt has been incurred prudently and efficiently, having regard to the market conditions at the time, there may be grounds for our successors to consider that it is appropriate that price caps should provide the airports with sufficient revenue to cover the costs of servicing that debt until it matures…
In addition, the CC included an allowance for the cost of embedded debt in its review of the price control for Stansted in 2008.76
According to the CC’s approach, an appropriate estimate for the cost of debt for BT would take into consideration the cost of the embedded debt and the cost of new debt. The cost of new debt for BT has already been discussed in section 5.1. This section discusses the cost of embedded debt for BT.77
74 Competition Commission (2010), ‘Bristol Water plc—A reference under section 12(3)(a) of the Water Industry Act 1991’, August 4th, p. 65, para 9.13. 75 Competition Commission (2007), ‘BAA Ltd: A report on the economic regulation of the London airport companies (Heathrow Airport Ltd and Gatwick Airport Ltd), appendix F, September, p. F11. The CC’s estimates of the cost of debt in the Heathrow and Gatwick reviews were not based on the application of a duty to financing clause (which exists in the water industry) as there was no such duty for airports at the time of the estimation. 76 Competition Commission (2008), ‘Stansted Airport Ltd, Q5 price control review’, Appendix L, October 23rd, pp. L8-L11. 77 Some regulators also incorporate refinancing fees and other transaction costs related to the debt financing into the estimation of the cost of debt. In the case of BT, since most of these costs are included in the cost of embedded debt—ie, in the ‘effective interest rate’ that BT reports for its bond portfolio—these are not estimated separately.

Oxera The cost of capital of BT 41
5.2.1 Cost of embedded debt for BT As discussed earlier, as a result of hedging with currency and interest rate swaps contracts, the majority of BT’s long-term bonds effectively incur a fixed interest rate in sterling. For the fiscal year ended March 31st 2010, the effective cost of BT’s long-term fixed interest rate sterling bonds is 8.0%.78 However, in order to estimate the cost of existing debt for 2013/14, it is necessary to exclude bonds that would mature before April 2013 since they would not be in existence in 2013/14.
Table 5.3 below presents the cost of BT’s bonds that effectively incur a fixed rate for the 2013/14 period (as provided by BT for the purpose of this report). Analysis undertaken by BT suggests that the cost of its long-term bonds that are effectively exposed to a fixed rate is for 2013/14.79
Table 5.3 Effective cost of BT’s fixed-rate bonds in 2013/14
The cost of BT’s floating-rate bonds in 2013/14 is likely to be similar to the cost of new debt estimated in the previous section (6.5–7%) since they are affected by the same factors. The midpoint estimate of the cost of new debt and floating-rate bonds is 6.75%.
The only remaining values that need to be estimated are the weights of the fixed- and floating-rate bonds in BT’s debt portfolio in 2013/14. BT’s net debt was £8,674m at the end of December 2010.80 To be conservative, it is assumed that BT would maintain the same level of net debt in 2013/14 and the difference between the net debt and fixed-rate borrowing
is borrowed at the floating rate, which has an expected cost of 6.75%.
Therefore, the weighted average cost of new and embedded debt is 8.0%.81
5.3 Summary
Consistent with the discussion in section 4, the evidence presented in this section suggests that, despite BT’s actual high levels of gearing in the past few years, the market did not appear to have priced in a higher permanent gearing compared with the historical average gearing level before the financial crisis. Instead, the spreads on BT’s bonds are consistent with the assumption that investors believed that the high levels of BT’s gearing in the past few years would be temporary, and that there has been no or little change in BT’s long-run capital structure.
Focusing solely on the cost of new debt, evidence on the spreads of BT’s bonds and the BBB rated bond index suggest that the 2–2.5% debt premium proposed by Ofcom is appropriate. Combining the range for the debt premium with the point estimate for the nominal risk-free rate implies that the cost of new debt is in the range of 6.5–7%.
However, following the CC’s approach to estimate the cost of debt as the weighted average cost of new and embedded debt would result in a much higher cost of debt estimate. The CC’s approach ensures that regulated companies earn sufficient revenue to service its existing debt that is incurred efficiently and prudently. The cost of the embedded debt for BT in 2013/14 is estimated conservatively to be 8.0%, which is significantly higher than the cost of new debt. This cost of debt is used in estimating the overall cost of capital for BT for 2013/14.
78 BT (2010), Annual report, footnote 18, p. 120. 79 80 BT’s Q3 2010 financial results release, available at http://www.btplc.com/News/ResultsPDF/q311release.pdf. 81

Oxera The cost of capital of BT 42
6 Overall estimation of BT’s cost of capital
Table 6.1 combines Oxera’s estimates of the cost of equity, cost of debt, and forward-looking gearing to arrive at an overall estimate of BT’s cost of capital for 2013/14.
Table 6.1 Cost of capital estimation for BT
WACC parameter Ofcom
May 2009 Ofcom
January 2011 Oxera
March 2011
Real risk-free rate (%) 2 1.5 1.5–2
Inflation (%) 2.5 2.5 2.5–3
Nominal risk-free rate (%) 4.5 4 4–5
Equity risk premium (%) 5 5 4.5–5.5
Equity beta (estimated) 0.9 0.78–1.08 0.9–1.0
Gearing for de-levering (%) 38 50–53 40
Asset beta1 0.61 0.45–0.60 0.59–0.65
Gearing for re-levering (%) 35 50 40
Equity beta (re-levered) 0.86 0.78–1.08 0.90–1.0
Debt premium (%) 3 2–2.5
Cost of debt (%) 8.02
Tax (%) 28 25 25
WACC (pre-tax nominal) (%) 10.6 8.2–9.73 10.4–10.84 Note: 1 The asset beta is estimated based on the assumption that the debt beta is 0.125, which is consistent with Ofcom’s proposal in its January 2011 consultation document. 2 This is the weighted average cost of new and embedded debt. 3 This is the extended range considered by Ofcom, not the range implied by the parameters shown in the column (which is 8.3–9.5%). 4 The WACC estimation is based on the point estimates of the nominal risk-free rate (4.5%) and ERP (5%). Source: Ofcom (2009), ‘A new pricing framework for Openreach’, May, p. 24, Table 4.5. Ofcom (2011), ‘Proposals for WBA charge control—Consultation document and draft notification of decisions on charge control in WBA Market’, January 20th, p. 83, Table 6.3. Oxera calculations.
Based on Oxera's assessment of the underlying parameters, an appropriate range for BT’s cost of capital for the 2013/14 period would be 10.4–10.8%. This range is based on the point estimates of the nominal risk-free rate (4.5%) and ERP (5%), as well as the weighted average cost of new and embedded debt (as per the CC’s approach). This estimate is above Ofcom’s proposed range in the January 2011 consultation document, but similar to Ofcom’s May 2009 determination.

www.oxera.com
Park Central 40/41 Park End Street
Oxford OX1 1JD United Kingdom
Tel: +44 (0) 1865 253 000 Fax: +44 (0) 1865 251 172
Stephanie Square Centre Avenue Louise 65, Box 11
1050 Brussels Belgium
Tel: +32 (0) 2 535 7878 Fax: +32 (0) 2 535 7770
Thavies Inn House 7th Floor
3/4 Holborn Circus London EC1N 2HA
United Kingdom
Tel:+44 (0) 20 7822 2650 Fax:+44 (0) 20 7822 2651