Embed Size (px)
Citation preview

Engineering Structures 27 (2005) 1138–1150
www.elsevier.com/locate/engstruct
der
ress–strainnsourineeringeffect” inect and noere strengthration thatd to cyclic
ientation onteretic loopsorsion.iveents but is
Analytical prediction of the pinching mechanism of RC elements uncyclic shear using a rotation-angle softened truss model
M.Y. Mansoura, Jung-Yoon Leeb,∗, R. Hindic
aDepartment of Civil and Environmental Engineering, University of Houston, Houston, TX, 77204, USAbDepartment of Architectural Engineering, Sungkyunkwan University, 300, Chunchun-dong, Jangan-gu, Suwon, 440-746, South Korea
cDepartment of Civil Engineering and Construction, Bradley University, Peoria, IL, 61625, USA
Received 30 March 2004; received in revised form 17 February 2005; accepted 24 February 2005Available online 20 April 2005
Abstract
The response of a reinforced concrete (RC) element under cyclic shear is characterized by the hysteretic loops of the shear stcurves. These hysteretic loops can exhibit strength deterioration,stiffness degradation, and a pinched shape. Recent tests [MaMY, Hsu TTC. Behavior of reinforced concrete elements under cyclic shear. I: Experiments. ASCE Journal of Structural Eng2005;131(1):44–53] have shown that the orientation of steel grids in RC shear elements has a strong effect on the “pinchingthe post-yield hysteretic loops. When the steel grid was set at a 45 degree angle to the shear plane, there was no pinching effstrength deterioration. However, when the steel grid was set parallel to the shear plane, there was a severe pinching effect and sevdeterioration with increasing shear strain magnitude. It was thus obvious that the undesirable “pinching effect” and strength deteriowere attributed to the presence of high shear forces can be eliminated by properly orienting the steel grid in RC elements subjecteshear.
In this paper, two RC elements subjected to reversed cyclic shear stresses are considered to study the effect of the steel grid orthe shape of the cyclic shear stress–strain curves. The presence and absence of the pinching mechanism in the post-yield shear hysis studied using the Rotating Angle Softened Truss Model (RA-STM) theory [Hsu TTC. Softened truss model theory for shear and tACI Structural Journal 1988;85(6):624–35]. It is found that the RA-STM when combined with newly proposed cyclic material constitutrelationships can rationally predict the presence and absence of the pinching effect in the shear hysteretic loops of RC shear elemstill incapable of predicting the descending envelopes.© 2005 Elsevier Ltd. All rights reserved.
Keywords: Pinching effect; Energy dissipation; Ductility; Cyclic loading; Shear; Stress; Strain
nedtic
sartions toing
.
dedse oftheetentlyre
e off a
nt’singionof
1. Introduction
Structures located in earthquake regions are desigto withstand moderate seismic loading within the elasrange, and to absorb the energy of severe seismicloadingusing the plastic range. Consequently, it becomes necesto evaluate the inelastic responses and energy dissipacapacities of such structures and to determine methodenhance their seismic behavior under earthquake loadIn the case of structures that deform primarily in the
∗ Corresponding author. Tel.: +82 31 290 7564.
0141-0296/$ - see front matter © 2005 Elsevier Ltd. All rights reserveddoi:10.1016/j.engstruct.2005.02.011
y
.
flexural mode, the response is governed by well-rounhysteretic load–deformation curves because the responsuch elements is governed mainly by the properties ofreinforcing steel bars. By comparison, reinforced concrelements that deform primarily in the shear mode frequeshow significant pinching around zero load, and sevestrength deterioration in their hysteretic loops.
Thus, when the shear force governs the responsa reinforced concrete (RC) element, as in the case olow-rise shear wall, the effect of shear on the elemeresponse is thought to be responsible for the “pincheffect” in the hysteretic loops, resulting in the degradatof stiffness, deterioration of strength and the reduction
M.Y. Mansour et al. / Engineering Structures 27 (2005) 1138–1150 1139
,
,
r
swn
antheChighant
rallly
ofear
retic
soof
ing
ingresand
heng.r,
ruts
rcentheskedadthe
eralyhe
arto
eelr
ofed
mvesbytosly
ed
Nomenclature
Ecr andEs modulus of elasticity of concrete and steelbars, respectively
f ′c compressive strength of concrete cylinder
fcr cracking stress of concretef ′ct4 stress at point TD between Stage C1 and Stage
T4fi andεi average steel stress and strain at the load
reversal point, respectivelyf�, ft smeared stresses of steel bars in the� and t
directions, respectivelyfs andεs average stress and strain of mild steel bars
respectively,fy andεy yield stress and strain of bare mild steel bars
respectivelyk loading coefficientα angle between the direction of the principal
concrete stress and the direction of thelongitudinal steel
γ�t smeared shear strain in the�–t coordinatesystem
γ45◦ smeared shear strain in the 45◦ directionεc andσc average strain and stress of concreteεci andσci concrete strain and stress at the load
reversal pointεci+1 concrete strain at the end of the stage unde
considerationεd , εr smeared principal strains in ther and d
directions, respectivelyε�, εt smeared strains in the� and t directions,
respectivelyεH , εV smeared strains in theH and V directions,
respectivelyεo peak cylinder compressive strain of concreteξσ andξε softening coefficient of stress and strain,
respectivelyρ reinforcement steel ratioρ�, ρt steel ratios in the � and t directions,
respectivelyσd andσr principal stresses in the cracked concrete in
thed andr directions, respectivelyσ�, σt applied cyclic normal stresses in the� and t
directions, respectivelyσ c
� , σ ct stresses on the concreteelement alone in the�
andt directions, respectivelyτ�t applied cyclic shear stress in the�–t coordi-
nate systemτ c�t shear stress on the concrete element alone in
the�–t coordinate system
energy dissipation capacity, as the cyclic loading increasebeyond the yielding level. However, it was recently shothat this undesirable pinching effect [1] can be eliminated in
the hysteretic load–deformation curves of a shear-dominelement if the steel grid orientation is properly aligned in tdirection of the applied principal stresses. In this case, Rshear-dominant elements can be designed to possessenergy dissipation capacities, just like RC flexural-dominelements.
The effect of the steel bar orientation on the structuresponse of RC structures was first experimentainvestigated by Paulay [3] and Paulay and Binney [4] whoshowed that the pinching effect in the hysteretic loopscoupling beams can be controlled by adding inclined shreinforcement, as shown inFig. 1(a).Fig. 1(b), on the otherhand, shows the severe pinched shape in the hysteloops of the same beam considered inFig. 1(a), when noinclined shear reinforcement is used. Their test results alrevealed that the ductility, energy dissipation and strengthcoupling beams were considerably improved by arrangsteel diagonally.
The mechanisms behind the presence of the pincheffect in the hysteretic loops of shear-dominant structuwere studied by several researchers, like KinugasaNomura [5] and Fenwick et al. [6] to name a few, whoshowed that the pinching effect was mainly due to topening and closing of concrete cracks under cyclic loadiAccording to theirfindings, when subjected to cyclic sheatwo out of phase orthogonal sets of diagonal concrete stand cracks form in an RC element. After steel yielding,the shear deformation significantly increasesand hence thecrack width also increases. When the applied shear fois reversed in direction, the opened cracks are closed ione direction and the closed cracks start to open inorthogonal direction at very low level of shear forces. Aa consequence, the strength and the stiffness of the cracconcrete are remarkably reduced during this period of loreversal, creating the pinching effect. The presence ofpinching effect was also attributed to the deterioration ofthe bond between concrete and the steel bars. Sevbond–slip models [7–9] were in turn proposed to analyticallmodel the pinching effect in the hysteretic loops of tload–deformation curves of shear-dominant elements.
Even though previous researchers [5,6] were able todescribe physically the pinching mechanism in shedominant structures, to date no study has been ableshow analytically the variation of the concrete and ststresses and strains as the pinching effect progresses fothe hysteretic loops of the shear stress–strain curvesRC elements. In this paper, the Rotating Angle SoftenTruss Model [2] (RA-STM) is used to explain rationallythe presence and absence of the pinching mechanisin the hysteretic loops of the shear stress–strain curof two out of twelve RC elements previously testedMansour and Hsu [1]. The tested panels were subjectedreversed cyclic shear. The RA-STM which was previouproposed by Hsu [2] to predict the shear behavior ofRC elements subjected to monotonic loading is extendin this paper to predict the cyclic behavior of two RC

1140 M.Y. Mansour et al. / Engineering Structures 27 (2005) 1138–1150
Fig. 1. Load–deflection curves of RC beams: (a) hysteresis loops withoutpinching effects and (b) hysteresis loops with pinching effects.
Fig. 2. RC elements subjected to in-plane stresses: (a) reinforced concrete, (b) concrete alone, (c) steel alone, and (d) principal axesd–r for stresses onconcrete.
newclictwo
totha
r
on olses.is
ine
are
lic
tith
n in
outipalg.
ionsare
rete
ipalf
theeteonreando
elements subjected to cyclic shear. This extension usesconstitutive relationships for concrete and steel under cyloading. Comparing the predicted responses of theseelements reveals the mechanism inherent in the pinchingphenomenon.
2. Rotating angle softened truss model (RA-STM)theory
2.1. Basic principles
The RA-STM [2] was mainly developed for the analysisof reinforced concrete membrane elements subjectedin-plane monotonic stresses. The RA-STM assumesthe steel reinforcement isuniformly distributed in theconcrete element and that the cracking is smeared ovethe element’s surfaces (Fig. 2(a)). In this investigation thetheory is extended and used topredict the behavior of RCelements subjected to cyclic shear stresses. The extensithe RA-STM requires only the formulation of new materiaconstitutive relationships for reversed cyclic loading. Theconstitutive relationships will be given in the next sectionThe equilibrium and compatibility relationships used in thpaper were originally derived by Hsu [2].
A reinforced concrete cracked element, shownFig. 2(a), is subjected toin-plane biaxial cyclic stresses. Th
t
f
directions of the longitudinal and transverse steel barsdesignated by the�- and t- axes, respectively, constitutingthe �–t coordinate system. Accordingly, the applied cycnormal stresses are designated asσ� andσt , and the appliedcyclic shear stresses asτ�t . The reinforced concrete elemencan be visualized as a combination of two elements wdifferent material properties: a concrete element, showFig. 2(b), and a steel element, shown inFig. 2(c).
The principal stresses in the concrete element (withsteel) can be assumed to coincide with the applied princstresses of the reinforced concrete element before crackinUpon cracking, the concrete element (Fig. 2(d)) is separatedby the cracks into a series of concrete struts. The directof the post-cracking principal stresses in concretedefined by thed–r coordinate system shown inFig. 2(d).Accordingly the principal stresses in the cracked concalone are defined asσd and σr in the d and r directions,respectively. The angle between the direction of the princstress in the cracked concrete (d-axis) and the direction othe longitudinal steel (�-axis) is defined as the angleα.
The RA-STM is based on the assumption thatinclination of principal compression stress in the concrcoincides with the inclination of the principal compressistrain. The RA-STM also assumes that the cracks asmeared throughout the reinforced concrete elements,the reinforcing bars are uniformly distributed in tw

M.Y. Mansour et al. / Engineering Structures 27 (2005) 1138–1150 1141
te)
lpens,tingarefon
ene
s
istiont
ssee
sssed
the
insal
e
.
n-
ased-C
in
ereingte.are
kedd byves
orthogonal directions (� andt). The behavior of the elemenis, therefore, formulated in terms of smeared (or averagstresses and smeared (or average) strains, so that the conceptof continuum mechanics can still be applied.
When using the RA-STM to predict the structuraresponse of a reinforced concrete element, three tyof equations are needed: the equilibrium equatiothe compatibility equations, and equations representhe constitutive material models. These equationssummarized in the following subsections. The derivations oall the equilibrium and compatibility equations are basedthe angleα (refer toFig. 2(d)).
2.2. Equilibrium equations
The stresses,σ�, σt , and τ�t , shown in Fig. 2(a), arethe applied stresses on the reinforced concrete elemviewed as a whole. The stresses on the concrete elemalone are denoted asσ c
� , σ ct andτ c
�t , as shown inFig. 2(b).The longitudinal and transverse steel provides the smearedstresses ofρ� f� andρt ft , as shown inFig. 2(c), where thepairs of ρ�, ρt and f�, ft are respectively the steel ratioand smeared stresses of steel bars in the� andt directions,respectively. The steel reinforcements are assumed to resonly axial stresses, neglecting any possible dowel actAccordingly, the stresses in areinforced concrete elemenare defined by the following three equilibrium equations:
σ� = σ c� + ρ� f� (1)
σt = σ ct + ρt ft (2)
τ�t = τ c�t . (3)
In these three equations, the three concrete stre(σ c
� , σ ct and τ c
�t ) in the �–t coordinate system can brelated to the principal stresses of concrete (σd and σr )in the d–r coordinate system using the principle of stretransformation. The three equations can then be expresas [2]:
σ� = σd cos2 α + σr sin2 α + ρ� f� (4)
σt = σd sin2 α + σr cos2 α + ρt ft (5)
τ�t = (−σd + σr ) sinα cosα. (6)
2.3. Compatibility equations
The three compatibility equations, which representrelationship between the strains (ε�, εt , andγ�t ) in the �–tcoordinates of the reinforcement and the principal stra(εd , εr ) in the d–r coordinates of the concrete principstresses, can be shown to be [2]:
ε� = εd cos2 α + εr sin2 α (7)
εt = εd sin2 α + εr cos2 α (8)
γ�t = (−εd + εr ) sinα cosα (9)
where εr and εd are the smeared principal strains of thconcrete in ther andd directions, respectively.
s
tnt
.
s
Fig. 3. Stress–strain curve of concretesubjected to reversed cyclic loading
2.4. Cyclic constitutive relationships of materials
The solution of Eqs. (4) through (9) requires the cyclicconstitutive relationships of the constituent materials (cocrete and steel) to be established. The cyclicstress–straincurves of cracked concrete in compression and tensionwell as the cyclic stress–strain curves of steel bars embded in concrete were obtained from testing full-scale Relements as described in detail by Mansour et al. [10]. Inwhat follows only a summary of the cyclic stress–stracurves of the materials is given.
2.4.1. Cyclic constitutive relationships of cracked concreteThe cyclic stress–strain curves of cracked concrete w
found to consist of several loading, unloading and reloadstages to describe the cyclic behavior of cracked concreThe cyclic stress–strain curves of cracked concreteshown inFig. 3. Experimental data [10] revealed that theenvelope curves for the cyclic stress–strain curves of cracconcrete in compression and tension can be approximatethe monotonic tensile and compressive stress–strain curof concrete as proposed by Belarbi and Hsu [11]. Theseenvelope curves are given below:
σc = (ξσ f ′
c − f ′ct4
) (2
(εc
ξεεo
)−(
εc
ξεεo
)2)
+ f ′ct4 εo ≤ εc < 0 (Stage C1) (10a)
σc = ξσ f ′c
(1 −
(εc/ε0 − 1
4/ξε − 1
))εc < εo (Stage C2)
(10b)
σc = Ecrεc 0 ≤ εc ≤ 0.00008 (Stage T1) (11a)
σc = fcr
(0.00008
εc
)0.4
εc > 0.00008 (Stage T2) (11b)
whereσc is the average stress of concrete;εc is the averagestrain of concrete; Ecr is the modulus of elasticity of

1142 M.Y. Mansour et al. / Engineering Structures 27 (2005) 1138–1150
s
eak
4;in,
on
d
n,fit
thege;
en
at
clice:
4—edcin
clicragegecan
ildd
.
;
anandger
rIn
heng
the
g
in
e of
lue
e
concrete taken as 3900√
f ′c (MPa); fcr is the cracking stres
of concrete taken as 0.31√
f ′c (MPa); f ′
c and εo are thecompressive strength of concrete cylinder and the pcylinder compressive strain, respectively;f ′
ct4 is the stressat point TD (in Fig. 3) between Stage C1 and Stage Tξσ andξε are the softening coefficient of stress and strarespectively, given by:
ξσ = ξε = 5.9√f ′c (MPa)
1√1 + kεr
(12)
whereεr is the principal tensile strain in the normal directito the principal compressive direction;k is the loadingcoefficient taken ask = 400 for proportional loading ank = 200 for sequential loading.
For theunloading and reloading curves a linear functiogiven by Eq. (13) below, was proposed and found to bestthe test results [10]:
σc = σci + Ecc(εci − εc) (13)
whereσci and εci are the concrete stress and strain atload reversal point or at the point where the stages chanEcc is the modulus of elasticity of concrete which was takto be as
Ecc = σci − σci+1
εci − εci+1(14)
whereσci+1 andεci+1 are the concrete stress and strainthe end of the stage under consideration.
2.4.2. Cyclic constitutive relationships of steel bars embed-ded in concrete
Five different stages were used to describe the cystress–strain curves of steelbars embedded in concretStage 1—before yielding of steel; Stage 2T—after yieldingof steel in tension; Stage 2C—after yielding of steel incompression; Stage 3—unloading region; and Stagereloading region. All five stages are shown illustratin Fig. 4. Test results [10] revealed that the monotonitensile stress–strain curves of steel bars embeddedconcrete as proposed by Belarbi and Hsu [12] couldalso be approximated as envelope curves to the cytensile stress–strain curves of steel bars. The avestress–strain relationships for Stage 1, Stage 2T and Sta2C representing the envelope curves are given below andbe found in detail elsewhere [10]:
Stage 1 fs = Esεs (εs ≤ εn) (15a)
Stage 2T
fs = fy
[(0.91− 2B) +
(0.02+ 0.25B
εs
εy
)](εs > εn)
(15b)
Stage 2C fs = − fy ( fs ≤ − fy) (15c)
where fs and εs are the average stress and strain of msteel bars, respectively,fy and εy are the yield stress anstrain of bare mild steelbars, respectively;Es is the modulus
Fig. 4. Stress–strain curve of steel barssubjected to reversed cyclic loading
of elasticity of steel bars;ρ is the reinforcement steel ratioεn = εy(0.93− 2B); andB = ( fcr/ fy)
1.5/ρ.The proposed cyclic stress–strain relationships for
embedded steel bar in concrete include the unloadingreloading branches taking into account the Baushineffect. Several models [13,14] have been developed fothe cyclic stress–strain relationship of steel bars.this paper, the unloading and reloading branches of tcyclic stress–strain relationship are given by the followiequation [15]:Stage 3 and Stage 4
εs − εi = fs − fi
Es
{1 + A−R
∣∣∣∣ fs − fi
fy
∣∣∣∣R−1
}(15d)
where fi andεi are the average steel stress and strain atload reversal point, respectively. The coefficientsA and Rin Eq. (15d) were determined from reversed cyclic loadintests to best fit the testresults of Mansour et al. [10] andwere taken asA = 1.9k−0.1
p ,R = 10k−0.2p . Theparameter
k p is the plastic strainεp normalized byεn and is taken ask p = εp/εn.
2.5. Solution procedure
The solution procedure used in the analysis is giventhe flow chart shown inFig. 5. The non-linear solution wascontrolled by means of a step-wise increment in the valuthe principal strainεd according to a prescribed deformationhistory. An iterative procedure was performed for each vaof εd until all the equilibrium, compatibility and constitutiveequations were satisfied.
3. Tests of elements CA3 and CE3
The two test elements considered, CA3 and CE3, arshown in Fig. 6(a). Two coordinate systems(H, V ) and
M.Y. Mansour et al. / Engineering Structures 27 (2005) 1138–1150 1143
henal
ids
n
st of
0%l
20calells.
uslyhe
erale
of
the
ipale
ls werethe
ng,ative
andngtntil
ethetrolays
tionbe
n be
wo
ent
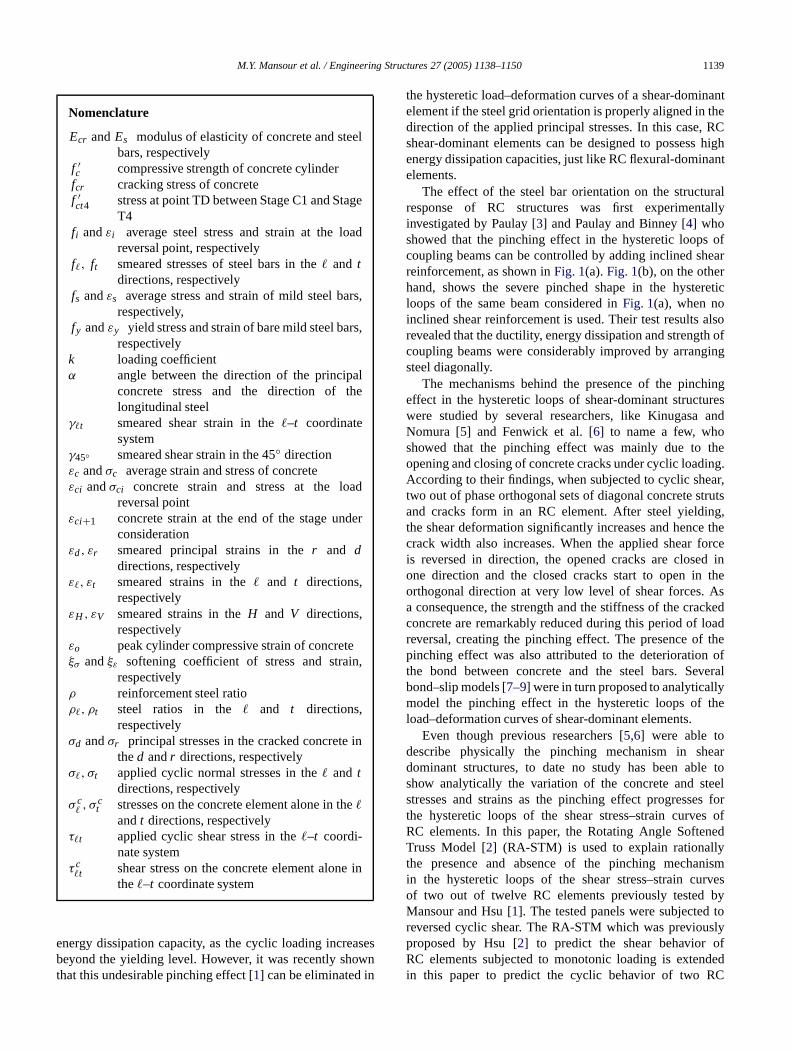
Fig. 5. Flow chart of solution procedure.
Fig. 6. Arrangement of steel barsand LVDT locations for panels CA3(45◦)
and CE3(0◦): (a) arrangement of steel bars and (b) LVDT arrangements.
(�, t) are usedfor the two elements. The firstH –Vcoordinate is used to represent the horizontal(H ) and thevertical (V ) directions of the applied principal stresses. Tsecond�–t coordinate is used to represent the longitudi(�) and transverse(t) directions of the steel bars.
The elements are reinforced with two parallel steel grplaced at angles of 45◦ and 0◦, respectively, to the horizontaldirection. The elements are 1397× 1397 × 178 mm insize. In element CA3, the�–t coordinate system makes a
angle of 45◦ with the H –V coordinate system, while inelement CE3 both theH –V and �–t coordinate systemcoincide with each other. Both panels had equal amounsteel in the longitudinal(�) and transverse(t) directions.The reinforcing ratios of elements CA3 and CE3 are 1.7and 1.20%, respectively, ineach direction. The materiaproperties for these two elements are summarized inTable 1.
The loads were applied through 20 horizontal andvertical in-plane jacks, and the horizontal and vertiapplied stresses were measured from the 40 jack load cThe in-plane pure shear stress in the 45◦ direction of theelement was then calculated by stress transformation. Theaverage (or smeared) strains were measured continuousing a set of LVDTs mounted on the two faces of ttest element as shown inFig. 6(b). Each LVDT measureda displacement over a length that traversed at least sevcracks. The measurement of the average strains in thhorizontal, vertical and one diagonal direction (at 45◦ tothe horizontal direction) can allow for the calculationthe shear strain at 45◦(γ45◦) using the principle of straintransformation as shown below:
γ45◦ = εH − εV (16)
whereεH and εV are the measured average strains inhorizontal and vertical directions, respectively.
The elements were subjected to reversed cyclic princstresses in the horizontal and vertical directions. When thestwo principal applied stresses were equal in magnitudeand opposite in direction, a state of pure shear stressτ45◦was created at the 45◦ direction to the applied principastresses. The average (or smeared) stresses and straincontinuously obtained by measuring the jack forces andelement deformations during testing. Under cyclic loadithe shear stresses alternated between positive and negvalues with increasing magnitude, as shown inFig. 7. Theabsolute values of maximum shear stresses (positivenegative) were chosen to be multiples of the crackishear stress. Once the yielding load of the RC elemenwas approached, a strain-control mode was adopted ufailure of the element. During this strain-control mode, thshear strain was used as an input signal to controlprincipal horizontal stress which in turn was used to conthe principal vertical stress. Both stresses were alwmaintained equal in magnitude and opposite in direcduring this stage. The shear strains were chosen tomultiples of the yield shear strain, as shown inFig. 7. Moredetails on the testing procedures and the test panels cafound elsewhere [1].
4. Experimental and predicted cyclic shear stress–straincurves
The experimental shear hysteretic loops of the telements, CA3(45◦) and CE3(0◦), are shown inFig. 8.In this figure, the vertical and horizontal axes represthe shear stressτ45◦ and the shear strainγ45◦ at 45◦ to

1144 M.Y. Mansour et al. / Engineering Structures 27 (2005) 1138–1150
Table 1Specification of specimens and material properties
Panel Concrete Steel in� direction Steel int direction Steel anglea
Rebars ρ� f�y Rebars ρt ft y
f ′c (MPa) (mm2) (%) (MPa) (mm2) (%) (MPa)
CA3 45 No. 6 (284) 1.70 428 No. 6 (284) 1.70 428 45◦CE3 50 No. 6 (284) 1.20 428 No. 6 (284) 1.20 428 0◦a The angle is measured with respect to the horizontal direction.
Fig. 7. Loading history of CA3(45◦).
Fig. 8. Comparison between the observed and predicted cyclic shear stress–strain curves of panels CA3(45◦) and CE3(0◦): (a) test result of CA3, (b) analyzedresult of CA3, (c) test result of CE3, and (d) analyzed result of CE3.
M.Y. Mansour et al. / Engineering Structures 27 (2005) 1138–1150 1145
.
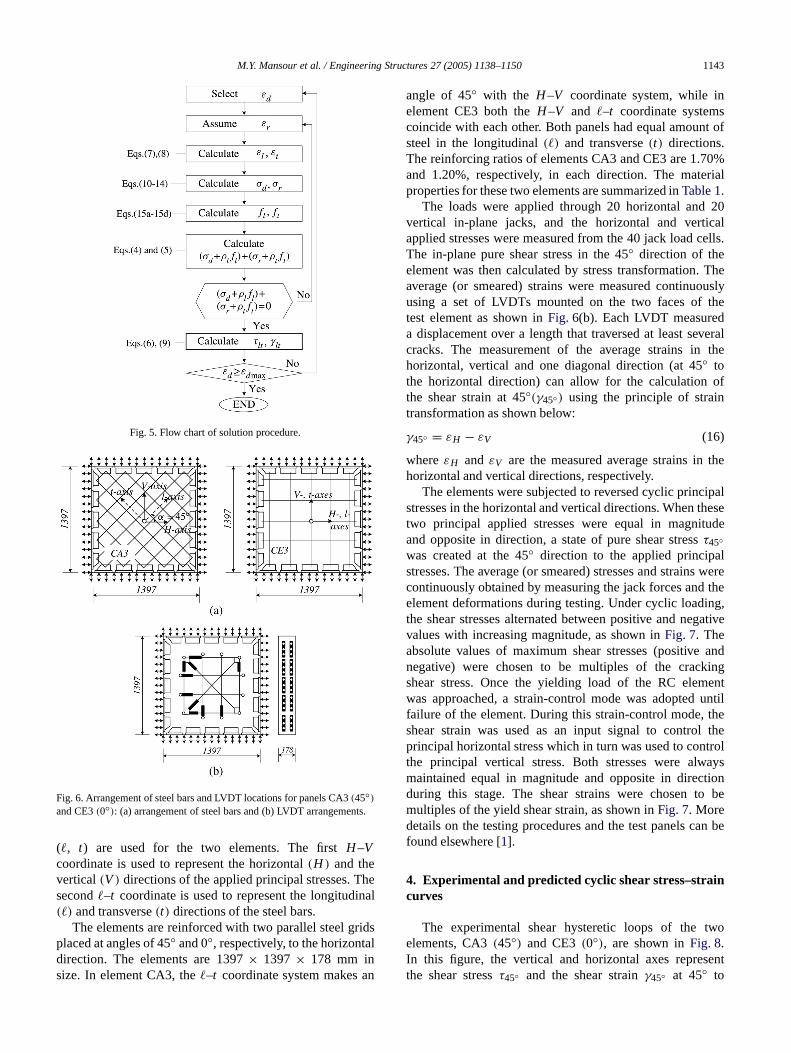
Fig. 9. Predicted axial cyclic stress–strain curves of steel bars of panels CA3(45◦) and CE3(0◦) in the longitudinal direction using the RA-STMededitedth
nvedridurv
th
earehelic
theke
hentsth
he
the
s-ven b
the
ed
shearand,teel
s, astheeent
notver,
while
kedA3nrete
etesivePa,th
th isonalin
llywerey
f theeartsridA3
the principal coordinate of applied stresses. InFig. 8, thehysteretic loops of element CA3 displayed a highly pinchshape that is generally associated with shear dominatbehavior. The envelope curve of this element also exhiba distinct descending branch indicating a severe strengdegradation of the element with increasing shear straimagnitude. In contrast, no pinching effect can be obserin the hysteretic loops of element CE3, with its steel gparallel to the applied principal stresses. The envelope cof element CE3 did not have a descending branch andstrength deterioration was not noticeable.
Fig. 8 also compares the experimental cyclic shstress–strain relationships of CA3 and CE3 to thospredicted using the RA-STM. The predicted results of tRA-STM are in good agreement with the observed cycshear stress–strain curves of CA3(45◦) and CE3 (0◦).The RA-STM can thus be used successfully to predictpresence and absence of the pinching effect and the pre-peabehavior accurately but remains incapable of predicting thdescending envelopes as in the case of element CA3(45◦).
5. Behavior of materials
To study the effect of the steel grid orientation on tbehavior of the materials for the two considered elemethe predicted stress–strain curves of the steel bars inlongitudinal direction and that of concrete in one of tprincipal directions are considered.
5.1. Predicted cyclic stress–strain curves of steel barsembedded in concrete
The cyclic stress–strain curves of the steel bars inlongitudinal direction of elements CA3(45◦) and CE3(0◦) are shown inFig. 9. These cyclic hysteretic loopwere predicted using the solution procedure of the RASTM previously outlined and the material constitutirelationships of steel bars embedded in concrete as giveEqs. (15a) through (15d).
Fig. 9 shows that the cyclic stress–strain curves oflongitudinal steel bars in element CA3(45◦) are alwaystensile and are never compressive, meaning that the appli
ee
,e
y
compression stresses needed to produce a state of purehad to be solely resisted by concrete. On the other hthe hysteretic loops of the stress–strain curves of the sin element CE3(0◦) show that the longitudinal steel barsare subjected to both compression and tension stressethe intensity of cyclic load increases. Therefore, whensteel grid orientation in a shearelement is set parallel to thapplied principal stress directions, as in the case of elemCE3 (0◦), the steel bars have to be designed to resistonly tensile stresses but also compressive stresses. Howefor shear elements with steel grids set parallel to the planeof pure shear, as is the case of element CA3(45◦), thesteelbars have to be designed to resist tensile stresses onlythe concrete will resist the compressive stresses.
5.2. Predicted cyclic stress–strain curves of concrete
The predicted cyclic stress–strain curves of cracconcrete in one of the principal direction for elements Cand CE3 are shown inFig. 10. The figures show a reductioin the maximum attained compressive strengths of concfor elements CA3(45◦) and CE3 (0◦), calculated fromEq. (12), when compared to their corresponding concrcylinder strengths. For example, the maximum compresstrength of the concrete of element CA3 is almost 15 Mwhich is about 33% of its maximum concrete strengcylinder. This reduction in concrete compressive strengattributed mainly to the presence of cracks in the orthogdirection. Fig. 10 also shows that the cyclic stress–stracurves of concrete of element CE3(0◦) were mainly intension, meaning that the cracks in this element did not fuclose since the compressive stresses in the concreterelatively small and insufficient to cause the cracks to fullclose.
6. Presence and absence of the pinching mechanism
To better understand the presence and absence opinching mechanism in the hysteretic loops of the shstress–strain curves, the predicted results of the two elemenconsidered in this paper with two different steel gorientations are analyzed using the RA-STM. Element C

1146 M.Y. Mansour et al. / Engineering Structures 27 (2005) 1138–1150
n
Fig. 10. Predicted axial cyclic stress–strain curves of concrete of panels CA3(45◦) and CE3(0◦) in the longitudinal direction using the RA-STM.
Fig. 11. One cycle of hysteresis for CA3(45◦): (a) shear stress vs. strain curve, (b) stress vs. strain curve of steel in the� or t directions, (c) stress vs. straicurve of concrete in theH direction, and (d) stress vs. strain curve of concrete in theV direction.
ing
to
ng
g
gand
thelC,ts
g.afterthedentiveheare
the
(45◦) is chosen to explain the presence of the pinchmechanism, while element CE3(0◦) is chosen toexplain theabsence of the pinching mechanism.
6.1. Pinching mechanism in element CA3 (45◦)
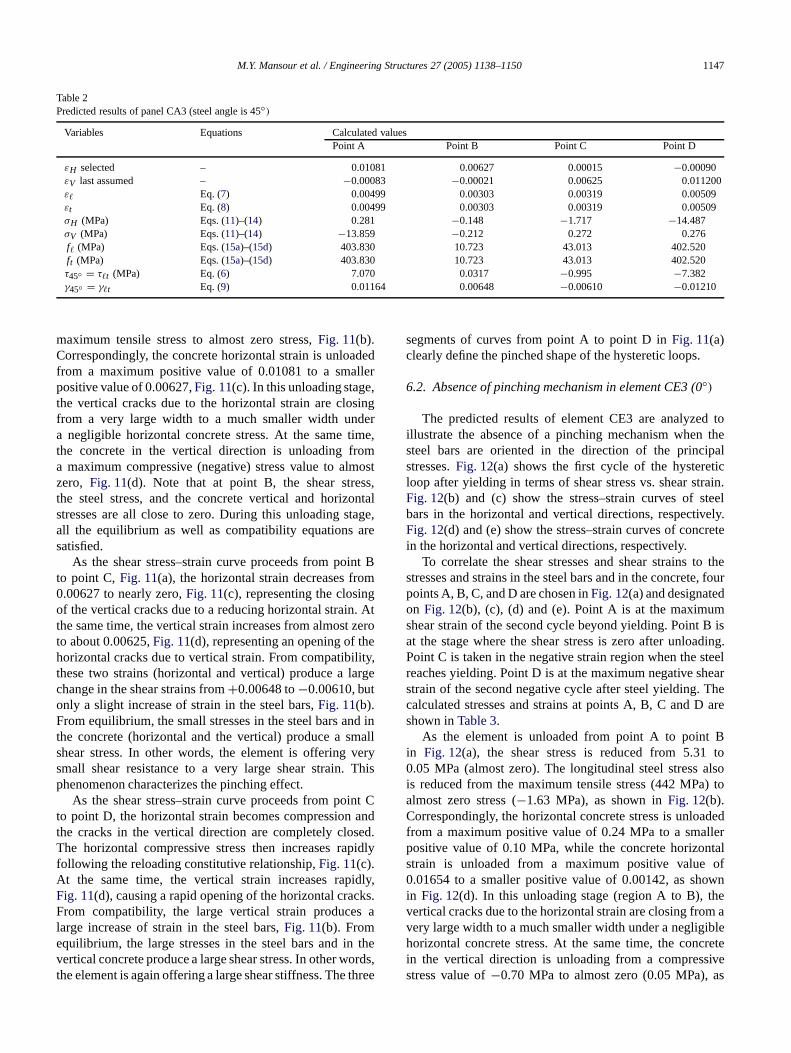
The predicted results of element CA3 are consideredstudy the presence of the pinching mechanisms.Fig. 11(a)shows the first cycle of the hysteretic loop after yieldiin terms of the shear stressτ45◦ vs. the shear strainγ45◦in the 45◦ direction. Fig. 11(b) shows the correspondinstress–strain curves of the steel bars in the� and tdirections, whileFig. 11(c) and (d) show the correspondinstress–strain curves of the concrete in the horizontalvertical directions, respectively.
To correlate the shear stresses and shear strains tostresses and strains in thesteel bars, in the horizontaconcrete and in the vertical concrete, four points A, B,and D are chosen inFig. 11(a) and the corresponding poinare designated inFig. 11(b), (c) and (d). Point A is at themaximum shear strain of the first cycle beyond yieldinPoint B is at the stage where the shear stress is zerounloading. Point C is taken in the negative strain region atend of the low-stress pinching zone just before the sudincrease in stiffness. Point D is at the maximum negashear strain of the first negative cycle beyond yielding. Tcalculated stresses and strains at points A, B, C and Dshown inTable 2.
As the element isunloaded from point A to point Bin Fig. 11(a), the steel stress also is reduced from
M.Y. Mansour et al. / Engineering Structures 27 (2005) 1138–1150 1147
Table 2Predicted results of panel CA3 (steel angle is 45◦)
Variables Equations Calculated valuesPoint A Point B Point C Point D
εH selected – 0.01081 0.00627 0.00015 −0.00090εV last assumed – −0.00083 −0.00021 0.00625 0.011200ε� Eq. (7) 0.00499 0.00303 0.00319 0.00509εt Eq. (8) 0.00499 0.00303 0.00319 0.00509σH (MPa) Eqs. (11)–(14) 0.281 −0.148 −1.717 −14.487σV (MPa) Eqs. (11)–(14) −13.859 −0.212 0.272 0.276f� (MPa) Eqs. (15a)–(15d) 403.830 10.723 43.013 402.520ft (MPa) Eqs. (15a)–(15d) 403.830 10.723 43.013 402.520τ45◦ = τ�t (MPa) Eq. (6) 7.070 0.0317 −0.995 −7.382γ45◦ = γ�t Eq. (9) 0.01164 0.00648 −0.00610 −0.01210
edler,ingere,
ts,nta
,re
t BmgAt
oety,rge
d inall
yis
t Cand.idl
,ks.
therds
hre
totheal
ain.eel.ete
ther
isding.teelreare
tolsoto
d
alfwne
alee
s
maximum tensilestress to almost zero stress,Fig. 11(b).Correspondingly, the concrete horizontal strain is unloadfrom a maximum positive value of 0.01081 to a smalpositive value of 0.00627,Fig. 11(c). In this unloading stagethe vertical cracks due to the horizontal strain are closfrom a very large width to a much smaller width unda negligible horizontal concrete stress. At the same timthe concrete in the vertical direction is unloading froma maximumcompressive (negative)stress value to almoszero, Fig. 11(d). Note that at point B, the shear stresthe steel stress, and the concrete vertical and horizostresses are all close to zero.During this unloading stageall the equilibrium as well as compatibility equations asatisfied.
As the shear stress–strain curve proceeds from pointo point C, Fig. 11(a), the horizontal strain decreases fro0.00627 to nearly zero,Fig. 11(c), representing the closinof the vertical cracks due to a reducing horizontal strain.the same time, the vertical strain increases from almost zerto about 0.00625,Fig. 11(d), representing an opening of thhorizontal cracks due to vertical strain. From compatibilithese two strains (horizontal and vertical) produce a lachange in the shear strains from+0.00648 to−0.00610, butonly a slight increase of strain in the steel bars,Fig. 11(b).From equilibrium, the small stresses in the steel bars anthe concrete (horizontal and the vertical) produce a smshear stress. In other words, the element is offering versmall shear resistance to a very large shear strain. Thphenomenon characterizes the pinching effect.
As the shear stress–strain curve proceeds from pointo point D, the horizontal strain becomes compressionthe cracks in the vertical direction are completely closedThe horizontal compressive stress then increases rapfollowing the reloading constitutive relationship,Fig. 11(c).At the same time, the verticalstrain increases rapidlyFig. 11(d), causing a rapid opening of the horizontal cracFrom compatibility, the large vertical strain produces alarge increase of strain in the steel bars,Fig. 11(b). Fromequilibrium, the large stresses in the steel bars and invertical concrete produce a large shear stress. In other wothe element is again offering a large shear stiffness. The t
l
y
,e
segmentsof curves from point A to point D inFig. 11(a)clearly define the pinched shape of the hysteretic loops.
6.2. Absence of pinching mechanism in element CE3 (0◦)
The predicted results of element CE3 are analyzedillustrate the absence of a pinching mechanism whensteel bars are oriented in the direction of the principstresses.Fig. 12(a) shows the first cycle of the hystereticloop after yielding in terms of shear stress vs. shear strFig. 12(b) and (c) show the stress–strain curves of stbars in the horizontal and vertical directions, respectivelyFig. 12(d) and (e) show the stress–strain curves of concrin the horizontal and verticaldirections, respectively.
To correlate the shear stresses and shear strains tostresses and strains in the steelbars and in the concrete, foupoints A, B, C, and D are chosen inFig. 12(a) and designatedon Fig. 12(b), (c), (d) and (e). Point A is at the maximumshear strain of the second cycle beyond yielding. Point Bat the stage where the shear stress is zero after unloaPoint C is taken in the negative strain region when the sreaches yielding. Point D is atthe maximum negative sheastrain of the second negative cycle after steel yielding. Thcalculated stresses and strains at points A, B, C and Dshown inTable 3.
As the element isunloaded from point A to point Bin Fig. 12(a), the shear stress is reduced from 5.310.05 MPa (almost zero). The longitudinal steel stress ais reducedfrom the maximum tensile stress (442 MPa)almost zero stress (−1.63 MPa), as shown inFig. 12(b).Correspondingly, the horizontal concrete stress is unloadefrom a maximum positive value of 0.24 MPato a smallerpositive value of 0.10 MPa, while the concrete horizontstrain is unloaded from a maximum positive value o0.01654 to a smaller positive value of 0.00142, as shoin Fig. 12(d). In this unloading stage (region A to B), thvertical cracks due to the horizontal strain are closing fromvery large width to a much smaller width under a negligibhorizontal concrete stress. Atthe same time, the concretin the vertical direction isunloading from a compressivestress value of−0.70 MPa to almost zero (0.05 MPa), a

1148 M.Y. Mansour et al. / Engineering Structures 27 (2005) 1138–1150
of
Fig. 12. One cycle of hysteresis for CE3(0◦): (a) shear stress vs. strain curve, (b) stress vs. strain curve of steel in the� direction, (c) stress vs. strain curvesteel in thet direction, (d) stress vs. strain curve of concrete in theH direction, and (e) stress vs. strain curve of concrete in theV direction.s therooines
iate
to
sewntalery
(o
ng
le ae at
a
g
A3
innt
ng
he
shown inFig. 12(e). Note that, at point B, the shear stress,the longitudinal and transverse steel stresses, as well avertical and horizontal concrete stresses, are all close to z
As the shear stress–strain curve proceeds from pB to point C, Fig. 12(a), the horizontal strain decreasfrom 0.00142 to 0.000675 (nearly zero),Fig. 12(d). In thisstage the vertical cracks are still closing and are assocwith very low concrete horizontal stresses (Fig. 12(d)).However, this change in horizontal strain from 0.001420.000675 causes high compressive stresses (−376.8 MPa) tobuild up in the longitudinal (or horizontal) reinforcing bar(Fig. 11(b)). At the same time, the vertical strains increasfrom 0.00555 (almost zero) to about 0.01182, as shoin Fig. 12(e), representing an opening of the horizoncracks. This opening of the horizontal cracks occurs at vlow vertical concrete stresses (Fig. 12(e)) but causes hightensile stresses (392.9 MPa) to build up in the transversevertical) reinforcing bars (Fig. 12(c)). From compatibility,these strains (horizontal and vertical) produce a large chain the shear strains from+0.00867 to−0.00507, and from
e.
t
d
r
e
equilibrium, the large steelstresses in the longitudina(horizontal) and transverse (vertical) steel bars produclarge jump in the shear stress from almost a zero valupoint B to a large negative value of−4.67 MPa at pointC (Fig. 12(a)). In other words, the element is offeringhigh shear stiffness from point B to point C (Fig. 12(a)).This phenomenon characterizesthe absence of the pinchinmechanism.
6.3. Physical visualization of pinching mechanism
The presence of the pinching mechanism in element C(45◦), as shownby region BC inFig. 11, can be explainedintuitively by examining a cracked element with 45◦ steelbars, as shown inFig. 13(a). A state of pure shear stressthe 45◦ direction of this element in region BC is equivaleto applying a horizontal compressive stressσH and a verticaltensile stressσV of equal magnitude. In the reverse loadistagefrom point B to point C (Fig. 11(a)), which definesthe region wherepinching occurs, both the vertical and t

M.Y. Mansour et al. / Engineering Structures 27 (2005) 1138–1150 1149
0
vertical
Table 3Predicted results of panel CE3 (steel angle is 0◦)
Variables Equations Calculated valuesPoint A Point B Point C Point D
εH selected – 0.01654 0.01422 0.00675 0.00497εV last assumed – 0.00350 0.00555 0.01182 0.0163ε� Eq. (7) 0.01654 0.01422 0.00675 0.00497εt Eq. (8) 0.00350 0.00555 0.01182 0.01630σH (MPa) Eqs. (11)–(14) 0.237 0.103 −0.328 −0.539σV (MPa) Eqs. (11)–(14) −0.698 0.046 0.214 0.238f� (MPa) Eqs. (15a)–(15d) 441.990 −1.632 −376.800 −408.440ft (MPa) Eqs. (15a)–(15d) −407.580 −5.538 392.900 440.860τ�t (Mpa) Eq. (6) 0.00 0.00 0.00 0.00γ�t Eq. (9) 0.00 0.00 0.00 0.00τ45◦ (MPa) a 5.310 0.051 −4.658 −5.230γ45◦ a 0.01304 0.00867 −0.00507 −0.01133
a Transformation equations.
Fig. 13. Cracked RCelement with 45◦ steel grid orientation: (a) RC panel, (b) compressive stress in the horizontal direction, and (c) tensile stress in thedirection.
t ye
ct o
hestheoers
hethe
ops
ed
g
lntalss
cal
thesteellly towillloop
els)ffect
edalffecttility
ictwith
horizontal cracks are open. The concrete struts have nobeen formed, and the applied stressesσH andσV must beresisted by the two 45◦ steel bars since the carrying capacityof cracked concrete can be neglected. Separate the effeσH andσV , as shown inFig. 13(b) and (c), respectively. Thehorizontal stressσH will induce a compressive stress in ttwo 45◦ steel bars,Fig. 13(b), whilethe vertical tensile stresσV will induce a tensile stress of equal magnitude insame two 45◦ bars,Fig. 13(c). These two stresses in the tw45◦ steel bars will cancel out. As a result, the element offno shear resistance to the applied shear stressτ45◦ in the 45◦direction, whilethe shear strainγ45◦ increases rapidly due tothe opening of the horizontal cracks and the closing of tvertical cracks. The resulting near zero shear stiffness inBC regions creates the pinching effect in the hysteretic loof the shear stress vs. shear strain curves.
6.4. Physical visualization of absence of pinching mecha-nism
The absence of the pinching mechanism in element CE3(90◦) can be intuitively visualized by considering a crackelement with 90◦ steel bars, as shown inFig. 14(a). A stateof pure shear stress in the 45◦ direction can be achievedby applying a horizontal compressive stressσH and verticaltensile stressσV of equal magnitude. In the reverse loadin
t
f
stagefrom point B to point C (Fig. 12(a)), both the verticaand horizontal cracks are open. Consequently, the horizocompressive stressσH is resisted by the compressive strein the horizontalsteel bar only (Fig. 14(b)), while the verticaltensile stressσV is resisted by a tensile stress in the vertibar only (Fig. 14(c)). The shear stressτ45◦ in the 45◦direction is then contributed by the compressive stress inhorizontal steel bars and the tensile stress in the verticalbars. As a result, the shear stress increases proportionathe shear strain, and the shear stiffness in the BC regionbe large, thus creating a smooth and robust hystereticwithout the pinched shape.
7. Conclusions
In this paper, two RC membrane elements (pansubjected to cyclic shear were considered to assess the eof the steel grid orientation on the “pinching effect” for thehysteretic loops of the shear stress–strain curves.
Experimentally, the test results of the two panels showthat orienting the steel grid in the direction of the principapplied stresses eliminates the undesirable pinching eand increases the energy dissipation capacity and ducof RC elements subjected to cyclic shear.
Theoretically, the RA-STM theory was shown to predthe cyclic shear responses of the two considered panels

1150 M.Y. Mansour et al. / Engineering Structures 27 (2005) 1138–1150
vertical
Fig. 14. Cracked RCelement with 0◦ steel grid orientation: (a) RC panel, (b) compressive stress in the horizontal direction, and (c) tensile stress in thedirection.clicblethetrain
s ofhesheand
it isin
heess
ll as
hets,d ifnnswillake
sl
ACI
CE
ear
clicy
fEE.
elal
eteNo.
.
ofal of
ial
nd;
rch
in):
byttee
ntsral
good accuracy once combined with accurate material cyconstitutive relationships. The RA-STM was found capaof predicting the pinched shape in the hysteretic loops ofshear stress–strain curves, as well as the stresses and sat yield, and the unloading and reloading shear stiffnesthe two panels. The RA-STM was also used to explain tpresence or the absence of a pinched shape in thehysteretic loops by showing the variation of the steel aconcrete stresses during one loading cycle. However,worth mentioning that there is still an area of weaknessthe RA-STM: the model cannot yet be used to predict tdescending envelope curves. To take care of this weaknthe model has to take into account Poisson’s effect as wethe deterioration of concrete under cyclic loading [16].
Finally, since the pinching effect is influenced by torientation of the steel grid in RC shear-dominant elementhis undesirable pinching mechanism can be eliminatethe steel reinforcement is placed parallel to the directioof the applied principal stresses. This will provide a meato enhance the ductility of shear elements, so theyhave higher energy dissipation capacity to resist earthquloading.
References
[1] Mansour MY, Hsu TTC. Behavior of reinforced concrete elementunder cyclic shear. I: Experiments.ASCE Journal of StructuraEngineering 2005;131(1):44–53.
[2] Hsu TTC. Softened truss model theory for shear and torsion.Structural Journal 1988;85(6):624–35.
[3] Paulay T. Simulated seismic loading of spandrel beams. ASJournal of Structural Division 1971;97(ST9):2407–19.
s
r
,
[4] Paulay T, Binney JR. Diagonally reinforced coupling beams of shwalls. ACI Publication SP-42 1974;1:579–98.
[5] Kinugasa H, Nomura S. Failure mechanism under reversed cyloading after flexural yielding. JCI Concrete Research and Technolog1994;5(2):21–32 [In Japanese].
[6] Fenwick RC, Megget LM, Wuu P. Load deflection characteristics oplastic hinges in ductile concrete beams. In: Proceedings 11th WC1996.
[7] Stevens NJ, Uzumeri SM, Collins MP, Will GT. Constitutive modfor reinforced concretefinite element analysis. ACI Structural Journ1994;88(1):49–59.
[8] Sttipunt C, Wood SL. Finite element analysis of reinforced concrshear walls. Civil Engineering Studies, Structural Research Series584. Urbana: University of Illinois; 1993. p. 384.
[9] Xu C. Analytical model for reinforced concrete under cyclic loadingPh.D. dissertation. Urbana (IL):Department of Civil Engineering,University of Illinois at Urbana-Champaign; 1991.
[10] Mansour M, Lee J-Y, Hsu TTC. Cyclic stress–strain curvesconcrete and steel bars in membrane elements. ASCE JournStructural Engineering 2001;127(12):1402–11.
[11] Belarbi A, Hsu TTC. Constitutive laws of softened concrete in biaxtension-compression. ACI Structural Journal 1995;92(5):562–73.
[12] Belarbi A, Hsu TTC. Constitutive laws of concrete in tension areinforcing bars stiffened by concrete. ACI Structural Journal 199491(4):465–74.
[13] Aktan AE, Karlson BI, Sozen MA. Stress–strain relationship ofreinforcing bars subjected to large strain reversals. Structural ReseaSeries, No. 397. Urbana (IL): University of Illinois; 1973.
[14] Kent DC, Park R. Cyclic load behavior of reinforcing steel. Stra(Journal of the British Society for Strain Measurements) 1973;9(398–103.
[15] Ramberg W, Osgood WR. Description of stress–strain curvesthree parameter. Technical note 902. National Advisory Commifor Aeronautics; 1943.
[16] Mansour MY, Hsu TTC. Behavior of reinforced concrete elemeunder cyclic shear. II: Theoretical model. ASCE Journal of StructuEngineering 2005;131(1):54–65.