Embed Size (px)
Citation preview

An Overview of the U.S. Economy and Housing Market,
Our View of the Stock Market, Why We’re Short Homebuilders, Our Top
Holdings, and Our In-Depth Analysis of Our Three Largest Positions:
Berkshire Hathaway, Iridium and Howard Hughes Corp.
Whitney Tilson
T2 Partners LLC
Nexus 2012 Conference
April 27, 2012

T2 Partners Management L.P.
Manages Hedge Funds and Mutual Funds
and is a Registered Investment Advisor
The General Motors Building
767 Fifth Avenue, 18th Floor
New York, NY 10153
(212) 386-7160
[email protected] www.T2PartnersLLC.com
-3-
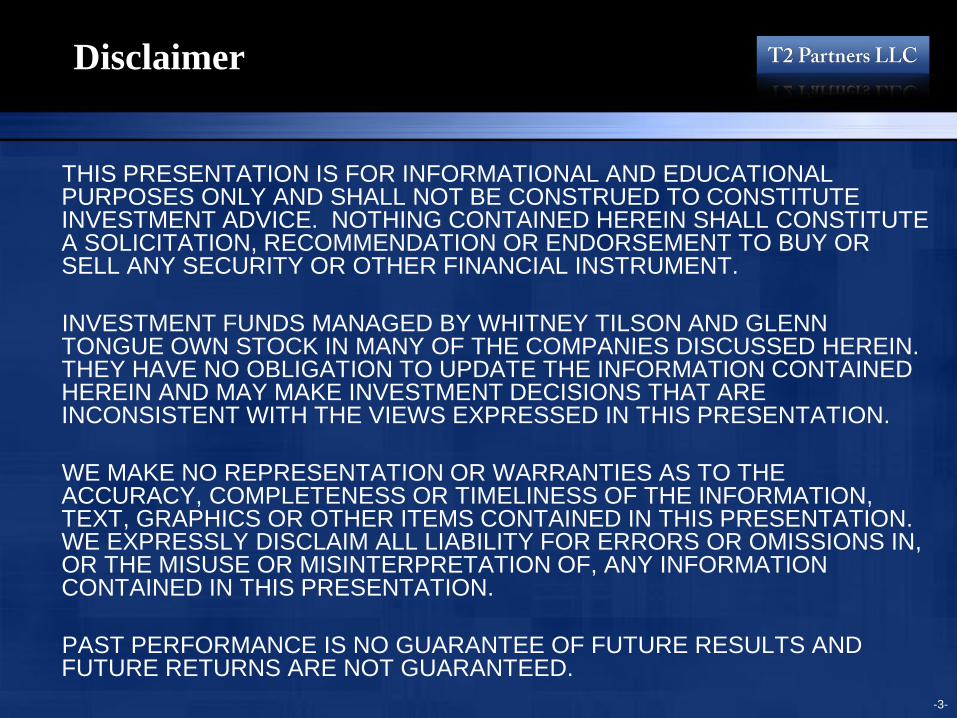
Disclaimer
THIS PRESENTATION IS FOR INFORMATIONAL AND EDUCATIONAL PURPOSES ONLY AND SHALL NOT BE CONSTRUED TO CONSTITUTE INVESTMENT ADVICE. NOTHING CONTAINED HEREIN SHALL CONSTITUTE A SOLICITATION, RECOMMENDATION OR ENDORSEMENT TO BUY OR SELL ANY SECURITY OR OTHER FINANCIAL INSTRUMENT.
INVESTMENT FUNDS MANAGED BY WHITNEY TILSON AND GLENN TONGUE OWN STOCK IN MANY OF THE COMPANIES DISCUSSED HEREIN. THEY HAVE NO OBLIGATION TO UPDATE THE INFORMATION CONTAINED HEREIN AND MAY MAKE INVESTMENT DECISIONS THAT ARE INCONSISTENT WITH THE VIEWS EXPRESSED IN THIS PRESENTATION.
WE MAKE NO REPRESENTATION OR WARRANTIES AS TO THE ACCURACY, COMPLETENESS OR TIMELINESS OF THE INFORMATION, TEXT, GRAPHICS OR OTHER ITEMS CONTAINED IN THIS PRESENTATION. WE EXPRESSLY DISCLAIM ALL LIABILITY FOR ERRORS OR OMISSIONS IN, OR THE MISUSE OR MISINTERPRETATION OF, ANY INFORMATION CONTAINED IN THIS PRESENTATION.
PAST PERFORMANCE IS NO GUARANTEE OF FUTURE RESULTS AND FUTURE RETURNS ARE NOT GUARANTEED.

U.S. Economic Overview
-10
-8
-6
-4
-2
0
2
4
6
Q1 '07 Q2 '07 Q3 '07 Q4 '07 Q1 '08 Q2 '08 Q3 '08 Q4 '08 Q1 '09 Q2 '09 Q3 '09 Q4 '09 Q1 '10 Q2 '10 Q3 '10 Q4 '10 Q1 '11 Q2 '11 Q3 '11 Q4 '11 Q1 '12
Latest estimate
Previous estimate
-5-
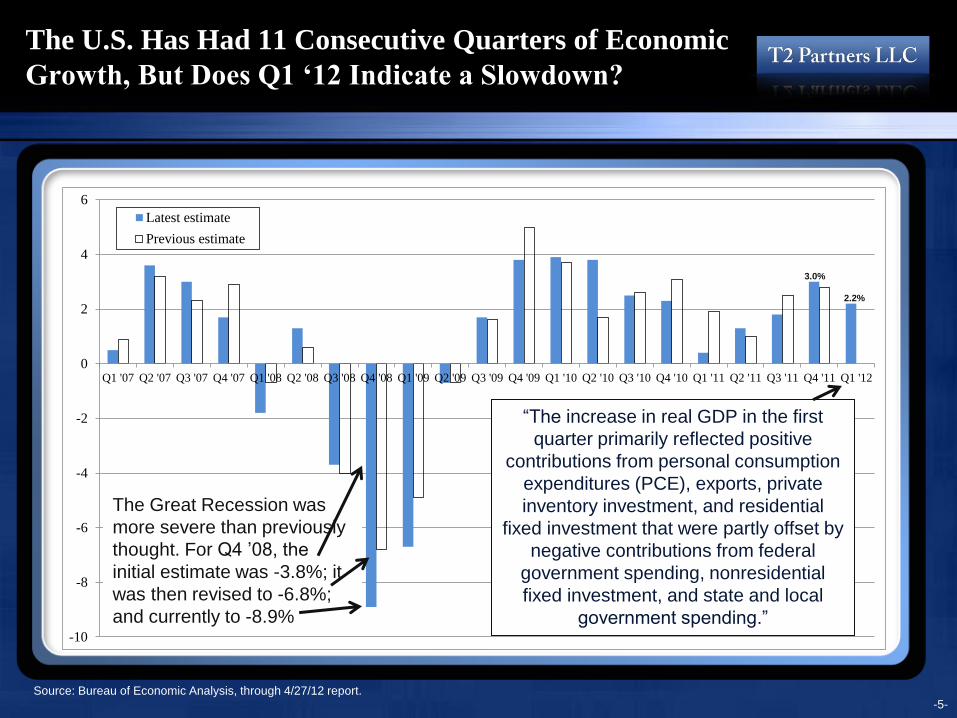
The U.S. Has Had 11 Consecutive Quarters of Economic
Growth, But Does Q1 ‘12 Indicate a Slowdown?
Source: Bureau of Economic Analysis, through 4/27/12 report.
The Great Recession was
more severe than previously
thought. For Q4 ’08, the
initial estimate was -3.8%; it
was then revised to -6.8%;
and currently to -8.9%
3.0%
2.2%
“The increase in real GDP in the first
quarter primarily reflected positive
contributions from personal consumption
expenditures (PCE), exports, private
inventory investment, and residential
fixed investment that were partly offset by
negative contributions from federal
government spending, nonresidential
fixed investment, and state and local
government spending.”
-6-
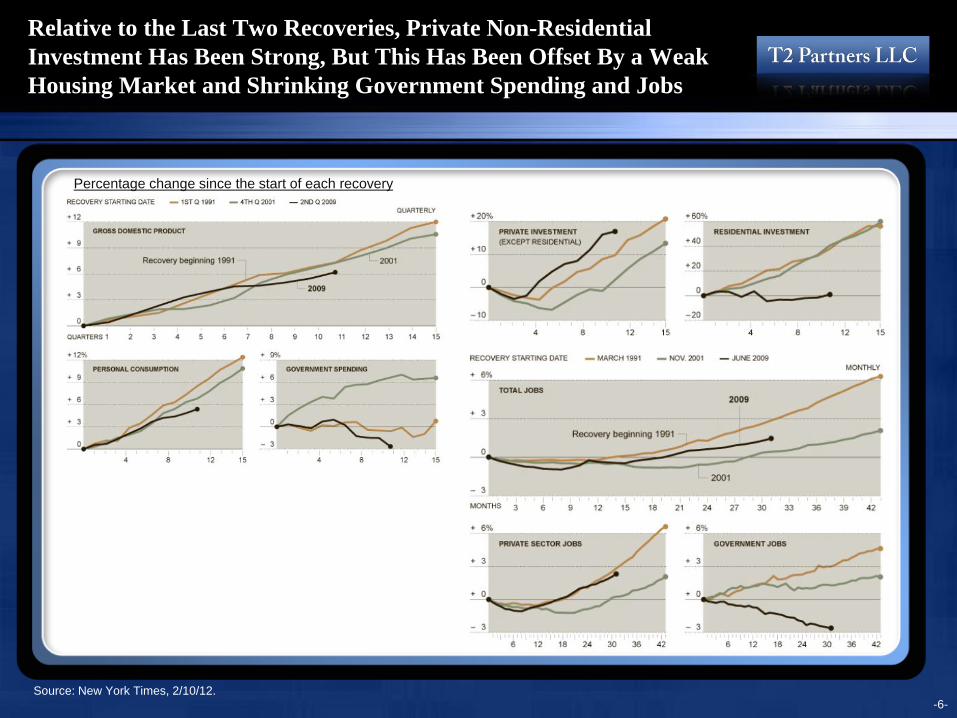
Relative to the Last Two Recoveries, Private Non-Residential
Investment Has Been Strong, But This Has Been Offset By a Weak
Housing Market and Shrinking Government Spending and Jobs
Source: New York Times, 2/10/12.
Percentage change since the start of each recovery
-7-
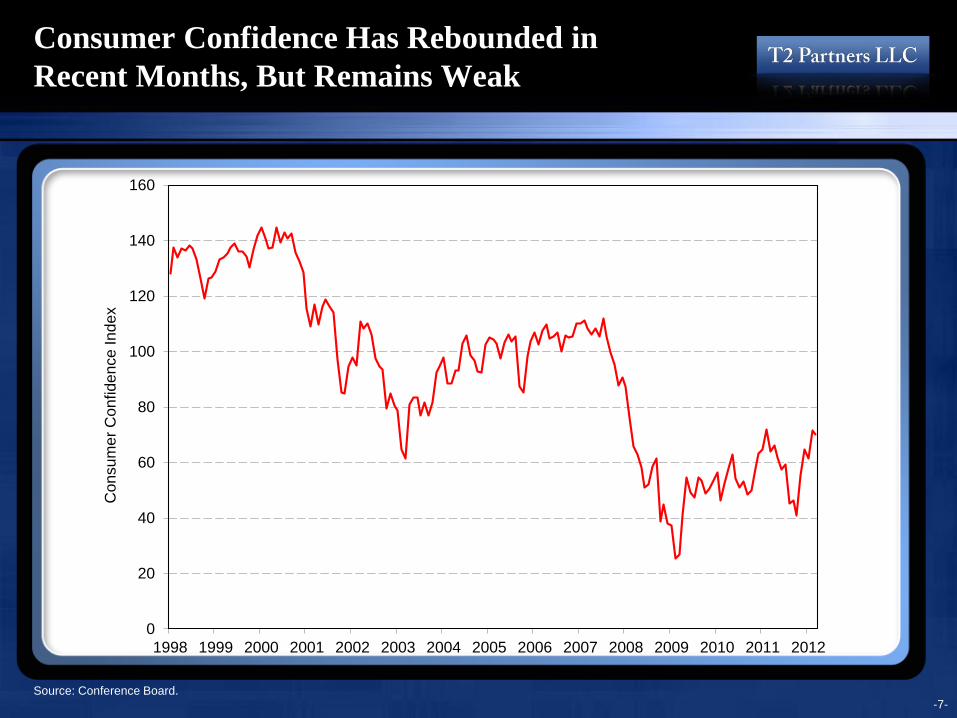
Consumer Confidence Has Rebounded in
Recent Months, But Remains Weak
Source: Conference Board.
0
20
40
60
80
100
120
140
160
1998 1999 2000 2001 2002 2003 2004 2005 2006 2007 2008 2009 2010 2011 2012
Co
nsu
me
r C
on
fid
en
ce
In
de
x
-8-
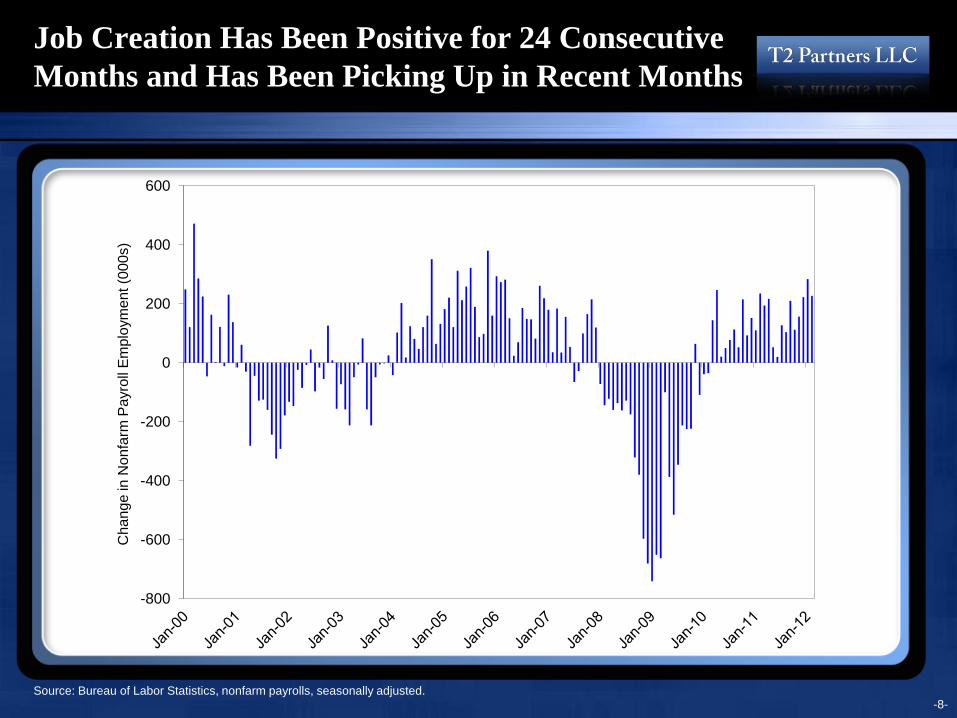
Job Creation Has Been Positive for 24 Consecutive
Months and Has Been Picking Up in Recent Months
Source: Bureau of Labor Statistics, nonfarm payrolls, seasonally adjusted.
-800
-600
-400
-200
0
200
400
600
Ch
an
ge
in
No
nfa
rm P
ayro
ll E
mp
loym
en
t (0
00
s)
-9-
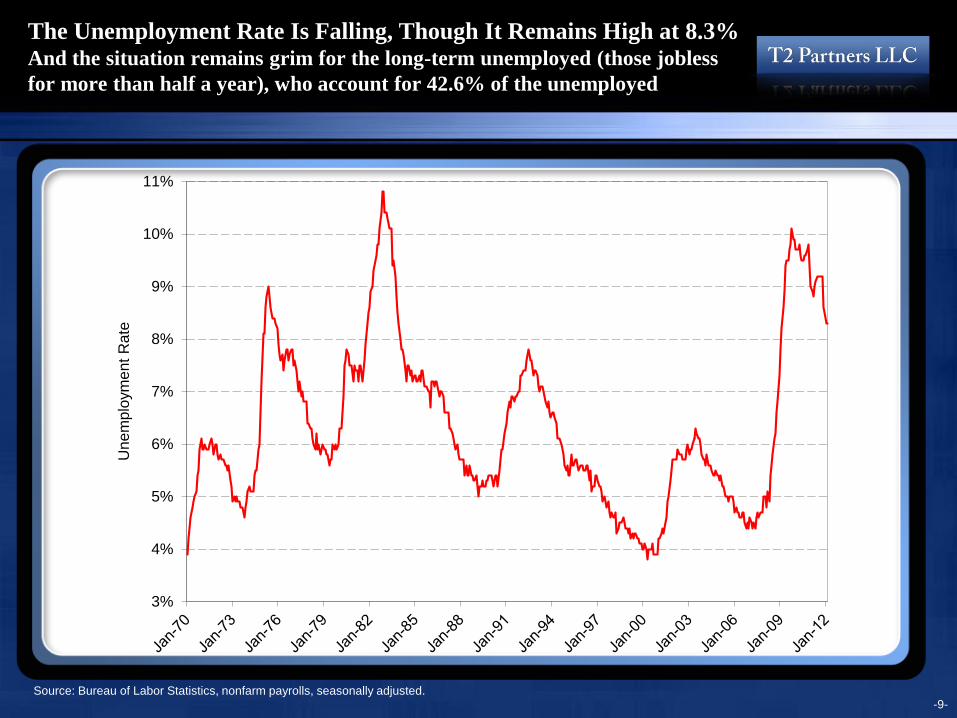
The Unemployment Rate Is Falling, Though It Remains High at 8.3% And the situation remains grim for the long-term unemployed (those jobless
for more than half a year), who account for 42.6% of the unemployed
Source: Bureau of Labor Statistics, nonfarm payrolls, seasonally adjusted.
3%
4%
5%
6%
7%
8%
9%
10%
11%
Unem
plo
ym
ent
Rate
-10-
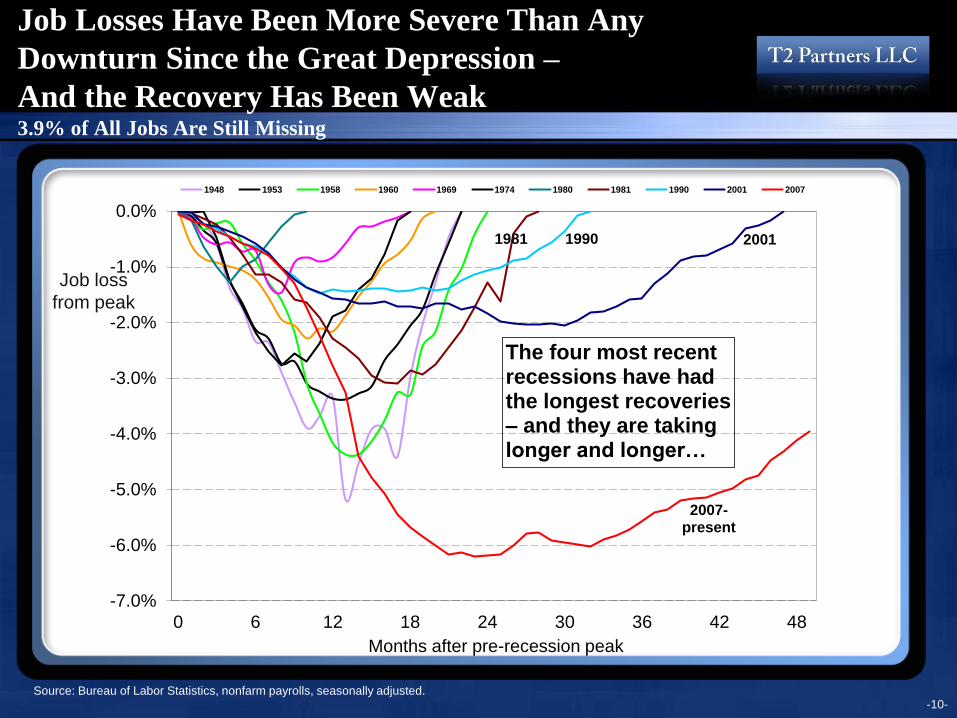
Job Losses Have Been More Severe Than Any
Downturn Since the Great Depression –
And the Recovery Has Been Weak 3.9% of All Jobs Are Still Missing
Source: Bureau of Labor Statistics, nonfarm payrolls, seasonally adjusted.
Job loss
from peak
-7.0%
-6.0%
-5.0%
-4.0%
-3.0%
-2.0%
-1.0%
0.0%
0 6 12 18 24 30 36 42 48
Months after pre-recession peak
1948 1953 1958 1960 1969 1974 1980 1981 1990 2001 2007
2007-present
200119901981
The four most recent recessions have had the longest recoveries – and they are taking longer and longer…
-11-
Summary
We are cautiously optimistic that a modest economic recovery is
underway in the U.S., but with the S&P 500 up roughly 10%, the
markets have already had a good year so we don’t see much
upside unless the economy really takes off, which we think is
unlikely. And there are a number of factors that could derail the
recovery (in descending order of concern):
1. The U.S. housing market turns down
2. The European banking system enters another crisis, most
likely due to a severe recession and/or a sovereign debt crisis
in Spain or Italy
3. A sharp slowdown or recession in China, most likely due to
the bursting of its real estate bubble
4. A sovereign debt crisis in Japan
The Most Likely Scenario Is That
the Economy Muddles Through
Doug Kass of Seabreeze Partners lays out four possible scenarios and their respective likelihoods, which generally mirrors our view:
1. Scenario No. 1 -- Muddle Through (probability: 65%): The U.S. muddles through, with 1.5%-2.25% Real GDP growth and the European
economies suffer a modest (but contained) business downturn. China’s and India’s economies grow in line relative to consensus
forecasts. There is no further quantitative easing. Obama regains the Presidency and the Republicans control Congress. The fiscal cliff
is reduced by half (to $275 billion). 2013 S&P 500 profits trend towards a range of $107-$109 per share as some modest margin
slippage occurs (coincident with escalating inflationary pressures). Stocks, valued at 14.25x under this outcome, have 10% upside over
the next nine months. S&P target is 1540.
2. Scenario No. 2 -- Below Consensus Economic Growth (probability: 20%): The U.S. experiences a disappointing sub-1.5% Real GDP
growth rate, Europe experiences a medium-scale recession and China’s economic growth disappoints modestly relative to expectations.
QE3 is initiated and has a modestly favorable impact on aggregate growth. OBama regains the Presidency and the Republicans control
Congress. The fiscal cliff is reduced by less than half (to $275-$350 billion). The S&P 500 profit forecasts for 2013 are reduced to levels
slightly below 2012’s results as corporations' pricing power is limited, profit margins are pressured and S&P profit forecasts are cut back
to below consensus of $98 to $100 per share. Stocks, valued at 13.0x under this outcome, have 8% downside risk over the next nine
months. S&P target is 1290.
3. Scenario No. 3 -- Economic Reacceleration Above Consensus (probability: 15%): The pace of U.S. economic recovery reaccelerates to
above-consensus forecasts (3%+ Real GDP growth) based on pro-growth fiscal policies geared toward generating job growth; corporate
profit margins being preserved (with low inflation and contained wage growth); interest rates remaining low; and durable spending
(housing and autos) recovering sharply as pent up demand is unleashed. The $550 billion fiscal cliff is whittled down to only about $150
billion (subtracting less than 0.5% from 2013 Real GDP) as an Obama Presidential win and a Republican Congress lead to compromise
on taxes, entitlements and deficits. Europe stabilizes (and experiences a shallow recession), and China has a soft landing (with GDP
growth tracking in excess of eight percent). There is no QE3. S&P 500 profit estimates for 2013 are raised to $110-$113 per share.
Stocks, valued at 15.5x under this outcome, have 23% upside over the next nine months. S&P target is 1725.
4. Scenario No. 4 -- Recession (probability: 5%): The U.S. enters a recession precipitated by a loss of business and consumer confidence,
producing a fall in manufacturing output and personal consumption expenditures. President Obama and the Democratic party regain the
Presidency and the Senate but the Republicans maintain control of the House of Representative. The schism between the two parties
persists. Partisanship leads to rancor during Summer debt ceiling deliberations (instituted because of slowing nominal GDP) - similar to
that of August, 2011. Confidence deteriorates further and the housing market seizes up as bank lending becomes more restrictive when
the fiscal cliff is not remedied/addressed (the hit to GDP is -1.5% to -2.0%). QE3 is instituted but fails to contain the economic weakness.
A series of European bank failures and EU sovereign debt defaults contribute to a deepening European recession and a hard landing in
China and India. S&P 500 earnings estimates for 2013 are materially reduced to $75 to $80 per share. Stocks, valued at 11.5x under
this outcome, have 36% downside risk over the next nine months. S&P target is 890.
-12-

Our View of the Stock Market
-14-
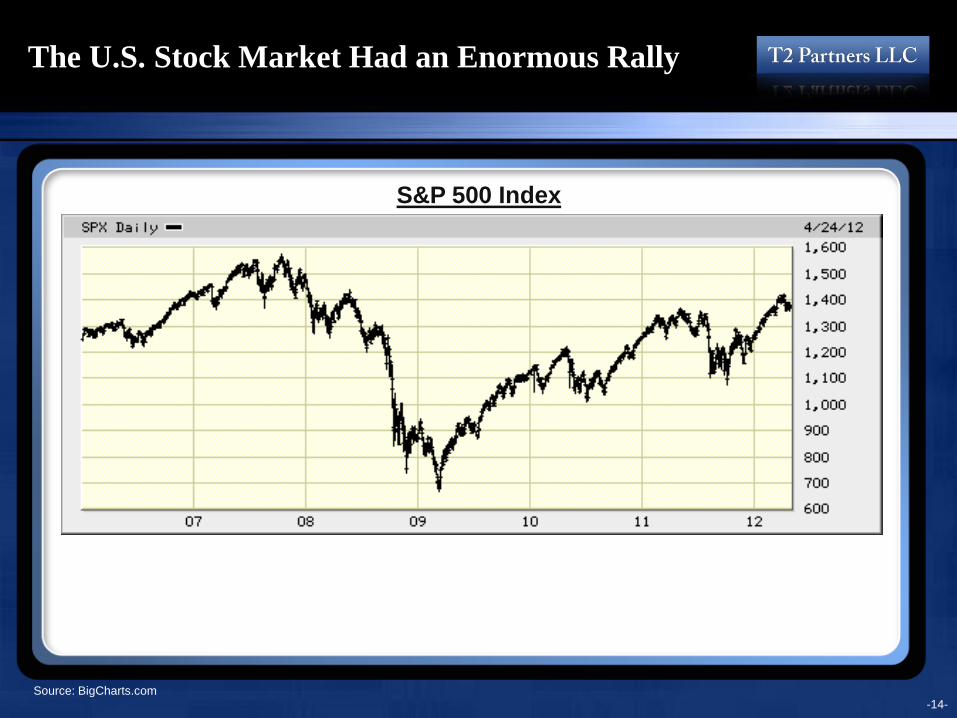
The U.S. Stock Market Had an Enormous Rally
Source: BigCharts.com
S&P 500 Index
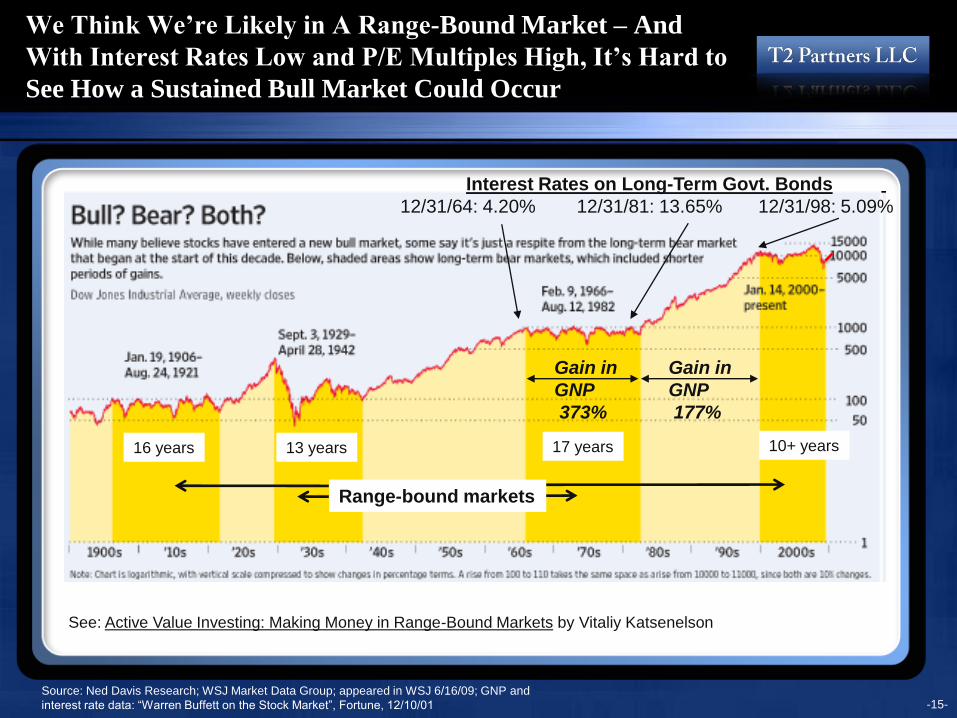
We Think We’re Likely in A Range-Bound Market – And
With Interest Rates Low and P/E Multiples High, It’s Hard to
See How a Sustained Bull Market Could Occur
Source: Ned Davis Research; WSJ Market Data Group; appeared in WSJ 6/16/09; GNP and
interest rate data: “Warren Buffett on the Stock Market”, Fortune, 12/10/01
Gain in
GNP
373%
Gain in
GNP
177%
Interest Rates on Long-Term Govt. Bonds
12/31/64: 4.20% 12/31/81: 13.65% 12/31/98: 5.09%
Range-bound markets
See: Active Value Investing: Making Money in Range-Bound Markets by Vitaliy Katsenelson
16 years 13 years 17 years 10+ years
-15-

0
2
4
6
8
10
12
14
16
18
20
0
5
10
15
20
25
30
35
40
45
50
1860 1880 1900 1920 1940 1960 1980 2000 2020
Lo
ng
-Ter
m I
nte
rest
Rat
es
Pri
ce-E
arn
ings
Rat
io (
CA
PE
)
19011966
2000
Price-Earnings Ratio
Long-Term Interest Rates
1981
1921
1929
Based on Inflation-Adjusted 10-Year Trailing Earnings, the S&P 500 at 22.2x Is Trading at a 14% Premium to Its 50-Year Average of 19.4x
Source: Stock Market Data Used in "Irrational Exuberance" Princeton University Press, 2000, 2005, updated, Robert J. Shiller.
Current P/E: 22.2x P/E average since 1881: 16.4x
-16-
P/E average since 1960: 19.4x
-17-
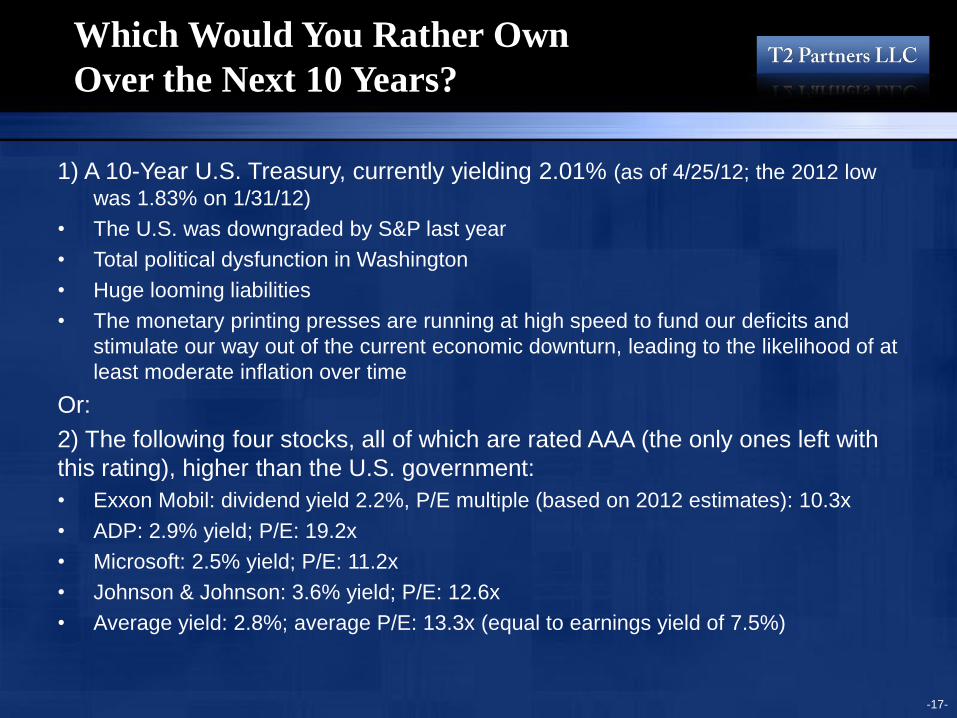
Which Would You Rather Own
Over the Next 10 Years?
1) A 10-Year U.S. Treasury, currently yielding 2.01% (as of 4/25/12; the 2012 low
was 1.83% on 1/31/12)
• The U.S. was downgraded by S&P last year
• Total political dysfunction in Washington
• Huge looming liabilities
• The monetary printing presses are running at high speed to fund our deficits and
stimulate our way out of the current economic downturn, leading to the likelihood of at
least moderate inflation over time
Or:
2) The following four stocks, all of which are rated AAA (the only ones left with
this rating), higher than the U.S. government:
• Exxon Mobil: dividend yield 2.2%, P/E multiple (based on 2012 estimates): 10.3x
• ADP: 2.9% yield; P/E: 19.2x
• Microsoft: 2.5% yield; P/E: 11.2x
• Johnson & Johnson: 3.6% yield; P/E: 12.6x
• Average yield: 2.8%; average P/E: 13.3x (equal to earnings yield of 7.5%)
-18-
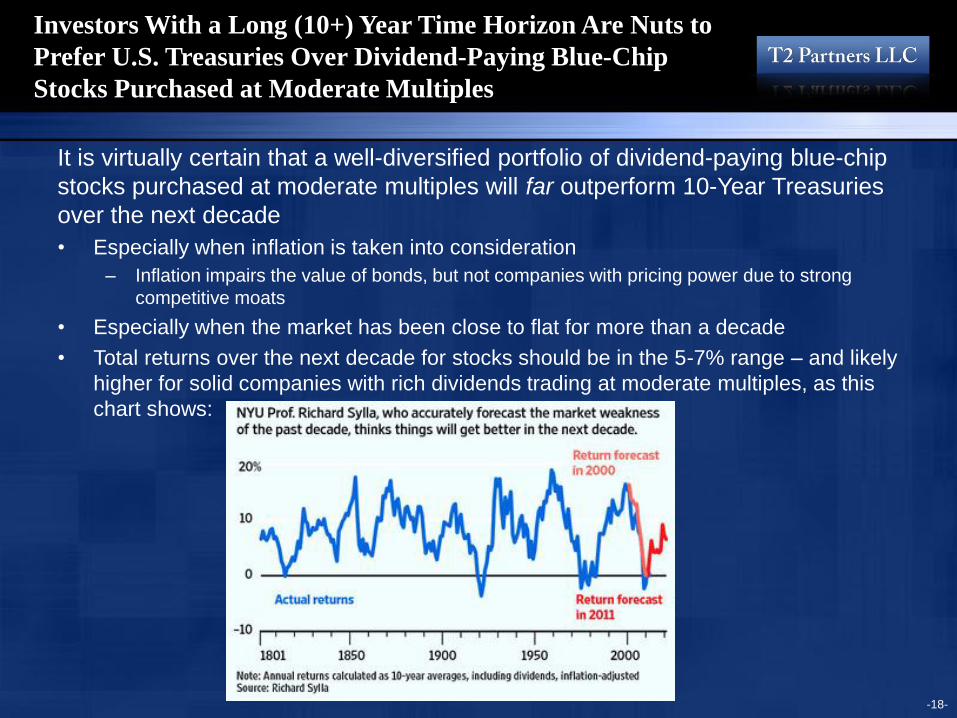
Investors With a Long (10+) Year Time Horizon Are Nuts to
Prefer U.S. Treasuries Over Dividend-Paying Blue-Chip
Stocks Purchased at Moderate Multiples
It is virtually certain that a well-diversified portfolio of dividend-paying blue-chip
stocks purchased at moderate multiples will far outperform 10-Year Treasuries
over the next decade
• Especially when inflation is taken into consideration
– Inflation impairs the value of bonds, but not companies with pricing power due to strong
competitive moats
• Especially when the market has been close to flat for more than a decade
• Total returns over the next decade for stocks should be in the 5-7% range – and likely
higher for solid companies with rich dividends trading at moderate multiples, as this
chart shows:

Thoughts on the Housing Market
More Mortgage Meltdown
Was Published in May, 2009
-20-
-21-
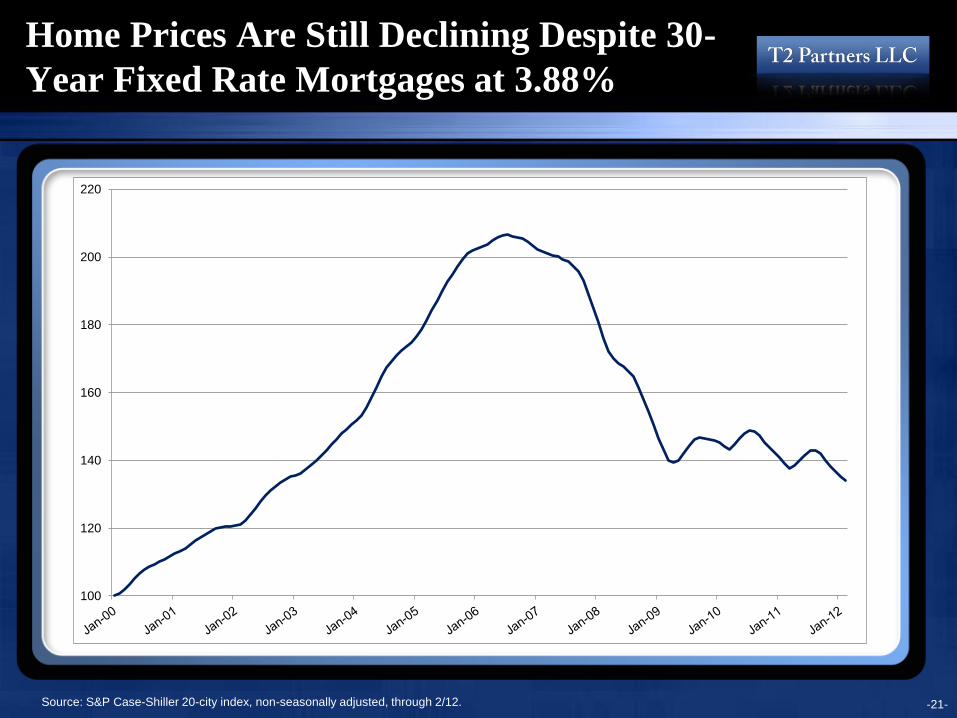
Home Prices Are Still Declining Despite 30-
Year Fixed Rate Mortgages at 3.88%
Source: S&P Case-Shiller 20-city index, non-seasonally adjusted, through 2/12.
100
120
140
160
180
200
220
-22-
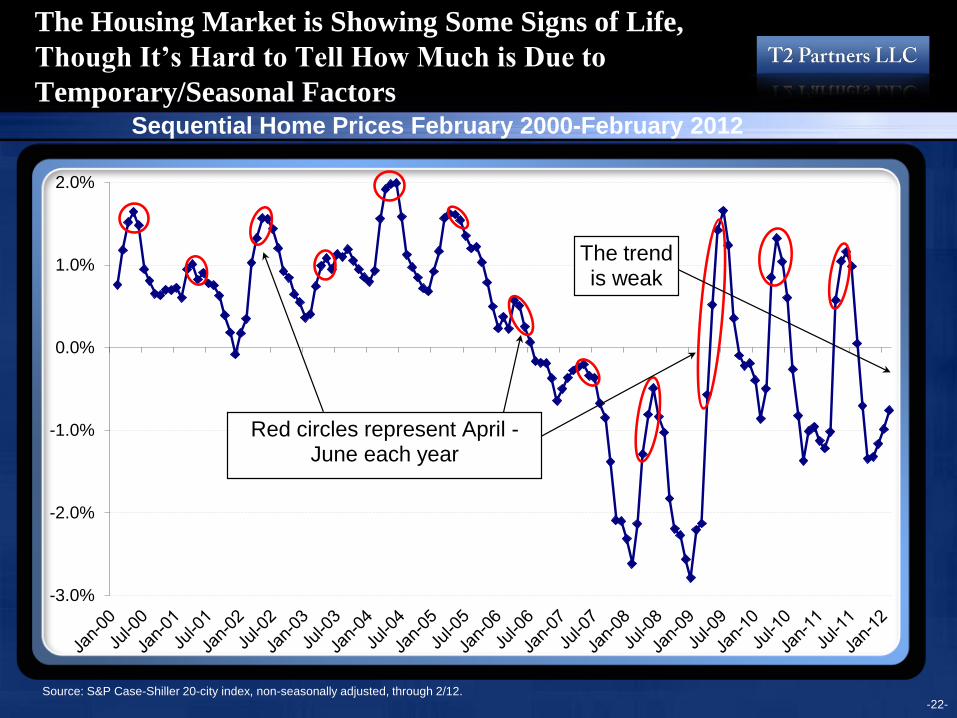
The Housing Market is Showing Some Signs of Life,
Though It’s Hard to Tell How Much is Due to
Temporary/Seasonal Factors
Source: S&P Case-Shiller 20-city index, non-seasonally adjusted, through 2/12.
Sequential Home Prices February 2000-February 2012
-3.0%
-2.0%
-1.0%
0.0%
1.0%
2.0%
Red circles represent April -June each year
The trendis weak
-23-
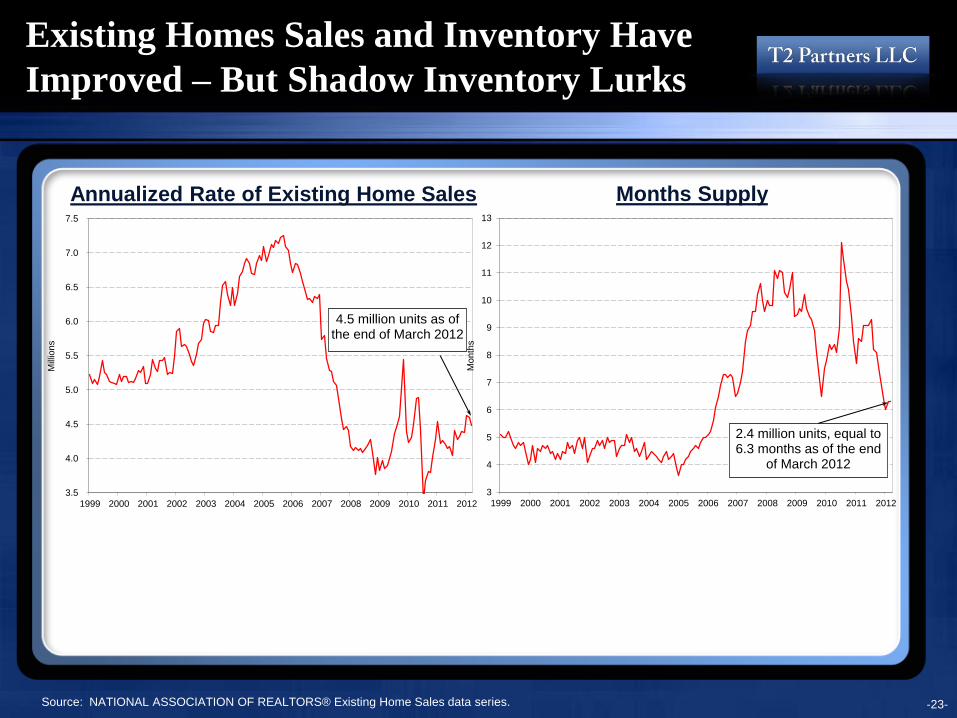
Existing Homes Sales and Inventory Have
Improved – But Shadow Inventory Lurks
Source: NATIONAL ASSOCIATION OF REALTORS® Existing Home Sales data series.
Months Supply Annualized Rate of Existing Home Sales
3.5
4.0
4.5
5.0
5.5
6.0
6.5
7.0
7.5
1999 2000 2001 2002 2003 2004 2005 2006 2007 2008 2009 2010 2011 2012
Mill
ions
4.5 million units as of the end of March 2012
3
4
5
6
7
8
9
10
11
12
13
1999 2000 2001 2002 2003 2004 2005 2006 2007 2008 2009 2010 2011 2012
Mo
nth
s
2.4 million units, equal to 6.3 months as of the end
of March 2012

-24-
Notoriously Fickle First-Time Buyers and
Investors Are Driving Existing Home Sales
Source: Mark Hanson Advisers.
Investors First-Time Buyers
0%
1%
2%
3%
4%
5%
6%
7%
8%
9%
10%
11%
12%
13%
14%
15%
Perc
enta
ge o
f H
om
e L
oans
-25-
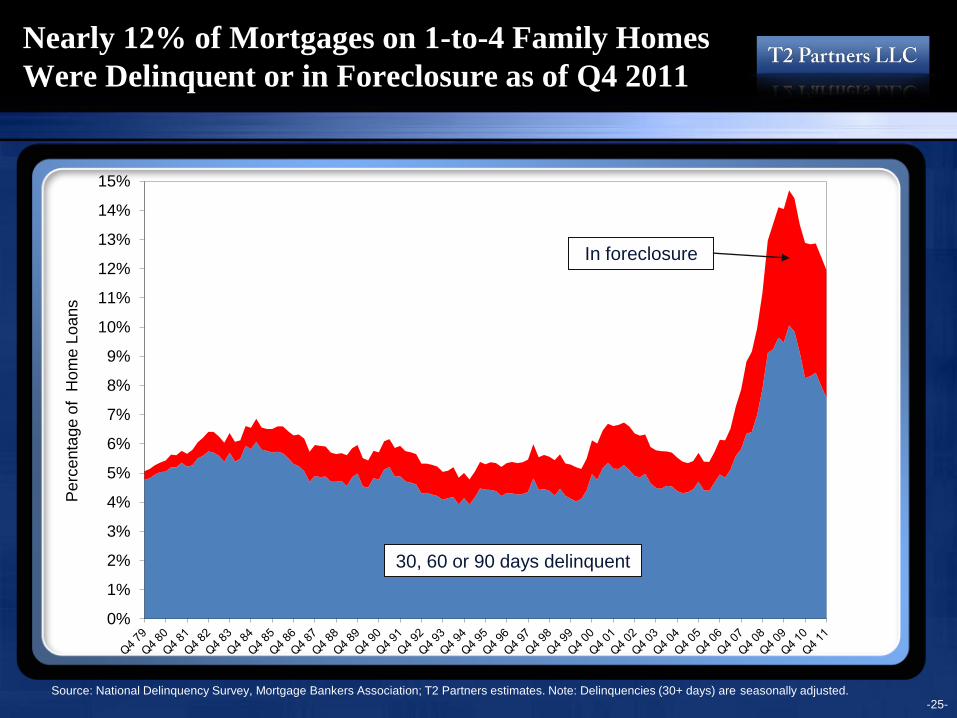
Nearly 12% of Mortgages on 1-to-4 Family Homes
Were Delinquent or in Foreclosure as of Q4 2011
Source: National Delinquency Survey, Mortgage Bankers Association; T2 Partners estimates. Note: Delinquencies (30+ days) are seasonally adjusted.
In foreclosure
30, 60 or 90 days delinquent
-26-
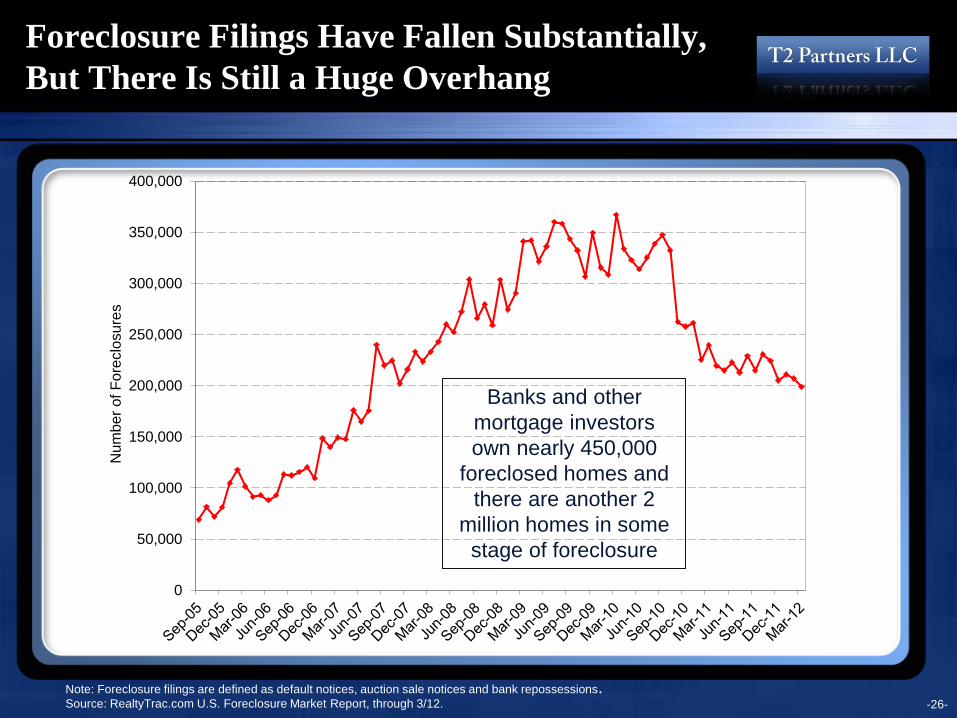
Foreclosure Filings Have Fallen Substantially,
But There Is Still a Huge Overhang
Note: Foreclosure filings are defined as default notices, auction sale notices and bank repossessions.
Source: RealtyTrac.com U.S. Foreclosure Market Report, through 3/12.
0
50,000
100,000
150,000
200,000
250,000
300,000
350,000
400,000
Nu
mb
er
of F
ore
clo
su
res
Banks and other
mortgage investors
own nearly 450,000
foreclosed homes and
there are another 2
million homes in some
stage of foreclosure
-27-
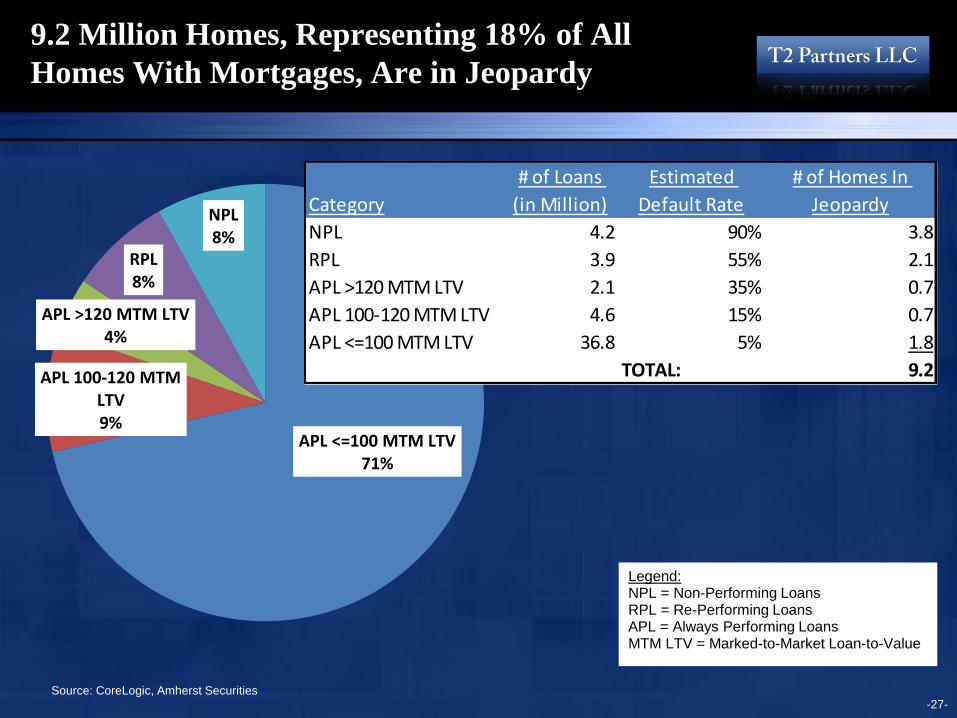
9.2 Million Homes, Representing 18% of All
Homes With Mortgages, Are in Jeopardy
Source: CoreLogic, Amherst Securities
APL <=100 MTM LTV71%
APL 100-120 MTM LTV9%
APL >120 MTM LTV4%
RPL8%
NPL8%
Category
# of Loans
(in Million)
Estimated
Default Rate
# of Homes In
Jeopardy
NPL 4.2 90% 3.8
RPL 3.9 55% 2.1
APL >120 MTM LTV 2.1 35% 0.7
APL 100-120 MTM LTV 4.6 15% 0.7
APL <=100 MTM LTV 36.8 5% 1.8
TOTAL: 9.2
Legend:NPL = Non-Performing LoansRPL = Re-Performing LoansAPL = Always Performing LoansMTM LTV = Marked-to-Market Loan-to-Value
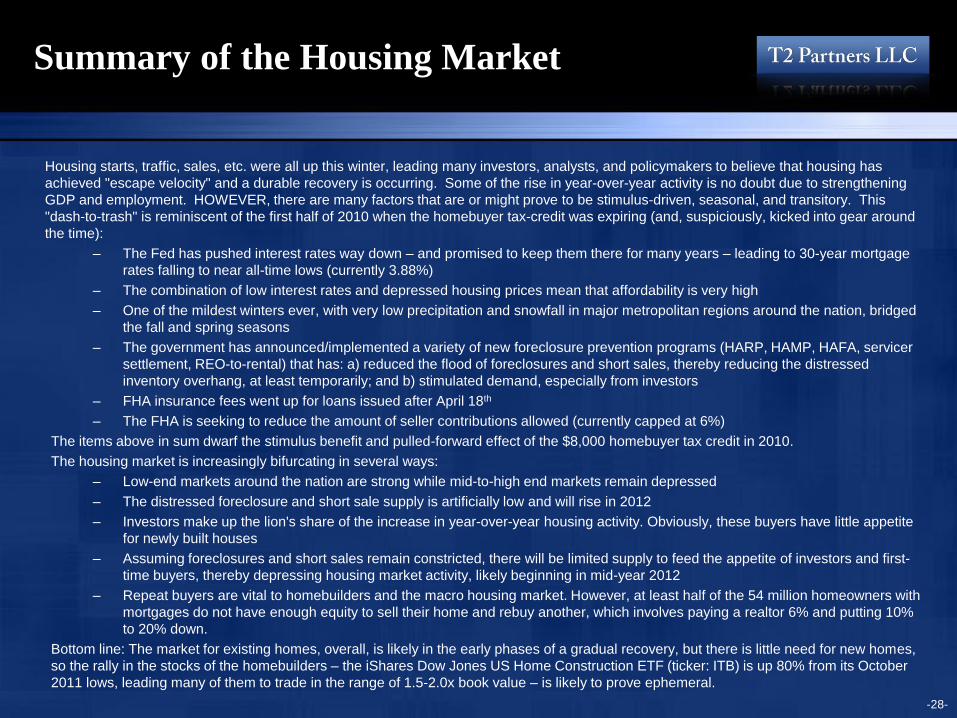
Summary of the Housing Market
Housing starts, traffic, sales, etc. were all up this winter, leading many investors, analysts, and policymakers to believe that housing has
achieved "escape velocity" and a durable recovery is occurring. Some of the rise in year-over-year activity is no doubt due to strengthening
GDP and employment. HOWEVER, there are many factors that are or might prove to be stimulus-driven, seasonal, and transitory. This
"dash-to-trash" is reminiscent of the first half of 2010 when the homebuyer tax-credit was expiring (and, suspiciously, kicked into gear around
the time):
– The Fed has pushed interest rates way down – and promised to keep them there for many years – leading to 30-year mortgage
rates falling to near all-time lows (currently 3.88%)
– The combination of low interest rates and depressed housing prices mean that affordability is very high
– One of the mildest winters ever, with very low precipitation and snowfall in major metropolitan regions around the nation, bridged
the fall and spring seasons
– The government has announced/implemented a variety of new foreclosure prevention programs (HARP, HAMP, HAFA, servicer
settlement, REO-to-rental) that has: a) reduced the flood of foreclosures and short sales, thereby reducing the distressed
inventory overhang, at least temporarily; and b) stimulated demand, especially from investors
– FHA insurance fees went up for loans issued after April 18th
– The FHA is seeking to reduce the amount of seller contributions allowed (currently capped at 6%)
The items above in sum dwarf the stimulus benefit and pulled-forward effect of the $8,000 homebuyer tax credit in 2010.
The housing market is increasingly bifurcating in several ways:
– Low-end markets around the nation are strong while mid-to-high end markets remain depressed
– The distressed foreclosure and short sale supply is artificially low and will rise in 2012
– Investors make up the lion's share of the increase in year-over-year housing activity. Obviously, these buyers have little appetite
for newly built houses
– Assuming foreclosures and short sales remain constricted, there will be limited supply to feed the appetite of investors and first-
time buyers, thereby depressing housing market activity, likely beginning in mid-year 2012
– Repeat buyers are vital to homebuilders and the macro housing market. However, at least half of the 54 million homeowners with
mortgages do not have enough equity to sell their home and rebuy another, which involves paying a realtor 6% and putting 10%
to 20% down.
Bottom line: The market for existing homes, overall, is likely in the early phases of a gradual recovery, but there is little need for new homes,
so the rally in the stocks of the homebuilders – the iShares Dow Jones US Home Construction ETF (ticker: ITB) is up 80% from its October
2011 lows, leading many of them to trade in the range of 1.5-2.0x book value – is likely to prove ephemeral.
-28-

Investment: Short Homebuilders Via iShares Dow
Jones U.S. Home Construction Index (ITB)
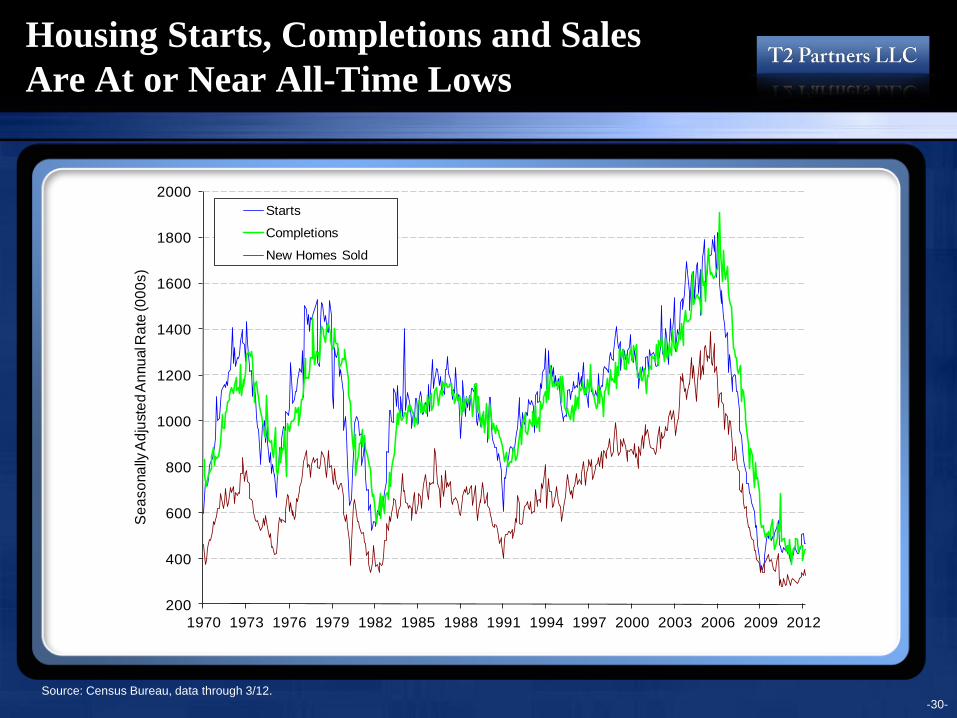
Housing Starts, Completions and Sales
Are At or Near All-Time Lows
Source: Census Bureau, data through 3/12. -30-
200
400
600
800
1000
1200
1400
1600
1800
2000
1970 1973 1976 1979 1982 1985 1988 1991 1994 1997 2000 2003 2006 2009 2012
Se
aso
na
lly A
dju
ste
d A
nnu
al R
ate
(00
0s)
Starts
Completions
New Homes Sold
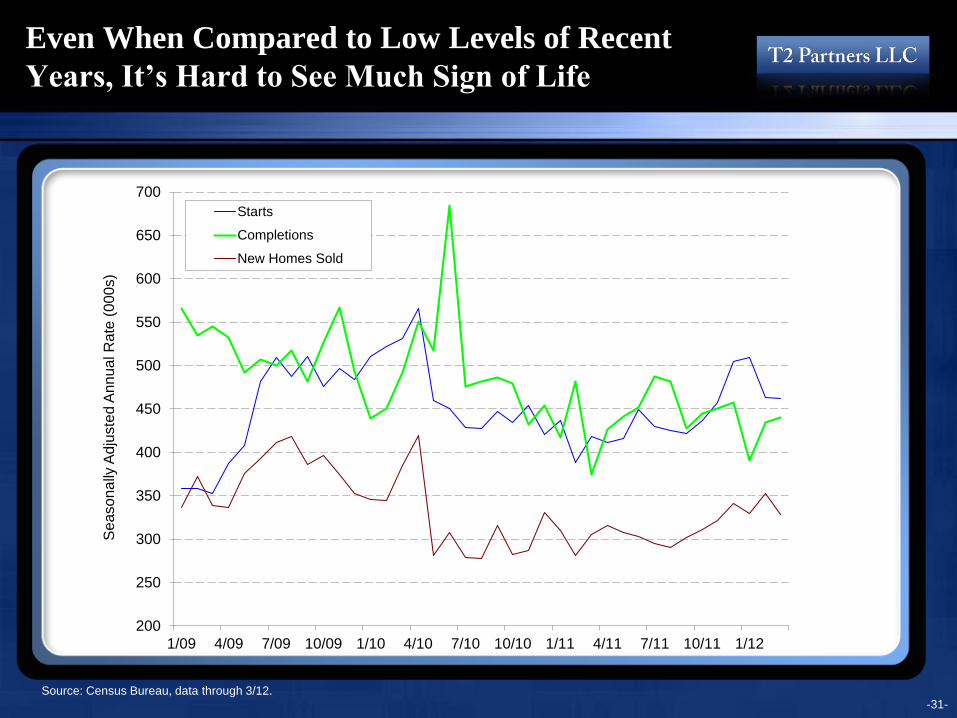
Even When Compared to Low Levels of Recent
Years, It’s Hard to See Much Sign of Life
Source: Census Bureau, data through 3/12. -31-
200
250
300
350
400
450
500
550
600
650
700
1/09 4/09 7/09 10/09 1/10 4/10 7/10 10/10 1/11 4/11 7/11 10/11 1/12
Seasonally
Adju
ste
d A
nnual R
ate
(000s)
Starts
Completions
New Homes Sold
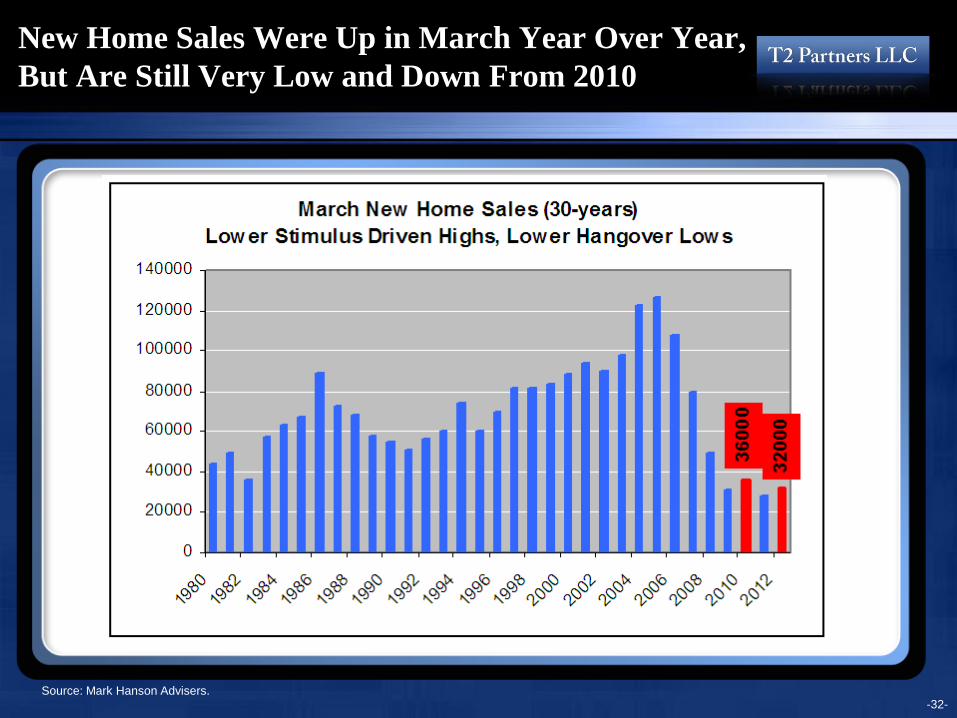
New Home Sales Were Up in March Year Over Year,
But Are Still Very Low and Down From 2010
Source: Mark Hanson Advisers. -32-
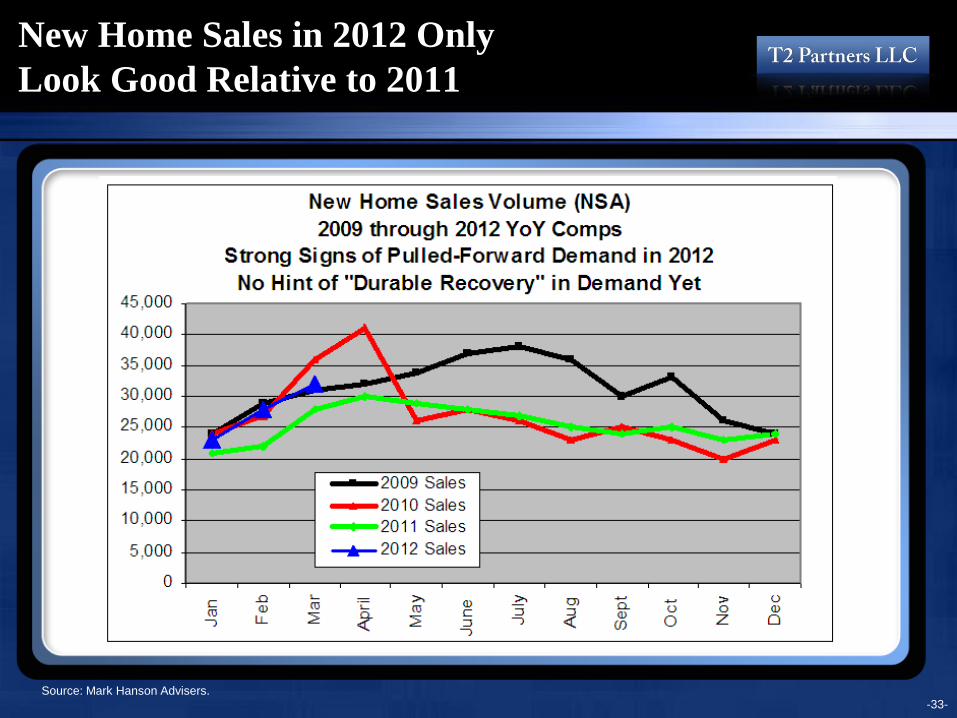
New Home Sales in 2012 Only
Look Good Relative to 2011
Source: Mark Hanson Advisers. -33-
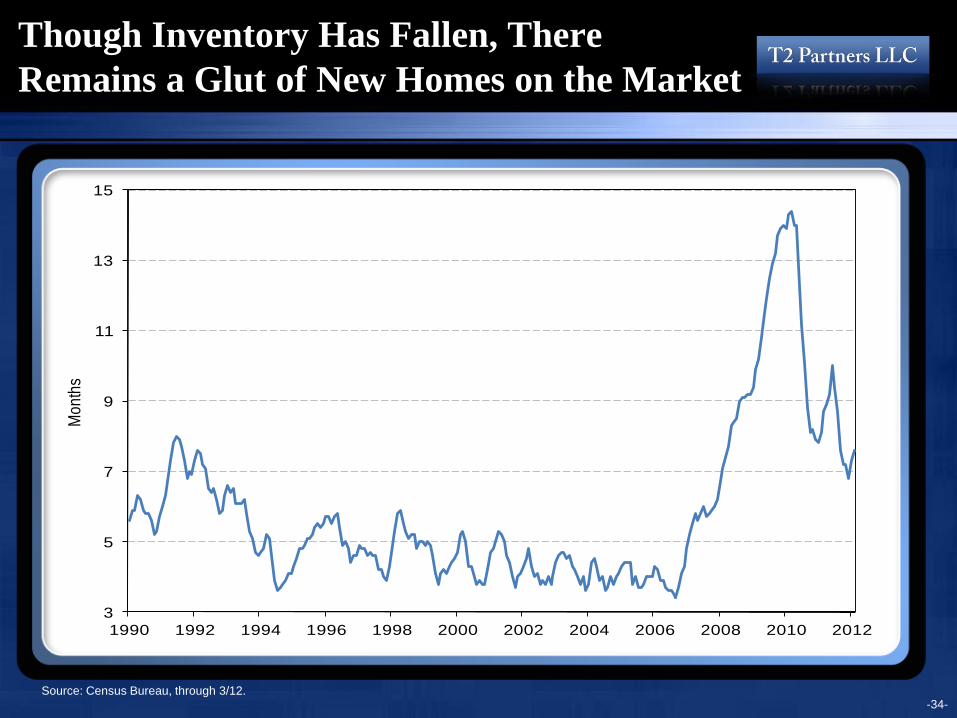
Though Inventory Has Fallen, There
Remains a Glut of New Homes on the Market
Source: Census Bureau, through 3/12. -34-
3
5
7
9
11
13
15
1990 1992 1994 1996 1998 2000 2002 2004 2006 2008 2010 2012
Mo
nth
s
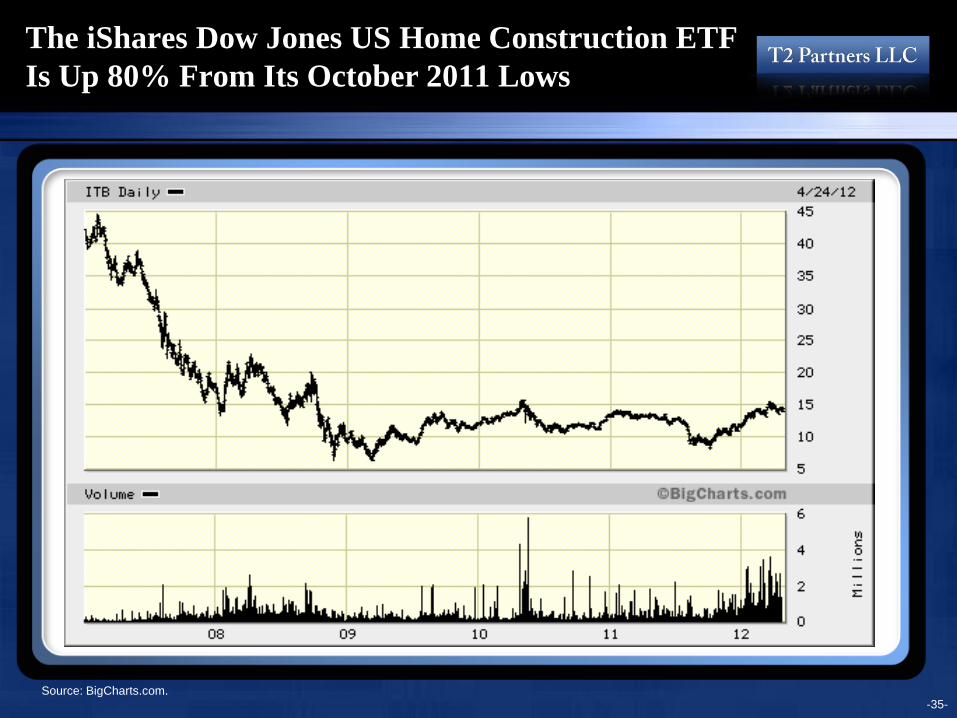
The iShares Dow Jones US Home Construction ETF
Is Up 80% From Its October 2011 Lows
Source: Census Bureau
Source: BigCharts.com. -35-
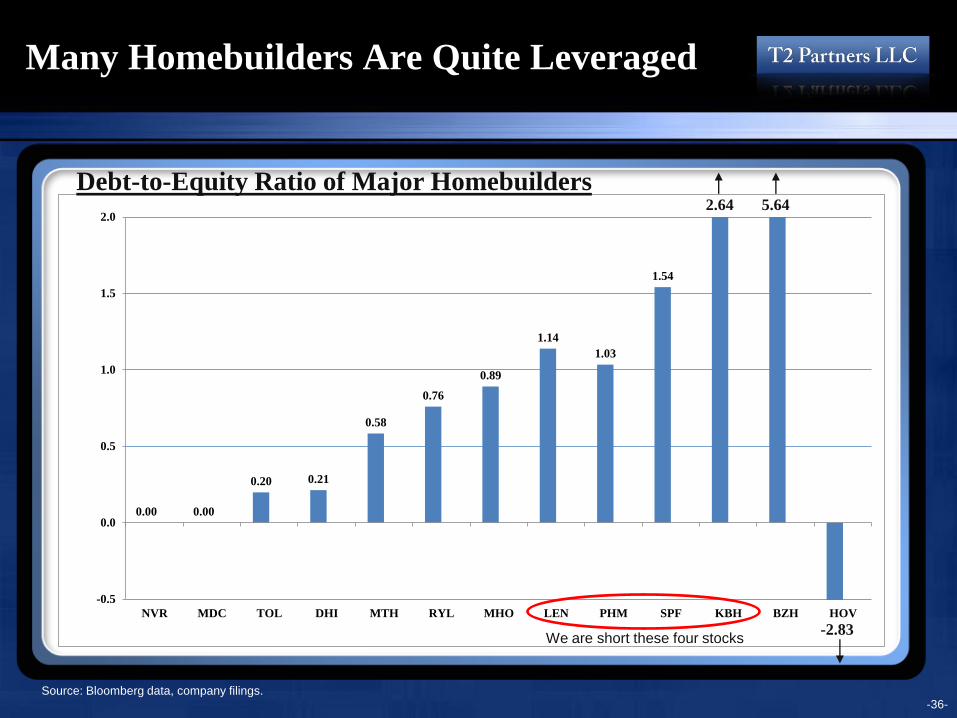
0.00 0.00
0.20 0.21
0.58
0.76
0.89
1.14
1.03
1.54
-0.5
0.0
0.5
1.0
1.5
2.0
NVR MDC TOL DHI MTH RYL MHO LEN PHM SPF KBH BZH HOV
Many Homebuilders Are Quite Leveraged
Source: Bloomberg data, company filings. -36-
2.64 5.64
-2.83
Debt-to-Equity Ratio of Major Homebuilders
We are short these four stocks

0.39
0.93
1.32 1.31
1.67
1.54
1.71
1.57
2.39 2.37
-0.5
0.0
0.5
1.0
1.5
2.0
2.5
NVR MDC TOL DHI MTH RYL MHO LEN PHM SPF KBH BZH HOV
Many Homebuilders Have
Too Much Inventory
Source: Bloomberg data, company filings. -37-
3.91 6.01
-1.91
Inventory-to-Equity Ratio of Major Homebuilders
We are short these four stocks
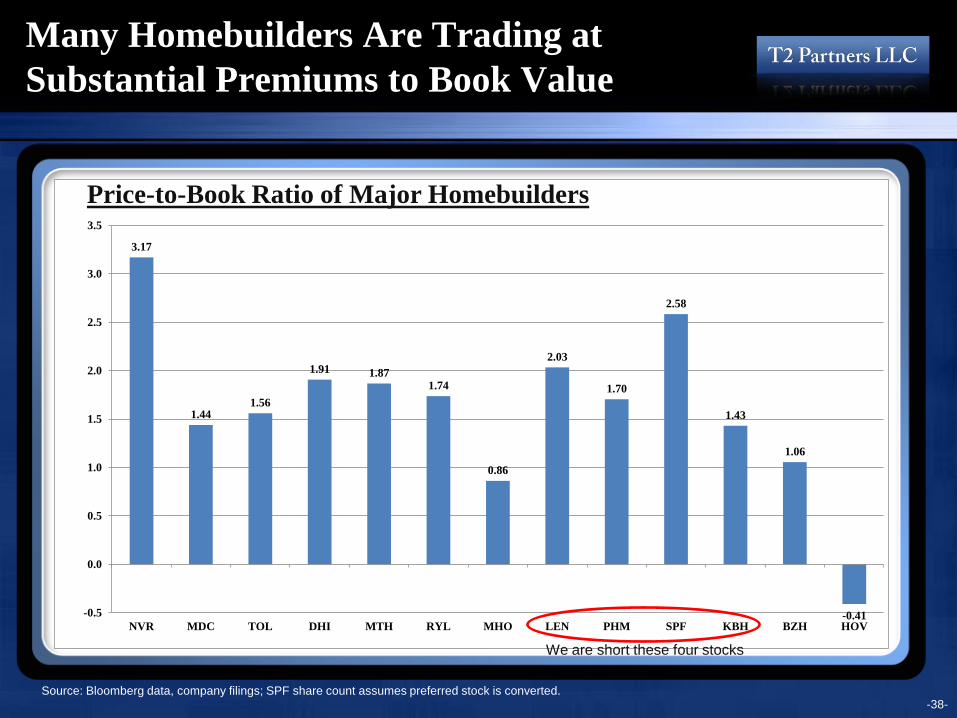
3.17
1.441.56
1.91 1.871.74
0.86
2.03
1.70
2.58
1.43
1.06
-0.41-0.5
0.0
0.5
1.0
1.5
2.0
2.5
3.0
3.5
NVR MDC TOL DHI MTH RYL MHO LEN PHM SPF KBH BZH HOV
Many Homebuilders Are Trading at
Substantial Premiums to Book Value
Source: Bloomberg data, company filings; SPF share count assumes preferred stock is converted.
Price-to-Book Ratio of Major Homebuilders
We are short these four stocks
-38-
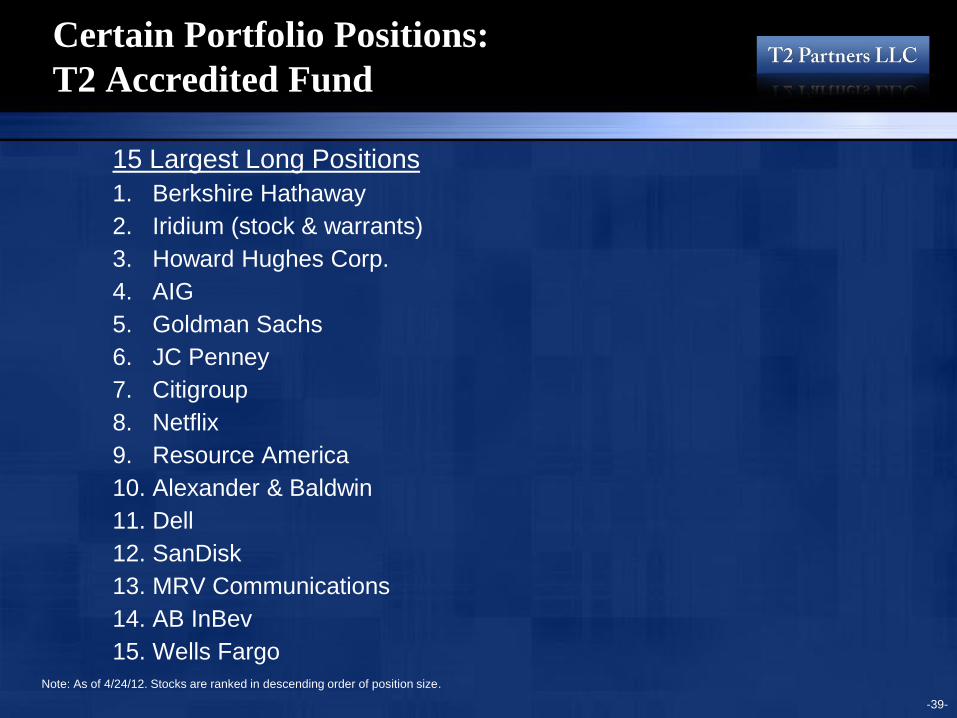
Certain Portfolio Positions:
T2 Accredited Fund
15 Largest Long Positions
1. Berkshire Hathaway
2. Iridium (stock & warrants)
3. Howard Hughes Corp.
4. AIG
5. Goldman Sachs
6. JC Penney
7. Citigroup
8. Netflix
9. Resource America
10. Alexander & Baldwin
11. Dell
12. SanDisk
13. MRV Communications
14. AB InBev
15. Wells Fargo
Note: As of 4/24/12. Stocks are ranked in descending order of position size.
-39-
Our Analysis of Berkshire Hathaway
February 24, 2012

-41-
Berkshire Hathaway: A High-Quality,
Growing 67-Cent Dollar
History
• Berkshire Hathaway today does not resemble the company that
Buffett bought into during the 1960s
• Berkshire was a leading New England-based textile company, with
investment appeal as a classic Ben Graham-style “net-net”
• Buffett took control of Berkshire on May 10, 1965
• At that time, Berkshire had a market value of about $18 million and
shareholder's equity of about $22 million
Company Shares Price Value ($B)
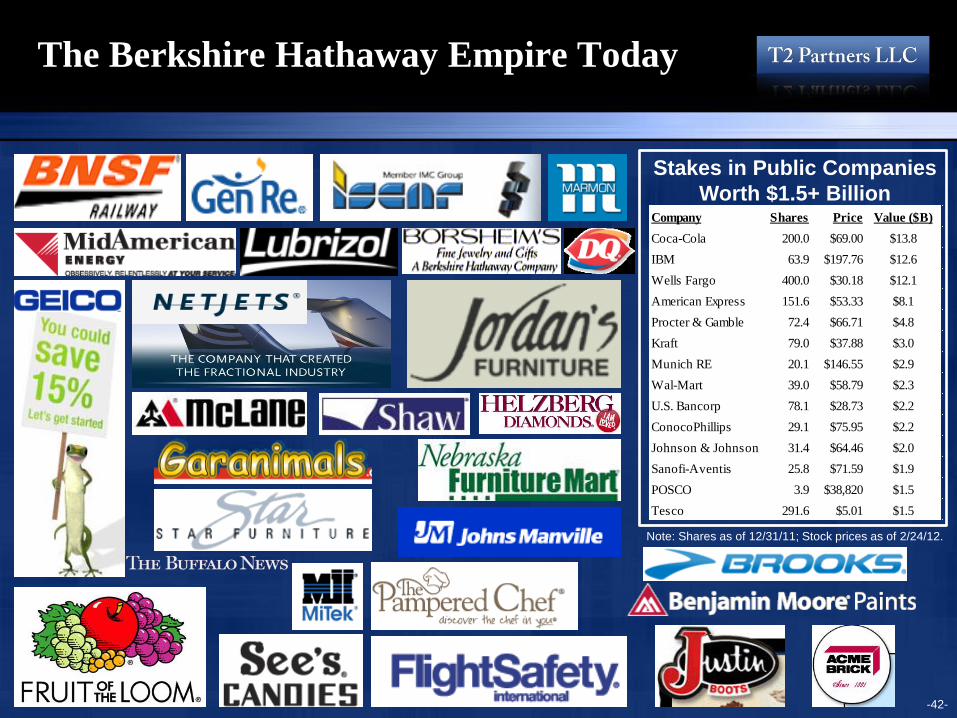
Coca-Cola 200.0 $69.00 $13.8
IBM 63.9 $197.76 $12.6
Wells Fargo 400.0 $30.18 $12.1
American Express 151.6 $53.33 $8.1
Procter & Gamble 72.4 $66.71 $4.8
Kraft 79.0 $37.88 $3.0
Munich RE 20.1 $146.55 $2.9
Wal-Mart 39.0 $58.79 $2.3
U.S. Bancorp 78.1 $28.73 $2.2
ConocoPhillips 29.1 $75.95 $2.2
Johnson & Johnson 31.4 $64.46 $2.0
Sanofi-Aventis 25.8 $71.59 $1.9
POSCO 3.9 $38,820 $1.5
Tesco 291.6 $5.01 $1.5
The Berkshire Hathaway Empire Today
Stakes in Public Companies
Worth $1.5+ Billion
Note: Shares as of 12/31/11; Stock prices as of 2/24/12.
-42-

-43-
The Basics
• Stock price (2/24/12): $120,000
– $80.04 for B shares (equivalent to $120,060/A share)
• Shares outstanding: 1.65 million
• Market cap: $198 billion
• Total assets (Q4 ‘11): $393 billion
• Total equity (Q4 ‘11): $169 billion
• Book value per share (Q4 ‘11): $99,860
• P/B: 1.20x
• Float (Q4 ‘11): $70.6 billion
-44-
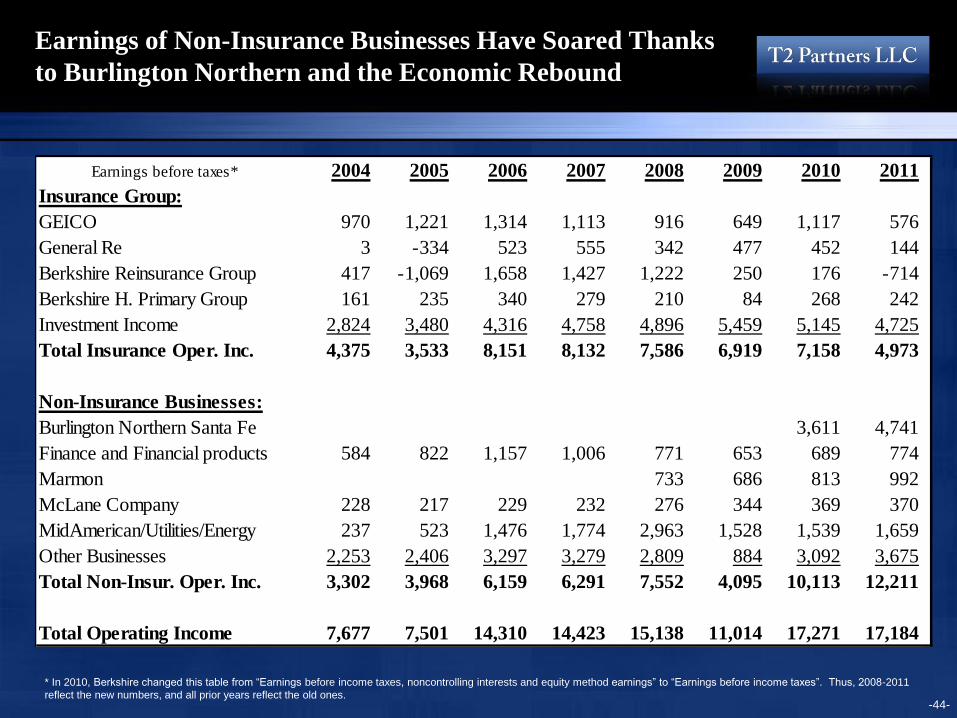
Earnings of Non-Insurance Businesses Have Soared Thanks
to Burlington Northern and the Economic Rebound
* In 2010, Berkshire changed this table from “Earnings before income taxes, noncontrolling interests and equity method earnings” to “Earnings before income taxes”. Thus, 2008-2011
reflect the new numbers, and all prior years reflect the old ones.
Earnings before taxes* 2004 2005 2006 2007 2008 2009 2010 2011
Insurance Group:
GEICO 970 1,221 1,314 1,113 916 649 1,117 576
General Re 3 -334 523 555 342 477 452 144
Berkshire Reinsurance Group 417 -1,069 1,658 1,427 1,222 250 176 -714
Berkshire H. Primary Group 161 235 340 279 210 84 268 242
Investment Income 2,824 3,480 4,316 4,758 4,896 5,459 5,145 4,725
Total Insurance Oper. Inc. 4,375 3,533 8,151 8,132 7,586 6,919 7,158 4,973
Non-Insurance Businesses:
Burlington Northern Santa Fe 3,611 4,741
Finance and Financial products 584 822 1,157 1,006 771 653 689 774
Marmon 733 686 813 992
McLane Company 228 217 229 232 276 344 369 370
MidAmerican/Utilities/Energy 237 523 1,476 1,774 2,963 1,528 1,539 1,659
Other Businesses 2,253 2,406 3,297 3,279 2,809 884 3,092 3,675
Total Non-Insur. Oper. Inc. 3,302 3,968 6,159 6,291 7,552 4,095 10,113 12,211
Total Operating Income 7,677 7,501 14,310 14,423 15,138 11,014 17,271 17,184
-45-
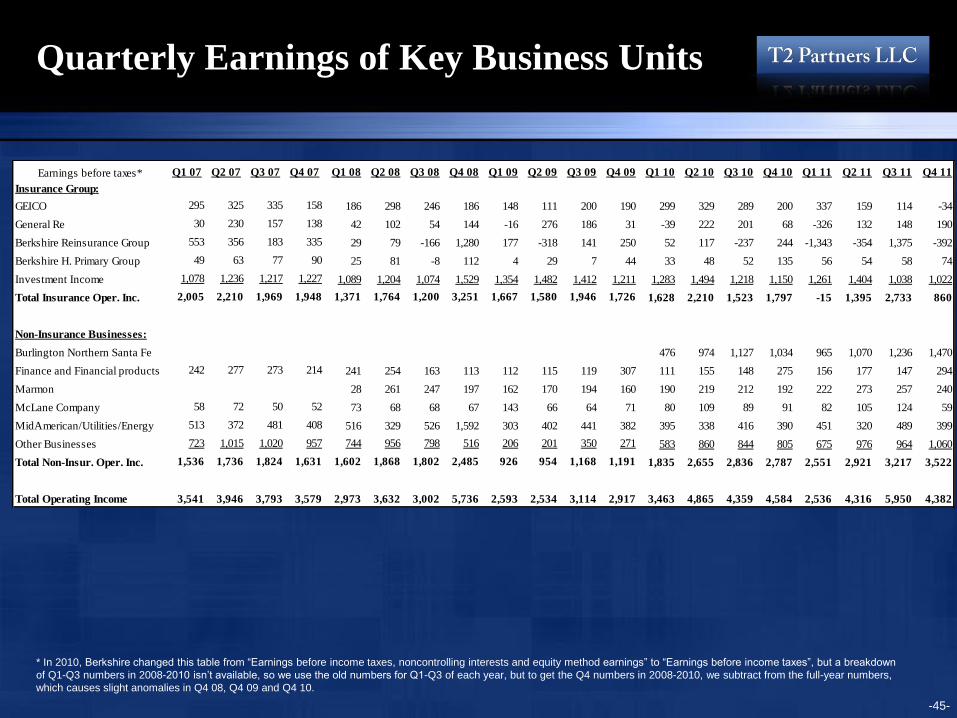
Quarterly Earnings of Key Business Units
* In 2010, Berkshire changed this table from “Earnings before income taxes, noncontrolling interests and equity method earnings” to “Earnings before income taxes”, but a breakdown
of Q1-Q3 numbers in 2008-2010 isn’t available, so we use the old numbers for Q1-Q3 of each year, but to get the Q4 numbers in 2008-2010, we subtract from the full-year numbers,
which causes slight anomalies in Q4 08, Q4 09 and Q4 10.
Earnings before taxes* Q1 07 Q2 07 Q3 07 Q4 07 Q1 08 Q2 08 Q3 08 Q4 08 Q1 09 Q2 09 Q3 09 Q4 09 Q1 10 Q2 10 Q3 10 Q4 10 Q1 11 Q2 11 Q3 11 Q4 11
Insurance Group:
GEICO 295 325 335 158 186 298 246 186 148 111 200 190 299 329 289 200 337 159 114 -34
General Re 30 230 157 138 42 102 54 144 -16 276 186 31 -39 222 201 68 -326 132 148 190
Berkshire Reinsurance Group 553 356 183 335 29 79 -166 1,280 177 -318 141 250 52 117 -237 244 -1,343 -354 1,375 -392
Berkshire H. Primary Group 49 63 77 90 25 81 -8 112 4 29 7 44 33 48 52 135 56 54 58 74
Investment Income 1,078 1,236 1,217 1,227 1,089 1,204 1,074 1,529 1,354 1,482 1,412 1,211 1,283 1,494 1,218 1,150 1,261 1,404 1,038 1,022
Total Insurance Oper. Inc. 2,005 2,210 1,969 1,948 1,371 1,764 1,200 3,251 1,667 1,580 1,946 1,726 1,628 2,210 1,523 1,797 -15 1,395 2,733 860
Non-Insurance Businesses:
Burlington Northern Santa Fe 476 974 1,127 1,034 965 1,070 1,236 1,470
Finance and Financial products 242 277 273 214 241 254 163 113 112 115 119 307 111 155 148 275 156 177 147 294
Marmon 28 261 247 197 162 170 194 160 190 219 212 192 222 273 257 240
McLane Company 58 72 50 52 73 68 68 67 143 66 64 71 80 109 89 91 82 105 124 59
MidAmerican/Utilities/Energy 513 372 481 408 516 329 526 1,592 303 402 441 382 395 338 416 390 451 320 489 399
Other Businesses 723 1,015 1,020 957 744 956 798 516 206 201 350 271 583 860 844 805 675 976 964 1,060
Total Non-Insur. Oper. Inc. 1,536 1,736 1,824 1,631 1,602 1,868 1,802 2,485 926 954 1,168 1,191 1,835 2,655 2,836 2,787 2,551 2,921 3,217 3,522
Total Operating Income 3,541 3,946 3,793 3,579 2,973 3,632 3,002 5,736 2,593 2,534 3,114 2,917 3,463 4,865 4,359 4,584 2,536 4,316 5,950 4,382
-46-
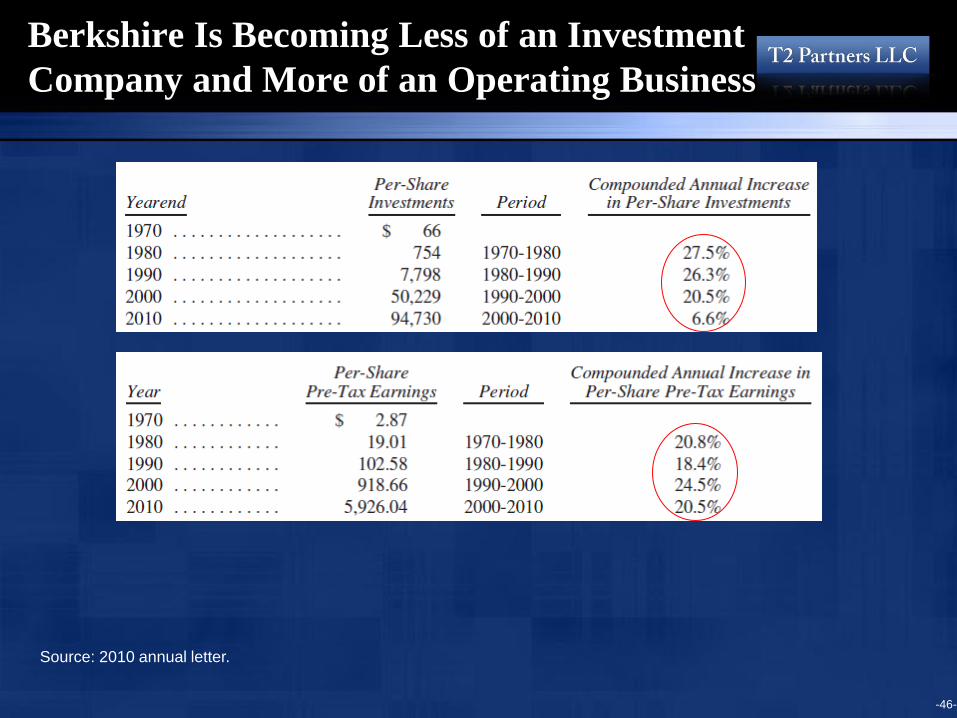
Berkshire Is Becoming Less of an Investment
Company and More of an Operating Business
Source: 2010 annual letter.
*
(10)
(5)
0
5
10
15
20
1997 1998 1999 2000 2001 2002 2003 2004 2005 2006 2007 2008 2009 2010 2011
Acquisitions Net Stock Purchases
-47-
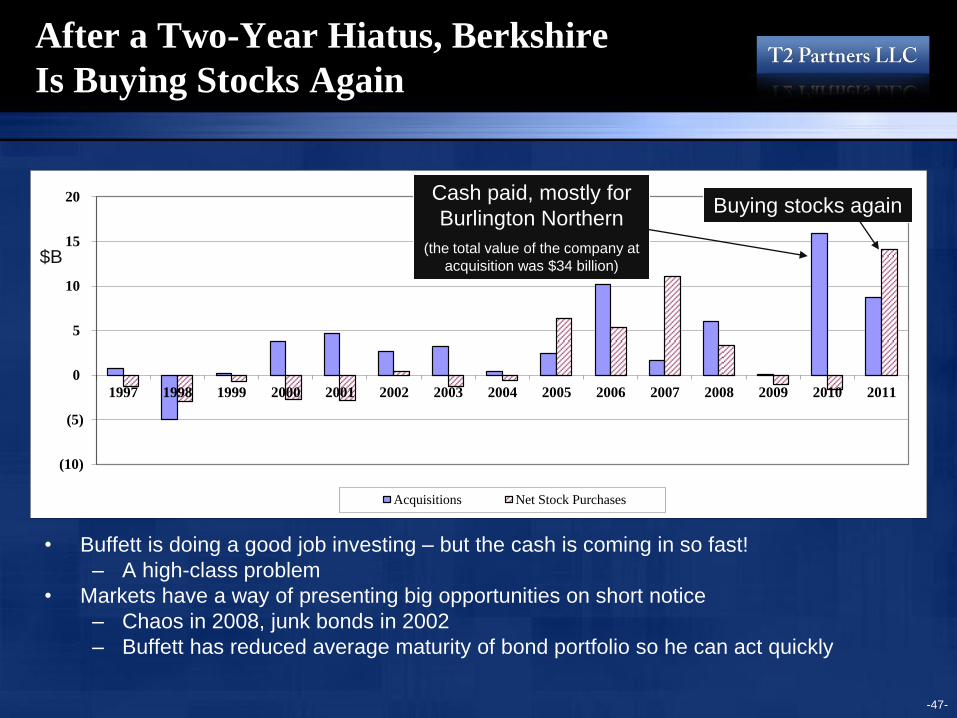
After a Two-Year Hiatus, Berkshire
Is Buying Stocks Again
• Buffett is doing a good job investing – but the cash is coming in so fast!
– A high-class problem
• Markets have a way of presenting big opportunities on short notice
– Chaos in 2008, junk bonds in 2002
– Buffett has reduced average maturity of bond portfolio so he can act quickly
$B
Cash paid, mostly for
Burlington Northern
(the total value of the company at
acquisition was $34 billion)
Buying stocks again
-48-
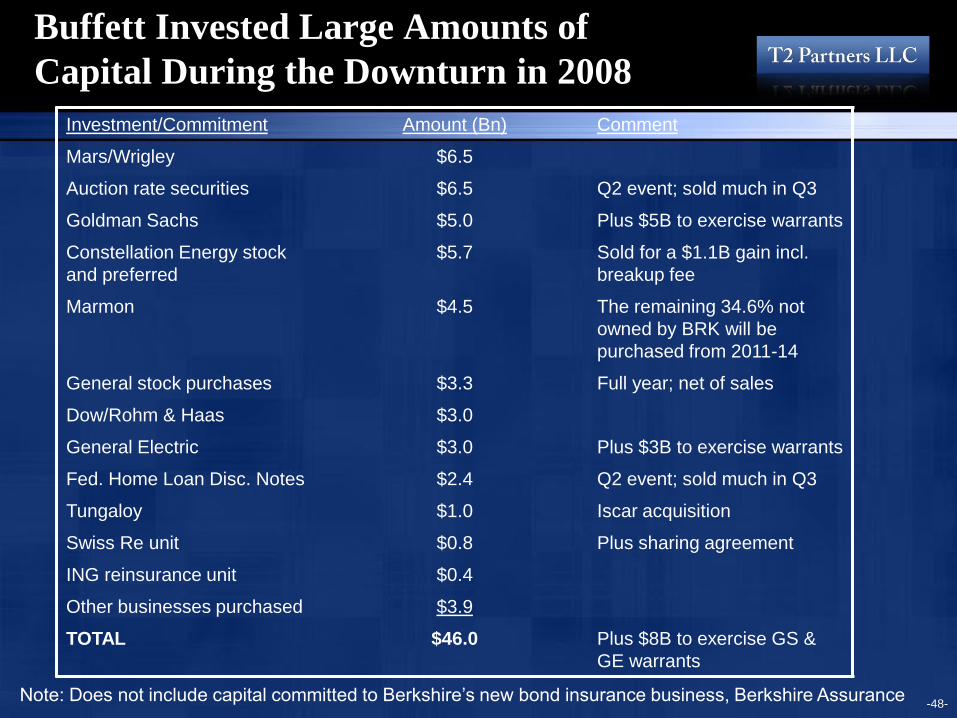
Buffett Invested Large Amounts of
Capital During the Downturn in 2008
Investment/Commitment Amount (Bn) Comment
Mars/Wrigley $6.5
Auction rate securities $6.5 Q2 event; sold much in Q3
Goldman Sachs $5.0 Plus $5B to exercise warrants
Constellation Energy stock
and preferred
$5.7 Sold for a $1.1B gain incl.
breakup fee
Marmon $4.5 The remaining 34.6% not
owned by BRK will be
purchased from 2011-14
General stock purchases $3.3 Full year; net of sales
Dow/Rohm & Haas $3.0
General Electric $3.0 Plus $3B to exercise warrants
Fed. Home Loan Disc. Notes $2.4 Q2 event; sold much in Q3
Tungaloy $1.0 Iscar acquisition
Swiss Re unit $0.8 Plus sharing agreement
ING reinsurance unit $0.4
Other businesses purchased $3.9
TOTAL $46.0 Plus $8B to exercise GS &
GE warrants
Note: Does not include capital committed to Berkshire’s new bond insurance business, Berkshire Assurance
-49-
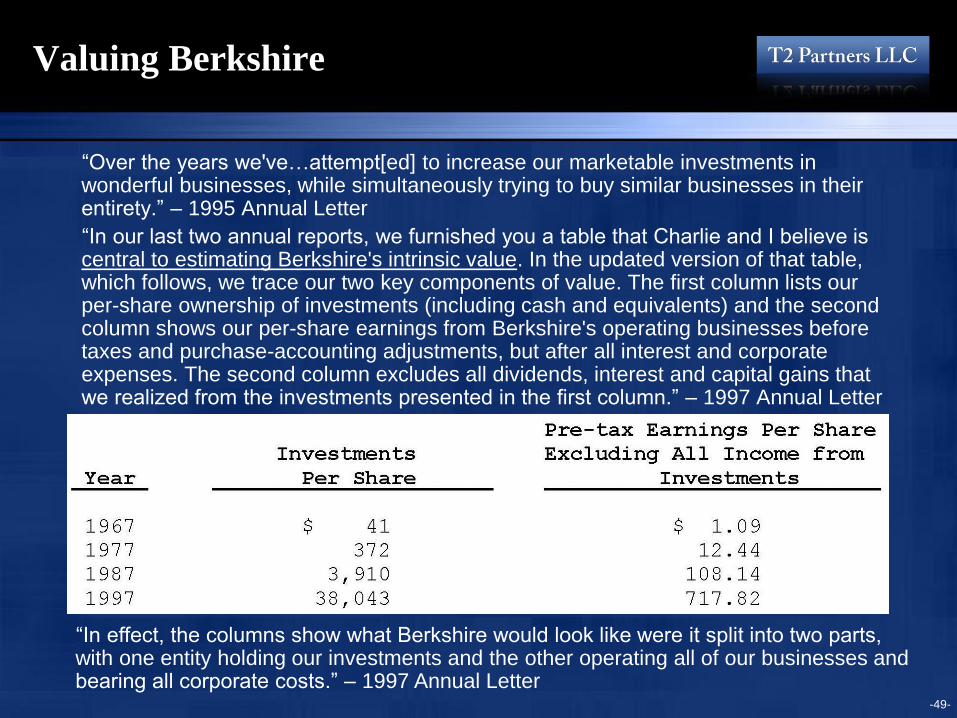
Valuing Berkshire
“Over the years we've…attempt[ed] to increase our marketable investments in wonderful businesses, while simultaneously trying to buy similar businesses in their entirety.” – 1995 Annual Letter
“In our last two annual reports, we furnished you a table that Charlie and I believe is central to estimating Berkshire's intrinsic value. In the updated version of that table, which follows, we trace our two key components of value. The first column lists our per-share ownership of investments (including cash and equivalents) and the second column shows our per-share earnings from Berkshire's operating businesses before taxes and purchase-accounting adjustments, but after all interest and corporate expenses. The second column excludes all dividends, interest and capital gains that we realized from the investments presented in the first column.” – 1997 Annual Letter
“In effect, the columns show what Berkshire would look like were it split into two parts, with one entity holding our investments and the other operating all of our businesses and bearing all corporate costs.” – 1997 Annual Letter
-50-
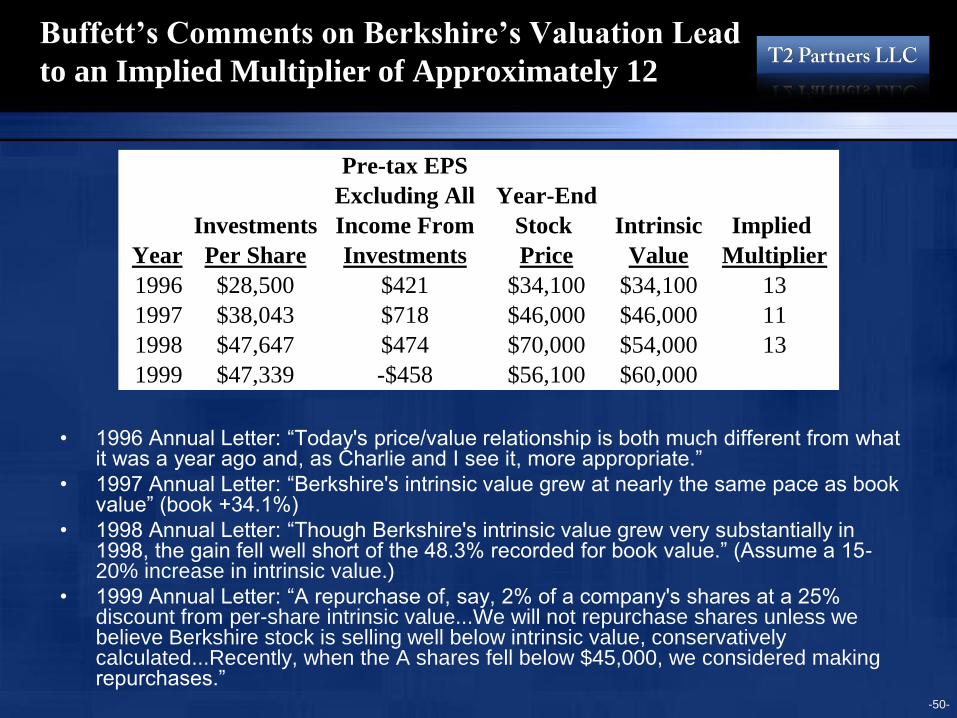
Buffett’s Comments on Berkshire’s Valuation Lead
to an Implied Multiplier of Approximately 12
• 1996 Annual Letter: “Today's price/value relationship is both much different from what it was a year ago and, as Charlie and I see it, more appropriate.”
• 1997 Annual Letter: “Berkshire's intrinsic value grew at nearly the same pace as book value” (book +34.1%)
• 1998 Annual Letter: “Though Berkshire's intrinsic value grew very substantially in 1998, the gain fell well short of the 48.3% recorded for book value.” (Assume a 15-20% increase in intrinsic value.)
• 1999 Annual Letter: “A repurchase of, say, 2% of a company's shares at a 25% discount from per-share intrinsic value...We will not repurchase shares unless we believe Berkshire stock is selling well below intrinsic value, conservatively calculated...Recently, when the A shares fell below $45,000, we considered making repurchases.”
Pre-tax EPS
Excluding All Year-End
Investments Income From Stock Intrinsic Implied
Year Per Share Investments Price Value Multiplier
1996 $28,500 $421 $34,100 $34,100 13
1997 $38,043 $718 $46,000 $46,000 11
1998 $47,647 $474 $70,000 $54,000 13
1999 $47,339 -$458 $56,100 $60,000

Pre-tax EPS
Excluding All Subsequent
Investments Income From Intrinsic Value Year Stock
Year End Per Share Investments Per Share Price Range
2001 $47,460 -$1,289 $64,000 $59,600-$78,500
2002 $52,507 $1,479 $70,000 $60,600-$84,700
2003 $62,273 $2,912 $97,000 $81,000-$95,700
2004 $66,967 $3,003 $103,000 $78,800-$92,000
2005 $74,129 $3,600 $117,300 $85,700-$114,200
2006 $80,636 $5,200-$5,400 $143,000-$144,400 $107,200-$151,650
2007 $90,343 $5,500-$5,700 $156,300-$158,700 $84,000-$147,000
2008 $75,912 $5,727 $121,728 (8 multiple) $70,050-$108,100
2009 $91,091 $3,571 $126,801 (10 multiple) $97,205-$128,730
2010 $94,730 $7,200 $166,730 (10 multiple) $98,952-$131,463
2011 $98,366 $8,000 $178,366 (10 multiple) ?
Estimating Berkshire’s Value: 2001 – 2011
1. Unlike Buffett, we include a conservative estimate of normalized earnings from Berkshire’s insurance businesses: half of the $2 billion
of annual profit over the past nine years.
2. Buffett reported $6,990/share in his 2011 annual letter, but we include half of normalized insurance earnings as well as run-rate
earnings for Lubrizol.
Given compressed multiples at the end of 2008, we used an 8 rather than a 12 multiple.
We’ve now increased this to a 10 multiple, still below the historical 12 multiple we believe Buffett uses.
-51-
1
2
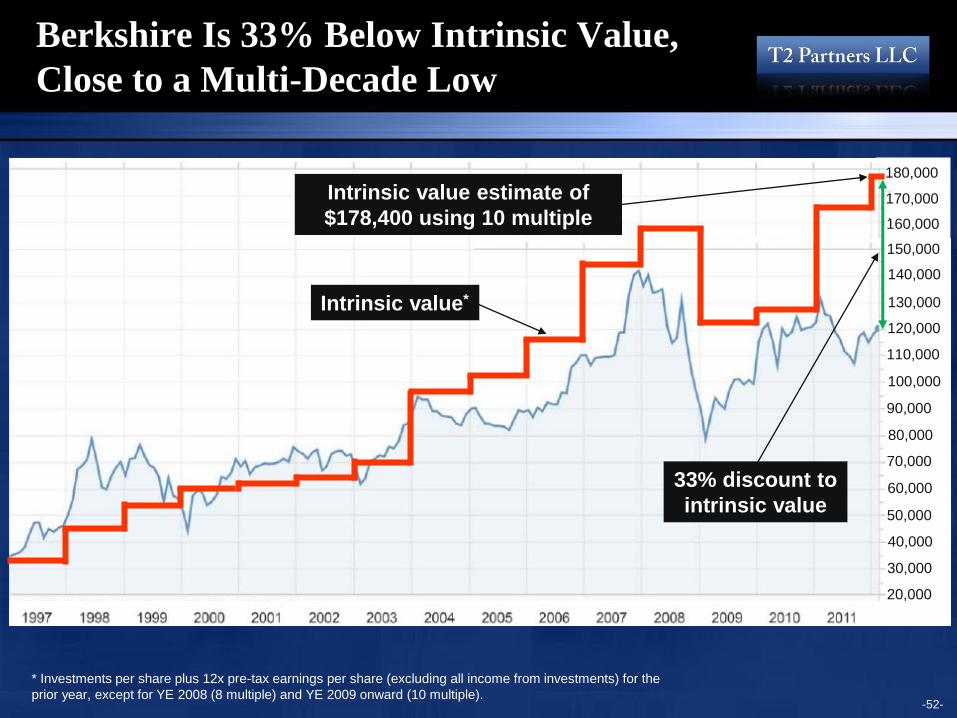
Berkshire Is 33% Below Intrinsic Value,
Close to a Multi-Decade Low
Intrinsic value*
* Investments per share plus 12x pre-tax earnings per share (excluding all income from investments) for the
prior year, except for YE 2008 (8 multiple) and YE 2009 onward (10 multiple).
Intrinsic value estimate of
$178,400 using 10 multiple
33% discount to
intrinsic value
-52-
150,000
140,000
130,000
120,000
110,000
100,000
90,000
80,000
70,000
60,000
50,000
40,000
30,000
20,000
160,000
170,000
180,000
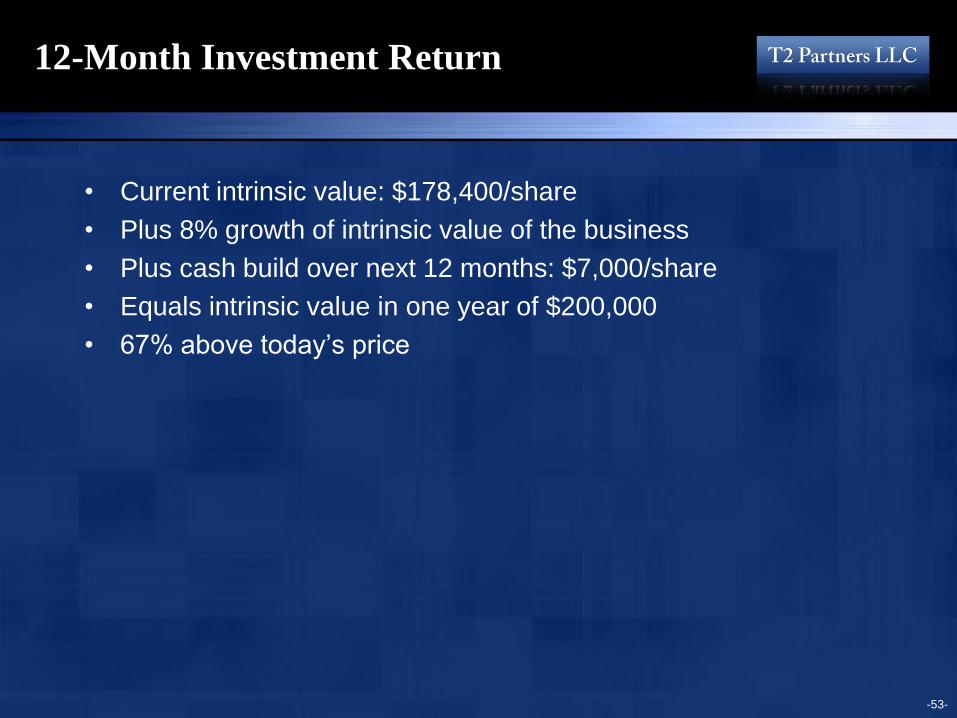
12-Month Investment Return
• Current intrinsic value: $178,400/share
• Plus 8% growth of intrinsic value of the business
• Plus cash build over next 12 months: $7,000/share
• Equals intrinsic value in one year of $200,000
• 67% above today’s price
-53-
-54-
Catalysts
• Continued earnings growth of operating businesses, especially
as $1+ billion of pre-tax earnings from Lubrizol are incorporated
• New equity investments
• Additional cash build
• Meaningful share repurchases
• Eventually, Berkshire could win back a AAA rating (not likely in
the near term)
• Potential for more meaningful acquisitions and investments
– If there’s a double-dip recession, this becomes more likely
-55-
Berkshire’s New Share Repurchase Program
• On September 26th 2011, Berkshire announced the first formal share
repurchase program in Berkshire’s history, and only the second time
Buffett has ever offered to buy back stock
• It’s unusual in three ways:
1. There’s no time limit
2. There’s no dollar cap
3. Buffett set a price: “…no higher than a 10% premium over the then-
current book value of the shares. In the opinion of our Board and
management, the underlying businesses of Berkshire are worth
considerably more than this amount…”
• Book value at the end of Q4 ‘11 was $99,860 ($66.57/B share)
• Thus, a 10% premium means that Buffett is willing to buy back stock
up to $109,846 ($73.23/B share), 8.5% below today’s price
-56-
The Share Repurchase Program Has Significantly Improved
the Risk-Reward Equation, So We Bought More Stock
• It confirms that Buffett shares our belief that Berkshire stock is deeply undervalued
– He wouldn’t be buying it back at a 10% premium to book value if he thought its intrinsic value
was, say, 20% or even 30% above book
– Our estimate is nearly $180,000/share, 50% above today’s levels
• Buffett put a floor on the stock: he was clear in numerous interviews after the program
was announced that he is eager to buy back a lot of stock – and he has plenty of dry
powder to do so:
– Berkshire has $33.5 billion of cash (excluding railroads, utilities, energy, finance and financial
products), plus another $31.2 billion in bonds (nearly all of which are short-term, cash
equivalents), which totals $64.7 billion
– On top of this, the company generated more than $12.3 billion in free cash flow in 2011 – in
other words, more than $1 billion/month is pouring into Omaha
– The press release notes that “repurchases will not be made if they would reduce Berkshire’s
consolidated cash equivalent holdings below $20 billion,” so that leaves $45 billion to deploy
(and growing by more than $1 billion/month), equal to 23% of the company’s current market
cap
• It’s unlikely, however, that Buffett would repurchase anything close to this amount, as some of the
cash and bonds are held at various insurance subsidiaries, plus Buffett likely wants to keep plenty of
dry powder to make acquisitions and investments like the recent $5 billion one into Bank of America
– In summary, Buffett could easily buy back $10-20 billion of stock and still have plenty of dry
powder for other investments
-57-
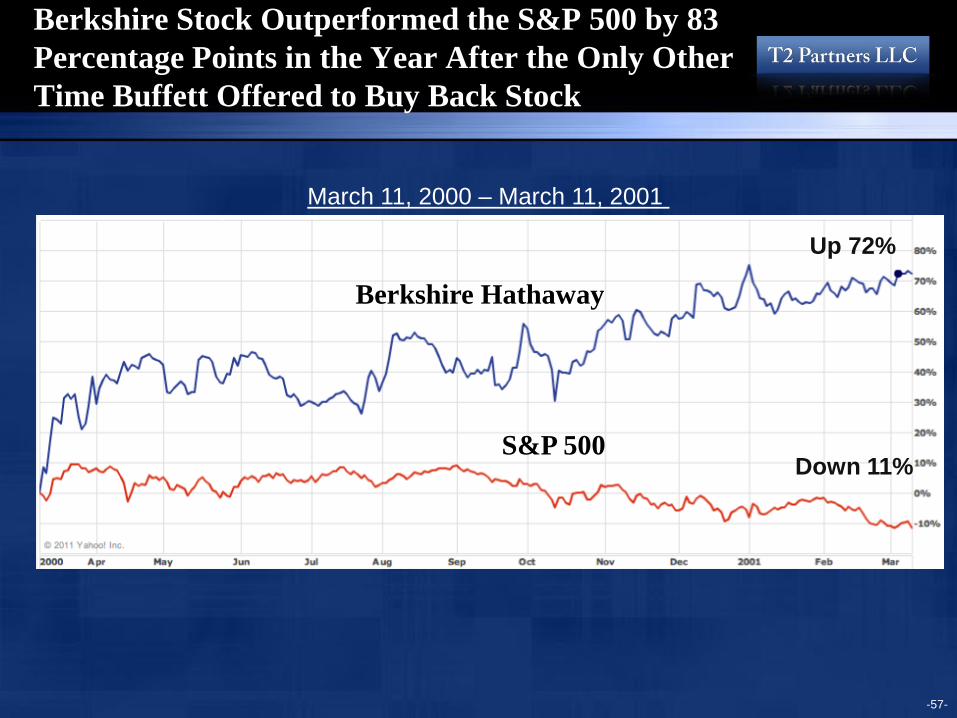
Berkshire Stock Outperformed the S&P 500 by 83
Percentage Points in the Year After the Only Other
Time Buffett Offered to Buy Back Stock
Berkshire Hathaway
S&P 500
March 11, 2000 – March 11, 2001
Up 72%
Down 11%
-58-
Risk: Who Will Replace Buffett?
• When Buffett is no longer running Berkshire, his job will be split into two
parts: one CEO, who has not been named, and a small number of CIOs
(Chief Investment Officers) – Two have been named already, Todd Combs and Ted Weschler, who both appear to be
excellent investors
• Nevertheless, Buffett is irreplaceable and it will be a significant loss when
he no longer runs Berkshire for a number of reasons: – There is no investor with Buffett’s experience, wisdom and track record, so his successors’
decisions regarding the purchases of both stocks and entire business might not be as good
– Most of the 75+ managers of Berkshire’s operating subsidiaries are wealthy and don’t need
to work, but nevertheless work extremely hard and almost never leave thanks to Buffett’s
“halo” and superb managerial skills. Will this remain the case under his successors?
– Buffett’s reputation is unrivaled so he is offered deals (such as the recent $5 billion
investment in BofA) on terms that are not offered to any other investor – and might not be
offered to his successors
– Being offered investment opportunities on terms/prices not available to anyone else also
applies to buying companies outright. There’s a high degree of prestige in selling one’s
business to Buffett (above and beyond the advantages of selling to Berkshire). For
example, the owners of Iscar could surely have gotten a higher price had they taken the
business public or sold it to an LBO firm
– Buffett’s Rolodex is unrivaled, so he gets calls (and can make calls that get returned) that
his successors might not
-59-
Aren’t We Concerned About the Uncertainty
of Berkshire After Buffett?
Answer: Not really, for two primary reasons:
1. Buffett isn’t going anywhere anytime soon. We think it’s at least
80% likely that Buffett will be running Berkshire for five more
years, and 50% likely he’ll be doing so for 10 more years
– Buffett turned 81 on Aug. 30th, is in excellent health, and loves his job
– There are no signs that he is slowing down mentally – in fact, he appears to be
getting better with age
• A life expectancy calculator (http://calculator.livingto100.com) shows that
Buffett is likely to live to age 93 (12 more years) – and we’d bet on the over
2. The stock is very cheap based on our estimate of intrinsic value
(nearly $178,400/A share), which does not include any Buffett
premium
• We simply take investments/share and add the value of the operating
businesses, based on a conservative multiple of their normalized earnings
• The value of the cash and bonds won’t change, and Coke, American Express,
Burlington Northern, GEICO, etc. will continue to generate robust earnings
even after Buffett’s no longer running Berkshire
-60-
Why Doesn’t Buffett Identify His Successor Now?
We think it's wise that Buffett hasn't named his successor for two
reasons:
1. It would place enormous pressure and expectations on this
person, which is unnecessary and counterproductive;
2. It might be demotivating for the candidates who were not chosen;
and
3. Who knows what will happen between now and the time that a
successor takes over (which could be more than a decade)?
– Maybe the current designee falls ill, leaves Berkshire, performs
poorly, or makes a terrible mistake (like Sokol did)?
– Or what if another candidate (perhaps one of the two backup
successors today) performs incredibly well, or Berkshire acquires a
business with a fantastic CEO, and Buffett and the board decide that
another candidate is better?
– In either case, Buffett and the board will be able to switch their
choice without the second-guessing and media circus that would
occur if the successor had been named
-61-
The Real Buffett Risk
• Buffett is often asked (as are we): “What would happen to the
company (and stock) if you got hit by a bus (i.e., die suddenly)?
– If it happened tomorrow, our best guess is that the stock would fall 10-15%
(which would give Berkshire the opportunity to buy back a lot of stock if it was
trading below 110% of book value)
– But this isn’t likely. Not to be morbid, but most people don’t die suddenly from
something like an accident or heart attack, but rather die slowly: their bodies
(and sometimes minds) break down gradually
– A far greater risk to Berkshire shareholders is that Buffett begins to lose it
mentally and starts making bad investment decisions, but doesn’t recognize it
(or refuses to acknowledge it because he loves his work so much) and the
board won’t “take away the keys”, perhaps rationalizing that a diminished Buffett
is still better than anyone else
– Buffett is aware of this risk and has instructed Berkshire’s board members, both
publicly and privately, that their most important job is to “take away the keys” if
they see him losing it
– We trust that both Buffett and the board will act rationally, but also view it as our
job to independently observe and evaluate Buffett to make sure we’re
comfortable that he’s still at the top of his game. Today, we think he’s never
been better.
-62-
An Analogy with Apple & Steve Jobs
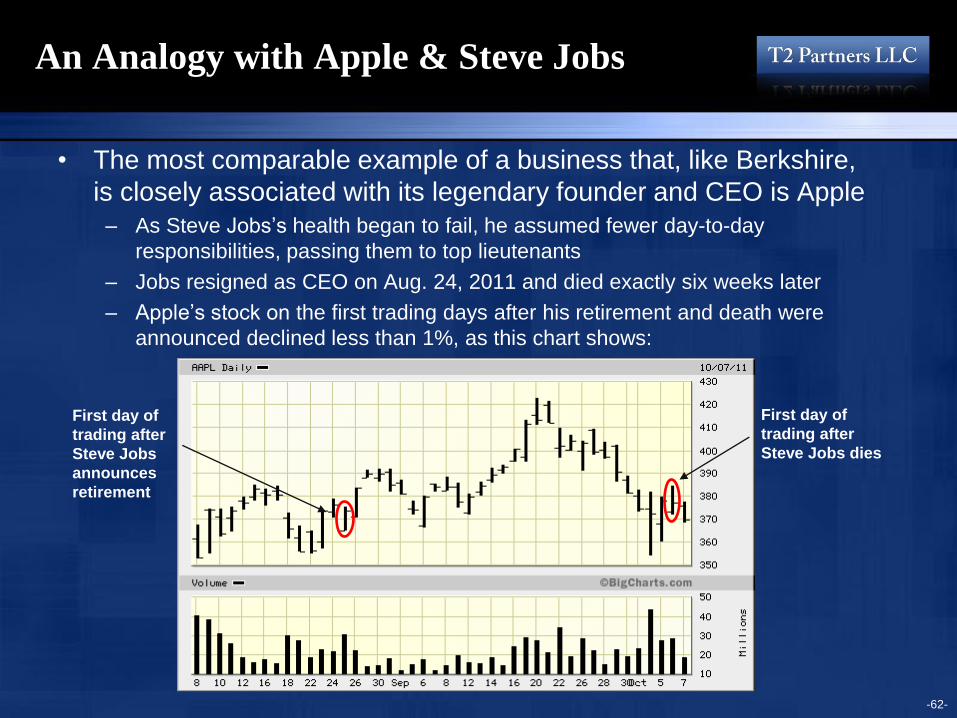
• The most comparable example of a business that, like Berkshire,
is closely associated with its legendary founder and CEO is Apple
– As Steve Jobs’s health began to fail, he assumed fewer day-to-day
responsibilities, passing them to top lieutenants
– Jobs resigned as CEO on Aug. 24, 2011 and died exactly six weeks later
– Apple’s stock on the first trading days after his retirement and death were
announced declined less than 1%, as this chart shows:
First day of
trading after
Steve Jobs
announces
retirement
First day of
trading after
Steve Jobs dies
-63-
Other Risks
• A double-dip recession impacts Berkshire’s earnings materially
• No catalyst occurs, so the stock sits there and doesn’t go up
– Intrinsic value will likely continue to grow nicely
• Berkshire’s stock portfolio declines
• Losses in the shorter-duration derivatives such as credit-default
swaps are larger than expected and/or mark-to-market losses
mount among the equity index puts
• A major super-cat event occurs that costs Berkshire many billions
• Berkshire is downgraded
-64-
Conclusion
• Cheap stock: 67-cent dollar, giving no value to recent
investments and immense optionality
• Extremely safe: huge cash and other assets provide intrinsic
value downside protection, while the new share repurchase
program provides downside protection on the stock
• Strong earnings should eventually act as a catalyst

Our Analysis of Iridium
October 16, 2011
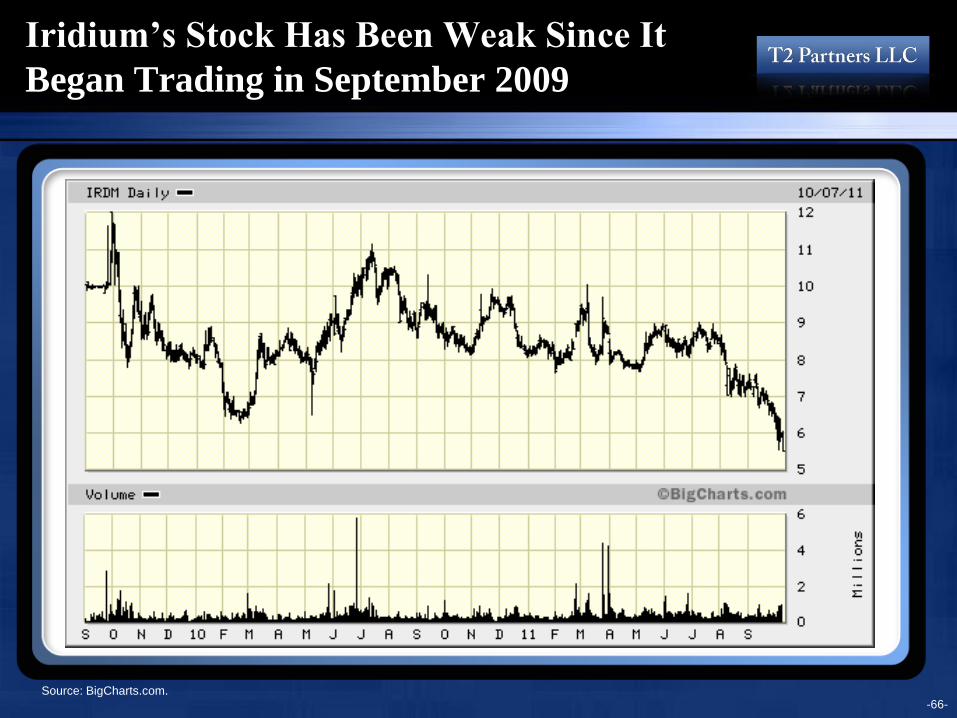
Iridium’s Stock Has Been Weak Since It
Began Trading in September 2009
Source: BigCharts.com. -66-

Overview (1)
• Iridium is the world’s only communication provider with the ability to provide
real-time voice and data communications over 100% of the earth’s service by
virtue of the company’s 66-satellite low-earth orbit (LEO) constellation. In
addition, Iridium is one of the few satellite operators with the ability to provide
effective voice, machine-to-machine (M2M), and high-speed data services.
• One of two major players in Global Satellite Communications industry
• Single subscriber device works worldwide
• Motorola spent $5 billion launching satellites in late 1990s
• Filed for bankruptcy in 1999 with only 50,000 customers due to too much
debt and clunky phones that didn’t work inside buildings
-67-
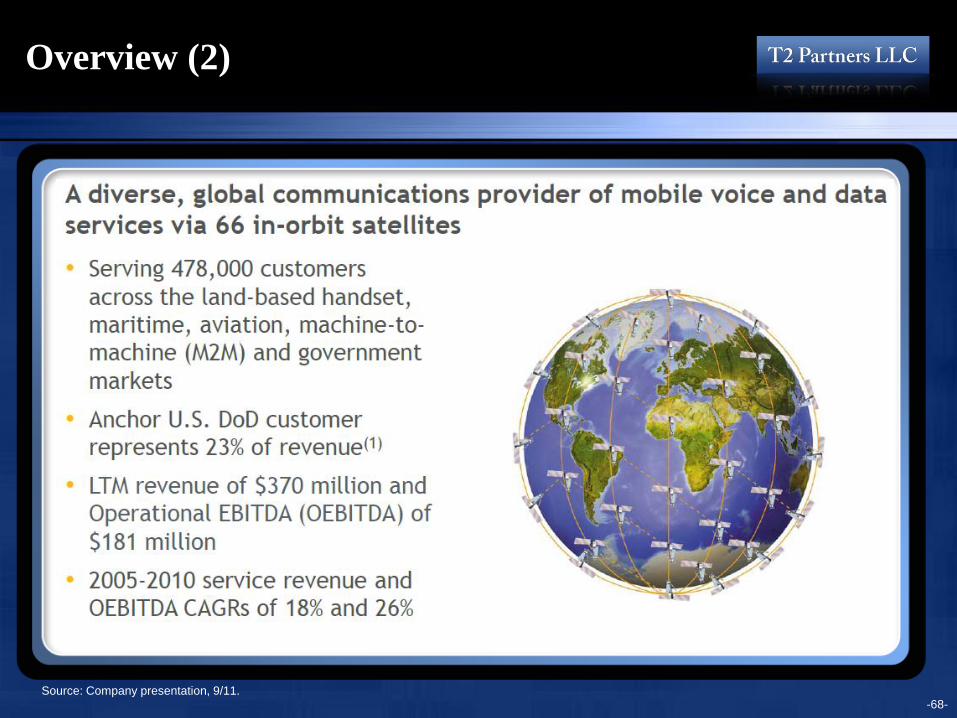
Overview (2)
Source: Company presentation, 9/11. -68-
-69-
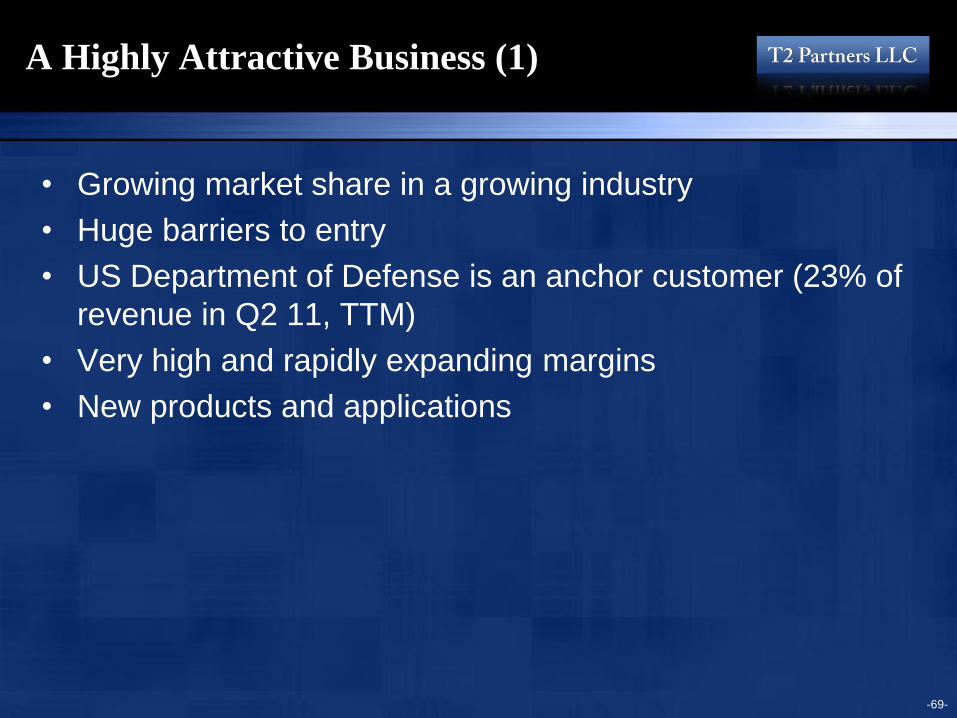
A Highly Attractive Business (1)
• Growing market share in a growing industry
• Huge barriers to entry
• US Department of Defense is an anchor customer (23% of
revenue in Q2 11, TTM)
• Very high and rapidly expanding margins
• New products and applications
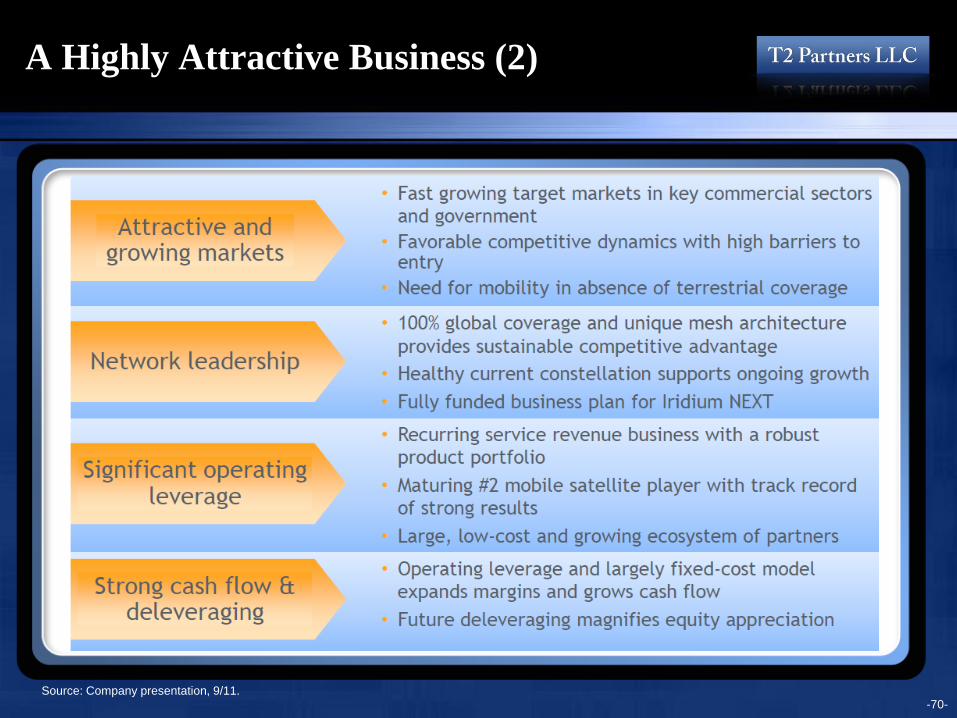
A Highly Attractive Business (2)
Source: Company presentation, 9/11. -70-
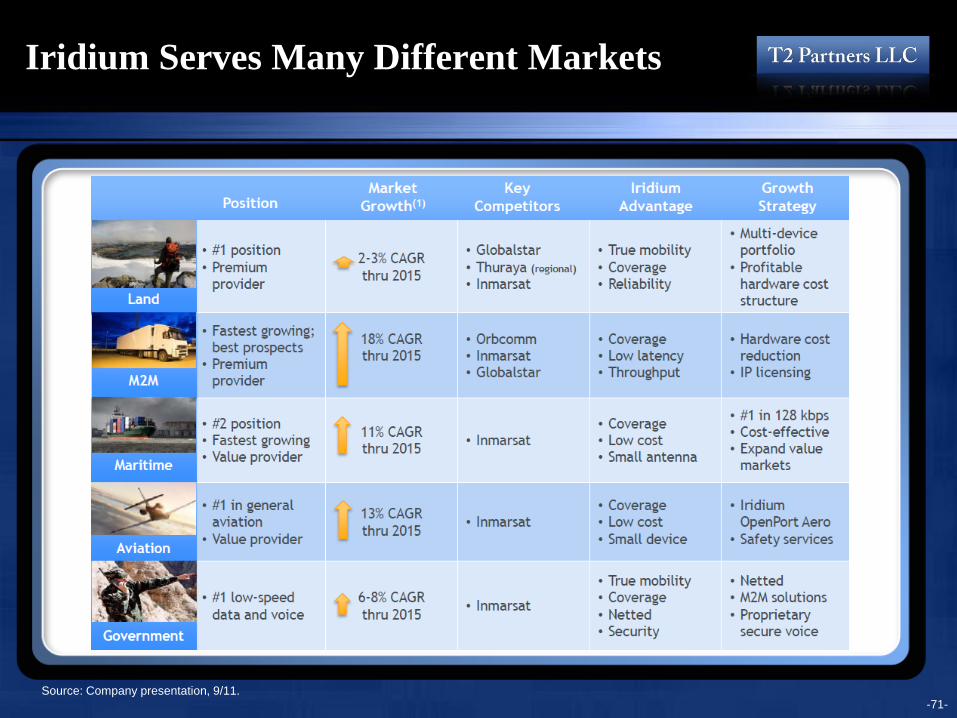
Iridium Serves Many Different Markets
Source: Company presentation, 9/11. -71-
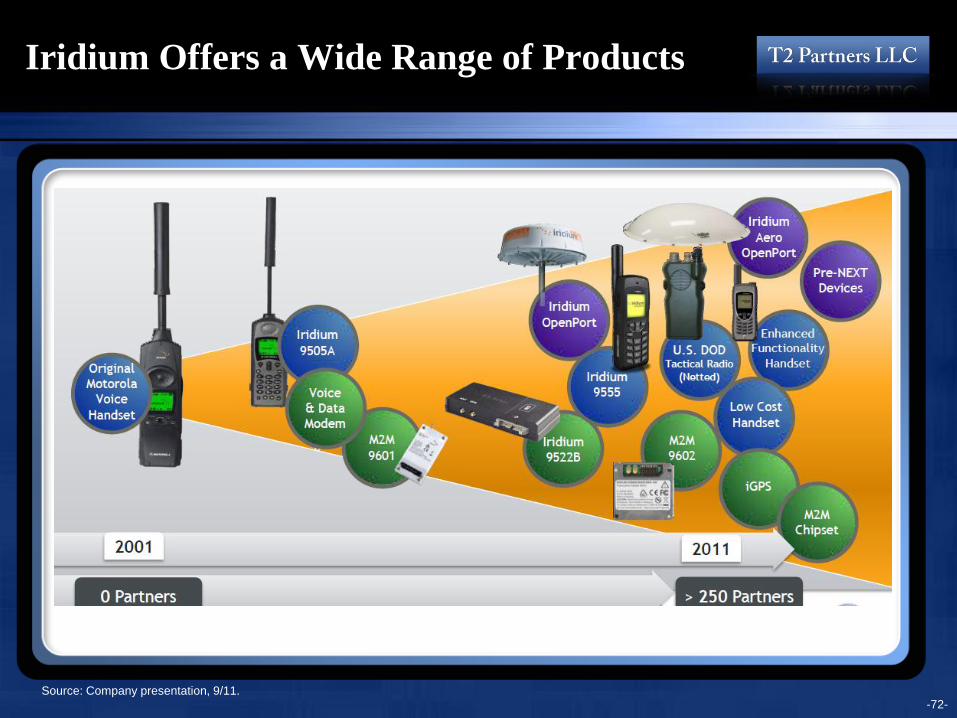
Iridium Offers a Wide Range of Products
Source: Company presentation, 9/11. -72-
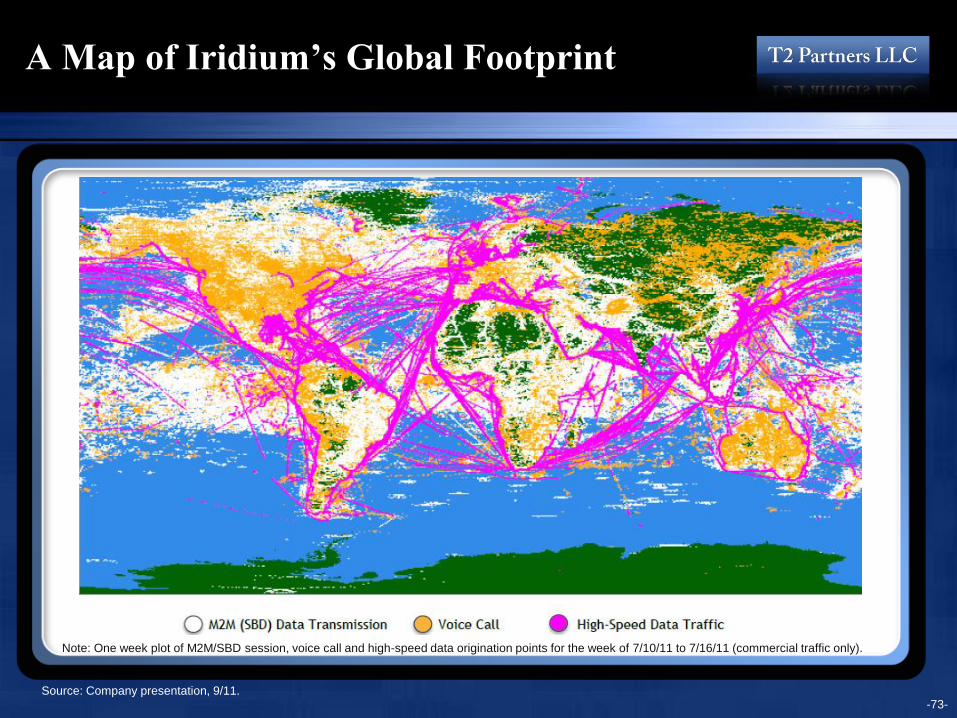
A Map of Iridium’s Global Footprint
Source: Company presentation, 9/11. -73-
Note: One week plot of M2M/SBD session, voice call and high-speed data origination points for the week of 7/10/11 to 7/16/11 (commercial traffic only).
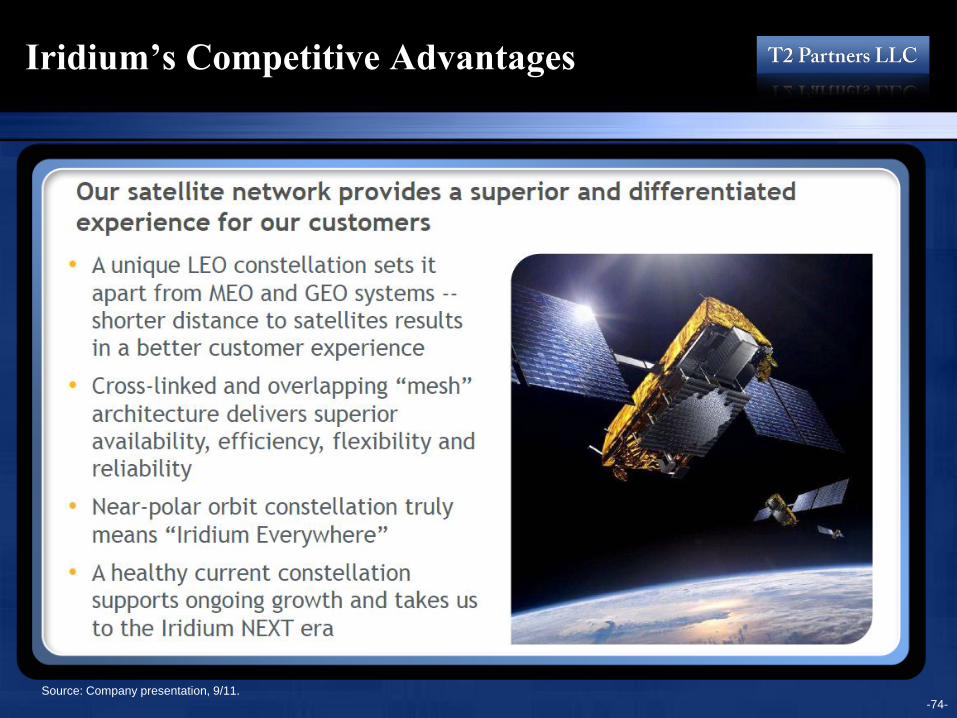
Iridium’s Competitive Advantages
Source: Company presentation, 9/11. -74-
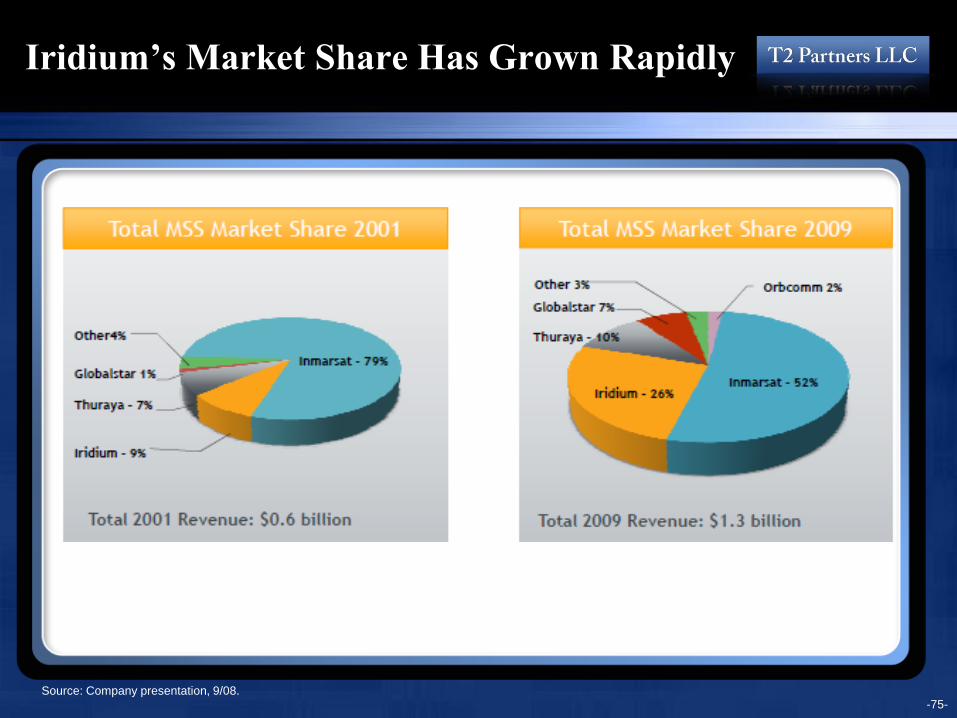
Iridium’s Market Share Has Grown Rapidly
Source: Company presentation, 9/08. -75-

Iridium Has Shown Strong Growth
in Subscribers Finished Q2 With 478,000 total billable subscribers, up 25% YOY
Source: Company presentation, 9/11. -76-
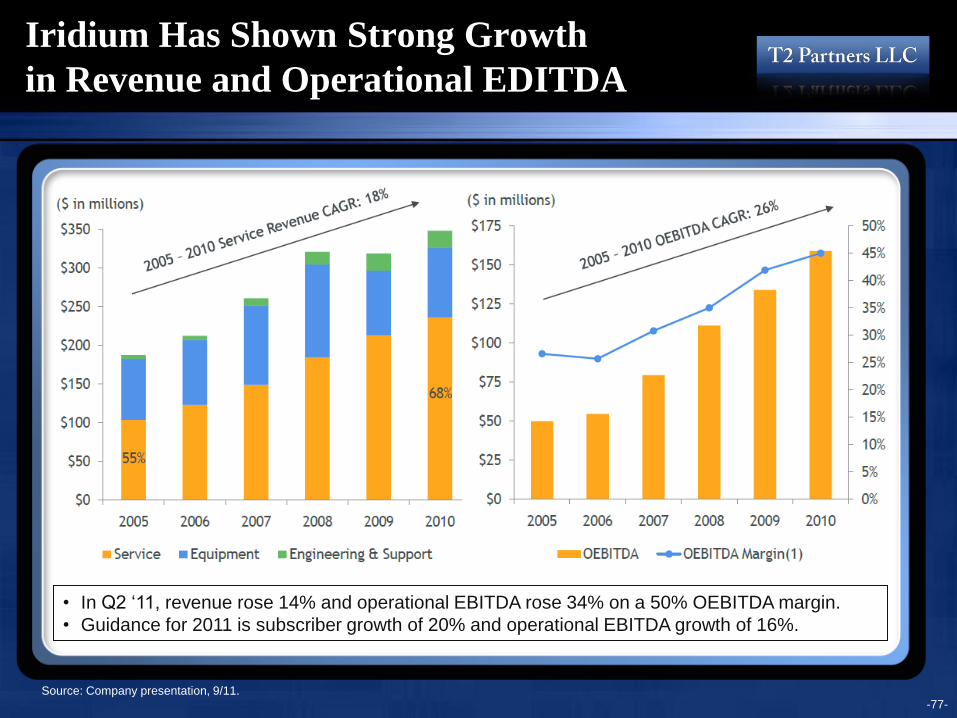
Iridium Has Shown Strong Growth
in Revenue and Operational EDITDA
Source: Company presentation, 9/11.
• In Q2 ‘11, revenue rose 14% and operational EBITDA rose 34% on a 50% OEBITDA margin.
• Guidance for 2011 is subscriber growth of 20% and operational EBITDA growth of 16%.
-77-
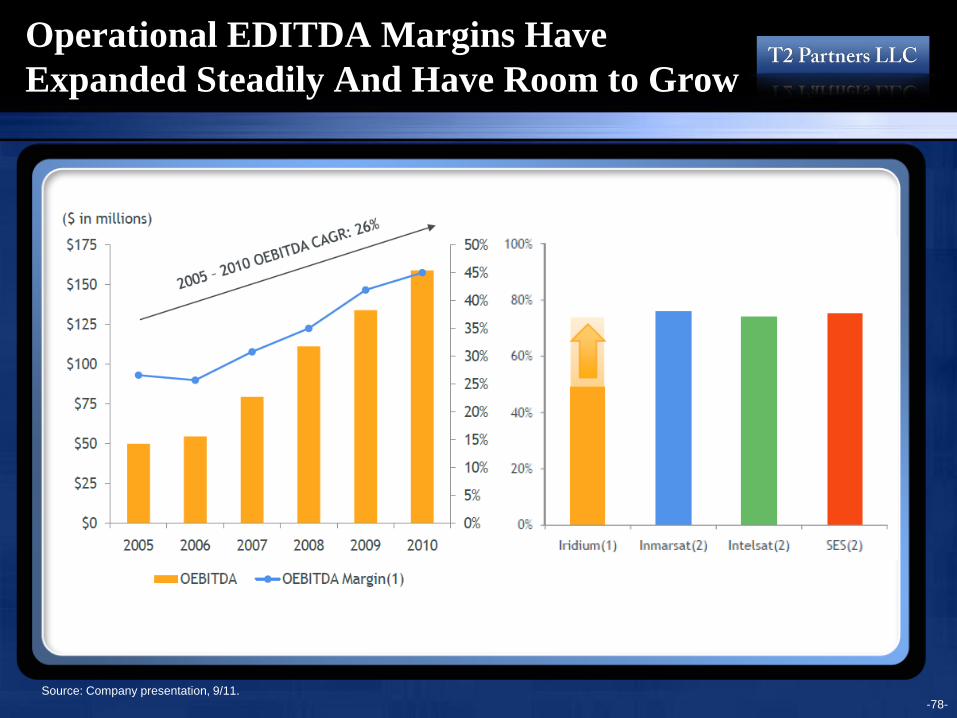
Operational EDITDA Margins Have
Expanded Steadily And Have Room to Grow
Source: Company presentation, 9/11. -78-
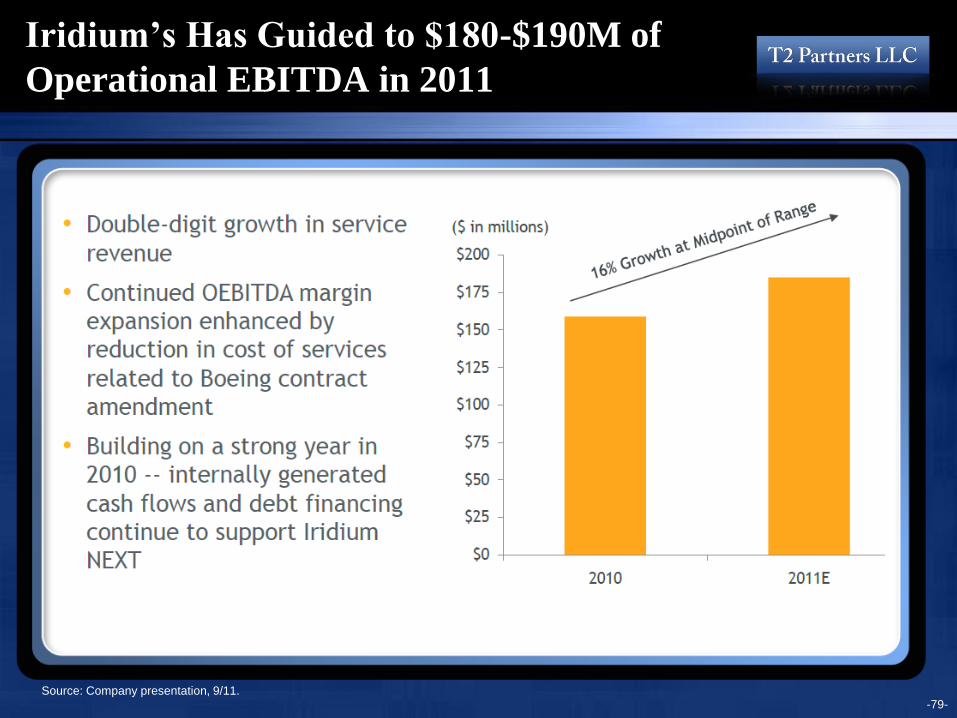
Iridium’s Has Guided to $180-$190M of
Operational EBITDA in 2011
Source: Company presentation, 9/11. -79-
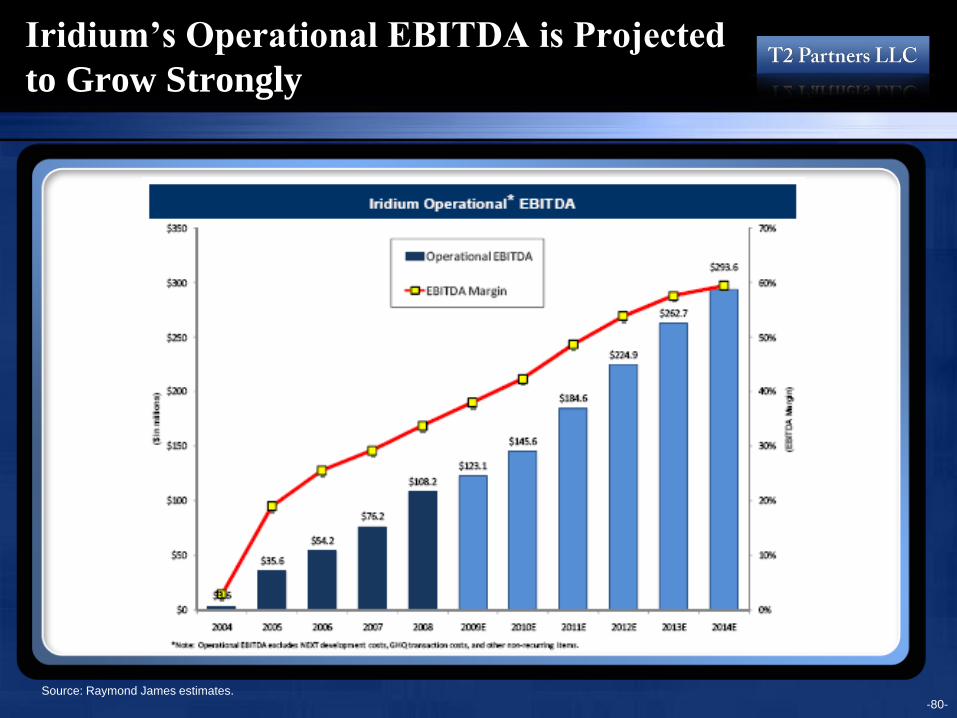
Iridium’s Operational EBITDA is Projected
to Grow Strongly
Source: Raymond James estimates. -80-
Iridium NEXT
• Current satellite constellation will need to be replaced
– Scheduled deployment between early 2015 and 2017
– Backwards compatible (existing customers will not need to
replace equipment)
– Improved capacity and data rates: 9x improvement in throughput
and 125x improvement in memory capacity
• Total cost: $3.0 billion
– Satellites: $2.0 billion
– Launch: $0.7 billion
– Other: $0.3 billion
• Funding
– Internally generated cash flow
– Debt
– Equity
– Revenue offsets (hosted payloads) -81-
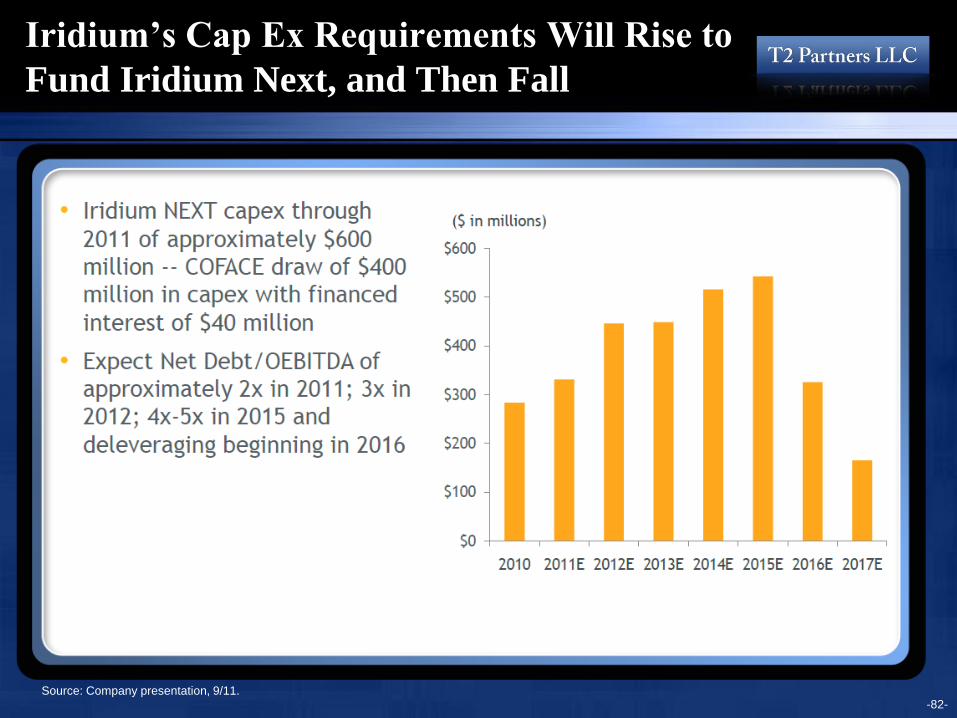
Iridium’s Cap Ex Requirements Will Rise to
Fund Iridium Next, and Then Fall
Source: Company presentation, 9/11. -82-
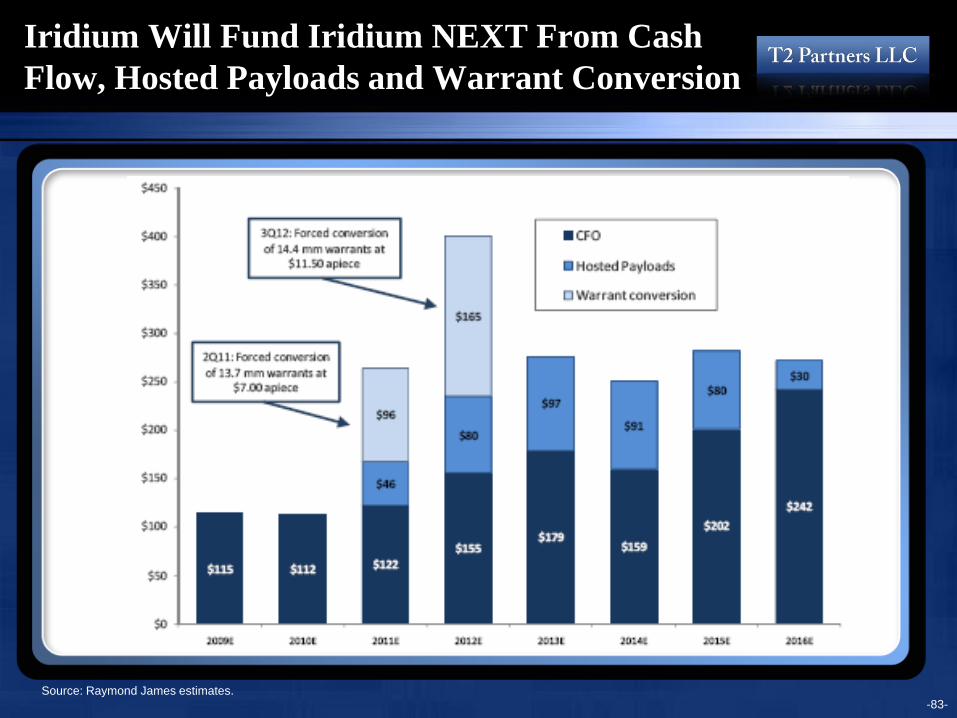
Iridium Will Fund Iridium NEXT From Cash
Flow, Hosted Payloads and Warrant Conversion
Source: Raymond James estimates. -83-
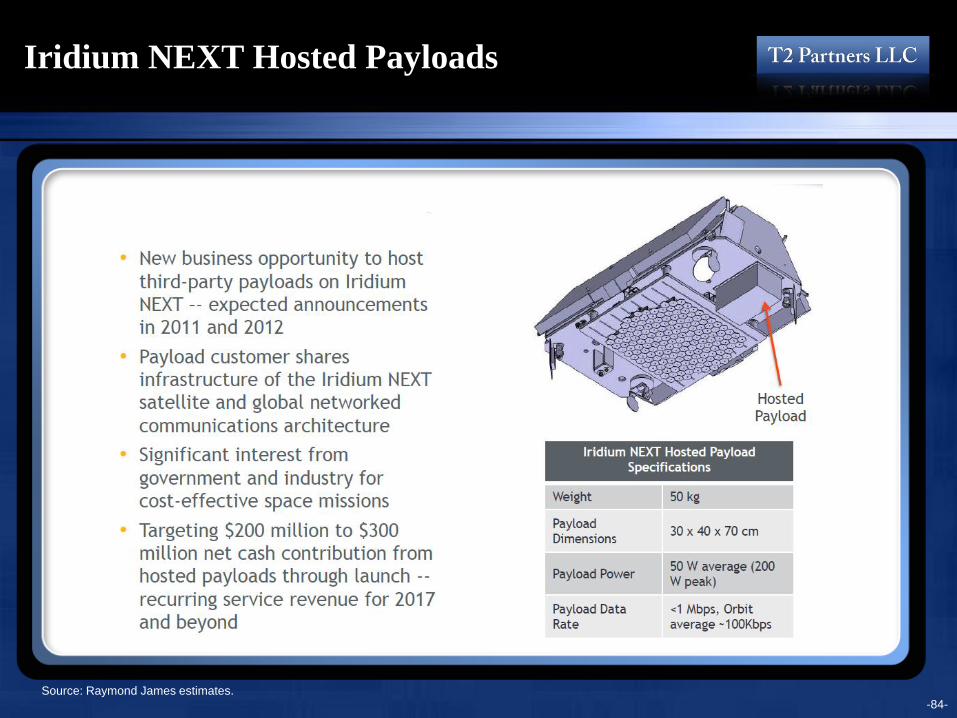
Iridium NEXT Hosted Payloads
Source: Raymond James estimates. -84-
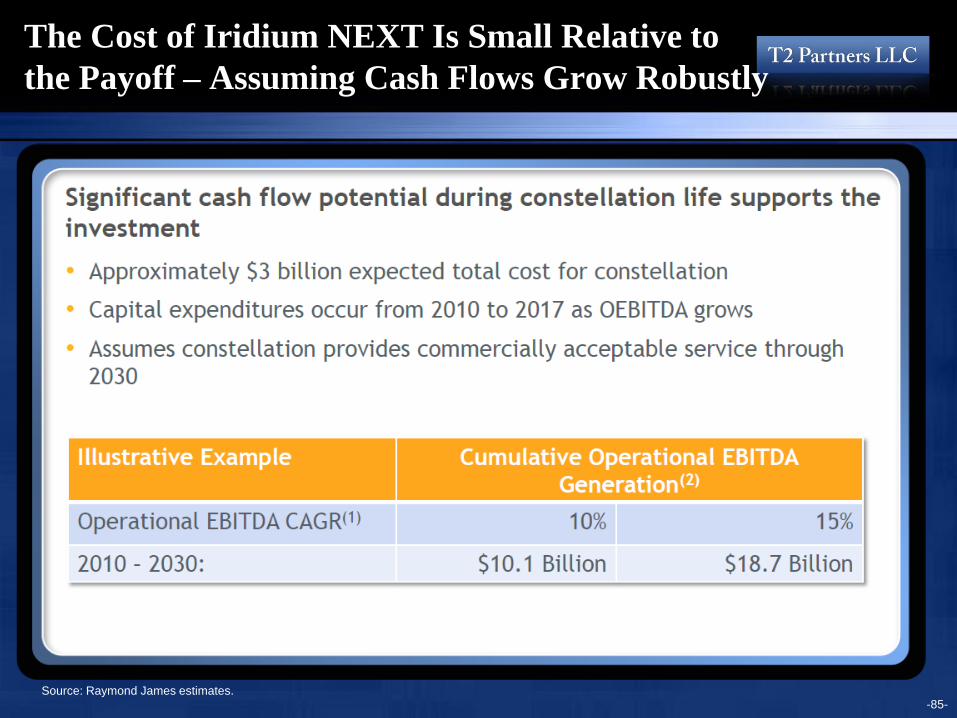
The Cost of Iridium NEXT Is Small Relative to
the Payoff – Assuming Cash Flows Grow Robustly
Source: Raymond James estimates. -85-
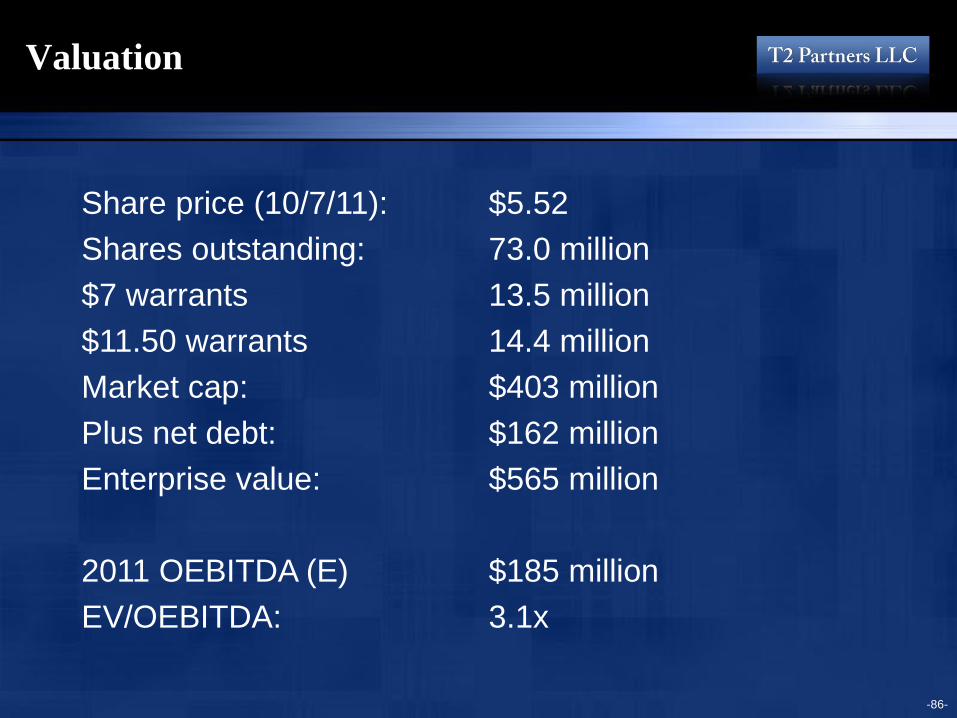
Valuation
Share price (10/7/11): $5.52
Shares outstanding: 73.0 million
$7 warrants 13.5 million
$11.50 warrants 14.4 million
Market cap: $403 million
Plus net debt: $162 million
Enterprise value: $565 million
2011 OEBITDA (E) $185 million
EV/OEBITDA: 3.1x
-86-
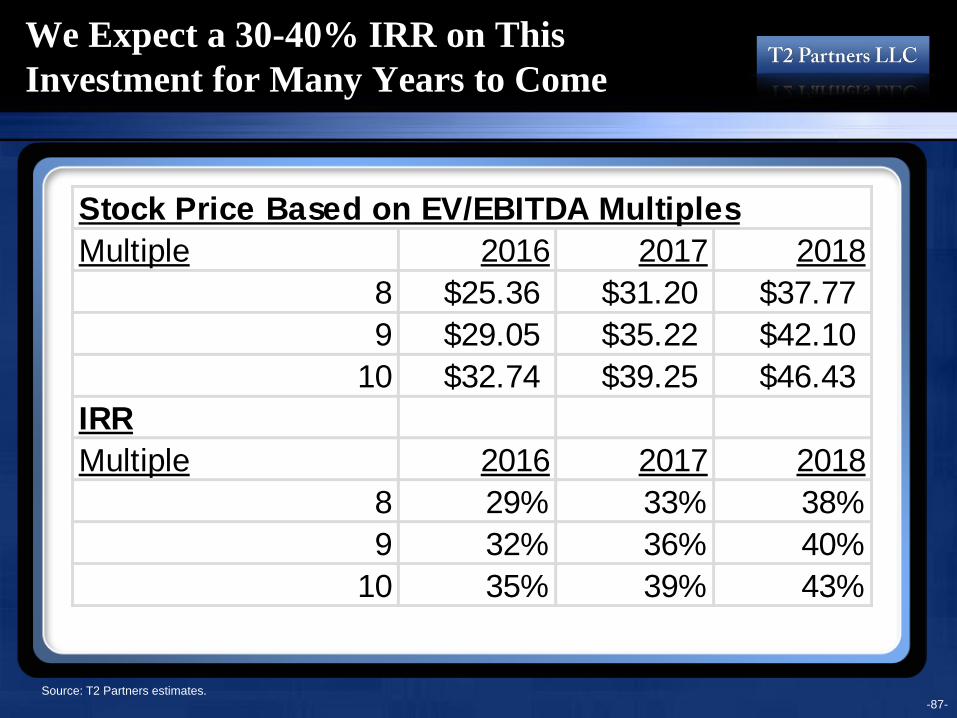
We Expect a 30-40% IRR on This
Investment for Many Years to Come
Source: T2 Partners estimates. -87-
Stock Price Based on EV/EBITDA Multiples
Multiple 2016 2017 2018
8 $25.36 $31.20 $37.77
9 $29.05 $35.22 $42.10
10 $32.74 $39.25 $46.43
IRR
Multiple 2016 2017 2018
8 29% 33% 38%
9 32% 36% 40%
10 35% 39% 43%

Summary of Iridium’s Q1 ‘11 Earnings
Report
Source: Company presentation, 9/11. -88-
Our Analysis of Howard Hughes Corp.
May 1, 2012
-90-
The Howard Hughes Corp.: A Snapshot
• HHC owns, manages and develops commercial, residential
and mixed-use real estate across the U.S.
• HHC properties include master planned communities,
operating properties, and development opportunities in 18
states
• HHC was spun out of General Growth Properties on
November 9, 2010 through the distribution of HHC stock to
holders of GGP stock
• REIT structure is not ideal for owning development assets,
master planned communities (‘MPCs'), and assets whose
current cash flows do not reflect future potential
• We believe that HHC has undervalued, high-quality real
estate assets in premier locations
-91-
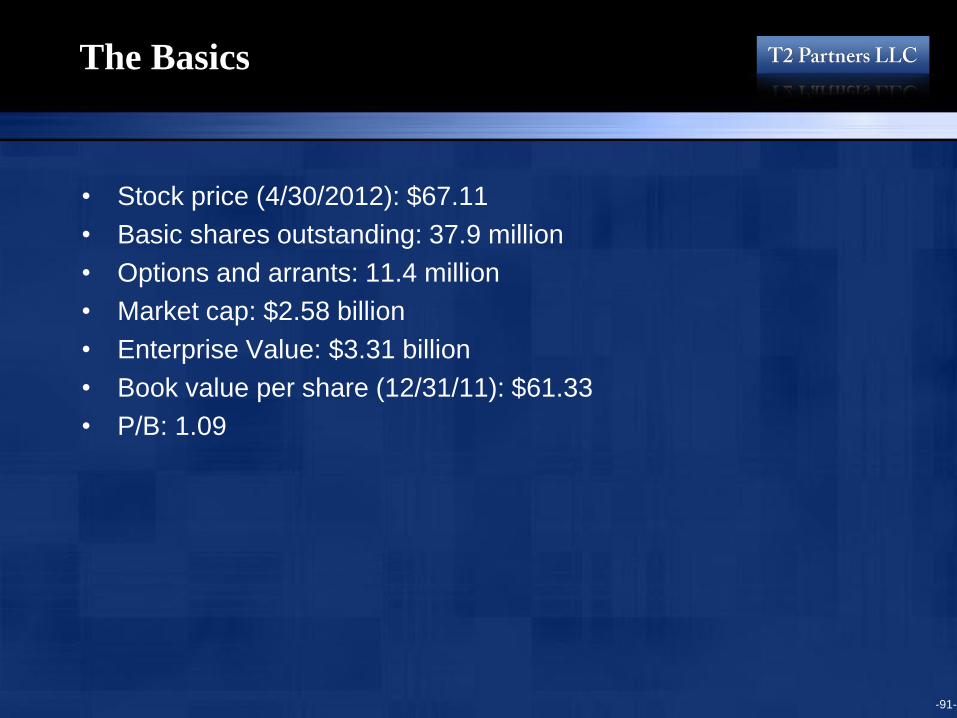
The Basics
• Stock price (4/30/2012): $67.11
• Basic shares outstanding: 37.9 million
• Options and arrants: 11.4 million
• Market cap: $2.58 billion
• Enterprise Value: $3.31 billion
• Book value per share (12/31/11): $61.33
• P/B: 1.09

-92-
A Classic Spinoff Situation
HHC spinoff characteristics
• Spun out of a reorg situation
• No research coverage (but for how
long?)
• Underfollowed by the investment
community
• Certain GGP investors are not able
to own HHC
• HHC’s assets are now the 100%
focus of HHC’s management, rather
than overlooked assets within GGP
• Insiders are highly incentivized
• We believe many value-creating
opportunities can be tapped
-93-
World Class Management and Board,
With Interests Aligned With Shareholders
• Insiders own close to 50% of stock including warrants
• Personal financial commitment: New CEO David Weinreb
purchased $15M of warrants; President Grant Herlitz
purchased $2M of warrants
• In addition to the GGP distribution, the plan sponsors
(Brookfield, Fairholme, Pershing Square, and Blackstone)
purchased 5.25 million additional shares for $250 million
• Major HHC shareholders: General Trust Company (11.2%),
Brookfield* (6.39%), Pershing Square* (9.4%), Paulson & Co.
(4.1%)
• Management and board have a wealth of experience and a
superb track record in managing, developing and investing in
real estate
• Each asset will be examined to extract maximum value
-94-
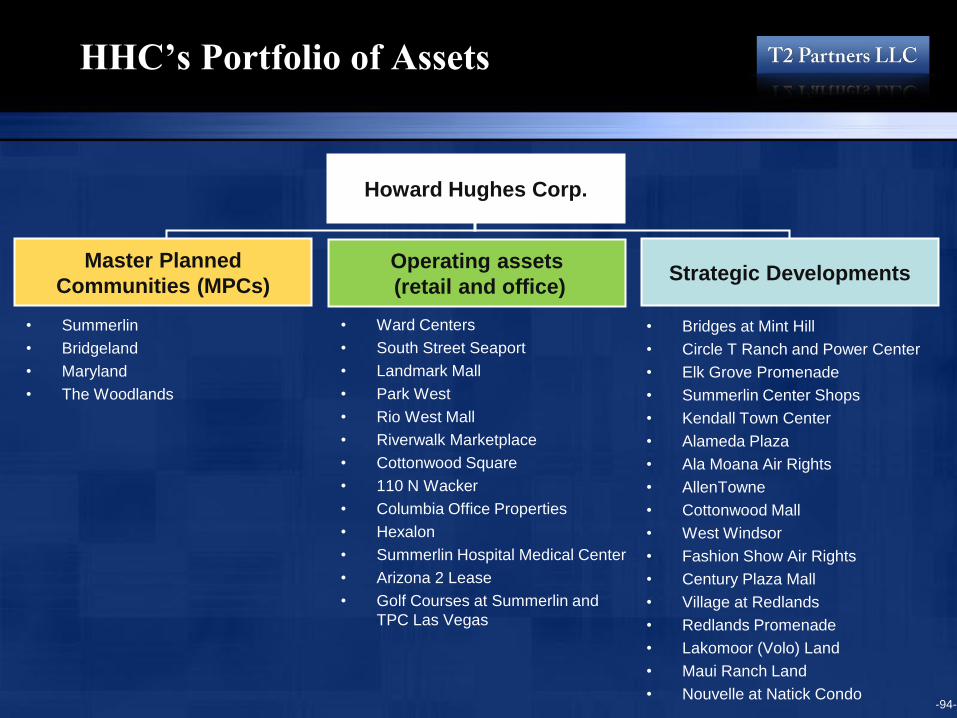
HHC’s Portfolio of Assets
Master Planned
Communities (MPCs) Strategic Developments
Operating assets
(retail and office)
Howard Hughes Corp.
• Summerlin
• Bridgeland
• Maryland
• The Woodlands
• Ward Centers
• South Street Seaport
• Landmark Mall
• Park West
• Rio West Mall
• Riverwalk Marketplace
• Cottonwood Square
• 110 N Wacker
• Columbia Office Properties
• Hexalon
• Summerlin Hospital Medical Center
• Arizona 2 Lease
• Golf Courses at Summerlin and
TPC Las Vegas
• Bridges at Mint Hill
• Circle T Ranch and Power Center
• Elk Grove Promenade
• Summerlin Center Shops
• Kendall Town Center
• Alameda Plaza
• Ala Moana Air Rights
• AllenTowne
• Cottonwood Mall
• West Windsor
• Fashion Show Air Rights
• Century Plaza Mall
• Village at Redlands
• Redlands Promenade
• Lakomoor (Volo) Land
• Maui Ranch Land
• Nouvelle at Natick Condo
-95-
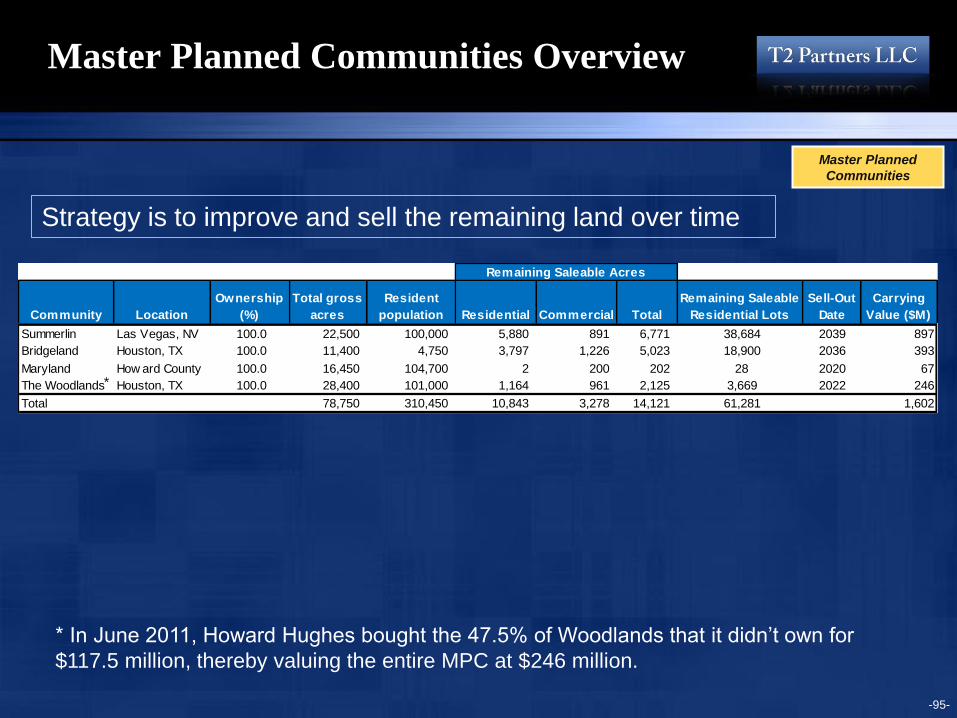
Master Planned Communities Overview
Master Planned
Communities
Strategy is to improve and sell the remaining land over time
* In June 2011, Howard Hughes bought the 47.5% of Woodlands that it didn’t own for
$117.5 million, thereby valuing the entire MPC at $246 million.
Community Location
Ownership
(%)
Total gross
acres
Resident
population Residential Commercial Total
Remaining Saleable
Residential Lots
Sell-Out
Date
Carrying
Value ($M)
Summerlin Las Vegas, NV 100.0 22,500 100,000 5,880 891 6,771 38,684 2039 897
Bridgeland Houston, TX 100.0 11,400 4,750 3,797 1,226 5,023 18,900 2036 393
Maryland How ard County 100.0 16,450 104,700 2 200 202 28 2020 67
The Woodlands Houston, TX 100.0 28,400 101,000 1,164 961 2,125 3,669 2022 246
Total 78,750 310,450 10,843 3,278 14,121 61,281 1,602
Remaining Saleable Acres
*
-96-
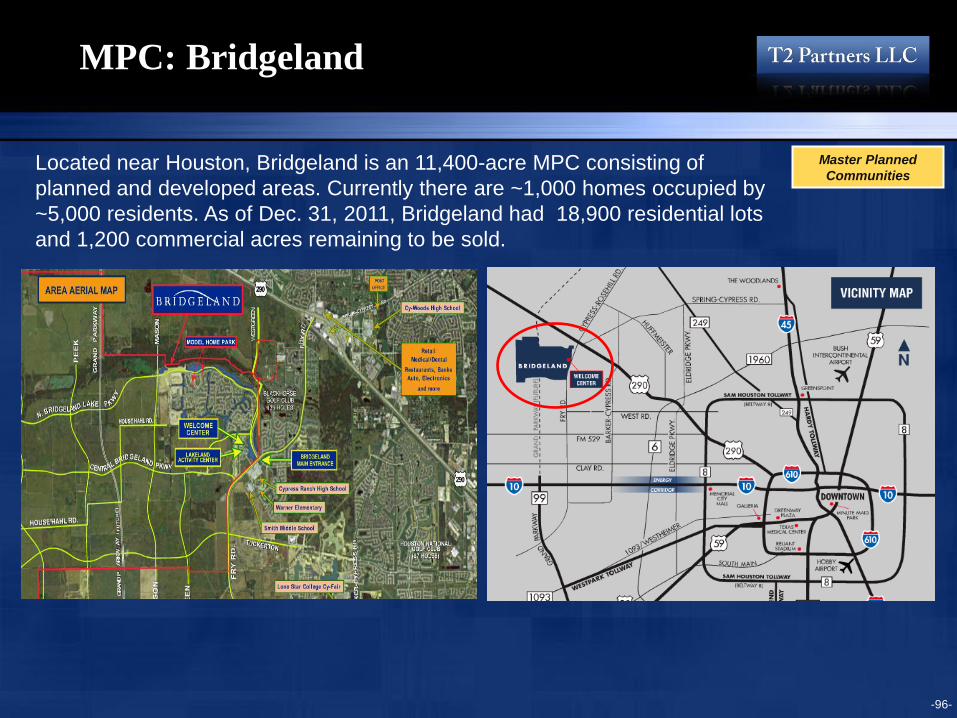
MPC: Bridgeland
Master Planned
Communities Located near Houston, Bridgeland is an 11,400-acre MPC consisting of
planned and developed areas. Currently there are ~1,000 homes occupied by
~5,000 residents. As of Dec. 31, 2011, Bridgeland had 18,900 residential lots
and 1,200 commercial acres remaining to be sold.
-97-
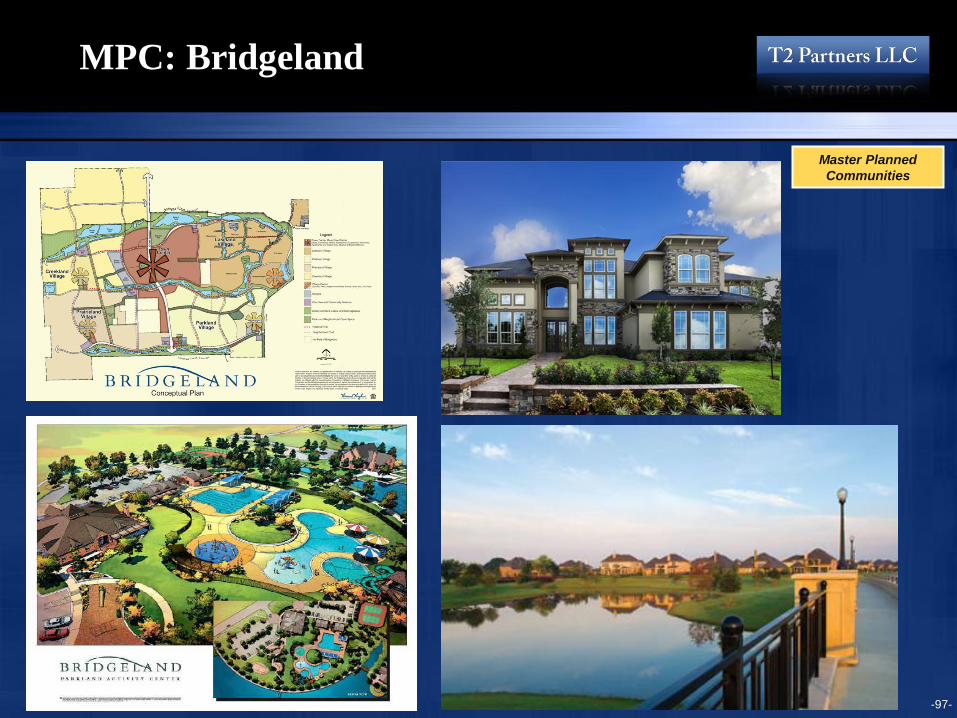
MPC: Bridgeland
Master Planned
Communities
-98-
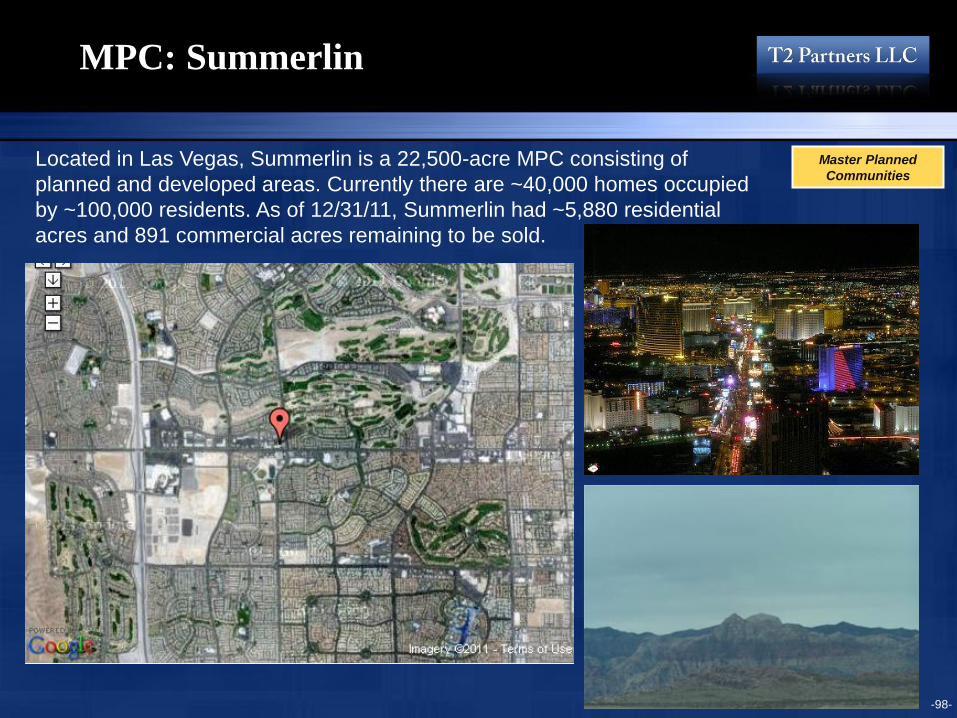
MPC: Summerlin
Master Planned
Communities Located in Las Vegas, Summerlin is a 22,500-acre MPC consisting of
planned and developed areas. Currently there are ~40,000 homes occupied
by ~100,000 residents. As of 12/31/11, Summerlin had ~5,880 residential
acres and 891 commercial acres remaining to be sold.
-99-
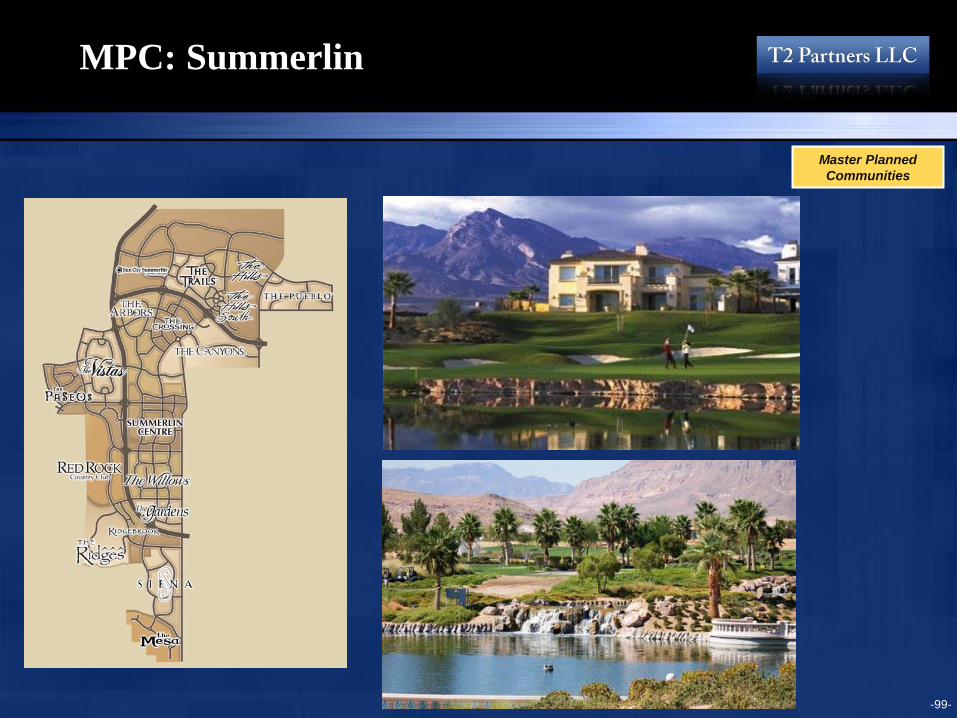
MPC: Summerlin
Master Planned
Communities
-100-
MPCs Valuation: Summerlin
* Based on management estimate of the total value of MPCs of $3.3B as of 12/31/07 (GGP Q3’08 operating supplement)
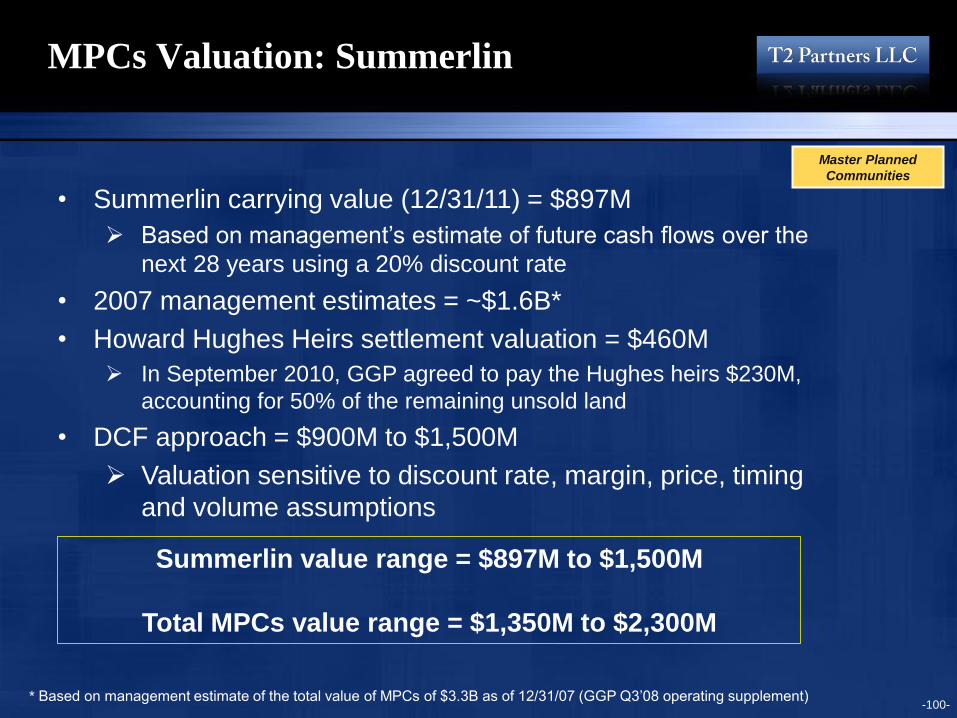
• Summerlin carrying value (12/31/11) = $897M
Based on management’s estimate of future cash flows over the
next 28 years using a 20% discount rate
• 2007 management estimates = ~$1.6B*
• Howard Hughes Heirs settlement valuation = $460M
In September 2010, GGP agreed to pay the Hughes heirs $230M,
accounting for 50% of the remaining unsold land
• DCF approach = $900M to $1,500M
Valuation sensitive to discount rate, margin, price, timing
and volume assumptions
Master Planned
Communities
Summerlin value range = $897M to $1,500M
Total MPCs value range = $1,350M to $2,300M

-101-
Operating Asset Portfolio
Operating assets
• Like the MPCs, the
operating assets are
difficult to value but our
analysis indicates that
the carrying value
significantly understates
the true value of these
assets
Opportunity to redevelop or reposition these assets over time
Property Location
Existing GLA
(sq ft)
Size
(Acres) 2011 NOI ($M)
Net book
value ($M) Description
Ward Centers Honolulu, HI 1,004,781 60 21.5 348.8 Entertainment retail complex and future mixed use development
Park West Peoria, AZ 249,168 48 0.6 79.6 Entertainment retail complex and future mixed use development
Landmark Mall Alexandria, VA 440,325 22 0.7 23.8 Retail complex and future major mixed use development
20/25 Waterw ay Ave. The Woodlands, TX 49,972 1 1.3 12.2 Tw o retail properties in The Woodlands Tow n Center
Riverw alk Marketplace New Orleans, LA 193,874 11 0.4 12.0 Shopping Center
Rio West Mall Gallup, NM 333,077 50 1.3 11.0 Shopping Center
Waterw ay Garage Retail The Woodlands, TX 21,260 -- 0.0 9.4 Attached to The Waterw ay Sq. Garage in Woodlands Tow n Ctr
South Street Seaport New York, NY 301,086 11 5.7 5.9 Retail space and future mixed use development
Cottonw ood Square Salt Lake City, UT 77,079 21 0.4 5.1 Community Center
Total 2,670,622 224 31.9 507.8
Assets
Economic
Ownership
Property
Type Sq. ft./Keys % Leased
Net book
value ($M)
4 Waterw ay Sq. 100% Office 218,551 98.8% 59.0
The Woodlands Resort & Conf. Ctr. 100% Hotel 440 keys 47.8
Columbia Office Properties 100% Office 300,000 89.3% 29.5
110 N. Wacker (Chicago) 100% Office 226,000 100.0% 23.6
Millennium Waterw ay Apartments 84% Apartments 393 keys 95.0% 22.0
The Club at Carlton Woods 100% Country Club 36 holes 14.6
9303 New Trails 100% Office 97,705 100.0% 14.5
Forest View /Timbermill Apartments 50% Apartments 472 keys 94.5% 11.7
1400 Woodloch Forest 100% Office 95,667 98.1% 11.6
Head Acquisition (Hexalon) 1% Retail 5.4
Summerlin Hospital Medical Center 7% Hospital 4.1
2201 Lake Woodlands Dr. 100% Office 24,024 100.0% 4.0
Stew art Title of Montgomery Co. 50% Title Company 3.6
The Woodlands Parking Garages 100% Garage 2,988 spaces 3.3
Woodlands Sarofim #1 Ltd. 20% Industrial 132,050 93.0% 2.5
Arizona 2 Office Lease 100% Note n.a.
Golf Courses at Summerlin & TPC LV Participation Golf 2.3
Total 259.5
-102-
Operating Asset: Ward Centers
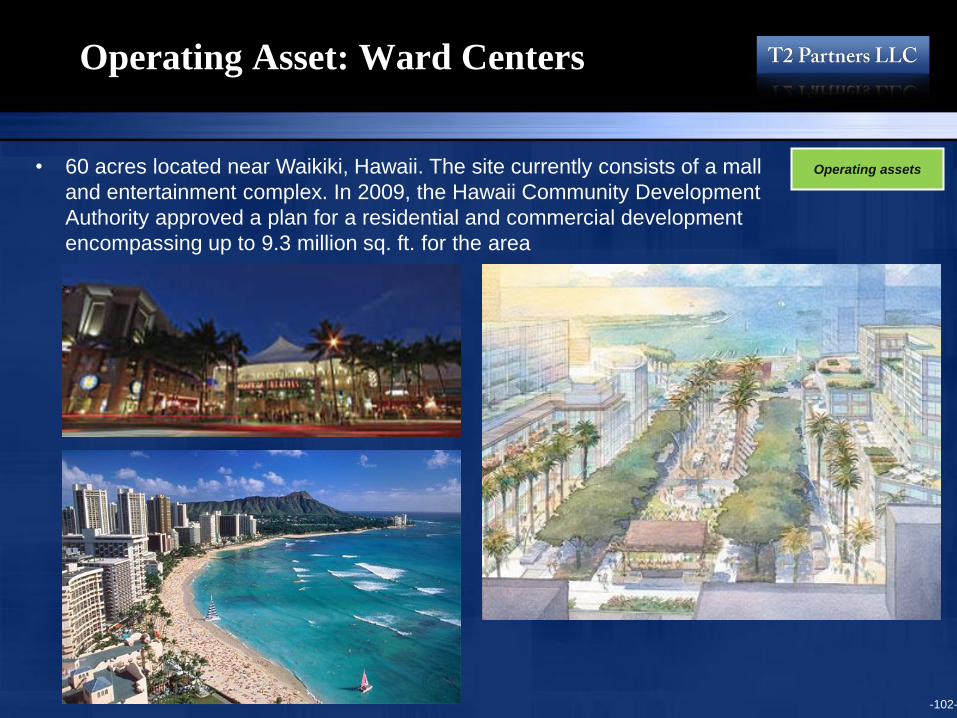
• 60 acres located near Waikiki, Hawaii. The site currently consists of a mall
and entertainment complex. In 2009, the Hawaii Community Development
Authority approved a plan for a residential and commercial development
encompassing up to 9.3 million sq. ft. for the area
Operating assets
-103-
Comparables to Consider When Thinking
About Ward’s Potential Value
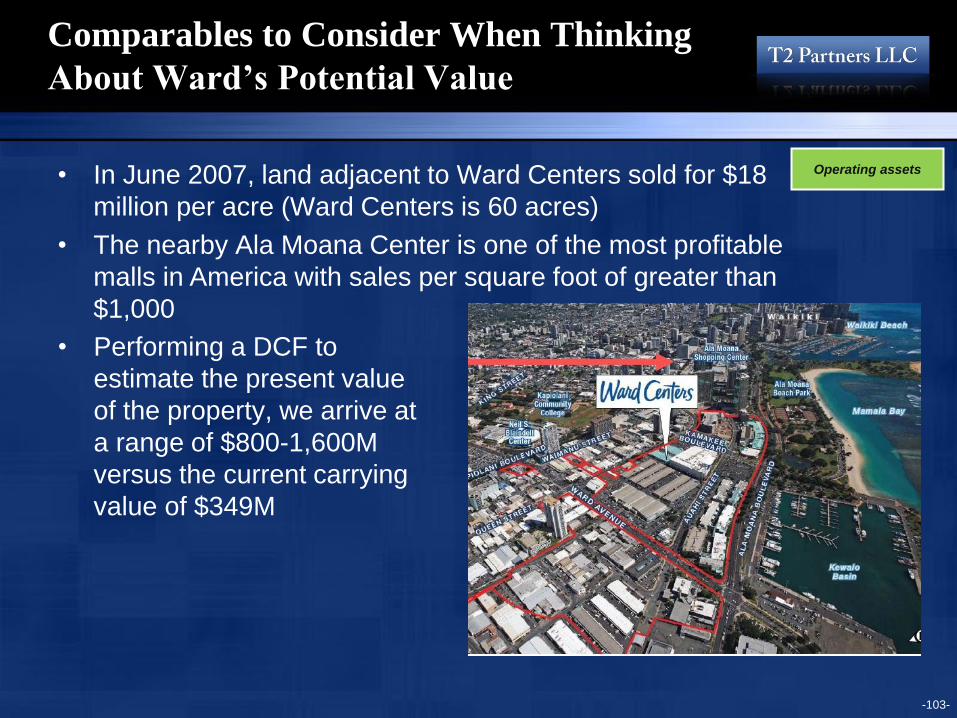
• In June 2007, land adjacent to Ward Centers sold for $18
million per acre (Ward Centers is 60 acres)
• The nearby Ala Moana Center is one of the most profitable
malls in America with sales per square foot of greater than
$1,000
Operating assets
• Performing a DCF to
estimate the present value
of the property, we arrive at
a range of $800-1,600M
versus the current carrying
value of $349M
-104-
Landmark Mall
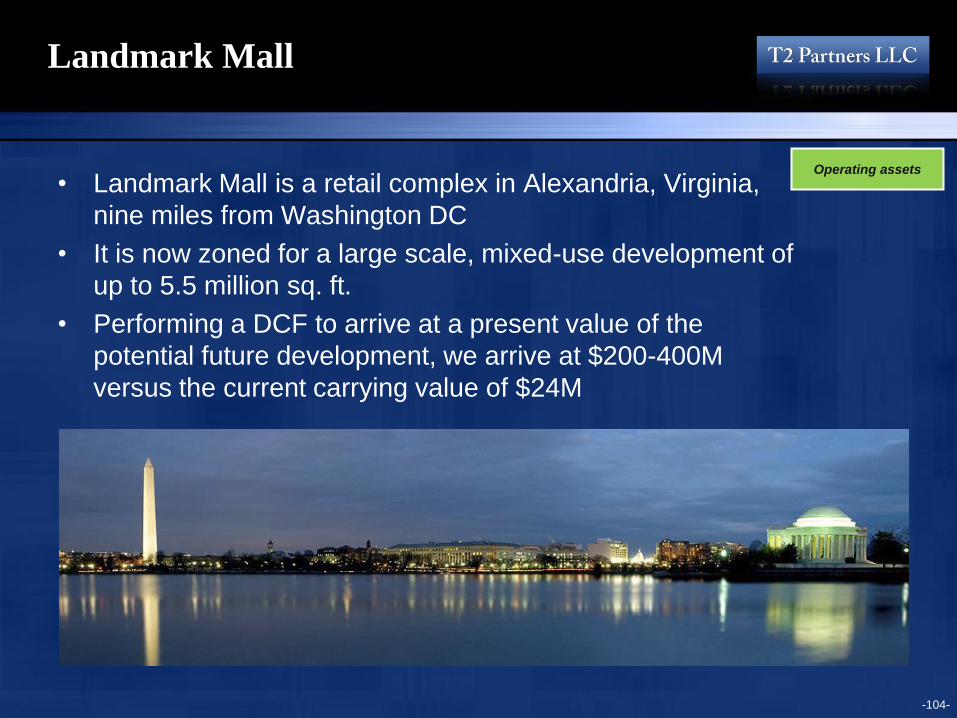
• Landmark Mall is a retail complex in Alexandria, Virginia,
nine miles from Washington DC
• It is now zoned for a large scale, mixed-use development of
up to 5.5 million sq. ft.
• Performing a DCF to arrive at a present value of the
potential future development, we arrive at $200-400M
versus the current carrying value of $24M
Operating assets
-105-
South Street Seaport
Operating assets
• Three historic buildings and a pavilion shopping mall,
located on the river in lower Manhattan
• One of the top five most visited sites in New York City.
• An 11-acre site, portions of which are master leased by
Howard Hughes from the City of New York on a long term
basis. Howard Hughes manages 301,086 square feet of gross
leaseable area, which generated $5.65 million of NOI in 2011
and is carried on HHC's books at $5.9 million
• A major redevelopment is underway that is expected to include
hotels, restaurants, residential towers, and retail and
entertainment space
• Performing a DCF to estimate present value of a potential
future development, we arrive at $150-300M versus the current
carrying value of $6M
-106-
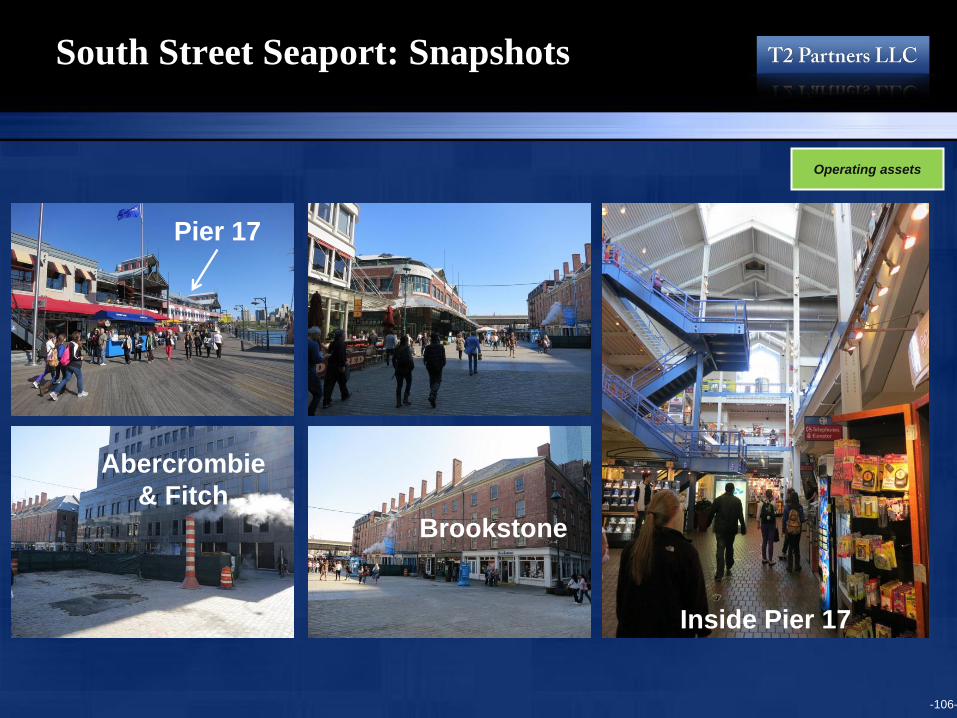
South Street Seaport: Snapshots
Pier 17
Inside Pier 17
Abercrombie
& Fitch
Brookstone
Operating assets
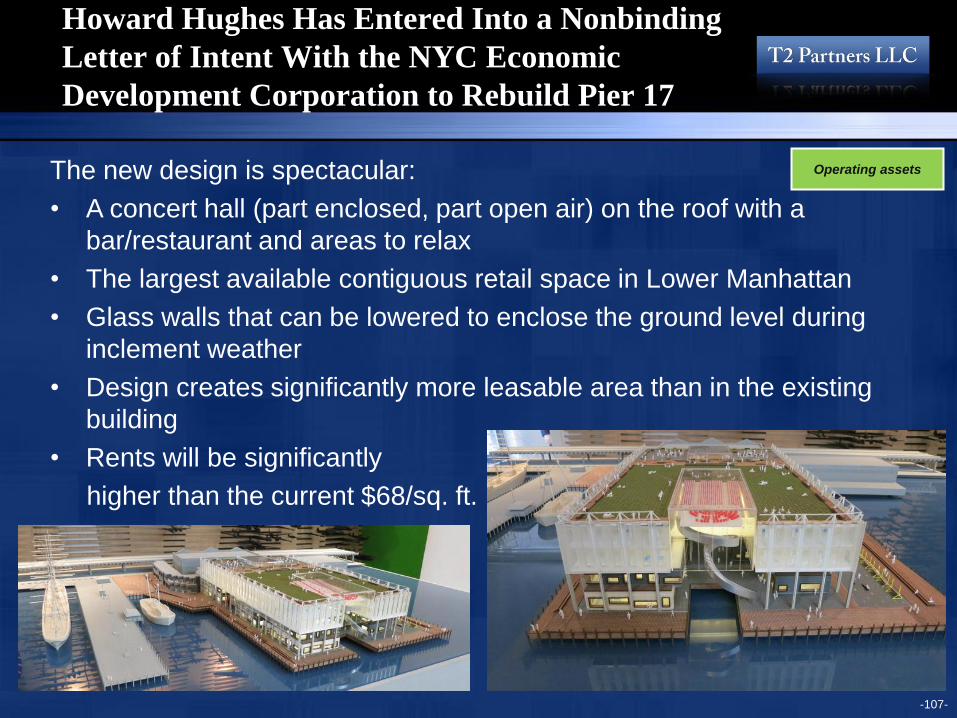
Howard Hughes Has Entered Into a Nonbinding
Letter of Intent With the NYC Economic
Development Corporation to Rebuild Pier 17
-107-
The new design is spectacular:
• A concert hall (part enclosed, part open air) on the roof with a
bar/restaurant and areas to relax
• The largest available contiguous retail space in Lower Manhattan
• Glass walls that can be lowered to enclose the ground level during
inclement weather
• Design creates significantly more leasable area than in the existing
building
• Rents will be significantly
higher than the current $68/sq. ft.
Operating assets
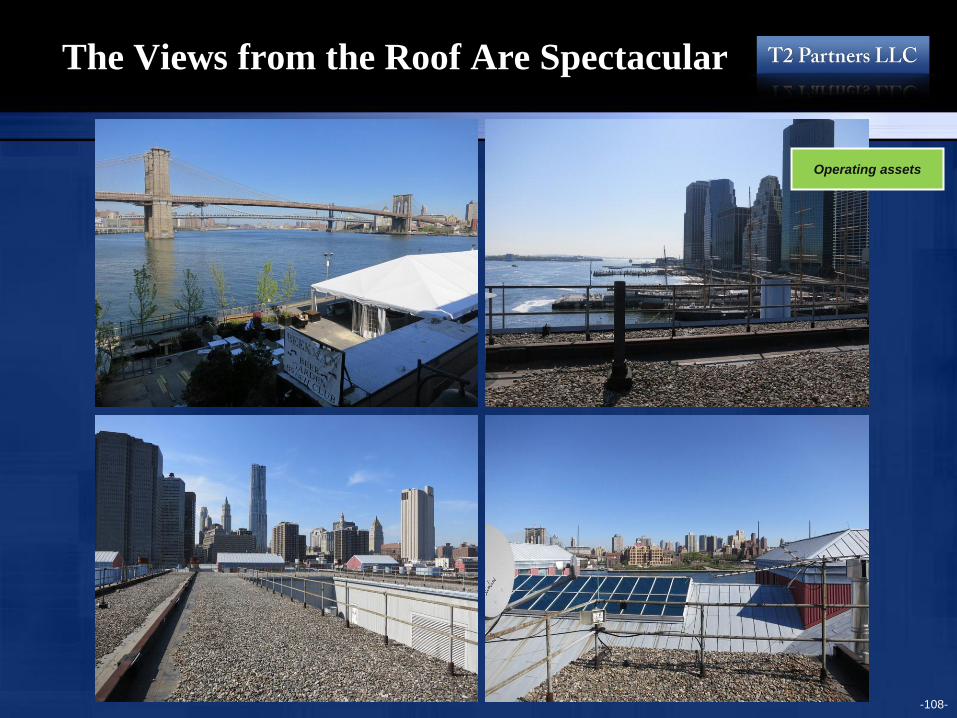
The Views from the Roof Are Spectacular
-108-
Operating assets
-109-
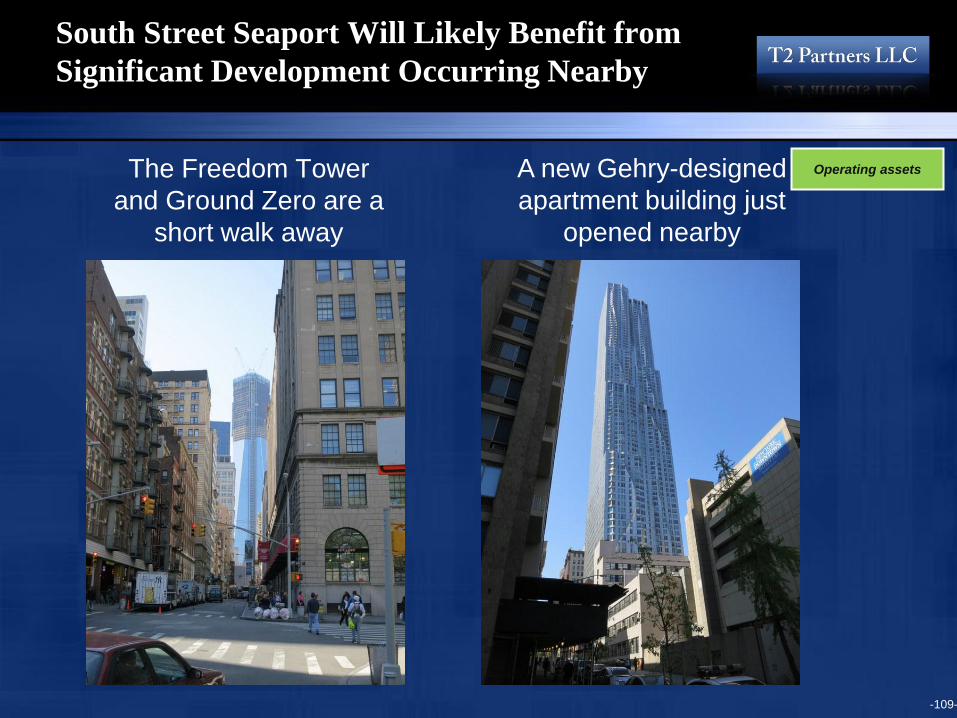
South Street Seaport Will Likely Benefit from
Significant Development Occurring Nearby
The Freedom Tower
and Ground Zero are a
short walk away
A new Gehry-designed
apartment building just
opened nearby
Operating assets
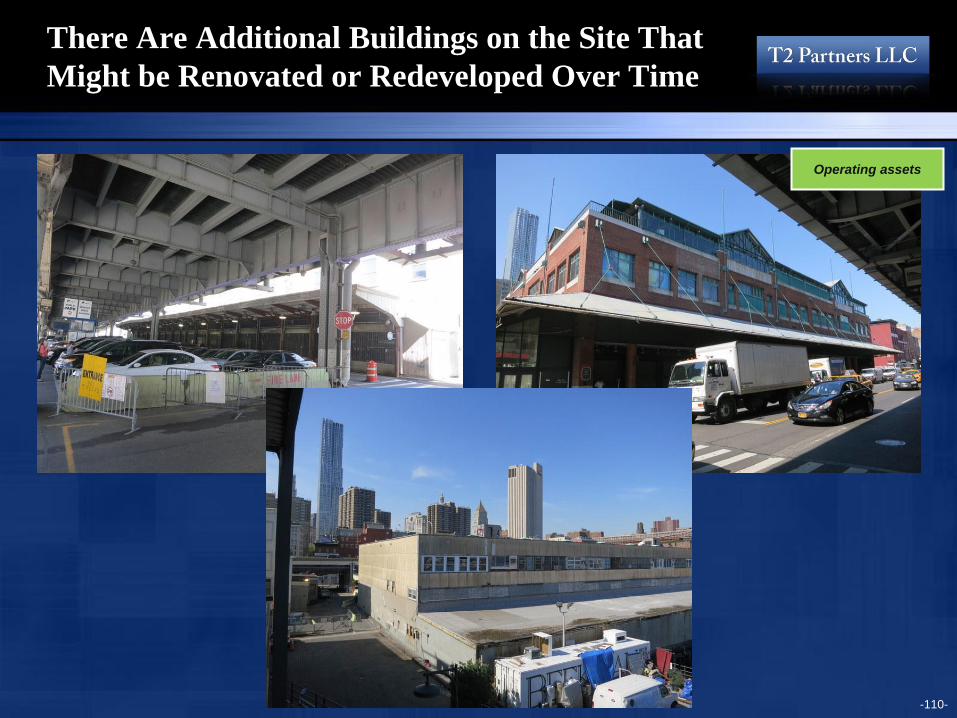
There Are Additional Buildings on the Site That
Might be Renovated or Redeveloped Over Time
-110-
Operating assets
-111-
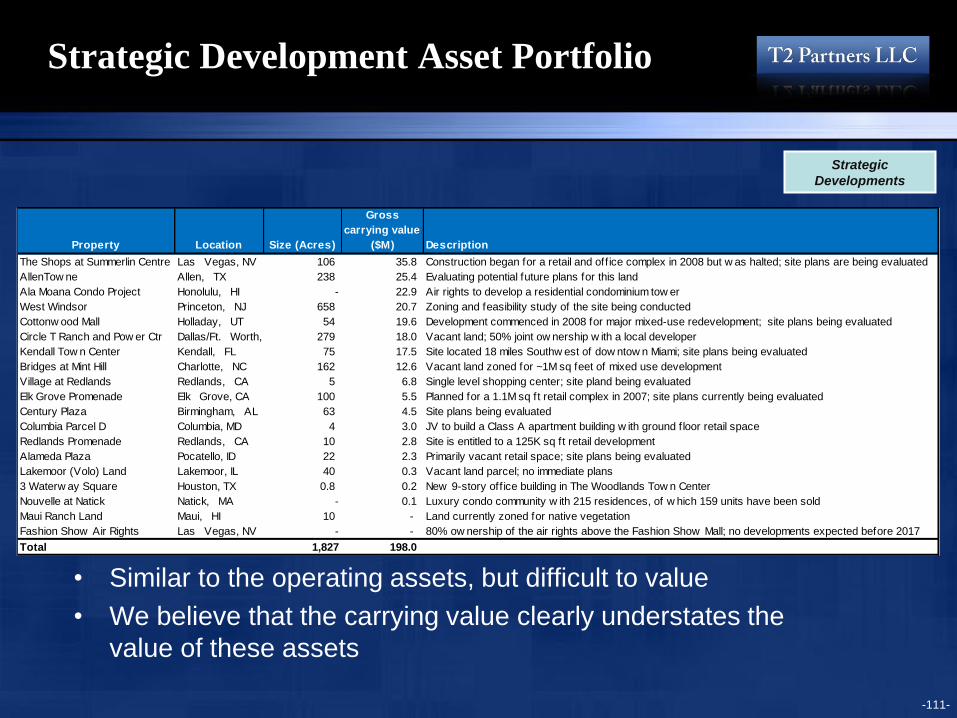
Strategic Development Asset Portfolio
• Similar to the operating assets, but difficult to value
• We believe that the carrying value clearly understates the
value of these assets
Strategic
Developments
Property Location Size (Acres)
Gross
carrying value
($M) Description
The Shops at Summerlin Centre Las Vegas, NV 106 35.8 Construction began for a retail and off ice complex in 2008 but w as halted; site plans are being evaluated
AllenTow ne Allen, TX 238 25.4 Evaluating potential future plans for this land
Ala Moana Condo Project Honolulu, HI - 22.9 Air rights to develop a residential condominium tow er
West Windsor Princeton, NJ 658 20.7 Zoning and feasibility study of the site being conducted
Cottonw ood Mall Holladay, UT 54 19.6 Development commenced in 2008 for major mixed-use redevelopment; site plans being evaluated
Circle T Ranch and Pow er Ctr Dallas/Ft. Worth, TX 279 18.0 Vacant land; 50% joint ow nership w ith a local developer
Kendall Tow n Center Kendall, FL 75 17.5 Site located 18 miles Southw est of dow ntow n Miami; site plans being evaluated
Bridges at Mint Hill Charlotte, NC 162 12.6 Vacant land zoned for ~1M sq feet of mixed use development
Village at Redlands Redlands, CA 5 6.8 Single level shopping center; site pland being evaluated
Elk Grove Promenade Elk Grove, CA 100 5.5 Planned for a 1.1M sq ft retail complex in 2007; site plans currently being evaluated
Century Plaza Birmingham, AL 63 4.5 Site plans being evaluated
Columbia Parcel D Columbia, MD 4 3.0 JV to build a Class A apartment building w ith ground floor retail space
Redlands Promenade Redlands, CA 10 2.8 Site is entitled to a 125K sq ft retail development
Alameda Plaza Pocatello, ID 22 2.3 Primarily vacant retail space; site plans being evaluated
Lakemoor (Volo) Land Lakemoor, IL 40 0.3 Vacant land parcel; no immediate plans
3 Waterw ay Square Houston, TX 0.8 0.2 New 9-story off ice building in The Woodlands Tow n Center
Nouvelle at Natick Natick, MA - 0.1 Luxury condo community w ith 215 residences, of w hich 159 units have been sold
Maui Ranch Land Maui, HI 10 - Land currently zoned for native vegetation
Fashion Show Air Rights Las Vegas, NV - - 80% ow nership of the air rights above the Fashion Show Mall; no developments expected before 2017
Total 1,827 198.0
-112-
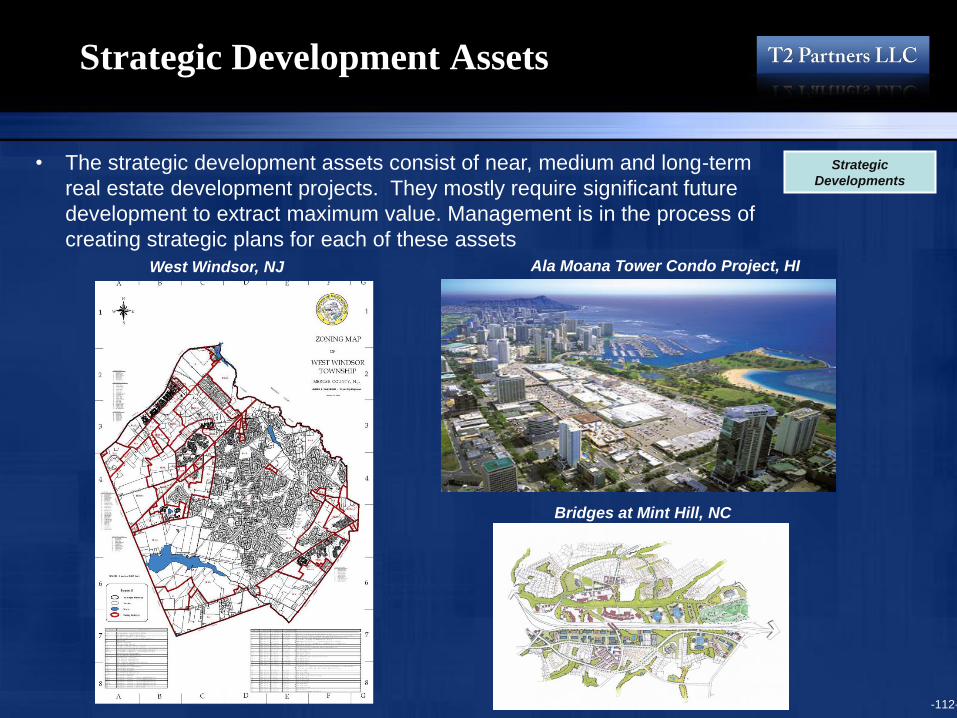
Strategic Development Assets
• The strategic development assets consist of near, medium and long-term
real estate development projects. They mostly require significant future
development to extract maximum value. Management is in the process of
creating strategic plans for each of these assets
Strategic
Developments
West Windsor, NJ Ala Moana Tower Condo Project, HI
Bridges at Mint Hill, NC
-113-
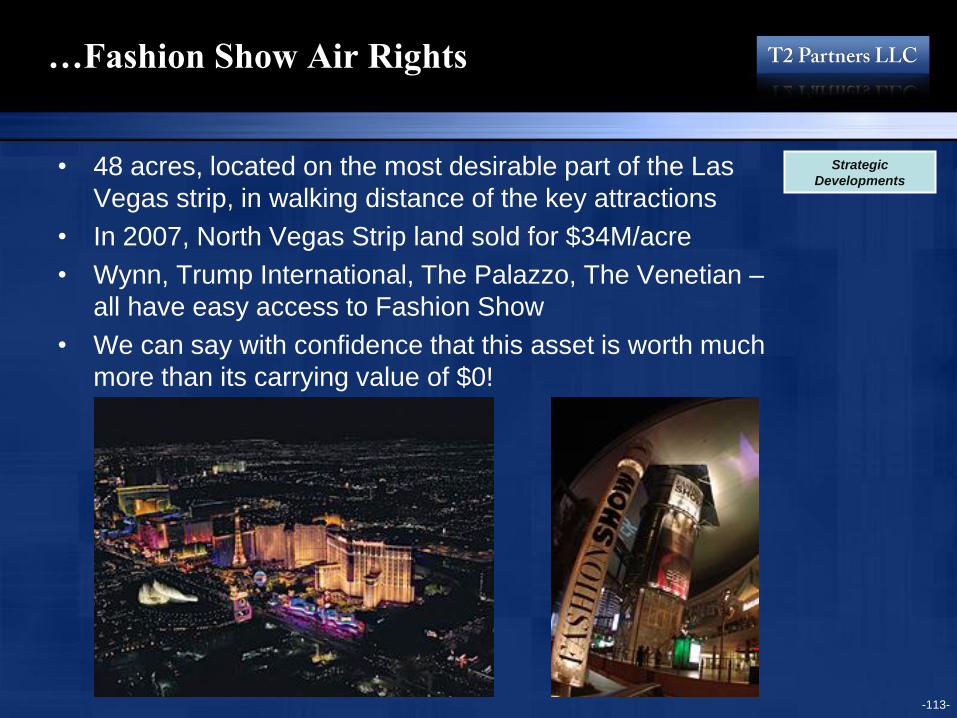
…Fashion Show Air Rights
• 48 acres, located on the most desirable part of the Las
Vegas strip, in walking distance of the key attractions
• In 2007, North Vegas Strip land sold for $34M/acre
• Wynn, Trump International, The Palazzo, The Venetian –
all have easy access to Fashion Show
• We can say with confidence that this asset is worth much
more than its carrying value of $0!
Strategic
Developments
-114-
Valuing HHC
“The real estate assets owned by HHC are notoriously difficult
to value” – 2010 HHC Chairman Letter
Valuation issues
• Long-term horizon
• Uncertainty around housing/real estate market
• Difficult to use traditional valuation metrics
• Wide spectrum of possible future outcomes
Best approach is to consider multiple valuation methodologies
to come up with a range of probable values

Putting It All Together
• We arrive at a range of values of $67 to $125 per share
• Attractive risk/reward
• Multiple free options
• Downside protection
• Inflation hedge
• Non-recourse leverage
• Opportunity to increase returns by applying appropriate leverage
-115-
* Cash and share count assume sponsor warrants exercised
Note: Other liabilities and assets, including $323M tax indemnity receivable from GGP, are not included in NAV calculation
Valuation ($M)
Assets Low High
Master Planned Communities 1,350 2,300
Operating Assets 1,450 2,650
Strategic Developments 500 1,200
Total 3,300 6,150
Cash* 628 628
Debt 606 606
NAV 3,322 6,172
Per share $67 $125
-116-
Catalysts
• Development announcements
• Asset/land sales
• Hidden assets uncovered
• Housing market begins to recover, especially in Las Vegas
and/or Houston
• Analyst coverage
-117-
Risks
• Housing market worsens for an extended period of time
• Unable to access financing to fund developments
• Time
• Execution
-118-
Conclusion
• Opportunity to purchase a minimally levered, diverse mix of
high-quality assets near the bottom of the market
• Safe: Strong balance sheet and attractive assets provide
downside protection
• Attractive risk/reward with multiple free options
• World class management team and board, with interests
aligned with shareholders