Embed Size (px)
Citation preview
Marshall UniversityMarshall Digital Scholar
Theses, Dissertations and Capstones
2015
An Investigation of the Effect of MN2+ on theFTH1 IRE-IRP ComplexEric Thomas [email protected]
Follow this and additional works at: http://mds.marshall.edu/etd
Part of the Analytical Chemistry Commons, and the Biochemistry Commons
This Thesis is brought to you for free and open access by Marshall Digital Scholar. It has been accepted for inclusion in Theses, Dissertations andCapstones by an authorized administrator of Marshall Digital Scholar. For more information, please contact [email protected].
Recommended CitationMendenhall, Eric Thomas, "An Investigation of the Effect of MN2+ on the FTH1 IRE-IRP Complex" (2015). Theses, Dissertations andCapstones. Paper 927.

AN INVESTIGATION OF THE EFFECT OF MN2+
ON THE FTH1 IRE-IRP COMPLEX
A thesis submitted to
the Graduate College of
Marshall University
In partial fulfillment of
the requirements for the degree of
Master of Science
in
Chemistry
by
Eric Thomas Mendenhall
Approved by
Dr. Bin Wang, Committee Chairperson
Dr. Michael Norton
Dr. Leslie Frost
Marshall University
May 2015

ii
ACKNOWLEDGEMENTS
Cody Harrison and Leesah Al-Qawasmi- Assistance with hSHAPE chemistry experiments.
Joshua Botkin- Assistance with AFM experiments.
Christian Warner- Synthesized G3 Dendron and other AFM reagents.
Andrea del Pilar Belalcazar- Obtained protocol to synthesize working IRP protein.
William Patterson III- Continued synthesis of several reagents for all experiments, maintaining
cell culture line and for daily lab assistance and support when needed.
Dr. Scott Day and Masudur Rhaman- Both were integral in providing the construct and idea
for the DNA Dendron for the AFM experiment.
David Neff and the Norton Lab Group- For assistance and allowing me allotted time in their
busy schedule to step in and use their AFM. A special thanks to David for his continued
assistance and support during all aspects of the AFM experiments.
Dr. Michael Norton- For his great support and contributions in providing the idea to image the
IRE/IRP complex using his AFM laboratory. Additional thanks for his expertise in providing the
knowledge on AFM imaging techniques, and for helping to push the boundaries of AFM
imaging for this research.
Dr. Bin Wang- A special thanks to Dr. Wang for being my thesis advisor and selecting me to
work in her lab as a graduate assistant. Her many contributions to this research include
everything involved in the EMSA and hSHAPE experiments. Her expertise in hSHAPE
chemistry is top tier, and she provides a great deal of insight and knowledge in this subject.
Additionally her continued support never goes unnoticed.
Additional thanks for this provided opportunity go to:
NSF RII IRT3 Grant EPS-1003907 for providing the funding for this research.
Marshall University Graduate College of Science and Dr. Charles Somerville.
Marshall University Department of Chemistry.
Lastly, none of this could have been accomplished without the full faith, love, and support of my
family.
iii
TABLE OF CONTENTS
List of Figures………………………………………………………………………………. v
List of Graphs………………………………………………………………………………..vi
List of Tables………………………………………………………………………………..vii
Abstract……………………………………………………………………………………..viii
Chapter 1. Introduction…………………………………………………………………...…..1
1.1 Iron Homeostasis and Ferritin……………………………………………………1
1.2 IRP-IRE Complex and its Components…………………………………………..2
1.3 Negative Effects on the IRP-IRE Complex………………………………………6
1.4 Electrophoretic Mobility Shift Assays…………………………………………...10
1.5 Atomic Force Microscopy………………………………………………………..10
1.6 hSHAPE Chemistry……………………………………………………………....12
Chapter 2. Experimental Methods………………………..…………………………………..16
2.1 DNA Synthesis……………………………………………………………………16
2.2 RNA Synthesis……………………………………………………………………17
2.3 IRP Synthesis………………………………………………………………….......18
2.3.1 Plasmid Cloning and Purification……………………………………….18
2.3.2 Protein Over-Expression and Purification………………………………19
2.4 EMSA Experiments……………………………………………………………….20
2.4.1 IRE Comparative Gel……………………………………………………20
2.4.2 Metal Ion Titration Gel………………………………………………….21
2.4.3 Mn2+ Pre-Incubation Experiments..……………………………………..22
2.5 hSHAPE Chemistry Experiments…………………………………………………23
2.5.1 Selective 2’ Hydroxyl Acylation………………………………………...23
2.5.2 Primer Extension………………………………………………………...24
2.5.3 Capillary Electrophoresis………………………………………………..24
2.5.4 Data Analysis……………………………………………………………25
2.6 AFM Experiments………………………………………………………………....26
iv
TABLE OF CONTENTS (CONT.)
Chapter 3. Experimental Results…………………………………………………...………...28
3.1 IRP-IRE Complex Formation EMSA Gel Experiment…………………………..28
3.2 IRP-IRE Complex Formation hSHAPE Chemistry Experiments………………..28
3.3 IRP-IRE Complex Formation AFM Experiments………………………………..41
3.4 IRP-IRE Complex Dissociation EMSA Mn2+ Titration………………………….43
3.5 IRP-IRE Complex Dissociation by Mn2+ hSHAPE Experiments……………..…45
3.6 EMSA Mn2+ Pre-Incubation Experiments……………………………….…..…...51
Chapter 4. Discussion..……………………………………………………………………….54
Chapter 5. Conclusions..……………………………………………………………………...61
References..…………………………………………………………………………..……….62
APPENDIX A: IRB LETTER OF APPROVAL…………………………..………………...65
v
LIST OF FIGURES
1. Ferritin Structure………………………………………………………………………….2
2. IRP Dual Function and 4Fe-4S Cluster……………………………………………….…..3
3. 5’ and 3’ Untranslated Region IREs………………………………………………………4
4. Binding Nucleotides of IRE to IRP……………………………………………………….6
5. Mutant IRE Binding Affinity……………………………………………………………...7
6. Metal Ion Influences on IRP-IRE Complex……………………………………………….8
7. Yohimbine Effects on IRP-IRE Complex…………………………………………………9
8. DNA Dendron Scaffold…………………………………………………………………...12
9. Selective 2’ Hydroxyl Acylation………………………………………………………….13
10. Primer Extension………………………………………………………………………...14
11. DNA PCR Product………………………………………………………………………17
12. ABI 310 Genetic Analyzer……………………………………………………………....25
13. Bruker Corporation Atomic Force Microscope………………………………………….26
14. EMSA IRE Comparative Gel……………………………………………………………28
15. Predicted IRE Structure………………………………………………………………….31
16. Predicted IRE Structure with IRP………………………………………………………..34
17. Predicted Mutant IRE Structure………………………………………………………….37
18. Predicted Mutant IRE Structure with IRP………………………………………………..40
19. AFM DNA Dendron Image………………………………………………………………41
20. AFM DNA Dendron-IRE-IRP Image…………………………………………………….42
21. EMSA Mn2+ Titration…………………………………………………………………….43
22. Predicted IRE Structure with IRP in 50 µM Mn2+.............................................................46
23. Predicted IRE Structure with IRP in 500 µM Mn2+……………………………………...48
24. Predicted IRE Structure with IRP in 5 mM Mn2+………………………………………..50
25. EMSA Control Gels……………………………………………………………………...51
26. Pre-IRE and IRP Mn2+ Incubation Gel…………………………………………………...52
27. Pre-IRE only and Pre-IRP only Mn2+ Incubation Gel……………………………………52
28. Combined Pre-Incubation Experiments 3:1 EMSA Gel………………………………….53
vi
LIST OF GRAPHS
1. Raw Data Electropherogram of IRE……………………………………………………….29
2. SHAPE Reactivity Histogram of IRE……………………………………………………...30
3. Raw Data Electropherogram of IRE with IRP……………………………………………..32
4. SHAPE Reactivity Histogram of IRE with IRP……………………………………………33
5. Raw Data Electropherogram of Mutant IRE……………………………………………….35
6. SHAPE Reactivity Histogram of Mutant IRE……………………………………………...36
7. Raw Data Electropherogram of Mutant IRE with IRP……………………………………..38
8. SHAPE Reactivity Histogram of Mutant IRE with IRP……………………………………39
9. EMSA Mn2+ Titration Curve……………………………………………………………….44
10. SHAPE Reactivity Histogram of IRE with IRP in 50 µM Mn2+………………………….45
11. SHAPE Reactivity Histogram of IRE with IRP in 500 µM Mn2+………………………...47
12. SHAPE Reactivity Histogram of IRE with IRP in 5 mM Mn2+…………………………..49

vii
LIST OF TABLES
1. Sequences in DNA PCR Reactions…………………………………………………………17
2. Standardized RNA Intensity Values of Mn2+ Pre-Incubation 3:1 EMSA Gel……………...53

viii
ABSTRACT
Iron is a widely distributed metal found in almost every physiological system in nature,
thus being an essential part of life. Iron homeostasis in the human body must be tightly regulated
as iron is both beneficial and harmful to different cellular processes. Ferritin is a protein that has
a prominent role in maintaining iron homeostasis via iron sequestration. Additionally, this
protein itself is regulated by the Iron Responsive Element (IRE) and its interaction with an apo-
aconitase protein or the Iron Regulatory Protein (IRP). The binding of the IRP to this IRE,
located on the 5’ untranslated stem loop region of the ferritin mRNA, will inhibit translation into
Ferritin creating an additional major mechanism to control cellular iron metabolism. Previous
literature had indicated that divalent metal ions (Fe2+, Mn2+) and small molecule drugs can
interrupt the binding of the IRE-IRP complex, specifically by altering the secondary structure of
the IRE. Following this model, we conducted a series of experiments using Atomic Force
Microscopy (AFM), Electrophoretic Mobility Shift Assays (EMSAs), and high-throughput
Selective 2’Hydroxyl Acylation analyzed by Primer Extension (hSHAPE) Chemistry to observe
effects from Mn2+ on already bound IRE-IRP complexes. The results concluded the Mn2+ had
little to no effect on an already bound IRE-IRP complex. However upon changing our
experimental procedure, EMSA experiments show pre-incubating the IRE and IRP separately in
Mn2+ prior to binding affects complex formation. The results also indicated it is the IRP being
affected by the Mn2+ and not the IRE, which contradicts the previous model.
1
CHAPTER 1
INTRODUCTION
1.1 Iron Homeostasis and Ferritin
Iron is a widely abundant metal found both in the surrounding environment, and in many
bio-physiological systems, thus being an essential part of life. In the human body, Fe has several
important roles such as its involvement in key redox reactions, integration into hemoglobin and
myoglobin, or acting as a cofactor in metalloproteins that have significant parts in metabolism.
On the contrary, Fe can also be a very potent ion in physiological systems. Iron’s involvement in
Fenton Reaction chemistry can result in a cascade of effects by reacting with hydrogen peroxide,
yielding reactive oxygen species that proceed to damage several important systems in cells.
Therefore, it is imperative that Fe homeostasis be closely regulated in the body. One such
way that Fe levels are regulated is through a series of iron binding proteins with the capabilities
to transport, store, and excrete Fe in the cell. Such proteins include Ferroportin, which transports
Fe across cellular membranes, Transferrin, which controls cellular Fe transportation, and Ferritin
that is involved in Fe sequestration. The evolution of these proteins working in concert indicates
that the human body does not have one distinct physiological pathway and that Fe regulation
must be maintained by the collective effort of these mechanisms.
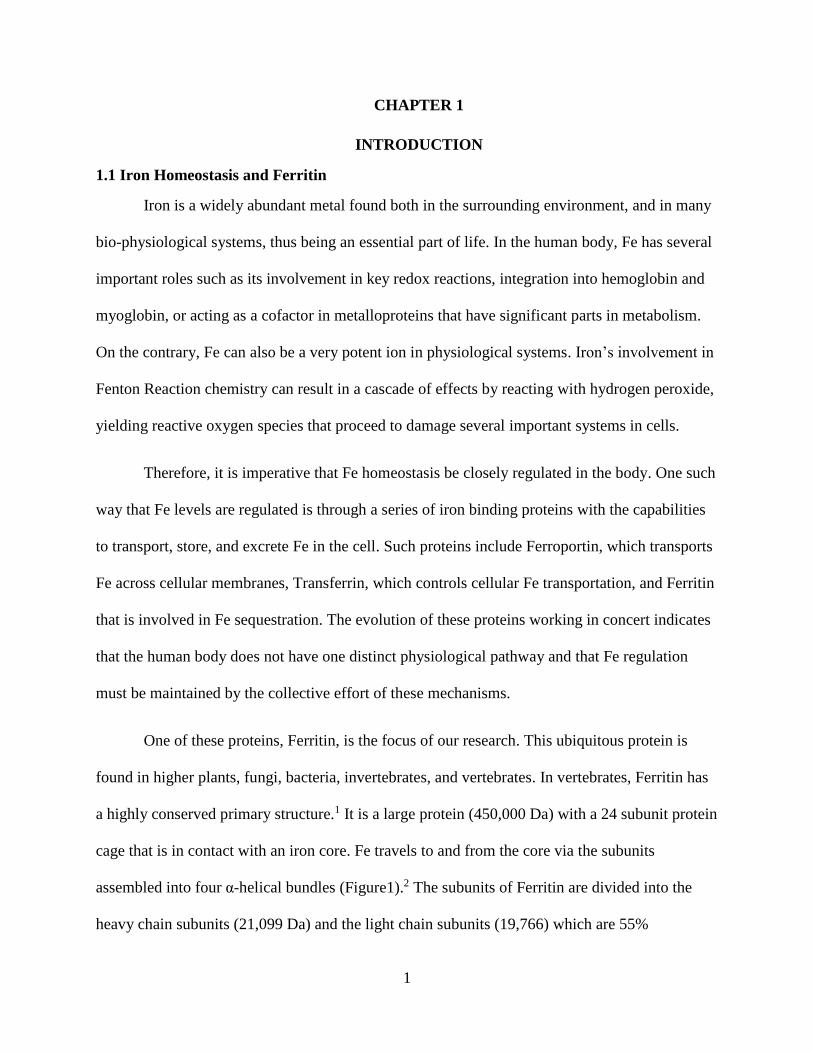
One of these proteins, Ferritin, is the focus of our research. This ubiquitous protein is
found in higher plants, fungi, bacteria, invertebrates, and vertebrates. In vertebrates, Ferritin has
a highly conserved primary structure.1 It is a large protein (450,000 Da) with a 24 subunit protein
cage that is in contact with an iron core. Fe travels to and from the core via the subunits
assembled into four α-helical bundles (Figure1).2 The subunits of Ferritin are divided into the
heavy chain subunits (21,099 Da) and the light chain subunits (19,766) which are 55%
2
homologous.1 The heavy chain subunit is responsible for ferroxidase conversion of the Fenton
Chemistry reactive Fe2+ to a less reactive Fe3+-O-Fe3+ complex, thus allowing ferritin to fulfill its
role in Fe sequestration in an efficient manner.3 The light chain subunit is involved in electron
transfer across ferritin’s protein cage and does not play a role in feroxidase conversions.4
Figure 1. Ferritin Structure. (A) A cross-section of the ferritin protein cage with its core at the
center. (B) Represents one of the subunits assembled into a four α-helical bundle. The white
arrows represent the metal ion traffic in the subunit.2
1.2 IRP-IRE Complex and its Components
In addition to having a network of proteins to assist in controlling Fe homeostatic levels,
several of these proteins themselves have their own control mechanisms through translational
regulation via the Iron Regulatory Protein (IRP) – Iron Responsive Element (IRE) network. Each
IRP-IRE network is comprised of two components: The Iron Regulatory Protein and a small
stem loop region of mRNA known as the Iron Responsive Element. The IRP-IRE network has
the ability to influence the production levels of several iron binding proteins, including ferritin,
therefore this network has a direct effect on Fe homeostasis in the body.
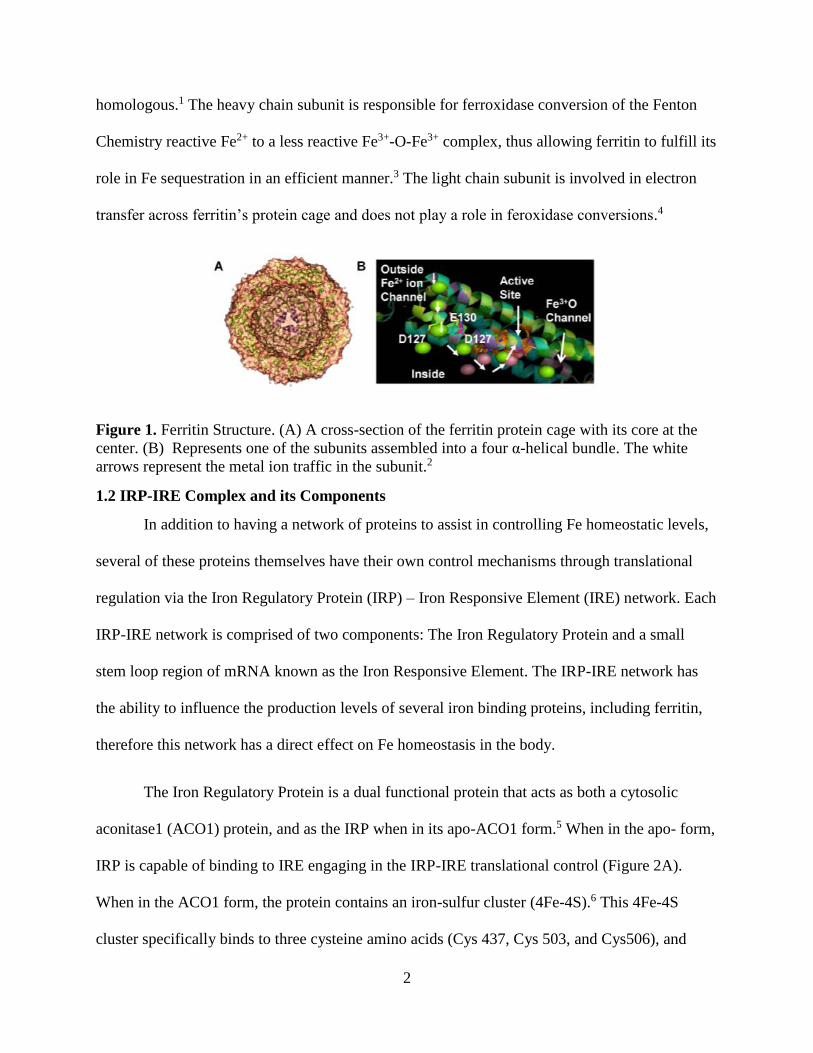
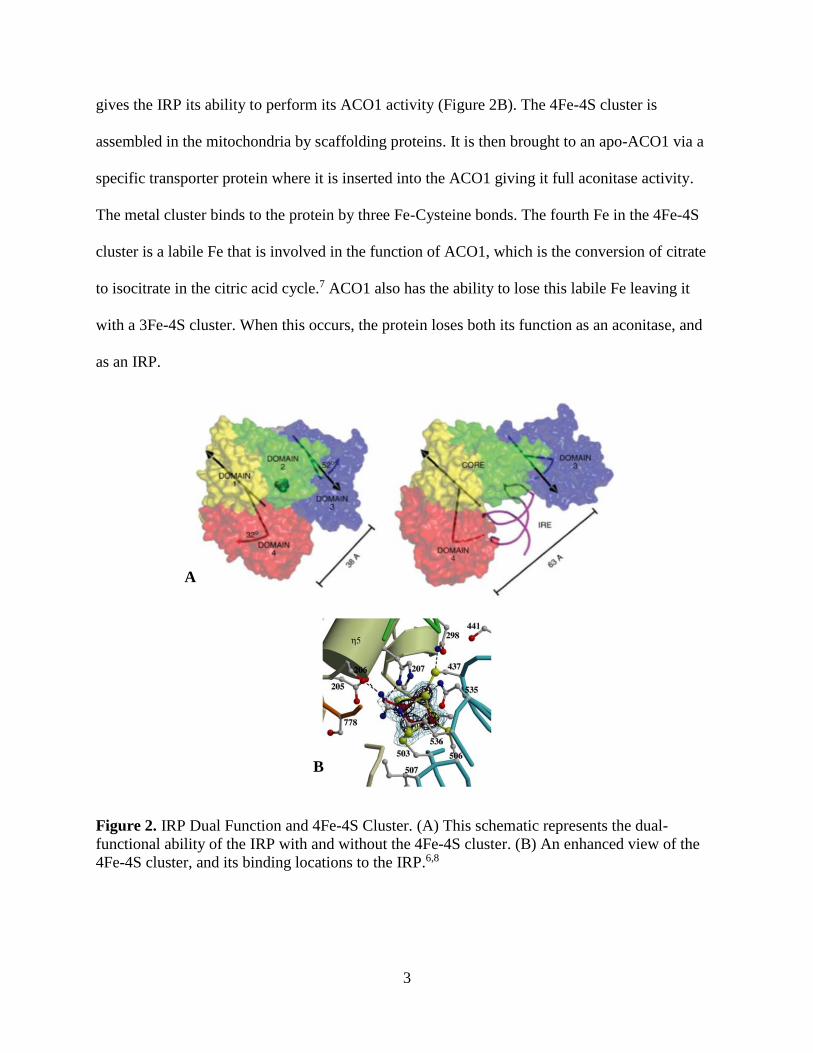
The Iron Regulatory Protein is a dual functional protein that acts as both a cytosolic
aconitase1 (ACO1) protein, and as the IRP when in its apo-ACO1 form.5 When in the apo- form,
IRP is capable of binding to IRE engaging in the IRP-IRE translational control (Figure 2A).
When in the ACO1 form, the protein contains an iron-sulfur cluster (4Fe-4S).6 This 4Fe-4S
cluster specifically binds to three cysteine amino acids (Cys 437, Cys 503, and Cys506), and
3
gives the IRP its ability to perform its ACO1 activity (Figure 2B). The 4Fe-4S cluster is
assembled in the mitochondria by scaffolding proteins. It is then brought to an apo-ACO1 via a
specific transporter protein where it is inserted into the ACO1 giving it full aconitase activity.
The metal cluster binds to the protein by three Fe-Cysteine bonds. The fourth Fe in the 4Fe-4S
cluster is a labile Fe that is involved in the function of ACO1, which is the conversion of citrate
to isocitrate in the citric acid cycle.7 ACO1 also has the ability to lose this labile Fe leaving it
with a 3Fe-4S cluster. When this occurs, the protein loses both its function as an aconitase, and
as an IRP.
Figure 2. IRP Dual Function and 4Fe-4S Cluster. (A) This schematic represents the dual-
functional ability of the IRP with and without the 4Fe-4S cluster. (B) An enhanced view of the
4Fe-4S cluster, and its binding locations to the IRP.6,8
A
B
4
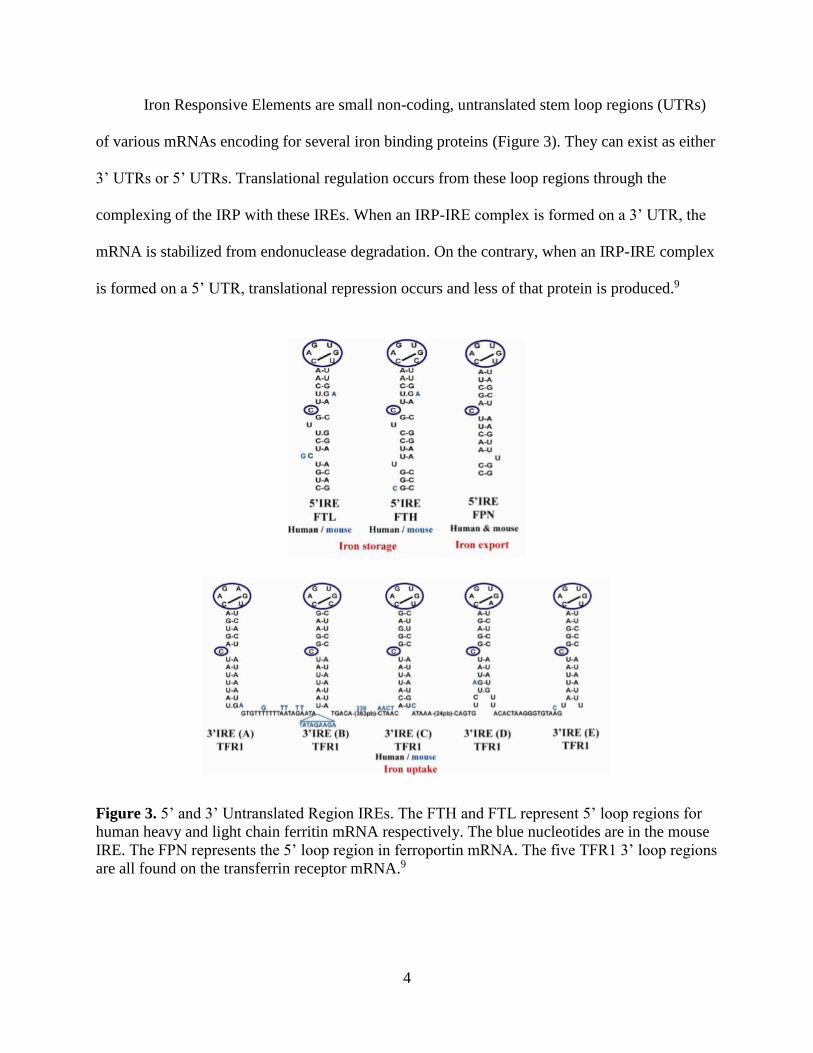
Iron Responsive Elements are small non-coding, untranslated stem loop regions (UTRs)
of various mRNAs encoding for several iron binding proteins (Figure 3). They can exist as either
3’ UTRs or 5’ UTRs. Translational regulation occurs from these loop regions through the
complexing of the IRP with these IREs. When an IRP-IRE complex is formed on a 3’ UTR, the
mRNA is stabilized from endonuclease degradation. On the contrary, when an IRP-IRE complex
is formed on a 5’ UTR, translational repression occurs and less of that protein is produced.9
Figure 3. 5’ and 3’ Untranslated Region IREs. The FTH and FTL represent 5’ loop regions for
human heavy and light chain ferritin mRNA respectively. The blue nucleotides are in the mouse
IRE. The FPN represents the 5’ loop region in ferroportin mRNA. The five TFR1 3’ loop regions
are all found on the transferrin receptor mRNA.9
5
The IRP-IRE complex that we are studying in our experiments belongs to the 5’UTR of
the Heavy Chain Human Ferritin (FTH1) mRNA. This complex helps to influence Fe
homeostasis by controlling ferritin translation. When intracellular Fe levels drop below the
physiological set-point, the 4Fe-4S cluster doesn’t form as readily, thus leaving many apo-
aconitase or IRPs in the cell. The IRP binds to the IRE of the FTH1 mRNA and represses the
production of ferritin, therefore allowing Fe concentrations to restore to their set-point. However,
when Fe levels are elevated, the 4Fe-4S complex more readily forms, meaning there are more
ACO1 proteins in the cell than IRPs. With the lack of IRP binding to IRE, translation is able to
occur as usual, producing Ferritin, which will in turn, fulfill its role by sequestering the excess Fe
and relieving the stress of elevated Fe levels.
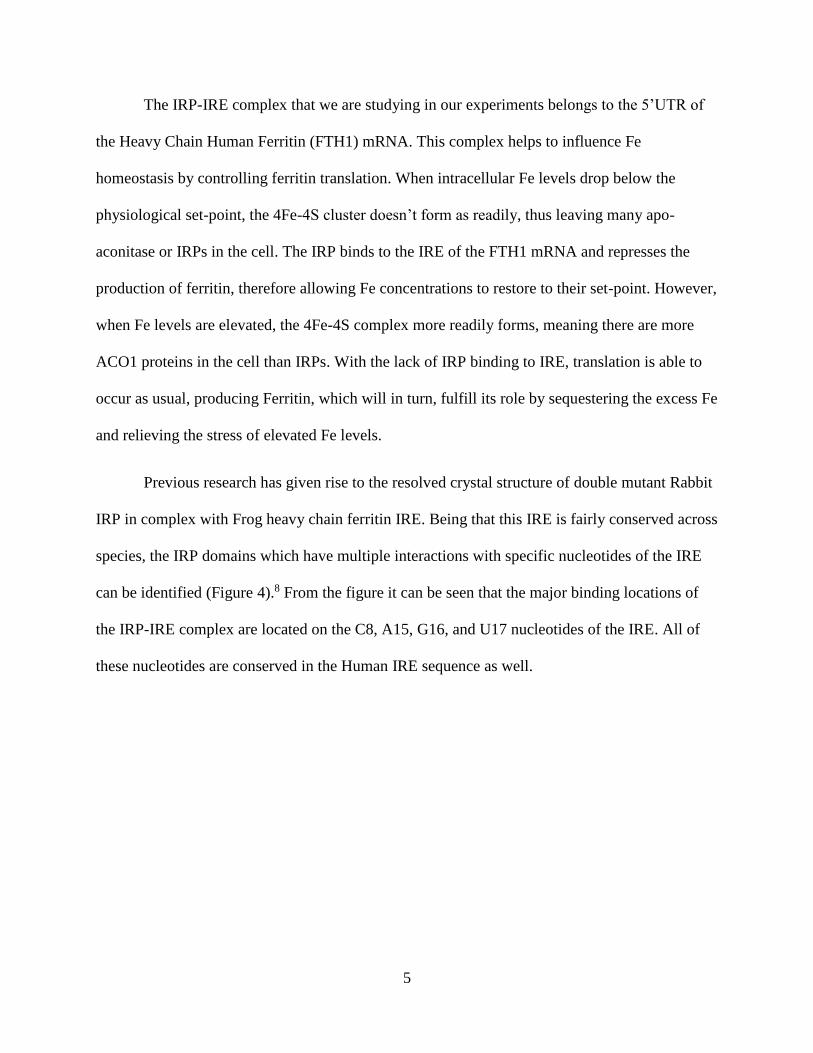
Previous research has given rise to the resolved crystal structure of double mutant Rabbit
IRP in complex with Frog heavy chain ferritin IRE. Being that this IRE is fairly conserved across
species, the IRP domains which have multiple interactions with specific nucleotides of the IRE
can be identified (Figure 4).8 From the figure it can be seen that the major binding locations of
the IRP-IRE complex are located on the C8, A15, G16, and U17 nucleotides of the IRE. All of
these nucleotides are conserved in the Human IRE sequence as well.
6
Figure 4. Binding Nucleotides of IRE to IRP. These locations were determined by x-ray
crystallography. The key nucleotides in binding, C8, A15, G16, and U17 are all shown to have
multiple interactions with the IRP. The C8 bulge has the most IRP interactions binding with six
different amino acids and eight amino acids total.8
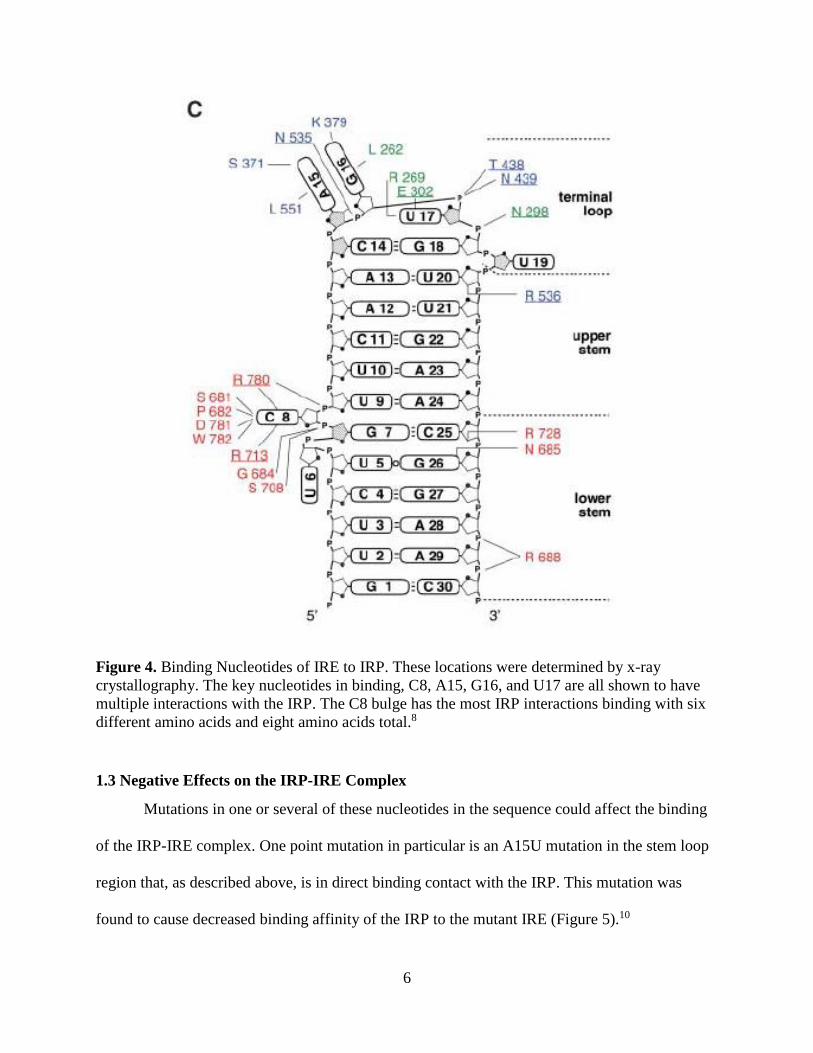
1.3 Negative Effects on the IRP-IRE Complex
Mutations in one or several of these nucleotides in the sequence could affect the binding
of the IRP-IRE complex. One point mutation in particular is an A15U mutation in the stem loop
region that, as described above, is in direct binding contact with the IRP. This mutation was
found to cause decreased binding affinity of the IRP to the mutant IRE (Figure 5).10
7
Figure 5. Mutant IRE Binding Affinity. This represents a band-shift assay from the Kato group,
comparing the mutant and wild-type IREs when bound to IRP.10
It is quite evident from this experiment that the mutated IRE has a much weaker binding
affinity for the IRP than the wild-type. This decreased affinity can be seen in the decreased
fluorescence of the IRP-IRE bands, the upper bands in the gel.
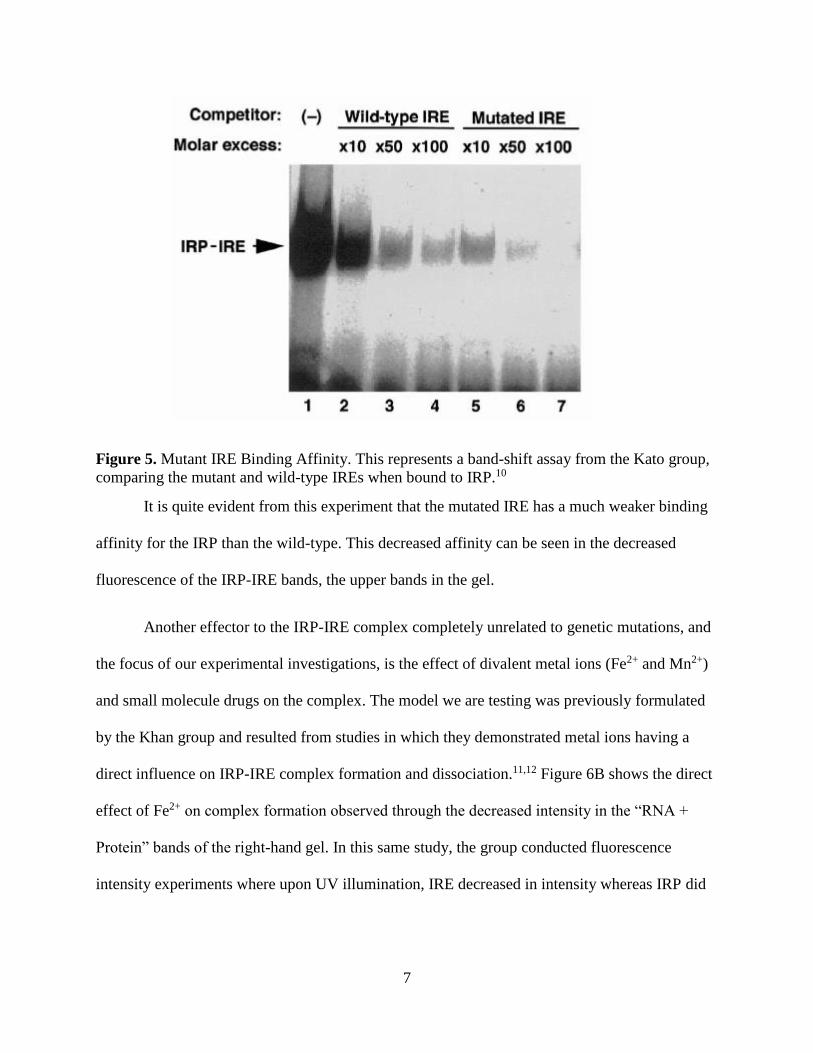
Another effector to the IRP-IRE complex completely unrelated to genetic mutations, and
the focus of our experimental investigations, is the effect of divalent metal ions (Fe2+ and Mn2+)
and small molecule drugs on the complex. The model we are testing was previously formulated
by the Khan group and resulted from studies in which they demonstrated metal ions having a
direct influence on IRP-IRE complex formation and dissociation.11,12 Figure 6B shows the direct
effect of Fe2+ on complex formation observed through the decreased intensity in the “RNA +
Protein” bands of the right-hand gel. In this same study, the group conducted fluorescence
intensity experiments where upon UV illumination, IRE decreased in intensity whereas IRP did
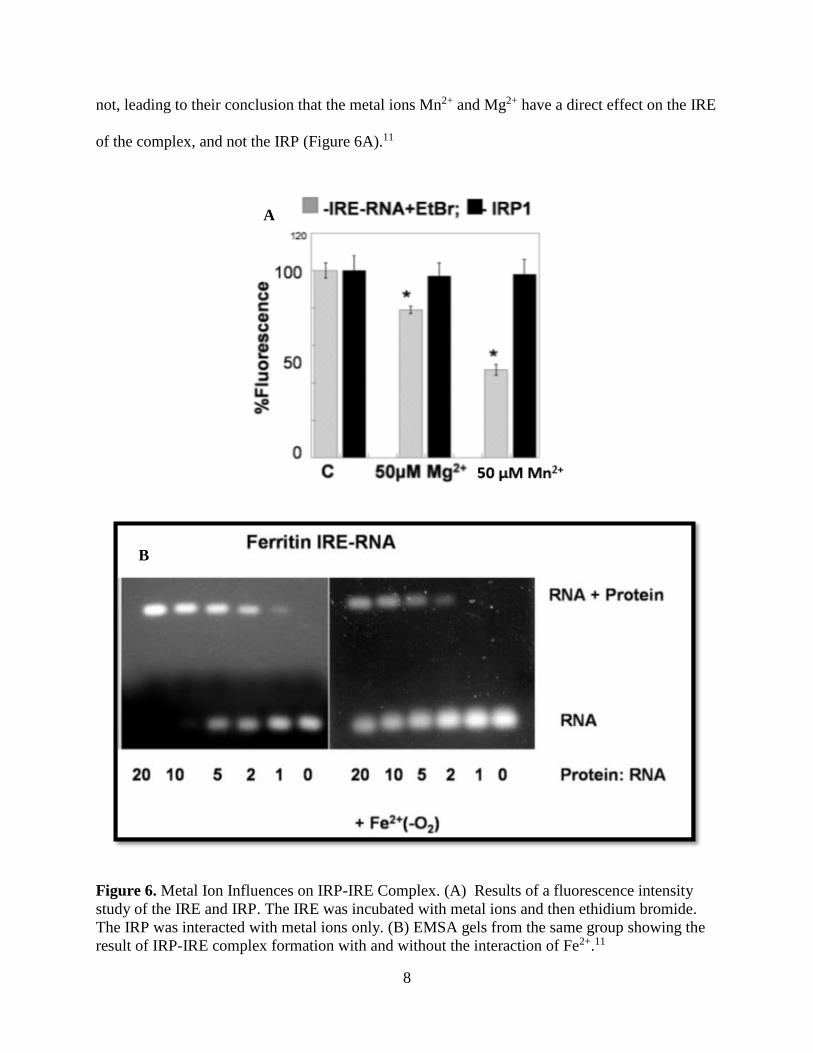
8
not, leading to their conclusion that the metal ions Mn2+ and Mg2+ have a direct effect on the IRE
of the complex, and not the IRP (Figure 6A).11
Figure 6. Metal Ion Influences on IRP-IRE Complex. (A) Results of a fluorescence intensity
study of the IRE and IRP. The IRE was incubated with metal ions and then ethidium bromide.
The IRP was interacted with metal ions only. (B) EMSA gels from the same group showing the
result of IRP-IRE complex formation with and without the interaction of Fe2+.11
A
B
9
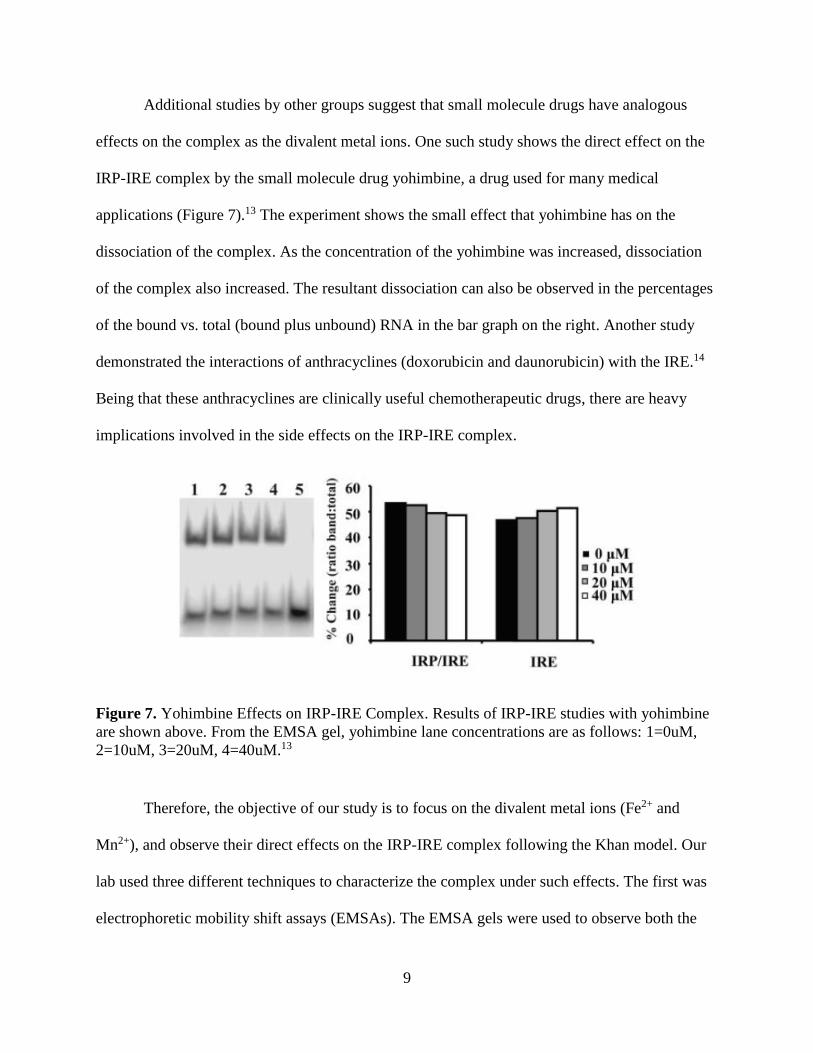
Additional studies by other groups suggest that small molecule drugs have analogous
effects on the complex as the divalent metal ions. One such study shows the direct effect on the
IRP-IRE complex by the small molecule drug yohimbine, a drug used for many medical
applications (Figure 7).13 The experiment shows the small effect that yohimbine has on the
dissociation of the complex. As the concentration of the yohimbine was increased, dissociation
of the complex also increased. The resultant dissociation can also be observed in the percentages
of the bound vs. total (bound plus unbound) RNA in the bar graph on the right. Another study
demonstrated the interactions of anthracyclines (doxorubicin and daunorubicin) with the IRE.14
Being that these anthracyclines are clinically useful chemotherapeutic drugs, there are heavy
implications involved in the side effects on the IRP-IRE complex.
Figure 7. Yohimbine Effects on IRP-IRE Complex. Results of IRP-IRE studies with yohimbine
are shown above. From the EMSA gel, yohimbine lane concentrations are as follows: 1=0uM,
2=10uM, 3=20uM, 4=40uM.13
Therefore, the objective of our study is to focus on the divalent metal ions (Fe2+ and
Mn2+), and observe their direct effects on the IRP-IRE complex following the Khan model. Our
lab used three different techniques to characterize the complex under such effects. The first was
electrophoretic mobility shift assays (EMSAs). The EMSA gels were used to observe both the
10
IRP-IRE complex formation and Mn2+ influences on complex formation and dissociation. The
second technique that was implemented was Atomic Force Microscopy (AFM). This technique
allowed us to detect complex formation and dissociation based on observational z-height
differences. Lastly, our most sensitive technique, high-throughput selective 2’ hydroxyl acylation
analyzed by primer extension (hSHAPE) chemistry, allowed us to discern, nucleotide by
nucleotide, any modifications made to the secondary structure of the IRE RNA under various
conditions.
1.4 Electrophoretic Mobility Shift Assays
EMSAs are a common technique to study RNA-protein interactions.15,16 Molecules of
different weights and charges are separated as they migrate through the gel at different speeds. A
current is applied to the gel allowing more negatively charged molecules and/or smaller
molecules to migrate toward the positively charged electrodes at higher speeds. The percentage
of agarose in the gel dictates the speed at which molecules will migrate. The higher the
percentage the more separation will occur between molecules of different sizes.
The EMSA gels used in our experiments provided the ability to observe the separation
between RNA bound in the IRP-IRE complex, and unbound RNA which was not in the complex.
Additionally, we used the resultant images from these gels to quantify the amount of RNA bound
and unbound which could be used to determine effects on the complex from either metal ions or
small molecule drugs.
1.5 Atomic Force Microscopy
AFM is a highly sensitive microscopy technique that is able to provide its users with
physical representations of small biomolecules on the nanometer scale. Some instruments are
11
capable of discerning molecules in the Angstrom range and one group has even been able to
achieve the imaging and characterization of molecular bonds using CO modified tips.17,18 AFM
is a common technique for molecular biochemists, and has been used quite often to image both
single and double stranded nucleic acids with high resolution.19,20
Therefore, this technique would be very appropriate in attempting to characterize our
IRE RNA and IRP upon complexation. Our approach would be to build the complex upon a
scaffold and observe increased changes in z-heights upon additions by each component of the
complex. Then we would introduce known complex disruptors, such as the metal ions, and
observe any decreased changes in z-height, indicating complex dissociation.
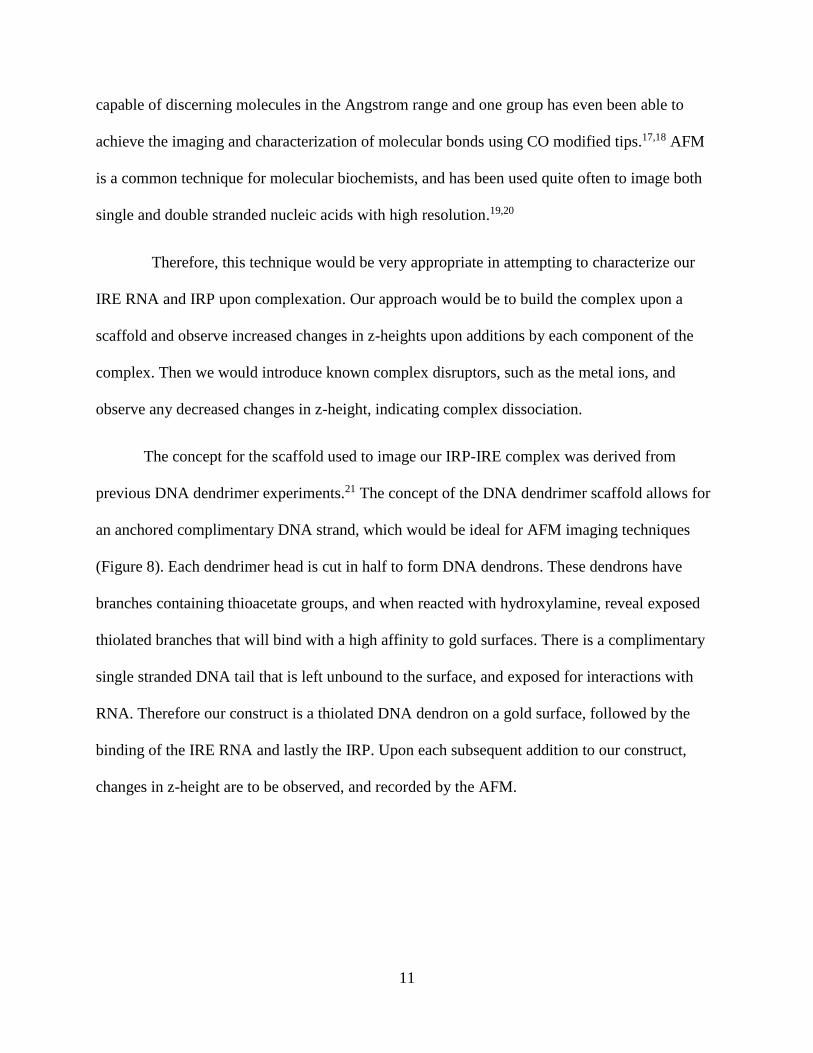
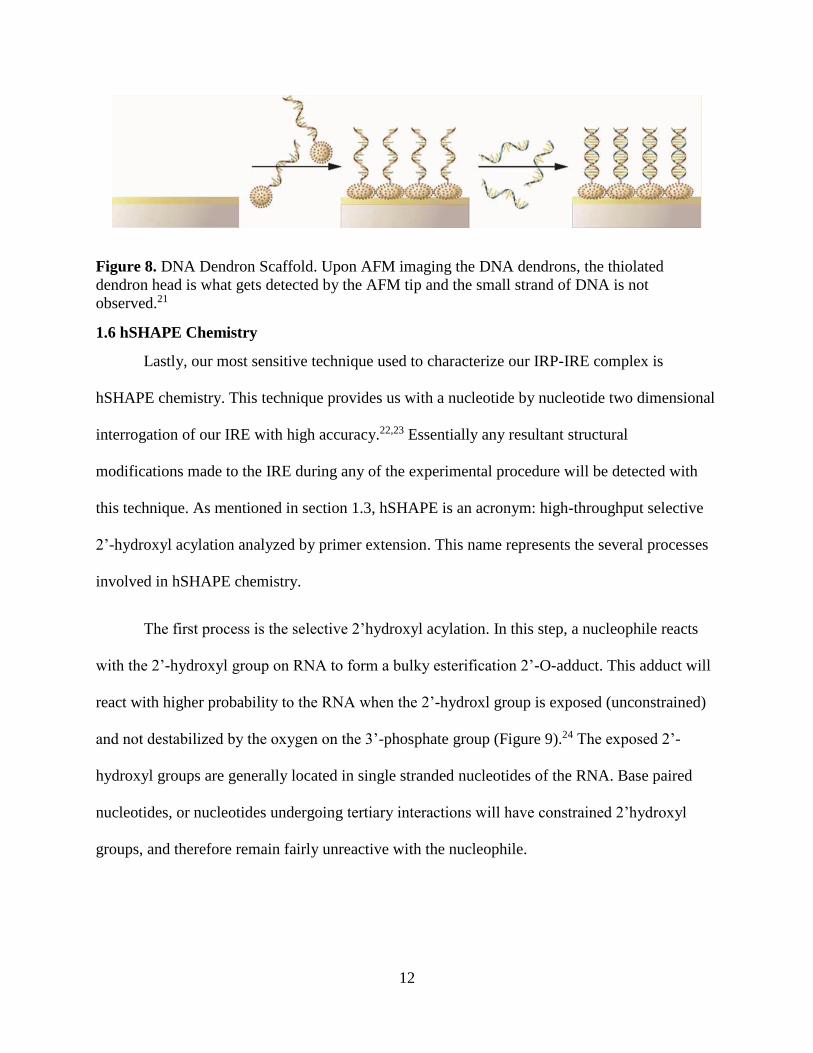
The concept for the scaffold used to image our IRP-IRE complex was derived from
previous DNA dendrimer experiments.21 The concept of the DNA dendrimer scaffold allows for
an anchored complimentary DNA strand, which would be ideal for AFM imaging techniques
(Figure 8). Each dendrimer head is cut in half to form DNA dendrons. These dendrons have
branches containing thioacetate groups, and when reacted with hydroxylamine, reveal exposed
thiolated branches that will bind with a high affinity to gold surfaces. There is a complimentary
single stranded DNA tail that is left unbound to the surface, and exposed for interactions with
RNA. Therefore our construct is a thiolated DNA dendron on a gold surface, followed by the
binding of the IRE RNA and lastly the IRP. Upon each subsequent addition to our construct,
changes in z-height are to be observed, and recorded by the AFM.
12
Figure 8. DNA Dendron Scaffold. Upon AFM imaging the DNA dendrons, the thiolated
dendron head is what gets detected by the AFM tip and the small strand of DNA is not
observed.21
1.6 hSHAPE Chemistry
Lastly, our most sensitive technique used to characterize our IRP-IRE complex is
hSHAPE chemistry. This technique provides us with a nucleotide by nucleotide two dimensional
interrogation of our IRE with high accuracy.22,23 Essentially any resultant structural
modifications made to the IRE during any of the experimental procedure will be detected with
this technique. As mentioned in section 1.3, hSHAPE is an acronym: high-throughput selective
2’-hydroxyl acylation analyzed by primer extension. This name represents the several processes
involved in hSHAPE chemistry.
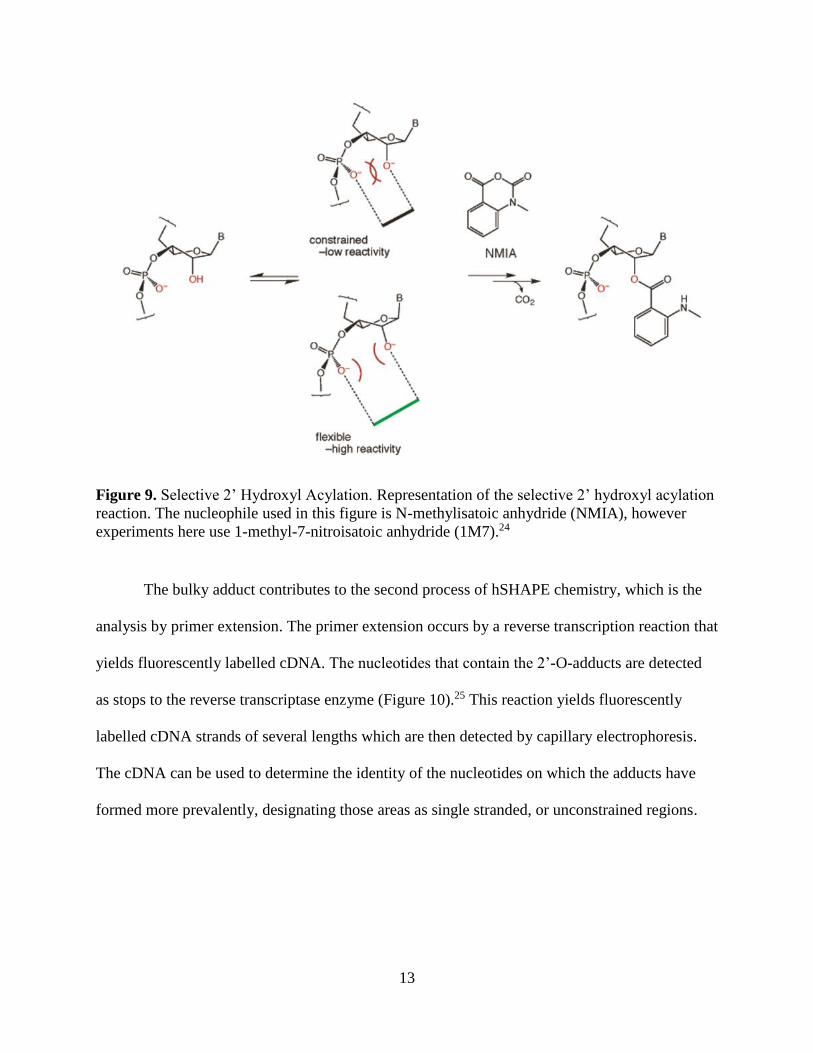
The first process is the selective 2’hydroxyl acylation. In this step, a nucleophile reacts
with the 2’-hydroxyl group on RNA to form a bulky esterification 2’-O-adduct. This adduct will
react with higher probability to the RNA when the 2’-hydroxl group is exposed (unconstrained)
and not destabilized by the oxygen on the 3’-phosphate group (Figure 9).24 The exposed 2’-
hydroxyl groups are generally located in single stranded nucleotides of the RNA. Base paired
nucleotides, or nucleotides undergoing tertiary interactions will have constrained 2’hydroxyl
groups, and therefore remain fairly unreactive with the nucleophile.
13
Figure 9. Selective 2’ Hydroxyl Acylation. Representation of the selective 2’ hydroxyl acylation
reaction. The nucleophile used in this figure is N-methylisatoic anhydride (NMIA), however
experiments here use 1-methyl-7-nitroisatoic anhydride (1M7).24
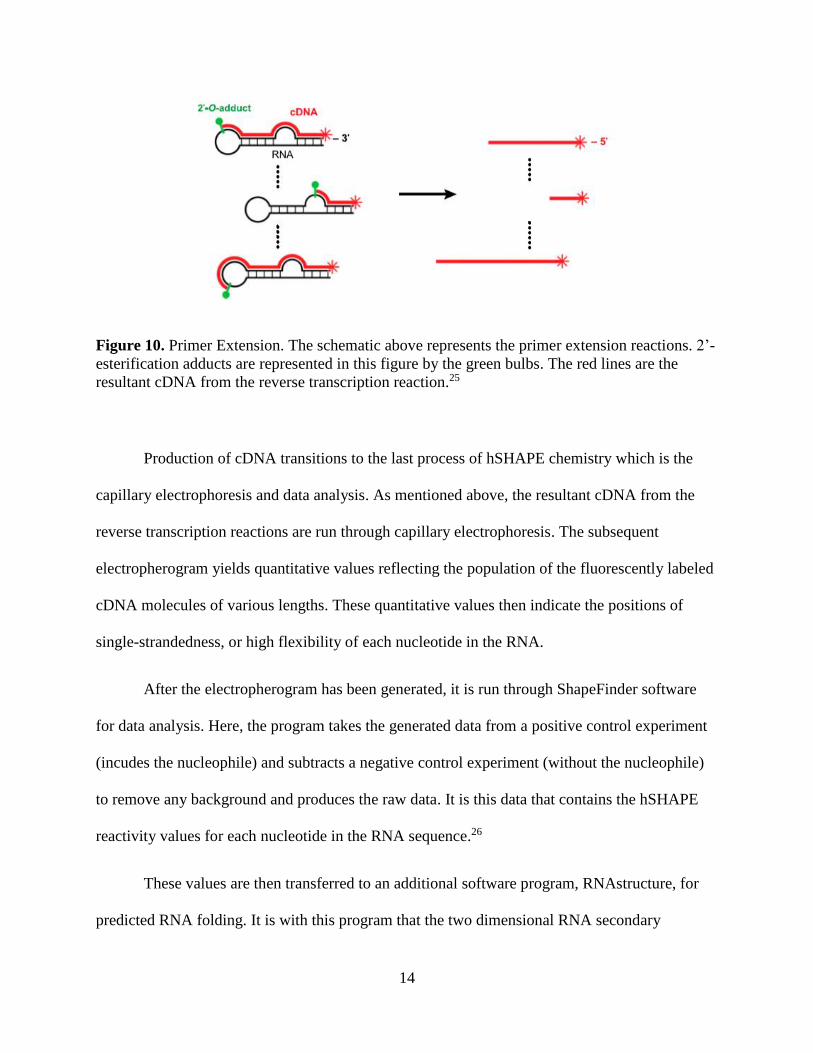
The bulky adduct contributes to the second process of hSHAPE chemistry, which is the
analysis by primer extension. The primer extension occurs by a reverse transcription reaction that
yields fluorescently labelled cDNA. The nucleotides that contain the 2’-O-adducts are detected
as stops to the reverse transcriptase enzyme (Figure 10).25 This reaction yields fluorescently
labelled cDNA strands of several lengths which are then detected by capillary electrophoresis.
The cDNA can be used to determine the identity of the nucleotides on which the adducts have
formed more prevalently, designating those areas as single stranded, or unconstrained regions.
14
Figure 10. Primer Extension. The schematic above represents the primer extension reactions. 2’-
esterification adducts are represented in this figure by the green bulbs. The red lines are the
resultant cDNA from the reverse transcription reaction.25
Production of cDNA transitions to the last process of hSHAPE chemistry which is the
capillary electrophoresis and data analysis. As mentioned above, the resultant cDNA from the
reverse transcription reactions are run through capillary electrophoresis. The subsequent
electropherogram yields quantitative values reflecting the population of the fluorescently labeled
cDNA molecules of various lengths. These quantitative values then indicate the positions of
single-strandedness, or high flexibility of each nucleotide in the RNA.
After the electropherogram has been generated, it is run through ShapeFinder software
for data analysis. Here, the program takes the generated data from a positive control experiment
(incudes the nucleophile) and subtracts a negative control experiment (without the nucleophile)
to remove any background and produces the raw data. It is this data that contains the hSHAPE
reactivity values for each nucleotide in the RNA sequence.26
These values are then transferred to an additional software program, RNAstructure, for
predicted RNA folding. It is with this program that the two dimensional RNA secondary
15
structure is generated using free energy, nearest-neighbor parameters. With the inclusion of the
pseudo-energy constraints provided by the SHAPE reactivity data from ShapeFinder, the
RNAstructure program can fold the RNA with improved structure prediction accuracy.27
The utilization of the three techniques previously described, allowed us to do the
following: The EMSA gels allowed us to observe the formation of the IRP-IRE complex under
uninhibited and metal ion conditions, the AFM experiment provided us with a physical
representation of the formation of the IRP-IRE complex, and lastly, the hSHAPE chemistry
experiments provided intricate two dimensional IRE RNA modeling under various conditions,
such as bound with the IRP and interference by metal ions.
16
CHAPTER 2
EXPERIMENTAL METHODS
2.1 DNA Synthesis
A polymerase chain reaction (PCR) was used to amplify 132 base pair and 77 base pair
FTH1 IRE RNAs. The DNA was synthesized with a forward primer, bearing a T7 promoter
sequence, a reverse primer, and a 75nt cassette template, all purchased from Integrated DNA
Technologies, Inc (IDT). The sequences are shown in Table 1 below. The PCR mixture (500 µL
total volume) used to synthesize the DNA contained the following: 20 mM Tris (pH 8.4), 50 mM
KCl, 2.5 mM MgCl2, 0.2 mM of each dNTP (dATP, dGTP, dCTP, and dTTP), 0.5 µM each of
forward and reverse primer, 0.1 nM of DNA template, and 0.025 units/µl Taq DNA polymerase.
The PCR reactions were run using an Eppendorf Mastercycler® personal Authorized Thermal
Cycler. The following PCR conditions were used: Denaturation at 94°C for 45 seconds,
Annealing at 65°C for 30 seconds, and Extension at 72°C for 30 seconds all repeated for 36
cycles followed by a 15 minute period at 72°C following the 36th cycle. The resultant DNA PCR
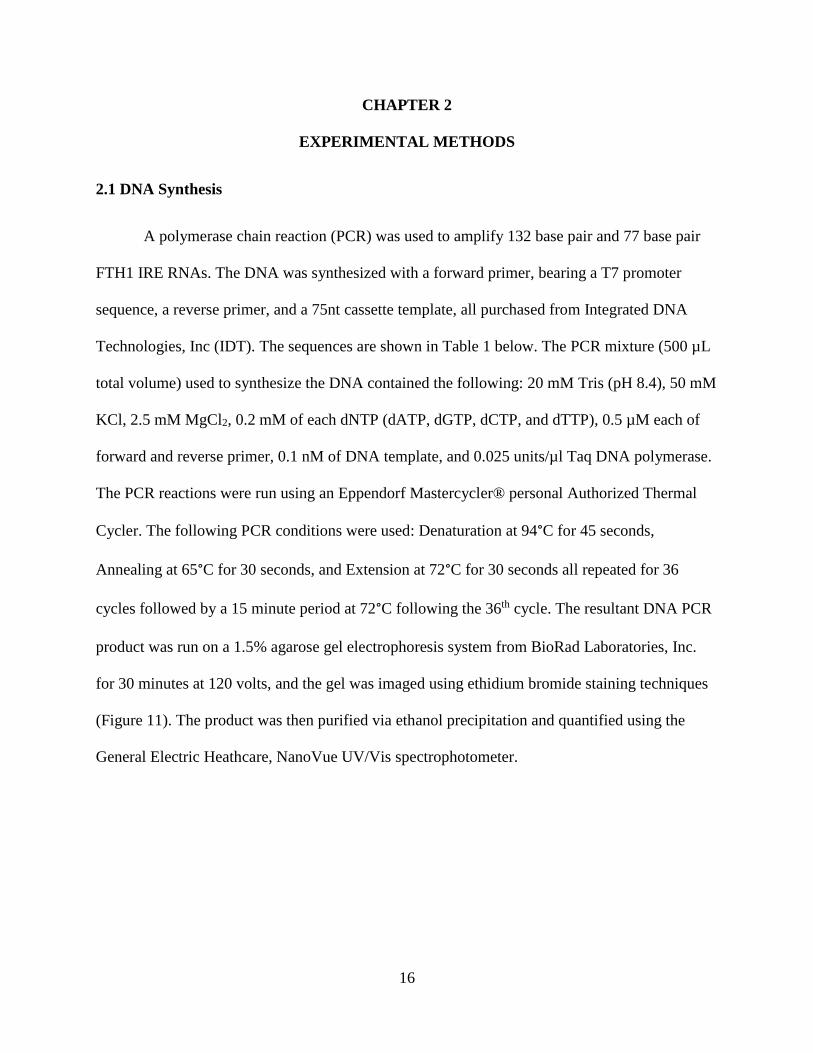
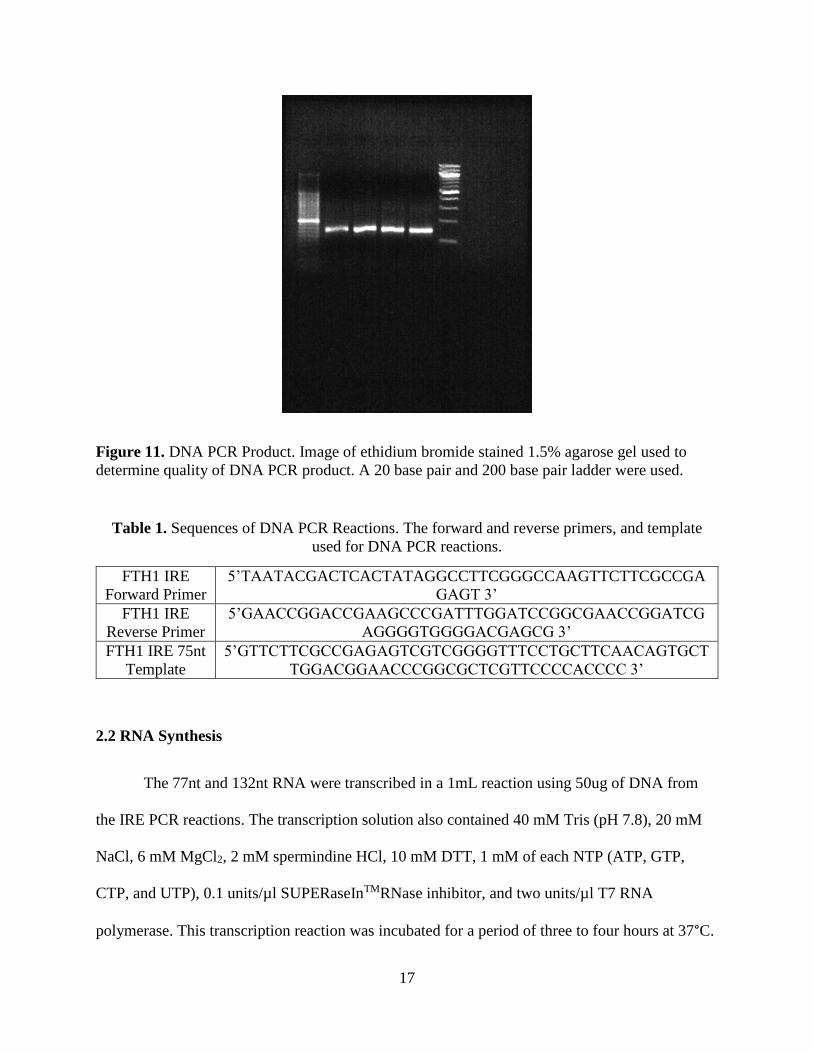
product was run on a 1.5% agarose gel electrophoresis system from BioRad Laboratories, Inc.
for 30 minutes at 120 volts, and the gel was imaged using ethidium bromide staining techniques
(Figure 11). The product was then purified via ethanol precipitation and quantified using the
General Electric Heathcare, NanoVue UV/Vis spectrophotometer.
17
Figure 11. DNA PCR Product. Image of ethidium bromide stained 1.5% agarose gel used to
determine quality of DNA PCR product. A 20 base pair and 200 base pair ladder were used.
Table 1. Sequences of DNA PCR Reactions. The forward and reverse primers, and template
used for DNA PCR reactions.
FTH1 IRE
Forward Primer
5’TAATACGACTCACTATAGGCCTTCGGGCCAAGTTCTTCGCCGA
GAGT 3’
FTH1 IRE
Reverse Primer
5’GAACCGGACCGAAGCCCGATTTGGATCCGGCGAACCGGATCG
AGGGGTGGGGACGAGCG 3’
FTH1 IRE 75nt
Template
5’GTTCTTCGCCGAGAGTCGTCGGGGTTTCCTGCTTCAACAGTGCT
TGGACGGAACCCGGCGCTCGTTCCCCACCCC 3’
2.2 RNA Synthesis
The 77nt and 132nt RNA were transcribed in a 1mL reaction using 50ug of DNA from
the IRE PCR reactions. The transcription solution also contained 40 mM Tris (pH 7.8), 20 mM
NaCl, 6 mM MgCl2, 2 mM spermindine HCl, 10 mM DTT, 1 mM of each NTP (ATP, GTP,
CTP, and UTP), 0.1 units/µl SUPERaseInTMRNase inhibitor, and two units/µl T7 RNA
polymerase. This transcription reaction was incubated for a period of three to four hours at 37°C.
18
After transcription, DNA template degradation was completed using two units/µL of TURBOTM
DNase in a 15 minute reaction at 37°C. The DNase was then deactivated using 0.5M EDTA and
heating the solution to 75°C for ten minutes. After DNA template degradation, the RNA was
purified by ethanol precipitation. Further purification of the 77 and 132nt IREs to be used for
AFM and hSHAPE chemistry respectively was done using an 8% denaturing polyacrylamide gel
electrophoresis (PAGE) experiment run at 12 watts for ~1.5 hours. The RNA was detected under
UV illumination, and the bands we cut out by hand for passive elution. Theses gel strips
containing the RNA were eluted for a period of 12 hours, on rotary, at 4°C in 1 mL of a 0.5 mM
sodium acetate, 1 mM EDTA solution. The resultant eluate was ethanol precipitated to
concentrate the RNA, which was then quantified using the NanoVue UV/Vis spectrophotometer.
52nt IRE RNA was also used for some comparative experiments, however this was directly
purchased from IDT.
2.3 IRP Synthesis
In initial studies, the IRP protein was purchased from OriGene Technologies, Inc. for use
in our experiments. However upon receiving the protein multiple times in the ACO-1
conformation and not the IRP conformation, we began our own protein over-expression and
purification to generate the IRP following the protocol from OriGene.
2.3.1 Plasmid Cloning and Purification
ACO-1 plasmid was cloned by transforming XL1-Blue Competent E. coli cells (Agilent
Technologies # 200249) with ACO1 (Myc-DDK-tagged)-Human aconitase 1 ORF plasmid
(OriGene # RC201857). Transformed XL1-Blue cells were grown in LB media containing 50
µg/ml Kanamycin for 16 hours. Plasmid was then purified using a QIAGEN Plasmid Maxi Kit
19
(QIAGEN # 12162) and re-suspended in T.E buffer pH 8.0 (10 mM Tris, pH 8.0; 1 mM EDTA,
pH 8.0).
2.3.2 Protein Over-Expression and Purification
The protein over-expression and purification protocol was developed by Andrea
Belalcazar with the guidance of OriGene tehnical support. 293T/17 Human Embryonic Kidney
cells (ATCC # CRL-11268) were grown in DMEM Medium (high glucose with sodium pyruvate
and L-glutamine) (Fisher # SH30243FS) containing 10% FBS. When cells reached 70-80%
confluency, DMEM media was replaced with Opti-MEM I Reduced Serum Medium (Life
Technologies # 11058-021). The cells were then transfected with the cloned ACO-1 plasmid
using TurboFectin Transfection Reagent (Ori-Gene # TF81005).
After four days of transfection, cells were washed with PBS and lysed with CelLytic M
lysis buffer (Sigma # C2978-250ML) containing a Protease Inhibitor Cocktail (Sigma # P8340-
5ML). ACO-1 protein was purified from the lysate using ANTI-FLAG M2 Affinity Gel (Sigma
# A2220) in SigmaPrep spin columns (Sigma # SC1000-1KT). The unwanted proteins were
washed from the columns with PBS. The Protein was then eluted with 0.1 M glycine, pH 3.5.
The pH of the solution was then made less acidic with the addition of 25 µl/ml Tris-HCl, pH 8.0.
The protein was then concentrated using Amicon Ultra Centrifugal Filters (Millipore #
UFC203024). The purified protein was then stored in this buffer at -80°C until needed for
experiments.
20
2.4 EMSA Experiments
2.4.1 IRE Comparative Gel
The first EMSA experiments compare the 52nt IRE (5’-AGAGU CGUCG GGGUU
UCCUG CUUCA ACAGU GCUUG GACGG AACCC GGCGC UC-3’), the 77nt IRE (5’-
GGCCU UCGGG CCAAG UUCUU CGCCG AGAGU CGUCG GGGUU UCCUG CUUCA
ACAGU GCUUG GACGG AACCC GGCGC UC-3’) used in AFM experiments, and the 132nt
IRE (5’- GGCCU UCGGG CCAAG UUCUU CGCCG AGAGU CGUCG GGGUU UCCUG
CUUCA ACAGU GCUUG GACGG AACCC GGCGC UCGUU CCCCA CCCCU CGAUC
CGGUU CGCCG GAUCC AAAUC GGGCU UCGGU UCCCG UUC-3’) used in hSHAPE
chemistry experiments. It was conducted to demonstrate both purity of each IRE RNA, and
binding ability to IRP. The ratio of IRP to IRE in this experiment was kept at 10:1, IRP:IRE. The
EMSA had separate 10 µL reaction solutions with and without the IRP containing the following:
0.2 µM of each respective IRE, 2 µM of IRP, 2.5X Binding Buffer (40 mM HEPES (pH 7.3), 80
mM KCl, 4 mM MgCl2, 4 mM DTT, and 20% Glycerol), and nuclease free H2O. The solutions
containing IRE and IRP underwent a 15 minute incubation period at room temperature to allow
for IRP-IRE complex formation. Each reaction was run in separate wells on an eight-well (7 cm
x 7 cm), 2% agarose gel at 120 volts for 30 minutes on a BioRad gel electrophoresis system
submerged in a 1X TBE buffer. The resulting gel was then stained for 30 minutes using Lonza
SYBR Green II RNA staining and then imaged under UV fluorescence. The gel was also stained
afterwards using Sigma Aldrich EZBlue protein staining mix.

21
2.4.2 Metal Ion Titration Gel
Metal Ion Titration using Mn2+ was conducted to observe the ability of the complex to
dissociate under various concentrations of Mn2+. A 16-well (14 cm(W) x 8 cm(L)) gel and C.B.S
Scientific Company, Inc. gel electrophoresis apparatus were used for this experiment. Sixteen
solutions were prepared for the Mn2+ titration. The first three solutions contained IRP only, IRE
only, and the IRP-IRE control with no Mn2+. The last 13 solutions contained Mn2+
concentrations ranging from 50 µM to 50 mM. Each solution contained a constant 10:1 ratio of
IRP:IRE. The 10 µL solution compositions were as follows: 0.2 µM 132nt IRE, 2 µM IRP,
(X)µM MnCl2, 2.5X Binding Buffer, and nuclease free H2O. The IRE and IRP underwent a 15
minute incubation period to allow for complex formation. The incubation period was then
followed by an introduction of the MnCl2 at each concentration for each respective solution and
a 15 minute interference/interaction period was allowed. The above reactions were performed at
room temperature. Afterwards, the solutions were loaded in the gel immersed in a 1X TBE
buffer and run for 30 minutes at 120 volts. The gel was then stained for 30 minutes in SYBR
Green II and imaged, followed by an EZBlue protein staining. The SYBR Green II image was
then analyzed using ImageJ software to determine the intensities of the RNA bands for curve
fitting analysis. Upon getting the intensities of each band, the following equation was used to
determine fraction of RNA bound:
Equation 1: Fraction bound = 𝑏𝑜𝑢𝑛𝑑 𝑅𝑁𝐴 𝑖𝑛𝑡𝑒𝑛𝑠𝑖𝑡𝑦
(𝑏𝑜𝑢𝑛𝑑 𝑅𝑁𝐴 𝑖𝑛𝑡𝑒𝑠𝑖𝑡𝑦+𝑢𝑛𝑑𝑏𝑜𝑢𝑛𝑑 𝑅𝑁𝐴 𝑖𝑛𝑡𝑒𝑠𝑖𝑡𝑦)
These values were then taken and plotted with the software program Kaleidagraph,
generating a graph of fraction bound vs. [Mn2+]. These points were then fit to a logarithmic
22
equation and a best-fit line was plotted using the software’s general curve fit definition option
and inserting the following equation:
Equation 2: y= 1-(m2*((m0)/(m0+m1))+m3);m1=1;m2=0.8;m3=0.01
Where m0 represents [Mn2+]; m1 represents the transition midpoint, [Mn2+]1/2; m2 represents the
transition amplitude; m3 represents the small baseline offset.
The resulting best-fit line was then calculated and plotted along the points of the
generated graph.
2.4.3 Mn2+ Pre-Incubation Experiments
For this set of EMSA experiments the period in which the Mn2+ ions were introduced to
our complex was changed. The Mn2+ ions were introduced to the IRE and IRP independently
prior to complex formation. We introduced 500 µM MnCl2 to IRE and IRP solutions for 15
minutes at room temperature prior to binding. In some of these experiments, either the IRE or the
IRP was incubated individually in 500 µM Mn2+ and the other member of the binding pair was
not exposed to Mn2+ in order to investigate the effects on each binding partner. We then
combined each component in a 10 µL mixture for complex binding. The experiments we ran
were either a protein titration (IRP:IRE ratios of 20:1, 10:1, 5:1, 2:1, and 1:1) or a constant 3:1
IRP:IRE ratio with different Mn2+ incubation conditions. The mixture again contained 500 µM
MnCl2, 0.2 µM IRE RNA previously incubated in Mn2+, 0.6 µM IRP (3:1 experiment)
previously incubated in Mn2+, 2.5X Binding buffer, and nuclease free H2O. The complex
formation incubation period was again 15 minutes at room temperature followed by
electrophoresis in a 1X TBE buffer at 120 volts for 30 minutes on the eight-well BioRad
23
electrophoresis apparatus. The experiment was also concluded with a SYBR Green II RNA
staining and an EZBlue Protein staining.
2.5 hSHAPE Chemistry Experiments
As mentioned in the introduction, hSHAPE chemistry is the acronym for a process. The
steps in the hSHAPE chemistry process are sequentially described in detail here.
2.5.1 Selective 2’ Hydroxyl Acylation
One micro molar 132nt IRE in a 0.5X TE buffer was heated at 95°C for two minutes and
then placed on ice for two minutes for proper conformational folding of the RNA. The IRE to be
used for the sequencing (ddNTP) reaction was kept on ice for the duration of the acylation
reactions. The IRE undergoing acylation was then mixed with the 2.5x Binding Buffer and
placed at 37°C for 20 minutes. After this 20 minute incubation, depending on the experiment,
IRP and/or MnCl2 was added after this step. IRP and IRE were incubated together for 15 minutes
followed by a 15 minute incubation in the experiment’s desired MnCl2 concentration, all at room
temperature. When IRP was involved, 2 µM concentrations were used to keep the ratio of
IRP:IRE at 10:1. After this step, 2’hydroxyl adduct formation was initiated. The solutions were
split into two tubes for a (+) reaction with the nucleophile 1-methyl-7-nitroisatoic anhaydride
(1M7), and a (-) reaction, without the 1M7. 1M7 diluted in dimethyl sulfoxide (DMSO) was
added to the (+) reaction at a final concentration of 3 mM for adduct formation. Only DMSO was
added to the (-) reaction. These solutions were then incubated for two minutes at 37°C followed
by an ethanol precipitation to obtain and concentrate the IRE with formed adducts.
24
2.5.2 Primer Extension
The primer extension reactions included the (+) reaction, (-) reaction, and a sequencing
reaction. Different fluorescently labeled DNA primers (5’-GAACCGGACCGAAGCCCG-3’)
were added to each of the three reactions. The reactions were incubated at 65°C for six minutes
followed by a 15 minute incubation at 35°C. Afterward, a reverse transcription buffer (50 mM
Tris-HCL (pH 8.3), 75 mM KCL, 3 mM MgCl2, 5 mM DTT, 0.5 mM dATP, dGTP, dCTP,
dTTP, and nuclease free H2O) was added to each reaction, along with a ddNTP (A,T,C, or G) to
only the sequencing reaction. The reactions are then heated to 52°C for one minute. Next, the
reverse transcriptase enzyme (SuperScript III, from Life Technologies, Corp.) was added to all
reactions and allowed to incubate for an additional ten minutes at 52°C. Afterwards, a
sequencing stop mix (1:1 of 100 mM EDTA: 3M NaOAc) was added to each reaction to stop the
reverse transcription. The (+) reaction, (-) reaction, and sequencing reaction were combined to a
single tube and ethanol precipitated to collected the newly formed cDNA fragments.
2.5.3 Capillary Electrophoresis
cDNA fragments are separated by size via capillary electrophoresis. Capillary
electrophoresis experiments were done on an ABI Prism® 310 Genetic Analyzer (Figure 12)
from Applied Biosystems. The genetic analyzer was cleaned and pre-loaded with a 1X ABI
buffer and Performance Optimized Polymer 4 (POP-4TM) prior to use. Each run consisted of one
combination of reactions. Runs lasted for 25 minutes and were kept at 15kV and 60°C. After runs
were completed, the raw electropherogram data was stored to the computer hard drive to be used
for analysis.
25
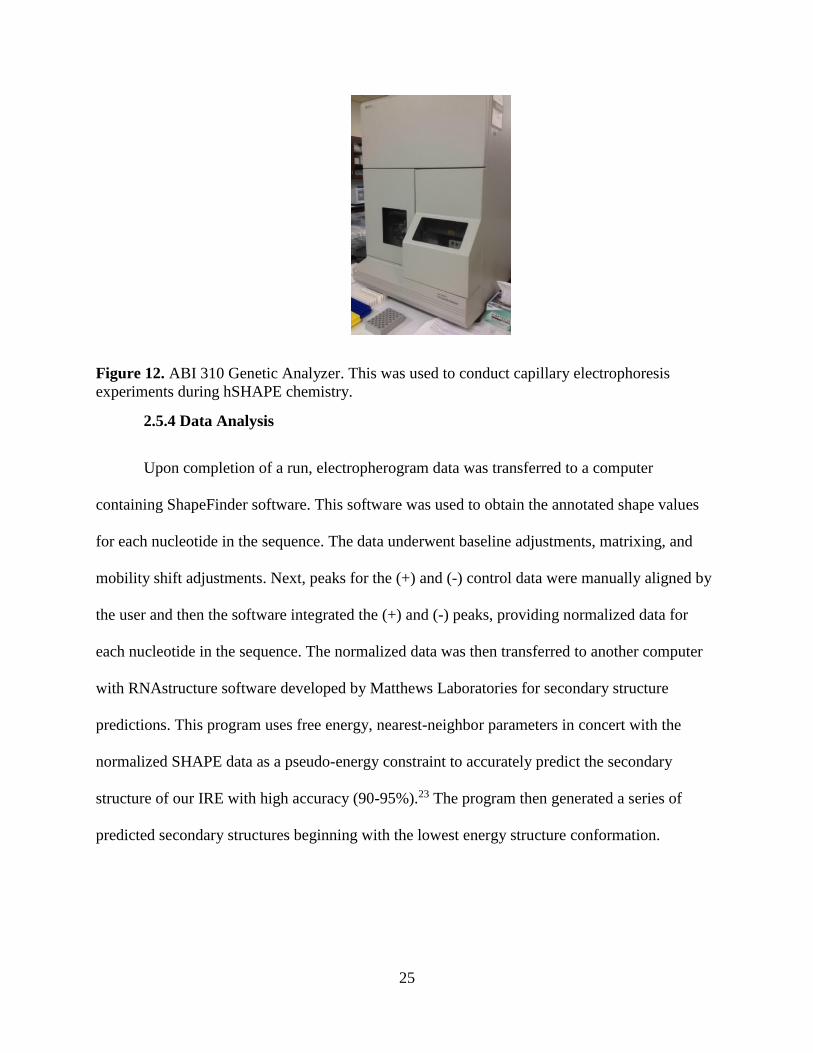
Figure 12. ABI 310 Genetic Analyzer. This was used to conduct capillary electrophoresis
experiments during hSHAPE chemistry.
2.5.4 Data Analysis
Upon completion of a run, electropherogram data was transferred to a computer
containing ShapeFinder software. This software was used to obtain the annotated shape values
for each nucleotide in the sequence. The data underwent baseline adjustments, matrixing, and
mobility shift adjustments. Next, peaks for the (+) and (-) control data were manually aligned by
the user and then the software integrated the (+) and (-) peaks, providing normalized data for
each nucleotide in the sequence. The normalized data was then transferred to another computer
with RNAstructure software developed by Matthews Laboratories for secondary structure
predictions. This program uses free energy, nearest-neighbor parameters in concert with the
normalized SHAPE data as a pseudo-energy constraint to accurately predict the secondary
structure of our IRE with high accuracy (90-95%).23 The program then generated a series of
predicted secondary structures beginning with the lowest energy structure conformation.
26
2.6 AFM Experiments
To conduct the AFM experiments, a construct needed to be developed to image the IRP-
IRE complex. This construct was derived from a series of SPR experiments that were being
conducted by the Day Lab at Marshall University. G3 Dendrons were conjugated with a
complimentary 26 base pair NH2-DNA strand ordered from IDT to act as the base of our
construct. Before each AFM experiment, the conjugated dendrons were reacted with
hydroxylamine for 30 minutes to expose the thiol groups of the dendron for binding to the gold
surfaces. All surfaces used for the experiments were 1mm x 1mm (111) Gold annealed Mica
surfaces purchased from the PHASIS group in Switzerland. 500 pM dendron solutions were used
to achieve resolution of single molecules and not a monolayer formation. After the
hydroxylamine reaction, a 5 µL droplet was applied to the Gold-Mica surface. All dendron-to-
surface binding steps were allowed five minutes of interaction to ensure binding. Once the
sample surface was ready, the surface was placed in a solution cell in the Bruker Corporation
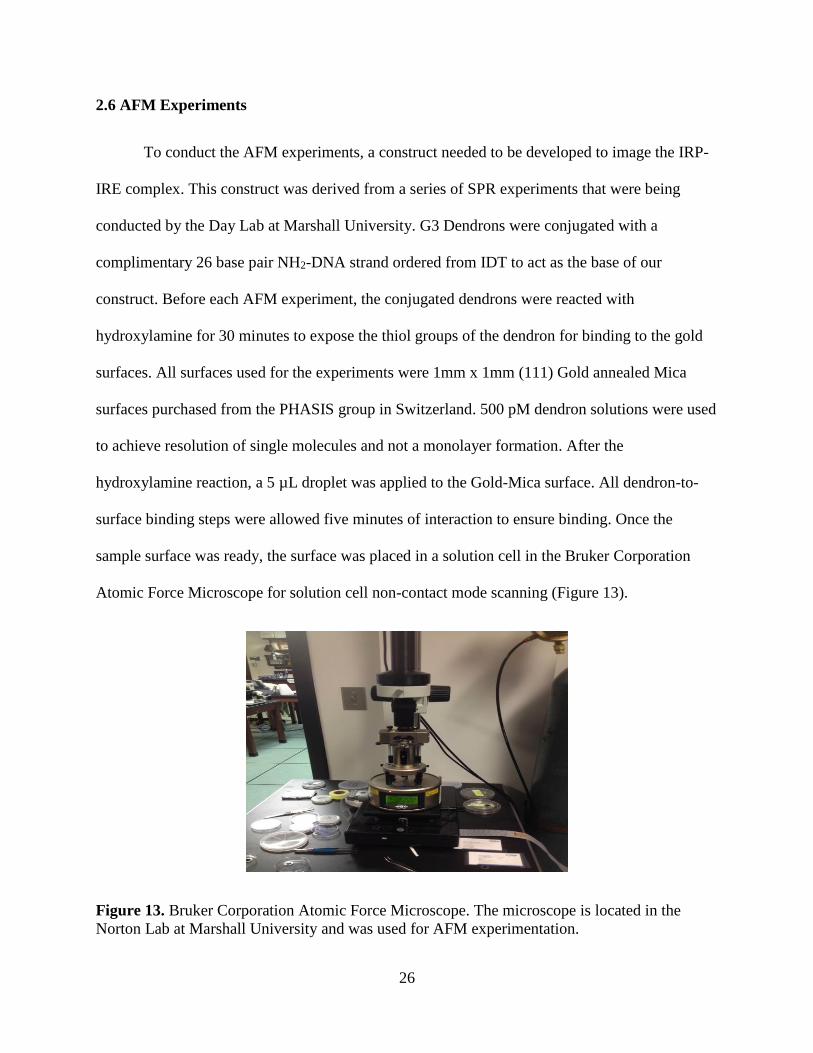
Atomic Force Microscope for solution cell non-contact mode scanning (Figure 13).
Figure 13. Bruker Corporation Atomic Force Microscope. The microscope is located in the
Norton Lab at Marshall University and was used for AFM experimentation.

27
The solution cell was filled with TE Buffer (pH 8.0) after the surfaces were reacted with
the 500 pM dendron solution. Images were then taken to determine z-heights of the dendrons on
the surface. Next, 77nt IRE RNA was added to the surface for a total IRE concentration of 10
nM and allowed 15 minutes for binding to the complementary DNA dendrons (5’- TCGGC
GAAGA ACTTG GCCCG AAGGCC/3AmMC6T/-3’). The cell was then washed with 1X
Binding Buffer (10mM HEPES (7.3 pH), 20 mM KCl, 1 mM MgCl2, 1 mM DTT, 5% Glycerol)
and imaged to observe the next stepwise increase in z-height. After the IRE addition scans, 20
nM of IRP was added to the solution cell and allowed 30 minutes to interact for complex
formation. Scans were being run during this 30 minute binding period to observe the final
increases in z-height of any DNA-IRE-IRP complexes on the Gold-Mica surface. Lastly, 500 µM
of MnCl2 was added to the solution cell and imaged over a period of 20 minutes to observe any
decreases in z-height, which could be indicative of complex dissociation. The resulting images
from all scans were processed using Bruker’s NanoScope Analysis software.
28
CHAPTER 3
EXPERIMENTAL RESULTS
The first set of experiments conducted were done to observe the binding of the IRP-IRE
complex using each one of the techniques. Once this was achieved, it was feasible to advance to
more interrogative experiments on the complex using any one of the techniques.
3.1 IRP-IRE Complex Formation EMSA Gel Experiment
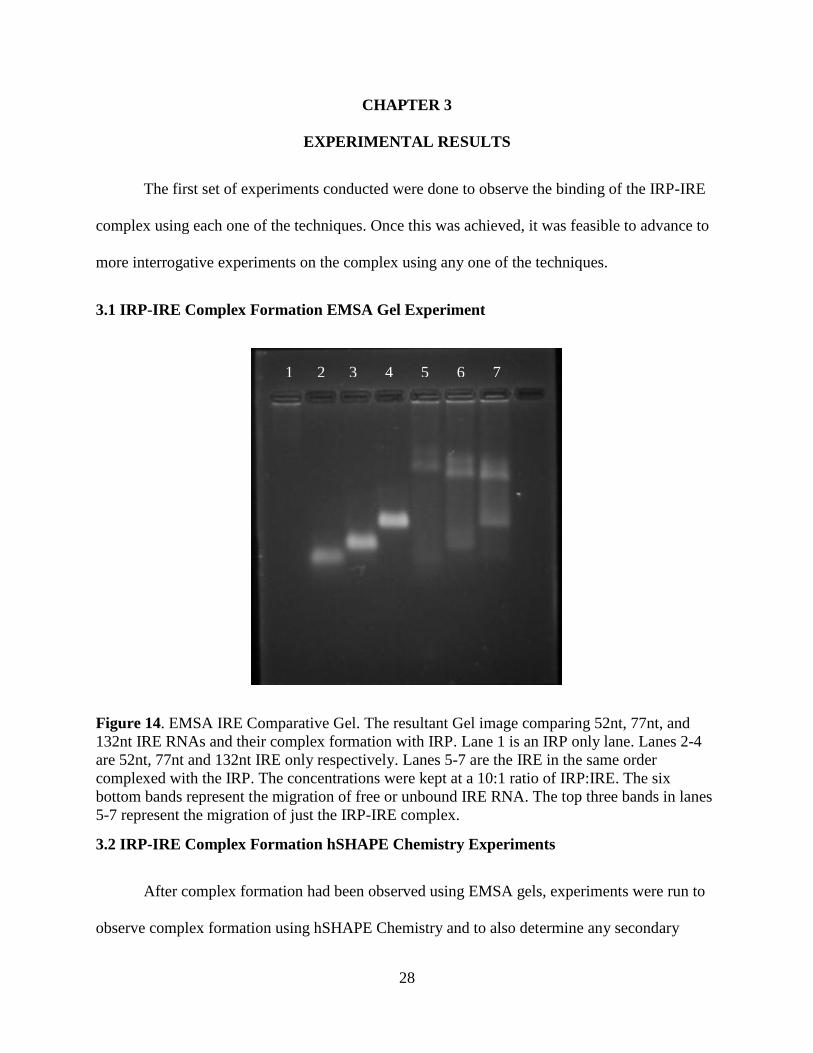
Figure 14. EMSA IRE Comparative Gel. The resultant Gel image comparing 52nt, 77nt, and
132nt IRE RNAs and their complex formation with IRP. Lane 1 is an IRP only lane. Lanes 2-4
are 52nt, 77nt and 132nt IRE only respectively. Lanes 5-7 are the IRE in the same order
complexed with the IRP. The concentrations were kept at a 10:1 ratio of IRP:IRE. The six
bottom bands represent the migration of free or unbound IRE RNA. The top three bands in lanes
5-7 represent the migration of just the IRP-IRE complex.
3.2 IRP-IRE Complex Formation hSHAPE Chemistry Experiments
After complex formation had been observed using EMSA gels, experiments were run to
observe complex formation using hSHAPE Chemistry and to also determine any secondary
1 2 3 4 5 6 7
29
structural modifications made to the IRE upon successful complex formation. Additionally,
mutant IRE was also used for hSHAPE chemistry experiments. In these experiments, the
IRP:IRE ratio was kept at 10:1. Three trials were run on each set of experimental conditions and
the figures below represent the averages of each set of experimental conditions.
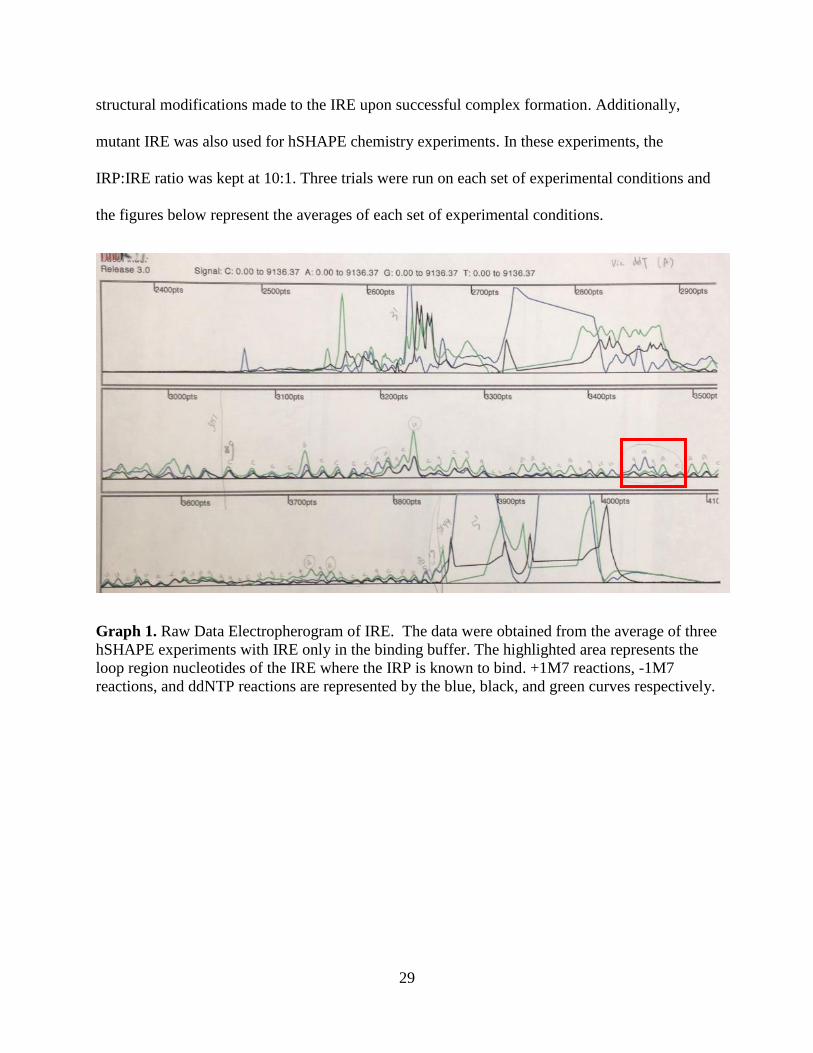
Graph 1. Raw Data Electropherogram of IRE. The data were obtained from the average of three
hSHAPE experiments with IRE only in the binding buffer. The highlighted area represents the
loop region nucleotides of the IRE where the IRP is known to bind. +1M7 reactions, -1M7
reactions, and ddNTP reactions are represented by the blue, black, and green curves respectively.
30
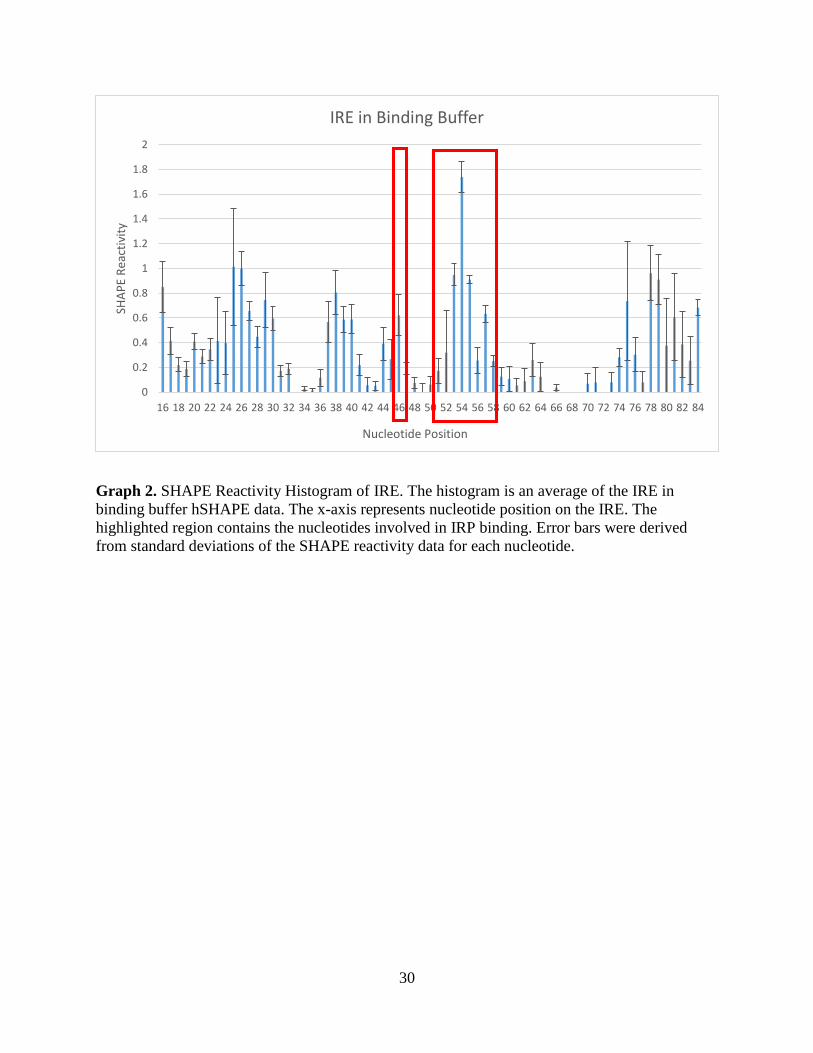
Graph 2. SHAPE Reactivity Histogram of IRE. The histogram is an average of the IRE in
binding buffer hSHAPE data. The x-axis represents nucleotide position on the IRE. The
highlighted region contains the nucleotides involved in IRP binding. Error bars were derived
from standard deviations of the SHAPE reactivity data for each nucleotide.
0
0.2
0.4
0.6
0.8
1
1.2
1.4
1.6
1.8
2
16 18 20 22 24 26 28 30 32 34 36 38 40 42 44 46 48 50 52 54 56 58 60 62 64 66 68 70 72 74 76 78 80 82 84
SHA
PE
Rea
ctiv
ity
Nucleotide Position
IRE in Binding Buffer
31
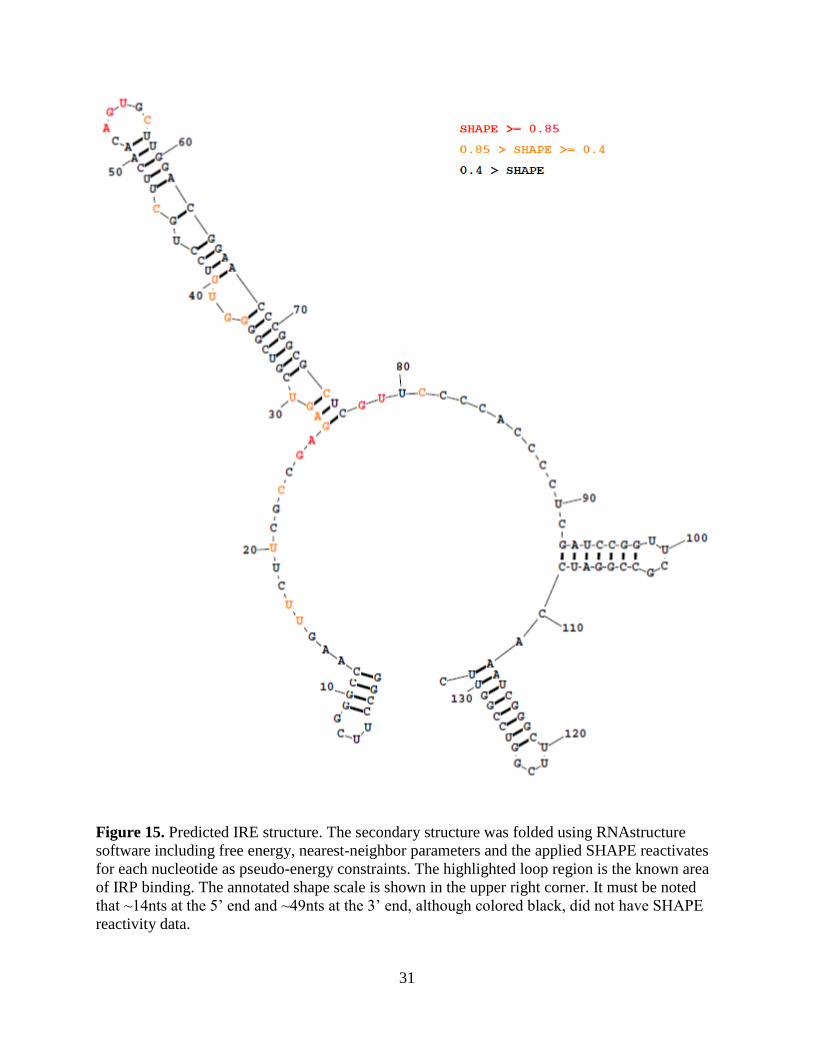
Figure 15. Predicted IRE structure. The secondary structure was folded using RNAstructure
software including free energy, nearest-neighbor parameters and the applied SHAPE reactivates
for each nucleotide as pseudo-energy constraints. The highlighted loop region is the known area
of IRP binding. The annotated shape scale is shown in the upper right corner. It must be noted
that ~14nts at the 5’ end and ~49nts at the 3’ end, although colored black, did not have SHAPE
reactivity data.

32
Graph 3. Raw Data Electropherogram of IRE with IRP. The data were obtained from the
average of three hSHAPE experiments with IRE bound to the IRP in the binding buffer. The
highlighted area represents the loop region nucleotides of the IRE where the IRP is known to
bind. +1M7 reactions, -1M7 reactions, and ddNTP reactions are represented by the blue, black,
and green curves respectively.
33
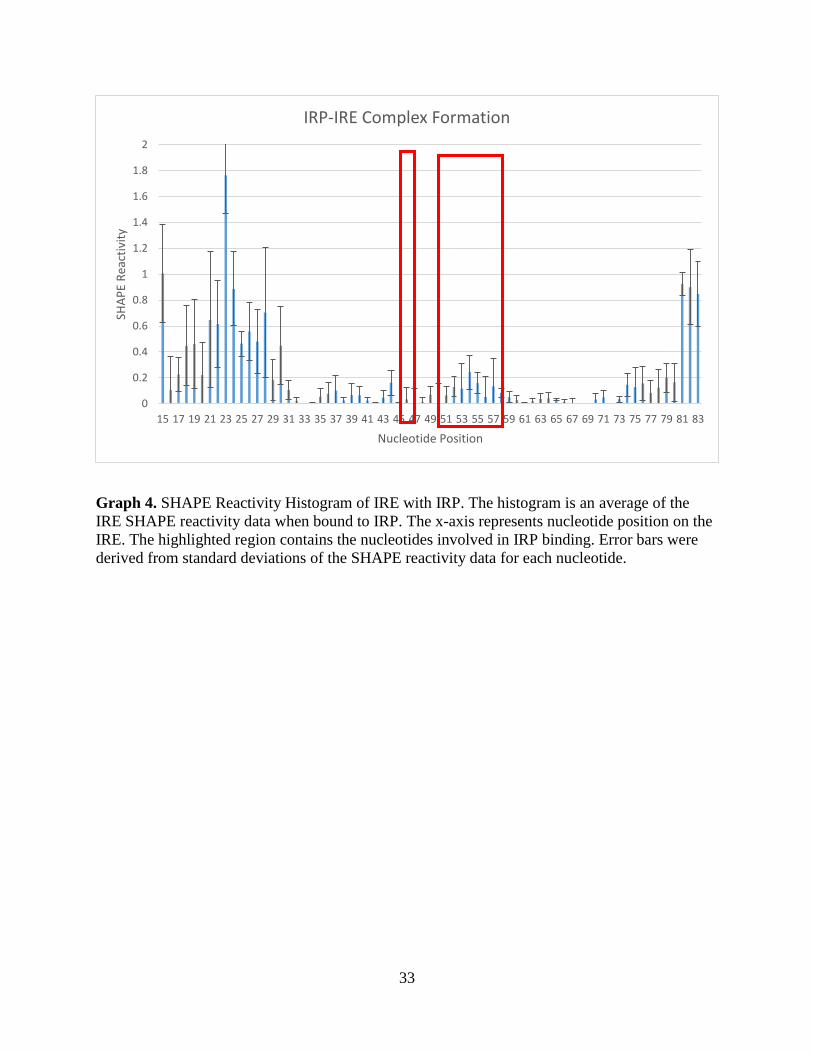
Graph 4. SHAPE Reactivity Histogram of IRE with IRP. The histogram is an average of the
IRE SHAPE reactivity data when bound to IRP. The x-axis represents nucleotide position on the
IRE. The highlighted region contains the nucleotides involved in IRP binding. Error bars were
derived from standard deviations of the SHAPE reactivity data for each nucleotide.
0
0.2
0.4
0.6
0.8
1
1.2
1.4
1.6
1.8
2
15 17 19 21 23 25 27 29 31 33 35 37 39 41 43 45 47 49 51 53 55 57 59 61 63 65 67 69 71 73 75 77 79 81 83
SHA
PE
Rea
ctiv
ity
Nucleotide Position
IRP-IRE Complex Formation
34
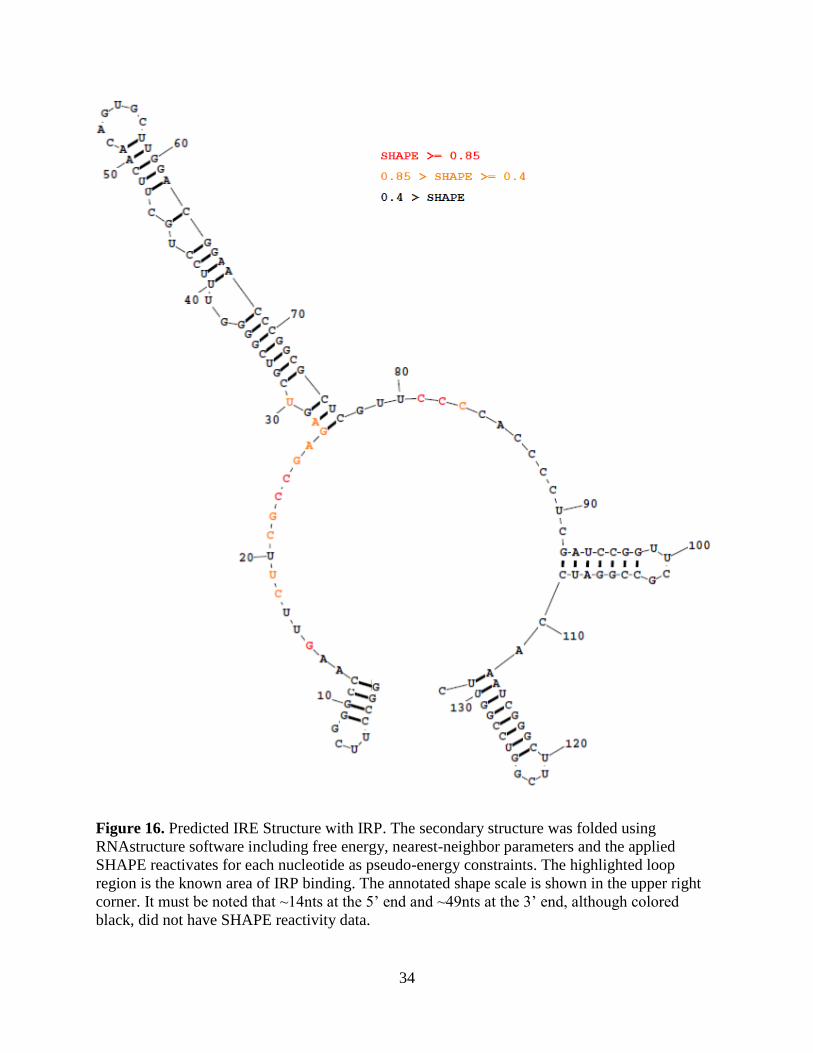
Figure 16. Predicted IRE Structure with IRP. The secondary structure was folded using
RNAstructure software including free energy, nearest-neighbor parameters and the applied
SHAPE reactivates for each nucleotide as pseudo-energy constraints. The highlighted loop
region is the known area of IRP binding. The annotated shape scale is shown in the upper right
corner. It must be noted that ~14nts at the 5’ end and ~49nts at the 3’ end, although colored
black, did not have SHAPE reactivity data.
35
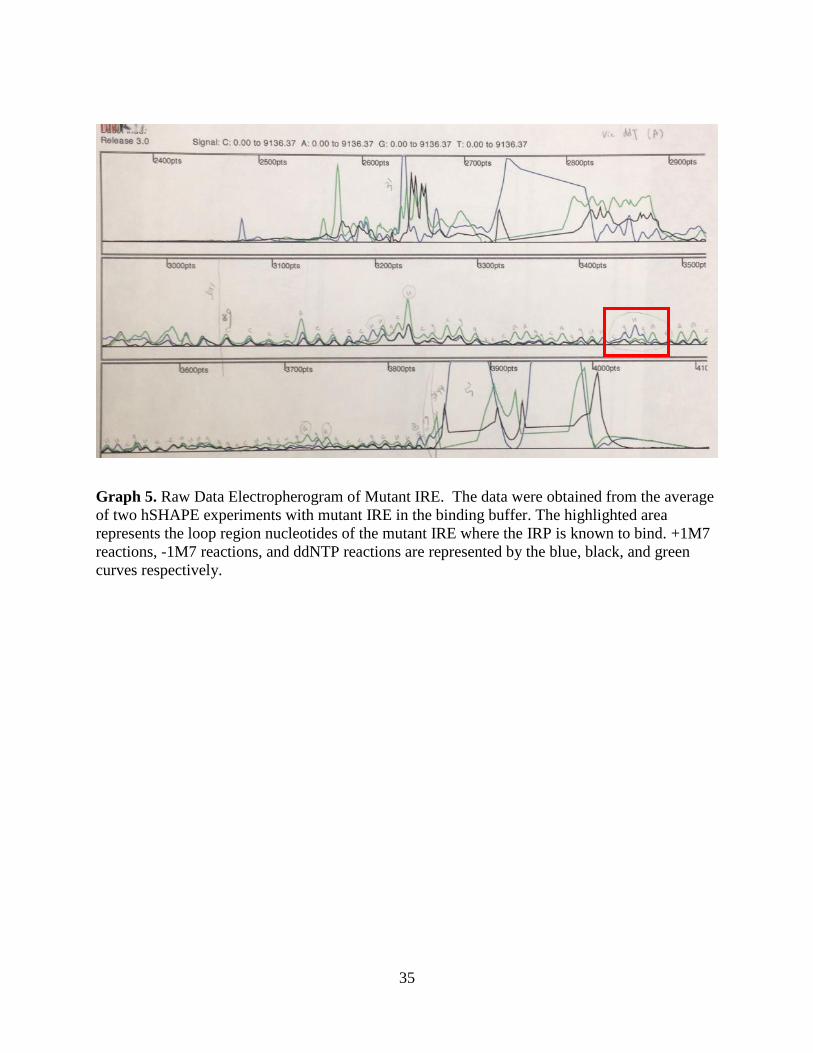
Graph 5. Raw Data Electropherogram of Mutant IRE. The data were obtained from the average
of two hSHAPE experiments with mutant IRE in the binding buffer. The highlighted area
represents the loop region nucleotides of the mutant IRE where the IRP is known to bind. +1M7
reactions, -1M7 reactions, and ddNTP reactions are represented by the blue, black, and green
curves respectively.
36
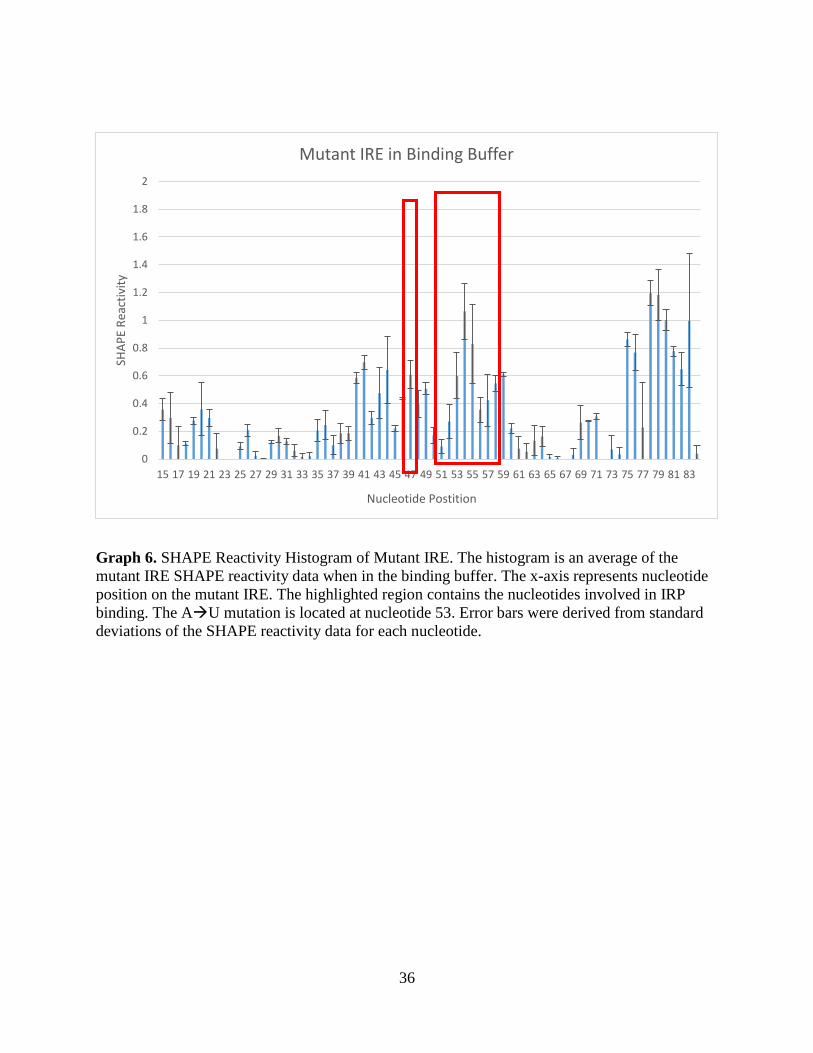
Graph 6. SHAPE Reactivity Histogram of Mutant IRE. The histogram is an average of the
mutant IRE SHAPE reactivity data when in the binding buffer. The x-axis represents nucleotide
position on the mutant IRE. The highlighted region contains the nucleotides involved in IRP
binding. The AU mutation is located at nucleotide 53. Error bars were derived from standard
deviations of the SHAPE reactivity data for each nucleotide.
0
0.2
0.4
0.6
0.8
1
1.2
1.4
1.6
1.8
2
15 17 19 21 23 25 27 29 31 33 35 37 39 41 43 45 47 49 51 53 55 57 59 61 63 65 67 69 71 73 75 77 79 81 83
SHA
PE
Rea
ctiv
ity
Nucleotide Postition
Mutant IRE in Binding Buffer
37
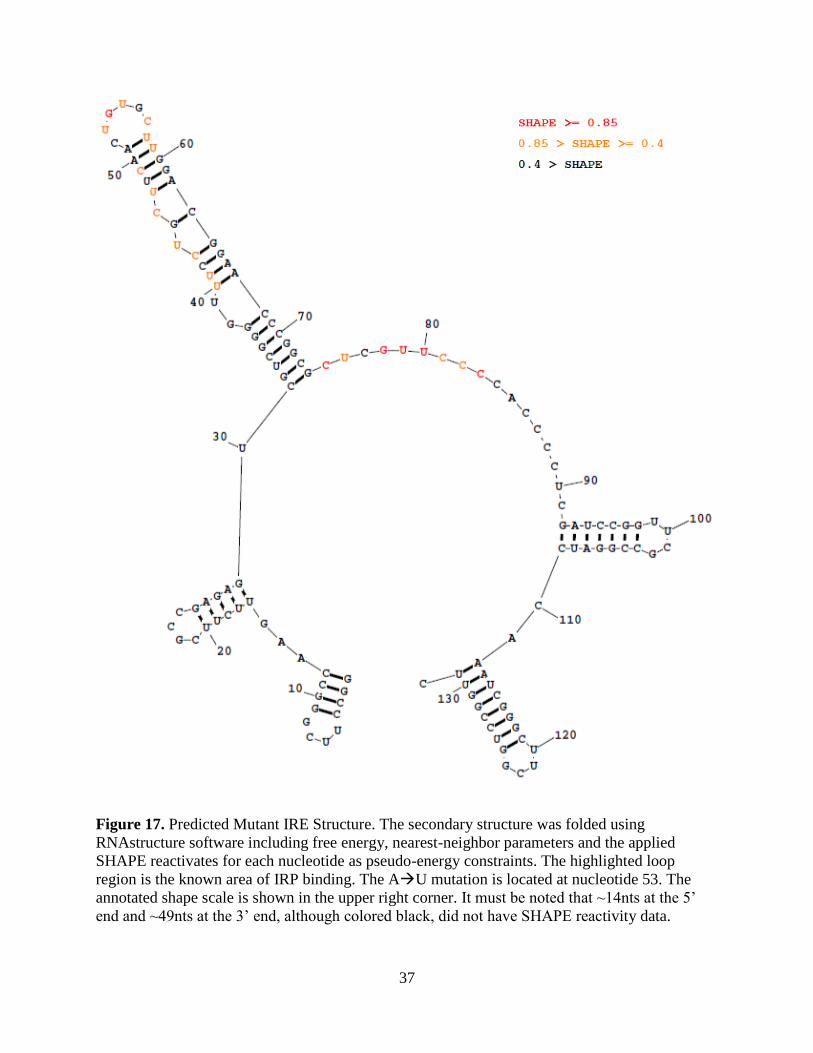
Figure 17. Predicted Mutant IRE Structure. The secondary structure was folded using
RNAstructure software including free energy, nearest-neighbor parameters and the applied
SHAPE reactivates for each nucleotide as pseudo-energy constraints. The highlighted loop
region is the known area of IRP binding. The AU mutation is located at nucleotide 53. The
annotated shape scale is shown in the upper right corner. It must be noted that ~14nts at the 5’
end and ~49nts at the 3’ end, although colored black, did not have SHAPE reactivity data.
38
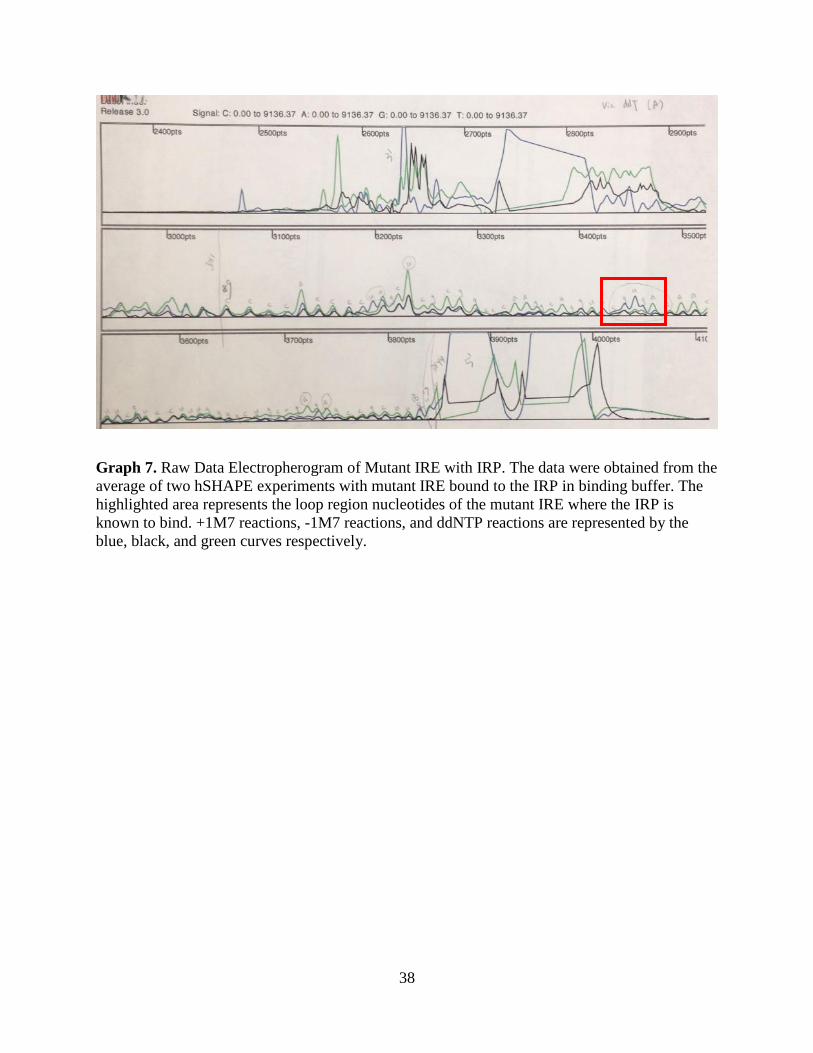
Graph 7. Raw Data Electropherogram of Mutant IRE with IRP. The data were obtained from the
average of two hSHAPE experiments with mutant IRE bound to the IRP in binding buffer. The
highlighted area represents the loop region nucleotides of the mutant IRE where the IRP is
known to bind. +1M7 reactions, -1M7 reactions, and ddNTP reactions are represented by the
blue, black, and green curves respectively.
39
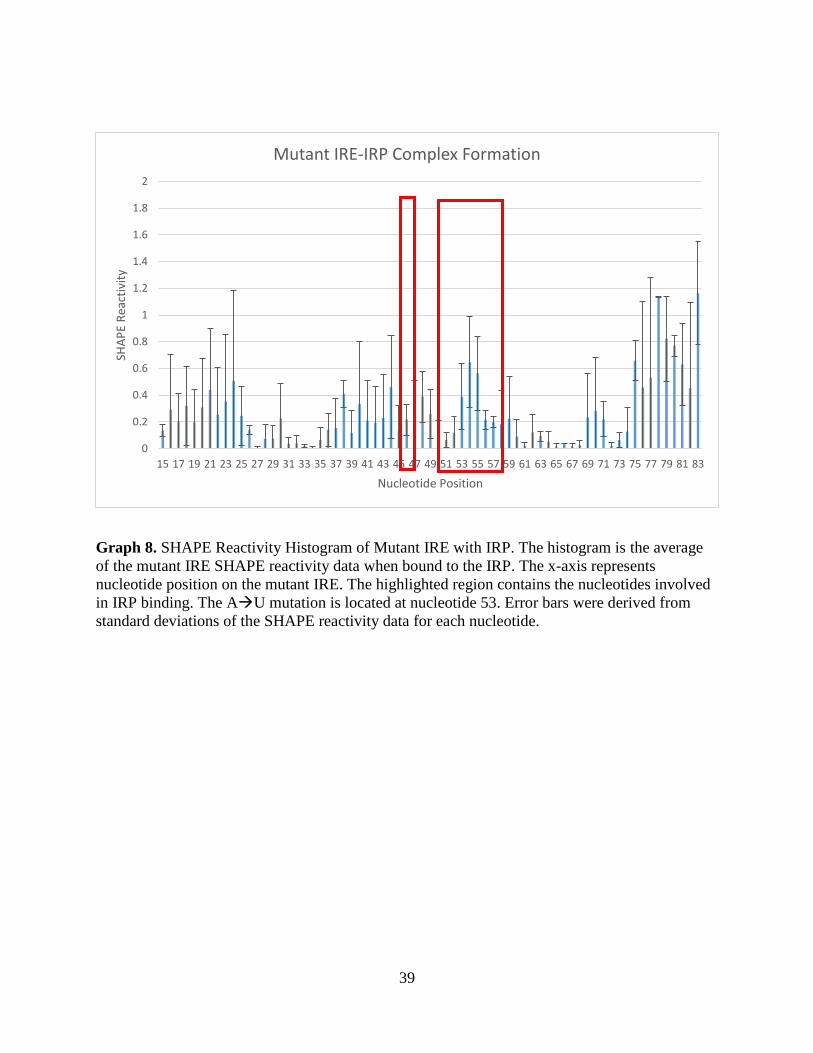
Graph 8. SHAPE Reactivity Histogram of Mutant IRE with IRP. The histogram is the average
of the mutant IRE SHAPE reactivity data when bound to the IRP. The x-axis represents
nucleotide position on the mutant IRE. The highlighted region contains the nucleotides involved
in IRP binding. The AU mutation is located at nucleotide 53. Error bars were derived from
standard deviations of the SHAPE reactivity data for each nucleotide.
0
0.2
0.4
0.6
0.8
1
1.2
1.4
1.6
1.8
2
15 17 19 21 23 25 27 29 31 33 35 37 39 41 43 45 47 49 51 53 55 57 59 61 63 65 67 69 71 73 75 77 79 81 83
SHA
PE
Rea
ctiv
ity
Nucleotide Position
Mutant IRE-IRP Complex Formation
40
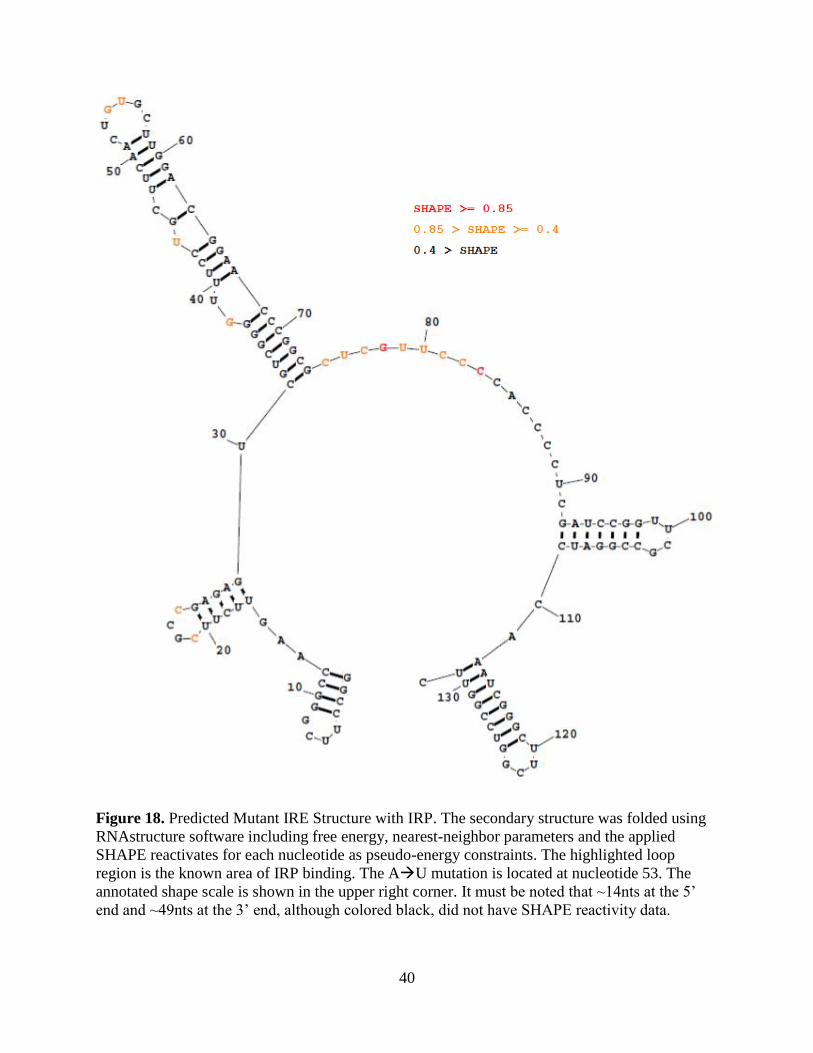
Figure 18. Predicted Mutant IRE Structure with IRP. The secondary structure was folded using
RNAstructure software including free energy, nearest-neighbor parameters and the applied
SHAPE reactivates for each nucleotide as pseudo-energy constraints. The highlighted loop
region is the known area of IRP binding. The AU mutation is located at nucleotide 53. The
annotated shape scale is shown in the upper right corner. It must be noted that ~14nts at the 5’
end and ~49nts at the 3’ end, although colored black, did not have SHAPE reactivity data.
41
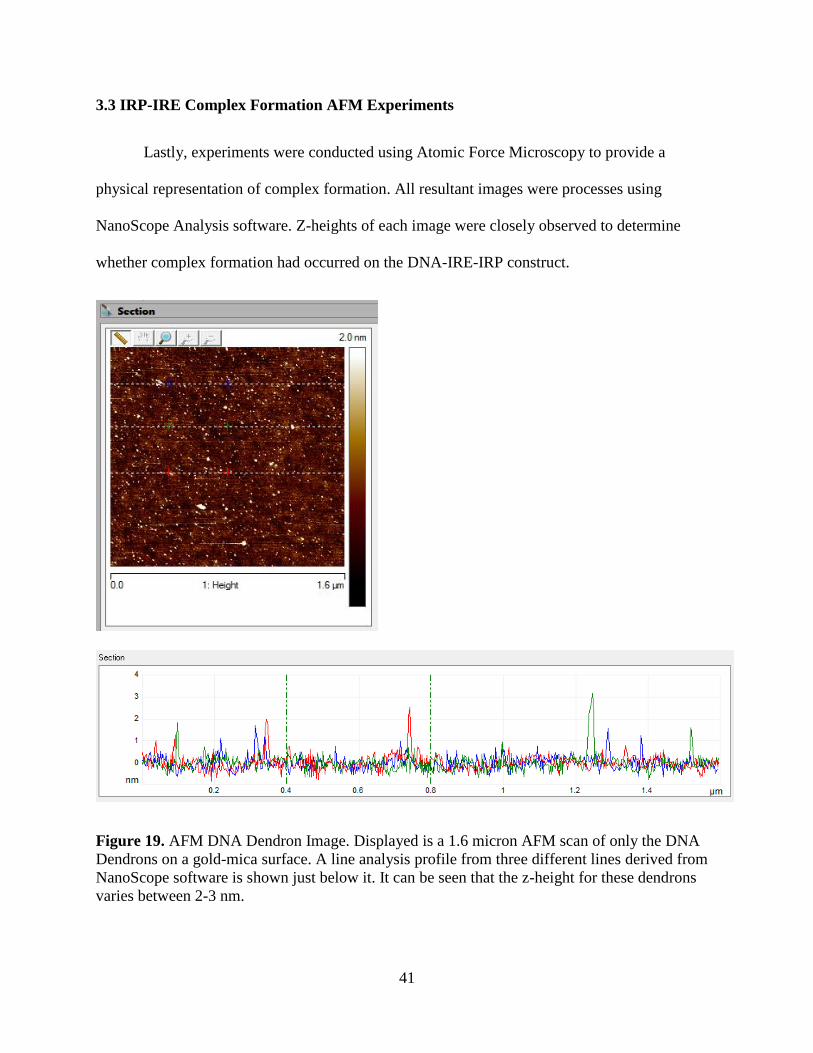
3.3 IRP-IRE Complex Formation AFM Experiments
Lastly, experiments were conducted using Atomic Force Microscopy to provide a
physical representation of complex formation. All resultant images were processes using
NanoScope Analysis software. Z-heights of each image were closely observed to determine
whether complex formation had occurred on the DNA-IRE-IRP construct.
Figure 19. AFM DNA Dendron Image. Displayed is a 1.6 micron AFM scan of only the DNA
Dendrons on a gold-mica surface. A line analysis profile from three different lines derived from
NanoScope software is shown just below it. It can be seen that the z-height for these dendrons
varies between 2-3 nm.
42
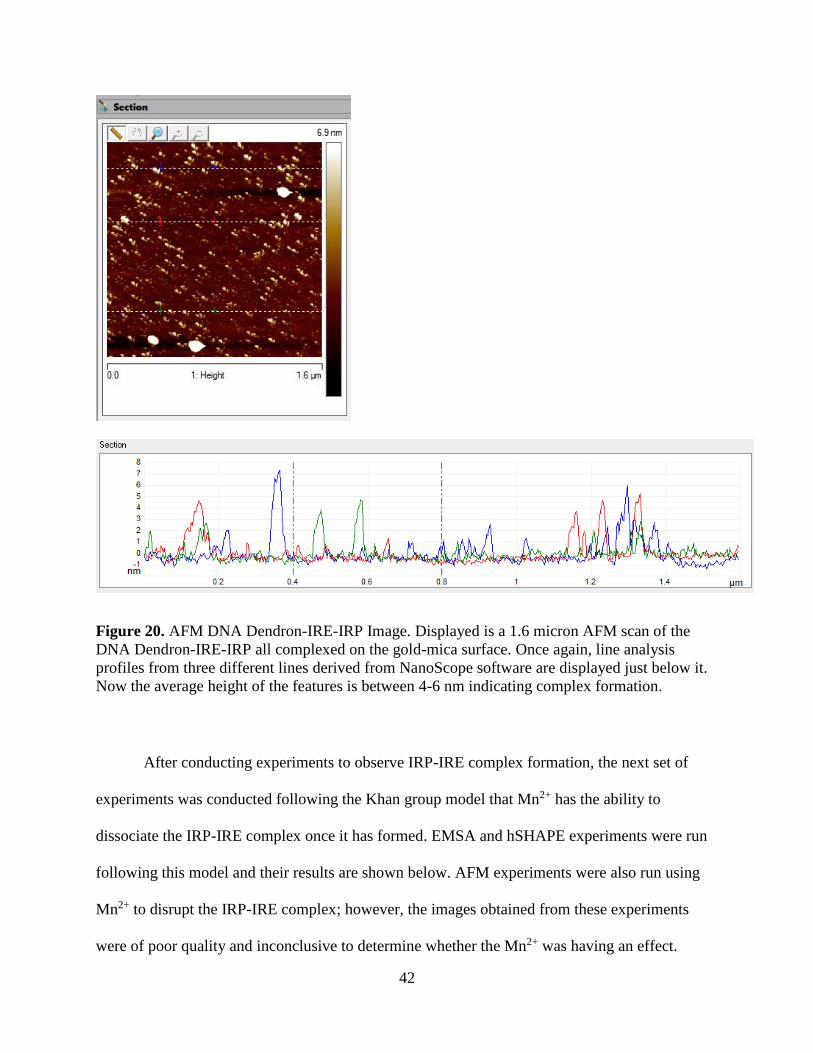
Figure 20. AFM DNA Dendron-IRE-IRP Image. Displayed is a 1.6 micron AFM scan of the
DNA Dendron-IRE-IRP all complexed on the gold-mica surface. Once again, line analysis
profiles from three different lines derived from NanoScope software are displayed just below it.
Now the average height of the features is between 4-6 nm indicating complex formation.
After conducting experiments to observe IRP-IRE complex formation, the next set of
experiments was conducted following the Khan group model that Mn2+ has the ability to
dissociate the IRP-IRE complex once it has formed. EMSA and hSHAPE experiments were run
following this model and their results are shown below. AFM experiments were also run using
Mn2+ to disrupt the IRP-IRE complex; however, the images obtained from these experiments
were of poor quality and inconclusive to determine whether the Mn2+ was having an effect.
43
3.4 IRP-IRE Complex Dissociation EMSA Mn2+ Titration
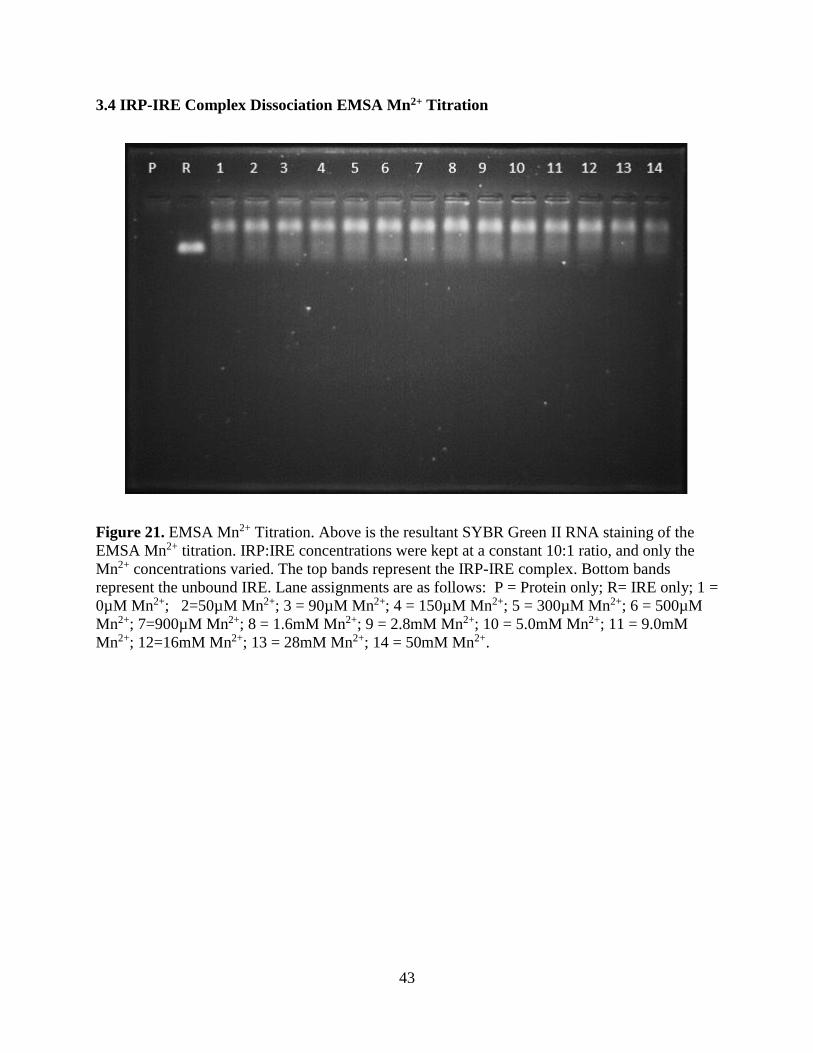
Figure 21. EMSA Mn2+ Titration. Above is the resultant SYBR Green II RNA staining of the
EMSA Mn2+ titration. IRP:IRE concentrations were kept at a constant 10:1 ratio, and only the
Mn2+ concentrations varied. The top bands represent the IRP-IRE complex. Bottom bands
represent the unbound IRE. Lane assignments are as follows: P = Protein only; R= IRE only; 1 =
0µM Mn2+; 2=50µM Mn2+; 3 = 90µM Mn2+; 4 = 150µM Mn2+; 5 = 300µM Mn2+; 6 = 500µM
Mn2+; 7=900µM Mn2+; 8 = 1.6mM Mn2+; 9 = 2.8mM Mn2+; 10 = 5.0mM Mn2+; 11 = 9.0mM
Mn2+; 12=16mM Mn2+; 13 = 28mM Mn2+; 14 = 50mM Mn2+.
44
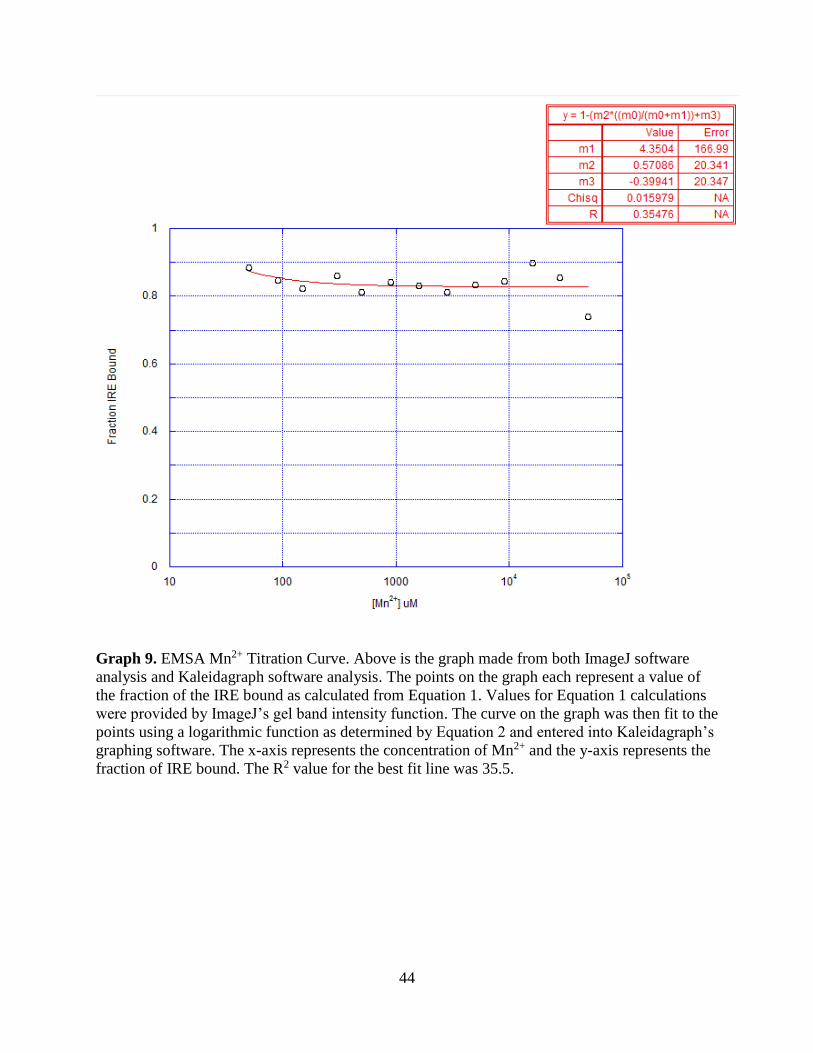
Graph 9. EMSA Mn2+ Titration Curve. Above is the graph made from both ImageJ software
analysis and Kaleidagraph software analysis. The points on the graph each represent a value of
the fraction of the IRE bound as calculated from Equation 1. Values for Equation 1 calculations
were provided by ImageJ’s gel band intensity function. The curve on the graph was then fit to the
points using a logarithmic function as determined by Equation 2 and entered into Kaleidagraph’s
graphing software. The x-axis represents the concentration of Mn2+ and the y-axis represents the
fraction of IRE bound. The R2 value for the best fit line was 35.5.
45
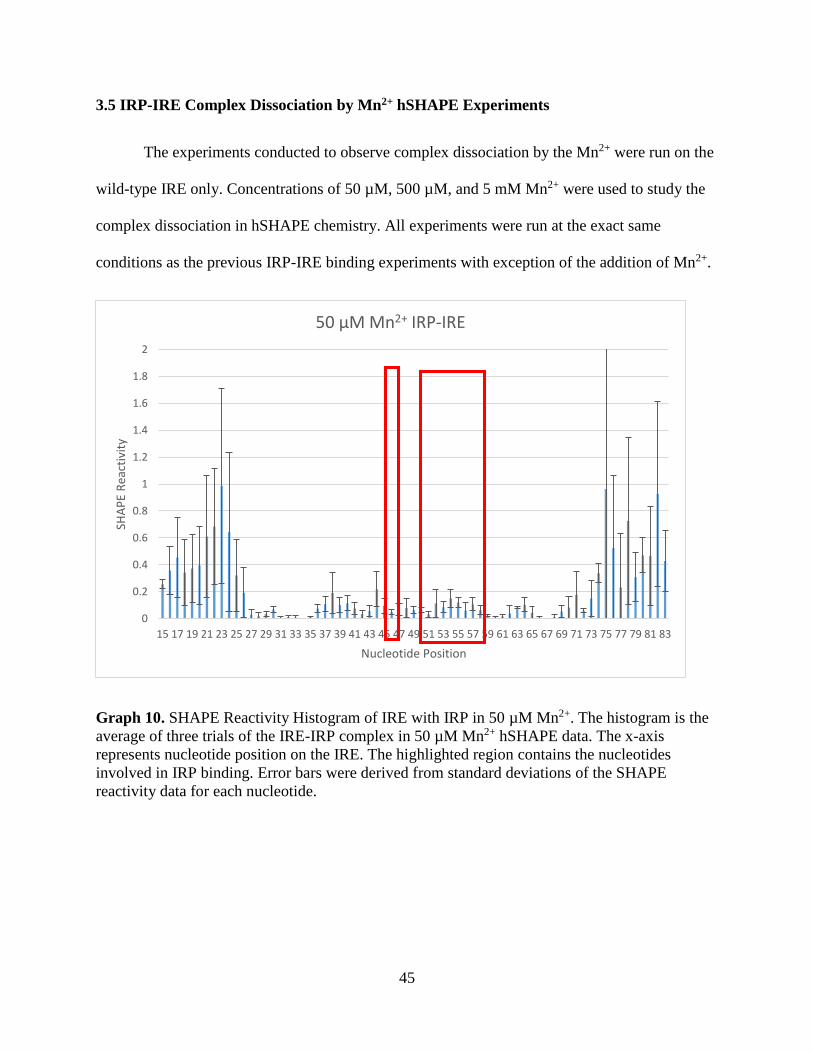
3.5 IRP-IRE Complex Dissociation by Mn2+ hSHAPE Experiments
The experiments conducted to observe complex dissociation by the Mn2+ were run on the
wild-type IRE only. Concentrations of 50 µM, 500 µM, and 5 mM Mn2+ were used to study the
complex dissociation in hSHAPE chemistry. All experiments were run at the exact same
conditions as the previous IRP-IRE binding experiments with exception of the addition of Mn2+.
Graph 10. SHAPE Reactivity Histogram of IRE with IRP in 50 µM Mn2+. The histogram is the
average of three trials of the IRE-IRP complex in 50 µM Mn2+ hSHAPE data. The x-axis
represents nucleotide position on the IRE. The highlighted region contains the nucleotides
involved in IRP binding. Error bars were derived from standard deviations of the SHAPE
reactivity data for each nucleotide.
0
0.2
0.4
0.6
0.8
1
1.2
1.4
1.6
1.8
2
15 17 19 21 23 25 27 29 31 33 35 37 39 41 43 45 47 49 51 53 55 57 59 61 63 65 67 69 71 73 75 77 79 81 83
SHA
PE
Rea
ctiv
ity
Nucleotide Position
50 µM Mn2+ IRP-IRE
46
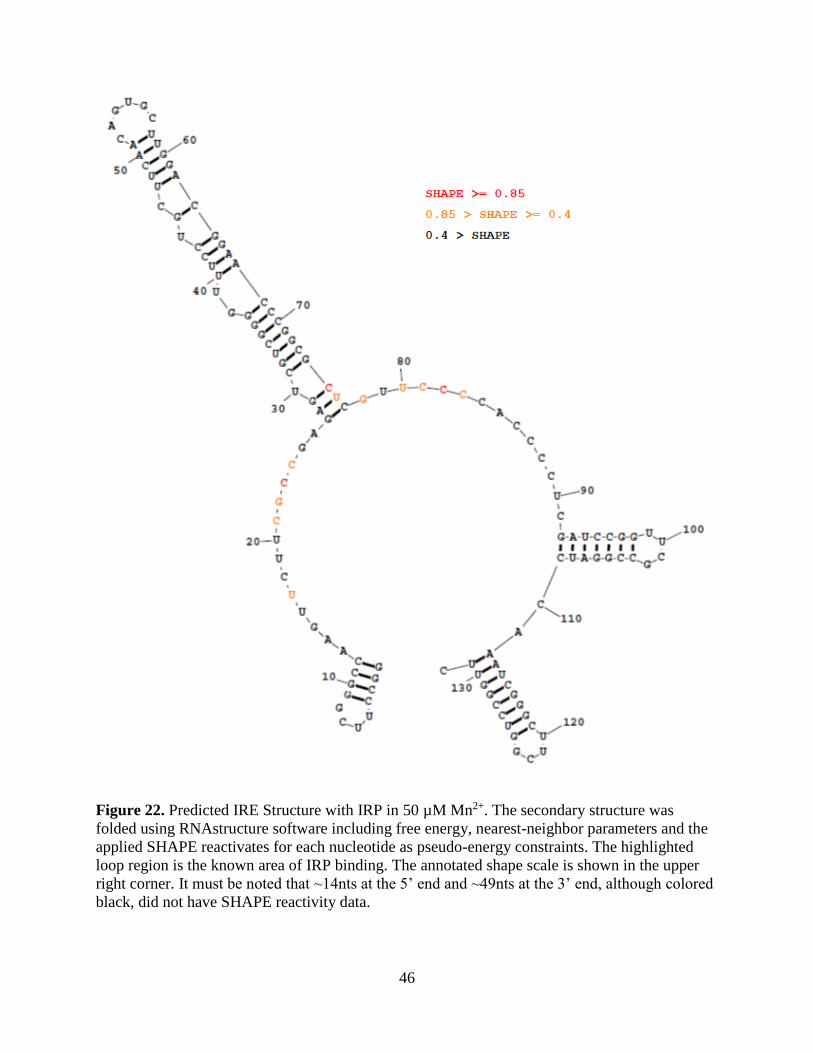
Figure 22. Predicted IRE Structure with IRP in 50 µM Mn2+. The secondary structure was
folded using RNAstructure software including free energy, nearest-neighbor parameters and the
applied SHAPE reactivates for each nucleotide as pseudo-energy constraints. The highlighted
loop region is the known area of IRP binding. The annotated shape scale is shown in the upper
right corner. It must be noted that ~14nts at the 5’ end and ~49nts at the 3’ end, although colored
black, did not have SHAPE reactivity data.
47
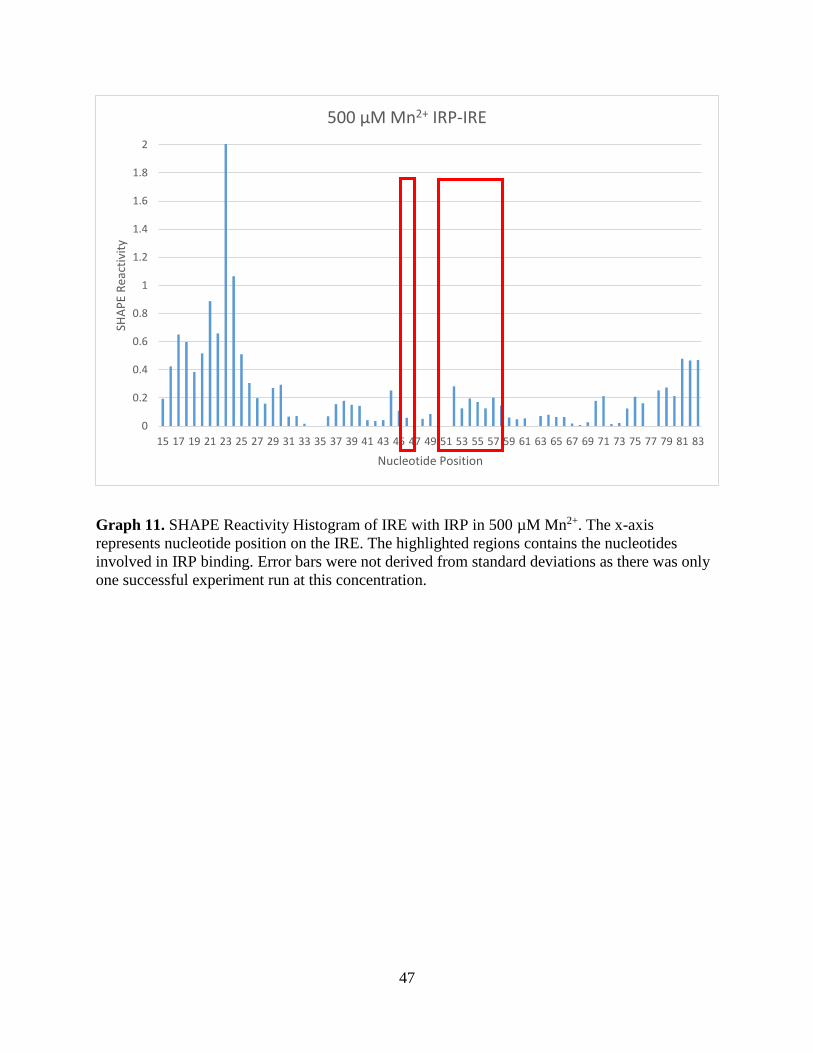
Graph 11. SHAPE Reactivity Histogram of IRE with IRP in 500 µM Mn2+. The x-axis
represents nucleotide position on the IRE. The highlighted regions contains the nucleotides
involved in IRP binding. Error bars were not derived from standard deviations as there was only
one successful experiment run at this concentration.
0
0.2
0.4
0.6
0.8
1
1.2
1.4
1.6
1.8
2
15 17 19 21 23 25 27 29 31 33 35 37 39 41 43 45 47 49 51 53 55 57 59 61 63 65 67 69 71 73 75 77 79 81 83
SHA
PE
Rea
ctiv
ity
Nucleotide Position
500 µM Mn2+ IRP-IRE
48
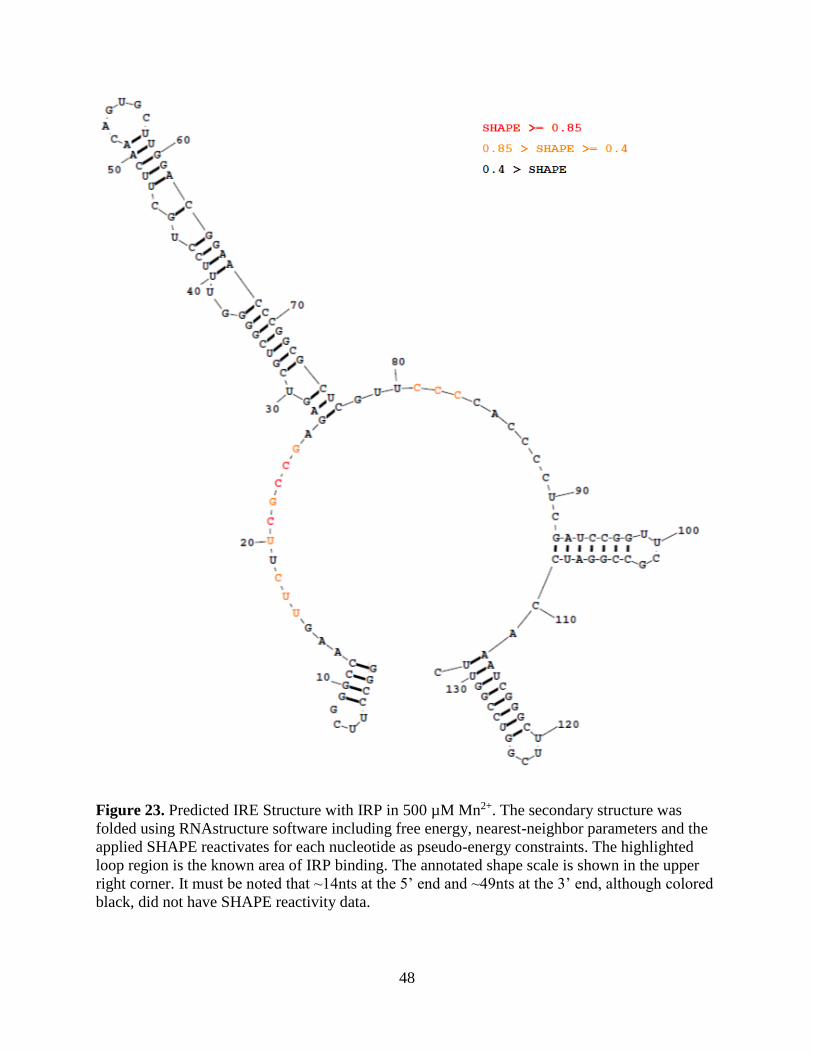
Figure 23. Predicted IRE Structure with IRP in 500 µM Mn2+. The secondary structure was
folded using RNAstructure software including free energy, nearest-neighbor parameters and the
applied SHAPE reactivates for each nucleotide as pseudo-energy constraints. The highlighted
loop region is the known area of IRP binding. The annotated shape scale is shown in the upper
right corner. It must be noted that ~14nts at the 5’ end and ~49nts at the 3’ end, although colored
black, did not have SHAPE reactivity data.

49
Graph 12. SHAPE Reactivity Histogram of IRE with IRP in 5 mM Mn2+. The histogram is the
average of two trials of the IRE-IRP complex in 5 mM Mn2+ hSHAPE data. The x-axis
represents nucleotide position on the IRE. The highlighted region contains the nucleotides
involved in IRP binding. Error bars were derived from standard deviations of the SHAPE
reactivity data for each nucleotide.
0
0.2
0.4
0.6
0.8
1
1.2
1.4
1.6
1.8
2
15 17 19 21 23 25 27 29 31 33 35 37 39 41 43 45 47 49 51 53 55 57 59 61 63 65 67 69 71 73 75 77 79 81 83
SHA
PE
Rea
ctiv
ity
Nucleotide Position
5 mM Mn2+ IRP-IRE
50
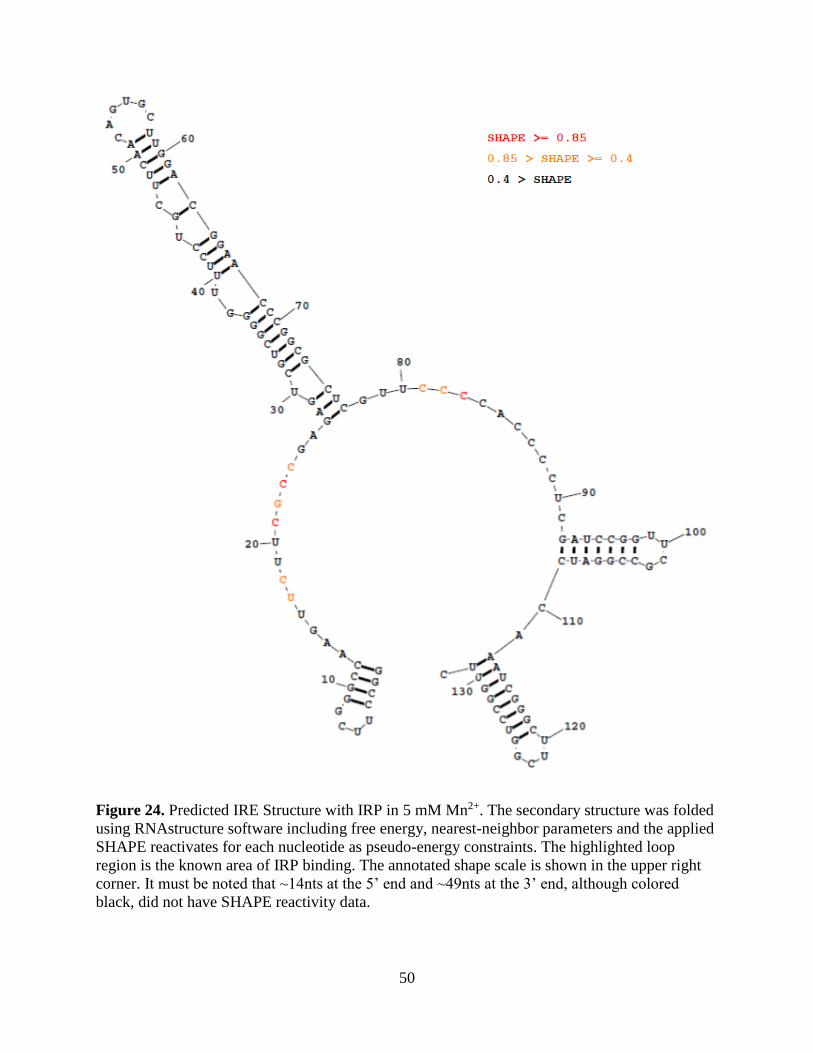
Figure 24. Predicted IRE Structure with IRP in 5 mM Mn2+. The secondary structure was folded
using RNAstructure software including free energy, nearest-neighbor parameters and the applied
SHAPE reactivates for each nucleotide as pseudo-energy constraints. The highlighted loop
region is the known area of IRP binding. The annotated shape scale is shown in the upper right
corner. It must be noted that ~14nts at the 5’ end and ~49nts at the 3’ end, although colored
black, did not have SHAPE reactivity data.
51
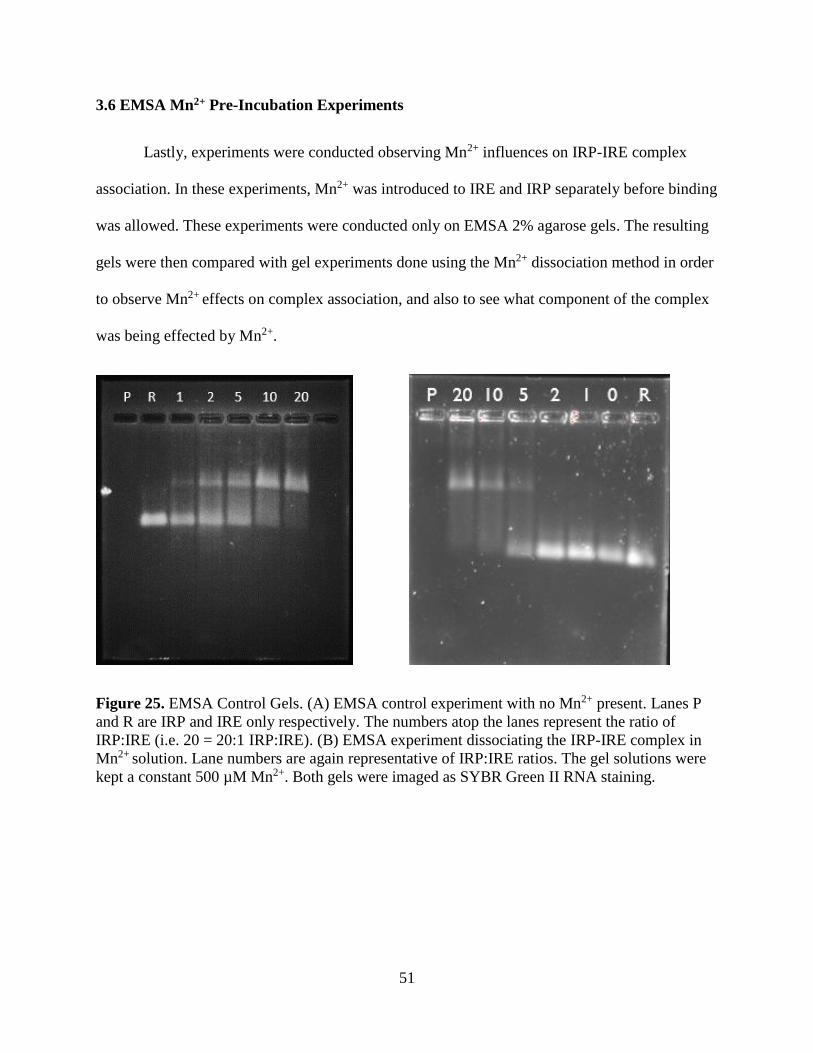
3.6 EMSA Mn2+ Pre-Incubation Experiments
Lastly, experiments were conducted observing Mn2+ influences on IRP-IRE complex
association. In these experiments, Mn2+ was introduced to IRE and IRP separately before binding
was allowed. These experiments were conducted only on EMSA 2% agarose gels. The resulting
gels were then compared with gel experiments done using the Mn2+ dissociation method in order
to observe Mn2+ effects on complex association, and also to see what component of the complex
was being effected by Mn2+.
Figure 25. EMSA Control Gels. (A) EMSA control experiment with no Mn2+ present. Lanes P
and R are IRP and IRE only respectively. The numbers atop the lanes represent the ratio of
IRP:IRE (i.e. 20 = 20:1 IRP:IRE). (B) EMSA experiment dissociating the IRP-IRE complex in
Mn2+ solution. Lane numbers are again representative of IRP:IRE ratios. The gel solutions were
kept a constant 500 µM Mn2+. Both gels were imaged as SYBR Green II RNA staining.
52
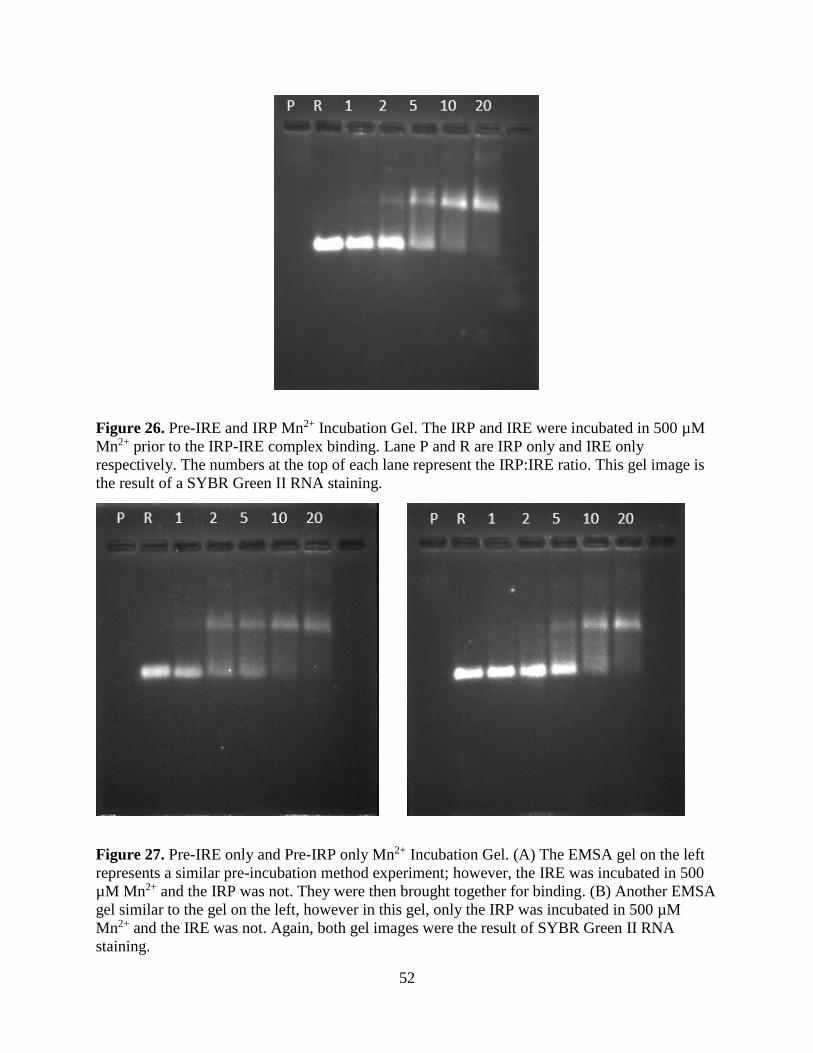
Figure 26. Pre-IRE and IRP Mn2+ Incubation Gel. The IRP and IRE were incubated in 500 µM
Mn2+ prior to the IRP-IRE complex binding. Lane P and R are IRP only and IRE only
respectively. The numbers at the top of each lane represent the IRP:IRE ratio. This gel image is
the result of a SYBR Green II RNA staining.
Figure 27. Pre-IRE only and Pre-IRP only Mn2+ Incubation Gel. (A) The EMSA gel on the left
represents a similar pre-incubation method experiment; however, the IRE was incubated in 500
µM Mn2+ and the IRP was not. They were then brought together for binding. (B) Another EMSA
gel similar to the gel on the left, however in this gel, only the IRP was incubated in 500 µM
Mn2+ and the IRE was not. Again, both gel images were the result of SYBR Green II RNA
staining.
53
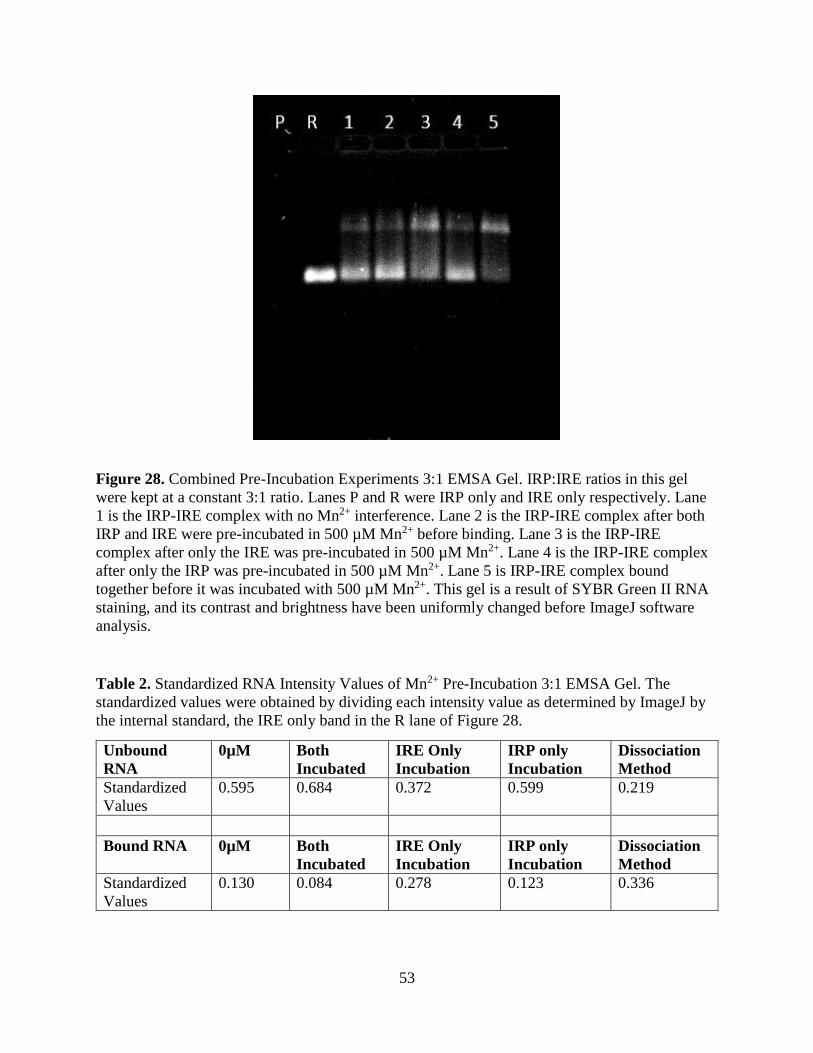
Figure 28. Combined Pre-Incubation Experiments 3:1 EMSA Gel. IRP:IRE ratios in this gel
were kept at a constant 3:1 ratio. Lanes P and R were IRP only and IRE only respectively. Lane
1 is the IRP-IRE complex with no Mn2+ interference. Lane 2 is the IRP-IRE complex after both
IRP and IRE were pre-incubated in 500 µM Mn2+ before binding. Lane 3 is the IRP-IRE
complex after only the IRE was pre-incubated in 500 µM Mn2+. Lane 4 is the IRP-IRE complex
after only the IRP was pre-incubated in 500 µM Mn2+. Lane 5 is IRP-IRE complex bound
together before it was incubated with 500 µM Mn2+. This gel is a result of SYBR Green II RNA
staining, and its contrast and brightness have been uniformly changed before ImageJ software
analysis.
Table 2. Standardized RNA Intensity Values of Mn2+ Pre-Incubation 3:1 EMSA Gel. The
standardized values were obtained by dividing each intensity value as determined by ImageJ by
the internal standard, the IRE only band in the R lane of Figure 28.
Unbound
RNA
0µM Both
Incubated
IRE Only
Incubation
IRP only
Incubation
Dissociation
Method
Standardized
Values
0.595 0.684 0.372 0.599 0.219
Bound RNA 0µM Both
Incubated
IRE Only
Incubation
IRP only
Incubation
Dissociation
Method
Standardized
Values
0.130 0.084 0.278 0.123 0.336

54
CHAPTER 4
DISCUSSION
As previously mentioned, we wanted to observe IRP-IRE complex formation using each
of our techniques before advancing toward experiments involving Mn2+ interferences. The
EMSA gel experiment (Figure 14) shows that complex formation did occur. Not only did it
occur, but the IRP successfully bound to each of our IRE RNAs (52, 77, and 132 nucleotides).
Complex formation is quite distinctly represented by the upper bands of lanes 5-7 of the gel.
Additionally, using a 10:1 ratio of IRP:IRE, the highly concentrated IRP solution bound up the
majority of the IRE in lanes 5-7 also indicated efficient complex formation.
After confirming the binding of the IRP-IRE complex using EMSA methods, we wanted
to observe complex formation through the changes in IRE SHAPE reactivates using our most
sensitive technique, hSHAPE chemistry, again keeping IRP:IRE ratios at 10:1. This can be
observed by comparing both Graphs 2 and 4, and Figures 15 and 16. In Graph 2, the IRE in
binding buffer only, the highlighted regions in the red boxes indicate the nucleotides (A53G54U55
and C46) of the IRE that have been confirmed to bind to IRP.8 When compared to the same
highlighted regions in Graph 4, the IRP bound to IRE, there is a significant decrease in SHAPE
reactivity levels, indicating the presence of a tertiary interacting with the IRE. This would be the
IRP binding to the IRE. Additionally when observing the predicted structures (Figures 15 and
16), the nucleotides involved in IRP binding have high reactivity values in Figure 15 as indicated
by the color coded annotated SHAPE reactivity scale; however, in Figure 16 these nucleotides
drop from levels of high (red) and moderate (orange) SHAPE reactivity levels, to that of low to
no SHAPE reactivity (black). Therefore, in comparing these graphs and figures, it was confirmed
55
via hSHAPE chemistry that the IRP-IRE complex forms. Also, it must be noted that the overall
secondary structure of the IRE did not have any conformational changes.
In addition to confirming the IRP-IRE complex formation using hSHAPE chemistry, we
also wanted to use this method to test IRP-mutant IRE binding. Previous studies indicated a
weaker binding affinity off the IRP to the mutant IRE, thus we anticipated seeing this affect in
the SHAPE reactivity values of the IRE binding nucleotides upon complex formation.10 Again by
comparing histograms (Graphs 6 and 8) and predicted secondary structures with colored SHAPE
annotations (Figures 17 and 18), it can be seen that IRP-IRE complex formation does occur and
is confirmed by the reduction in SHAPE reactivity values. Furthermore, the nucleotides involved
in IRP binding that decreased in SHAPE reactivity values, had a decrease in values that was not
as dramatic as that compared to the wild-type IRE hSHAPE experiments, therefore reaffirming
that the mutant IRE has a weaker binding affinity to the IRP.
Once we had confirmed IRP-IRE complex formation using two of our techniques, we
wanted to see if this complex formation could be translated into a physical representation using
atomic force microscopy. By using the DNA dendron scaffold method as seen in the Materials
and Methods section, we wanted to use AFM’s z-height resolution capabilities to observe
changes in z-heights indicating complex formation upon our gold-mica surface. Figure 19 shows
the 1.6 micron scan and following line analysis profile of the first AFM images of just the G3
DNA dendron on the gold-mica surface. The line analysis shows the sizes of our DNA dendrons
to be approximately 2-3 nm in height which corresponds with literature values.28 The next scans
were of the IRE complexed with the DNA dendron. These scans are not shown as the resulting
images yielded no definitive increases in z-height as single stranded RNA has been shown to
only have sizes of about 0.5 nm in AFM scans. Therefore we progressed to the next part of the
56
experiment by introducing the IRP to the solution. A previous group had done scanning force
microscopy imaging on the IRP-IRE complex using a different construct and this group had
found the IRP size to be approximately 2.5 nm in diameter.29 Therefore we anticipated to see
about a 2.5 nm increase in the sizes of the features on our gold-mica surface upon IRP addition.
Figure 20 shows just this. The resulting line analysis profile shows the features to now be
between 4-6 nm in height indicating complete DNA dendron-IRE-IRP complex formation.
After finding all three of our techniques could observe the formation of the complex, our
group moved to interrogate the effects of Mn2+ on the dissociation of an already formed IRP-IRE
complex. This dissociation method was first attempted during the AFM IRP-IRE binding
experiments previously discussed. After the DNA dendron-IRE-IRP complex had been imaged,
we introduced 500 µM Mn2+ to the solution and proceeded to image the surface. We anticipated
seeing features on the surface now ranging only between 2-3 nm in z-height, indicating complex
dissociation, observing only DNA dendrons and IRPs on the surface. However the resulting
scans were of poor quality from the MnCl2 addition causing large salt formations on the surface.
Next we decided to advance to use the EMSA gel technique to observe complex
dissociation. The results of this experiment are shown in Figure 21. We performed a complete set
of Mn2+ titration experiments on the complex with concentrations ranging from 50 µM up to 50
mM. We wanted to use the RNA fluorescence intensity data to plot a logarithmic curve and find
the ½ [Mn2+] to use for the following hSHAPE chemistry IRP-IRE with Mn2+ experiments. We
kept the IRP:IRE ratio at 10:1 for this experiment as well. By just observing Figure 21, it can be
seen that the Mn2+ seemed to have little to no effect on the IRP-IRE complex dissociation, even
at the highest concentrations. We decided to proceed and collect the ImageJ intensity values on
the bound and unbound IRE for graphing purposes. The result of this graph is seen in Graph 9.
57
We had anticipated observing a graph with a relative decreasing slope; however, both plotted
values and the derived best fit curve seems to be flat-line. With this result and an R2 value of
35.5, it can be said that there is no correlation between the Mn2+ concentrations and the
dissociation of the IRP-IRE complex.
In addition to the EMSA experiment, we wanted to continue to test the Mn2+ dissociation
method with hSHAPE chemistry experiments. hSHAPE titrations were performed using a
constant 10:1 IRP to IRE ratio and variable Mn2+ concentrations. Our goal was to plot titration
curves and calculate [Mn2+]1/2, the transition midpoint, at every nucleotide position in order to
identify transition steps and predict Mn2+ binding sites. Using hSHAPE chemistry to achieve this
has been previously done, for example, being used to analyze the effects of two ligands, Mg2+
and tobramycin (TOB5+), on the folding of S. cerevisiae tRNAAsp transcripts, where it precisely
confirmed the native structure of tRNAAsp.30 Based on the titration curves and the calculated
[ligand]1/2, the binding sites between both Mg2+ and TOB5+ to tRNAAsp were predicted.30
Therefore after successfully observing the IRP-IRE binding and its effects on the SHAPE
reactivities of the IRE binding nucleotides using hSHAPE chemistry, we expected adverse
effects. We hypothesized that there would be a gradual increase in SHAPE reactivities at the IRE
binding nucleotides in the terminal loop region, and bulge regions upon the release of tertiary
interactions with the IRP. However the results did not support this hypothesis, which can be seen
in Graphs 10, 11, and 12 and Figures 22, 23, and 24. When compared to the SHAPE reactivities
in these regions in the IRP-IRE hSHAPE experiment (Graph 4, Figure 16), the reactivities are
relatively the same and the reactivities remained at low values (<0.4 on the annotated SHAPE
scale).
58
In addition to the three Mn2+ concentrations illustrated in Figures 22-24, hSHAPE
titrations of the 10:1 IRP-IRE complex were also performed at other Mn2+ concentrations (data
not shown). We did not perform hSHAPE experiments at extremely high Mn2+ concentrations,
such as 50 mM, as a previous study demonstrated a nonnegligible effect of higher concentrations
of divalent metal ions on the final extent of 2’-O-adduct formation.22
In summary, EMSA and hSHAPE chemistry have been applied to determine the effects
of Mn2+ on the dissociation of the IRE-IRP complex. The results from both techniques indicate
that Mn2+ has little to no effect on the dissociation of the already bound IRE-IRP complex. Our
experimental design for the titration of the IRE-IRP complex with Mn2+ was based on a model
that suggests that Mn2+ binds only to the IRE RNA, and not to IRP.11 If the model is incorrect,
and if Mn2+ actually interacts with both IRP and the IRE RNA, or only with IRP, the
experimental design using an IRP-IRE complex solution in a 10:1 molar ratio (i.e., IRP in large
excess) would be invalid as small affects would be masked by the high IRP concentration.
In 2014, the Khan group published their kinetic studies of the effects of Mn2+ on the FTH
IRE-IRP complex.31 They found that Mn2+ ions induced about a six-fold decrease in the
association rate of IRP binding to the FTH IRE RNA. In addition, Mn2+ induced approximately a
two-fold increase in the dissociation rate of the IRP-IRE complex.
With this new information, we turned our focus from the effect of Mn2+ on dissociation
of the IRP-IRE complex to the larger effect that Mn2+ has on the association between IRP and
the IRE RNA. Concerned that the IRE RNA may not be the target of Mn2+, or may not be the
only target of Mn2+, we designed the EMSA experiments, as described in the materials and
methods section, to determine the target of the Mn2+. The first experiment involved the pre-
incubation of both the IRP and IRE in 500 µM Mn2+ run on a protein titration gel (Figure 26).

59
From these results, when compared to the control gel (Figure 25A), there is a clear increase in
the intensity of the lower unbound RNA bands, especially at the lower ratios, in Figure 26. This
led us to conclude that the Mn2+ was having an effect on complex association.
Next, we wanted to test whether the Mn2+ was affecting the IRP or the IRE in the
complex. We ran protein titrations gels again, however we either pre-incubated only the IRE in
Mn2+ (Figure 26A) or only the IRP in Mn2+ (Figure 26B). Upon comparison between these two
figures with our control gel in Figure 25A, it is quite evident that the Mn2+ is appearing to have a
significant effect on the IRP during pre-incubation, instead of the IRE. This result was concluded
by the fluorescence intensity increases of the unbound RNA bands in the Pretreated-IRP gel but
not in the Pretreated-IRE gel.
Lastly we wanted to make a direct comparison between the three pre-incubation methods
on a single gel, while also including a control lane (with 0 µM Mn2+) and a lane to compare to
the previous dissociation method (complex formation followed by Mn2+ incubation). The results
of this experiment are shown in Figure 28 and Table 2. Figure 28 displays greater intensities of
the unbound RNA bands in the IRP-IRE pre-incubation lane and the IRP pre-incubation lane.
After quantifying the data from the gel (Table 2), it is observed once again that the IRP-IRE pre-
incubation lane, and the IRP pre-incubation lane had higher unbound RNA intensities.
Additionally, the IRE pre-incubation lane had the second highest bound RNA intensity
indicating Mn2+ had little to no effect on the IRE.
In brief, it can be postulated that the IRE-IRP complex is not highly affect by Mn2+ once
bound; however, upon pre-incubation, it is the IRP that is affected and not the IRE as previously
thought. Future considerations for this research must then involve shifting models to
interrogating the IRP and the effect Mn2+ can have on it.

60
One highly recommended investigatory technique would be x-ray crystallography of the
IRP upon Mn2+ interaction. This would provide us with the complete, atom-by-atom structure of
the protein, including where the Mn2+ would be bound, and any conformational changes that
have occurred in the protein.
Another technique that one could use for the protein is analytical ultracentrifugation
(AUC). AUC is a technique that uses laser detection systems to analyze sedimentation upon high
speed centrifugation. AUC has a sedimentation velocity in which the movement of solutes in
high centrifugal fields uses hydrodynamic theory to define the size, shape, and interactions of
macromolecules.32 Additionally, AUC has a thermodynamic method called sedimentation
equilibrium where equilibrium concentration gradients at lower centrifugal fields are analyzed to
define molecular mass, assembly stoichiometry, association constants, and solution nonideality.32
Essentially AUC will allow us to observe if there have been conformational changes to the
protein under Mn2+ influences, but also we could use this technique to further study the IRP-IRE
complex association and dissociation. Unlike x-ray crystallography, this technique could not tell
us where exactly Mn2+ would be binding in the IRP.
We can also speculate as to where and how the Mn2+ is affecting the IRP. One thought, is
that the Mn2+ could be assembling in a similar Fe-S cluster formation, and binding to the protein
in that location, thus causing the IRP to shift to an ACO-1 conformation. This could be a result
of Cys- side chains having more favorable charge-charge interactions with metal ions.33 As
discussed in the introduction, the 4Fe-4S cluster is bound to three Cys amino acids of the IRP.
Additionally, “soft” metal ions such as Fe2+ and Mn2+ will frequently bind to weak field ligands
such as sulfur, which is in the side chain of cysteine.34
61
CHAPTER 5
CONCLUSIONS
In conclusion, our group was able to successfully confirm the formation of the IRP-IRE
complex using EMSA gels, hSHAPE chemistry, and atomic force microscopy. Due to these
results we were able to pursue further investigations of the complex, following the model that
Mn2+ had the ability to dissociate the complex, specifically affecting the IRE. After several
experiments both with EMSA gels and hSHAPE chemistry, we were able to conclude that Mn2+
had little to no effect on the dissociation of the IRP-IRE complex. Therefore we adjusted our
model to correspond with an updated version indicating that the metal ion will have a greater
effect on association than dissociation. Our EMSA Mn2+ pre-incubation experiments not only
confirm this, but also indicate that the Mn2+ is having a larger effect on the IRP component of the
complex. From here, future experimentation would need to be conducted to assess the effects
that Mn2+ is having on the IRP.
62
REFERENCES
1. Theil, E. C., Ferritin: structure, gene regulation, and cellular function in animals, plants,
and microorganisms. Annual review of biochemistry 1987, 56 (1), 289-315.
2. Theil, E. C., Ferritin: the protein nanocage and iron biomineral in health and in disease.
Inorganic chemistry 2013, 52 (21), 12223-12233.
3. Honarmand Ebrahimi, K.; Bill, E.; Hagedoorn, P.-L.; Hagen, W. R., The catalytic center
of ferritin regulates iron storage via Fe(II)-Fe(III) displacement. Nat Chem Biol 2012, 8 (11),
941-948.
4. Carmona, U.; Li, L.; Zhang, L.; Knez, M., Ferritin light-chain subunits: key elements for
the electron transfer across the protein cage. Chemical communications (Cambridge, England)
2014, 50 (97), 15358-61.
5. Volz, K., The functional duality of iron regulatory protein 1. Current opinion in
structural biology 2008, 18 (1), 106-11.
6. Dupuy, J.; Volbeda, A.; Carpentier, P.; Darnault, C.; Moulis, J. M.; Fontecilla-Camps, J.
C., Crystal structure of human iron regulatory protein 1 as cytosolic aconitase. Structure
(London, England : 1993) 2006, 14 (1), 129-39.
7. Brazzolotto, X.; Timmins, P.; Dupont, Y.; Moulis, J. M., Structural changes associated
with switching activities of human iron regulatory protein 1. The Journal of biological chemistry
2002, 277 (14), 11995-2000.
8. Walden, W. E.; Selezneva, A. I.; Dupuy, J.; Volbeda, A.; Fontecilla-Camps, J. C.; Theil,
E. C.; Volz, K., Structure of dual function iron regulatory protein 1 complexed with ferritin IRE-
RNA. Science (New York, N.Y.) 2006, 314 (5807), 1903-8.
9. Joshi, R.; Morán, E.; Sánchez, M., Cellular iron metabolism. The IRP/IRE regulatory
network. Iron Metabolism 2012, 25-58.
10. Kato, J.; Fujikawa, K.; Kanda, M.; Fukuda, N.; Sasaki, K.; Takayama, T.; Kobune, M.;
Takada, K.; Takimoto, R.; Hamada, H.; Ikeda, T.; Niitsu, Y., A mutation, in the iron-responsive
element of H ferritin mRNA, causing autosomal dominant iron overload. American journal of
human genetics 2001, 69 (1), 191-7.
11. Khan, M. A.; Walden, W. E.; Goss, D. J.; Theil, E. C., Direct Fe2+ sensing by iron-
responsive messenger RNA:repressor complexes weakens binding. The Journal of biological
chemistry 2009, 284 (44), 30122-8.
12. Ma, J.; Haldar, S.; Khan, M. A.; Sharma, S. D.; Merrick, W. C.; Theil, E. C.; Goss, D. J.,
Fe2+ binds iron responsive element-RNA, selectively changing protein-binding affinities and
regulating mRNA repression and activation. Proceedings of the National Academy of Sciences of
the United States of America 2012, 109 (22), 8417-22.
13. Tibodeau, J. D.; Fox, P. M.; Ropp, P. A.; Theil, E. C.; Thorp, H. H., The up-regulation of
ferritin expression using a small-molecule ligand to the native mRNA. Proceedings of the
National Academy of Sciences of the United States of America 2006, 103 (2), 253-7.
14. Canzoneri, J. C.; Oyelere, A. K., Interaction of anthracyclines with iron responsive
element mRNAs. Nucleic acids research 2008, 36 (21), 6825-34.
15. Ryder, S. P.; Recht, M. I.; Williamson, J. R., Quantitative analysis of protein-RNA
interactions by gel mobility shift. Methods in molecular biology (Clifton, N.J.) 2008, 488, 99-
115.
63
16. Heffler, M. A.; Walters, R. D.; Kugel, J. F., Using electrophoretic mobility shift assays to
measure equilibrium dissociation constants: GAL4-p53 binding DNA as a model system.
Biochemistry and molecular biology education : a bimonthly publication of the International
Union of Biochemistry and Molecular Biology 2012, 40 (6), 383-7.
17. Gross, L.; Mohn, F.; Moll, N.; Liljeroth, P.; Meyer, G., The chemical structure of a
molecule resolved by atomic force microscopy. Science (New York, N.Y.) 2009, 325 (5944),
1110-4.
18. Gross, L.; Mohn, F.; Moll, N.; Schuler, B.; Criado, A.; Guitian, E.; Pena, D.; Gourdon,
A.; Meyer, G., Bond-order discrimination by atomic force microscopy. Science (New York, N.Y.)
2012, 337 (6100), 1326-9.
19. Hansma, H. G.; Sinsheimer, R. L.; Li, M. Q.; Hansma, P. K., Atomic force microscopy of
single- and double-stranded DNA. Nucleic acids research 1992, 20 (14), 3585-90.
20. Zhu, J.; Feng, X.; Lou, J.; Li, W.; Li, S.; Zhu, H.; Yang, L.; Zhang, A.; He, L.; Li, C.,
Accurate quantification of microRNA via single strand displacement reaction on DNA origami
motif. PloS one 2013, 8 (8), e69856.
21. Day, B. S.; Fiegland, L. R.; Vint, E. S.; Shen, W.; Morris, J. R.; Norton, M. L., Thiolated
dendrimers as multi-point binding headgroups for DNA immobilization on gold. Langmuir : the
ACS journal of surfaces and colloids 2011, 27 (20), 12434-42.
22. Mortimer, S. A.; Weeks, K. M., A fast-acting reagent for accurate analysis of RNA
secondary and tertiary structure by SHAPE chemistry. Journal of the American Chemical Society
2007, 129 (14), 4144-5.
23. Mathews, D. H.; Disney, M. D.; Childs, J. L.; Schroeder, S. J.; Zuker, M.; Turner, D. H.,
Incorporating chemical modification constraints into a dynamic programming algorithm for
prediction of RNA secondary structure. Proceedings of the National Academy of Sciences of the
United States of America 2004, 101 (19), 7287-92.
24. Merino, E. J.; Wilkinson, K. A.; Coughlan, J. L.; Weeks, K. M., RNA structure analysis
at single nucleotide resolution by selective 2'-hydroxyl acylation and primer extension (SHAPE).
Journal of the American Chemical Society 2005, 127 (12), 4223-31.
25. Karabiber, F.; McGinnis, J. L.; Favorov, O. V.; Weeks, K. M., QuShape: rapid, accurate,
and best-practices quantification of nucleic acid probing information, resolved by capillary
electrophoresis. RNA (New York, N.Y.) 2013, 19 (1), 63-73.
26. Vasa, S. M.; Guex, N.; Wilkinson, K. A.; Weeks, K. M.; Giddings, M. C., ShapeFinder: a
software system for high-throughput quantitative analysis of nucleic acid reactivity information
resolved by capillary electrophoresis. RNA (New York, N.Y.) 2008, 14 (10), 1979-90.
27. Reuter, J. S.; Mathews, D. H., RNAstructure: software for RNA secondary structure
prediction and analysis. BMC bioinformatics 2010, 11, 129.
28. Hierlemann, A.; Campbell, J. K.; Baker, L. A.; Crooks, R. M.; Ricco, A. J., Structural
distortion of dendrimers on gold surfaces: a tapping-mode AFM investigation. Journal of the
American Chemical Society 1998, 120 (21), 5323-5324.
29. Bonin, M.; Oberstrass, J.; Vogt, U.; Wassenegger, M.; Nellen, W., Binding of IRE-BP to
its cognate RNA sequence: SFM studies on a universal RNA backbone for the analysis of RNA-
protein interaction. Biological chemistry 2001, 382 (8), 1157-62.
30. Wang, B.; Wilkinson, K. A.; Weeks, K. M., Complex ligand-induced conformational
changes in tRNA(Asp) revealed by single-nucleotide resolution SHAPE chemistry. Biochemistry
2008, 47 (11), 3454-61.
64
31. Khan, M. A.; Ma, J.; Walden, W. E.; Merrick, W. C.; Theil, E. C.; Goss, D. J., Rapid
kinetics of iron responsive element (IRE) RNA/iron regulatory protein 1 and IRE-RNA/eIF4F
complexes respond differently to metal ions. Nucleic acids research 2014, 42 (10), 6567-77.
32. Cole, J. L.; Lary, J. W.; Moody, T.; Laue, T. M., Analytical Ultracentrifugation:
Sedimentation Velocity and Sedimentation Equilibrium. Methods in cell biology 2008, 84, 143-
79.
33. Dudev, T.; Lim, C., Competition among metal ions for protein binding sites:
determinants of metal ion selectivity in proteins. Chemical reviews 2013, 114 (1), 538-556.
34. Yamashita, M. M.; Wesson, L.; Eisenman, G.; Eisenberg, D., Where metal ions bind in
proteins. Proceedings of the National Academy of Sciences 1990, 87 (15), 5648-5652.
65
APPENDIX A: IRB LETTER OF APPROVAL