Embed Size (px)
Citation preview

AN INVESTIGATION INTO FACTORS THAT AFFECT THE ACCURACY OF
COST ESTIMATES FOR BUILDINGS : CASE STUDY OF PRIVATE
RESIDENTIAL AND OFFICE PROJECTS IN THE CITY OF NAIROBL
BY
FRANCIS MUTHEE GITHAIGA.
This Research Project Submitted In Part Fulfillment For The Degree Of Master
Of Arts In Construction Management Of The University Of Nairobi.
University of NAIROBI Library
0341510 6
AUGUST 2006.

DECLARATION
This research project is my original work and has not been presented in any other University.
Francis Muthee Githaiga
B50/P/7437/2002
0 2 - o r -Date
B.A (Bldg. Econ.) Hons. MAAK (Q.S), F.I.Q.S.K, Reg. Quantity Surveyor
This research project has been submitted for examination with my approval as the University
supervisor in the Department o f Real Estate and Construction Management.
B.Arch M.A (Bldg. Mgmt.), PhD (Nairobi), Reg. Arch., MAAK (A)
(ii)

DEDICATION
To my dear wife Catherine for her love, support and encouragement; and to my sons Denis, Kelvin
and Alex for their inspiration.
(iii)

ACKNOWLEDGEMENT
This study and the entire course would not have been possible without the patience and help of the
Almighty God.
I am very grateful to my supervisor Dr. Robert W. Rukwaro for patiently and faithfully guiding me
through the research project. His support and comments were very valuable.
I also acknowledge the input received from the rest of the members of staff of Department of Real
Estate and Construction Management and the encouragement from my fellow students and
professional colleagues
Thanks to all and God bless.
(iv)

TABLE OF CONTENTS PAGE NO.
Title....................................................................................................................................... i
Declaration.......................................................................................................................... ii
Dedication.......................................................................................................................... iii
Acknowledgement............................................................................................................. i v
Table of Contents................................................................................................................... v
List o f Figures...................................................................................................................... viii
List o f Tables...................................................................................................................... ix
Abbreviations...................................................................................................................... x
Abstract................................................................................................................................. xi
Chapter One: INTRODUCTION
1.1 Background of the study............................................................................................ I
1.2 Problem Statement......................................................................................................... 2
1.3 Objectives of the Study................................................................................................ 3
1.4 Research Questions..................................................................................................... 3
1.5 Hypothesis................................................................................................................. 1
1.6 Scope o f the Study.............................................................................................................3
1.7 Assumptions................................................................................................................. 4
1.8 Significance of the Study........................................................................................ 4
1.9 Structure of the Study................................................................................................ 5
Chapter Two: LITERATURE REVIEW
2.1 Introduction............................................................................................................. 6
2.2 The Brief.................................................................................................................. 6
2.3 The Need for Cost Estimation.............................................................................. 9
2.4 Cost Estimating Methods............................................................................................ 15
(v)

172.5 The Fundamental Problems o f Cost Estimation.................
2.6 Tender Patterns and Bidding Strategy.................................
2.6.1 Tender Patterns.........................................................
2.6.2 Non-serious Tenders and Cover prices...................
2.6.3 Bidding Strategies....................................................
2.7 The Accuracy of Estimating................................................
2.7.1 Measuring performance..........................................
2.7.2 Present Achievement.............................................
2.7.3 Improving Estimating Performance.......................
2.7.4 Computer Methods..................................................
2.8 Cost D ata .............................................................................
2.8.1 Uses of cost Data...................................................
2.8.2 Problems with analysis of Bills of Quantities.......
2.8.3 Sources of Data......................................................
2.9 Cost Indices.........................................................................
2.9.1 Uses of Index Numbers.........................................
2.9.2 Types of Index Numbers........................................
2.10 Other factors affecting cost estimate of project.................
2.10.1 Estimator specific factors..............................
2.10.2 Design and project specific factors..............
2.10.3 Conceptual Estimates as dependent variables
2.11 Summary.............................................................................
19
19
20
20
21
71
22
23
24
21
25
26
29
31
31
32
36
36
IX
41
43
Chapter Three: RESEARCH METHODOLOGY
3.1 Introduction........................................................................................................... 45
3.2 Research Design...................................................................................................... 45
3.3 The Study Area..................................................................................................... 45
3.4 The Population..................................................................................................... 45
3.5 Sampling Technique and Sample Size................................................................... 46
3.6 Research Variables............................................................................................ 46
(vi)

3.7 Research Tools......................................................................................................... 17
3.8 Administration of the Questionnaire and Data Collection...................................... 47
3.9 Measurement of variables......................................................................................... 47
3.9.1 Independent Variables..................................................................................... 47
3.9.2 Dependent variables.......................................................................................... 50
3.10 Hypothesis Testing....................................................................................................... 51
3.11 Methods of Data Analysis.......................................................................................... 52
Chapter Four: DATA ANALYSIS AND RESULTS................................................ 54
4.0 Introduction............................................................................................................. 54
4.1 Analysis of Independent Variables......................................................................... 55
4.2 Analysis of Dependent Variables............................................................................... 59
4.3 Quantitative Analysis................................................................................................ 59
4.3.1 Correlations................................................................................................... 00
4.3.2 Stepwise Regression Analysis......................................................................... 61
4.4 Hypothesis Testing....................................................................................................... 63
Chapter F iv e : CONCLUSIONS.................................................................................... 64
5.1 Introduction............................................................................................................. 64
5.2 Results.................................................................................................................... 64
5.3 Recommendations.................................................................................................. 65
5.4 Suggested Areas of Further Study........................................................................ 66
REFERENCES..................................................................................................................... 67
APPENDICES
Appendix A - Questionnaire for Quantity Surveying Finns.......................... 72
Appendix B - F- Distribution Tables................................................................. 76
(vii)

LIST OF FIGURES Page No.
2.1 RIBA Plan of work - Cost Stages........................................................................... 7
2.2 Traditional Cost Modeling....................................................................................... K
2.3 Uncontrollable Factors Affecting Contractor’s Risk o f Cost Overburden............. 38
2.4 Estimates’ Accuracy Problem.................................................................................... 42
(viii)

LIST OF TABLES Page No.
3.1 Scoring for Project Scope/Size ..................................................................... 48
3.2 Scoring for Construction Time ..................................................................... 49
3.3 Scoring for Cost Estimate Method Used............................................................... 49
3.4 Scoring for Project Organization .................................................................... SO
3.5 Scoring for Professional involved in arriving Cost Estimate................................ 50
3.6 Scoring for Level of Accuracy............................................................................... 51
4.1 Frequency of Residential Buildings....................................................................... 54
4.2 Frequency of Office Building............................................................................... 54
4.3 Summary of Frequency of All Building types........................................................ 55
4.4 Observed Frequency of Types of Contract Used and Building Types............. 56
4.5 Observed Frequency of Cost Estimating Method Used and Building Types.... 56
4.6 Observed Frequency of Project Organization Approaches and Building Types.. 57
4.7 Observed Frequency of Consultants Used in Cost Estimating and Building Type. 58
4.8 Observed Frequency Accuracy of the Cost Estimates and Building Types......... 59
4.9 Correlations of Independent and Dependent Variables ................................. 60
4.10 Coefficients of Independent Variables...................................................................... 61
4.11 Regression Models Summary................................................................................... 62
(ix)

ABBREVIATION
BICS - Building Cost Information Services
C.V - Coefficient Variation
IQSK - Institute of Quantity Surveyors of Kenya
IT Information Technology
SMM - Standard Method of Measurement
(x)

ABSTRACT
The purpose of all pre-tender estimates is to provide an indication of the probable cost of the new
construction. Decision-making at the early stages of a project, initial appropriations and economic
feasibility studies are based upon the preliminary or pre-design cost estimates. It is apparent that
predicting costs accurately is a problem in construction industry especially at the pre-tender stage.
The methods used to predict project building costs include the unit method, floor area method,
approximate quantities, elemental analysis and pricing of bills of quantities before tender.
This research sought to determine the magnitude of the influence of cost estimating methods used
in the prediction of construction costs. It also identifies other factors that cause inaccuracy and
their magnitude of this effect on overall accuracy. The study hypothesis is that cost estimates do
not accurately project pre-design stage costs used as a guide for investment decision making
process.
This work adopts a survey research design and concentrates on private residential and office
buildings in city of Nairobi. The population o f which is the number of projects handled by
professional quantity surveying firms. The resultant data is then analysed by the SPSS software to
derive correlation, regression and resultant statistical parameters.
This research examined the problem o f the quality o f conceptual estimating. It assessed the usage
of historical and empirical information which had been used in the pre-tender cost estimates, and
ascertained whether it is possible to get an appropriate initial assessment of the expected accuracy
and reliability o f a cost estimate. This is then compared with successful bidder or the lowest tender
figure awarded the contract.
The findings o f this research is that pre-design cost estimates as currently used in the industry do
not significantly project the actual construction costs and this negates their reliance as a guide for
investment decision making process. The research recommends that a more elaborate database be
developed and other building parameters such as building type, and project scope, which the study
found significant should be incorporated.
(xi)

The study concluded that the building type and scopc/sizc o f projects arc the major determinants
of cost estimating functions. The study recommends that the quantity surveying firm must be
critical on the type and scope /size of the office and residential buildings when doing their cost
estimations.
(xii)
Chapter One
INTRODUCTION
1.1 Background of The Study
Cost information on buildings is normally based on “unit rates" which assume that costs hear a
simple and direct relationship to units of finished work such as the area o f a wall (Morion and
Jagger 1995, p 27). This is the genesis of a fundamental problem of accuracy and reliability.
Morton and Jagger (Morton and Jagger 1995, p 27) suggests that this method does not
accurately reflect the way costs arc generated in the building process, as the method is a
considerable barrier to accurate prediction and control. A study of the evolution of building
elements reveals a general aim to improve cost efficiency through design and construction
(Ashworth 2004, p 98). It is becoming increasingly apparent that to predict costs accurately is
a problem which is common to all industries.
It therefore emerges that there is need for pre-tender price estimation with reasonable accuracy
that helps the client decide whether to build or not. flic purpose of all pre-tender estimates is
to provide an indication ol the probable cost of the new construction. The single most
important intention of the estimate is its accuracy (Ashworth 2004. p 97). Floor area method is
perhaps the best known product-based cost model and provides the data upon which initial
estimates are based. This techniques is currently used by the quantity surveying firms at large,
in spite of a number of failings which have become apparent over the years. I crry cl al ( 1999.
p 121) argue that a process that actually generates the costs as they arc incurred is likely to be
more accurate. However, using the floor area method, the construction process cannot be
modelled until the form of the building has been postulated and therefore the process based
model has little place in its application. The floor area method takes no acyount of the
configuration, or details of the building design, and is only simply based upon one ol the
following (Ferry et al 1999, p 120):
• The floor area of the proposed project (gross or net)
• The volume of the proposed project or
• Some user parameter such as number ol pupil places for a school or number of beds for a
hospital.
1

The method automatically excludes site works from the single price rate calculation and
estimates them separately. This is because their cost has no relationship to the si/c of the
building. The engineering services are also sometimes treated in the same way with rather less
justification.
Cost control is something which the design team tries to achieve using various cost estimation
methods, by trying to keep the cost of building within the limits of the predetermined estimate,
throughout the design and construction stages of the project (Seeley 1991). Cost planning and
control begins at the pre-design stage using this method. Pre-design estimating refers to
computing the probable cost of the new works at some stage before the complete drawings and
bills of quantities are prepared, which act as the basis for final estimating preparation.
Decision-making at the early stages of the project, initial appropriations and economic
feasibility studies are based upon the preliminary or pre-design cost estimates. The method
therefore chosen to come up with a cost estimate should not deviate from accuracy a lot so that
figures close to the actual construction costs are realized.
1.2 Problem Statement
A number o f cost estimating methods are used to ascertain and possibly project building costs
at the pre-tender stage. These include the unit method, floor area method, cube method,
approximate quantities, elemental analysis and pricing bills of quantities before tender.
The most commonly used cost estimating method was the floor area method (The Quantity
Surveyor 2001). This is largely a post sceond world war method, which had application in
public building facilities that were identified such as schools and residential developments
(Ferry et al 1999, p 121). Such an estimate merely attempts to forecast that a building of a
certain size can be built for a certain sum of money. It cannot analyze whether a particular
design is going to meet that cost. It is possible to weight the estimate subjectively on the
grounds that the proposed solution looks to be at the expensive end or the low-cost end of the
market, but this subject the work into the realms of guesswork. The other methods of' cost
estimation require more information at the design stage.
2
13 Objectives of the Study
The main objective of the study is:-
i. To establish the variation between costs estimates derived form the various estimation
methods.
ii. To establish factors that have direct influence on the cost of residential and office
projects in Kenya
iii. To establish the deviation o f construction cost estimates from actual tenders received
1.4 Research Questions
i. What is the magnitude of variation between preliminary costs estimates derived from
the various estimating methods?
ii. What are the factors that have a direct influence on the cost o f a project?
iii. What is the level o f deviation of cost estimates to those derived from the tendering
process?
1.5 Hypothesis
The Null Hypothesis: Cost estimates do not accurately project pre-design stage cosls used as a
guide for investment decision making process.
The Alternative Hypothesis: Cost estimates do accurately project pre-design stage costs used
as a guide for investment decision making process.
1.6 Scope of the Study
The study was limited to residential and office buildings. I bis is because they comprise the
bulk of construction work in Nairobi. In addition, the preliminary cost estimating methods has
the large applications in the residential and office building projects. The scope of this study is
limited to case studies of private residential projects in Kenya, in live forms of low-rise
apartments, residential maisonettes, bungalows, low and high rise office blocks. Only private
residential building projects are considered in the study, flic rationale for this decision is that
there is a general economic and social need to provide housing and office accommodation for
the increasing urban population in Kenya. Hence, findings of this study have theoretical and
practical applications in a more liberalized construction market for estimating residential
houses and office buildings.
3

Only projects in the city o f Nairobi were included in the study sample. Nairobi accounts for
over 60% o f the cost value of the private building projects in the main towns of Kenya
(Republic of Kenya 1991 - 95). Further most quantity surveying practices are located in
Nairobi, even for projects located outside the Nairobi City. Residential and office buildings
started and completed within the last ten years (1996 to 2005) were included in the sample.
This period was considered long enough to reveal the behaviors o f cost trends in the Kenyan
building industry and explain costs distributions of private building projects.
1.7 Assumptions
This study made the assumption that the main aim of preliminary cost estimation is lo
forecast the future cost of a project; and to control its building design to ensure that the
estimated figure is close to the tender figure and probably the final project cost.
1.8 Significance of the Study
This study seeks to avail information for use by the various construction industry stakeholders;
clients professionals, contractors, investors and researchers.
The study has identified areas that cause estimating inaccuracies when using various cost
estimation methods and make recommendations on how to improve on the methods. With
inaccuracies and variations being reduced, it is expected that the clients would start actual
financial planning with greater certainty. The results of this study will have practical
application in the cost estimating and cost planning practice. The study is a step towards the
development and establishment o f a cost estimating model system to be used in the building
industry in Kenya. In addition, it is hoped it will lead to development and refinement of
computer software to be used for cost estimates for putting up residential and office buildings
in Kenya. An insight of applicability and relevance of the preliminary estimating methods to
the Kenyan situation would be availed, rhis would act as a catalyst for further research in the
field of cost modelling.
4

1.9 Structure of the Study
This research project has five chapters and their contents arc briefly outlined below.
Chapter one discusses the problems of preliminary cost estimating. It discusses the effects of
implications of potential avenues o f inaccuracies. It includes the objectives, hypothesis, scope
and significance of the study.
Chapter two discusses the concept o f accuracy and its difficulty especially because o f non
availability of required information in early stages. It formulates a domain o f
reasonable accuracy which envisages availability of estimates for the purpose for
which it is required. It discusses the various forms of estimates at different stages of
the project and their levels of accuracy depending on information available.
Chapter three gives the methodology to be used in the study. The research design, flic
Population, sample, data collection instruments and methods employed.
Chapter four handles the analysis o f the independent and dependent variables, flic data
interpretation and presentation in the forms of descriptive and inferential statistics is
made and their explanations thereof.
Chapter five covers the conclusions of the research findings, gives recommendations o f the
study and finally suggests possible areas of further study.
5
$

Chapter T w o
LITERATURE REVIEW
2.1 Introduction
This chapter gives an overview o f the past findings covering the wider aspect of cost
estimation. It further discusses the various forms of estimates, area of application and their
limitations. Cost estimation methods are elaborately discussed together with related researches
done by others in this domain. The chapter builds up the main approach of the study through
its understanding of the concept o f ‘estimation’ is formulated and used to define problem areas
of estimation.
2.2 The Brief
“Design" may begin even before a full brief is established as soon as the client who is the
person or Institution for which the building is to be built makes a decision to construct a
building in a particular way in a particular place. At this first stage, as the brief is considered
and developed, some idea of cost has to be established quickly. There may already be a budget
limit but if not the client will need to know what order of cost is likely to be involved the “cost
bracket” (Morton and Jagger 1995, P 19). Feasibility studies involve financial ns well as
functional and technical requirements (Figure 2.1). Although there is bound to be much
rethinking in the early stages, it is critically important to settle on major decisions as it become
increasingly expensive and unrealistic to make changes to the design as building proceeds
(Morton and Jagger 1995, P 19).
The Cost Determinants: The two most obvious determinants ol the overall cost ol a building
are its function and size. The floor area method is “crude” and simple way o f estimating what
a building is going to cost, often used by Architects and Quantity Surveyors as a fust guess
and sometimes surprisingly accurate (Morton and Jagger 1995, p 36). It takes the proposed
size o f a building (in square meters o f tloor area) and multiplies that by the average current
costs per square metre for buildings o f that type in that region (F igure 2.2).
6

1.
2.
3.
4.
5.
6.
7.
Control
Figure 2.1 RIBA Plan of Work - Cost Stages
(Source: Morton and Jaggcr 1995, p 19)
7

Resources (Programme related)
Feedback limited to contractor interest.
Figure 2.2 Traditional Cost Modeling
Source: Adapted from Ferry and Brandon 1999, p 113
8

Simple and conventional ways of analyzing a buildings cost arc varied. There arc thus many
different, but equally valid, ways o f defining the total cost of a building, depending on ihc
perspective from which the problem is being viewed; whether from the contractor or the client.
(Morton and Jagger 1995 p 289) argue that the analysis o f costs by element, based on bills of
quantities, cannot reflect truly the way costs arc actually incurred or generated, mainly because
it ignores the interaction of one element with another and take insufficient account of the actual
process of construction, which consists of bringing resources together under particular
conditions.
23 The Need for Cost Estimation
How can all the parties engaged in the building process ensure that maximum value lor money
in all senses of value is achieved - or approximated as closely as possible in a world of great
uncertainty? Despite how sophisticated the systems become, there remain two certain
difficulties which are inherent in the building process itself, and which explain why accurate
cost reduction has always been such an intractable problem. Ihc initial difficulty is that
accurate estimate o f a buildings cost cannot be made until the details o f the designs arc known
expect to some extent in the case o f standard repeated building types. Nonetheless, the client
needs knowledge o f cost before commitment to the contract and its detailed design, flic
techniques developed over the years to overcome these central difficulties though criticized as
relatively crude have remained in use. 'Hie fact that a hundred years o f ingenuity has
ultimately failed to come up with a perfect solution indicates the depth of the problem
The initial Estimate: The cost-prediction and cost planning, techniques developed make the
best use of information available at each stage in the development o f the design. Striving to■fr
achieve optimization in cost is only a part of the total objective o f initial cost-predictions
(Ferry etal 1999, P 105). While all consultants would like to achieve optimization in their own
sub-system of activity, it is the performance of all systems acting together that determines the
degree of initial cost accuracy.
At the very beginning, even before the brief itself has been formulated, clients may be
approaching their decision from one o f two different directions or from somewhere in between.
First they may have a clear idea of the building required in terms of its function and size and
9

need to know how much it is likely to cost, having been given a rough estimate they can then
adjust their expectations of the buildings specification or raise the budget.
Alternatively, a client may have a very firmly fixed budget and want to know the kind of
building to expect for a given amount of money or perhaps also what trade oil's arc possible
between aspects such as quality of finish and size before making a decision.
Cost Planning and Cost Control: The percentage deviations of residential and office building
project from achieving the specified time and cost targets observed when the building is
completed are normally used by researchers and practitioners in the building industry to
measure the level of the client's satisfaction with the performance of the project team
(Baradyana 1996, Mbatha 1986, Mbechc 1994, Sidwell 1985). A key process by which the
project team strives to achieve this time-cost-quality-utility goal is the process of'cost control'
which mainly falls in the domain of Quantity Surveying and Construction Project
Management. Cost control refers to all methods used in controlling the cost o f a building
project within the limits o f a predetermined estimate, throughout the design and construction
stages of the project (Seeley 1991, p 14). Building cost refers to the amount which the client
will have to pay the main contractor and sub-contractors to construct the building or procure a
facility immediately upon completion.
Cost block control aims at keeping the total cost within the amount agreed with the client, by
doing pre-design estimating, cost planning, cost checking and taking remedial action where
element costs exceed the planned target during the design and construction further the control
of aims at achieving a balanced and logical distribution o f the available funds between various
elements of building.
Project cost planning at the design stage entails the preparation of a cost estimate and a cost
plan and carrying out of cost checks. Cost planning and control begins at pre-design otherwise
referred to as preliminary or approximate estimating. Pre-design estimating refers to computing
the probable cost o f new works at some stage before the hills of firm quantities, which nets as
the basis for final estimates can be prepared. This estimating sets the cost ceiling within, which
the design and construction o f the building should proceed.
10

Decision - making at the early stages of the project, initial appropriations and economic
feasibility studies are based upon the preliminary or pre-design cost estimates. In the Kenyan
building industry, single price rates estimating, rate per square metre, elemental cost planning,
approximate quantities, operations and resources planning arc the methods commonly used by
Quantity Surveyors in forecasting and planning building costs. These method needs to be re
examined to ascertain whether they have been predicting building costs to within acceptable
levels. In practice, the most commonly used pre-design costing is calculated from analysis of
previously completed buildings. To facilitate thorough cost updating for variations in design
and construction (time, quantity, quality and utility) in the new project as compared to the
previous job, the overall superficial unit cost is broken down into elements and sub-elements
using elemental cost analysis of the previous job as the basis for the breakdown.
The 'updating' for time, quality, quantity and utility is carried out using straight-line
adjustments for difference in floor area and applying building cost indices for adjustments in
time, and "professional judgement" for adjustments in quality and utility (Raflcry 1991, p
169). As more design information becomes available, approximate quantities can be measured
and quality adjustments be made more accurately and more objectively. To the approximate
cost estimate which is obtained using approximate quantities is normally added or deducted t<>
account for market considerations such as the likelihood o f increased costs occurring between
the date of preparing the estimate and the date of letting the contract. The adjustment for
quality and utility is based on expert intuition; there arc no clear guidelines for making the
adjustment
The importance of professional experience and expert judgment that are applied in the cost
prediction method described above are not disputable. Rxpcrt intuition has been considered
and correctly used, as a significant ingredient in the practice of cost prediction (Kous Kanins
and Koehn 1974, p 590, Raftery 1991, p 185, Seeley 1992, p (iii). This notwithstanding, the
use o f the traditional method of cost forecasting causes a serious discomfort in the building
industry. The pre-design and even final building cost estimates have quite often been observed
to deviate significantly from tenders, leaving the quantity surveyor who is the estimators
frustrated. As an example, Thuo’s cost forecast "through" price enquiries and mathematical
analysis, indicated that the predicted costs bear no close relationship with the actual; but he
II

seems to suggest that this situation is attributable to the fact that be was "forecasting during
recession"(2000, p II). This is highly debatable; a good reliable forecasting model should
factor-in the influence of national or sectoral economic boom and recessionary forces. Existing
cost estimating methods fail to take into account of economic down turn in a country and its
effect on building costs
Gitau attributes Thuo's situation to the lack of reliable database for the building costs (2000; p
15). However, a more refined technique of cost modeling is highly likely to increase
significantly, the gain from the existing cost data (Rafkry 1991, p 184).
The building cost estimate carries a lot of unpredictable uncertainty and is likely to he
detrimental by the decision maker and owners financing a project. Pre-design cost estimates
need to be adequately accurate because as stated earlier initial appropriations and economic
feasibility studies are based on such estimates. The impact of information technology (IT) has
brought potential for improvement in cost modeling techniques. This coupled with new
procurement methods will lead to reduced building costs, more predictions o f likely costs and
less period for carrying out initial cost estimates.
Ideally, the model cost for use in pre-design cost estimation should be inexpensive quick and
reasonably accurate. Kous Koulas and Kochn (1974, p 589) observe that detailed quantity
takes-offs and accurate cost estimates arc too expensive to the clients and contractors and time
consuming to the estimator. Nonetheless, the degree of accuracy will very much depend on the
type of information provided to the quantity surveyor and the quality of pricing information
and judgment that is used (Ashworth 2004, p 265)
Importance of Cost Estimation: There has in recent years been a great need for an
understanding of construction economics and cost control, particularly during the design stage
of projects. The importance of this is due largely to the following according to Ashworth
(2004, p 5): -
• The increased pace in society in general has resulted in clients being less likely f<> tolerate
delays caused by redesigning building when tenders arc too high.
12

• The client’s requirements today arc more complex than those o f their Victorian
counterparts. A more effective system of control is therefore desirable from inception up
to the completion of the final account, and thereafter during costs-in-usc.
• The clients of the industry often large organisations and financial institutions have had an
increased emphasis on accountability in both the public and the private sectors of the
industry. The efficiency of these organizations at construction work is only as good as the
type and quality of information used in the analysis.
• There has been a trend towards modern designs and new techniques, materials and
methods of construction. The designer is able to choose from a far wider range of
products and this has produced variety in construction. The traditional methods of
estimating are unable to cope in these circumstances to achieve value for money and
more balanced designs.
• There has, in general, been a move towards the elimination of waste, and a greater
emphasis on the use o f the world’s scarce resources. This has necessitated a desire for
improved methods of forecasting and control of costs.
The Cost Feedback Mechanism: The traditional principle of gathering site performance data
from previous project known as feedback is predominantly in application. The estimator uses
standard outputs, influenced by size, complexity, quality and the like, to estimate the costs <d
work to be performed (Ashworth 2004, p 55). If the contractor is successful in submitting the
accepted tender then the work is put into practice and during construction, is monitored by site
management staff. The monitoring is frequently carried out incidental to other purposes such as
incentive calculations. These calculations require quantities of work to be measured against the
labour and time that have been expended. However, the practice is that such information is not
routinely used by estimators or quantity surveyors in calculation or revision o f outputs for the
following reasons:
• It is very variable in terms of the output it generates.
• There is insufficient confidence, by estimators, in the site recording system.
• The information is often not compatible with future estimating needs.
• T here is a difficulty in reusing the data because o f the unique circum stances under w hich
the work has been carried.
13
The traditional method used for estimating purposes has been to develop a classification
system against which to record costs. The outputs achieved on similar work from previous
projects should be the major source of information used in estimating. However, construction
work requires a complex system against which to record this information. Research lias shown
that the reliability of any cost recording system substantially deteriorates when the number of
cost codes exceeds 50 (Ashworth 2004). The cost code system used in the construction
industry is a four-digit system.
The complexity of construction work and the fact that most projects arc bespoke one-off
designs (Ashworth 2004 p 56). Even projects that are considered to be “ identical" record
different actual outputs and costs and that makes the process difficult to achieve in practice.
Evidence indicates that different sites record different feedback values for apparently similar
items of work.
Production standards, for both labour and plant, arc likely to be influenced by a whole range nl
project characteristics. Estimators when adapting a standard output need to assimilate these
different factors in order to arrive at a best estimate for the work. Some o f the characteristics
that need consideration:
• Location and accessibility o f the work
• Amount of repetition in the work
• Intricacy of the design
• Need for special labour skills
• Quantity of work involved
• Quality of materials used
• Standard of workmanship
• Working environment such as safety, temperature, cleanliness etc
When using bills of quantities, analysis of costs by elements is done. But this cannot tiulv
reflect the way costs are actually incurred or generated as they ignore the interaction of
different buildings elements. The analysis of costs by element, based on bills of quantities,
cannot reflect truly the way costs arc actually incurred or generated, mainly because it has
ignored the interaction of one element with another and takes insufficient account of the actual
14

process of construction, which consists of bringing resources together unde r particular
conditions.
Design decisions take account of the relative costs o f different ways o f combining those
resources in determining the material to be specified, the form of the building, the structural
system to be used and the way the internal environment is to be controlled (Ashworth 2004. p
56).
However, carefully the initial designs arc costed and however buildablc the design, there is still
scope for major discrepancies between estimates and actual cost if the basis of the cost
analyses and system of cost planning and control do not rcflccl the realities o f construction.
2.4 Cost Estimating Methods
The cost prediction and cost-planning techniques that have been developed try to make the best
use o f information available at each design development stage (Murton and .latter l*)95).
At the very beginning, even before the brief has been formulated clients may be approaching
their decision to build from one or two different directions. They may have a clear idea of the
building required, in terms of its function and size and need to know how much it is likely to
cost. Having been given a rough estimate, they can adjust their expectations o f the building
specification. They may look again at the budget to sec if it can be raised. Clients may also
have a very firmly fixed budget and want to know what kind of building can be expected for
the money.
Obviously estimates made at this stage cannot take account of any specific characteristics the
design of the form that the building might have. There are certain methods that are used to get
an initial estimate and they include the following discussed below.
Unit Method: Estimates based on function or performance related. This is extremely simple
and can be used when minimal information is available. It is not however, applicable where
the function o f proposed building is new, unique or its proposed design very different from the
conventional. The principle is to use information available on other buildings of similar
function to identify some kind ol unit cost- for example cost per student for a college, cost per
15

be space for a hospital, and the population to be served by a library. Its major disadvantage is
lack o f precision and thus it’s just a blunt tool for only establishing general guidelines.
Superficial Area Method: It is the most commonly used method for early price estimation.
As it is easy to calculate, easily understood by people in the construction industry. The area of
each o f the floors is measured and multiplied by a cost per meter squared. While using this
method, there are certain aspects which should be considered, like, items of work which cannot
be related to the floor area need to be priced at separate all inclusive rates. Secondly, if a
client expresses the project only in terms of the usable space, if necessary to add to this area
circulation and other non-usable space to make the building functional.
Storey Enclosure Method: The problem with the first two techniques is that they take no
account of the building shape in plan or sections that arc significant determinants of cost. This
is solved by storey enclosure method. However, before any cost model o f this sort can he
used, design proposals have to be developed with some details. Another method called the
cube method that had been used for a long time has become obsolete.
Approximate Quantities: This one provides a more detailed approximate estimate than any of
the other methods. They represent composite items, which combine and group together typical
bill measured items. In practice, only the major items that arc of cost importance arc
measured. It provides a more detailed and reliable method o f approximation.
Elemental Cost Estimating: In this method it analyses the cost of the project on an elemental
basis, attempting to make use of the cost analyses from other similar projects.
Pricing Bills of Quantities: In this method, the quantity surveyor prices a complete hill of
quantities to predict contractors tender.
Each of the methods summary described before produces a single-figure estimates, such a
figure becomes quickly fixed in the minds of clients, finance provider, designers and quantity
surveyor. It would probably be much sensible, though more difficult and costly, to present the
early estimates as a range of probabilities, showing the sort o f features or circumstances which
would tend to push cost up or down.
16

The choice of the method to use in preparing the cost estimates depends on certain factors
which includc:-Time available. Project information. Cost data. Preference and familiarity and
Experience of the quantity surveyor
2.5 The Fundamental Problems of Cost Estimation
The first difficulty is that a really accurate estimate of a building's cost cannot be made until
the details of the design are known except in the case o f standard repeated building types.
However, the client wanting to have a building constructed needs to know how much it is
going to cost before committing him or herself to the contract and its detailed design
(Ashworth 2004).
The second difficulty is that the information about the building as presented by designers and
analyzed by the Quantity Surveyor docs not relate directly enough to the process of
construction as perceived by the contractor. The techniques developed over the years to
overcome this difficulty may be criticized as relatively crude but the fact that a hundred years
of ingenuity has ultimately failed to come up with a perfect solution perhaps indicate the depth
of the problem. With the development of integrated computer models and more coordinated
information systems, success may be nearer, but it will still require mutual understanding ami
considerable determination on the part of the people involved if any real advance is to he
made.
Despite the advances made in modeling techniques and the use of microcomputers for
assessing alternatives more quickly, it can still be argued that the issues which relied the real
cost of buildings are not fully taken account of in current approaches to building economics.
The reason is that the sources of cost information, primarily generated through the use of hills
of quantities reflect the product rather than the process o f construction, flic bills of quantities
and the Standard Method o f Measurement (SMM) use units of measured work in the main to
convey costs rather than identifying the resources needed to achieve the finished woik.
The location of the element in the building is ignored. In a multi-storey structure it is obvious
that it will cost more to cast the concrete floor slabs at the top o f building than at the bottom.
17
More fundamentally, there is a mis-match between the way the design is represented in the
bills o f quantities and the contractor’s approach to planning and controlling the cost of
construction. The contractor will attempt to identify the various activities and their sequence,
the time required for each activity and the various resources needed.
The information in the bills of quantities docs not help the contractor directly to establish the
construction programme. The two fundamental difficulties in using bills o f quantities as the
basis of cost models are: - the real cost generators, that arc the resources arc not identified; and
most of finished work represents an amalgamation of resources, which arc not subject to the
same variables.
The purpose of these cost estimates is to provide an indication of the probable cost of
construction, as it is an important factor to consider in the client's overall strategy of the
decision to build. The estimate also provides a basis for his budgeting and construction cost
control can also be used for comparison as a basis for the evaluation o f different design
solutions. This shows the importance in which estimates arc to the whole construction process.
(Ashworth 2004, p 99)
Importance of Accurate Cost Estimates: With a good pre-tender estimate, budgeting is
enabled and this decides whether the project should proceed as envisaged. If the project costs
are widely underestimated companies can be “locked in" to uneconomical investments. The
client company for the knowledgeable comparison o f bids also requires estimates, where
contractors are involved, with low bids being a much course for concern as high bids. I bis
concern is because of certain reasons. If a contractor underestimates the cost to him of
carrying out a project at the bidding stage on fixed price contract, the consequences can lie
catastrophic to him.
Accurate estimating is important throughout the life of a project to evaluate proposed changes.
alternative ways of carrying out the work and as a basis for efleetivc cost control. These arc
the basis for decision-making and control of work in progress for both client and contractors.
Due to many factors like lack of information at initial stages there is a problem of completing
of project to its initial estimate. This therefore leads to escalation of costs that can lie defined
as “The difference between the final cost or latest estimate of final cost and the original
definitive estimate” (Morton and Jaggar 2003). It can also be defined as “The change in18

estimated costs over time". With high cost escalations, many companies can he trapped by the
“sunk costs principles'’. Therefore when making initial cost estimates allowances for cost
escalation should he included.
2.6 l ender Patterns And Bidding Strategy
2.6.1 Tender Patterns
Contrary to general belief, a typical distribution of competitive tenders for the same contract »■;
almost symmetrical. In fact it is closely approximated by the normal distribution There is a
very slight skewness to the right but this is so small that it can for practical purposes he ignored
(Bceston, 1983).
On rare occasions there arc about 25 bids for a single contract to provide a good indication «>1
shape, and then the characteristic indication of conformity with the normal distribution me
seen. Conformity with the normal distribution with otdy negligible skewness i ; not what
would be expected from most people's mental model o f tendering. In this model th<* tenderer's
who most want to win the competition estimate carefully and bid low. Their bids can ho
expected to be close to each other and include the winner. Those less keen estimate less
carefully and pitch their tenders higher. Their bids should he higher than the others and more
scattered. Some of them would not he properly estimated hut pitched high enough to ensure
that the bidder would not win and intended only to avoid telling the client that he was not
interested in tendering for the project. The total effect of such model would produce a
distribution very strongly skewed to the right.
The additions or subtraction could represent differences in keenness and estimating, error.
Because the shape of distribution is close to being normal, it suggests that estimating emu is
the major cause of deviations. It docs not mean that bidders consciously aim for the centie <*l
the list. They use methods, which on average, put them in the middle, and the ones that they
win are those where their downward errors arc greatest. So. saying that error makes a greater
contribution than keenness is not saying that variability due to keenness is necessarily very
small (Beeston 1983).
19

2.6.2 Non-Serious Tenders and Cover Prices
A tender may be submitted by a contractor who has been included in a restricted lender list and
feels that he ought to bid even though he docs not want the contract. Such a bid can he called a
“non-serious tender” and a special case of it is the “cover price”. A cover price is not arrived
at by careful estimating but by asking another tenderer for a figure that is safely higher than his
bid will be. Other non-serious tenders result from rough estimation and a very high mark-up.
In a sense these bids are genuine tenders because the contractor would do the work somehow if
by any chance his high bid were accepted. ITie high bid, like any other high bid, reflects a low
level of keenness. Such bidders do not want to be regarded as being reluctant to tender but
neither do they want to get reputation for high prices, because Ihcy feel that both would reduce
their chance o f being included in future tender lists. This probably helps to keep their tenders
within the same normal distribution as the others (Bccston 198 H
2.6.3 Bidding Strategies
Some bidding strategies offered to contractors depend on analysis o f the contractor's
performance against specified competitors (Bceston 1983). They arc however unlikely to be
successful due to the following rcasons:-
• Specifying competitors greatly reduces the data upon which the strategy can l>c based.
• The strategy cannot be applied to two or three competitors in any one tender list little
chance.
• It is not always possible to discover the competitors before having to tender.
• An individual competitor may change his bidding strategy thus rendering past data
about him misleading.
• Such strategies seldom take account of kccncrs to win.
Special knowledge about one or more competitors is useful and best used to adjust a bid that
has been constructed in a consistent way without using that knowledge. The higher the
numbers of tenders submitted by contractors, the lower the lowest bid. With high competition,
co n trac to rs t r y to reduce th e ir p rices to w in the tender. T h is actua lly leads to more msfariCCS o f
skewed tenders, which arc hard to predict their true value.
20

2.7 The Accuracy Of Estimating
2.7.1 Measuring Performance
Few practitioners objectively measure their estimating accuracy (Bceston 1983). When they
do they are usually unpleasantly surprised. Because of the optimistic idea that most have of
their own performance, they too easily reject a new method for which accuracy lias been
quantified. They find it hard to believe that they cannot do better than the figures quoted for
the new method.
To measure estimating errors, a definition of error must be decided upon, f rom the client's
estimator, the obvious one is the difference between the estimate and the lowest tender. A
convenient way o f expressing the error is the ratio of estimate to target.
The contractor’s estimator may have more difficulty in defining his target and measuring his
errors. He may aim to be in a particular place. Such as second or third in the ranking of bid
for a contract, in that case he would be allowing his estimating errors and those o f his
competitors to produce the required proportion o f lowest tenderer's. When bids arc published,
he could compare his bid with that o f the one in the target position, sometimes him, and call
the difference his errors.
As the actual costs can only be known for contracts that arc won. there is a danger of tending to
judge the estimating method when it has performed successfully. On the other hand, it can be
argued that the time measure of effectiveness o f an estimating method is the profitability of
contract won, so only these are relevant. This is difficult to rationalize because if a different
method has been used, different contracts would have been won, so comparison between
methods could be biased (Bceston 1983).
As well as measuring the error by comparison with the actual target, it may be interesting to
compare the estimate with a more stable hypothetical target. Reducing the contribution of
target movement to the variability o f the error brings us closer to measuring the inherent error
of the estimate. For example, the average bids for a contract is more stable than the lowest, so
it is quite reasonable to aim at this and then make an adjustment for the difference between the
average and the lowest, taking into account the number o f tenders.
21
An estimator who can show that the correlation between his estimates and average bids is good
(that is, the difference does not vary much) is entitled, in one sense, to claim good
performance; even though it is little consolation to a client whose lowest tender has come in for
above the estimate. Because of occasional wildly erratic bids, the median is a preferable
average to arithmetic mean. Also, it is easily calculated because bids arc likely to l>c arranged
in order of size for presentation to the client.
The idea of measuring error in relation to various targets brings out the importance of
distinguishing between average error, however measured, and dispersion errors. Quality of an
estimate can best be judged by the dispersion of errors and not the long-run average error,
which can easily be corrected and may even, be deliberate. Another reason for using the
dispersion of errors about their average separately from the average error is that the effects on
dispersion of choosing various defined points in the tender list as hypothetical, or initial,
targets can be compared. The dispersion of errors can be thought of as either the standard
deviation of percentage errors or the standard deviation of the percentage ratio of estimate to
target.
1,12 Present Achievement
Although slightly skewed to the right, the distribution o f estimating errors can be regarded as
conforming to the normal distribution (Bccston 1983). A typical standard deviation of
percentage errors made by client’s estimators was found by Morrison and Stevens (1981) to he
12%. Specializing in a particular type of work can reduce it to 10%. Ikeston (1983) has seen
no documented evidence o f lower standard deviation than the above figures measured over
enough estimates to be convincing.
In this connection, the standard error o f the standard deviation must l>c remembered. It is ( )/V
/ (2n) where O is the population standard deviation and n the number o f estimates. Therefore,
if the population standard deviation is taken to be 12%, the numbers o f estimates need to be at
least 50, giving a standard error of 1.2, before a sample standard deviation o f 10% can he
regarded as significantly better.
Contractors’ estimators seem to do better but their task is different. It is not easy to interpret
the meaning o f their ability to provide a basis for bids whose dispersion has a coefficient of
22
variation (CV) of 6%, but it is certain that their methods produce results which agree with each
other more closely than with those o f the client estimator. One factor that would contribute to
a better performance by contractors’ estimators is that they take into account construction
methods more realistically than clients’ estimators (Bccston 1983).
When contractors estimate their costs, their variability is presumably less than that exhibited
when their mark-up is included. ITicrcforc the variability o f contractors’ estimates of their
costs is probably a little less than the variability between bids for the same contract.
Clients’ estimators could reasonably hope to reduce the variability of their estimates to close
this if they used the same methods as contractors when estimating their costs. To calculate the
resulting estimating errors requires the addition of the variability o f the winning contractor's
mark-up, which is presumably very small. Wining bids are likely to have a less variable mark
up than other bids.
Clients should be made aware of the dispersion of estimating errors. The proportion likely to
be within 10% would be a suitable way of doing so. The limit of estimating accuracy should be
borne in mind when deciding whether to proceed with a design. It would be a pity to reject a
good design, which seems too expensive when it would be acceptable if the estimate were too
high by about one standard deviation of the distribution o f errors. Equally, the client should be
prepared for the lowest tender to be the same amount or more above the estimate. Iking aware
of the distribution of estimating errors also help when deciding whether to accept a tender as
the best obtainable or to call for more.
2.73 Improving Estimating Performance
The performance o f an estimate can be improved by improving certain tasks thus making it
reliable (Becston 1983). These include:
• An improvement requiring no new technique but more effort would be obtained by use
of more than one project as a price analogue. It is more productive of accuracy to
spend time on making repeated estimates than on refining any one of them. A
minimum of four projects should be the aim, but even two or three arc much better than
one.
23

• Making several estimates and averaging them is a powerful way of improving long
term performance, because the standard error o f the average is proportional to l/Vn
provided that the estimates arc independent.
» Another simple procedure to improve estimating performance is to use several methods
for each estimate and to keep records o f errors so as to select the best method <>i
combination of methods. A minimum of 30 projects need to be analyzed.
• Moving towards contractors' methods o f estimating was suggested as a way ol
improving clients' estimators’ performance. This would include not only learning from
them how to take account o f construction methods but also emulating their way of
arriving at a mark-up.
• Whatever method o f estimating is used, it will be improved by better data With moie
estimators having access to computers, large data banks should become easier i<»
handle.
2.7.4 Computer Methods
With the advent of the computer work has been made easy through speeding up the work being
undertaken. In addition, it reduces the instances in which errors can he committed, this
increases accuracy. The use of computers can improve (he accuracy of estimating in two
aspects. One they can make available a large bank of data so that estimates can be based on
more projects. The other improvement is that they allow the consistent application of <jniie
involved methods. Consistency of methods is helpful because it facilitates objective monitoring
of performance, improves the development of the user’s judgment and provides the basis o f a
bidding strategy.
2.8 Cost Data
I he published information received by quantity surveyors usually relates to a typical building
in a typical location with only a brief summary of the contributing factors l<> such a cost. I he
feedback of such cost information centre rotates around (be bills of quantities (Morton and
Jaggar 1995). Information on wages, materials and plants collected on site and fed to contract
manager of the contractor who passes the data to estimator who uses this logcthci with data
from other projects to estimate the next tender price. Flic consultant quantitv-siii \ eying firm
24

analyses this data from the new tenders and uses it to forecast the cost o f the next similar
building and control its costs during the design development. This data that is obtained from
the site feedback has its shortcomings.
In reviewing traditional cost models, the methods used arc merely structures around which cost
adviser’s judgment is applied to make them work. The models arc ill equipped to produce a
reliable answer on their own. If a right cost figure is applied to any single price method, they
give better results than more sophisticated techniques with wrong cost data applied to them
(Ferry 2003).
Reliability of cost information give estimators prevailing market conditions at lime of lender
rather than conditions at time of making the estimate more reliable as a tool of predicting costs
to be incorrect as market trends are defeated. The root o f forecasting and cost control activity,
there is need for cost data to supplement the numbers, areas, and volumes etc, which have been
used to describe the building. It is this data that is critical in determining whether an estimate
is reliable or not.
2.8.1 Uses of Cost Data
Uses of data can be classified into four main headings as follows:
Forecasting o f Cost: Provides information on cost per square metre, elemental unit rates, hills
of quantities rates and all-in unit rates. This information is sourced from analysis o f past
projects or historic costs. The figures would be updated by the use of a building cost index, and
would be projected forward to the proposed tender date by an intuitive or calculated prediction
technique.
Comparison of Cost: In this use of data, the need is not so much to discover vvliat the
building or component will actually cost at the time of tender, but to make comparison between
items with similar function, or buildings of different design, to decide which the IxMter choice
is.
B alancing o f Coat: In determ ining a budget for the co st control o f n bu ild ing , it is ncccssnry
to breakdown the overall cost into smaller units. These smaller units arc used not only for
25
checking purposes but also to allow a cost strategy for design to be developed. This strategy
will attempt to spend money in accordance with the client’s requirement, by allocating sums of
money to the various major components of the building.
Analysis of Cost Trends: By looking at the way in which costs for different items arc
changing in relation to one another, or changing between one point in time and another, it is
possible to have a better chance o f selecting the specification which will suit the client's
requirement over the short and long term. Cost data also allow us to obtain a more reliable
prediction of what the market price to the client will be when the job eventually goes out to
tender. When data is used for the detection of cost trends, the cost is very often related to a
base-year cost, in which case the presentation of the information is in the form o f a cost index.
2.8.2 Problems with Analysis of Bills of Quantities
The vast majority of the information used by cost planners arises from the hills of quantities.
The Bills of Quantities are subject to incorrect assumptions (Morton and Jaggar 1995). Among
these include: -
Variation in Pricing Methods: When different contractors’ tenders for the same project are
broken down into smaller units, it’s very common to find variations in each sub-sector, flic
reasons for these variations include: -
• The rates in bills of quantities are not true costs, but neither arc they true prices in the
sense of a price in a supermarket shelf. Rates arc simply a notional breakdown of the total
price for commercial and administrative purposes.
• Contractors prices preliminary items differently. Some will place preliminaries in the
preliminaries section while others will include them, in whole or in part, in the measured
work rates as they see a commercial advantage in not identifying them too explicitly.
• It may be in the contractor’s best interest to ‘load’ the prices of those parts o f the building
which are executed first, such as excavation and earthworks, to improve the projects'
cash flow
• W here a con trac to r an ticipates variations to the contract, he m ay low er th e unit rates I«»»
them to be omitted items and increase rates for other items.
26

• Estimations make different assumptions in regard to resource requirements, flic
assumptions made will relate to the estimators view o f the firms expertise and economic
structure.
• Errors in estimating often cancel each other, hut once in a while an error of significant
cost in a single item may occur.
Variations in Bills of Quantities Kates for Different Projects: The following play an
important role in price variations in bills of quantities o f contractors tendering for different
projects.
• Site conditions : Certain site conditions affect the rates in a bill of quantity, these include:
Problems o f access: Boundary conditions especially adjoining buildings. Soil bearing
capacity and consistency, Topography and orientation o f building.
• Design variations : Has effect on efficient use of resources production method and time.
The design o f a building affects the efficient use o f resources time and method of
production.
• Contract conditions: Any contract which requires more working capital for the project, or
additional risk, is almost certain to incur a cost penalty which will be passed on 1o the
client. Conditions relating to the length of the construction period, particularly shortening
of time, and the phasing of works, may both result in uneconomic working hours and will
influence the estimator’s rates and particularly the preliminary items. Their impacts are
difficult to anticipate especially with regards to their effect in unit rates.
• Size of contract : Each firm depending on its size has an optimum size of contract that
suits its resources and structure. This alTccts its approach to the estimate when bidding for
certain contracts. The unit rates for a large project should make allowance for the
economies o f scale that could be expected, but certain aspects like site working conditions
and nature o f the industry don’t allow for such economics to be made.
• Location : This factor affects the problems of accessibility to the production resources.
The transport o f materials, workpeople and plant to site, accommodation o f the workforce
on remote sites etc. affects tender rates. On top of this local climate may affect the starting
on site, degree o f protecting required and interruption o f work programme.
27

With these variations affecting the data obtained from bills of quantities rates, success depends
upon the skill o f the user in determining what rate to use against a particular measured
quantity.
The Contractor’s Bid Price: While estimating process is theoretically adopted, it is infact
very often used to justify a total that the contractor has in mind from the very beginning.
Contractors bid at what they consider to be a socially acceptable price. This price is not well
defined, but it is considered to be the price which society is prepared to pay for a particular
type of building.
By bidding at this value, the estimator overcomes the problem of being unable i<> predict
resource requirement for the project. As the client’s anticipated cost is probably based on what
has been successfully built before, it is therefore likely that the estimator will have put forward
a reasonable estimate, and the labour and material ‘constants’ arc used to justify this.
Despite the wide variation in individual bills of quantities rates the final tender figures arc
often considerably closer than one would expect. This is the noil-deterministic notion of
pricing that is often used by contractors.
This notion is assisted by certain aspects that influence the pricing which arc:
• The name o f the project appears to influence the cost
• Constants o f labour, plant and materials arc not reliable
• Chances o f contracts being won.
• Estimates are tailored to suit the market.
If the estimation of cost really were a deterministic exercise, then the constants used in the
estimate would be absolute and unchanging, unless they were awarded as the result of
ascertained cost feedback.
In order for a firm to survive after losing a number of bids in succession, they reduce the rates
in the next tender. This practice suggests that the estimate docs not mean very much in terms
of an accura te prediction. I f the firm d o cs gel the jo b and th ey think it w ill be 'tig h t', they put
their best management team on the project and very often get a better return than a job where
28

the foresaw a large profit and did not maintain such tight control. Doubt has been cast on the
deterministic estimating process and thus should influence the way in which we look at and use
cost data. Obviously the factors of supply and demand related to the capacity o f the industry,
and its workload, will influence the level of the contractors bid, and the relationship between
these factors and the socially acceptable price - which has not yet been defined. It is important
to realize that market conditions reflect the economic standing of the country and this aspect
may well have more impact on ‘historic’ cost data, and the price society is prepared to pay for
its buildings, than any other.
2.83 Sources o f Data
Present data sources available in the industry have allowed the development ol simple and
reasonably effective system o f cost forecasting and control that the various parties arc familiar
with. For the cost adviser of a client, information can be obtained from two sources:
Own data: In most cases cost advisers usually prefer using data that they have prepared, l his
is due to the discussed following reasons. The data will be from a project background they
know and therefore are familiar with all the problems associated with the projects like location
complexity. Further detailed breakdown of any structural information is available in published
data. If it is so required therefore accessibility problems arc not encountered, flic data will
refer to the geographical area in which the firm carries out most of its work. Compared with
published data, there is a shorter time lag between receiving raw data, processing it and being
able to use the structured information in the office. This is particularly relevant to cost indices.
The choice of classification and structure of the processed data is under the control of the firm.
It is therefore possible to ensure that the details that arc most relevant to that particular practice
are emphasized and identified rather than having to accept a standardized published formal.
The disadvantages of own data sources arc that the variety of specification location, size and
shape of project is so large, that it is unlikely than an office will have up-to-date information,
which it can apply to all its new projects.
Published Cost Data: While the cost planner can probably make initiative assessment,
particularly of cost per square metre, it is reassuring to have a check available in the form of
published information. It is the primary role of published information to provide data which
29

enables practitioners to check on their own knowledge and to provide a context for their own
decision-making.
Sources of Published Data: There has been a steady improvement in the quantity and quality
of cost information appearing in journals and magazines concerned with design and building
management. Largely due to demand from clients for better-cost control, editors have found it
necessary to devote more space to cost analysis and forecasts. With the rapid changes in level
of resource costs and measured rates over very short time-spans, the technical journals,
published at weekly intervals, have largely replaced the traditional annual standard price books
as a source o f quick reference material.
A traditional source o f useful information has been the price books which arc normally
published normally by several long established organizations. In periods of rapid inflation or
market changes, they have suffered the drawback of having to prepare their information well in
advance o f the year o f publication, rhis problem has more recently been overcome by the
publishers offering on-line computers access to updated information.
The Institute o f Quantity Surveyors o f Kenya (IQSK) publishes cost information in their
quarterly journal in which they give prices of various items in the East African Countries of
Kenya, Uganda and Tanzania. The Kenya bureau of statistics has also been publishing a
quarterly cost index since 1997 that is available at their library at a fee.
Most o f the government literature in Kenya is sourced by the Kenyans who use data from
different government departments like Ministry of Public Works to come up with an index that
can be used from their offices. The problem with this data is that it is very outdated. l;or
example, the Kenya bureau of statistics still uses 1972 as its base year when formulating a cost
index, which has been subsequently overtaken by economic events such as inflation and
economic growth.
Information Services: With the advent o f cost planning techniques and the need lor a wide
range o f information on different types o f project, it was realized that most offices would
require information additional to the data normally found in one particular practice. It was
suggested in UK that if firms could be persuaded to supply their own elemental cost analyses,
to a central body, then a large pool of information could be gathered which could then be
30
disseminated to the subscribing members. If those analyses could be supplemented with other
more general information, on treads and economic indicators, then a useful service would be
provided to the profession.
building Cost Information Service (BICS) : BCIS is a subscriber-based service which
collates and analyses data submitted by its subscribers and incorporates materials from other
sources. Since 1()K4, BCIS lias been operating a computer based service which gives
snbsci ibers unlimited access to the entire BCIS databank from their own personal computers.
11 can be accessed from anywhere in the world. Simple but powerful selection tools to cut out
time-consuming browsing to locate for example the cost analyses needed for a project have
been developed. This ensures that users have access to the widest possible range of examples
as well as the most up-to-date information - particularly important when the market is volatile.
I lie package is designed to replicate the process that a quantity surveyor would follow when
working by hand, but can be amended if desired.
2.*) Cost Indices
One ol the most important items o f cost data, particularly in connection with forecasting
techniques that rely on historic information, is a cost index. Its object is to measure changes in
the cost of an item or group of items from one point in time to another. All index numbers
iequiio the selection of a base year, which is a date in which all the other numbers in a series
can relate. This number is usually 100 which allows for an increase or decrease in the value o f
data.
2.*).1 Uses of Index Numbers
I lie index numbers are used to:
• Update elemental cost analyses that is the tender information of past projects can be
hi ought upto current costs for estimating and budgeting purposes.
• Update for research that is bringing cost information, obtained at a number of different
point in time, to a common date by use of an index, a much larger sample of data can be
examined.
31

• I \iui|H)la(c the existing trend that is hy plotting the pattern of costs measured by an index,
it may he possible to extrapolate a tread into the future. Extrapolation based purely on
piesenl day trends is very risky.
• t ab ulate the fluctuations that is by applying an index to the cost o f work undertaken
dining a specified period, it is possible to evaluate the increase in cost o f resources to the
contractor more speedily and with less ambiguity than by using the previous laborious
method of comparing every invoice price with the base date cost of the same item
• Identify the changes in cost relationships that is if a cost index is prepared for the different
components o f a building, or for alternative possible solutions to design problem for
example reinforced concrete frame then it is possible to see the changes in the relationship
between one component and another over time.
• Assess market conditions that are if the index will measure the market price, as opposed to
the change in the cost of resources, then a measure of current market conditions can be
obtained which is of enormous benefit in updating and forecasting costs.
• Analyze o f unit price for buildings of similar function this is done if the data could be
found giving, say, the cost per metre squared of all schools of a certain type being built in
ilk country at one point in time, then the average o f these costs cold be used to provide the
basis of an index. If the exercise were repeated at regular intervals for that type of
building, then a regulai index could be established.
1 .‘>.2 t y p es o f I m l a N u m b er
I here .iu* two types of index numbers; factor cost index and tender based index.
t he 1 aetoi Cost Index: Ibis uses changes in the cost of resources to build up a composite
index It can also be referred to as a building cost index and mostly measures changes in the
contiactor’s cost. It’s constructed on a combination o f actual wage rates material costs and
plant and overhead charges. Due to its complexity, it is based on the principle of basket o f
goods in order to represent typical rates (Ashworth 2004). This type of index can be
constructed for total cost of a building or type of building; an elemental e.g. external wall
w ithin the building process; or for a single material e.g. cement.
In the construction of a concrete block wall, blocks, contribute 10 times more than mortar
hence in calculation a composite index; resources need to be weighted in accordance with their32

impui lance. Hie el led of weighting is to reduce an index value because mortar which has
mciea .ed most in price does not share equal status with blocks and labour. Changes in labour
efficiency, although affecting the cost to the contractor and possibly the client will not be
represented in the index unless the weightings are changed.
I lieu* i » a very leal difficulty with the factor cost index l>ccause it is not easy to judge
productivity over time, particularly with regard to the construction o f whole buildings
(Ashwoith 2004). In fact in the majority of cases, weighting in building factor cost indices are
assumed to remain constant until a revision of the index is undertaken and further analysis o f
the importance o f each resource is made.
I he selection of representative or typical items is also difficult. This is because o f wide
variation constructional methods and materials than can be used. Other problems include the
quantity of data needed to be collected in order to provide some statistical reliability. The
profit and overheads can be function of market conditions and it would be difficult to devise a
iclinblc quantitative measure for this variable.
It is impoitant to icali/c that factor cost index is actually measuring the change in the cost o f
ic s o i i u es to contractor for a typical building, thus it has little or no account of the tendering
market. It also docs not directly measure the change in the price the client must pay, and
although the “maiket conditions” allowance attempts to rectify this situation, the source may
not be reliable, further factor cost index does not measure the change in cost of a specific
building under consideration by a quantity surveyor. It is unlikely that the “typical building”
will have the same mix of resources as the clients’ project; however, on many occasions the
dd lei cnee will not he cost significant.
D espile these drawbacks, the factor cost index is very suitable for identifying treads in
resources and relationships. It was particularly useful for evaluating cost fluctuations in
contracts which allowed lor reimbursement of any changes in cost to the contractor that
neemted during the contract period, as was common practice at times of high inflation.
I lie l ender-Based Index: I his type of index is based on what the client is prepared to pay for
the building. It takes as its source o f information (he tender document itself i.e. the bills o f
quantities. This should record what is happening in the market place and therefore should be
33

Hindi mure useful in updating prices for a design budget. It may or may not include
lluctuations in price, depending on the terms of the contract.
A tcndci-based index can he obtained by pricing and re-pricing a bill of quantities at various
required intervals. To obtain a more accurate index, data should be repriced repeatedly. The
larger the sample size, the greater is the reliance that can be placed on the results.
I nun a client’s quantity surveyors view, a tender-based index has certain advantages compared
to the factor cost index (Morion and Jaggar 1995). These include: -
• It measures the change in the cost to the client of a particular project over time, taking full
account of market conditions in addition to the change in cost to the contractor.
• It is relatively simple to operate once a base schedule o f prices has been obtained.
• It allows comparison of the price obtained by tender for a specific project with the national
or regional building price trend.
• It allows the relationship between the market for building o f different functions and locality
to be plotted.
• It is not based on other indices and therefore any interest inaccuracies are not compounded.
With all these advantages it also lias some problems compared to the factor cost index as
lollows:-
• A large number of projects are required for each index due to variability of price rates in
Kills of Quantities. At least 50 projects are required for a suitable sample (Morton and
Jaggai 1995).
• I Ih index relies heavily on the base year schedule, which will have to be regularly revised
to lake into account new products and new methods of measurement. This is a time-
consuming and costly task.
• Lack of suitable projects at any one time. This makes evaluation of the projects difficult
thus reducing reliability of the index.
pi ices the movement of the tender-based index is much more erratic.
34
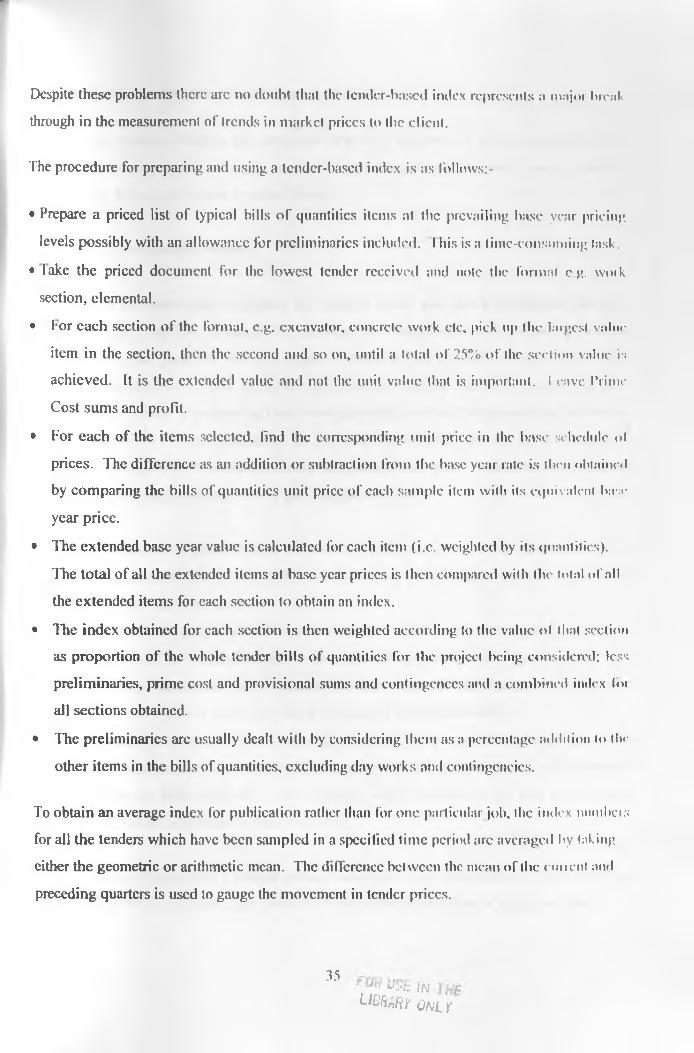
Despite these problems there arc no doubt that the tender-based index represents a major break
through in the measurement of trends in market prices to the client.
The procedure for preparing and using a tender-based index is as follows:-
• Prepare a priced list of typical bills o f quantities items at the prevailing base year pricing
levels possibly with an allowance for preliminaries included. I his is a time-consuming task.
• lake the priced document for the lowest tender received and note the format e g. woik
section, elemental.
• l or each section o f the format, c.g. excavator, concrete work cte. pick up the largest value
item in the section, then the second and so on, until a total of 25% of the section value is
achieved. It is the extended value and not the unit value that is important. I cave Prime
Cost sums and profit.
• For each of the items selected, find the corresponding unit price in the base schedule ol
prices. The difference as an addition or subtraction from the base year rate is then obtained
by comparing the bills of quantities unit price of each sample item with its equivalent base
year price.
• The extended base year value is calculated for each item (i.c. weighted by its quantities).
The total of all the extended items at base year prices is then compared with the total of nil
the extended items for each section to obtain an index.
• The index obtained for each section is then weighted according to the value ol that section
as proportion o f the whole tender bills of quantities for the project being considered; less
preliminaries, prime cost and provisional sums and contingcnccs and a combined index loi
all sections obtained.
• The preliminaries are usually dealt with by considering them as a percentage addition to the
other items in the bills of quantities, excluding day works and contingencies.
To obtain an average index for publication rather than for 011c particular job, the index numbers
for all the tenders which have been sampled in a specified time period arc averaged by Inking
either the geometric or arithmetic mean. The difference between the mean of the current and
preceding quarters is used to gauge the movement in tender prices.
35' f 1 v.'tz wl i b r a r y o n l y

2.10 Other Factors Affecting Cost Estimate of Project
Factors that directly influence the estimated cost of a project can lead to unrealistic cost
estimates before construction actually starts. They can be gathered into two groups cslimatoi
specific, and design and project-specific factors.
2.10.1 Estimator-Specific Factors
Most of the estimator-specific factors, like clerical errors and wrong production rates, arc
controllable and can be managed by checking the calculations and providing relevant
information to the estimator. However, less controllable factors related l<> an estimator still
exist at the project level. Those factors arc composed of estimator biases. Estimator, like other
people, can be biased in performing their work depending on their background and incentives.
Even though some o f these biases can be controlled by changing the incentive system, one
cannot completely control estimators’ biases on a project with project management tools in the
same way one manages productivity in the field (figure 2.3).
Estim ator's Biases: In general people are biased in performing their work depending on their
background and incentives. Capen (1976) has made three observations about the behaviors of
technical people under uncertainty:
■ A large number o f people have little idea of what to do in uncertain situations.
■ A large number of technical people overestimate the precision of their knowledge. As a
result, he has concluded that, in general, people with technical backgrounds are over
confident when putting ranges on their knowledge in uncertain situations.
• Motivational and cognitive biases are major causes of this overconfidence in people (Smith
1991). Motivational bias occurs when people feel that they arc going to be rewarded
depending on their prediction. For example, when estimators feel that their towards
depend on their confidence in their estimates.
Cognitive bias occurs when a thought process causes incorrect assessments of uncertainty and
risk. Smith (1991) and Birnie and Yates (1991) describe several types o f cognitive biases
36

Adjustment and anchoring bias occurs when a person starts Irom some initial estimate and
then adjusts that estimate until it seems reasonable. Construction cost estimation
techniques create a suitable environment for this bias. Estimators choose a production rate
that they think is representative o f a particular kind of task, and then they adjust it
according to certain project-specific conditions. This results in too much emphasis on the
initial number. A better thought process would be to start from a range of production rates
that cover most o f the possibilities and then choose the most likely rate accordingly.
Representative bias occurs when people concentrate just on recent projects in assessing the
risks of an upcoming project. In identifying risk factors and assessing risk, the most casih
remembered factors arc those that occurred recently. The extent of this similarity becomes
a dominant factor in the cost estimate, and all other available data such as di I lei cnees in
quantity, location, or market conditions tend to be overlooked.
Availability bias occurs because of the limited memory capacity of people. Previous bad
construction experiences of estimators make them estimate the cost o f certain items
conservatively. For example, previous experience with a material shortage can lead to
higher estimate for that material cost.
Clairvoyance (risk definition) bias occurs when people have an incomplete definition ol
uncertainties. They tend to include only risks that are within the responsibility of the
project team, like labour availability, subcontractor performance, etc., and exclude risks (hi
which the project team is not responsible, such as changes in scope. To overcome this bias,
uncertainty and risk should be defined clearly. In formal decision analysis methodologies, a
clairvoyance test, which requires that a variable be defined so clearly that an answer about
it would be unambiguous, is used to prevent the presence o f clairvoyance bias.
Estimators, like many people, have motivational and cognitive biases, and these biases can
lead to distorted and inaccurate cost estimates.
37

r x Estimator specific factors
Design and project specific factors
Construction specific factors
v t JX_______£____________> l—„---- J
/ ( ’ost overrun due to \Uncontrollable factors \
Econ & political environment anorifre. factor's
JL . *Cost
Estimate
* ______ *Tender Price
Contractor's cost overburden due to uncontrollable factors
T ~ ►
Notes: Contract specific factors
Estimator Specific factors consist o f motivational and cognitive biases
Design and project specific factors consist of project size vagueness scope, and design complexity
this is a function of constructability of the design, utilization of advanced technology, specialized
equipment and methods, and the integration of multiple disciplines.
Construction specific factors consist of unknown geological conditions, weather conditions, client
generated and subcontractor generated risk factors.
Economic and political environment specific factors consist of economic and political risk
factors
Contract specific factors consist of contract type and legal context of a contract.
Figure 2 3 Uncontrollable Factors Affecting Contractor’s Risk of ( ’ost O v e rb u rd e n
Source: Pack, J. H. (1994)
2.10.2 Design and Project - Specific Factors
Another group o f factors that affect the cost estimate o f a project arc design and projet
specific factors, which include vagueness in scope, design complexity, and project size.

Vagueness in Scope: Project scope describes the work to be performed; hence a cost estimate
heavily depends on this scope definition. In fact, lack of proper scope definition has been
stated to be a major source of bad estimates (Cowie (19X7). Vagueness in scope has two
implications for cost control:
• It decreases the accuracy of cost estimates; and
• It creates a potential for changes in scope during the construction stage, whit h generally
results in a increase in cost to both owners and contractors.
The accuracy of a cost estimate is highly dependent on the level of detail in the scope
definition. A cost estimate based on a detailed design should be more accurate than one
without any design information. Peurifoy and Obcrlcndcr (19X9) have divided the aeeura* \
o f an estimate into three levels depending on the preciseness of scope definition
• A conceptual cost estimate prepared from a project scope definition that d o e . not include
design information is usually accurate within +40 and 10% of the actual cost
• A cost estimate prepared upon completion of the preliminary design is usually n eo n a te
within +25 and — 5% of the actual cost.
• A detailed cost estimate prepared upon completion of the final design is expected to In
accurate within +10 and -3% of the actual cost.
The figures given above show that conceptual cost estimates suffer most from vagueness in
scope. Construction faces three major risks in conceptual estimating (Pack (1904) f irst, ii k
is involved in the pricing of materials to be furnished. Material information is often not
available early on, and the materials that quantity surveyor thinks might work during tin-
bidding process are sometimes very different from the materials included in the final design
Secondly, there are schedule and time risks. As the scope of a project is continuously
emerging, the duration of the project is hard to estimate. I bis mainly affects the estimation of
overhead costs. Moreover, liquidated damages clauses for late completion in a project put
additional risk on the contractor during the conceptual cost-estimating stage, f inally. (Pack
1994) also mentions the presence of risk in subcontracting in conceptual cost estimates. In Ibis
stage, there arc fewer competitive subcontractor quotes than at bidding time, since mo t
subcontractors do not want to give a firm lump sum price or take ihe risk of quantity overruns
39

Hetland (1994) mentions vagueness in scope as one of the major factors that resulted in cost
overruns. Vagueness in scope on these projects also increased the resource consumption during
construction. This alone resulted in a 29% cost overrun. In addition to this adverse effect on
the accuracy of cost estimates, lack of proper scope definition creates a potential for change or
growth in scope during construction. Changes in scope result in the addition o f new activities
that will increase the actual cost o f a project. Cowic (19X7) has observed that the majority of
cost growth during the construction period derives from scope growth. Another problem with
changes in scope is that additional work scope, which will have to be added later, is generally
required to be carried out without extending the original contract delivery date. Increase in
scope can only be executed by increasing the resource intensity over and above the planned
level. This often leads to increased unit cost and hence increased total cost of a project
(Hetland (1994)].
Design Complexity: Design complexity is a function of the constructability of the design, the
use of advanced technology, specialized equipment and specialized methods, and the
integration o f multiple disciplines (Rusteika and Boomer 1992). The risk involved in the use ol
advanced technology and specialized methods depends largely on the newness of the
technology and its performance history in stimulate and actual use (Napier and ( hang 1(>X8)
Hie contractor who has prior experience with the use o f specialized method oi advanced
technology faces less risk. On the other hand, if that method or technology represents a I list
of-a-kind use, the contractor will bear more risk due to increased uncertainties.
In general, in complex design, an estimator will have a harder time visualizing the construction
process and hence will not be able to estimate the quantities, production rates, and unit costs
related to that project accurately. This will lead to a cost figure that is obtained as a result nl
guesswork rather than a systematic estimating approach.
Project Size: Past empirical studies have shown that project si/c also influence cost overrun
rates (Jahren and Ashe 1990); Skitmorc 1988); (Randolph ct al. 1987; Rowland 1981)
However, there are two contradictory conclusions on how project size effects cost overrun
rates in construction. Randolph ct al, conclude that cost-overrun rates decrease as contract size
increases (1987). On the other hand, Rowland concludes that cost overrun rates increase as
40

contract size increases (1987). An explanation of Randolph's result is that as the stakes are
higher on larger projects, more care is exercised during the bidding and planning stages.
However, at the same time large projects arc generally more complex and this leads to an
increase in cost overruns as found by Rowland (1981).
Recently, Jahren and Ashe (1990) investigations revealed that cost overrun rates <>l 1-11% are
more likely to occur on larger projects than smaller ones. I lovvever. cost overruns greater than
11% mostly occur on smaller projects. An explanation for this result is that projects become
more complex as they become larger which leads to the occurrence of larger cost overruns. At
the same time, however, special care is given to large projects by managers. I his 's ill prevent
the cost overruns from becoming excessively larger. As a result, it is hard to tell how project
size affects the risk for cost overruns.
2.103 Conceptual Estimates as Dependent Variables
Conceptual estimates are critical inputs for owners’ decision making in the caily planning,
stages of a construction project. Owners or clients have to make planning decisions based on
cost figures that are estimated under a high level o f uncertainty about the project's future. An
assessment o f the expected quality of this input is as important as knowing the expected cost of
a new project. This can be considered as a way of measuring thr cost risk of the project.
To the decision-maker or owner, quality means the expected accuracy and reliability <>l the
estimate figure.
Figure 2.4 shows a model of the conceptual estimating problem, where the estimator has to
determine an approximate cost to accomplish the new project based only on a sei of predictors
about what the project would be when finished. The quality and quantity of these predictors
will impact on the capability of the estimator to estimate the future project cost accurately.
Conceptual estimating requires extensive knowledge and expertise (Shen ct al. 2001) and
requires extensive use of judgement to produce a meaningful result (Rush and Roy ’()()!).
41

CLUES
Real project Estimating System
Accuracy of Estimate
f igure 2.4 Estimate’s Accuracy Problem
StuiKv; Adopted from lloarth It. M (1980)
( o iii eptual ( ost Estimating Accuracy and Reliability
Accra acy can be deliiied as nearness to the truth (Kebntn 1978). Something is accurate if it is
exact aiul free of errors and mistakes. In the case o f construction conceptual estimates,
accuracy reflects the closeness of estimate to the actual reference cost of a project. The
difference between the estimate and reference values is the estimating error. For an owner, this
reference cost is normally the lowest bid received for a project. Accuracy can be defined as the
percentage difference between the estimated values o f the product or work when compared
with the price for which the product or work is contracted (True 1988).
42

Reliability is a very general concept that is applied to several different domains. I lie concept
is more common in fields such as materials and structural engineering, equipment pcrformaiu e
and test measurement, where precise experimental and actual data are easy to obtain
(O’Connor 1985). The application of this concept to ‘softer’ areas has been much more limited
because o f the difficulty to obtain data. According to Babbie (1983), reliability is a matter nl
whether a particular technique, applied repeatedly to the same object, would yield the same
result each time. Nachmias and Nachmias (1987) defined it as the extent to which a measuring
instrument contains variable errors; errors that differed from observation to observation during
any measuring instance. According to Evans and Lindsay (2002). the reliability of a
measurement refers to knowing how well the measuring instrument consistently measures the
true value o( the characteristic. Rebat (1978) gives a definition of reliability as the degree <>l
variance shown by a statistic in repeated sampling, adding that reliability is also a measure ■ >!
the degree o f consistency with experience.
As described by Ahuja et al (1994). the success or failure of a project is in great pail
dependent on the accuracy of several estimates. Unfortunately, in many eases, estimates are
used as deterministic figures and too much confidence is assigned to them (<)'< onnoi 1985)
The expected accuracy range and its associated reliability enable the dccision-makei to analyze
different possible scenarios according to different cost figures. This information helps
planners establish contingency level on a sounder basis and manage uncertain!) better. In
addition, it assists management in predicting the cash flow for the life of a project more
realistically and develops confidence in the estimating function ((’lark and I oren/oni 1985)
2.11 Summary
Any method of preliminary cost estimation of construction projects should be as accurate as
possible so as to ensure the reliability and the usefulness of the data obtained from these
estimates. Most estimates usually vary to a certain extent with the contractor, bid pric es
showing that there is a margin of error in the quantity surveyors estimates. I he difference
between an early price estimate and the accepted tender from a contractor represents an
inaccuracy.

This review has established that the factors that have some influence on the accuracy ol
estimating the costs o f the construction work include:-
• The effects o f differing availability of design information.
• The amount, type and quality of cost data that is easily accessible.
• The type of project some types o f schemes can be estimated with a greater degree ol
consistency.
• Project size in terms of value, flic accuracy tends to improve by a small amount as
projects increase in size
• The number o f bidders on competitive projects
• The stability o f market conditions
• Personal factors like familiarity with a particular type of project a client lias been
associated with a substantial improvement in forecasting accuracy.
• Proficiency in estimating is said to be a result o f skills, experiences, judgement,
knowledge, intuition, academia background and enthusiasm
44
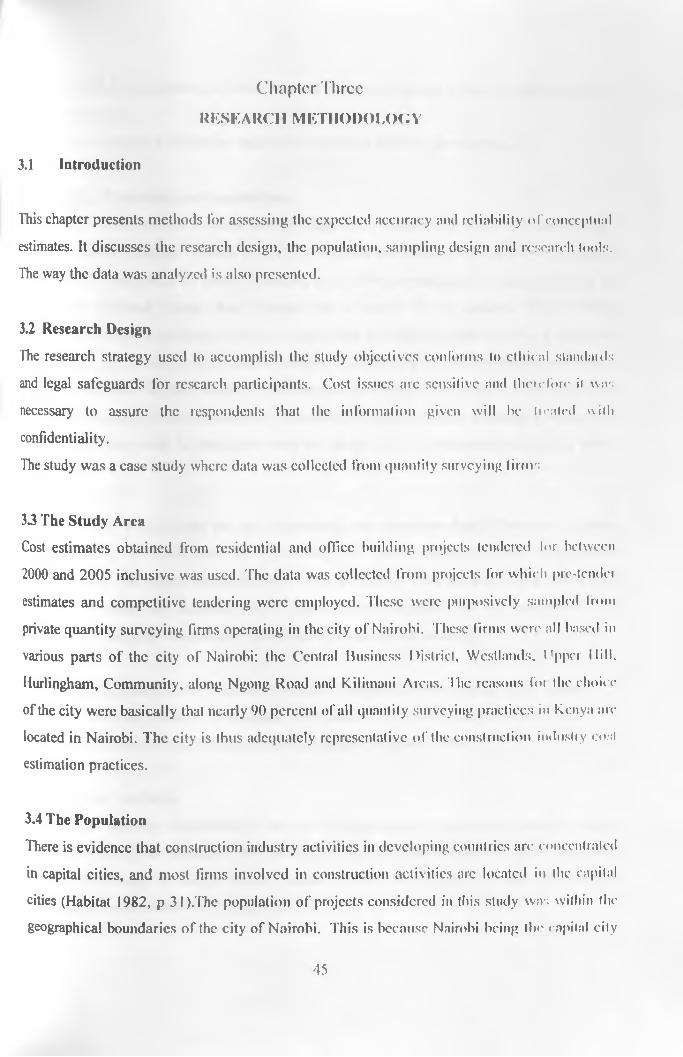
Chapter Three
RESEARCH METHODOLOGY
3.1 Introduction
This chapter presents methods for assessing the expected accuracy and reliability ofconccptual
estimates. It discusses the research design, the population, sampling design and research tools.
The way the data was analyzed is also presented.
3.2 Research Design
The research strategy used to accomplish the study objectives conforms to ethical standauls
and legal safeguards for research participants. Cost issues arc sensitive and therefore ii was
necessary to assure the respondents that the information given will he heated with
confidentiality.
The study was a case study where data was collected from quantity surveying firms
33 The Study Area
Cost estimates obtained from residential and office building projects tendered lor between
2000 and 2005 inclusive was used. The data was collected from projects for which pre-tender
estimates and competitive tendering were employed. 'These were purposivcly sampled from
private quantity surveying firms operating in the city of Nairobi. These firms were all based in
various parts of the city of Nairobi: the Central Business District, Wcstlands. tipper Hill.
Hurlingham, Community, along Ngong Road and Kilimani Areas. The reasons foi the choice
of the city were basically that nearly 90 percent of all quantity surveying practices in Kenya arc
located in Nairobi. The city is thus adequately representative o f the construction industry cost
estimation practices.
3.4 The Population
There is evidence that construction industry activities in developing countries are concentrated
in capital cities, and most firms involved in construction activities arc located in the capital
cities (Habitat 1982, p 31).The population o f projects considered in this study was within the
geographical boundaries of the city of Nairobi. This is because Nairobi being the capital city
45

of Kenya, and in comparison to other parts o f Kenya, it has the highest number of active
construction sites.
The focus of the study is on private residential and office building developments.
3.5 Sampling Technique and Sample Size
Researches on construction projects have in many eases worked with relatively small sample
sizes for various reasons. Nkado (1992) investigated information system lor the building
industry with a sample of 29 cases; Ogunlana, ct al (1996) investigated the causes of delay in
projects in Thailand basing their research on a sample of 12 projects. I Ihcr (1996).
investigated the cost estimating practices in Australian construction industry using, a sample ol
10 projects. This researcher has used a sample of 68 projects which is therefore well above
what has been used in other studies in the construction industry elsewhere. I he sample size
determined the type o f statistics applied. Therefore, by using a suitable statistical tool, some <>l
the problems that could he associated with the sample si/e are minimised (Gull ct al 1990;
Lapin 1982).
Gall et al (1996) argue that the non responding data represents bias if they arc in some
measurable way different from the responding one. Such differences could normally he
associated with the project characteristics of size and client. This has not been the ease with
this study because the different project characteristics identified will he represented. The
sample o f 68 projects comprised o f residential types and office buildings.
Given also the constraints of time and resources, a sample size of 68 projects from quantity
surveying firms was found to he adequate for the study. This was in order to he above the
recommended minimum of 30 members (Mugenda and Mugcnda 1999)
3.6 Research Variables
Most of the variables were identified through literature review specifically variables relating
factors that affect cost estimates. ITic variables arc grouped into a number of broad categories
to ensure easy analysis. The groupings consider variable relationships with each other as well
as similarity in characteristics (Appendix A).
46
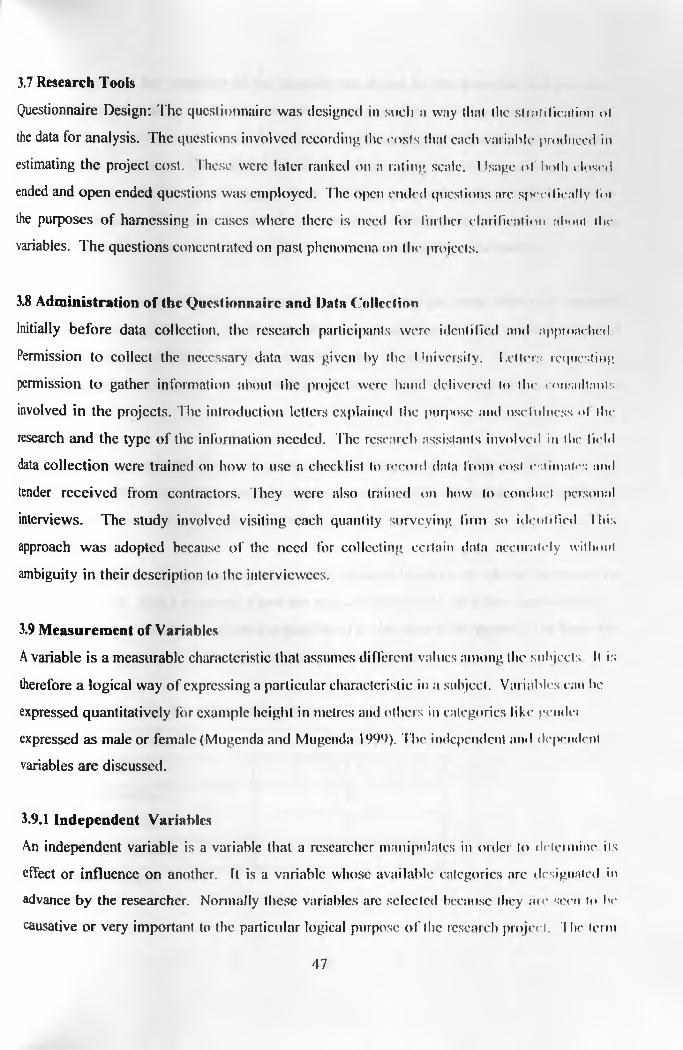
3.7 Research Tools
Questionnaire Design: The questionnaire was designed in such a way that the si rat ideation o f
the data for analysis. The questions involved recording the costs that each variable produced in
estimating the project cost. These were later ranked on a rating scale. 1 Jsage o f both dosed
ended and open ended questions was employed. The open ended questions arc specifically foi
the purposes of harnessing in cases where there is need for further clarification about the
variables. The questions concentrated on past phenomena on the projects.
3.8 Administration of the Questionnaire and Data Collection
Initially before data collection, the research participants were identified and approached.
Permission to collect the necessary data was given by the 1 Inivcrsity. fetters requesting
permission to gather information about the project were hand deliverer! to ihe consultants
involved in the projects. The introduction letters explained the purpose and use fulness <d the
research and the type of the information needed. The research assistants involved in the field
data collection were trained on how to use a checklist to reeoid data from cost estimates and
tender received from contractors. They were also trained on how to conduct personal
interviews. The study involved visiting each quantity surveying firm s<> identilied This
approach was adopted because o f the need for collecting certain data accurately without
ambiguity in their description to the interviewees.
3.9 Measurement of Variables
A variable is a measurable characteristic that assumes different values among the subjects It is
therefore a logical way o f expressing a particular characteristic in a subject. Variables can be
expressed quantitatively for example height in metres and others in categories like gendn
expressed as male or female (Mugenda and Mugcnda 1999). The independent and dependent
variables are discussed.
3.9.1 Independent Variables
An independent variable is a variable that a researcher manipulates in order to determine its
effect or influence on another. It is a variable whose available categories arc designated in
advance by the researcher. Normally these variables arc selected because they me seen to be
causative or very important to the particular logical purpose o f the research project. The term
47

independent means the categories of the variables arc chosen by the researcher independently
in the measurement taken in Ihc project and normally prior to it. In this study the level <>l
accuracy of cost estimates evidenced through the functions o f project statistics was viewed as
the independent variable. The project statistics included project seope/si/c, consti action time,
cost estimating methods, project organization, building type and professionals involved in
giving the estimate. The measurement o f the components o f these independent variables was
done in an ordinal scale as can be derived from the descriptive nature of the study.
An ordinal scale groups subjects into categories and ranks them into some order with numerals
reflecting increasing amount of the characteristics hut not at intervals. I hc numerals arc used
to represent relative position or order among the values of the variable. However. the orda
indicated in an ordinal scale does not imply a quantitative diction (Mugenda ami Mugcmla
1999)
Thus, based on the responses from the questionnaire, a scoring system for each of the
components of the independent variables was developed to indicate its performance in that
aspect as shown in Tables 3.1,3.2, 3.3, 3.4 and 3.5.
Project Scope/Size: The project scope/sizc can be measured in terms of value o f the project <>i
construction area. It is a measure o f how the project is perceived to he either small or large.
This independent variable was given a scaling based on the value of the project. I he larger the
project the more complex it is to give an accurate cost estimate.
fable 3.1: Scoring for Project Scopc/Sizc
Project Value Kshs. Score
0 - 5 0 million 1
5 0 -1 0 0 million 2
100-200 million 3
200 - 500 million 4
Source : Author
48

Construction Time: The construction time or Contract period is the time a building
contractor gives for completing the project at the time of tendering. It is normally given in
days, weeks or months ( l ahlc 3.2). This independent variable was a given scaling based on the
contract period. The more the construction time, the higher the risks and hence inaccuracies ol
the cost.
Fable 3.2 Scoring for Construction Time
Contract Period (Weeks) Score
9 - 1 2 1
1 2 -1 5 2
1 5 -1 8 3
(N1O
C 4
24 and over 5
Source : Author
Cost Estimate M ethod Used: This independent variable was given a sealing based on the
design information available (Table 3.3).
Table 3.3 Scoring fo r cost estimate method used
Method Used Maximum Score
Pricing complete bills of quantities 1
Pricing approximate bills of quantities 2
Elemental cost analysis 3
Square meter rate 4
Source: Author
Project Organization: Project organization refers to the procurement method used for managing
the project. This independent variable was given scaling based on risks of price increase to a
client during construction stage, flic design and build procurement method is more accurate in
firming up a tender figure as the contractor assumes most of the risks associated in per forming
the contract. The other procurement methods were ranked in the order that they arc likely to
bring variability in the final construction cost to a project. (Table 3.4)
49
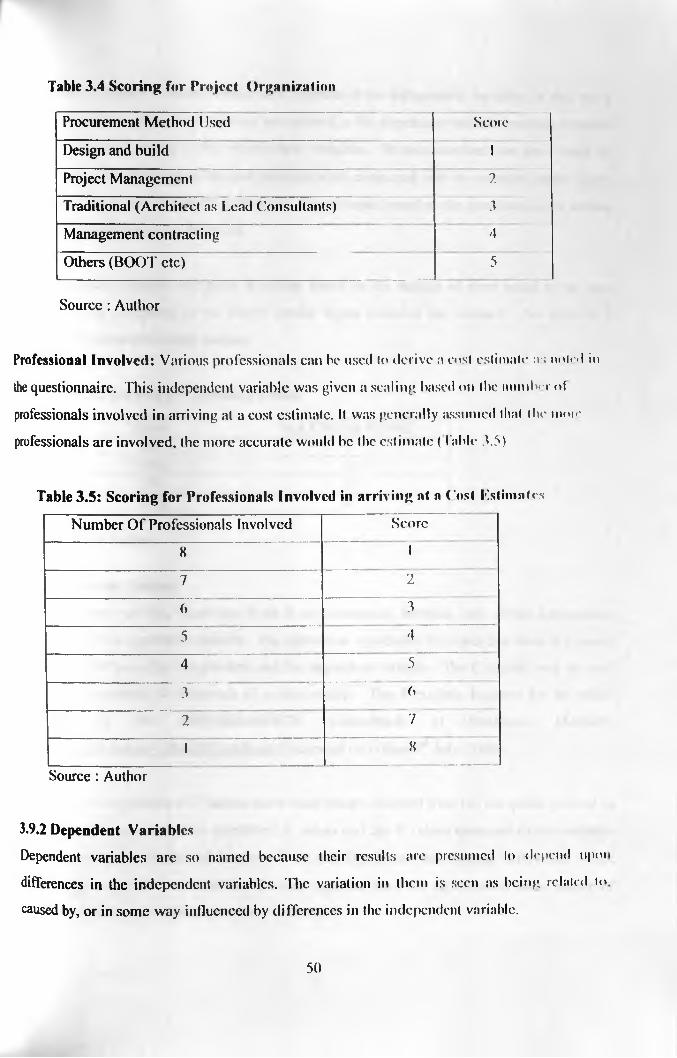
Table 3.4 Scoring for Project Organization
Procurement Method Used Score
Design and build 1
Project Management 2
Traditional (Architect as Lead Consultants) 3
Management contracting 4
Others (BOOT etc) 5
Source: Author
Professional Involved: Various professionals can he used lo derive a cost estimate a•; noted in
the questionnaire. This independent variable was given a scaling based on the numlvr ol
professionals involved in arriving at a cost estimate. It was generally assumed that the moie
professionals are involved, the more accurate would he the estimate ( Table 3.5)
Table 3.5: Scoring for Professionals Involved in arriving at a Cost estimates
Number O f Professionals Involved Score
8 1
7 2
6 3
5 4
4 5
3 (>
2 7
1 8
Source : Author
3.9.2 Dependent Variables
Dependent variables are so named because their results are presumed lo depend upoi
differences in the independent variables. The variation in them is seen as being related i<»
caused by, or in some way influenced by differences in the independent variable.
50

A dependent variable therefore varies as a function o f Ihc independent variable. In this study
the level of accuracy o f a cost estimate was viewed as the dependent variable because it should
vary in some relationship to the independent variables. Its measurement was also based on
ordinal scale. The accuracy of the cost estimate when compared with the awarded tender figure
was ranked on a scale o f one (1) to four (4). For example based on the questionnaire a scoring
basis was established as in Tabic 3.6.
This dependent variable was given a scaling based on the margin of error noted in the cost
estimate when compared to the lowest tender figure awarded the contract. An error of 5
percent was given the lowest number.
Table 3.6 Scoring for Accuracy Levels
• Error MAXIMUM SCORE5% 110% 220% 360% 4
Source : Author
3.10 Hypothesis Testing
The null hypothesis Ho, states that there is no relationship between each of the independent
variables and the dependent variable. The alternative hypothesis IIa states that there is a casual
relationship between the independent and the dependent variable. The 1; statistic was be used
to test the existence or otherwise of a relationship. The F statistic is given bv the tables
provided by the NIST/SEMATECH e-Handbook of Statistical Mcthods-
http://www.itl.nist.gov./div898/handbook (Accessed on Friday X,h July, 2005)
rhere was a comparison of F values made from values obtained from the computer printout in
the regression models that is: calculated F values and the F values tabulated in the statistics
table at appropriate degrees of freedom. If the null hypothesis was rejected in this case where
the F value calculated exceeded the F value expected from the tables at the same degree of
freedom; then the alternative hypothesis is accepted.
51
1 ioiu NIS I'/SliMA ITCH table (Available at liltp://wvvw.itl.nist.gov/div898/handbook
Accessed on Friday 8th July, 2005) the null hypothesis was rejected for the cost estimate.
Some icast)ns why a I statistic test might tail to uncover statistical significance even if the
independent variable is actually related to the independent variables are: inadequate sample
size, ty |>e I I error, specification error and restricted variance in X. Another possibility is high
multi co-linearity, but this is ruled out in these results because the contingency table of
correlation coefficient showed that none of the variables in the final model had a high
correlation to each other. With a larger sample, a given coefficient is more likely to be found
significant. In very large samples o f over 1,000, the statistical significance may actually be
“too easy” to find since tiny coefficient can be statistically significant. In studies where the
samples size is limited as a result of difficulties in obtaining case studies (Nyagah, 1989: p.
1-15-Mo), the size of the sample could make the results not significant at the prescribed
confidence internal.
\\ lien- the null hypothesis would have been accepted as a result ot type II error this would
have implied that the null hypothesis is accepted while in fact it is false. In a case where the
sample size is fixed the problem of choosing a significance level becomes important. The
significance test in principle can be set at any level between 0 and 1. Most social scientists set
.u o.o.S or 0.01. One of the convenient levels is usually selected at the beginning of a study.
< )ue might select a level ol 0.025 prior to the investigation only to find that the significance at
0 05 i less demanding. In this case one may prefer to accept the results at the lower test.
What this explains is that the significance at a lower test level may be evident which at a higher
test lev cl is not. What this explains is that the significance at a lower test.
3.11 M eth o d s o f Data Analysis
I lie variables selected for the prediction of the cost estimates are those that could be easily,
inex|H nsively and conveniently be defined and measured at the pre-design (or sketch design)
•>iage ol the building development process. The analysis of the data was done using a
computer package - Statistical Programme for Social Sciences (SPSS) for windows - and
involved the following procedures: - descriptive Statistics (mean, mode, medium, skewness,
kurlosis, maximum & minimum correlations and regressions.
52

I
Regression analysis was used for data analysis. Descriptive statistics have been used to
explain the various outcomes and relationships. To achieve this, the responses in the
questionnaire were assigned numerical values a process refereed to as coding) for ease of
analysis. This was facilitated with the items in the questionnaire being mainly close ended.
Inferential statistics (using SPSS Software) has been applied to assist in testing of hypothesis.
I he testing of hypothesis followed regression and correlation analysis between two major
variable sin the study namely the accuracy of cost estimate and the building type. The
inferential statistics is applied to help in generalization o f the findings. The hypothesis is
tested at *>5% confidence level.
53

Chapter Four
DATA ANALYSIS AND PRESENTATION
1.0 Introduction
in this chapter data that was collected from quantity surveying firms is analyzed. Tables and
description derived from the data is used to explain the findings from the survey. The hypothesis
that cost estimates do not accurately project pre-design stage cost used as a guide for investment
decision making process is also tested. Out of the 68 targeted projects, each with a questionnaire
incspcciive of the quantity surveying firm involved, only 46 were returned, representing 68
|k*icent. 1 he researcher considered 46 projects provided reasonable and sufficient response rate
tin proceeding with the data analysis. The firms were visited several times before they could fill
the quest ionnaire due to the involving task o f filling the detailed elemental analysis of costs. The
pood responsiveness was mainly due to the fact that the firms purposively selected had data from
picviows projects. Willi a few quick telephone calls the respondents agreed to give the
information to the research assistants. Responses were received from the 27 participating
quantity surveying firms is shown in Tables 4.1 — 4.3. The breakdown o f the 46 projects
analyzed is also as shown. Only one bungalow type project was received the reasons being that
most lums have not handled any project o f this nature for the last five years.
I aide *1. l — f r e q u e n c y o f R es id en tia l B u ild in g s
t ypes of Residential Buildings No. Percentage
l.l 1 ow Rise f lats 13 54
1.2 Maisonnettes 10 42
1.3 Bungalows 1 4
lOTAL 24 100
Source : Author
I able -1.2 — frequency of Office Buildings
fypesof Office Buildings No. Percentage
2.1 Low rise office blocks 12 552 7 High rise office block (with lift) 10 45
IO IA L ___ 22 100Source : Author
54

I able 4. t Summary Of Frequency Of All Building Types
Type of Residential Buildings Frequency Percentage
l.l l ow rise flats 13 28
1.2 Maisonettes 10 22
1.3 Bungalows 1 2
1.4 l ow rise office block 12 26
1.5 High rise office block (with lift) 10 22
TOTAL 46 100
Source Author
1.1 A nalysis o f Im lc p e n d e iit V a ria b le s
I he analysis of the various components of the independent variables are discussed in this
section.
Types of C o n tra c t Used: The study sought to find out the most frequently used contracts
( fable 1.4). Most o f the project, 85 percent were awarded to contractors as lump sum fixed
price. It seems most of the consultants are comfortable with fixed price contracts where
contractors takes the risks for increases in prices of materials, labour and plant during the
construction period. Most of the contract periods are within one year (12 month construction
pci iod). Hence it fairly easy to predict price increases and take the risks. However, the study
did not investigate why lump sum fixed price are the most popular type of contracts,
fluctuating price contracts at 4 percent are only being used for larger projects with
ioiisiiuction period of over two years. The other types of contracts labour contracts and
contract management account tor 11 percent of the total project studied.
55
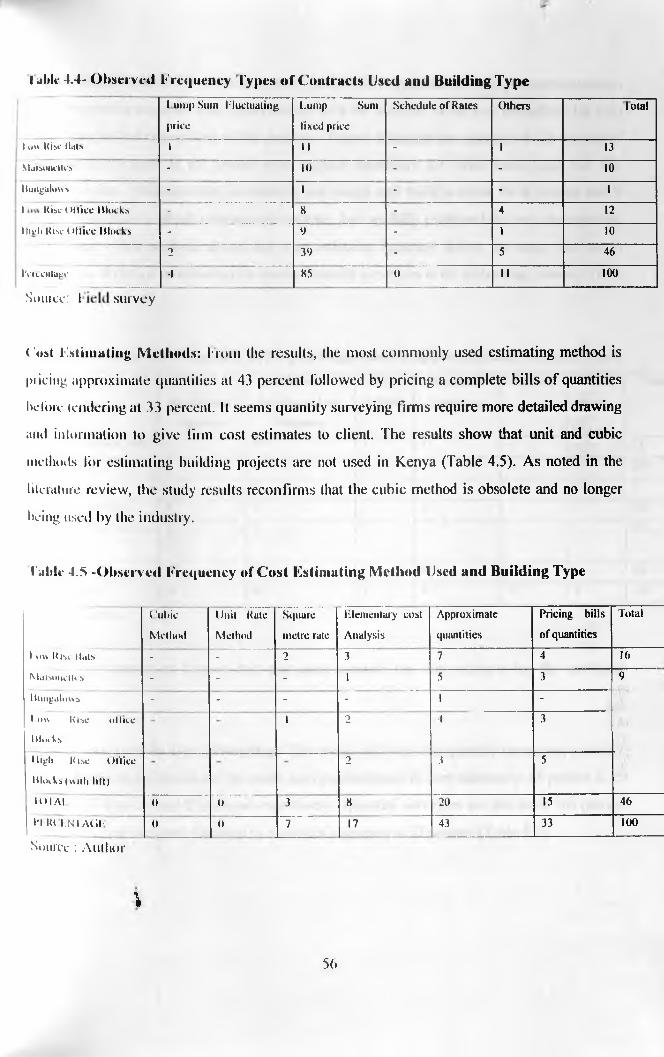
I al»lc 4.4- Observed frequency Types of Contracts Used and Building Typel ump Sum Fluctuating
priceLump Sum
fixed priceSchedule of Rates Others total
1 ow R ise l la ls 1 II - 1 13M aiso n e tte s - 10 - - 10Bungalow* - 1 - - 1
1 R ise nuke b l o c k s - 8 - 4 12
1 h e li R ise Office h l o i k s - 9 - 1 to2 39 - 5 46
IV ic c iila g c___________
4 85 0 11 too
Source: 1 survey
Cost Estimating Methods: f rom the results, the most commonly used estimating method is
pricing approximate quantities at 43 percent followed by pricing a complete bills of quantities
before tendering at 33 percent. It seems quantity surveying firms require more detailed drawing
and information to give firm cost estimates to client. The results show that unit and cubic
methods for estimating building projects are not used in Kenya (Table 4.5). As noted in the
literature review, the study results reconfirms that the cubic method is obsolete and no longer
being used by the industry.
Table 4.5 -Observed frequency of Cost Estimating Method Used and Building Type
( 'uhic Method
Unit Rate Method
Square metre rale
Elementary cost Analysis
Approximate
quantities
Pricing bills of quantities
Total
1 ow Rise Oats - - 2 3 7 4 16
Maisonettes - - - 1 5 3 9bungalows - - - - 1 -
1 ow Rise oUiec blot ks
1 2 4 3
High Rise Office blocks (with lilt)
2 3 5
IOIAI. 0 0 3 8 20 15 46
ITIU I.NI/Uil- 0 0 7 17 43 33 to o
Source: Author
\
56
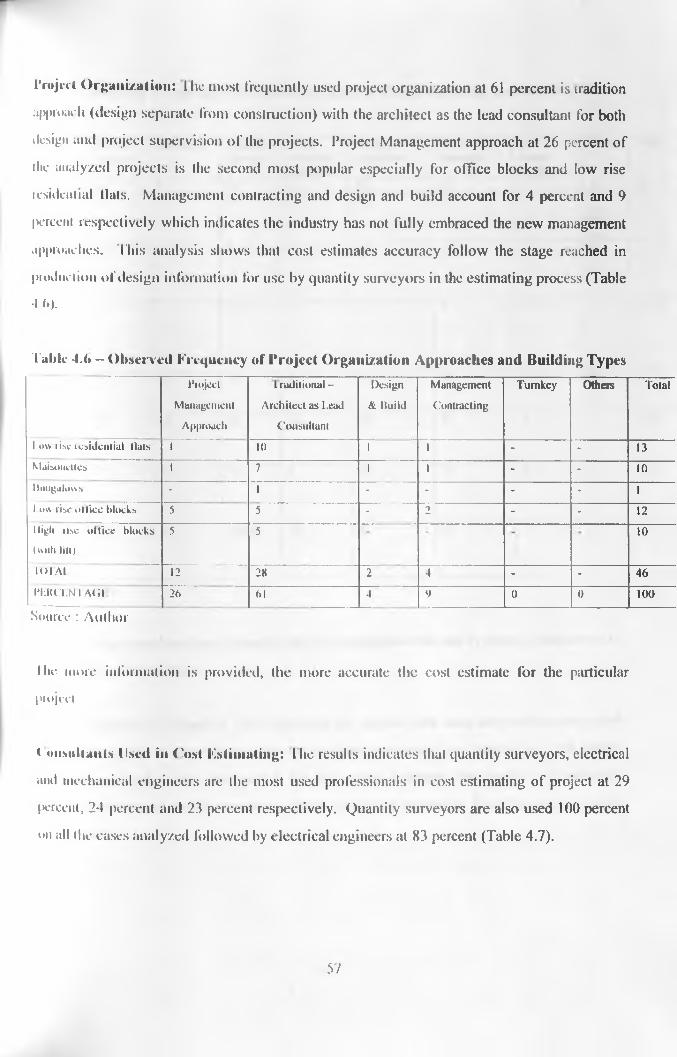
Project Organization: I lie most frequently used project organization at 61 percent is tradition
approach (design separate from construction) with the architect as the lead consultant for both
design and project supervision o f the projects. Project Management approach at 26 percent of
the analyzed projects is the second most popular especially for office blocks and low rise
residential Hats. Management contracting and design and build account for 4 percent and 9
percent respectively which indicates the industry has not fully embraced the new management
approaches. This analysis shows that cost estimates accuracy follow the stage reached in
production of design information for use by quantity surveyors in the estimating process (Table
• I f , ) .
T able 4.(> - Observed Frequency of Project Organization Approaches and Building TypesProject
ManagementApproach
t raditional -
Architect as Lead Consultant
Design &. lluild
ManagementContracting
Turnkey Others Total
1 ovv rise residential Hals 1 10 1 1 - - 13Maisonettes l 7 1 1 - - 10liungalovvs - 1 - - - - 11 ovv rise office Mocks 5 5 - 2 - - 12High iisc otlice blocks (with lilt>
5 5 10
101 At 12 28 2 4 - - 46IT.KCLNI ACil 26 61 4 9 0 0 too
Source : Author
I he more information is provided, the more accurate the cost estimate for the particular
piojcci
t oiiMiliauts Used in (lost Estimating: l he results indicates that quantity surveyors, electrical
and mechanical engineers are the most used professionals in cost estimating of project at 29
IH.-rcent, 24 percent and 23 percent respectively. Quantity surveyors are also used 100 percent
*»n all the eases analyzed followed by electrical engineers at 83 percent (Table 4.7).
57

Table 4.7 - Observed Frequency of Consultants used in Cost Estimating and Building Type
ProjectManager
Architects QuantitySurveyors
Civil/StructuralEngineers
ElectricalEngineers
MechanicalEngineers
LandScapeArchitects
Others Total
j Low rise Oats 2 5 13 5 12 11 3 1 521 Maisonettes 2 3 10 1 6 6 28
Bungalows 1 1 1 3
Low rise office Blocks
12 1 9 9 2 33
High rise office blocks (with lift)
1 6 10 6 10 10 1 34
TOTAL 5 14 46 13 38 37 6 1 160
Professionalusagei percentage)
3 9 29 8 24 23 4 1 100
Usage on 46 projects analyzed 'percentage)
11 30 100.00 28 83 80 13 2
Source: Author
Project Managers and architect normally provide information for use by other professionals in
the cost estimation function.
Other Independent Variables: The respondent felt that the plot areas and construction plinth
areas were covered in the project scope and size for purposes of cost estimating. The scarity
information provided was not useful for the study similarly the quality o f materials,
components and workmanship was not a factor in the cost estimating function, hence the data
was not used.
58

4.2 Analysis of Dependent Variables
I he sludy also set out to establish the extent of accuracy variability of the cost estimate and
lowest enders received for the projects studied (Table 4.8).
Accuracy of Cost Estimates: From the results of the accuracy analysis, the majority margin
error was 30 percent at the accuracy level of 5 - 1 percent. Projects with an accuracy level o f
0-5 percent were only 2 percent.
fable: 4.8 Observed Frequency of Accuracy of the Cost Estimate and Building Type: v,. '
PercentagePrior
It v
> III
Low RiseResidentialMats
Maisonettes Bungalow lx)w Rise Office
Mock
High Rise Office Block
Total Percentage
1>
- - - - 1 23 - J 6 14 34
10- 15 3 1 - 3 3 10 2215-20 3 3 - 5 1 13 2820 - 25 3 - 1 1 - 4 1125 - 30 - 2 - - - 2 4
30 - 35 1 1 - - - 2 4
35-40 - - - - - - 0
Over 40 - - - - - - 0
IOTAI.
(Percentage)13 10 1 12 10 46 100
Source : Aut
4.3 tyua
ior
utitativc Analysis
I his section presents the results of the quantitative analysis. Usage is made of Pearson’s
product moment correlations to assess multi-co-linearity in order to determine whether the
independent variables are highly correlated among themselves. The computed correlations on
all the variables in the model show that there is a minimum level of the problem of multi-co-
linearity. The method used for analysis is step-wise regression. The independent variables
undergo testing for their strength in predicting the dependent variables using the regression
coefficients.
59
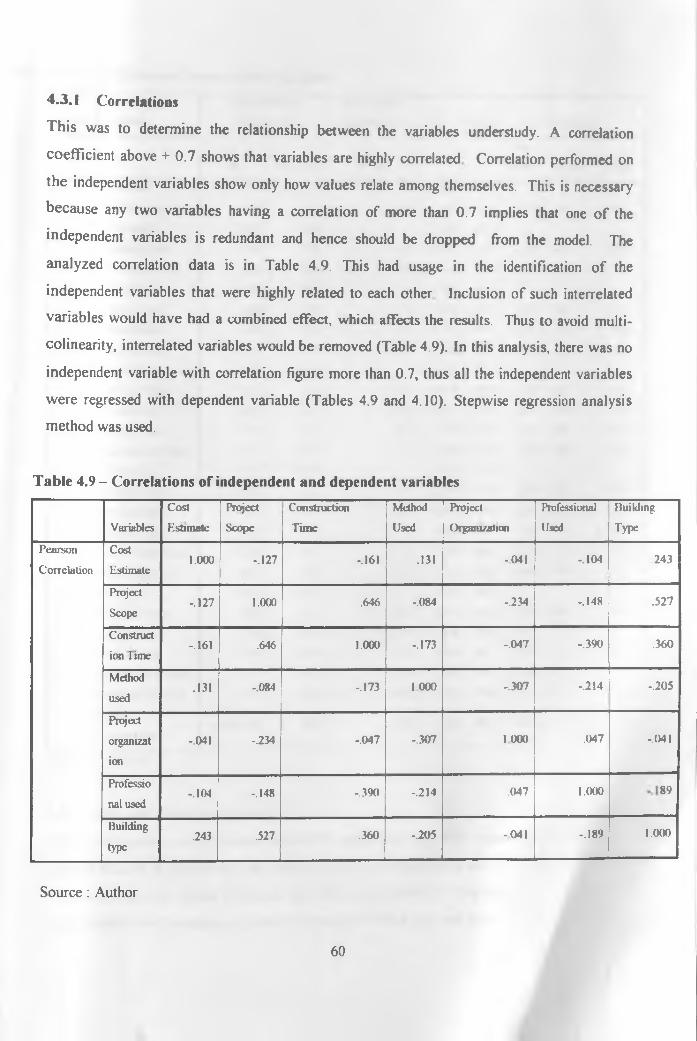
4.3.1 Correlations
This was to determine the relationship between the variables understudy. A correlation
coefficient above + 0.7 shows that variables are highly correlated Correlation performed on
the independent variables show only how values relate among themselves. This is necessary
because any two variables having a correlation of more than 0.7 implies that one o f the
independent variables is redundant and hence should be dropped from the model. The
analyzed correlation data is in Table 4.9. This had usage in the identification of the
independent variables that were highly related to each other Inclusion of such interrelated
variables would have had a combined effect, which affects the results. Thus to avoid multi
colinearity, interrelated variables would be removed (Table 4.9). In this analysis, there was no
independent variable with correlation figure more than 0.7, thus all the independent variables
were regressed with dependent variable (Tables 4.9 and 4.10). Stepwise regression analysis
method was used.
Table 4.9 - Correlations of independent and dependent variables
VariablesCostEstimate
ProjectScope
ConstructionTime
MethodUsed
ProjectOrganization
ProfessionalUsed
BuildingType
PearsonCorrelation
CostEstimate
1.000 -.127 -.161 .131 -041 -.104 243
ProjectScope
-.127 1.000 .646 -.084 -.234 _i 21 X .527
Construct ion l ime
-.161 .646 1.000 -.173 -.047 -.390 .360
Methodused
.131 -.084 -.173 1 000 -.307 -.214 -.205
Projectorgani/ation
-.041 -.234 -.047 -.307 1 000 .047 -.041
Profcssio nal used
-.104 -.148 -.390 -.214 .047 1.000
|00 vO
Buildingtype
.243 .527 .360 -.205 -041 -.189 1.000
Source : Author
60

fable 4.10 — Coefficients of Independent Variables
Model VariablesUnstandardi/ed
CoefficientsStandardizedCoefficients t Sig Correlations
B Std Kiror BetaZero-order l^ ia l Part
1 (Constant) 1.578 .474 3 331 .002Building Type .218 .131 .243 1.660 .104 .243 .243 .243
2 (Constant) 1.597 456 3 505 001Building Type 385 .148 429 2.592 .013 .243 368 .365Project Scope -.325 .152 -.353 -2.135 .038 -.127 -.310 -.300
3 (Constant) 1.043 .602 1.732 .091Building Type .424 .150 .473 2836 .007 243 .401 .395Project Scope -.331 .151 -360 -2.198 .034 -.127 -.321 -.306
Method Used .225 .162 .198 1 389 .172 .131 .210 .193
4 (Constant) 1.191 .654 1.822 .076
Building Type .424 .151 .473 2.815 .007 .243 .402 .395
Project Scope -.265 .187 -288 -1.419 .163 -.127 -.216 -.199
Method Used .209 .165 .184 1 269 .212 .131 .194 .178
Construction Time -.125 .206 -.113 -.608 .547 -.161 -.094 -.085
5 (Constant) 1.641 1.086 1.511 .139
Building Type .408 .155 .455 2.624 .012 .243 .383 .371
Project Scope -.241 .194 -.262 -1 241 .222 -.127 -.192 -.176
Method Used .176 .178 .155 992 1 .327 .131 .155 .140
Construction Time -.180 .233 -.163 -.773 .444 -.161 -.121 -.109
ProfTesional Used -.051 098 -.087 -.521 .605 -.104 -.082 -.074
6 (Constant) 1 858 1 306 1 423 .163
Building Type 409 .157 .456 2.603 .013 .243 385 .373
Ihoject Scope -.256 203 -.279 -1.264 .214 -.127 -.198 -.181
Method Used .159 .189 .140 843 .405 .131 .134 .121
Construction Time -.174 .236 -.158 -.739 .464 -.161 -.118 -.106
Professional Used -.052 .099 -089 -.523 .604 -.104 -.083 -.075
I’roject-6.353E-02 .207 -048 -.308 .760 -.041 -049 -.044
Organization
Source : Author
4.3.2 Stepwise Regression Analysis
All the independent variables were entered for regression. Step-wise regression method was
adopted because it showed only the variables that were important at the set confidence level of
95 percent. The only model which met this criteria was model 2. This means that the two
major predictors o f accuracy o f cost estimates are building type and project scope/size. The
61

predictors are able U> explain 14.9 percent o f the variation of the cost estimate in the building.
I bis model 2 is the only combination of the variables that is significant at 0.05 level which is
the set confidence level. I he rest o f the variables combined can only explain 5.9 percent as
presented in fable 4.11.
I lie implication ol (his finding is that these other variables; construction time, method of
construction, project organization and profession used in the building construction projects
have minimal impact on the estimated cost. Probably the reason for this occurrence is that our
project and construction management has remained conventional and these variables reflect
more or less the practised management in quantity surveying firms. What we are saying is that
almost all construction firms have minimal variation when it comes to application o f among
these variables in their practice. Ilencc the findings show that probably the most critical
variables that quantity surveying firms should consider when doing cost estimates are the type
o f building and the scope/size of project.
I able 4 .11 Regression Models Summary
Model K R SquareAdjusted K
SquareSlit. Error of the Estimate Change Statistics
R Square Change h Change dfl df2 Sig. 1 Change
1 .2 4.1 .050 .018 .99 .059 2.755 1 44 .104> 186 .149 .110 .96 .090 4.560 1 43 .038*
t 412 .187 .128 .95 .037 1.929 1 42 .172
1 no . t ‘>4 .115 .95 ss(M)7 .369 1 41 .547
s 1 4<» .199 .099 .96 (K)5 .272 1 40 .605
<> -140 .201 .078 .97 .002 .095 1 39 .760
Source: Author
K squared-0.149 F-4.560 Significant l7ss0.038 * Significant level at 0.05
a. Predictors: (Constant), BLD1) I VP
b. Predictors: (Constant), BLDD I VP, PRJJSCOP
c. Predictors: (Constant), IU.DD TYP, PRJ SCOP, METUSFD
d. Predictors: (Constant), BLDDTYP, PRJ_SCOP, MLTJJSPD, CON_TIM
c Predictors: (Constant), BI.D!) I VP, PRJ_SCOP, METJJSED, CON_TIM, PROFFJN
l I'K.li. lots: (Constant), U l.D D f Yl‘, PRJ SCOI>, MET USED, <«>N_TIM, PROFFJN. PRJ_ORG
j*. I )c|tcodciil Variable: ( ()SI l-.SI
62

4.4 Hypothesis Testing
The Null Hypothesis: Cost estimates do not accurately project pre-design stage costs used
guide for investment decision making process.
The Alternative Hypothesis: Cost estimates do accurately project pre-design stage costs
as a guide for investment decision making process.
Testing using the F-statistic
Tabulated F is 2.449 at 95% confidence level (Appendix It)
Computed F is 4.560 (Table 4.11).
Null hypothesis is rejected hence we accept the alternative hypothesis that states that
estimates do accurately project pre-design stage costs used as a guide loi investment de i
making process. As explained in stepwise regression analysis, the building type and
scope/size were found to influence the cost estimate ol building project signilu anil
as a
used
cost
•ision
roject
63
Chapter l ive
CONCLUSIONS
5.1 Introduction
This chapter gives the findings on the accuracy of cost estimates when computed with tin*
results of the successful lenders or lowest bidders awarded the contract. Conceptual cost
estimates arc critical inputs for owners’ decision-making in the early planning stages ol
construction projects. However, a recurrent problem associated with conceptual estimating is
how to assess the quality of the estimates, that is, the expected accuracy and reliability of cost
figures given the uncertainty and risk that every project will face during its development < >u«
o f the approaches used to assess the quality of an estimate is the application o l c\peiii <
opinion and experience. This research examined the problem of the quality ol conceptual
estimating. It assessed the usage o f historical and empirical information which had been used
in the pre-tender cost estimates, and ascertained whether it is possible to get an appropriate
initial assessment o f the expected accuracy and reliability of a cost estimate. I his is then
compared with successful bidder or the lowest tender figure awarded the contract
5.2 Results
The findings of the study can be summarized as follows:-
• The main objective of this study was to establish the variation between the cost
estimates derived from the various estimation methods, flic research established that
cost estimating methods contribute 43 percent of estimating errors.
• The second objective was to establish factors that have direct influence on the cost ol
residential and office projects in Kenya. I he study has shown that building type and
project scope size arc other major factors contributing 24.3% of the estimating errors.
The study also tried to discover whether there arc other factors that have a direct
influence on the cost o f project that arc omitted by the pre-tender co I estimation
methods. The findings was unable to account for more than 20% other factors that may
influence the accuracy of cost estimates. Other factors were identified in ihr literature
review as estimator's biases. However these factors were not covered in this rcscnich.

• I he third objective ol the study was to establish tlx* deviation ol construction cost
estimates from actual tender received. The findings noted that cost estimates a* * ma« \
falls between 5-10% of estimated costs.
From the finding and analysis of this study, it can be concluded that llicii exist a large
variability between cost estimates and the successful bidder or the lowest lendei llguie-.
awarded the contract.
Based on stepwise and regression analysis, building type and project scope/si/c variables wen
found to major predictors of the cost estimates of building projects, lienee these vmiablrs
explains the inaccuracies therein. The outcome of hypothesis testing confirmed dial at 9V\.
confidence level (S.F =0.05 and 42 degrees o f freedom). I he outcome is suppoiled with sliong.
correlation (0.877) between level of cost estimate and cost estimating methods. This is
statistically significant at 0.01 level (that is, it would occur hy chance less than one m a
hundred times) generalized to the whole population and thus apply to all building project
considered in this study. The implication o f the findings is that const ruction cost estimates in
Kenya will continue to experience variability unless adequate attention is not paid by quantity
surveyors firms in addressing major predictors in the cost estimating ol building projects.
The other implication of this findings is that the variables which do not constitute die
significant model 2, must be given attention by the quantity surveying forms since llicy would
improve the accuracy o f the building cost estimate. Since drey seem to be surrogates ol
project and construction management, then it is important the professions an*I evaluate their
management techniques as they have bearing cost ol building..
5 3 Recommendations
It is recommended that the quantity surveying linns need to consider the building i \p e ami
scope /size of building more critically when they arc doing cost estimate in projects ol ollu »
and residential buildings.
65

5.4 Suggested Areas of Further Study
• Performance of a cost model for estimating preliminary cosl of building costs before the
design proceeds to a more advanced level.
• Establishment of a building cost index in Kenya that can be used for comparing cost generated
by different time period (years)
• Elemental distribution of cost for residential and office building projects in Kenya.
• Reasons why fixed price types of contracts arc most used for construction projects in Kenya
66

REFERENCES
1. Adams, J.R. and Swanson, L.A. (1976) Information processing behaviour and
estimating accuracy in operations management. Academy of Management Journal.
19(1), 98-109.
2. Ashley, D. and Scrpcl, A. (1988) Survey on Conceptual Estimating Practice.
Unpublished Summary Report, t Iniversity of Texas, Austin. IX.
3. Ashworth, A. (2004) cost studies of Building 4'1’ I .dilion, I’rcnticc Hall, England.
4. Babbie, E. (1983) The Practice of Social Research, 3nl cdn. Wadsworth. I ondon. eh. V
5. Baradyana, J.S (l996),"Dclays: a major management problem for the construction
projects in the East African Region: The Case study of Tan/ania”. Paper presented in
the first regional conference on construction project management - East African
Context, Machakos, Kenya, November 20-23
6. Beeston, D. f. (1983), Statistical Method for Building Price Data, .1. W. Ashworth I id.
Great Britain.
7. Birnie, J., and 5 ates, A. (1991). “Cost prediction using dccision/risk analysis
methodologies.7' Constr. Mgmt. and Economics. 9, 171-186.
8. Clark, F.D. and I orenzoni, A.B. (1985) Applcid Cost Engineering, 2'"1 cdn. Marcel
Dekker.
9. Curran, M.W. (1989) Range estimating. Cost Engineering, 31(3), 18-26.
10. Dawson C. 2002 P r a c t ic a l R e s e a r c h M e th o d Published by I low to Books
67

11. Ferry, J.D. Brandon. I \ S. and Ferry, Jonathan I) ( I*>*>*>). cost planning of Buildings.
Black well publishing, l I.K.
12. Fildcs, R. (1987) Forecasting: the issues, in S. Makridakis and S. Wheelwright (cds):
The Handbook of Forecasting, John Wiley & Sons, Indianapolis, pp. 150 I 70.
13. Flanagan, R. (1986). “Patterns of competitive tendering." Dept, ol Constr. Mgint..
University of Reading, Reading, U.K.
14. Foxhall, W.B. (1975). Techniques for successful practice for architects and engineers.
McGraw-Hill Book Co., Inc., New York. N.Y.
15. Gray, N.S. (2001) Secrets to creating the elusive accurate estimate. I’M Network.
August, 54-57.
16. Hogarth, R.M. (1980) Judgement and Choice, Wiley, New York, .lobling. I’. (1995)
Initial estimates, in N. Smith (cd): Project Cost Estimating, Thomas I'd lord. I ondon.
pp. 11-27.
17. Ibbs, W. C., and Ashley, D. B. (1987). “Impact of various construction contract
clauses.” J. Constr. Engrg. And Mgmt., ASCE, 113(3). 14.
18. Jahren, C., and Ashe, A. (1990). “Predictors of cost-overrun rates.” J. Constr. Engrg.
And Management. ASCI'. 116(3), 548-552.
19. Kivaa, T, 2000, developing a Model for Estimating Construction period: A survey ol
building projects in Nairobi, M. A. Thesis, University of Nairobi, I Inpublishcd.
20. Kometa, S., Olomolaiyc, P.. and Harris, F. (1995). “Qualifying client-generated risk by
project consultants.” Constr. Mgmt. and Economics, 13, 137-147.
68

21. Kouskoulas, V. & Kochn, E. (1974): " Pre-design Cost Estimation function for
buildings" Journal of the Construction Division. ASCI I Vol. 100. N<)( 'OA. December
1974.
22. “Management of project risks and uncertainties." ( 1989). Publication 6-8. ( oust met ion
Industry Institute Cost/Scliedule Controls Task force. University o f lexas Press,
Austin, Tex.
23. Mbatha I. M. (1986). Building contract performance: ease study ot ( iovernment
Projects in Kenya . M. A. Uresis, 1 Iniversity of Nairobi, (unpublished)
24. McDonald, D. F. Jr. (1989). “Advanced cost estimating and workshop t C Anno
Meeting o f the Am. Assn, of Cost Engrs., Morgantown, W. Va 17-23.
25. Murton, R and Jailer, D (1995): Design and Economics of Building, 5"' I and I N spoil
UK.
26. Nachmias, D and Nachmias, C. (1987) Research Methods in the Social Sciences. V'1
edn, St Martin, London, eh. 7.
27. Napier, T. R., and Chang, L.-M. (1988). “Cost assessment of emerging construction
technologies.” Am. Assn, o f Cost Engrs. Trans., C.4.1 -(3.4.5.
28. Nkado, R. (1995). “Construction time-influencing factors: the contractor's
perspective.” Conslr. Mgmt. and Economics, 13, 81-89.
29. Oyamada, H., and Yokoyama, K. (1986). “A study of cost estimating relationship
between plant cost and economic trend factors.” Am. Assn, of Cost Engrs. Trans.,
M.2.1 - M.2.5.
30. Rebata, J.A. (1978) Qualification of estimates. Transactions o f the American
Association o f Cost Engineers, paper D-2, 169-173.
69

31. Rush, C. and Roy, R. (2001) Expert judgement in cost estimating: modeling the
reasoning process. Concurrent Engineering - Research and Application. 0(4), 7.71
284.
32. Pack, J. H. (1994). “Contractor risks in conceptual estimating." Cost I ngrg.. 36(1
19-22.
33. Peurifoy, R., and Ohcrlcndcr. G. (1989), Estimating Construction costs. 4"' I d .
McGraw-Hill Book Co., Inc., New York, N.Y.
34. Raflcry, J. (1992): Principles o f Building Economics Condon, BSP Professional Books.
35. Randolph, D. A., Rajandra, k ., and Camplicld, J. J. (1987). “Using risk management
techniques to control construction contract costs." .1. Constr. I ngrg. and Mgmt., AS( b.
3(4), 314-324 .
36. Rukwaro, R (1990): Influence of Architectural Design parameters on maintenance costs
of Building services of Office Buildings in the city of Nairobi. MA I hesis. I Ini versity
of Nairobi, Unpublished.
37. Seeley 1. H. 1992: Building Economics, Macmillan Press. London.
38. Serpcll, A. (1990) Improved conceptual estimating performance using a knowledge-
based approach. PhD Dissertation, 1 Inivcrsity o f Texas, Austin, I X.
39. Shen, Q.P., Fong, P.S.W. and Deng, M.Z.M. (2001) Developing an intelligent system
for teaching pre-tender cost estimating of office building projects. Computet
Applications in Engineering Education, 9(1), 26-36.
40. Skirtmore, R.M. (1985) flic influence of professional expertise in construction price
forecasts, Report. Department of Civil Engineering, University of Salford. I >k.
70

41. True, N.F. (1988) Determining the accuracy of an estimate.
42. Winker, R.L. (1987) Judgmental and Bayesian forecasting, in S. Mnkridakis and S
Wheelwright (cd^): The Handbook of f orecasting, 2n<l edn, Wiley. Chichester, pp. 248-
265.
43. Thuo (1987) Institute of Quantity Surveyors of Kenya (1QSK) Journal. IQSK .
71

APPENDIX A
An Investigation Into Factors That AITect The Accuracy Of Cost Estimates For Building:
Case-Study O f Private Residential And Office Projects In Kenya
Questionnaire For Quantity Surveying Firms
PARI I
K in d ly a s s is t in p r o v id in g th e d a ta r e q u i r e d in th is r e s e a r c h s tu d y , b y c o m p le t in g th is
q u e s t io n n a ir e . Y o u r a s s is ta n c e w il l h e h ig h ly a p p r e c ia te d . A n s w e r s to th e q u e s t io n s c o n ta in e d
in th e q u e s t io n n a ir e sh a ll h e k e p t c o n f id e n t ia l
Please provide the following details of Residential huihling project selected from your
quantity surveying firm
1 PROJECT PARTICULARS Fill in this column
A. Type of residential building project (please tick)
1. Residential - Low Kise flats
2. Maisonettes
3. Bungalows
B Type of Contract (please tick)
1. Lumpsum fluctuating price
2. Lumpsum fixed price
3. Schedule of rates
4. Other (specify)
2. PROJECT SCOPE & COMPLEXITY
A. Plinth area Square metres
B. Height - Total number o f storeys
C. - Storey height (average)
Metres
- T otal height (including parapet walls, roof etc)
Metres
D. length of frontage
Metres
E. Size of site (plot) Square
metres
F. Roof pitch (please tick)
72

pitched roof
flat roof
G. Total Area of:-
(i) External wall Square metres
(ii) External Windows Square metres
(iii) External Doors Square metres
3. CONSTRUCTION TIME
A. Date of cost estimate
B. Date o f tender opening
4. COST ESTIMATE
A. A.1 Preliminary Cost Estimates
A.2 Lowest tender figure recommended for contract award
B. COST ESTIMATING METHOD USED
(i) cubic method
(ii) Unit rate method
(iii) Square metre rate
(iv) Elementally cost analysis
(v) Approximate quantities
(vi) Pricing complete bills of quantities
5. PROJECT ORGANIZATION
A. Procurement Approach (please tick)
1. Traditional - Architect being designer & contractor)
2. Non-traditional - design & build
- project management
- management contracting
- turnkey
- Other (please specify)
B. Which of the following professionals were involved in giving cost
estimates for this project (please tick)
1. Project managers
2. Architects
3. Quantity Surveyors
73

4. Civil / Structural engineers
5. Electrical engineers
6. Mechanical engineers
7. landscape architects
8. Others (specify)
6 QUALITY OF MATERIALS, COMPONENTS &
WORKMANSHIP
Using the scale described below, rate the quality of materials
and workmanship in the following components of the
building.
1 it k the correct ratio
Component/ Scale Fair
(D
A verage
(2)
(looj
(3)
l 'e/r < rood
(d)
A Foundations Strip
foundation
B Structural Design Minimum
design loads
Average
design
loads
Above average
design loads
Many extra
design loads
C. External wall Masonry Masonary
and/or
Glass
cladding
Cilass cladding.
Curtain wall,
precast concrete
pancls/sunhrcakers
Monumental
(nimble)
D. Floor Finishes Cement
screed
PVC and/or
Granolithic
Ceramic tiles
terrazzo, parquet.
Granite, marble
E. Internal Wall finishes Plaster &
paint
Plaster &
paint,
timber
panels
Plaster & paint
timber panels,
ceramic tiles
Aluminum
panels. Mai Me
F. Ceiling finishes Plaster &
paint painted
eelotex
Plaster &
paint,
painted
chipboard,
soft wood
T & G
boarding
Plaster & paint,
painted chipboard,
hardwood I & G
boarding
Suspended
aluminium
panes
74

G. Sanitary fittings Squatting
type WC,
Plastic
cisterns
White
fittings,
stainless
steel taps.
Coloured
conventional
shape fittings,
brass plated taps
< 'olmired non
conventional
shape linings,
gold plated taps
H. Electrical fluorescent
light, poor
quality
ceiling
fluorescent
light,average
quality
suspended
ceiling
Fluorescent light,
above average
quality ceiling
Fluorescent
light, excellent
quality ( oiling
1 Ventilating and air Below Average Above average Above average
conditioning average quality minimum quality
quality
75

I*' Distribution Table
APPENDIX »
V ,/V , 1 2 3 4 ~5 6 7 " 8 9 101. 161.4 199.5 215.7 224.58 230.16 233.98 236.76 238.88 10 54 241.92. 18.513 19.00 19.16 19.247 19.29 19.330 19.35 19.371 19 385 19.13. 10.128 9.552 9.277 9.117 9.013 8.941 8 887 8.845 8 81 ' 8.7864. 7.709 6.944 6.591 6.388 6.256 6.163 6.094 6.041 5.999 5.9645. 6.608 5.786 5.409 5.192 5.050 4.950 4.876 4.818 4.77 ’ 4.7356. 5.987 5.143 4.757 4.534 4.387 4.284 4.207 4.147 4.099 4.0607. 5.591 4.737 4.347 4.120 3.972 3.866 3.787 3.726 3 67 7 3.6378. 5.318 4.459 4.066 3.838 3.687 3.581 3.500 3438 J 388 3.3479. 5.117 4.256 3.863 3.633 3.482 3.374 3.293 3.230 3.179 3.13710. 4.965 4.103 3.708 3.478 3.326 3.217 3.135 3.072 3.020 2.97811. 4.844 3.982 3.587 3.357 3.204 3.095 3.012 2.948 2 8% 2.85412. 4.747 3.885 3.490 3.259 3.106 2.996 2.913 2.849 2.796 2.75313. 4.667 3.806 3.411 3.179 3.025 2.915 2.832 2.767 2.714 2.67114. 4.600 3.739 3.344 3.112 2.958 2.848 2.764 >699 2 616 2.60215. 4.543 3.682 3.287 3.056 2.901 2.790 2.707 2.641 2.588 2.54416. 4.494 3.634 3.239 3.007 2.852 2.741 2.657 2.591 2 5 19 2.49417. 4.451 3.592 3.197 2.965 2.810 2.699 2 614 2.548 2.494 2.45018. 4.414 3.555 3.160 2.928 2.773 2.661 2.577 2.510 2.456 2.41219. 4.381 3.522 3.127 2.895 2.740 2.628 2.544 2.477 2.423 2.37820. 4.351 3.493 3.098 2.866 2.711 2.599 2.514 2.447 2.393 2.34821. 4.325 3.467 3.072 2.840 2.685 2.573 2.488 2.420 2.366 2.32122. 4.301 3.443 30.49 2.817 2.661 2.549 2.464 2.397 2.342 2.29723. 4.279 3.422 3.028 2.796 2.640 2.528 2.442 2.375 2.310 2.27524. 4.260 3.403 3.009 2.776 2.621 2.508 2.423 2.355 2.30025. 4.242 3.385 2.991 2.759 2.603 2.490 2.405 2.337 2 282 2.23626. 4.225 3.369 2.975 2.743 2.587 2.474 2.388 2.321 2.265 2.22027. 4.210 3.354 2.960 2.728 2.572 2.459 2.373 2.305 2.250 2.20428. 4.196 3.340 2.947 2.714 2.558 2.445 2.359 2.291 2.239 2.19029. 4.183 3.328 2.934 2.701 2.545 2.432 2.346 2.278 2.223 2.17730. 4.171 3.316 2.922 2.690 2.534 2.421 2.334 2.266 2.211 2.16540 4.085 3.232 2.839 2.606 2.449 2.336 2.249 2.180 2.1 M 2.07750 4.034 3.183 2.790 2.557 2.400 2.286 2.199 2.130 2.073 2.02660 4.001 3.150 2.758 2.525 2.368 2.254 2.167 2.097 2.040 1.99370 3.978 3.128 2.736 2.503 2.346 2.231 2.143 2.074 2.017 1.96980 3.960 3.1 II 2.719 2.486 2.329 2.214 2.126 2.056 1.999 1.95 190 3.947 3.098 2.706 2.473 2.316 2.201 2.113 2.043 1.986 1.938100 3.936 3.087 2.696 2.463 2.305 2.191 2.103 2.032 1.975 1.93120 3.92 3.07 2.68 2.45 2.29 2.17 2.09 2.02 |.% 1.93
3.84 3.00 2.60 2.37 2.21 2.10 2.01 1.94 1.88 1.80
Upper critical values of the f distribution for V2 numerator degrees of freedom and VI denominator degrees of freedom 5% significance level.
Source: NISI7SEMATECI1 e-1 land book of Statistical Methods
http://www.itl.nist.gov/div898/handbook (accessed 3.02 2003)
76