Embed Size (px)
Citation preview

An Investigation of How Wavelet Transform can Affect the CorrelationPerformance of Biomedical Signals
The Correlation of EEG and HRV Frequency Bands in the frontal lobe of the brain
Ronakben Bhavsar, Neil Davey, Yi Sun and Na HelianThe School of Computer Science, University of Hertfordshire, Hatfield, U.K.
r.bhavsar2, n.davey, y.2.sun, [email protected]
Keywords: EEG, HRV, Biomedical Signal Processing, Time series Data Analysis, Pearson Correlation, Wavelet Trans-form, Independent Component Analysis, Feature Extraction, Fast Fourier Transform.
Abstract: Recently, the correlation between biomedical signals, such as electroencephalograms (EEG) and electrocar-diograms (ECG) time series signals, has been analysed using the Pearson Correlation method. AlthoughWavelet Transformations (WT) have been performed on time series data including EEG and ECG signals, sofar the correlation between WT signals has not been analysed. This research shows the correlation betweenthe EEG and HRV, with and without WT signals. Our results suggest electrical activity in the frontal lobe ofthe brain is best correlated with the HRV. We assume this is because the frontal lobe is related to higher mentalfunctions of the cerebral cortex and responsible for muscle movements of the body. Our results indicate apositive correlation between Delta, Alpha and Beta frequencies of EEG at both low frequency (LF) and highfrequency (HF) of HRV. This finding is independent of both participants and brain hemisphere.
1 INTRODUCTION
Biomedical signals are a record of electrical activitywithin human body, and they may indicate the stateof health of human. Among many biomedical sig-nals, Electroencephalograph (EEG) and Electrocar-diograph (ECG) signals are considered in this work.EEG signals provide a measure of brain nerve cellelectro-physiological activity, that is accessible on thesurface of the scalp (Lewis et al., 1988), thus pro-vide information about different types of brain activ-ity. Identifying changes in EEG signals has improvedour understanding of the relationship of these signalsto people ′s moods, and behaviour (Han et al., 2012),(Ebersole and Pedley, 2003). ECG signals containsa plethora of information on the normal and patho-logical physiology of the heart and its health. Fur-thermore, ECG signals provide vital information withregards to the function and rhythm of the heart. Theheart rate variability (HRV) has been extracted fromthe ECG signals. HRV describes the variation in timebetween consecutive heart beats, which is commonlyreferred to as the RR (R wave to R wave) or NN (Nor-mal beat to normal beat) intervals.
In recent years, the correlation between the EEGand the ECG have been conducted to analyse theirfunctionality under certain conditions and to check
whether this functionality is related to each other. Re-search (Kim et al., 2013), (Chua et al., 2012), (Ab-dullah et al., 2009), (Sakai et al., 2007), (Berg et al.,2005), (Edlinger and Guger, 2006), suggests that thecorrelation between spectral bands of EEG and HRVhas been conducted to assess the interaction betweenthem, and achieved remarkable correlation.
The recent research on correlation between thesetwo signals as mentioned earlier has focused on theFourier analysis of the frequencies presents in thesesignals. Whilst, the wavelet transform (WT), acts onfrequency and time of the recorded signals. There-fore, WT has widely utilized for analysing biomedi-cal or time series signals. The WT of the signal canbe thought of as an extension of the classic Fouriertransform (FT) - it works on multi-scale basis, insteadof working on a single scale (Time or Frequency) asFT, and gives detailed and clear information of thesignals. Therefore, WT of the signals is an importantmethod not only to analyse EEG and ECG/HRV sig-nals individually, but also to analyse the correlationbetween them. According to recent research (Thomasand Moni, 2016), (Chandra et al., 2017), (Mirsadeghiet al., 2016), (Mporas et al., 2015), (Valderrama et al.,2012), (Nasehi and Pourghassem, 2011), (Cvetkovicet al., 2008), WT has been used to analyse eitherEEG or ECG signal, but the correlation between these
transformed signals has not yet been conducted. Inthis paper we are not only focusing on the correlationbetween without wavelet transform signals but alsobetween wavelet transformed signals.
2 RELATED WORK
A series of data points in time order, or time series,provide the view of a signal as it evolves over time, inthe Time domain (TD). TD analysis is used to anal-yse the signal in its actual state - it is utilised to anal-yse changes in biomedical signals, such as the power(or amplitude) over time. In addition, the frequenciespresent in the signal are open to investigation (for ex-ample, by using the Fast Fourier Transform (FFT)).Such an analysis is said to take place in the Frequencydomain (FD). The FD analysis is used to identify fre-quencies present in the signals. Furthermore, it can beutilized to establish the relationship between frequen-cies and its corresponding power (amplitude), and sothe energy distributions in signals.
In recent research, the correlation between EEGand ECG/HRV signals have been analysed in the FD,as shown in Table 1, which indicates that the Pear-son correlation is the best method for the FD analy-sis. In addition, different numbers of EEG electrodeshave been used to analyse the relationship with theECG/HRV. To the best of our knowledge, very lim-ited work has been done on the correlation betweenEEG and ECG/HRV signals using 19 EEG electrodes.Moreover, no one has analysed these signals under thesame condition (i.e. with TEAS acupuncture applied)that utilised in this research. This paper investigatesthe correlation between EEG and ECG/HRV signalsin FD using Pearson correlation considering all 19EEG electrodes under the same condition.
Based on the research as shown in Table 2 on WT,it is straightforward that the DWT based methods arewell known for EEG and ECG feature extraction andanalysis. Furthermore. Among the DWT based meth-ods mentioned, db wavelet method has been consid-ered by the researchers. It is obvious from the re-search on WT that key features of EEG and ECG sig-nal can improve the analysis performance. Therefore,it is important to analyse not just either EEG or ECGas shown in Table 2, but also the correlation betweenEEG and ECG. To our knowledge, we have not yetfound information on the correlation between wavelettransformed signals. In this work, we describes suchan analysis.
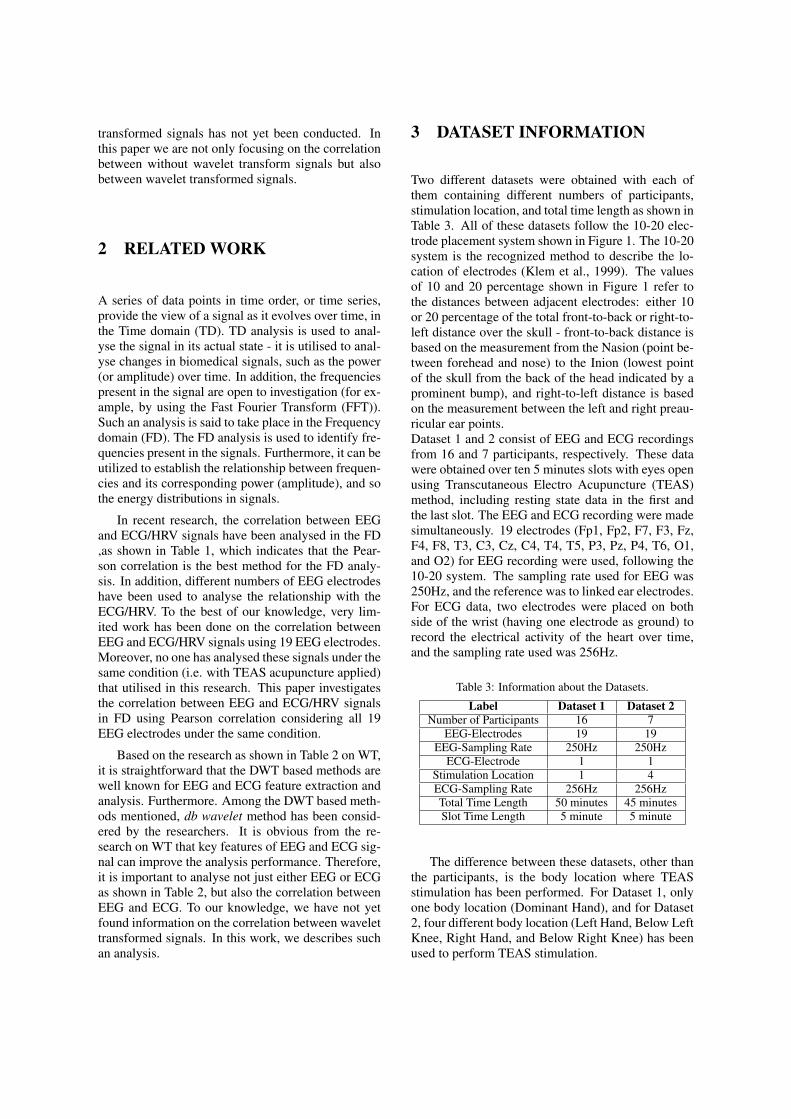
3 DATASET INFORMATION
Two different datasets were obtained with each ofthem containing different numbers of participants,stimulation location, and total time length as shown inTable 3. All of these datasets follow the 10-20 elec-trode placement system shown in Figure 1. The 10-20system is the recognized method to describe the lo-cation of electrodes (Klem et al., 1999). The valuesof 10 and 20 percentage shown in Figure 1 refer tothe distances between adjacent electrodes: either 10or 20 percentage of the total front-to-back or right-to-left distance over the skull - front-to-back distance isbased on the measurement from the Nasion (point be-tween forehead and nose) to the Inion (lowest pointof the skull from the back of the head indicated by aprominent bump), and right-to-left distance is basedon the measurement between the left and right preau-ricular ear points.Dataset 1 and 2 consist of EEG and ECG recordingsfrom 16 and 7 participants, respectively. These datawere obtained over ten 5 minutes slots with eyes openusing Transcutaneous Electro Acupuncture (TEAS)method, including resting state data in the first andthe last slot. The EEG and ECG recording were madesimultaneously. 19 electrodes (Fp1, Fp2, F7, F3, Fz,F4, F8, T3, C3, Cz, C4, T4, T5, P3, Pz, P4, T6, O1,and O2) for EEG recording were used, following the10-20 system. The sampling rate used for EEG was250Hz, and the reference was to linked ear electrodes.For ECG data, two electrodes were placed on bothside of the wrist (having one electrode as ground) torecord the electrical activity of the heart over time,and the sampling rate used was 256Hz.
Table 3: Information about the Datasets.
Label Dataset 1 Dataset 2Number of Participants 16 7
EEG-Electrodes 19 19EEG-Sampling Rate 250Hz 250Hz
ECG-Electrode 1 1Stimulation Location 1 4ECG-Sampling Rate 256Hz 256HzTotal Time Length 50 minutes 45 minutesSlot Time Length 5 minute 5 minute
The difference between these datasets, other thanthe participants, is the body location where TEASstimulation has been performed. For Dataset 1, onlyone body location (Dominant Hand), and for Dataset2, four different body location (Left Hand, Below LeftKnee, Right Hand, and Below Right Knee) has beenused to perform TEAS stimulation.

Table 1: Summary of Correlation Research on Biomedical Signals since 2003 to 2017
RefDetail TD FD Pearson Correlation Method Other Correlation Method EEG Electrodes Investigated(Miyashita et al., 2003) - X X - 4
(Yang et al., 2002) - X X - 2(Ako et al., 2003) - X X - 1
(Jurysta et al., 2003) - X - Coherency Analysis 3(Takahashi et al., 2005) - X X - 6
(Edlinger and Guger, 2006) - X X - 2(Berg et al., 2005) - X X - 2(Sakai et al., 2007) - X X - 19
(Abdullah et al., 2010) - X - Cross-correlation 1(Chua et al., 2012) - X - X 4(Kim et al., 2013) - X - Coherency Analysis 19
(Prinsloo et al., 2013) X - X - 3(Liou et al., 2014) - X X - 19
(Triggiani et al., 2016) - X X - 19
Table 2: Summary of Research on Well known Wavelet Transformation Methods for Biomedical Signals since 2012 to 2017
RefDetail EEG ECG/HRV TD FD Feature Extraction Method(Kutlu and Kuntalp, 2012) - X X - DWT-Daub Wavelet
(Thomas et al., 2015) - X X - DWT-Daub Wavelet(Sudarshan et al., 2017) - X X - DWT-Daub Wavelet(Acharya et al., 2017) - X - X DWT-Daub Wavelet
(Dolatabadi et al., 2017) - X X X Principal Component Analysis (PCA)(Kumari et al., 2014) X - X X DWT-Daub Wavelet(Mumtaz et al., 2017) X - X X DWT-Daub Wavelet
(Kevric and Subasi, 2017) X - - X DWT-Daub Wavelet(Faust et al., 2015) X - X - DWT-Daub Wavelet
Figure 1: The international 10-20 system seen from A (left side of the head) and B (above the head). The letter F, T, C, P, O,A, Fp and Pg stands for frontal, temporal, central, parietal, occipital, earlobes, frontal polar, and nasopharyngeal, respectively.The figure is obtained from (Klem et al., 1999).
4 METHODS
4.1 Pearson Correlation
The Pearson′s correlation coefficient measures howclosely two different observables are related to eachother. Correlation co-efficient range between 1 (whenthe matching entities are exactly the same) and −1
(when the matching entities are inverses of eachother). A value of zero indicates no relationship ex-isting between the entities.
4.2 Wavelet Transform
The Wavelet Transform (WT) is designed to directthe problem of signals with nonstationarity. It in-cludes representation of time function in terms of sim-
ple blocks, termed wavelets. These blocks are derivedfrom a signal generating function called the motherwavelet by translation and dilation operations. Dila-tion, also known as scaling, compresses or stretchesthe mother wavelet and translation shifts it along thetime axis (Daubechies, 1990), (Akay, 1997), (Unserand Aldroubi, 1996). The WT can be categorized intocontinuous and discrete. Continuous wavelet trans-form (CWT), implies that the scaling and translationparameters change continuously, and thus, representconsiderable effort and vast amount of data calcula-tion for every possible scale. Therefore, we used dis-crete wavelet transform (DWT). The WT of the sig-nal can be thought of as an extension of the classicFourier transform (FT) - it works on multi-scale ba-sis, instead of working on a single scale (Time or Fre-quency) as FT. This is achieved by decomposition ofthe signal over dilated (scale) and translated (time)version of wavelet. An input signal is decomposed byusing low pass filter and high pass filter followed bydown sampling in each stage. The output of the firststage high pass filter gives the detail coefficient (D1),whereas the low pass filter gives the approximationcoefficient (A1).
The prototype wavelet used in this study isDaubechies wavelet of order 4 (db4) based on our re-search on biomedical/time series signal analysis, asmentioned in Table 2.
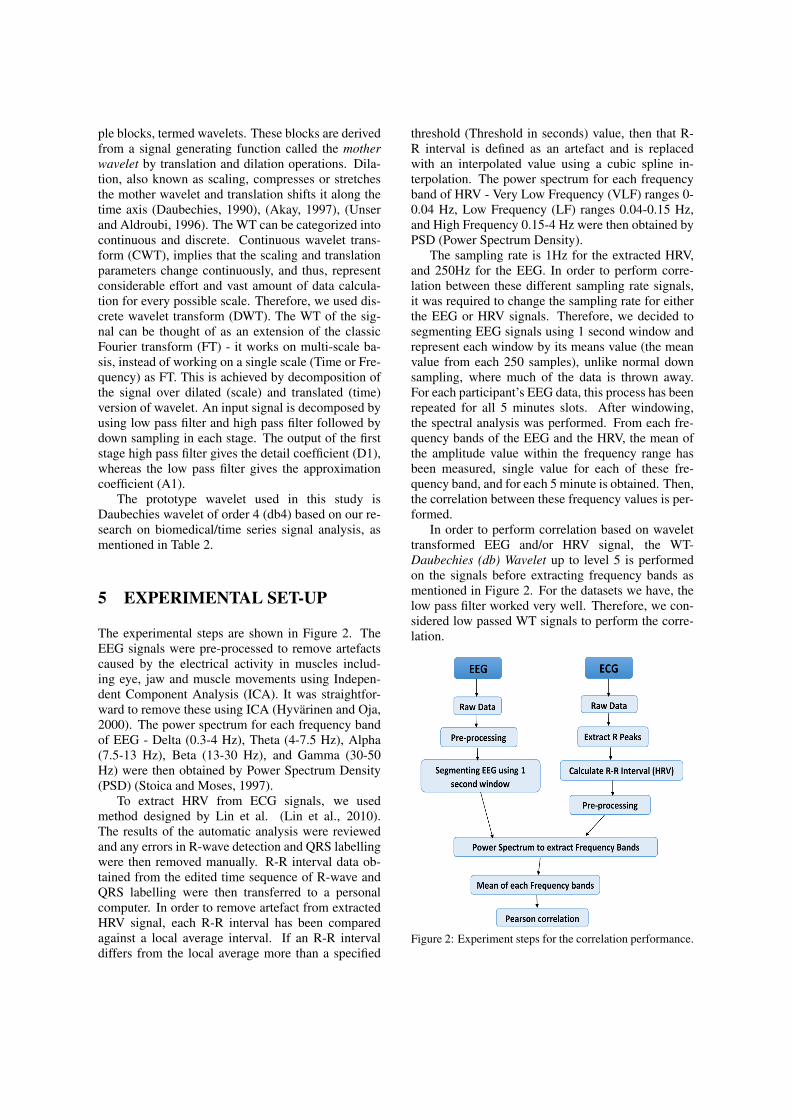
5 EXPERIMENTAL SET-UP
The experimental steps are shown in Figure 2. TheEEG signals were pre-processed to remove artefactscaused by the electrical activity in muscles includ-ing eye, jaw and muscle movements using Indepen-dent Component Analysis (ICA). It was straightfor-ward to remove these using ICA (Hyvarinen and Oja,2000). The power spectrum for each frequency bandof EEG - Delta (0.3-4 Hz), Theta (4-7.5 Hz), Alpha(7.5-13 Hz), Beta (13-30 Hz), and Gamma (30-50Hz) were then obtained by Power Spectrum Density(PSD) (Stoica and Moses, 1997).
To extract HRV from ECG signals, we usedmethod designed by Lin et al. (Lin et al., 2010).The results of the automatic analysis were reviewedand any errors in R-wave detection and QRS labellingwere then removed manually. R-R interval data ob-tained from the edited time sequence of R-wave andQRS labelling were then transferred to a personalcomputer. In order to remove artefact from extractedHRV signal, each R-R interval has been comparedagainst a local average interval. If an R-R intervaldiffers from the local average more than a specified
threshold (Threshold in seconds) value, then that R-R interval is defined as an artefact and is replacedwith an interpolated value using a cubic spline in-terpolation. The power spectrum for each frequencyband of HRV - Very Low Frequency (VLF) ranges 0-0.04 Hz, Low Frequency (LF) ranges 0.04-0.15 Hz,and High Frequency 0.15-4 Hz were then obtained byPSD (Power Spectrum Density).
The sampling rate is 1Hz for the extracted HRV,and 250Hz for the EEG. In order to perform corre-lation between these different sampling rate signals,it was required to change the sampling rate for eitherthe EEG or HRV signals. Therefore, we decided tosegmenting EEG signals using 1 second window andrepresent each window by its means value (the meanvalue from each 250 samples), unlike normal downsampling, where much of the data is thrown away.For each participant’s EEG data, this process has beenrepeated for all 5 minutes slots. After windowing,the spectral analysis was performed. From each fre-quency bands of the EEG and the HRV, the mean ofthe amplitude value within the frequency range hasbeen measured, single value for each of these fre-quency band, and for each 5 minute is obtained. Then,the correlation between these frequency values is per-formed.
In order to perform correlation based on wavelettransformed EEG and/or HRV signal, the WT-Daubechies (db) Wavelet up to level 5 is performedon the signals before extracting frequency bands asmentioned in Figure 2. For the datasets we have, thelow pass filter worked very well. Therefore, we con-sidered low passed WT signals to perform the corre-lation.
Figure 2: Experiment steps for the correlation performance.
6 EXPERIMENTAL RESULTSAND DISCUSSION
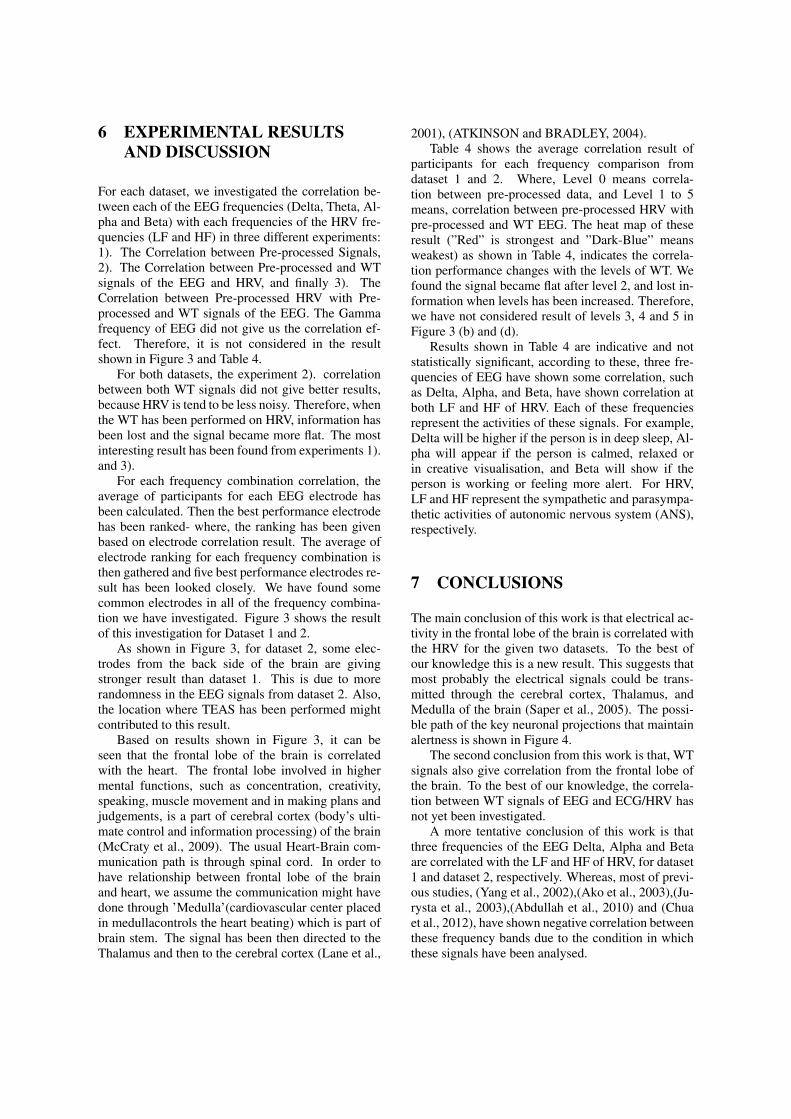
For each dataset, we investigated the correlation be-tween each of the EEG frequencies (Delta, Theta, Al-pha and Beta) with each frequencies of the HRV fre-quencies (LF and HF) in three different experiments:1). The Correlation between Pre-processed Signals,2). The Correlation between Pre-processed and WTsignals of the EEG and HRV, and finally 3). TheCorrelation between Pre-processed HRV with Pre-processed and WT signals of the EEG. The Gammafrequency of EEG did not give us the correlation ef-fect. Therefore, it is not considered in the resultshown in Figure 3 and Table 4.
For both datasets, the experiment 2). correlationbetween both WT signals did not give better results,because HRV is tend to be less noisy. Therefore, whenthe WT has been performed on HRV, information hasbeen lost and the signal became more flat. The mostinteresting result has been found from experiments 1).and 3).
For each frequency combination correlation, theaverage of participants for each EEG electrode hasbeen calculated. Then the best performance electrodehas been ranked- where, the ranking has been givenbased on electrode correlation result. The average ofelectrode ranking for each frequency combination isthen gathered and five best performance electrodes re-sult has been looked closely. We have found somecommon electrodes in all of the frequency combina-tion we have investigated. Figure 3 shows the resultof this investigation for Dataset 1 and 2.
As shown in Figure 3, for dataset 2, some elec-trodes from the back side of the brain are givingstronger result than dataset 1. This is due to morerandomness in the EEG signals from dataset 2. Also,the location where TEAS has been performed mightcontributed to this result.
Based on results shown in Figure 3, it can beseen that the frontal lobe of the brain is correlatedwith the heart. The frontal lobe involved in highermental functions, such as concentration, creativity,speaking, muscle movement and in making plans andjudgements, is a part of cerebral cortex (body’s ulti-mate control and information processing) of the brain(McCraty et al., 2009). The usual Heart-Brain com-munication path is through spinal cord. In order tohave relationship between frontal lobe of the brainand heart, we assume the communication might havedone through ’Medulla’(cardiovascular center placedin medullacontrols the heart beating) which is part ofbrain stem. The signal has been then directed to theThalamus and then to the cerebral cortex (Lane et al.,
2001), (ATKINSON and BRADLEY, 2004).Table 4 shows the average correlation result of
participants for each frequency comparison fromdataset 1 and 2. Where, Level 0 means correla-tion between pre-processed data, and Level 1 to 5means, correlation between pre-processed HRV withpre-processed and WT EEG. The heat map of theseresult (”Red” is strongest and ”Dark-Blue” meansweakest) as shown in Table 4, indicates the correla-tion performance changes with the levels of WT. Wefound the signal became flat after level 2, and lost in-formation when levels has been increased. Therefore,we have not considered result of levels 3, 4 and 5 inFigure 3 (b) and (d).
Results shown in Table 4 are indicative and notstatistically significant, according to these, three fre-quencies of EEG have shown some correlation, suchas Delta, Alpha, and Beta, have shown correlation atboth LF and HF of HRV. Each of these frequenciesrepresent the activities of these signals. For example,Delta will be higher if the person is in deep sleep, Al-pha will appear if the person is calmed, relaxed orin creative visualisation, and Beta will show if theperson is working or feeling more alert. For HRV,LF and HF represent the sympathetic and parasympa-thetic activities of autonomic nervous system (ANS),respectively.
7 CONCLUSIONS
The main conclusion of this work is that electrical ac-tivity in the frontal lobe of the brain is correlated withthe HRV for the given two datasets. To the best ofour knowledge this is a new result. This suggests thatmost probably the electrical signals could be trans-mitted through the cerebral cortex, Thalamus, andMedulla of the brain (Saper et al., 2005). The possi-ble path of the key neuronal projections that maintainalertness is shown in Figure 4.
The second conclusion from this work is that, WTsignals also give correlation from the frontal lobe ofthe brain. To the best of our knowledge, the correla-tion between WT signals of EEG and ECG/HRV hasnot yet been investigated.
A more tentative conclusion of this work is thatthree frequencies of the EEG Delta, Alpha and Betaare correlated with the LF and HF of HRV, for dataset1 and dataset 2, respectively. Whereas, most of previ-ous studies, (Yang et al., 2002),(Ako et al., 2003),(Ju-rysta et al., 2003),(Abdullah et al., 2010) and (Chuaet al., 2012), have shown negative correlation betweenthese frequency bands due to the condition in whichthese signals have been analysed.
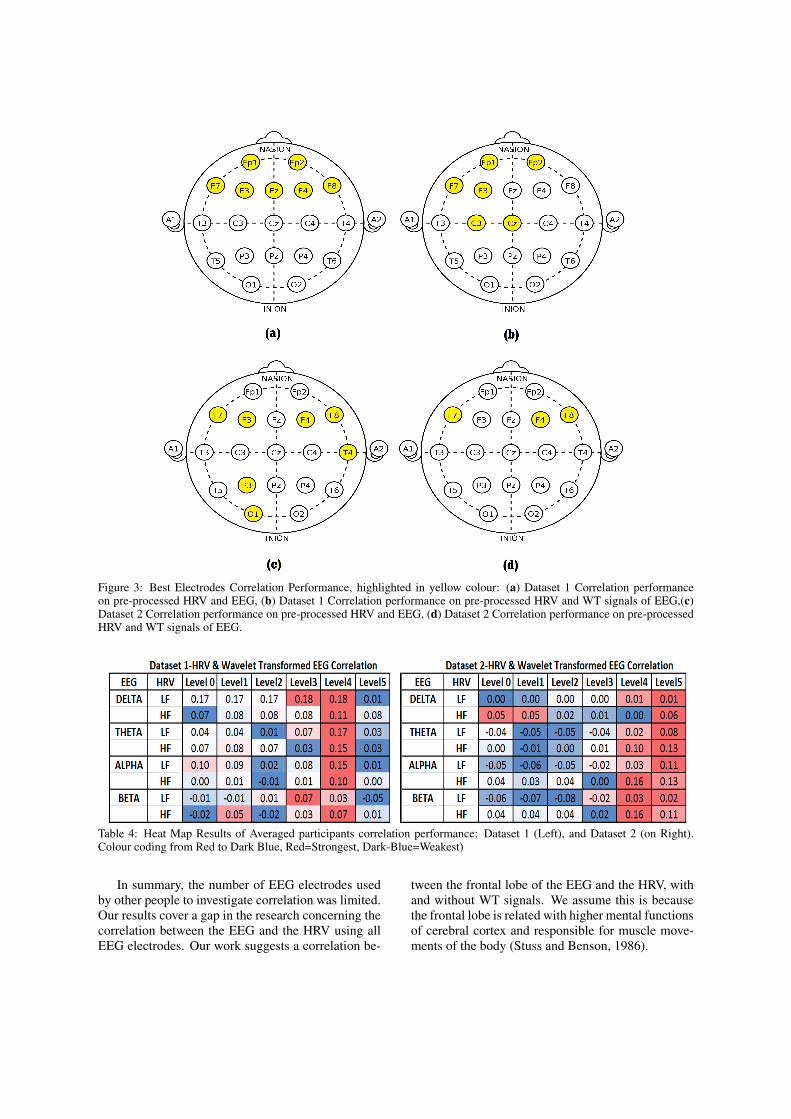
Figure 3: Best Electrodes Correlation Performance, highlighted in yellow colour: (a) Dataset 1 Correlation performanceon pre-processed HRV and EEG, (b) Dataset 1 Correlation performance on pre-processed HRV and WT signals of EEG,(c)Dataset 2 Correlation performance on pre-processed HRV and EEG, (d) Dataset 2 Correlation performance on pre-processedHRV and WT signals of EEG.
Table 4: Heat Map Results of Averaged participants correlation performance: Dataset 1 (Left), and Dataset 2 (on Right).Colour coding from Red to Dark Blue, Red=Strongest, Dark-Blue=Weakest)
In summary, the number of EEG electrodes usedby other people to investigate correlation was limited.Our results cover a gap in the research concerning thecorrelation between the EEG and the HRV using allEEG electrodes. Our work suggests a correlation be-
tween the frontal lobe of the EEG and the HRV, withand without WT signals. We assume this is becausethe frontal lobe is related with higher mental functionsof cerebral cortex and responsible for muscle move-ments of the body (Stuss and Benson, 1986).

Figure 4: Key neuronal projections that maintain alertness,and possibly the path from cardiovascular center to thefrontal lobe of the barin’s communication. The figure isobtained from (Saper et al., 2005).
REFERENCES
Abdullah, H., Holland, G., Cosic, I., and Cvetkovic, D.(2009). Correlation of sleep eeg frequency bandsand heart rate variability. In Engineering in Medicineand Biology Society, 2009. EMBC 2009. Annual Inter-national Conference of the IEEE, pages 5014–5017.IEEE.
Abdullah, H., Maddage, N. C., Cosic, I., and Cvetkovic,D. (2010). Cross-correlation of eeg frequency bandsand heart rate variability for sleep apnoea classifica-tion. Medical & biological engineering & computing,48(12):1261–1269.
Acharya, U. R., Fujita, H., Adam, M., Lih, O. S., Sudar-shan, V. K., Hong, T. J., Koh, J. E., Hagiwara, Y.,Chua, C. K., Poo, C. K., et al. (2017). Automatedcharacterization and classification of coronary arterydisease and myocardial infarction by decompositionof ecg signals: a comparative study. Information Sci-ences, 377:17–29.
Akay, M. (1997). Wavelet applications in medicine. IEEEspectrum, 34(5):50–56.
Ako, M., Kawara, T., Uchida, S., Miyazaki, S., Nishihara,K., Mukai, J., Hirao, K., Ako, J., and Okubo, Y.(2003). Correlation between electroencephalographyand heart rate variability during sleep. Psychiatry andclinical neurosciences, 57(1):59–65.
ATKINSON, M. and BRADLEY, R. T. (2004). Electro-physiological evidence of intuition: Part 2. a system-wide process? THE JOURNAL OF ALTERNATIVEAND COMPLEMENTARY MEDICINE, 10(2):325–336.
Berg, J., Neely, G., Wiklund, U., and Landstrom, U. (2005).Heart rate variability during sedentary work and sleep
in normal and sleep-deprived states. Clinical physiol-ogy and functional imaging, 25(1):51–57.
Chandra, S., Sharma, G., Sharma, M., Jha, D., and Mit-tal, A. P. (2017). Workload regulation by sudarshankriya: an eeg and ecg perspective. Brain informatics,4(1):13.
Chua, E. C.-P., Tan, W.-Q., Yeo, S.-C., Lau, P., Lee,I., Mien, I. H., Puvanendran, K., and Gooley, J. J.(2012). Heart rate variability can be used to estimatesleepiness-related decrements in psychomotor vigi-lance during total sleep deprivation. Sleep, 35(3):325–334.
Cvetkovic, D., Ubeyli, E. D., and Cosic, I. (2008). Wavelettransform feature extraction from human ppg, ecg,and eeg signal responses to elf pemf exposures: A pi-lot study. Digital signal processing, 18(5):861–874.
Daubechies, I. (1990). The wavelet transform, time-frequency localization and signal analysis. IEEEtransactions on information theory, 36(5):961–1005.
Dolatabadi, A. D., Khadem, S. E. Z., and Asl, B. M. (2017).Automated diagnosis of coronary artery disease (cad)patients using optimized svm. Computer methods andprograms in biomedicine, 138:117–126.
Ebersole, J. S. and Pedley, T. A. (2003). Current practice ofclinical electroencephalography. Lippincott Williams& Wilkins.
Edlinger, G. and Guger, C. (2006). Correlation changes ofeeg and ecg after fast cable car ascents. In Engineeringin Medicine and Biology Society, 2005. IEEE-EMBS2005. 27th Annual International Conference of the,pages 5540–5543. IEEE.
Faust, O., Acharya, U. R., Adeli, H., and Adeli, A. (2015).Wavelet-based eeg processing for computer-aidedseizure detection and epilepsy diagnosis. Seizure,26:56–64.
Han, M., Sun, L., and Hong, X. (2012). Extraction of theeeg signal feature based on echo state networks. Shengwu yi xue gong cheng xue za zhi= Journal of biomedi-cal engineering= Shengwu yixue gongchengxue zazhi,29(2):206–211.
Hyvarinen, A. and Oja, E. (2000). Independent compo-nent analysis: algorithms and applications. Neuralnetworks, 13(4):411–430.
Jurysta, F., Van De Borne, P., Migeotte, P.-F., Dumont,M., Lanquart, J.-P., Degaute, J.-P., and Linkowski, P.(2003). A study of the dynamic interactions betweensleep eeg and heart rate variability in healthy youngmen. Clinical neurophysiology, 114(11):2146–2155.
Kevric, J. and Subasi, A. (2017). Comparison of signal de-composition methods in classification of eeg signalsfor motor-imagery bci system. Biomedical Signal Pro-cessing and Control, 31:398–406.
Kim, D.-K., Lee, K.-M., Kim, J., Whang, M.-C., and Kang,S. W. (2013). Dynamic correlations between heart andbrain rhythm during autogenic meditation. Frontiersin human neuroscience, 7.
Klem, G. H., Luders, H. O., Jasper, H., Elger, C., et al.(1999). The ten-twenty electrode system of the inter-national federation. Electroencephalogr Clin Neuro-physiol, 52(3):3–6.

Kumari, P., Kumar, S., and Vaish, A. (2014). Feature ex-traction using emprical mode decomposition for bio-metric system. In Signal Propagation and ComputerTechnology (ICSPCT), 2014 International Conferenceon, pages 283–287. IEEE.
Kutlu, Y. and Kuntalp, D. (2012). Feature extraction forecg heartbeats using higher order statistics of wpdcoefficients. Computer methods and programs inbiomedicine, 105(3):257–267.
Lane, R., Reiman, E., Ahern, G., and Thayer, J. (2001).21. activity in medial prefrontal cortex correlates withvagal component of heart rate variability during emo-tion. Brain and Cognition, 47(1-2):97–100.
Lewis, N. G., McGovern, J. B., Miller, J. C., Eddy,D. R., and Forster, E. M. (1988). Eeg indices ofg-induced loss of consciousness (g-loc). Techni-cal report, SCHOOL OF AEROSPACE MEDICINEBROOKS AFB TX.
Lin, C.-W., Wang, J.-S., and Chung, P.-C. (2010). Min-ing physiological conditions from heart rate variabil-ity analysis. IEEE Computational Intelligence Maga-zine, 5(1):50–58.
Liou, L.-M., Ruge, D., Kuo, M.-C., Tsai, J.-C., Lin, C.-W., Wu, M.-N., Hsu, C.-Y., and Lai, C.-L. (2014).Functional connectivity between parietal cortex andthe cardiac autonomic system in uremics. The Kaoh-siung journal of medical sciences, 30(3):125–132.
McCraty, R., Atkinson, M., Tomasino, D., and Bradley,R. T. (2009). The coherent heart heart-brain interac-tions, psychophysiological coherence, and the emer-gence of system-wide order. Integral Review: ATransdisciplinary & Transcultural Journal for NewThought, Research, & Praxis, 5(2).
Mirsadeghi, M., Behnam, H., Shalbaf, R., and Moghadam,H. J. (2016). Characterizing awake and anesthetizedstates using a dimensionality reduction method. Jour-nal of Medical Systems, 40(1):1.
Miyashita, T., Ogawa, K., Itoh, H., Arai, Y., Ashidagawa,M., Uchiyama, M., Koide, Y., Andoh, T., and Yamada,Y. (2003). Spectral analyses of electroencephalogra-phy and heart rate variability during sleep in normalsubjects. Autonomic Neuroscience, 103(1):114–120.
Mporas, I., Tsirka, V., Zacharaki, E. I., Koutroumani-dis, M., Richardson, M., and Megalooikonomou, V.(2015). Seizure detection using eeg and ecg signalsfor computer-based monitoring, analysis and manage-ment of epileptic patients. Expert Systems with Appli-cations, 42(6):3227–3233.
Mumtaz, W., Xia, L., Yasin, M. A. M., Ali, S. S. A., andMalik, A. S. (2017). A wavelet-based technique topredict treatment outcome for major depressive disor-der. PloS one, 12(2):e0171409.
Nasehi, S. and Pourghassem, H. (2011). Real-time seizuredetection based on eeg and ecg fused features usinggabor functions. In Intelligent Computation and Bio-Medical Instrumentation (ICBMI), 2011 InternationalConference on, pages 204–207. IEEE.
Prinsloo, G. E., Rauch, H. L., Karpul, D., and Derman,W. E. (2013). The effect of a single session of shortduration heart rate variability biofeedback on eeg: a
pilot study. Applied psychophysiology and biofeed-back, 38(1):45–56.
Sakai, S., Hori, E., Umeno, K., Kitabayashi, N., Ono,T., and Nishijo, H. (2007). Specific acupunc-ture sensation correlates with eegs and autonomicchanges in human subjects. Autonomic Neuroscience,133(2):158–169.
Saper, C. B., Scammell, T. E., and Lu, J. (2005). Hypothala-mic regulation of sleep and circadian rhythms. Nature,437(7063):1257.
Stoica, P. and Moses, R. L. (1997). Introduction to spectralanalysis, volume 1. Prentice hall Upper Saddle River,NJ.
Stuss, D. T. and Benson, D. F. (1986). The frontal lobes.Raven Pr.
Sudarshan, V. K., Acharya, U. R., Oh, S. L., Adam, M.,Tan, J. H., Chua, C. K., Chua, K. P., and San Tan,R. (2017). Automated diagnosis of congestive heartfailure using dual tree complex wavelet transform andstatistical features extracted from 2s of ecg signals.Computers in Biology and Medicine, 83:48–58.
Takahashi, T., Murata, T., Hamada, T., Omori, M., Kosaka,H., Kikuchi, M., Yoshida, H., and Wada, Y. (2005).Changes in eeg and autonomic nervous activity dur-ing meditation and their association with personal-ity traits. International Journal of Psychophysiology,55(2):199–207.
Thomas, M., Das, M. K., and Ari, S. (2015). Automaticecg arrhythmia classification using dual tree complexwavelet based features. AEU-International Journal ofElectronics and Communications, 69(4):715–721.
Thomas, P. and Moni, R. (2016). Methods for improving theclassification accuracy of biomedical signals based onspectral features. Technology, 7(1):105–116.
Triggiani, A. I., Valenzano, A., Del Percio, C., Marzano,N., Soricelli, A., Petito, A., Bellomo, A., Basar, E.,Mundi, C., Cibelli, G., et al. (2016). Resting staterolandic mu rhythms are related to activity of sym-pathetic component of autonomic nervous system inhealthy humans. International Journal of Psychophys-iology, 103:79–87.
Unser, M. and Aldroubi, A. (1996). A review of waveletsin biomedical applications. Proceedings of the IEEE,84(4):626–638.
Valderrama, M., Alvarado, C., Nikolopoulos, S., Mar-tinerie, J., Adam, C., Navarro, V., and Le Van Quyen,M. (2012). Identifying an increased risk of epilepticseizures using a multi-feature eeg–ecg classification.Biomedical Signal Processing and Control, 7(3):237–244.
Yang, C. C., Lai, C.-W., Lai, H. Y., and Kuo, T. B.(2002). Relationship between electroencephalogramslow-wave magnitude and heart rate variability duringsleep in humans. Neuroscience letters, 329(2):213–216.