Embed Size (px)
Citation preview
1
Does Organizational Forgetting Affect Vendor Quality
Performance? – An Empirical Investigation Date: April 08, 2014
Anupam Agrawal
Department of Business Administration, University of Illinois at Urbana-Champaign, Champaign, Illinois 61820,
Suresh Muthulingam
Smeal College of Business, Pennsylvania State University, University Park, Pennsylvania16802,
Abstract
While previous studies have examined how the development of organizational knowledge (organizational
learning) affects quality performance, we investigate how the depreciation of organizational knowledge
(organizational forgetting) affects vendor quality performance. We use data on 2,732 quality
improvement initiatives undertaken by a car manufacturer at 295 vendors. We find that organizational
forgetting affects quality gains obtained from learning-by-doing (autonomous learning) and from
undertaking quality improvement initiatives (induced learning); over 16% of quality gains from
autonomous learning and over 13% of the quality gains from induced learning depreciate every year.
Depreciation of quality gains mainly occurs through the degradation of assimilated organizational quality
knowledge and the impact of organizational forgetting on quality is lower than what has been observed in
the literature for costs and productivity. Further, the impact of organizational forgetting i) differs across
the types of quality improvement efforts: quality gains from process improvement initiatives depreciate
while those from quality assurance initiatives do not, and ii) depends on where quality knowledge gets
embedded within vendor organizations: depreciation of quality gains is lower for knowledge embedded in
technology than for knowledge embedded in organizational routines or organizational members. We
contribute by providing insights on how organizational forgetting affects quality performance.
Keywords: Quality Management, Process Improvement, Quality Assurance, Design Quality,
Organizational Learning, Organizational Forgetting, Vendor Management
1. Introduction
Since the advent of the quality movement in the early eighties, firms have strived to ensure quality in their
manufacturing operations. The emphasis on quality has continued with the increased outsourcing of man-
ufacturing activities, and many firms focus on ensuring quality in their supply chains. However in the re-
cent past, despite the focus on quality management, many firms have faced quality issues in their supply
chains. Some high profile examples include, Johnson and Johnson’s (JNJ) recall of infant medicines in
2010 due to chemical contamination from wooden pallets used by vendors (Singer and Abelson 2011) and
Mattel’s recall of toys in 2007 because of excessive lead in toys manufactured by vendors (Lee et al.
2008). Additionally, the respective firms faced significant financial consequences: JNJ’s 2010 revenues
2
fell by $290 million and Mattel incurred financial costs of around $110 million. What is intriguing about
these examples is that quality problems occurred even though specific measures were undertaken by the
firms to avoid such issues. For instance, after the recall in 2010, JNJ undertook a number of actions in its
infectious disease business to avoid chemical contamination. However, in 2011, JNJ initiated another re-
call after it found similar chemical contaminants in the medicines manufactured by vendors for the infec-
tious disease business (Johnson & Johnson 2011). Similarly, Mattel had implemented specific measures at
its vendors (Early Light and Lee Der) to avoid the use of lead-based paint, and yet recalls were initiated
due to excessive lead paint in toys manufactured by the same vendors (Sodhi and Tang 2012). These ex-
amples suggest that sometimes efforts to improve quality performance of vendors may not be effective.
This may be because vendors find it challenging to learn and develop quality knowledge required to ad-
dress quality issues, or because the quality knowledge developed by vendors depreciates over time. Con-
sequently, to ensure quality performance in supply chains it is essential to study how quality knowledge is
built, sustained, or depreciated within supply chains, and these issues form the core of our research. A
significant body of work has examined how organizational quality knowledge gets built through organiza-
tional learning (e.g., Lapré et al. 2000, Ittner et al. 2001), however not much work has examined whether
organizational quality knowledge depreciates. In manufacturing firms a variety of factors, such as product
changes, amendments to routines, member turnover or equipment wear and tear, can depreciate organiza-
tional knowledge. The literature refers to this depreciation of organizational knowledge as organizational
forgetting (Benkard 2000, Argote 2013), and several scholars have suggested that organizational forget-
ting may affect quality performance (Li and Rajagopalan 1998, Lapré et al. 2000). In line with this litera-
ture, we investigate how organizational forgetting affects quality performance and examine potential con-
tingencies that influence the impact of organizational forgetting on quality.
This study uses data from AMC (a large automotive manufacturer in Asia, who requested confidenti-
ality). In 2006, AMC initiated a program to improve the quality of incoming components for its car divi-
sion. Over the next four years, a team of engineers from AMC worked collaboratively with their vendors
to implement 2,732 quality improvement initiatives at vendor facilities. Table 1 provides select examples
of quality improvement initiatives implemented at vendors. In this period, we interacted closely with
AMC and its vendors, which allowed us to recognize several nuances associated with improving vendor
quality performance. To illustrate this, we refer to Figure 1, which shows the quality performance of a
sheet metal stamping vendor. We observe that quality performance improves over time, albeit with some
variation. In an interview, a manager at the vendor stated, “Initially when we started, we had quality prob-
lems, but as our workers became more familiar with producing parts with tighter tolerances for AMC, our
quality levels improved.” This quote suggests that quality knowledge gets built as vendors gain experi-
3
ence. In Figure 1, we also notice periods when quality performance depreciates. An AMC engineer ex-
plained, “Sometimes people resign, key personnel go on leave, new apprentices ignore processes, or raw
material suppliers change, and the vendor quality may deteriorate!” This quote suggests that vendor quali-
ty knowledge may erode over time. The data from the quality improvement program of AMC enables us
to examine how organizational learning and organizational forgetting affect vendor quality performance.
The literature has identified two mechanisms of organizational learning that facilitate quality im-
provement. Firms can improve their quality either by performing the same task repeatedly (this learning
from production experience is known as autonomous learning), or by undertaking conscious actions to
improve quality (this learning through quality improvement experience is known as induced learning).
The underlying assumption in these mechanisms is that quality gains from each unit of production and
each quality improvement initiative are retained over time. However, several studies have shown that cost
reductions or productivity gains obtained from autonomous learning depreciate over time (e.g., Darr et al.
1995, Benkard 2000). In some manufacturing firms, over 90% of the cost reduction or productivity gains
obtained from production experience depreciate within a year (Argote et al.1990, Epple et al. 1996).
While the literature has examined the depreciation of organizational knowledge gained from autonomous
learning, the depreciation of organizational knowledge gained from induced learning has remained rela-
tively unexplored. One may assume that the research findings based on cost or productivity measures may
also apply to the quality domain; however Levin (2000) provides evidence to the contrary. In the context
of product reliability he finds that learning does not depend on production experience but depends on
elapsed time. Moreover, Levin (2000) indicates that organizational performance cannot be restricted to a
single construct such as cost or productivity and that quality also constitutes an important dimension of
organizational performance. Therefore, we investigate how organizational forgetting affects quality per-
formance (measured in terms of defect rates) achieved through autonomous and induced learning.
We find that organizational forgetting has a lower effect on quality than what has been observed in
the literature for cost and productivity; however the effect is still significant as 16.08% of quality gains
from autonomous learning and 13.17% of quality gains from induced learning depreciate every year. We
also delve deeper to investigate how different modes of organizational forgetting affect the retention of
organizational quality knowledge. De Holan and Phillips (2004) suggest that organizational knowledge
can depreciate unintentionally because of organizational failure to consolidate and assimilate new
knowledge (this is called dissipation) or because of organizational inability to maintain acquired
knowledge over time (this is called degradation). In our context, degradation mainly contributes to the
depreciation of organizational quality knowledge developed from autonomous and induced learning.
4
We then investigate two potential contingencies that influence how organizational forgetting affects
quality. First, we examine how the quality gains obtained from different types of quality improvement
initiatives are affected by organizational forgetting. We leverage Li and Rajagopalan (1998) to identify
whether the quality improvement initiatives in our data pertain to quality assurance, process improve-
ment, or design quality; and find that gains from quality assurance initiatives do not depreciate, while
those from process improvement initiatives depreciate by over 14% every year. Second, we examine
whether organizational forgetting is governed by where quality knowledge gets embedded within vendor
organizations. In our setting, quality improvement initiatives could develop quality knowledge by focus-
ing on technology, routines, or organizational members. Consistent with the literature which finds that
individuals are a precarious resource to retain organizational knowledge (Argote 2013, Narayanan et al.
2009, David and Brachet 2011); we find that depreciation of organizational knowledge is highest when it
is embedded in organizational members (26.02%). In contrast, depreciation of organizational knowledge
when it is embedded in routines (14.22%) or in technology (8.86%) is significantly lower.
Our paper makes several contributions to the Operations Management (OM) literature. First, we ex-
plicitly examine how organizational forgetting affects quality and are one of the first in OM to do so.
Second, we are the first to demonstrate the impact of organizational forgetting for induced learning. Addi-
tionally, we show that organizational forgetting has a lower impact on quality than what has been ob-
served in the context of costs or productivity. Third, by examining the impact of organizational forgetting
on different types of quality improvement initiatives, we extend the findings from the quality manage-
ment literature. Fourth, by investigating whether organizational forgetting affects quality knowledge em-
bedded in technology, we validate underlying assumptions in the organizational forgetting literature. Our
study is also relevant for practice as it provides insights on managing quality in supply chains.
The rest of the paper is organized as follows. In Section 2, we develop our hypotheses. In Section 3,
we describe the data and the measures used in our analysis. In Section 4, we discuss our methodology. In
Section 5, we present our results. In Section 6, we discuss the implications of our findings, limitations of
our work and suggest directions for future research.
2. Hypotheses
To develop our hypotheses, we draw on the learning literature to understand how organizational
knowledge gets built and then examine how organizational knowledge can depreciate.
2.1 Development of Quality Knowledge
Organizational learning refers to the concept that as organizations gain experience they develop
knowledge which enables them to become better at performing tasks. Wright (1936) was the first to doc-
ument organizational learning, when he observed that unit costs in air-frame production declined with
5
cumulative output. Similar observations have been made across a wide cross section of industries includ-
ing shipbuilding (Argote et al. 1990), electronics (Adler and Clark 1991), fast food franchises (Darr et al.
1995) and professional services (Boone et al. 2008). The idea that organizational learning can be
achieved by performing tasks repeatedly (autonomous learning) and by conscious efforts (induced learn-
ing) was first suggested by Levy (1965) and developed further by Dutton and Thomas (1984). This litera-
ture highlights that as organizations gain experience they learn and develop knowledge which enables
them to raise productivity or lower costs because of the following three broad factors: increased profi-
ciencies of organizational members, improvement in organizational structure and routines, and improve-
ments in organizational technology (Argote 2013). Similarly, a link between organizational learning and
quality performance has also been established (e.g., Fine 1986, Dada and Marcellus 1994). Li and Ra-
jagoplan (1998) use a theoretical model to show that quality levels improve with cumulative production
experience (autonomous learning) and cumulative investment in quality improvement efforts (induced
learning). Aligned with this body of work, several empirical studies have shown that both autonomous
and induced learning improve quality performance in a variety of settings, such as continuous manufac-
turing (Lapré et al. 2000), discrete manufacturing (Ittner et al. 2001) and healthcare (Nembhard and
Tucker 2011).
2.2 Depreciation of Quality Knowledge
An inherent assumption in the models that link organizational learning to quality performance is that
gains from organizational knowledge developed with experience do not depreciate over time. However,
the literature indicates that organizational knowledge may depreciate because of three broad reasons.
First, gains realized through the enhanced proficiency of organizational members may depreciate because
of member turnover or transfers (Huber 1991, Narayanan et al. 2009, Argote 2013). This is because indi-
viduals often capture subtle nuances of performing tasks which are difficult to transfer and which may get
lost when individuals no longer perform the tasks. Moreover, research shows that organizational
knowledge embedded in individuals can depreciate even in the absence of turnover (Weldon and
Bellinger 1997, David and Brachet 2011). Second, gains obtained from improvements in structures and
routines may depreciate because of modifications to processes and amendments to routines (Argote and
Epple 1990, Argote 2013). For instance, Cohen and Bacdayan (1994) demonstrate (using experiments)
that novelties in processes affect the effectiveness of routines. Third, gains from improvements in tech-
nology may depreciate because of changes to the products, changes to the underlying technology, or wear
and tear of equipment (Argote and Epple 1990, Argote 2013).
2.2.1 Depreciation of Quality Knowledge Developed from Production Experience

6
Several empirical studies find that cost reductions or productivity gains obtained from organizational
knowledge developed through production experience depreciate over time (e.g., Darr et al. 1995, Epple et
al. 1996, Benkard 2000). In line with this literature which indicates that organizational knowledge can
depreciate, we expect that quality gains obtained from organizational knowledge developed through pro-
duction experience will also depreciate over time.
2.2.2 Depreciation of Quality Knowledge Developed from Quality Improvement Experience
To investigate depreciation of quality knowledge developed from quality improvement experience, we
draw on Lapré et al. (2000), who point out that quality improvement initiatives must develop knowledge
about cause-effect relationships and validate solutions to effectively address quality issues. Typically,
knowledge developed through such initiatives is elaborate and is built into processes, routines, or equip-
ment. However, given the dynamic nature of the production environment at vendor facilities, processes
and routines are likely to undergo changes and production equipment are likely to deteriorate, which may
lead to the depreciation of quality knowledge developed from quality improvement efforts.
Additionally, several studies find significant depreciation of organizational knowledge in manufactur-
ing firms (e.g., Epple et al. 1996, Benkard 2000), which suggests that firms find it challenging to mitigate
depreciation of organizational knowledge within their operations. AMC deals with 295 vendors spread
across many industries, which will make it more challenging to mitigate depreciation of organizational
knowledge at vendor facilities. Therefore, we hypothesize:
Hypothesis 1a: Depreciation of organizational knowledge developed from production experience over
time will reduce the effect of autonomous learning on vendor quality performance.
Hypothesis 1b: Depreciation of organizational knowledge developed from quality improvement
experience over time will reduce the effect of induced learning on vendor quality performance.
We refer to de Holan and Phillips (2004) to investigate how different modes of organizational forget-
ting affect the retention of organizational quality knowledge. They identify four modes of organizational
forgetting: 1) dissipation, 2) degradation, 3) purging and 4) suspension. Dissipation and degradation con-
form to the accidental mode of organizational forgetting where organizations are unable to retain essential
knowledge due to faulty or inadequate memory systems. Dissipation occurs when organizations fail to
consolidate and assimilate new knowledge in the organizational memory systems. It signifies the state
where organizations acquire knowledge to perform tasks but the knowledge is unstable and deteriorates
rapidly. Degradation refers to the knowledge depreciation that happens after satisfactory performance has
been achieved. It represents the state where organizations acquire knowledge to achieve acceptable per-
formance; however over time they fail to maintain knowledge and organizational performance deterio-
rates. In contrast, purging and suspension correspond to the purposeful mode of organizational forgetting.
7
Purging represents situations where organizations ‘unlearn’ old ways of doing things as part of the efforts
to learn something new. As a complement to organizational learning, purging is considered desirable as it
involves casting aside old methods in a bid to adopt new essential processes (Bettis and Prahalad 1995).
Suspension refers to the state when organizations fail to adopt or entertain new innovations or practices.
In our context, as SIU engineers worked collaboratively with vendors to develop solutions to quality
issues, vendors are likely to adopt the quality improvement solutions and therefore suspension is not rele-
vant. With the adoption of quality improvement solutions, vendors are likely to develop quality
knowledge leading to improved quality performance. This implies that vendors ‘unlearn’ processes that
cause quality issues and provides indirect support for the presence of purging. Moreover, as quality im-
provement initiatives typically have well laid out procedures and are supported with equipment and tools
we expect vendors to consolidate the quality knowledge within their organizations. Thus, we do not antic-
ipate quality knowledge to be unstable, and do not expect vendors to lose organizational quality
knowledge rapidly, or in other words we do not expect to find evidence for dissipation. Finally, on ac-
count of the dynamic production environment at vendor facilities the organizational quality knowledge
consolidated through quality improvement initiatives is likely to depreciate over time which indicates the
presence of degradation. Based on the above discussion, we hypothesize:
Hypothesis 2: Organizational forgetting will manifest in different modes to affect the retention of organi-
zational quality knowledge at vendors: Quality knowledge will depreciate due to degradation and will not
be affected by dissipation, while purging will support the development of quality knowledge.
In the next two hypotheses, we investigate potential contingencies that influence how organizational
forgetting affects quality performance. First, we examine how organizational forgetting affects quality
gains obtained from the different types of quality improvement initiatives. Li and Rajagopalan (1998)
point out that quality performance improves as a result of efforts in quality assurance, process improve-
ment and design quality. This is because quality assurance efforts identify and remove defective products,
process improvement efforts ensure that defective products are not produced, and design quality efforts
make parts easier to manufacture or design products that do not need inspection.
To evaluate the impact of organizational forgetting, we turn to the literature on knowledge retention
within organizations. This literature suggests that knowledge is assimilated and retained within organiza-
tions when it can be incorporated into processes (Argote and Miron-Spektor 2011), codified (Zander and
Kogut 1995), or embedded in technology (Epple et al. 1996). Our setting involves quality assurance initi-
atives that are incorporated into processes (e.g., check hole position using inspection pin, as in example 2
in Table 1), codified (e.g., a sampling plan, as in example 4 in Table 1), and embedded in technology
(e.g., inspection gauges, as in example 3 in Table 1). Additionally, quality assurance initiatives involve
8
clearly laid out procedures (e.g., accept components if they conform to inspection gauges, as in examples
1 and 3 in Table 1) and therefore we expect the gains from quality assurance initiatives to be better re-
tained at vendors.
In our context, process improvement initiatives also exhibit features similar to quality assurance initi-
atives that facilitate retention of quality gains. For instance, such improvement initiatives can be incorpo-
rated into processes (e.g., change of balancing sequence, as in example 9 in Table 1) and embedded in
technology (e.g., poka-yoke, as in example 6 in Table 1). However, unlike quality assurance initiatives
that involve clearly laid out procedures, process improvement initiatives can involve some elements of
knowledge that are not clearly articulated and are therefore more susceptible to depreciation (Argote
2013). For instance, in example 7 in Table 1 — to ensure correct chamfering of gears — operators must
fully butt the components against the cup locator before clamping them for chamfering. Additionally,
process improvement initiatives are often integrated into production processes and may be subject to wear
and tear involved with regular production. For instance, in example 8 in Table 1, the sealant applicator in
the automated rotary fixture is made of softer material than the solenoid and needs to be replaced periodi-
cally to ensure proper sealant application. Consequently, quality gains from process improvement initia-
tives can erode due to the depreciation of knowledge that may not be clearly articulated and due to depre-
ciation from regular operations.
With regard to design quality initiatives, the literature finds mixed evidence. Ishikawa (1985, p 85-88)
illustrates that design changes which address a symptom may avoid quality problems temporarily, and
points out that only changes that address the fundamental causes can completely resolve quality issues.
Adler and Clark (1991) find that engineering changes undertaken to improve product conformance can
have a disruptive effect on learning, while changes undertaken to improve production can facilitate learn-
ing. Similarly Lapré et al. (2000) find that design quality projects with high conceptual but low operation-
al learning disrupt learning, while projects with high conceptual and high operational learning enhance
learning. Therefore, quality gains from design quality initiatives can depreciate because they do not ad-
dress the fundamental cause, they disrupt learning, or they have inadequate conceptual and operational
learning. Based on the above discussion, we infer that quality gains from quality assurance initiatives will
be better retained at vendors while quality gains from process improvement and design quality initiatives
may depreciate over time. Therefore, we hypothesize:
Hypothesis 3: Quality gains from cumulative quality assurance initiatives will depreciate less over time
than quality gains from cumulative process improvement or cumulative design quality initiatives.
We now examine the impact of where the quality knowledge gets embedded within vendor organiza-
tions. Towards this end, we refer to the characterization of knowledge as explicit or tacit knowledge. Ex-
9
plicit knowledge refers to knowledge that is precisely formulated and articulated, while tacit knowledge
represents knowledge that is subconsciously understood or applied and difficult to articulate (Polanyi
1966, Nonaka 1994, Nonaka and van Krogh 2009). Explicit knowledge is amenable to codification. This
is because knowledge can be precisely formulated and articulated only if there is an understanding of the
underlying mechanisms that link the actions required to perform a task with the performance outcomes
produced by the task (Zollo and Winter 2002). Technology can serve as an effective repository of codi-
fied knowledge, as it allows for knowledge to be embedded in equipment to ensure tasks achieve desired
outcomes (Zack 1999, Cross and Baird 2000, Nonaka and van Krogh 2009) and as it can serve as a reser-
voir for storage, retrieval and reuse of knowledge (Cross and Baird 2000, Argote 2013).
Several studies on organizational forgetting observe that knowledge embedded in technology is re-
sistant to depreciation. Argote (2013, p. 105) synthesizes the empirical evidence and states, “… the de-
preciation rates observed across a variety of settings are consistent with the hypothesis that embedding
knowledge in technology is an effective way to mitigate its depreciation.” Consequently, we expect that
organizational quality knowledge developed from quality improvement initiatives that focus on technolo-
gy will be resistant to depreciation.
Nelson and Winter (1982) identified routines as repetitive patterns within the schemata of an organi-
zation. Organizational routines can serve as an effective means to retain explicit knowledge because they
establish stabilized patterns of behavior in response to specific stimuli (Zollo and Winter 2002). While the
literature suggests that routines are effective in maintaining organizational knowledge, it also finds that
novelties introduced in processes can affect knowledge retained through routines (Cohen and Bacdayan
1994). Feldman and Pentland (2003) point out that routines have two aspects: the ostensive aspect pro-
vides repetitive and stable component of routines, while the performative aspect of routines provides vari-
ation and flexibility in the organization. The performative aspect of routines is less codifiable and pro-
vides room for improvisation by agents. Even the same routine performed by the same organizational
agent repeatedly over time is susceptible to improvisation or adaptation and this can affect knowledge
held within the routine. Additionally, in business environments that undergo change, persisting with exist-
ing routines can render knowledge obsolete (Zollo and Winter 2002). Thus, some of the quality
knowledge obtained from quality improvement initiatives that focus on routines can deteriorate over time.
Organizational members represent effective repositories to acquire and store tacit knowledge within
organizations because individuals can capture subtle nuances of performing tasks which may be difficult
to articulate. However, organizational knowledge embedded within organizational members is likely to
depreciate because of turnover and transfers and because individuals may forget even when there is no
turnover (Weldon and Bellinger 1997, Narayanan et al. 2009, David and Brachet 2011). Additionally,
10
organizational knowledge stored in organizational members is expected to decay faster than knowledge
stored in organizational routines (Cohen and Bacdayan 1994). Based on the above discussion, we hypoth-
esize:
Hypothesis 4: Quality improvement initiatives that focus on technology will exhibit the lowest
depreciation of organizational quality knowledge, followed by quality improvement initiatives that focus
on routines and quality improvement initiatives that focus on organizational members.
3. Data and Measures
3.1 Data Used for the Analysis
In 2006, AMC created a division called ‘Supplier Improvement Unit’ (SIU, from now onwards) to spear-
head the efforts to improve the quality of components supplied by their vendors. The SIU comprised 20
engineers, drawn from the existing employees of AMC, who worked collaboratively with its 295 vendors.
AMC typically provides product design specifications to vendors, who in turn manufacture the products,
inspect and ship them to meet AMC’s requirements. The overall quality of products supplied by vendors
is evaluated by AMC using a comprehensive assessment process within AMC’s operations. This includes
incoming inspection, in-process evaluation and final product testing. The assessment of vendor quality
forms the basis for the quality improvement initiatives that are identified as a result of joint problem-
solving efforts between SIU engineers and the vendors. From 2006 to 2009, 2,732 quality improvement
initiatives were implemented at vendor facilities and the average quality of components supplied to AMC
improved by nearly 25%, as shown in Figure 2. We collected the data on all 2,732 quality improvement
initiatives as well as the data on the monthly vendor-level quality for this period. We supplemented the
data with multiple visits to AMC and its suppliers. We spent over 17 weeks at AMC and its suppliers and
conducted 43 semi-structured interviews with senior managers and engineers of AMC and its suppliers.
This facilitated a deep understanding of the quality improvements efforts undertaken at vendor facilities.
3.2 Measures Used for the Analysis
To investigate organizational forgetting, we start by establishing that vendors develop knowledge to ad-
dress quality issues. To do this, we leverage the literature on organizational learning (e.g. Benkard 2000,
Argote 2013) which maintains that knowledge is developed with experience and indicates that when ex-
perience affects organizational performance it indicates the presence of learning. Then, we establish that
knowledge developed at the vendors depreciates. To do this, we leverage the literature on organizational
forgetting (e.g. Epple et al. 1996, Benkard 2000, Boone et al. 2008) which infers that organizational
knowledge depreciates when the impact of experience on organizational performance outcomes decays
over time. Consequently, the main variables used in our analysis pertain to measures of organizational

11
quality performance and measures of organizational experience. We describe these variables and the addi-
tional controls used in our analysis below, and defer the details of how we assess the depreciation of or-
ganizational knowledge to Section 4.1.
3.2.1 Dependent Variable
Defect Rate – We measure vendor quality performance using monthly defect rates. Defect rate (𝑌𝑖𝑡) for
vendor i in period t is the defective parts per million (ppm) received at AMC. For a given period it is cal-
culated as ∑ 𝑁𝑢𝑚𝑏𝑒𝑟 𝑜𝑓 𝐷𝑒𝑓𝑒𝑐𝑡𝑖𝑣𝑒 𝑃𝑎𝑟𝑡𝑠𝑗
𝑛𝑗=1
∑ 𝑇𝑜𝑡𝑎𝑙 𝑃𝑎𝑟𝑡𝑠 𝑆𝑢𝑝𝑝𝑙𝑖𝑒𝑑𝑗𝑛𝑗=1
× 106, where n represents the number of distinct components
supplied by the vendor. Our measure of defect rates is consistent with the approach adopted in the litera-
ture (e.g., Ittner et al. 2001). Moreover, AMC has used this measure to evaluate quality performance of
vendors over the course of our study.
3.2.2 Independent Variables for Hypotheses 1a and 1b
We use the following lagged measures of experience to evaluate our hypotheses:
Lagged Cumulative Production Experience – To capture the effect of autonomous learning we use pro-
duction experience measured as 𝑃𝑖(𝑡−1) = ∑ 𝑝𝑖𝑡𝑡−1𝑡=0 , where 𝑝𝑖𝑡 is the number of units (in 100,000) sup-
plied by vendor i in period t. The start of our time series coincides with the introduction of the quality im-
provement program, and therefore we assume that 𝑝𝑖0 = 0. As we do not observe the complete history of
production experience, we use the exponential form of the learning curve in our analysis. This is because,
as Lapré and Tsikriktsis (2006) state “…for the exponential form (of the learning curve), accounting for
prior experience is a nonissue—omission of prior experience will not bias learning-rate estimates.” In the
exponential form of the learning curve the rate of improvement for a process depends on the gap between
the current performance and the ideal performance of the process. The main challenge in using the expo-
nential form is to determine the ideal performance of the process. However, the quality domain provides a
natural target for the aspirational ideal for a process i.e. zero defects (Lapré et al. 200). Additionally,
when information on prior experience was unavailable, scholars have used the exponential form of the
learning curve to examine quality related outcomes in many settings, such as waste reduction (Lapré et al.
2000), complaint rates (Lapré and Tsikriktsis 2006), and surgical mortality (KC and Staats 2012).
Lagged Cumulative Quality Improvement Experience– To capture the effect of induced learning we use
quality-improvement experience measured as 𝑄𝑖(𝑡−1) = ∑ 𝑞𝑖𝑡𝑡−1𝑡=0 , where 𝑞𝑖𝑡 is the number of quality im-
provement initiatives done at vendor i in period t. This is in line with Lapré et al. (2000) and Nembhard
and Tucker (2011), who use similar count based measures to capture the impact of induced learning.
3.2.3 Independent Variables for Hypothesis 2
12
We modify the experience variables used for hypotheses 1a and 1b to identify ‘new’ and ‘old’ compo-
nents of experience. We define ‘new’ experience as the experience gained in the last ‘h’ months and ‘old’
experience as the cumulative experience gained prior to the last ‘h’ months. (The details of how we iden-
tify the appropriate number of months ‘h’ to be considered for recent experience are provided later in Sec-
tion 4.2.) This allows us to split our measures of production 𝑃𝑖𝑡 and quality-improvement 𝑄𝑖𝑡 experience
to create the variables to evaluate our hypothesis on the different modes of organizational forgetting:
‘New’ Cumulative Production Experience – This represents recent production experience and is measured
as 𝑃𝑖(𝑡−1)_𝑛𝑒𝑤 = ∑ 𝑝𝑖𝑘𝑘=𝑡−1𝑘=𝑡−ℎ−1 .
‘Old’ Cumulative Production Experience – This represents production experience gained in the past and
is measured as 𝑃𝑖(𝑡−1)_𝑜𝑙𝑑 = ∑ 𝑝𝑖𝑘𝑘=𝑡−ℎ−2𝑘=0 .
‘New’ Cumulative Quality Improvement Experience (𝑄𝑖(𝑡−1)_𝑛𝑒𝑤) and ‘Old’ Cumulative Quality Im-
provement Experience (𝑄𝑖(𝑡−1)_𝑜𝑙𝑑) are defined similarly.
3.2.4 Independent Variables for Hypothesis 3
We classified the 2,732 quality improvement initiatives in our research into one of the three types of qual-
ity improvement initiatives based on whether they relate to 1) Quality Assurance, 2) Process Improve-
ment or 3) Design Quality. Quality improvement initiatives were classified as ‘Quality Assurance’ if they
addressed quality issues by introducing or modifying inspection procedures at vendor facilities, as illus-
trated in examples 1 through 5 in Table 1. Initiatives were classified as ‘Process Improvement’ if they
addressed the quality issues mainly by changes or modifications to the production processes at the vendor
facilities, as illustrated in examples 6 through 12 in Table 1. Initiatives were classified as ‘Design Quality’
if they involved changes or modifications to the design of components manufactured by vendors, as illus-
trated in examples 13 and 14 in Table 1. The classification was done by 20 engineers of the SIU and then
the production and quality chiefs at AMC validated the classifications independently. The kappa statistic
of inter-rater agreement between these two raters is 0.78, which is high; Landis and Koch (1977) suggest
that scores between 0.61 and 0.80 represent substantial agreement. If there were differences in the classi-
fication, then they were resolved jointly by the two chiefs. Overall, there are 458, 2,025, and 249 quality
improvement initiatives that relate to quality assurance, process improvement, and design quality respec-
tively. We use this classification to decompose our measure for induced learning 𝑄𝑖𝑡 into three compo-
nents to form the independent variables to evaluate Hypothesis 3:
Lagged Cumulative Quality Assurance – This is the number of ‘Quality Assurance’ initiatives undertaken
at a vendor. It is calculated as 𝑆𝑖(𝑡−1) = ∑ 𝑠𝑖𝑡,𝑡−1
𝑡=0 where 𝑠𝑖𝑡 is the number of ‘Quality Assurance’ initia-
tives done at vendor i in period t.
13
‘Lagged Cumulative Process Improvement (𝑅𝑖(𝑡−1))’ and ‘Lagged Cumulative Design Quality (𝐷𝑖(𝑡−1))’
– These are defined analogously.
3.2.5 Independent Variables to Evaluate Hypothesis 4
To evaluate Hypothesis 4, we identify quality improvement initiatives that mainly focus on technology,
routines and organizational members. Quality improvement initiatives were classified as ‘Technology
Solutions’ if they addressed the quality issues mainly by introduction of new equipment or modifications
to existing equipment or processes, as illustrated in examples 1, 2, 3, 6, 7, 8, 13 and 14 in Table 1. In line
with Nelson and Winter (1982), initiatives that sought to improve quality performance by changes to re-
petitive patterns of work or by introduction of repetitive activity at vendors, as in examples 4, 5, 9, and 10
in Table 1, were identified as ‘Routines Solutions’. Initiatives which mainly addressed quality issues by
developing operator skills (via training and monitoring), as illustrated in examples 11 and 12 in Table 1,
were identified as ‘Operator Solutions’. To do the classification, the vendor development and quality
chiefs at AMC jointly identified three examples each of quality improvement initiatives that could be
classified as ‘Technology Solutions’, ‘Routines Solutions’ and ‘Operator Solutions’. These examples
served as the basis on which 6 SIU engineers undertook the classification for the 2,732 quality improve-
ment initiatives. The resulting classification was validated independently by the vendor development and
quality chiefs at AMC. The kappa statistic of inter-rater agreement between these two raters is 0.72,
which indicates substantial agreement (Landis and Koch 1977). Differences in the classification were
resolved jointly by the two chiefs. In our data, 1,353, 1,067, and 312 quality improvement initiatives were
classified as ‘Technology Solutions’, ‘Routines Solutions’, and ‘Operator Solutions’ respectively. This
classification enables us to decompose our measure for induced learning 𝑄𝑖𝑡 into three components that
form the independent variables we use to evaluate Hypothesis 4:
Lagged Cumulative Technology Solutions– This is the number of ‘Technology Solutions’ initiatives un-
dertaken at a vendor. It is calculated as 𝑇𝑆𝑖(𝑡−1) = ∑ 𝑡𝑠𝑖𝑡,𝑡−1
𝑡=0 where 𝑡𝑠𝑖𝑡 is the number of ‘Technology
Solutions’ implemented at vendor i in period t.
The variables ‘Lagged Cumulative Routines Solutions (𝑅𝑆𝑖(𝑡−1))’ and ‘Lagged Cumulative Operator So-
lutions (𝑂𝑆𝑖(𝑡−1))’ are defined analogously.
3.2.6 Controls
Vendor Fixed Effects – We use vendor-level fixed effects in all our analyses. Given that vendors supply
components that belong to one type of technology/industry (such as electrical components, forgings, sheet
metal, etc.), vendor fixed effects control for time-invariant factors such as technology and industry types.
Additionally, many vendor-specific factors such as (i) the starting quality performance of vendors when
the SIU was created, (ii) the size of the vendor, (iii) the degree of collaboration between the vendors and
14
AMC, (iv) the relative bargaining power between a vendor and AMC, and (v) the geographic distance of
the vendor from AMC’s facilities (to name a few) can influence quality performance. Vendor fixed ef-
fects also control for these vendor-specific time-invariant supply chain related factors. Furthermore, dur-
ing the course of our study, only one SIU engineer worked with a specific vendor, and therefore the ven-
dor-level fixed effects also control for the specific engineer. Note that the fixed effects controls in our
panel dataset allow for arbitrary correlation between the unobserved time-invariant vendor-level charac-
teristics and the observed explanatory variables 𝑃𝑖𝑡 and 𝑄𝑖𝑡 (Wooldridge 2002, p 286).
Product Mix and Model Change– From 2006 to 2009 AMC manufactured between two to four car mod-
els every month. During this time there were three model changes. Therefore, we include indicators to
account for the changes in product mix and model changes, in line with Thompson (2007).
Time Fixed Effects – Monthly fixed effects control for factors that change over time, such as technology.
Tables 2 and 3 provide the descriptive statistics and correlations for our data.
4. Methodology
We verify the impact of autonomous and induced learning on quality performance and then evaluate how
organizational forgetting affects quality performance. The analyses were done with STATA (version 13).
4.1 Models to Evaluate Organizational Learning and Organizational Forgetting We use econometric models that relate quality performance to the drivers of organizational learning: au-
tonomous learning is linked to cumulative production volume, and induced learning is linked to cumula-
tive quality improvement initiatives. The underlying assumption in our models is that vendors develop
knowledge that enables them to improve their quality performance. Following Li and Rajagopalan (1998),
we assume that such knowledge is gained through production experience or quality improvement experi-
ence. We represent the knowledge stock 𝐾 for a vendor by:
𝐾 = 𝛼1𝑃 + 𝛼2𝑄 (1)
where 𝑃 and 𝑄 represent production and quality improvement experience. We depict the defect rate of a
vendor 𝑌(𝐾), as a function of the knowledge stock. We assume that the vendors and AMC (through the
SIU engineers) work to achieve a target rate for defects (𝑌∗). Consequently, as Lapré et al. (2000) sug-
gest, the vendors and AMC will exert effort to reduce the performance gap between their current defect
rate and the target rate. If 𝜇 denotes the learning rate, then the rate of defect reduction can be represented
by the differential equation:
𝑑𝑌(𝐾)
𝑑𝐾= 𝜇[𝑌(𝐾) − 𝑌∗] (2)
15
In line with the larger body of TQM literature (e.g. Deming 1986), we assume that the optimal target
rate for defects (𝑌∗) is zero defects. This assumption also aligns with AMC and its vendors because their
target is zero defects. The solution to the differential equation (2) gives:
𝑌(𝐾) = exp (𝛼 + 𝜇𝐾) (3)
which links quality performance to the knowledge stock. Note that (3) represents the exponential form of
the learning curve, in line with Levy (1965) and Lapré et al. (2000). Using (1) and (3) we write:
𝑙𝑛(𝑌𝑖𝑡) = 𝛼𝑖 + 𝛽𝑃𝑃𝑖(𝑡−1) + 𝛾𝑄𝑄𝑖(𝑡−1) + 𝜂𝑖𝑉𝑖 + 𝜙𝑖𝑀𝑡 + 𝜓𝑖𝐶𝑡 + 𝜖𝑖𝑡 (4)
where 𝑌𝑖𝑡, 𝑃𝑖(𝑡−1), and 𝑄𝑖(𝑡−1) are as described in §3.2, 𝑉𝑖 represents vendor fixed effects, 𝑀𝑡 represents
product mix and model change controls, 𝐶𝑡 represents time fixed effects, and 𝜖𝑖𝑡 represents the error
terms. Here, 𝛽𝑃 = 𝜇𝛼1 denotes the learning rate for production experience, and 𝛾𝑄 = 𝜇𝛼2 denotes the
learning rate for quality improvement experience. We expect 𝛽𝑃 and 𝛾𝑄 to be negative and significant,
indicating that both autonomous and induced learning contribute to lower defect rates. We estimate the
econometric specification (4) using panel data regression. We use clustered standard errors in all our
analyses in line with Wooldridge (2002, p 311) to account for the fact that our data exhibit within-panel
serial correlation (Note: estimating model (4) assuming errors arise from an AR(1) process provides simi-
lar results). The results of this analysis are shown in model (L1) of Table 4.
An underlying assumption in model (4) is that all knowledge acquired through autonomous and in-
duced learning in the current period is carried over to subsequent periods. We now explicitly change our
model to allow for depreciation of organizational knowledge. We use organizational forgetting parame-
ters 𝜆𝑃 and 𝜆𝑄 to represent the proportion of autonomous and induced knowledge from past periods that is
available in future periods. Thus, we denote the stock of autonomous knowledge 𝐴𝐾𝑖𝑡 at time t for ven-
dor i as a function of the stock of autonomous knowledge in the prior period 𝐴𝐾𝑖(𝑡−1) and the current pro-
duction volume 𝑝𝑖𝑡, as 𝐴𝐾𝑖𝑡 = 𝜆𝑃𝐴𝐾𝑖(𝑡−1) + 𝑝𝑖𝑡. Here, we restrict 𝜆𝑃 by the expression 0 ≤ 𝜆𝑃 ≤ 1, to
ensure that depreciation of knowledge is not greater than the existing stock of knowledge. Similarly, the
stock of induced knowledge 𝐼𝐾𝑖𝑡 can be represented as 𝐼𝐾𝑖𝑡 = 𝜆𝑄𝐼𝐾𝑖(𝑡−1) + 𝑞𝑖𝑡 where 0 ≤ 𝜆𝑄 ≤ 1. We
use these parameters to assess the impact of organizational forgetting in the following econometric model:
𝑙𝑛(𝑌𝑖𝑡) = 𝛼𝑖 + 𝛽𝑃𝐴𝐾𝑖(𝑡−1) + 𝛾𝑄𝐼𝐾𝑖(𝑡−1) + 𝜂𝑖𝑉𝑖 + 𝜙𝑖𝑀𝑡 + 𝜓𝑖𝐶𝑡 + 𝜖𝑖𝑡 (5)
where the other terms are as described in model (4). Note that when λP = λQ = 1, from the definition of
𝐴𝐾𝑖𝑡 = 𝜆𝑃𝐴𝐾𝑖(𝑡−1) + 𝑝𝑖𝑡 we get 𝐴𝐾𝑖(𝑡−1) = ∑ 𝑝𝑖𝑡𝑡−1𝑡=0 = 𝑃𝑖(𝑡−1), similarly 𝐼𝐾𝑖(𝑡−1) = ∑ 𝑞𝑖𝑡
𝑡−1𝑡=0 = 𝑄𝑖(𝑡−1).
Consequently, model (4) is a special case of (5). If 0 ≤ λP, λQ < 1, then it indicates that some knowledge
gained from autonomous and induced learning depreciates and is not available in the current period.
16
The econometric model (5) is not linear in its parameters. The independent variables 𝐴𝐾𝑖(𝑡−1) and
𝐼𝐾𝑖(𝑡−1) are functions of lagged production volume and lagged quality improvement initiatives, and the
organizational forgetting parameters 𝜆𝑃 and 𝜆𝑄. Consequently, we cannot use traditional linear regression
models as they will be unable to provide separate estimates of 𝛽𝑃 , 𝛾𝑄 , 𝜆𝑃, and 𝜆𝑄. To address our esti-
mation problem of recovering the parameters with their standard errors, we use an approach that builds on
the nonparametric bootstrap technique proposed by Freedman (1981) and discussed in Davidson and
MacKinnon (2006). In brief, our approach involves two simultaneous steps: (i) a two-dimensional grid
search over λP and λQ and (ii) bootstrapping. In the grid search step, we calculate the values of autono-
mous and induced knowledge stock (𝐴𝐾𝑖(𝑡−1) and 𝐼𝐾𝑖(𝑡−1)) for each value of 𝜆𝑃 and 𝜆𝑄 in increments of
0.0001 in the interval [0,1]. Thus, we have 10,000 potential vectors of autonomous and induced
knowledge, though at this stage we do not know the optimal values of 𝜆𝑃 and 𝜆𝑄. In the bootstrapping
step, for given values of 𝜆𝑃 and 𝜆𝑄, we draw with replacement data on the dependent variable, the associ-
ated values of autonomous and induced knowledge, and the relevant controls to create a simulated sample
of our dataset. We estimate the regression parameters and the model 𝑅2 using the simulated dataset. We
repeat this process for all potential values of 𝜆𝑃 and 𝜆𝑄 and store the parameter estimates of 𝛼𝑖, 𝛽𝑃 , 𝛾𝑄 ,
𝜂𝑖 , 𝜙𝑖 and 𝜓𝑖 and the corresponding values of 𝜆𝑃 and 𝜆𝑄 for the model with the highest 𝑅2 as the relevant
estimates for this bootstrapping step. We replicate this step 1,000 times. Then we use the means of the
parameter estimates and the standard errors of the estimates over these 1000 bootstrap replicates as the
relevant estimates for our model (5). These results are shown in model (F1) in Table 4. (Additional details
of our approach are included in the online appendix A.) Our method builds on the approach used in the
organizational forgetting literature by Boone et al. (2008). While they obtain the estimates of organiza-
tional forgetting with standard errors for autonomous learning; we extend their approach to obtain esti-
mates of organizational forgetting with standard errors for autonomous as well as induced learning.
A potential concern in the above bootstrapping approach is that correlations in the sample among ob-
servations close to each other in time from different vendors could bias results. Consequently, we follow
Efron and Tibshirani (1994) and Bertrand et al. (2004), who suggest block bootstrapping for dependent
data to preserve the panel structure of the data (and to avoid the creation of simulated samples by random
selection of observations from pooled data).
4.2 Models to Evaluate the Impact of Different Modes of Organizational Forgetting
To evaluate Hypothesis 2, we modify the experience variables to identify ‘new’ and ‘old’ components of
experience. This allows us to examine the different modes of organizational forgetting as follows:
a. If the ‘old’ components of experience depreciate, then they provide evidence that ‘degradation’,
17
the mechanism by which established knowledge is not maintained is present.
b. If the ‘new’ components of experience depreciate, then they provide evidence that ‘dissipation’,
the mechanism by which new knowledge fails to get consolidated is present.
c. If the ‘new’ components of experience exhibit learning, then they provide evidence that ‘purg-
ing’, the mechanism by which vendors ‘unlearn’ processes that cause quality issues and improve
their quality performance is present.
We define ‘new’ experience as the experience gained in the last ‘h’ months and ‘old’ experience as the
cumulative experience gained prior to the last ‘h’ months, as detailed in section 3.2.3, to obtain:
𝑙𝑛(𝑌 𝑖𝑡) = 𝛼𝑖 + 𝛽𝑜𝑙𝑑𝑃𝑖(𝑡−1)_𝑜𝑙𝑑 + 𝛽𝑛𝑒𝑤𝑃𝑖(𝑡−1)_𝑛𝑒𝑤 + 𝛾𝑜𝑙𝑑𝑄𝑖(𝑡−1)_𝑜𝑙𝑑 + 𝛾𝑛𝑒𝑤𝑄𝑖(𝑡−1)_𝑛𝑒𝑤 + 𝜂𝑖𝑉𝑖 + 𝜙𝑖𝑀𝑡 + 𝜓𝑖𝐶𝑡 +
𝜖𝑖𝑡 (6)
Here, 𝛽𝑜𝑙𝑑 and 𝛾𝑜𝑙𝑑 capture learning rates for ‘old’ experience, while 𝛽𝑛𝑒𝑤 and 𝛾𝑛𝑒𝑤 denote the learning
rates for ‘new’ experience.
To examine the depreciation for ‘new’ and ‘old’ components of experience, we define the organiza-
tional forgetting parameters λ𝑃_𝑜𝑙𝑑 and λ𝑄_𝑜𝑙𝑑 to represent the proportion of ‘old’ autonomous and in-
duced knowledge from past periods that is available in future periods, and parameters λ𝑃_𝑛𝑒𝑤 and λ𝑄_𝑛𝑒𝑤
to represent the proportion of ‘new’ knowledge from past periods that is available in future periods. Con-
sequently, the stock of ‘new’ autonomous knowledge is defined as 𝐴𝐾𝑖(𝑡−1)_𝑛𝑒𝑤 =
∑ (λ𝑃_𝑛𝑒𝑤)𝑡−1−𝑘𝑝𝑖𝑘𝑘=𝑡−1
𝑘=𝑡−ℎ−1 , and the stock of ‘old’ autonomous knowledge is defined as 𝐴𝐾𝑖(𝑡−1)_𝑜𝑙𝑑 =
∑ (λ𝑃_𝑜𝑙𝑑)𝑡−ℎ−2−𝑘𝑝𝑖𝑘𝑘=𝑡−ℎ−2
𝑘=0. Analogously, we define the stock of ‘old’ induced knowledge 𝐼𝐾𝑖𝑡_𝑜𝑙𝑑
and ‘new’ induced knowledge 𝐼𝐾𝑖𝑡_𝑛𝑒𝑤. Based on these we develop the following model to examine the
depreciation for ‘old’ and ‘new’ components of experience:
𝑙𝑛(𝑌 𝑖𝑡) = 𝛼𝑖 + 𝛽𝑜𝑙𝑑𝐴𝐾𝑖(𝑡−1)𝑜𝑙𝑑+ 𝛽𝑛𝑒𝑤𝐴𝐾𝑖(𝑡−1)𝑛𝑒𝑤
+ 𝛾𝑜𝑙𝑑𝐼𝐾𝑖(𝑡−1)𝑜𝑙𝑑 + 𝛾𝑛𝑒𝑤𝐼𝐾𝑖(𝑡−1)_𝑛𝑒𝑤 + 𝜂𝑖𝑉𝑖 +
𝜙𝑖𝑀𝑡 + 𝜓𝑖𝐶𝑡 + 𝜖𝑖𝑡 (7)
To identify the appropriate number of months ‘h’ to be considered for ‘new’ experience, we estimated
our econometric specification (6) for values of ‘h’ from 1 through 6 using panel data regression. The
model with ℎ = 3 provided the best fit (as measured using 𝑅2 values). The results of this analysis are
shown in model (L2) of Table 4. We then evaluated our econometric model (7) using an approach similar
to the one used for the evaluation of model (5). These results are shown in model (F2) in Table 4.
4.3 Models to Evaluate the Impact for Different Types of Quality Improvement Initiatives
To evaluate how experience of different types of quality improvement initiatives affects quality perfor-
mance, we use the variables for lagged cumulative quality assurance (𝑆𝑖(𝑡−1)), lagged cumulative process
improvements (𝑅𝑖(𝑡−1)), and lagged cumulative design quality (𝐷𝑖(𝑡−1)) to obtain the following model:

18
𝑙𝑛(𝑌𝑖𝑡) = 𝛼𝑖 + 𝛽𝑃𝑃𝑖(𝑡−1) + 𝛾𝑆𝑆𝑖(𝑡−1) + 𝛾𝑅𝑅𝑖(𝑡−1) + 𝛾𝐷𝐷𝑖(𝑡−1) + 𝜂𝑖𝑉𝑖 + 𝜙𝑖𝑀𝑡 + 𝜓𝑖𝐶𝑡 + 𝜖𝑖𝑡 (8)
Next, we define parameters 𝜆𝑆, 𝜆𝑅, and 𝜆𝐷 to represent the proportion of induced knowledge related
to cumulative quality assurance, cumulative process improvements, and cumulative design quality from
past periods that is available in future periods. Let 𝐾𝑆𝑖𝑡, 𝐾𝑅𝑖𝑡 and 𝐾𝐷𝑖𝑡 represent the stock of induced
knowledge related to quality assurance, process improvements, and design quality, respectively, available
at vendor i in time t. Consequently, the stock of induced knowledge related to quality assurance 𝐾𝑆𝑖𝑡 can
be represented as 𝐾𝑆𝑖𝑡 = 𝜆𝑆𝐾𝑆𝑖(𝑡−1) + 𝑠𝑖𝑡, where 𝑠𝑖𝑡 is the ‘Quality Assurance’ initiatives done in the
current period and 0 ≤ λS ≤ 1. 𝐾𝑅𝑖𝑡 and 𝐾𝐷𝑖𝑡 are also represented analogously. We incorporate these
parameters to capture the impact of organizational forgetting in the following econometric model:
𝑙𝑛(𝑌𝑖𝑡) = 𝛼𝑖 + 𝛽𝑃𝐴𝐾𝑖(𝑡−1) + 𝛾𝑆𝐾𝑆𝑖(𝑡−1) + 𝛾𝑅𝐾𝑅𝑖(𝑡−1) + 𝛾𝐷𝐾𝐷𝑖(𝑡−1) + 𝜂𝑖𝑉𝑖 + 𝜙𝑖𝑀𝑡 + 𝜓𝑖𝐶𝑡 + 𝜖𝑖𝑡 (9)
Note that when 𝜆𝑆 = 𝜆𝑅 = 𝜆𝐷 = 𝜆𝑃 = 1 model (6) is a special case of model (7). If 0 ≤ 𝜆𝑆, 𝜆𝑅 , 𝜆𝐷 < 1 ,
then some of the knowledge gained from induced learning attributable to quality assurance, process im-
provements, or design change depreciates and is not available for use in the current month.
We estimated the econometric specification (8) using panel data regression. These results are shown
in model (L3) of Table 4. To estimate the econometric specification (9), our approach is similar to the one
used for the econometric model (5). We recovered all the organizational forgetting parameters and stand-
ard errors for model (9) using nonparametric bootstrap techniques, where we used 1,000 replicates with a
four-dimensional grid search over 𝜆𝑆,𝜆𝑅,𝜆𝐷, and 𝜆𝑃 in increments of 0.0001. These results are shown in
model (F3) of Table 4.
4.4 Models to Evaluate Impact of where Quality Knowledge Gets Embedded
To evaluate Hypothesis 4, we use the variables for lagged cumulative technology solutions (𝑇𝑆𝑖(𝑡−1)),
lagged cumulative routines solutions (𝑅𝑆𝑖(𝑡−1)) and lagged cumulative operator solutions (𝑂𝑆𝑖(𝑡−1)) in
the following econometric specification:
𝑙𝑛(𝑌𝑖𝑡) = 𝛼𝑖 + 𝛽𝑃𝑃𝑖(𝑡−1) + 𝛾𝑇𝑆𝑇𝑆𝑖(𝑡−1) + 𝛾𝑅𝑆𝑅𝑆𝑖(𝑡−1) + 𝛾𝑂𝑆𝑂𝑆𝑖(𝑡−1) + 𝜂𝑖𝑉𝑖 + 𝜙𝑖𝑀𝑡 + 𝜓𝑖𝐶𝑡 + 𝜖𝑖𝑡 (10)
We define 𝜆𝑇𝑆, 𝜆𝑅𝑆 and 𝜆𝑂𝑆 to represent the proportion of induced knowledge related to cumulative
technology, cumulative routines and cumulative operators from past periods that is available in future pe-
riods. Then we define 𝐾𝑇𝑆𝑖𝑡 , 𝐾𝑅𝑆𝑖𝑡 and 𝐾𝑂𝑆𝑖𝑡 as the stock of induced knowledge related to quality im-
provement projects with technology solutions, routines solutions and operator solutions available at time
t. This leads to the following econometric specification to capture the impact of organizational forgetting:
𝑙𝑛(𝑌𝑖𝑡) = 𝛼𝑖 + 𝛽𝑃𝑃𝑖(𝑡−1) + 𝛾𝑇𝑆𝐾𝑇𝑆𝑖(𝑡−1) + 𝛾𝑅𝑆𝐾𝑅𝑆𝑖(𝑡−1) + 𝛾𝑂𝑇𝑆𝐾𝑂𝑇𝑆𝑖(𝑡−1) + 𝜂𝑖𝑉𝑖 + 𝜙𝑖𝑀𝑡 + 𝜓𝑖𝐶𝑡 +
𝜖𝑖𝑡 (11)

19
We estimated the econometric specification (10) using panel data regression. These results are shown
in model (L4) in Table 4. We estimated econometric specification (11) using an approach similar to the
one used for the estimation of econometric model (9). These results are shown in model (F4) in Table 4.
5. Results
In this section, we present our results and discuss the various tests we did to validate their robustness.
5.1 Results of our Econometric Models
We observe that the coefficients of lagged cumulative production experience and lagged cumulative qual-
ity improvement experience are negative and significant at p<0.001 in models (L1) and (F1) of Table 4.
These results indicate that quality performance improves with cumulative production experience and cu-
mulative quality improvement experience. Thus both autonomous and induced learning contribute to en-
hanced vendor quality performance in our research setting.
In the context of Hypothesis 1a, we refer to model (F1) in Table 4 and find that 𝜆𝑃 is estimated at
0.9855 and is significantly different from 1 at p<0.01. This indicates that organization forgetting exists in
autonomous learning and supports Hypothesis 1a. Our results imply that the gains from autonomous
learning depreciate by 16.08% every year (annual depreciation is 1 − 0.985512 as 𝜆𝑃 represents monthly
depreciation rate). To predict the impact of autonomous learning, we follow the approach proposed in
Cameron and Trivedi (2005, pp. 103-104) because we use log-linear models of the general form ln(𝒚) =
𝒙′𝜷 + 𝝐 and for such models 𝑬(𝑦𝑖 𝒙𝑖⁄ ) = exp(𝒙𝒊′𝜷) 𝑬[exp(𝜖𝑖)]. Consequently, as the average annual
production for a vendor is 23.52 (1.96×12 months in 100,000 units) we estimate autonomous learning
will reduce defect rates by 3.17% annually (calculated as (�̂�𝑃𝑖(𝑡−1)=23.52 − �̂�𝑃𝑖(𝑡−1)=0)/�̂�𝑃𝑖(𝑡−1)=0 =
−0.0317). However, due to organizational forgetting, autonomous learning reduces defect rates by only
2.66% annually (calculated as (1 − 0.1608) × 3.17).
To evaluate Hypothesis 1b, we refer to model (F1) in Table 4 and find that λQ is estimated at 0.9883
and is significantly different from 1 at p<0.01. This indicates that organizational forgetting exists in in-
duced learning and supports Hypothesis 1b. Our results imply that the gains from induced learning depre-
ciate by 13.17% every year. On average 2.52 (calculated as 0.21×12) quality improvement initiatives are
implemented in a year at each vendor, consequently we estimate induced learning will reduce defect rates
by 7.65% annually (calculated as (�̂�𝑄𝑖(𝑡−1)=2.52 − �̂�𝑄𝑖(𝑡−1)=0)/�̂�𝑄𝑖(𝑡−1)=0 = −0.0765). However, due to
organizational forgetting, induced learning reduces defect rates by only 6.64% annually (calculated as
(1 − 0.1317) × 7.65%). Overall, our results indicate that organizational forgetting affects quality gains
obtained from both autonomous and induced learning.
20
For Hypothesis 2 we refer to the models (L2) and (F2) of Table 4. We observe that the coefficient of
‘new’ cumulative quality improvement experience is negative and significant at p<0.01 in both models
(L2) and (F2) of Table 4, however the coefficients of ‘new’ cumulative production experience are not
significant. These results do not provide conclusive evidence for the presence of ‘purging’ in our setting.
Our results also show that ‘dissipation’ is not present in our context, as the estimates of organizational
forgetting for ‘new’ autonomous learning 𝜆𝑃_𝑛𝑒𝑤 and ‘new’ induced learning 𝜆𝑄_𝑛𝑒𝑤 are not significantly
different from 1. We also observe that the estimate of organizational forgetting for ‘old’ autonomous
learning 𝜆𝑃_𝑜𝑙𝑑 (0.9784) and ‘old’ induced learning 𝜆𝑄_𝑜𝑙𝑑 (0.9831) are significantly different from 1 at
p<0.001. These results provide evidence that depreciation of quality knowledge at vendors in our context
is mainly on account of ‘degradation’. Consequently, our results only partially support Hypothesis 2 (as
we do not find conclusive evidence for the presence of ‘purging’).
To examine Hypothesis 3, we refer to model (L3) of Table 4 to verify the presence of organizational
learning for the three types of quality improvement initiatives. We find that the estimates of organization-
al learning are only significant for quality assurance and process improvement initiatives. We now refer to
model (F3) and observe that the estimate of organizational forgetting in quality assurance 𝜆𝑆 is not signif-
icantly different from 1. This suggests that improvement in quality performance driven by quality assur-
ance initiatives does not depreciate over time. However, 𝜆𝑅 is estimated at 0.9872 and is significantly dif-
ferent from 1 at p<0.001, which suggests that organizational forgetting exists in induced learning for pro-
cess improvement initiatives. Furthermore, this result indicates that the gains obtained from doing process
improvement projects depreciate by 14.32% every year. Additionally, a Wald test indicates that the esti-
mates of 𝜆𝑆 and 𝜆𝑅 are significantly different from each other at p<0.01. We do not make inferences
about organizational forgetting in the context of design quality, as the relevant organizational learning
estimates are not significant. Thus, our results suggest that the depreciation in knowledge stock for in-
duced learning is mainly due to depreciation in process improvement related knowledge.
For Hypothesis 4, we refer to model (L4) in Table 4 to confirm organizational learning for ‘Lagged
Cumulative Technology Solutions’, ‘Lagged Cumulative Routines Solutions’ and ‘Lagged Cumulative
Operator Solutions’. Then we observe in model (F4) of Table 4 that the estimates of organizational for-
getting for lagged cumulative technology solutions (𝜆𝑇𝑆) at 0.9923, for lagged cumulative routines (𝜆𝑅𝑆)
at 0.9873, and for lagged cumulative operators (𝜆𝑂𝑆), at 0.9752, are significantly different from 1 at
p<0.01. Additionally, Wald tests indicate that these organizational forgetting estimates are significantly
different from each other at p<0.01. Quality gains obtained from quality improvement initiatives that
mainly involve technology exhibit the lowest depreciation: 8.86% of such gains depreciate every year. In
21
contrast, quality gains obtained from quality improvement initiatives that focus on routines and operators
depreciate by 14.22% and 26.02%, respectively, every year. Overall our results support Hypothesis 4.
5.2 Robustness Checks
We now discuss the various tests we undertook to address concerns related to the analytical approaches
used in our overall analysis and to tackle specific issues in the evaluation of our individual hypotheses.
5.2.1 Tests Related to the Analytical Approaches
We measure defect rates in monthly intervals. It is possible that random fluctuations in vendor defect
rates over monthly intervals may affect our results. To address this concern, we aggregated our data over
two, three, four, and five month intervals and evaluated the econometric models (4) and (5). The results
with quarterly aggregated data are shown in models (L5) and (F5) of Table 5. Even with temporal aggre-
gation, our results on organizational forgetting are similar to our findings with monthly data.
We use the cumulative count of quality improvement initiatives to capture the impact of induced
learning. This approach gives equal weight to all quality improvement initiatives. However, it is possible
that the costs to implement different quality improvement initiatives could differ and influence AMC’s
choice of which initiatives to implement. To address this issue, we obtained the costs incurred by AMC
for each quality improvement initiative. These costs represent the extent to which the various quality im-
provement initiatives undertaken by AMC differ. The cost data enabled us to use the cumulative cost of
quality improvement initiatives to capture the impact of induced learning in our models (4) and (5). The
estimation results for these models are shown in models (L6) and (F6) of Table 5. These results are es-
sentially similar to those obtained in our main models and provide additional support to our findings.
We evaluated our models with an additional control for calendar time, as Levin (2000) and Lapré et
al. (2000) suggest that experience can also be a function of elapsed time. These results are shown in mod-
els (L7) and (F7) of Table 5. Our results are robust to the inclusion of the control for calendar time.
We used three tests to investigate for the potential endogeneity of the decision to undertake quality
improvement initiatives. First, we examined two instruments for the potential endogenous variable: i) the
cumulative quality improvement initiatives undertaken at other vendors handled by the same SIU engi-
neer, and ii) the cumulative quality improvement initiatives undertaken at other vendors within the same
industry. However, Hausman tests done after estimating the instrumental variables models failed to reject
the null hypothesis that cumulative quality improvement initiatives variable is exogenous. Second, we
evaluated a regression model with quality improvement initiatives as a dependent variable and lagged
defects as an independent variable. Lagged defects were not a significant predictor of quality improve-
ment initiatives. Finally, to break the potential endogenous relationship between cumulative quality im-
provement initiatives and defect rates, we estimated econometric specifications (4) and (5) with increased
22
lags (two, three and four months) for our experience variables. Our results remain essentially the same.
The overall evidence indicates that endogeneity is not a concern in our analyses.
We also examined for the potential impact of correlation in observations across vendors: i) by evalu-
ating models with standard errors clustered at industry level and at SIU engineer level, and ii) by estimat-
ing models that include experience gained at other vendors within an industry or handled by the same SIU
engineer. These analyses reveal that correlation across vendors is not a concern in our context.
5.2.2 Tests Related to the Individual Hypotheses
In the context of Hypothesis 3, the relatively smaller sample of design quality initiatives could lead to the
absence of significant findings. We used two tests to address this issue. First, we restricted our sample to
vendors where at least one design quality initiative was done. This reduced sample included information
on 94 vendors where design quality initiatives accounted for 17% of the overall quality improvement ini-
tiatives. We redid our analysis for this restricted sample and find that our results for design quality initia-
tives remain essentially the same. Second, we evaluated our learning models with selective over-sampling
of design quality initiatives to deal with the unbalanced data, in line with the bootstrapping approach sug-
gested by Estabrooks et al. (2004) and Japkowicz and Stephen (2002), and we do not find learning effects
for design quality initiatives. Additionally, we also examined whether design quality initiatives affect
quality performance after a lag. Evaluation of our models with the experience variables lagged from two
to nine months, confirms the absence of significant findings for design quality initiatives.
In the evaluation of Hypothesis 4, design quality initiatives are encompassed within technology based
improvement initiatives, and it is possible that the absence of organizational learning for design quality
initiatives may reflect as organizational forgetting for technology focused initiatives. To address this con-
cern, we excluded design quality initiatives from our data and evaluated models (10) and (11) for the re-
stricted data. Our results remain essentially similar.
We also examined whether endogeneity is a concern in our evaluation of Hypotheses 3 and 4. We
used a process similar to the one we used to evaluate the endogeneity of the decision to undertake quality
improvement initiatives and find that endogeneity is not a concern for Hypotheses 3 and 4.
6. Discussion and Conclusion
Our study contributes by providing insights on the role of organizational forgetting on quality perfor-
mance. While several studies have shown that organizational forgetting affects productivity improve-
ments and cost reduction obtained from production experience, we extend this to the quality domain. In
our setting, we find that 16.08% of quality gains from autonomous learning depreciate every year.

23
We contribute by demonstrating that organizational forgetting affects gains obtained from induced
learning. To the best of our knowledge, our study is the first to do so. In our context, we find that 13.17%
of quality gains from induced learning depreciate every year. Our results confirm the conjectures of sev-
eral scholars that organizational forgetting may affect quality performance. This is an area of theory that
has not been fully explored, and our results suggest that theoretical models that link learning and quality
could be enriched by incorporating organizational forgetting.
Our results show that the impact of organizational forgetting on quality is lower than that on produc-
tivity improvements or cost reduction. We find that the annual depreciation of quality gains ranges from
13.17% to 16.08%, while prior studies have shown an annual depreciation of production experience rang-
ing from 39% in aircraft production (Benkard 2000) to over 90% in automotive assembly (Epple et al.
1996) and shipbuilding (Argote et al. 1990). Two potential reasons could account for these differences.
The first is that quality performance is often well documented and tracked by vendors and AMC. Further,
quality improvement initiatives are typically developed after observing quality problems (e.g., Vibration
in assembly shroud fan and motor, as in example 9 in Table 1), exploring potential causes (e.g., Solenoid
failure due to water ingress, as in example 8 in Table 1), and identifying possible solutions (e.g., arresting
rotary movement of inspection gauge, as in example 1 in Table 1). This deliberate process of addressing
quality issues probably facilitates a higher retention of knowledge. The second could be the negligible
turnover of AMC’s SIU engineers in this period.
In our context, organizational forgetting mainly affects organizational knowledge through degrada-
tion: the depreciation of the ‘old’ component of experience. This suggests that it may be prudent for firms
to monitor the quality performance of their vendor base periodically, and also periodically revisit critical
quality problems that have been addressed in the past.
Our study also contributes by analyzing the impact of organizational forgetting on different types of
quality improvement projects. In our context, knowledge depreciation does not happen in all types of im-
provement efforts. Learning from quality assurance projects does not decay over time, whereas learning
from process improvement projects decays over time. Indeed, almost all the depreciation of knowledge or
organizational forgetting happens in the knowledge stock related to process improvement projects. Dis-
cussions with AMC engineers and vendors indicate that the explicit checks associated with quality assur-
ance initiatives facilitate greater focus in plant operations to meet the desired quality requirements. Fur-
thermore, the usage of test equipment ensures that the quality gains obtained through such projects are
sustained over time. On the other hand, some process improvement initiatives may not address all poten-
tial causes of the quality problems. For instance, in Table 1, the eighth quality improvement initiative in-
volved an even application of the sealant. Though the application of the sealant was automated, AMC
24
engineers pointed out that in some instances foreign materials in the sealant might lead to uneven bond-
ing, leading to quality issues.
One must be cautious about drawing inferences from these results. Our results do not imply that firms
should implement quality assurance initiatives instead of process improvement initiatives, as in many in-
stances process improvement initiatives may be more suitable to handle quality issues than quality assur-
ance initiatives (e.g., blow holes in castings can be better handled through improved sand preparation than
by using x-rays to test each casting). Given the absence of organizational forgetting for quality assurance
initiatives, our results suggest that firms could use such initiatives to address critical quality issues. How-
ever, firms will need to consider the cost implications of including an explicit quality assurance step in
their operations. If firms use process improvement initiatives to address critical quality issues, they must
revisit them after a period of time to ensure that quality performance is sustained.
It is intriguing that design quality initiatives do not affect overall quality in our setting. Discussions
with AMC mangers indicate that design quality initiatives are invariably undertaken only when all other
options have been exhausted and when the underlying causes are not well understood. Consequently,
these projects may not have the relevant know-why or an understanding of the root causes and, in line
with Lapré et al. (2000) and Ishikawa (1985), may not lead to improvement in quality performance.
Our study also responds to the call of Argote (2013) for research to examine the effectiveness of
technology in retaining organizational knowledge. We find that quality improvement initiatives which are
embedded in technology exhibit lower rates of depreciation (8.86%) as compared to quality improvement
initiatives that are embedded in routines (14.22%) or are embedded in organizational members (26.02%).
Thus, we validate the underlying assumption in the literature that embedding knowledge in technology is
effective in mitigating organizational forgetting. However, our discussions with AMC managers indicate
that not all quality issues can be addressed by technology focused initiatives and many a time changes to
routines or development of operator skills may be required to solve quality problems. Consequently, our
results suggest that irrespective of where quality knowledge gets embedded in organizations; firms will
need to assess quality improvement solutions regularly to sustain quality performance.
The approaches used in our study: of classifying projects into different types of quality improvement
initiatives; and of identifying where quality knowledge gets embedded, can all be done ex-ante and hence
have practical implications for firms. Our findings are also relevant for managers because they provide
insight on managing quality improvement and can enable more informed decision making.
There are some limitations in our study which could be overcome in future research. We do not con-
sider the effect of costs incurred by vendors for implementing the quality improvement initiatives. One
could envisage a study that uses information on prevention and appraisal costs to provide insight on the
25
interplay between benefits from quality improvement efforts and costs of such efforts. Also, we do not
observe the complete history of production experience. We recognize that there could be potential bene-
fits of observing the entire history of production experience to improve the inferences related to autono-
mous learning that could be addressed in future studies. In our study, we were not able to observe initia-
tives that were not implemented at vendors. A study that examines quality improvement efforts that were
not implemented at vendors could potentially provide enhanced insights quality management within sup-
ply chains. Using field data has enriched our study; however there are also some inevitable limitations as
all facets of a field setting cannot be controlled. Though we have used several robustness checks in our
analysis, we believe no single study can provide definitive answers on how organizational forgetting af-
fects quality. We hope our work will stimulate further theoretical and empirical work on the role of organ-
izational forgetting in quality improvement.
References
Adler, P.S., K.B. Clark. 1991. Behind the Learning Curve: A Sketch of the Learning Process.
Management Science 37(3) 267-81.
Argote, L. 2013. Organizational Learning: Creating, Retaining and Transferring Knowledge. 2nd ed.
Springer, New York, USA.
Argote, L., S.L. Beckman, and D. Epple. 1990. The Persistence and Transfer of Learning in Industrial
Settings. Management Science 36(2) 140-154.
Argote, L., D. Epple. 1990. Learning Curves in Manufacturing. Science 247(4945) 920-924.
Argote, L., E. Miron-Spektor. 2011. Organizational Learning: From Experience to Knowledge.
Organization Science 22(5) 1123-1137.
Benkard, C.L. 2000. Learning and Forgetting: The Dynamics of Aircraft Production. American Economic
Review 90(4) 1034-54.
Bertrand, M., E. Duflo, and S. Mullainathan. 2004. How Much Should we Trust Differences-in-
Differences Estimates? The Quarterly Journal of Economics 119(1), 249-275.
Bettis, R. A., C.K. Prahalad. 1995. The Dominant Logic: Retrospective and Extension. Strategic
Management Journal 16 5–14
Boone, T., R. Ganeshan, and R.L. Hicks. 2008. Learning and Knowledge Depreciation in Professional
Services. Management Science 54(7) 1231-36.
Cameron, A.C., P.K. Trivedi. 2009. Microeconometrics using Stata. Stata Press. College Station, Texas.
Cohen, M., P. Bacdayan. 1994. Organizational routines are stored as procedural memory: Evidence from
a laboratory study. Organization Science 5(4) 554-568.
26
Cross, R., L. Baird. 2000. Technology is Not Enough: Improving Performance by Building Organization-
al Memory Sloan Management Review 41(3) 69-78.
Dada, M., R. Marcellus. 1994. Process Control with Learning. Operations Research 42(2) 323-336.
Darr, E. D., L. Argote, and D. Epple. 1995. The Acquisition, Transfer, and Depreciation of Knowledge in
Service Organizations: Productivity in Franchises. Management Science 41(11) 1750-62.
David, G., T. Brachet. 2011. On the Determinants of Organizational Forgetting. American Economic
Journal: Microeconomics 3(3) 100–123
Davidson, R., J.G. MacKinnon. 2006. Bootstrap Methods in Econometrics. T. C. Mills, K. Patterson, eds.
Palgrave Handbooksof Econometrics: Vol. 1; Econometric Theory. Macmillan, Basingstoke, UK.
de Holan, P.M., N. Phillips. 2004. Remembrance of Things Past? The Dynamics of Organizational
Forgetting. Management Science 50(11) 1603-1613.
Deming, W.E. 1986. Out of the Crisis. MIT Press, Boston, USA.
Dutton, J.M., A. Thomas. 1984. Treating Progress Functions as a Managerial Opportunity. Academy of
Management Review 9(2) 235-247.
Efron, B., R. Tibshirani. 1994. An Introduction to the Bootstrap, Monograph in Applied Statistics and
Probability, No. 57. New York, NY: Chapman and Hall.
Epple, D., L. Argote, and K. Murphy. 1996. An Empirical Investigation of the Microstructure of
Knowledge Acquisition and Transfer through Learning by Doing. Operations Research 44(1) 77–86.
Estabrooks, A., T. Jo, and N. Japkowicz. 2004. A Multiple Resampling Method for Learning from
Imbalanced Data Sets. Computational Intelligence 20(1) 18-36.
Feldman, M. S. & Pentland, B.T. (2003). Reconceptualizing Organizational Routines as a Source of
Flexibility and Change. Administrative Science Quarterly 48(3) 94–118.
Fine, C.H. 1986. Quality Improvement and Learning in Productive Systems. Management Science 32(10)
1301-15.
Freedman, D.A. 1981. Bootstrapping Regression Models. Annals of Statistics. 9(6) 1218–1228.
Huber, G.P. (1991). Organizational Learning: The Contributing Processes and the Literatures.
Organization Science 2(1) 88-115.
Ishikawa, K. 1985. What is Total Quality Control? The Japanese Way. Prentice-Hall,N.J., USA.
Ittner, C.D., V. Nagar, and M.V. Rajan. 2001. An Empirical Examination of Dynamic Quality-Based
Learning Models. Management Science 47(4) 563-78.
Japkowicz, N., S. Stephen. 2002. The Class Imbalance Problem: A Systematic Study. Intelligent Data
Analysis 6(5) 429-449.
27
Johnson & Johnson. 2011. Janssen Identifies Trace Amounts of TBA in 5 Batches of PREZISTA®
(darunavir) in the EU and Canada. Available at http://www.investor.jnj.com/releasedetail.cfm?re-
leaseid=576210
KC, D.S., B.R. Staats. 2012. Accumulating a Portfolio of Experience: The Effect of Focal and Related
Experience on Surgeon Performance. Manufacturing & Service Operations Management, 14(4) 618-
636.
Landis, J.R., G.G. Koch. 1977. An Application Of Hierarchical Kappa-Type Statistics in the Assessment
of Majority Agreement Among Multiple Observers. Biometrics 33(2) 363-374.
Lapré, M.A., A.S. Mukherjee, and L.V. Wassenhove. 2000. Behind the Learning Curve: Linking
Learning Activities to Waste Reduction. Management Science 46(5) 597-611.
Lapré, M.A., N. Tsikriktsis. 2006. Organizational Learning Curves for Customer Dissatisfaction:
Heterogeneity across Airlines. Management Science 52(3) 352-66.
Lee, H.L., M.M. Tseng, and D. Hoyt. 2008. Unsafe for Children: Mattel's Toy Recall Supply Chain
Management. Case Study, Graduate School of Business, Stanford University, CA.
Levin, D.Z. 2000. Organizational Learning and the Transfer of Knowledge: An Investigation of Quality
Improvement. Organization Science 11(6) 630-647.
Levy, F.K. 1965. Adaptation in the Production Process. Management Science 11(6) 136-54.
Li, G., S. Rajagopalan. 1998. Process Improvement, Quality, and Learning Effects. Management Science
44(11) 1517-32.
NarayananS., S. Balasubramanian and J. M. Swaminathan. 2009. A Matter of Balance: Specialization,
Task Variety, and Individual Learning in a Software Maintenance Environment. Management Science
55(11) 1861-1876.
Nelson. R.R., S.G. Winter. 1982. An Evolutionary Theory of Economic Change. Harvard University
Press, Boston, USA.
Nembhard, I.M., A.L. Tucker. 2011. Deliberate Learning to Improve Performance in Dynamic Service
Settings: Evidence from Hospital Intensive Care Units. Organization Science 22(4) 907-22.
Nonaka I. 1994. A Dynamic Theory of Organizational Knowledge Creation. Organization Science 5(1)
14-37.
Nonaka, I., G. Von Krogh. 2009. Perspective: Tacit Knowledge nnd Knowledge Conversion: Controversy
and Advancement in Organizational Knowledge Creation Theory. Organization Science 20(3) 635-
652.
Polanyi, M. 1966. The Tacit Dimension. New York: Anchor Day Books.
Singer, N., R. Ableson. 2011. Can Johnson & Johnson Get its Act Together? New York Times January 15.
28
Sodhi, M.S., C.S. Tang. 2012. Application: Mitigating New Product Development Risks—the Case of the
Boeing 787 Dreamliner. In Managing Supply Chain Risk. International Series in Operations Research
& Management Science, Springer US 161-79.
Thompson, P. 2007. How Much Did the Liberty Shipbuilders Forget? Management Science 53(6) 908-
918.
Weldon, M.S., K.D. Bellinger. 1997. Collective Memory: Collaborative and Individual Processes in
Remembering. Journal of Experimental Psychology-Learning Memory and Cognition 23(5) 1160-
1175.
Wooldridge, J. 2002. Econometric Analysis of Cross Section and Panel Data. 2nd ed. MIT Press, USA.
Wright, T.P. 1936. Factors Affecting the Cost of Airplanes. Journal of the Aeronautical Sciences 3(4)
122-28.
Zack, M. H. 1999. Managing Codified Knowledge. Sloan Management Review 40(4) 45-58.
Zander, U., B. Kogut. 1995. Knowledge and the Speed of the Transfer and Imitation of Organizational
Capabilities: An Empirical Test. Organization Science 6(1) 76-92.
Zollo M., S. G. Winter. 2002. Deliberate Learning and the Evolution of Dynamic capabilities.
Organization Science 13(3) 339-351.
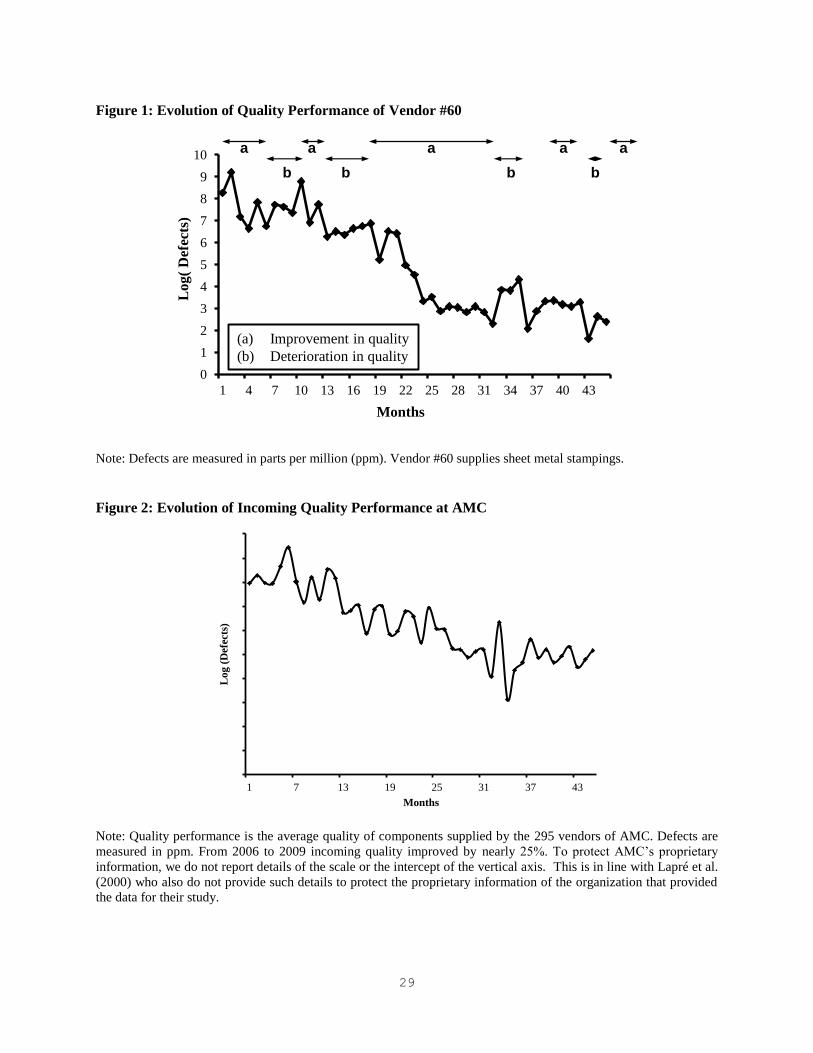
29
Figure 1: Evolution of Quality Performance of Vendor #60
Note: Defects are measured in parts per million (ppm). Vendor #60 supplies sheet metal stampings.
Figure 2: Evolution of Incoming Quality Performance at AMC
Note: Quality performance is the average quality of components supplied by the 295 vendors of AMC. Defects are
measured in ppm. From 2006 to 2009 incoming quality improved by nearly 25%. To protect AMC’s proprietary
information, we do not report details of the scale or the intercept of the vertical axis. This is in line with Lapré et al.
(2000) who also do not provide such details to protect the proprietary information of the organization that provided
the data for their study.
0
1
2
3
4
5
6
7
8
9
10
1 4 7 10 13 16 19 22 25 28 31 34 37 40 43
Months
Log
( D
efec
ts)
a
b
a
b
a
b
a
(a) Improvement in quality
(b) Deterioration in quality
a
b
3
4
4
5
5
6
6
7
7
8
8
1 7 13 19 25 31 37 43
Lo
g (
Def
ects
)
Months
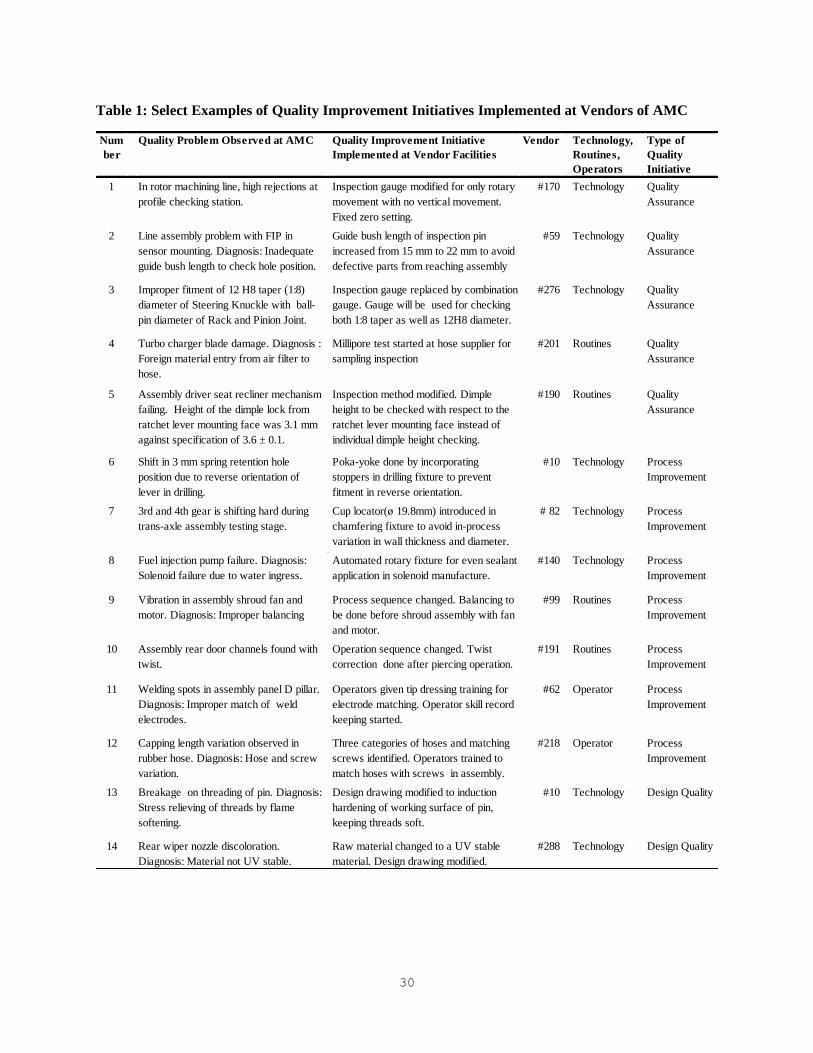
30
Table 1: Select Examples of Quality Improvement Initiatives Implemented at Vendors of AMC
Num
ber
Quality Problem Observed at AMC Quality Improvement Initiative
Implemented at Vendor Facilities
Vendor Technology,
Routines,
Operators
Type of
Quality
Initiative
1 In rotor machining line, high rejections at
profile checking station.
Inspection gauge modified for only rotary
movement with no vertical movement.
Fixed zero setting.
#170 Technology Quality
Assurance
2 Line assembly problem with FIP in
sensor mounting. Diagnosis: Inadequate
guide bush length to check hole position.
Guide bush length of inspection pin
increased from 15 mm to 22 mm to avoid
defective parts from reaching assembly
#59 Technology Quality
Assurance
3 Improper fitment of 12 H8 taper (1:8)
diameter of Steering Knuckle with ball-
pin diameter of Rack and Pinion Joint.
Inspection gauge replaced by combination
gauge. Gauge will be used for checking
both 1:8 taper as well as 12H8 diameter.
#276 Technology Quality
Assurance
4 Turbo charger blade damage. Diagnosis :
Foreign material entry from air filter to
hose.
Millipore test started at hose supplier for
sampling inspection
#201
Routines Quality
Assurance
5 Assembly driver seat recliner mechanism
failing. Height of the dimple lock from
ratchet lever mounting face was 3.1 mm
against specification of 3.6 ± 0.1.
Inspection method modified. Dimple
height to be checked with respect to the
ratchet lever mounting face instead of
individual dimple height checking.
#190 Routines Quality
Assurance
6 Shift in 3 mm spring retention hole
position due to reverse orientation of
lever in drilling.
Poka-yoke done by incorporating
stoppers in drilling fixture to prevent
fitment in reverse orientation.
#10 Technology Process
Improvement
7 3rd and 4th gear is shifting hard during
trans-axle assembly testing stage.
Cup locator(ø 19.8mm) introduced in
chamfering fixture to avoid in-process
variation in wall thickness and diameter.
# 82 Technology Process
Improvement
8 Fuel injection pump failure. Diagnosis:
Solenoid failure due to water ingress.
Automated rotary fixture for even sealant
application in solenoid manufacture.
#140 Technology Process
Improvement
9 Vibration in assembly shroud fan and
motor. Diagnosis: Improper balancing
Process sequence changed. Balancing to
be done before shroud assembly with fan
and motor.
#99 Routines Process
Improvement
10 Assembly rear door channels found with
twist.
Operation sequence changed. Twist
correction done after piercing operation.
#191 Routines Process
Improvement
11 Welding spots in assembly panel D pillar.
Diagnosis: Improper match of weld
electrodes.
Operators given tip dressing training for
electrode matching. Operator skill record
keeping started.
#62 Operator Process
Improvement
12 Capping length variation observed in
rubber hose. Diagnosis: Hose and screw
variation.
Three categories of hoses and matching
screws identified. Operators trained to
match hoses with screws in assembly.
#218 Operator Process
Improvement
13 Breakage on threading of pin. Diagnosis:
Stress relieving of threads by flame
softening.
Design drawing modified to induction
hardening of working surface of pin,
keeping threads soft.
#10 Technology Design Quality
14 Rear wiper nozzle discoloration.
Diagnosis: Material not UV stable.
Raw material changed to a UV stable
material. Design drawing modified.
#288 Technology Design Quality
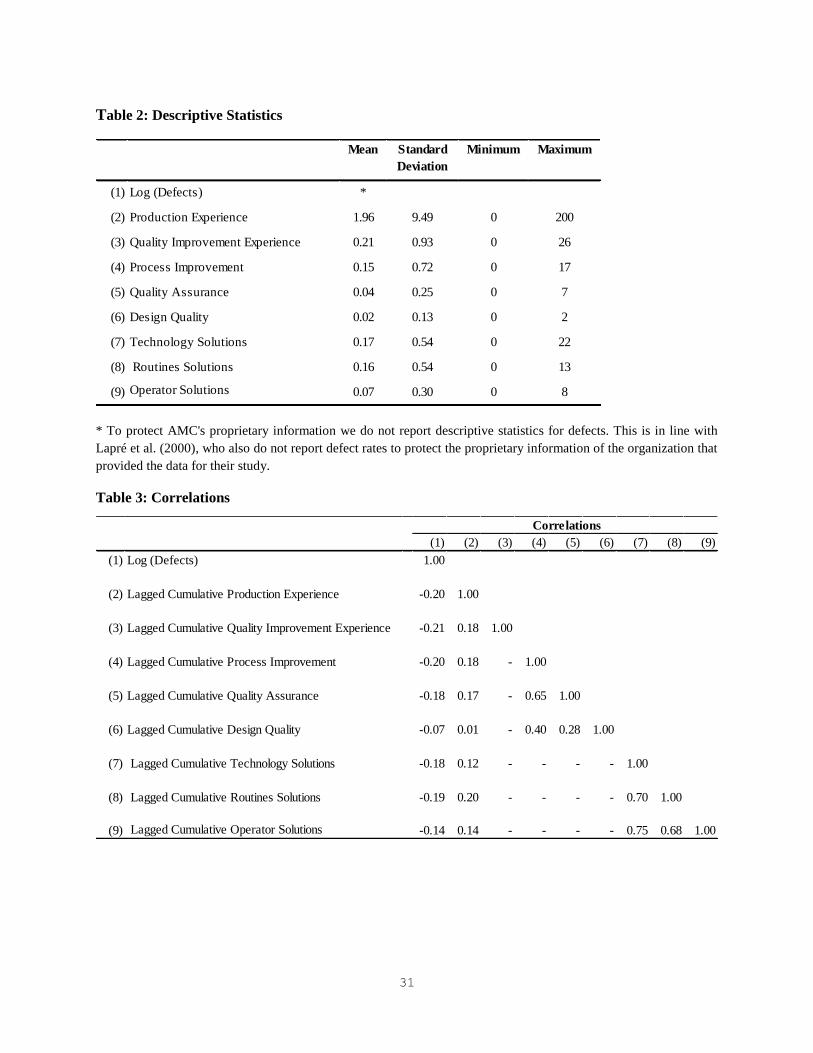
31
Table 2: Descriptive Statistics
* To protect AMC's proprietary information we do not report descriptive statistics for defects. This is in line with
Lapré et al. (2000), who also do not report defect rates to protect the proprietary information of the organization that
provided the data for their study.
Table 3: Correlations
(1) Log (Defects)
(2) Production Experience 1.96 9.49 0 200
(3) Quality Improvement Experience 0.21 0.93 0 26
(4) Process Improvement 0.15 0.72 0 17
(5) Quality Assurance 0.04 0.25 0 7
(6) Design Quality 0.02 0.13 0 2
(7) Technology Solutions 0.17 0.54 0 22
(8) Routines Solutions 0.16 0.54 0 13
(9) 0.07 0.30 0 8 Operator Solutions
Minimum Maximum
*
Mean Standard
Deviation
(1) (2) (3) (4) (5) (6) (7) (8) (9)
(1) Log (Defects) 1.00
(2) Lagged Cumulative Production Experience -0.20 1.00
(3) Lagged Cumulative Quality Improvement Experience -0.21 0.18 1.00
(4) Lagged Cumulative Process Improvement -0.20 0.18 - 1.00
(5) Lagged Cumulative Quality Assurance -0.18 0.17 - 0.65 1.00
(6) Lagged Cumulative Design Quality -0.07 0.01 - 0.40 0.28 1.00
(7) Lagged Cumulative Technology Solutions -0.18 0.12 - - - - 1.00
(8) Lagged Cumulative Routines Solutions -0.19 0.20 - - - - 0.70 1.00
(9) Lagged Cumulative Operator Solutions -0.14 0.14 - - - - 0.75 0.68 1.00
Correlations
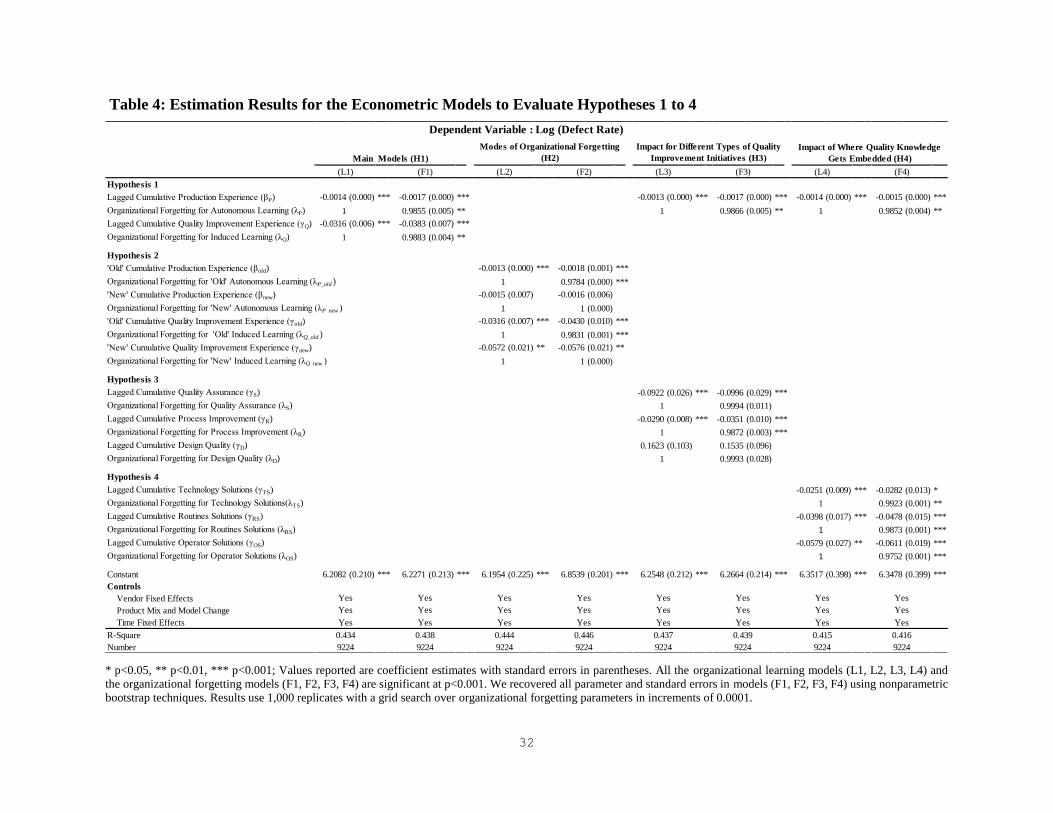
32
Table 4: Estimation Results for the Econometric Models to Evaluate Hypotheses 1 to 4
* p<0.05, ** p<0.01, *** p<0.001; Values reported are coefficient estimates with standard errors in parentheses. All the organizational learning models (L1, L2, L3, L4) and
the organizational forgetting models (F1, F2, F3, F4) are significant at p<0.001. We recovered all parameter and standard errors in models (F1, F2, F3, F4) using nonparametric
bootstrap techniques. Results use 1,000 replicates with a grid search over organizational forgetting parameters in increments of 0.0001.
Hypothesis 1
Lagged Cumulative Production Experience (βP) -0.0014 (0.000) *** -0.0017 (0.000) *** -0.0013 (0.000) *** -0.0017 (0.000) *** -0.0014 (0.000) *** -0.0015 (0.000) ***
Organizational Forgetting for Autonomous Learning (λP) 1 0.9855 (0.005) ** 1 0.9866 (0.005) ** 1 0.9852 (0.004) **
Lagged Cumulative Quality Improvement Experience (γQ) -0.0316 (0.006) *** -0.0383 (0.007) ***
Organizational Forgetting for Induced Learning (λQ) 1 0.9883 (0.004) **
Hypothesis 2
'Old' Cumulative Production Experience (βold) -0.0013 (0.000) *** -0.0018 (0.001) ***
Organizational Forgetting for 'Old' Autonomous Learning (λP_old ) 1 0.9784 (0.000) ***
'New' Cumulative Production Experience (βnew) -0.0015 (0.007) -0.0016 (0.006)
Organizational Forgetting for 'New' Autonomous Learning (λP_new ) 1 1 (0.000)
'Old' Cumulative Quality Improvement Experience (γold) -0.0316 (0.007) *** -0.0430 (0.010) ***
Organizational Forgetting for 'Old' Induced Learning (λQ_old ) 1 0.9831 (0.001) ***
'New' Cumulative Quality Improvement Experience (γnew) -0.0572 (0.021) ** -0.0576 (0.021) **
Organizational Forgetting for 'New' Induced Learning (λQ_new ) 1 1 (0.000)
Hypothesis 3
Lagged Cumulative Quality Assurance (γS) -0.0922 (0.026) *** -0.0996 (0.029) ***
Organizational Forgetting for Quality Assurance (λS) 1 0.9994 (0.011)
Lagged Cumulative Process Improvement (γR) -0.0290 (0.008) *** -0.0351 (0.010) ***
Organizational Forgetting for Process Improvement (λR) 1 0.9872 (0.003) ***
Lagged Cumulative Design Quality (γD) 0.1623 (0.103) 0.1535 (0.096)
Organizational Forgetting for Design Quality (λD) 1 0.9993 (0.028)
Hypothesis 4
Lagged Cumulative Technology Solutions (γTS) -0.0251 (0.009) *** -0.0282 (0.013) *
Organizational Forgetting for Technology Solutions(λTS) 1 0.9923 (0.001) **
Lagged Cumulative Routines Solutions (γRS) -0.0398 (0.017) *** -0.0478 (0.015) ***
Organizational Forgetting for Routines Solutions (λRS) 1 0.9873 (0.001) ***
Lagged Cumulative Operator Solutions (γOS) -0.0579 (0.027) ** -0.0611 (0.019) ***
Organizational Forgetting for Operator Solutions (λOS) 1 0.9752 (0.001) ***
Constant 6.2082 (0.210) *** 6.2271 (0.213) *** 6.1954 (0.225) *** 6.8539 (0.201) *** 6.2548 (0.212) *** 6.2664 (0.214) *** 6.3517 (0.398) *** 6.3478 (0.399) ***
Controls
Vendor Fixed Effects
Product Mix and Model Change
Time Fixed Effects
R-Square
Number
Dependent Variable : Log (Defect Rate)
9224 9224
Modes of Organizational Forgetting
(H2)
Impact for Different Types of Quality
Improvement Initiatives (H3)
Impact of Where Quality Knowledge
Gets Embedded (H4)
9224 9224 9224 9224 9224 9224
Yes Yes
0.434 0.415 0.416
Yes Yes Yes Yes Yes Yes
0.438 0.444 0.446 0.437 0.439
Yes Yes
Yes Yes Yes Yes Yes Yes Yes Yes
Yes Yes Yes Yes Yes Yes
(L3) (F3) (L4) (F4)
Main Models (H1)
(L1) (F1) (L2) (F2)
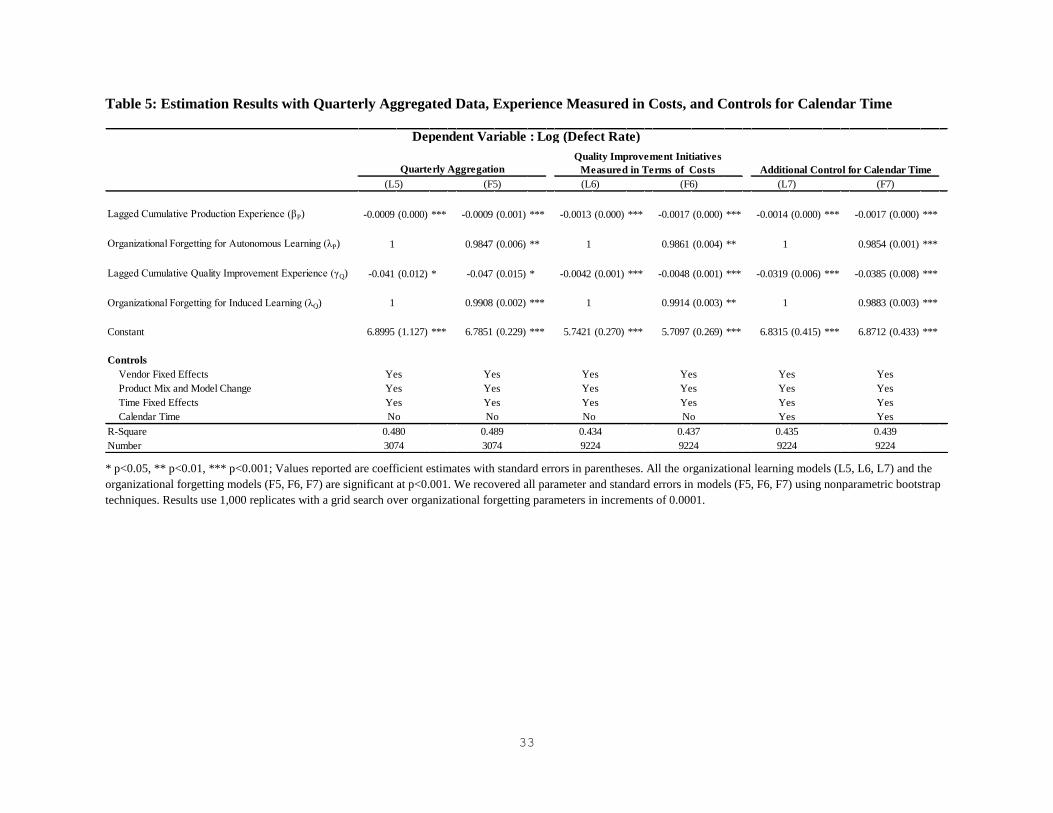
33
Table 5: Estimation Results with Quarterly Aggregated Data, Experience Measured in Costs, and Controls for Calendar Time
* p<0.05, ** p<0.01, *** p<0.001; Values reported are coefficient estimates with standard errors in parentheses. All the organizational learning models (L5, L6, L7) and the
organizational forgetting models (F5, F6, F7) are significant at p<0.001. We recovered all parameter and standard errors in models (F5, F6, F7) using nonparametric bootstrap
techniques. Results use 1,000 replicates with a grid search over organizational forgetting parameters in increments of 0.0001.
Lagged Cumulative Production Experience (βP) -0.0009 (0.000) *** -0.0009 (0.001) *** -0.0013 (0.000) *** -0.0017 (0.000) *** -0.0014 (0.000) *** -0.0017 (0.000) ***
Organizational Forgetting for Autonomous Learning (λP) 1 0.9847 (0.006) ** 1 0.9861 (0.004) ** 1 0.9854 (0.001) ***
Lagged Cumulative Quality Improvement Experience (γQ) -0.041 (0.012) * -0.047 (0.015) * -0.0042 (0.001) *** -0.0048 (0.001) *** -0.0319 (0.006) *** -0.0385 (0.008) ***
Organizational Forgetting for Induced Learning (λQ) 1 0.9908 (0.002) *** 1 0.9914 (0.003) ** 1 0.9883 (0.003) ***
Constant 6.8995 (1.127) *** 6.7851 (0.229) *** 5.7421 (0.270) *** 5.7097 (0.269) *** 6.8315 (0.415) *** 6.8712 (0.433) ***
Controls
Vendor Fixed Effects
Product Mix and Model Change
Time Fixed Effects
Calendar Time
R-Square
Number
(F6)(L6) (L7) (F7)
Additional Control for Calendar Time
Yes Yes Yes Yes Yes Yes
Yes Yes Yes Yes Yes Yes
Quality Improvement Initiatives
Measured in Terms of Costs
(L5) (F5)
Yes
Yes Yes Yes Yes Yes
Yes
0.489
No No No No
Dependent Variable : Log (Defect Rate)
Quarterly Aggregation
Yes
0.480
3074 3074 9224 9224 9224 9224
0.4390.4350.4370.434
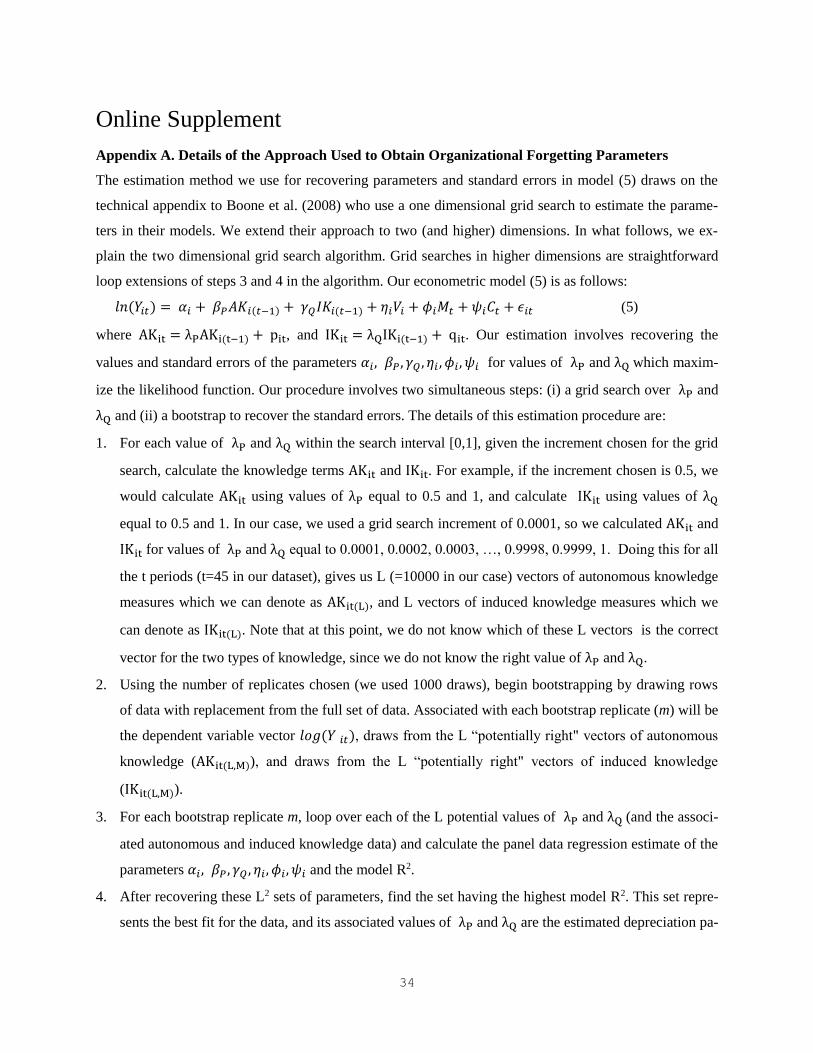
34
Online Supplement
Appendix A. Details of the Approach Used to Obtain Organizational Forgetting Parameters
The estimation method we use for recovering parameters and standard errors in model (5) draws on the
technical appendix to Boone et al. (2008) who use a one dimensional grid search to estimate the parame-
ters in their models. We extend their approach to two (and higher) dimensions. In what follows, we ex-
plain the two dimensional grid search algorithm. Grid searches in higher dimensions are straightforward
loop extensions of steps 3 and 4 in the algorithm. Our econometric model (5) is as follows:
𝑙𝑛(𝑌𝑖𝑡) = 𝛼𝑖 + 𝛽𝑃𝐴𝐾𝑖(𝑡−1) + 𝛾𝑄𝐼𝐾𝑖(𝑡−1) + 𝜂𝑖𝑉𝑖 + 𝜙𝑖𝑀𝑡 + 𝜓𝑖𝐶𝑡 + 𝜖𝑖𝑡 (5)
where AKit = λPAKi(t−1) + pit, and IKit = λQIKi(t−1) + qit. Our estimation involves recovering the
values and standard errors of the parameters 𝛼𝑖, 𝛽𝑃 , 𝛾𝑄 , 𝜂𝑖 , 𝜙𝑖, 𝜓𝑖 for values of λP and λQ which maxim-
ize the likelihood function. Our procedure involves two simultaneous steps: (i) a grid search over λP and
λQ and (ii) a bootstrap to recover the standard errors. The details of this estimation procedure are:
1. For each value of λP and λQ within the search interval [0,1], given the increment chosen for the grid
search, calculate the knowledge terms AKit and IKit. For example, if the increment chosen is 0.5, we
would calculate AKit using values of λP equal to 0.5 and 1, and calculate IKit using values of λQ
equal to 0.5 and 1. In our case, we used a grid search increment of 0.0001, so we calculated AKit and
IKit for values of λP and λQ equal to 0.0001, 0.0002, 0.0003, …, 0.9998, 0.9999, 1. Doing this for all
the t periods (t=45 in our dataset), gives us L (=10000 in our case) vectors of autonomous knowledge
measures which we can denote as AKit(L), and L vectors of induced knowledge measures which we
can denote as IKit(L). Note that at this point, we do not know which of these L vectors is the correct
vector for the two types of knowledge, since we do not know the right value of λP and λQ.
2. Using the number of replicates chosen (we used 1000 draws), begin bootstrapping by drawing rows
of data with replacement from the full set of data. Associated with each bootstrap replicate (m) will be
the dependent variable vector 𝑙𝑜𝑔(𝑌 𝑖𝑡), draws from the L “potentially right" vectors of autonomous
knowledge (AKit(L,M)), and draws from the L “potentially right" vectors of induced knowledge
(IKit(L,M)).
3. For each bootstrap replicate m, loop over each of the L potential values of λP and λQ (and the associ-
ated autonomous and induced knowledge data) and calculate the panel data regression estimate of the
parameters 𝛼𝑖, 𝛽𝑃 , 𝛾𝑄 , 𝜂𝑖, 𝜙𝑖, 𝜓𝑖 and the model R2.
4. After recovering these L2 sets of parameters, find the set having the highest model R2. This set repre-
sents the best fit for the data, and its associated values of λP and λQ are the estimated depreciation pa-
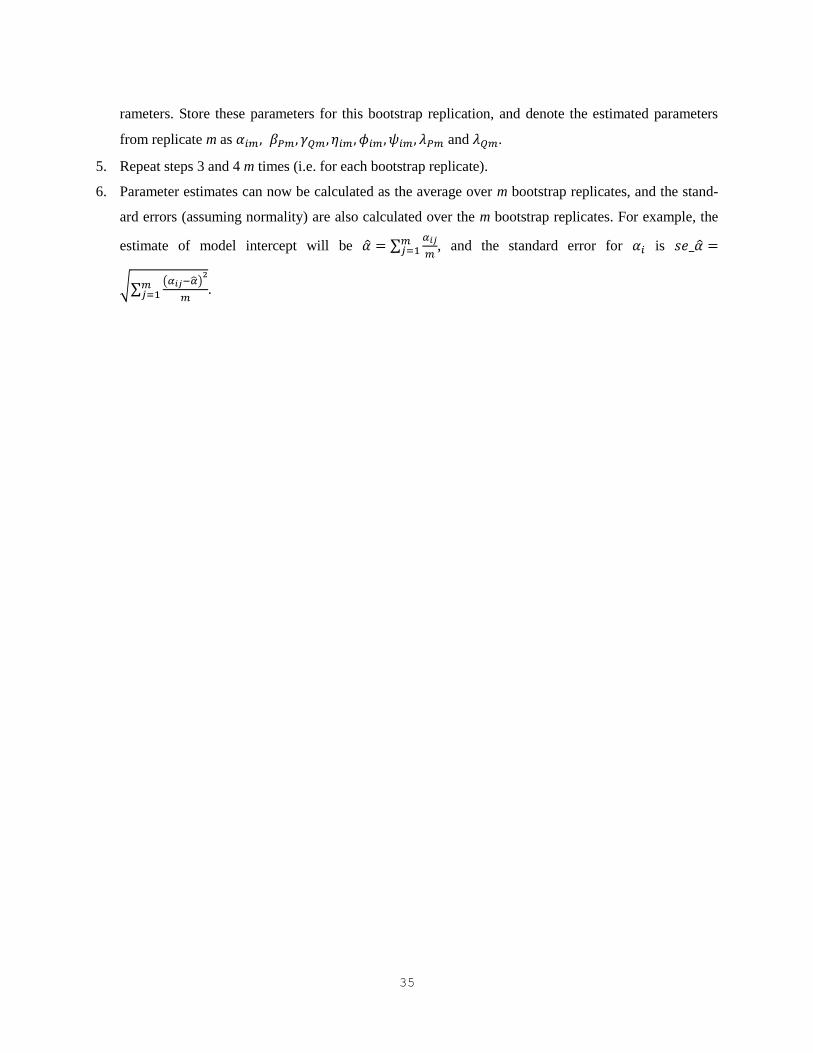
35
rameters. Store these parameters for this bootstrap replication, and denote the estimated parameters
from replicate m as 𝛼𝑖𝑚, 𝛽𝑃𝑚, 𝛾𝑄𝑚, 𝜂𝑖𝑚, 𝜙𝑖𝑚, 𝜓𝑖𝑚, 𝜆𝑃𝑚 and 𝜆𝑄𝑚.
5. Repeat steps 3 and 4 m times (i.e. for each bootstrap replicate).
6. Parameter estimates can now be calculated as the average over m bootstrap replicates, and the stand-
ard errors (assuming normality) are also calculated over the m bootstrap replicates. For example, the
estimate of model intercept will be �̂� = ∑𝛼𝑖𝑗
𝑚𝑚𝑗=1 , and the standard error for 𝛼𝑖 is 𝑠𝑒_�̂� =
√∑(𝛼𝑖𝑗−�̂�)
2
𝑚𝑚𝑗=1 .

![[PPT]Forgetting - WordPress.com · Web view2016/01/01 · Forgetting Aim Identify explanations of forgetting Explain what is meant by trace decay, displacement, interference, retrieval](https://img.pdfslide.us/doc/110x75/5ae895fd7f8b9aee078fb4cb/pptforgetting-view20160101forgetting-aim-identify-explanations-of-forgetting.jpg)