Embed Size (px)
Citation preview
1
An application of the Rasch measurement theory to an assessment of
geometric thinking levels
Gerrit Stols1*
, Caroline Long1 and Tim Dunne
2
1University of Pretoria, South Africa;
2University of Cape Town, South Africa
Corresponding author: Gerrit Stols: [email protected]
Abstract
The purpose of this study is to apply the Rasch model to investigate both the Van Hiele
theory for geometric development and an associated test. In terms of the test, the objective is
to investigate the functioning of a classic 25-item instrument designed to identify levels of
geometric proficiency. The data set consists of responses by 244 students (106 for a pre-test
and 138 for a post-test) of which 76 students sat both the pre-test and the post-test. The
summary item statistics do not show statistically discernible differences between observed
and expected scores under the Rasch model (Chi-square statistic). The Rasch analysis
confirms to some strong extent the Van Hiele theory of geometric development. The study
identifies some problematic test items as they only require knowledge of a specific aspect of
geometry instead of testing geometric reasoning. In terms of the Van Hiele theory, the Rasch
analyses identified as problematic some items about class inclusion, an issue which has also
been raised in other studies.
Keywords: Item difficulty, Geometric thinking levels, Rasch analyses, Van Hiele theory,
model fit
Introduction
The Van Hiele theory has made a significant impact worldwide in terms of geometry
education, particularly after its impact on Russian mathematics education became known
internationally (Larew, 1999; Martin, 2007). The theory proposes five hierarchical, sequential
and discrete levels of geometric development that are dependent on a learner’s experience.
The levels, as described by Larew (1999) are as follows:
Level 1 (visual recognition): Learners recognise a shape as a whole and distinguish a
given shape from others.
Level 2 (analysis of properties): Learners are aware of and recognise specific parts
and properties of figures but cannot see relationships between these properties.
Level 3 (informal deduction): Learners see the relationships between the parts and
properties of figures. Reasoning on this level includes the use of logical implications
and of justification of a step and therefore also (some simple forms of) class inclusion.
Level 4 (formal deduction): Learners understand the role of definitions and can
construct a multi-step proof.
Level 5 (rigor): Learners use logical reasoning to construct valid arguments which
include the use of indirect proofs and of proof by contrapositive. Learners can analyse
proofs, comprehend formal deduction and understand how deduction is based on a set
of postulates.
The Van Hieles originally numbered the Levels from 0 to 4 but Clements and Battista (1992)
suggested numbering the Levels from 1 to 5 instead to make provision for a pre-recognition
level, called Level 0. The Van Hiele theory also received other criticism over the years.
2
Criticism included the claim that these levels are discrete and hierarchical. A study by Smith
(1987) revealed that students frequently find questions about hierarchical classification or
class inclusion (Level 3) more difficult than some higher-level questions (on Levels 4 and 5).
This problem has also been identified by De Villiers who notes that “two aspects of the Van
Hiele theory need clarification and further research, namely a refinement with regard to the
levels at which deduction (as justification, explanation and systematisation) is supposed to
occur, as well as the relationship between hierarchical thinking and deduction” (1987, p. 24).
Mayberry (1983) developed an instrument and used it to assess pre-service teachers’
geometric understanding. In her examination of individual questions some patterns emerged.
These patterns also emerged in students’ responses in a similar study by Lawrie (1996) with
Australian teachers. Some of the patterns include that “many students do not have an
understanding of class inclusion, for example, do not recognise a square as a rectangle; most
students do not understand the difference between necessary and sufficient conditions; the
majority of students who had completed a senior secondary geometry course in which the
content was Level 3 or higher, were not able to demonstrate Level 3 insight in their
responses” (Lawrie, 1996, p. 349). Usiskin concluded back in 1982 that Level 5 does not
exist or is not testable. Wilson (1990) did a reanalyses of a Van Hiele test which supports the
Van Hiele order except for the items in the last level.
The problem to be addressed in this paper concerns both the five levels, as defined originally
by Van Hiele (1986), and the assessment of these levels by a test to operationalise the five
levels developed by Usiskin and his colleagues (Usiskin, 1982). The test instrument was
originally part of a large-scale study, the Cognitive Development and Achievement in
Secondary School Geometry (CDASSG) project. The aim of CDASSG project was to
determine whether or not students’ geometric cognitive levels could be aligned with the Van
Hiele levels (Usiskin, 1982). To ensure the content validity of the test, the CDASSG team
examined nine original Van Hiele writings for quotes that described behaviours of students at
each given level (Usiskin, 1982). The test consists of 25 items, with 5 items constructed at
each level. The sequential order of the five levels of items matched the Van Hiele levels, but
the ordering of the associated five items within any level was not assumed to be inherently
meaningful. All the items were of the multiple-choice type with five options for each
question.
In order to investigate any plausible effects of a six month geometry course given to pre-
service teachers at the University of Pretoria, the CDASSG Van Hiele Geometry Test was
administered to two year cohorts of mathematics education students, both before embarking
on the course and after completion, for the purpose of assessing progress by the students
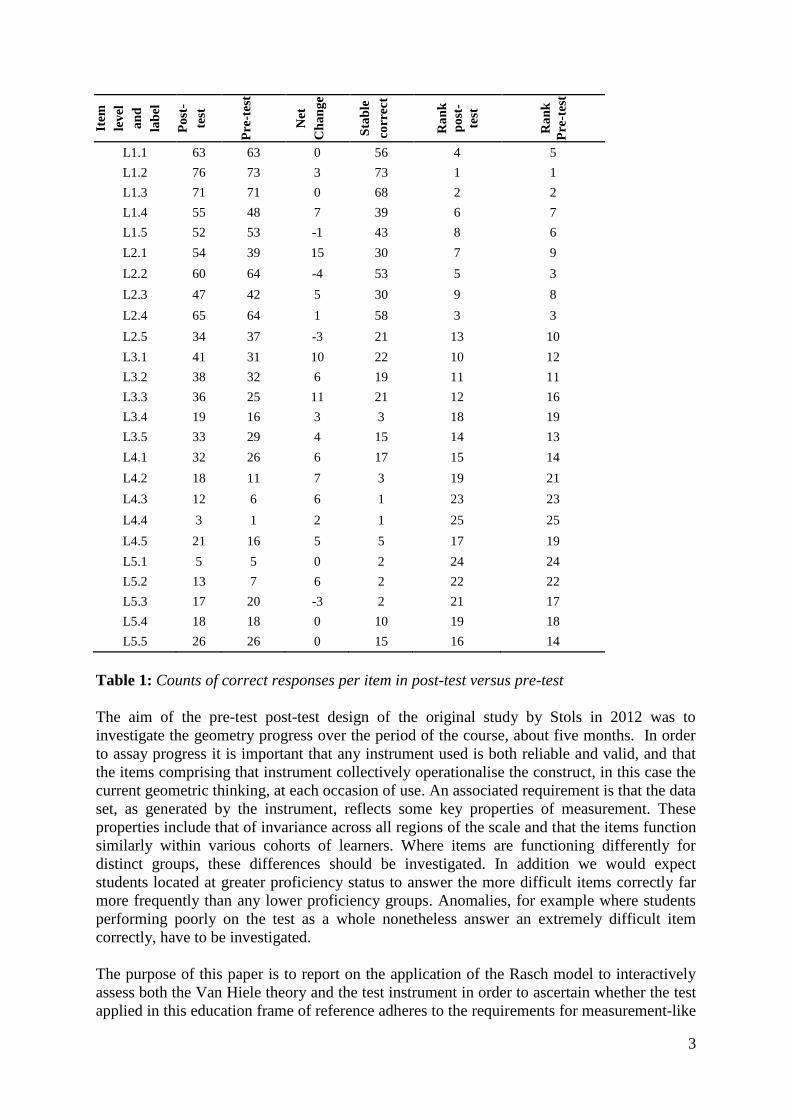
(Stols, 2012). Initial observations, from the data of 76 students writing both the test and
retest, were that for 4 of the 25 items, the pre-test percentage correct was greater than the
post-test percentage correct (see items 5, 7, 10, and 23 in Table 1).
In this study there was a definite descending pattern in counts of correct answers within the
levels from Level 1 (Q1 to Q5) through to Level 4 (Q16 to Q20), as predicted by the Van
Hiele theory. This pattern was, however, not maintained into the Level 5 (Q21 to Q25)
questions. The students performed slightly better on the set of Level 5 items compared to the
set of Level 4 items. This problem of anomalous frequencies for the presumed monotonic
ordering of levels has also been observed by other researchers (e.g. Wilson, 1990).
3
Item
lev
el
an
d
lab
el
Po
st-
test
Pre
-tes
t
Net
Ch
an
ge
Sta
ble
corr
ect
Ra
nk
po
st-
test
Ra
nk
Pre
-tes
t
L1.1 63 63 0 56 4 5
L1.2 76 73 3 73 1 1
L1.3 71 71 0 68 2 2
L1.4 55 48 7 39 6 7
L1.5 52 53 -1 43 8 6
L2.1 54 39 15 30 7 9
L2.2 60 64 -4 53 5 3
L2.3 47 42 5 30 9 8
L2.4 65 64 1 58 3 3
L2.5 34 37 -3 21 13 10
L3.1 41 31 10 22 10 12
L3.2 38 32 6 19 11 11
L3.3 36 25 11 21 12 16
L3.4 19 16 3 3 18 19
L3.5 33 29 4 15 14 13
L4.1 32 26 6 17 15 14
L4.2 18 11 7 3 19 21
L4.3 12 6 6 1 23 23
L4.4 3 1 2 1 25 25
L4.5 21 16 5 5 17 19
L5.1 5 5 0 2 24 24
L5.2 13 7 6 2 22 22
L5.3 17 20 -3 2 21 17
L5.4 18 18 0 10 19 18
L5.5 26 26 0 15 16 14
Table 1: Counts of correct responses per item in post-test versus pre-test
The aim of the pre-test post-test design of the original study by Stols in 2012 was to
investigate the geometry progress over the period of the course, about five months. In order
to assay progress it is important that any instrument used is both reliable and valid, and that
the items comprising that instrument collectively operationalise the construct, in this case the
current geometric thinking, at each occasion of use. An associated requirement is that the data
set, as generated by the instrument, reflects some key properties of measurement. These
properties include that of invariance across all regions of the scale and that the items function
similarly within various cohorts of learners. Where items are functioning differently for
distinct groups, these differences should be investigated. In addition we would expect
students located at greater proficiency status to answer the more difficult items correctly far
more frequently than any lower proficiency groups. Anomalies, for example where students
performing poorly on the test as a whole nonetheless answer an extremely difficult item
correctly, have to be investigated.
The purpose of this paper is to report on the application of the Rasch model to interactively
assess both the Van Hiele theory and the test instrument in order to ascertain whether the test
applied in this education frame of reference adheres to the requirements for measurement-like
4
interpretations. When such interpretations are admissible, they allow for confident inferences
and comparisons of the locations of items and of student proficiencies, which may inform
educational objectives. An application of the Rasch model requires interactive engagement
with both theoretical and empirical components to warrant its use as evidence for its validity,
reliability and inferred consequences.
Research problem
The problem to be addressed in this paper concerns both the Van Hiele theory and the
CDASSG Van Hiele Geometry Test. In terms of the test, the objective is to report on the
functioning of the test instrument for identifying five hierarchical levels of geometric
proficiency. In relation to this objective we seek empirical evidence for the instrument, as
structured according to the Levels 1 to 5, to be deemed valid and reliable. Here we ask
whether the items in the postulated levels function in either a strongly or coherently
hierarchical manner. Where there are level anomalies, we seek to provide an explanation for
the contrast in observed order against a theoretical perspective of the items. The theory
supporting the instrument will also come under the spotlight in that, though the instrument
may be operationalizing the theory, the theory itself may not provide a model of growth in
geometric proficiency, or the theory may, as suggested by De Villiers (1987), require
additional theoretical work.
Research Design
The reason for applying the Rasch model was firstly, to check the targeting and reliability of
the test instrument in a new context, secondly, to investigate to what extent the data fit the
model,1 and where there are anomalies, to attempt to explain these anomalies. Thirdly, we
investigated items for differential item functioning (DIF) that is the phenomenon that persons
of the same apparent proficiency as measured on the test, but from different groupings,
generate discernibly distinct location estimates on a particular item. Because the test is
designed to include locations of geometric proficiency that are above the current locations of
some of the persons tested, there may be guessing by lower proficiency persons in some of
the more difficult items. For some problematic items we investigated the functioning of the
distractors. The presence of guessing was explored, and a strategy, a tailored analysis, was
implemented to counter some of the misleading effects of guessing.
For the theoretical investigation of the instrument the data was arranged as two sets of
persons, that is the “pre-test persons” and then the “post-test persons”, and each set was
regarded as completely different persons. This approach is termed a stack analysis.2 The
stack data set size is 244 students but includes the 76 who sat both the pre- and the post-test,
as 152 (76 x 2).
This data set is slightly on the small side for the Rasch analysis of a 25-item test, and thus
may present some limitations. The general rule of thumb for the construction, development
and review of test instruments is that the learner count is at least ten times the maximum
score count, which would mean 250 students. In the case of this study, the information
obtained from the small group is cross-referenced with substantive analysis and may
1 For a detailed explanation of the Rasch model and its requirements see Andrich (1988), Dunne, Long, Craig &
Venter (2012). 2 The stack analysis was deemed preferable over the rack analysis for our exploratory purposes as the second
approach declares a large segment of missing data in this study. For more detail on this analytic approach see
Marais & Andrich (2011).
5
therefore be generalizable in the sense that the same principles will apply in other similar
situations. The results of this analysis will therefore be admissible within the current
theoretical debates.
The parameterisation of the Rasch model used for this study was the dichotomous model as
the responses were judged either correct or incorrect, and scores given as 1 or 0. The question
was raised whether alternative part marks options (e.g. 0, 1, 2) could be awarded in some
items where particular distractors appeared very close to correct or exhibited greater
geometric insight than the item’s other distractors. The decision was made to adhere to the
original test design, and award a correct mark only to the highest sense of correct, for the first
phase of the investigation.3
This stack analysis involved 244 students offering (up to) 25 responses. The intention in this
phase of the study was to investigate the functioning of the test instrument rather than the
proficiency changes over time. The analysis includes:
Checking the reliability, item and person fit of the data set to the model, according to
fit residual, chi-square and chi square probability indicators
Checking the item characteristic curves (ICCs) of all items for over-discrimination
and under-discrimination on the test as a whole. The ICC presents a comparison of the
expected level of difficulty and the empirical difficulty as observed in this data set.
The multiple choice distractor plots were checked and where the correct option
appeared to be selected by few students, this outcome was noted and the item scoring
was rechecked
Correcting for guessing outcomes amongst the participants with lower proficiency
levels was implemented. Here a tailored analysis imposes a missing status for correct
responses so far above the performance location of the respondent as to be
implausible and therefore uninformative.
With the measurement-related issues resolved as far as possible, and with the data apparently
fitting the model, the theoretical issues were investigated, and the anomalies highlighted. It
was hypothesised prior to the analysis that the anomalies observed would raise interesting
questions with regard to the structure and adequacy of Van Hiele levels. This study also
raised interesting questions with regard to the formulation of the items in this test instrument
and suggested some revisions of the questions themselves. A further aspect of interest is the
application of the Van Hiele theory for the learning and teaching of geometry, and the use of
the instrument for assessment of proficiency change over time.
Results
The summary item statistics were deemed acceptable (see Table 2). They do not show
statistically discernible differences between observed and expected scores under the Rasch
model (Chi-square statistic). The person separation index (PSI) is low, indicating poor
separation of proficiencies in this context associated with limited spread of person locations
along the scale. This low PSI may be a function of the homogeneous group to whom the test
was administered - all were aspiring mathematics teachers doing the same geometry course,
and all in the third year of their study. The poor separation may also indicate response
dependency, that is answering more difficult questions correctly is linked to answering earlier
questions correctly. However, this linkage feature is built into the design of the test and the
3 A second phase could include awarding graded marks for highest sense of correct (2 marks) and partially
correct (1 mark).
6
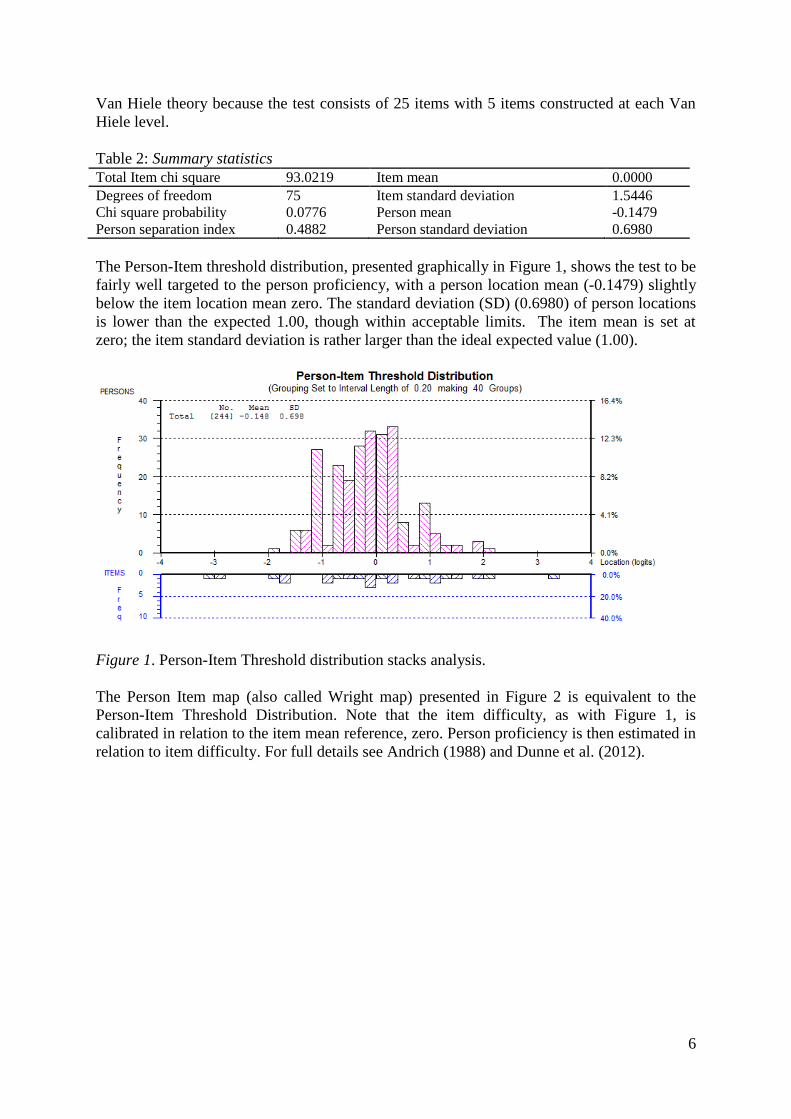
Van Hiele theory because the test consists of 25 items with 5 items constructed at each Van
Hiele level.
Table 2: Summary statistics
Total Item chi square 93.0219 Item mean 0.0000
Degrees of freedom 75 Item standard deviation 1.5446
Chi square probability 0.0776 Person mean -0.1479
Person separation index 0.4882 Person standard deviation 0.6980
The Person-Item threshold distribution, presented graphically in Figure 1, shows the test to be
fairly well targeted to the person proficiency, with a person location mean (-0.1479) slightly
below the item location mean zero. The standard deviation (SD) (0.6980) of person locations
is lower than the expected 1.00, though within acceptable limits. The item mean is set at
zero; the item standard deviation is rather larger than the ideal expected value (1.00).
Figure 1. Person-Item Threshold distribution stacks analysis.
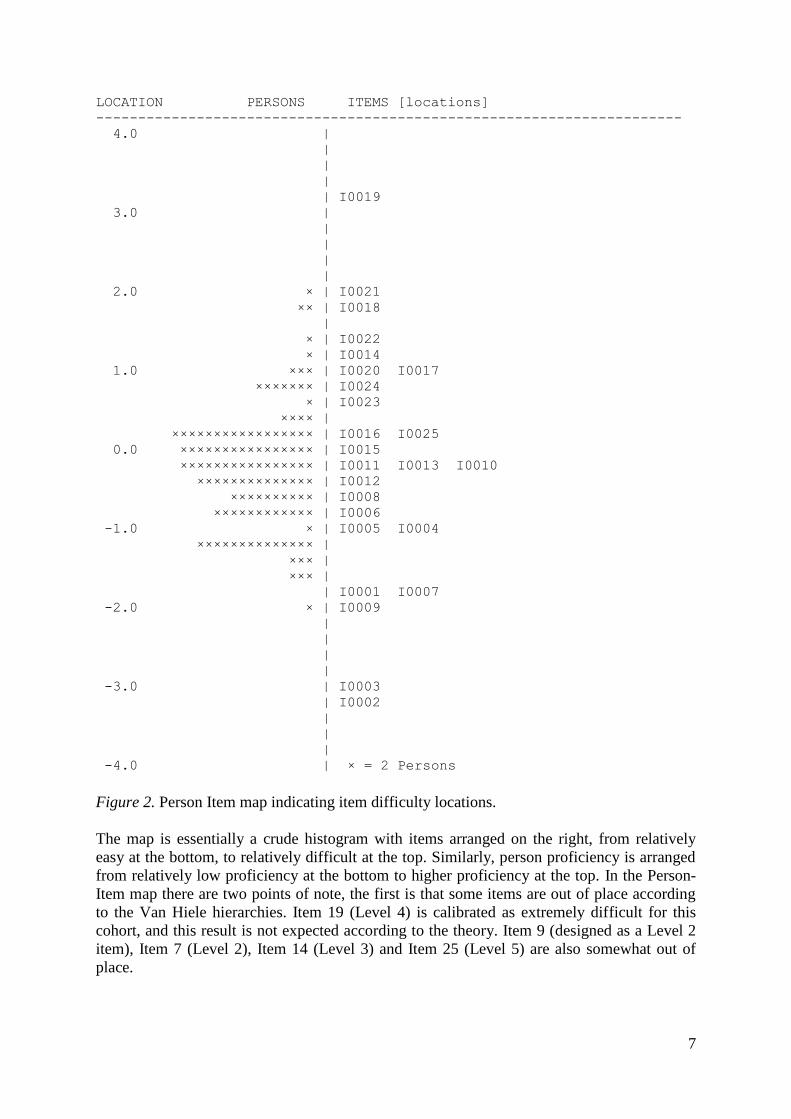
The Person Item map (also called Wright map) presented in Figure 2 is equivalent to the
Person-Item Threshold Distribution. Note that the item difficulty, as with Figure 1, is
calibrated in relation to the item mean reference, zero. Person proficiency is then estimated in
relation to item difficulty. For full details see Andrich (1988) and Dunne et al. (2012).
7
LOCATION PERSONS ITEMS [locations]
----------------------------------------------------------------------
4.0 |
|
|
|
| I0019
3.0 |
|
|
|
|
2.0 × | I0021
×× | I0018
|
× | I0022
× | I0014
1.0 ××× | I0020 I0017
××××××× | I0024
× | I0023
×××× |
××××××××××××××××× | I0016 I0025
0.0 ×××××××××××××××× | I0015
×××××××××××××××× | I0011 I0013 I0010
×××××××××××××× | I0012
×××××××××× | I0008
×××××××××××× | I0006
-1.0 × | I0005 I0004
×××××××××××××× |
××× |
××× |
| I0001 I0007
-2.0 × | I0009
|
|
|
|
-3.0 | I0003
| I0002
|
|
|
-4.0 | × = 2 Persons
Figure 2. Person Item map indicating item difficulty locations.
The map is essentially a crude histogram with items arranged on the right, from relatively
easy at the bottom, to relatively difficult at the top. Similarly, person proficiency is arranged
from relatively low proficiency at the bottom to higher proficiency at the top. In the Person-
Item map there are two points of note, the first is that some items are out of place according
to the Van Hiele hierarchies. Item 19 (Level 4) is calibrated as extremely difficult for this
cohort, and this result is not expected according to the theory. Item 9 (designed as a Level 2
item), Item 7 (Level 2), Item 14 (Level 3) and Item 25 (Level 5) are also somewhat out of
place.
8
Item 25 is designed to operationalize Van Hiele Level 5, and hence was perceived to be
beyond the scope of proficiency in the course, but was found to be relatively easy at a
location just above the mean on the person-item map. This item focuses on logical reasoning
and requires students to combine logical IF_THEN statements.
Item 19
Item 19 is one of five items (16 to 20) which should test the student’s understanding of a
formal deductive system, that is to explore if they operate on Van Hiele Level 4. However, to
answer these questions students should have knowledge of the role of definitions in proofs,
but not necessarily understand those roles. The correct answer is D: Some terms must be left
undefined and it is necessary to have some statements which are assumed true. This formal
knowledge of a deductive system was not an explicit part of their geometry course. Item 19: In geometry:
A) Every term can be defined and every true statement can be proved true.
B) Every term can be defined but it is necessary to assume that certain statements are true.
C) Some terms must be left undefined but every true statement can be proved true.
D) Some terms must be left undefined and it is necessary to have some statements which are
assumed true.
E) None of (A)-(D) is correct.
As will be discussed later, it seems as if at least the lower proficiency students randomly
guessed because of the roughly equal percentages of correct answers across the spectrum
from least proficient to highly proficient.
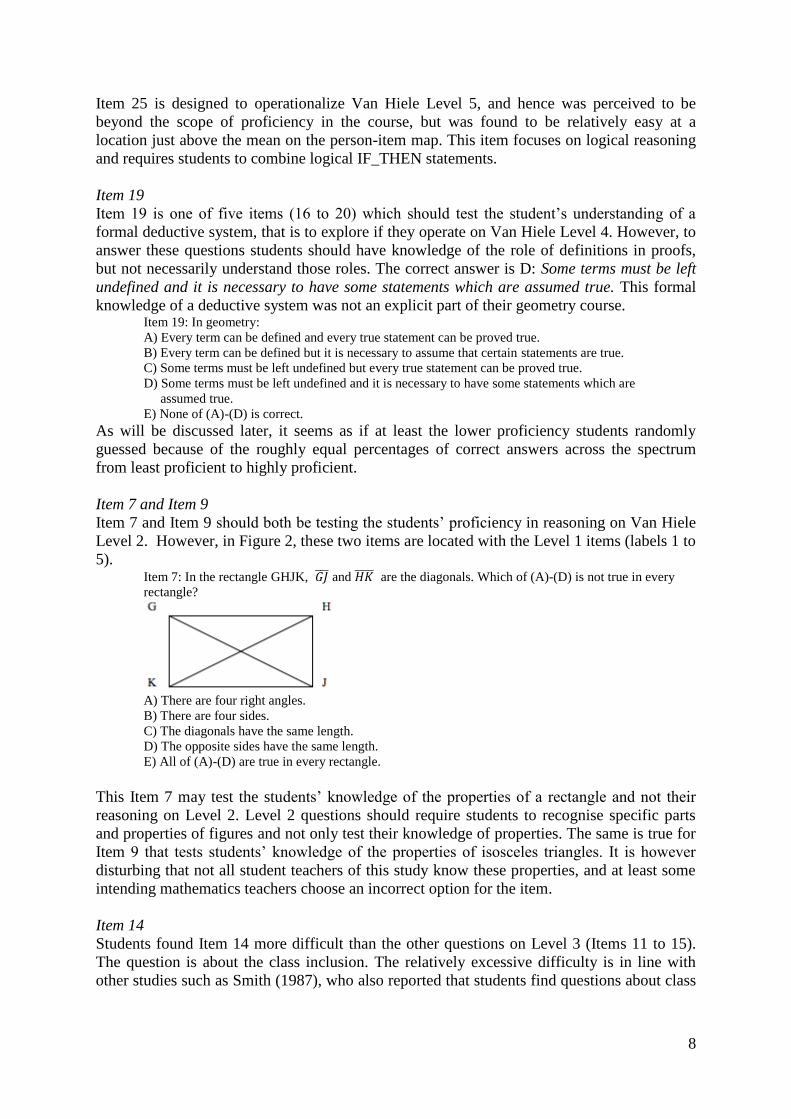
Item 7 and Item 9
Item 7 and Item 9 should both be testing the students’ proficiency in reasoning on Van Hiele
Level 2. However, in Figure 2, these two items are located with the Level 1 items (labels 1 to
5). Item 7: In the rectangle GHJK, ̅̅ ̅ and ̅̅ ̅̅ are the diagonals. Which of (A)-(D) is not true in every
rectangle?
A) There are four right angles.
B) There are four sides.
C) The diagonals have the same length.
D) The opposite sides have the same length.
E) All of (A)-(D) are true in every rectangle.
This Item 7 may test the students’ knowledge of the properties of a rectangle and not their
reasoning on Level 2. Level 2 questions should require students to recognise specific parts
and properties of figures and not only test their knowledge of properties. The same is true for
Item 9 that tests students’ knowledge of the properties of isosceles triangles. It is however
disturbing that not all student teachers of this study know these properties, and at least some
intending mathematics teachers choose an incorrect option for the item.
Item 14
Students found Item 14 more difficult than the other questions on Level 3 (Items 11 to 15).
The question is about the class inclusion. The relatively excessive difficulty is in line with
other studies such as Smith (1987), who also reported that students find questions about class
9
inclusion more difficult than some questions which according to Van Hiele are located at
levels higher than Level 3. Item 14: Which is true?
A) All properties of rectangles are properties of all squares.
B) All properties of squares are properties of rectangles.
C) All properties of rectangles are properties of all parallelograms.
D) All properties of squares are properties of all parallelograms.
E) None of (A)-(D) is true.
Overview of all items
What was interesting at this stage of the analysis is that the order expected from the theory
and from the design of the test was somewhat different from the empirical order of the items.
From the individual item fit statistics, none of the items show misfit when observing the
corresponding fit residual, chi square and chi-square probability. However some of the items
show slight misfit within the corresponding Item Characteristic Curves (ICCs).
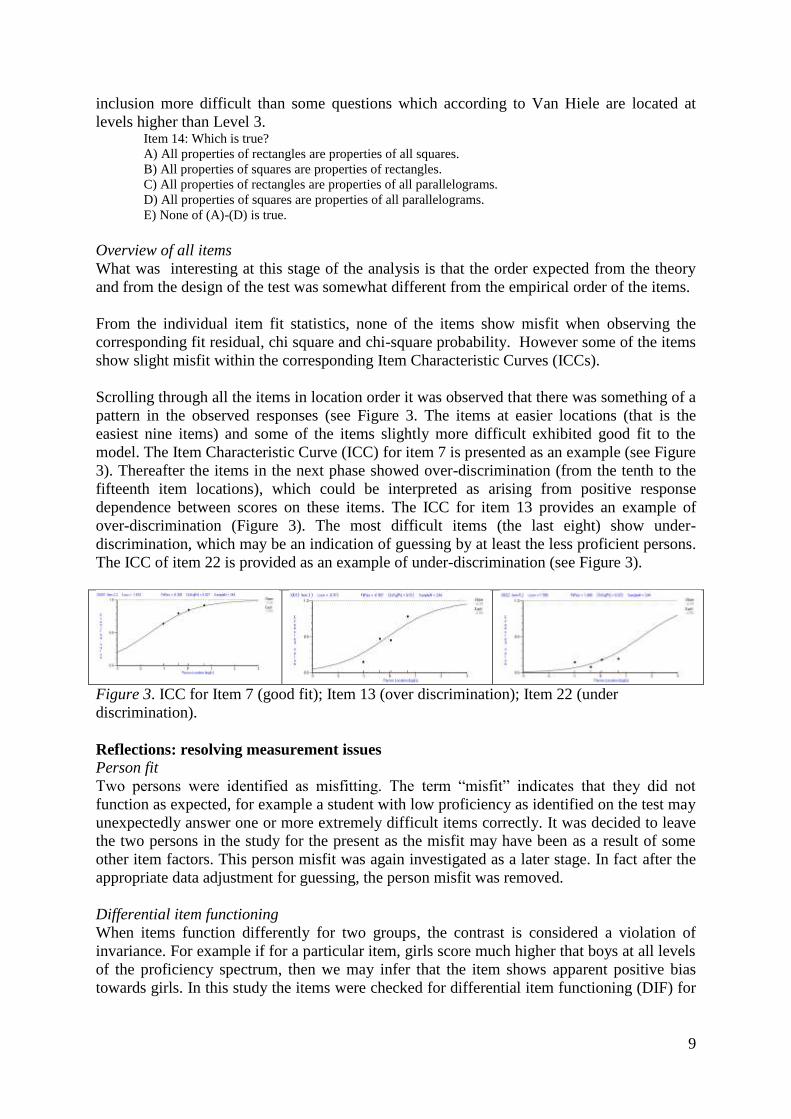
Scrolling through all the items in location order it was observed that there was something of a
pattern in the observed responses (see Figure 3. The items at easier locations (that is the
easiest nine items) and some of the items slightly more difficult exhibited good fit to the
model. The Item Characteristic Curve (ICC) for item 7 is presented as an example (see Figure
3). Thereafter the items in the next phase showed over-discrimination (from the tenth to the
fifteenth item locations), which could be interpreted as arising from positive response
dependence between scores on these items. The ICC for item 13 provides an example of
over-discrimination (Figure 3). The most difficult items (the last eight) show under-
discrimination, which may be an indication of guessing by at least the less proficient persons.
The ICC of item 22 is provided as an example of under-discrimination (see Figure 3).
Figure 3. ICC for Item 7 (good fit); Item 13 (over discrimination); Item 22 (under
discrimination).
Reflections: resolving measurement issues
Person fit
Two persons were identified as misfitting. The term “misfit” indicates that they did not
function as expected, for example a student with low proficiency as identified on the test may
unexpectedly answer one or more extremely difficult items correctly. It was decided to leave
the two persons in the study for the present as the misfit may have been as a result of some
other item factors. This person misfit was again investigated as a later stage. In fact after the
appropriate data adjustment for guessing, the person misfit was removed.
Differential item functioning
When items function differently for two groups, the contrast is considered a violation of
invariance. For example if for a particular item, girls score much higher that boys at all levels
of the proficiency spectrum, then we may infer that the item shows apparent positive bias
towards girls. In this study the items were checked for differential item functioning (DIF) for
10
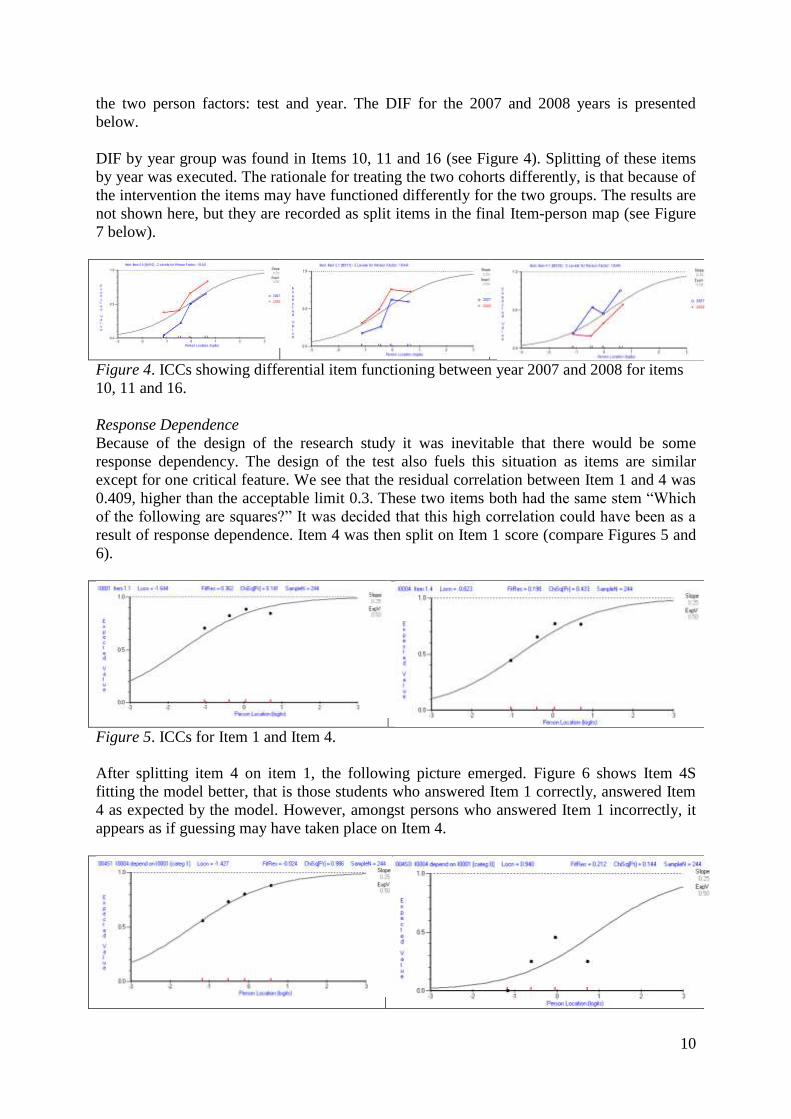
the two person factors: test and year. The DIF for the 2007 and 2008 years is presented
below.
DIF by year group was found in Items 10, 11 and 16 (see Figure 4). Splitting of these items
by year was executed. The rationale for treating the two cohorts differently, is that because of
the intervention the items may have functioned differently for the two groups. The results are
not shown here, but they are recorded as split items in the final Item-person map (see Figure
7 below).
Figure 4. ICCs showing differential item functioning between year 2007 and 2008 for items
10, 11 and 16.
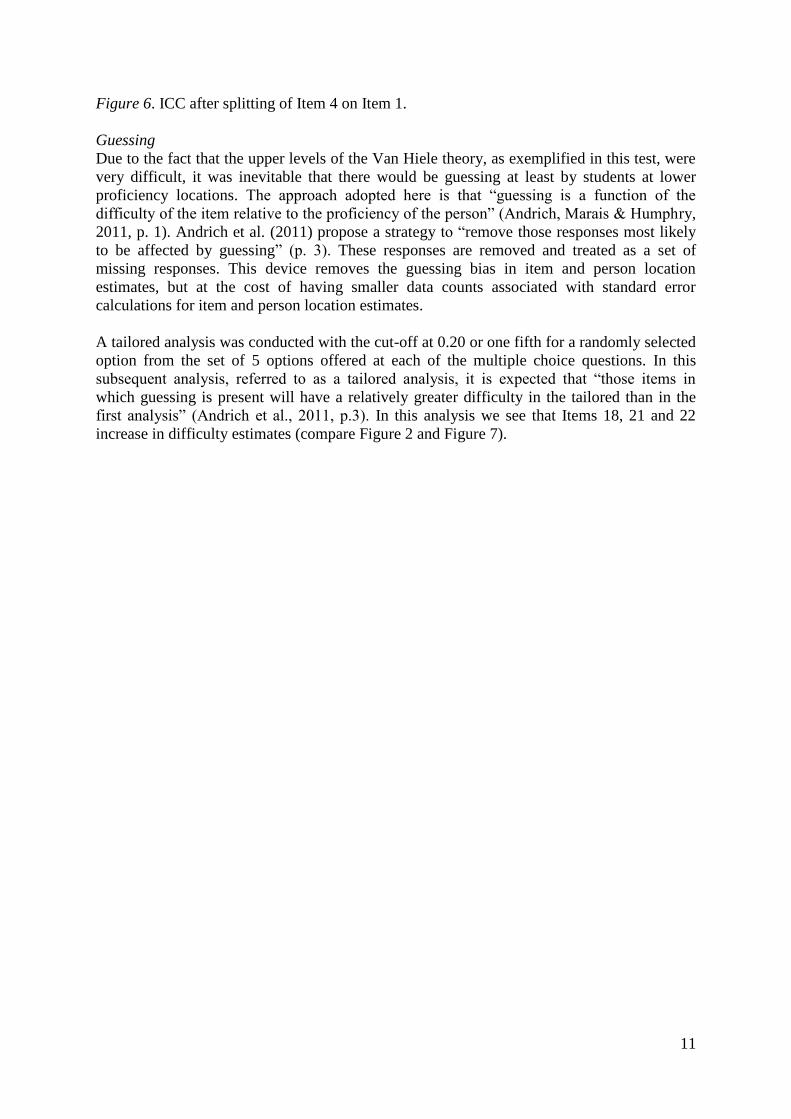
Response Dependence
Because of the design of the research study it was inevitable that there would be some
response dependency. The design of the test also fuels this situation as items are similar
except for one critical feature. We see that the residual correlation between Item 1 and 4 was
0.409, higher than the acceptable limit 0.3. These two items both had the same stem “Which
of the following are squares?” It was decided that this high correlation could have been as a
result of response dependence. Item 4 was then split on Item 1 score (compare Figures 5 and
6).
Figure 5. ICCs for Item 1 and Item 4.
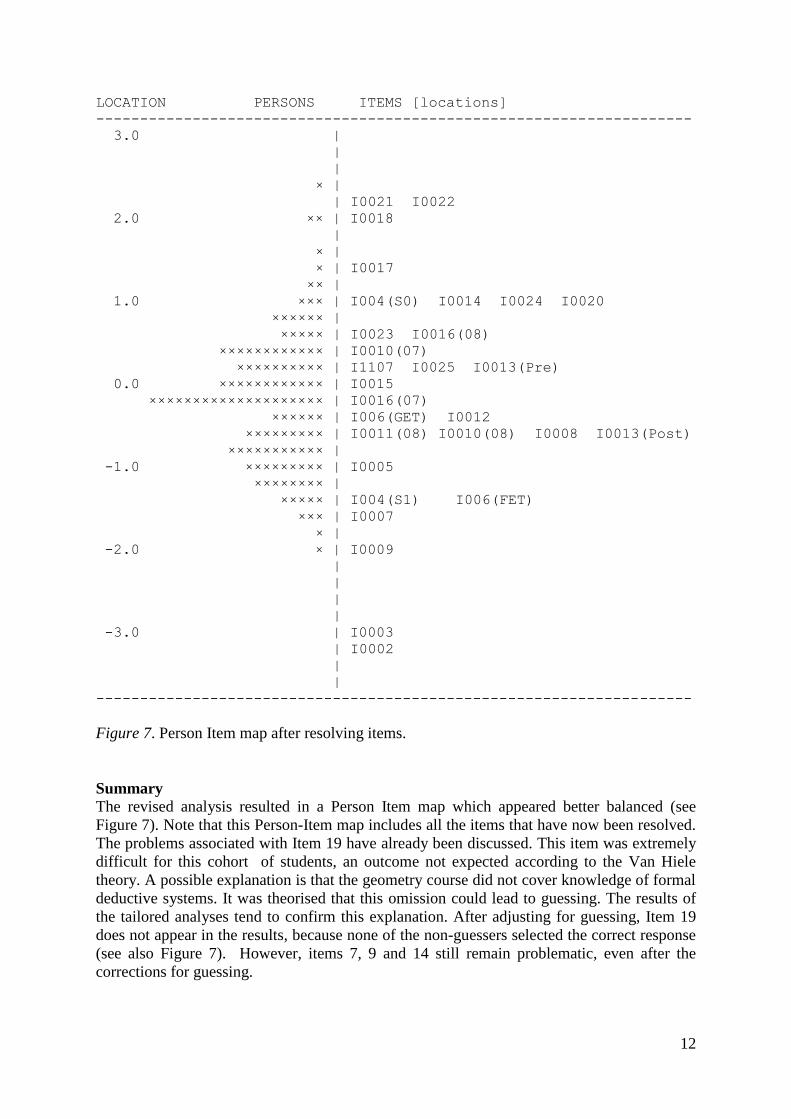
After splitting item 4 on item 1, the following picture emerged. Figure 6 shows Item 4S
fitting the model better, that is those students who answered Item 1 correctly, answered Item
4 as expected by the model. However, amongst persons who answered Item 1 incorrectly, it
appears as if guessing may have taken place on Item 4.
11
Figure 6. ICC after splitting of Item 4 on Item 1.
Guessing
Due to the fact that the upper levels of the Van Hiele theory, as exemplified in this test, were
very difficult, it was inevitable that there would be guessing at least by students at lower
proficiency locations. The approach adopted here is that “guessing is a function of the
difficulty of the item relative to the proficiency of the person” (Andrich, Marais & Humphry,
2011, p. 1). Andrich et al. (2011) propose a strategy to “remove those responses most likely
to be affected by guessing” (p. 3). These responses are removed and treated as a set of
missing responses. This device removes the guessing bias in item and person location
estimates, but at the cost of having smaller data counts associated with standard error
calculations for item and person location estimates.
A tailored analysis was conducted with the cut-off at 0.20 or one fifth for a randomly selected
option from the set of 5 options offered at each of the multiple choice questions. In this
subsequent analysis, referred to as a tailored analysis, it is expected that “those items in
which guessing is present will have a relatively greater difficulty in the tailored than in the
first analysis” (Andrich et al., 2011, p.3). In this analysis we see that Items 18, 21 and 22
increase in difficulty estimates (compare Figure 2 and Figure 7).
12
LOCATION PERSONS ITEMS [locations]
--------------------------------------------------------------------
3.0 |
|
|
× |
| I0021 I0022
2.0 ×× | I0018
|
× |
× | I0017
×× |
1.0 ××× | I004(S0) I0014 I0024 I0020
×××××× |
××××× | I0023 I0016(08)
×××××××××××× | I0010(07)
×××××××××× | I1107 I0025 I0013(Pre)
0.0 ×××××××××××× | I0015
×××××××××××××××××××× | I0016(07)
×××××× | I006(GET) I0012
××××××××× | I0011(08) I0010(08) I0008 I0013(Post)
××××××××××× |
-1.0 ××××××××× | I0005
×××××××× |
××××× | I004(S1) I006(FET)
××× | I0007
× |
-2.0 × | I0009
|
|
|
|
-3.0 | I0003
| I0002
|
|
--------------------------------------------------------------------
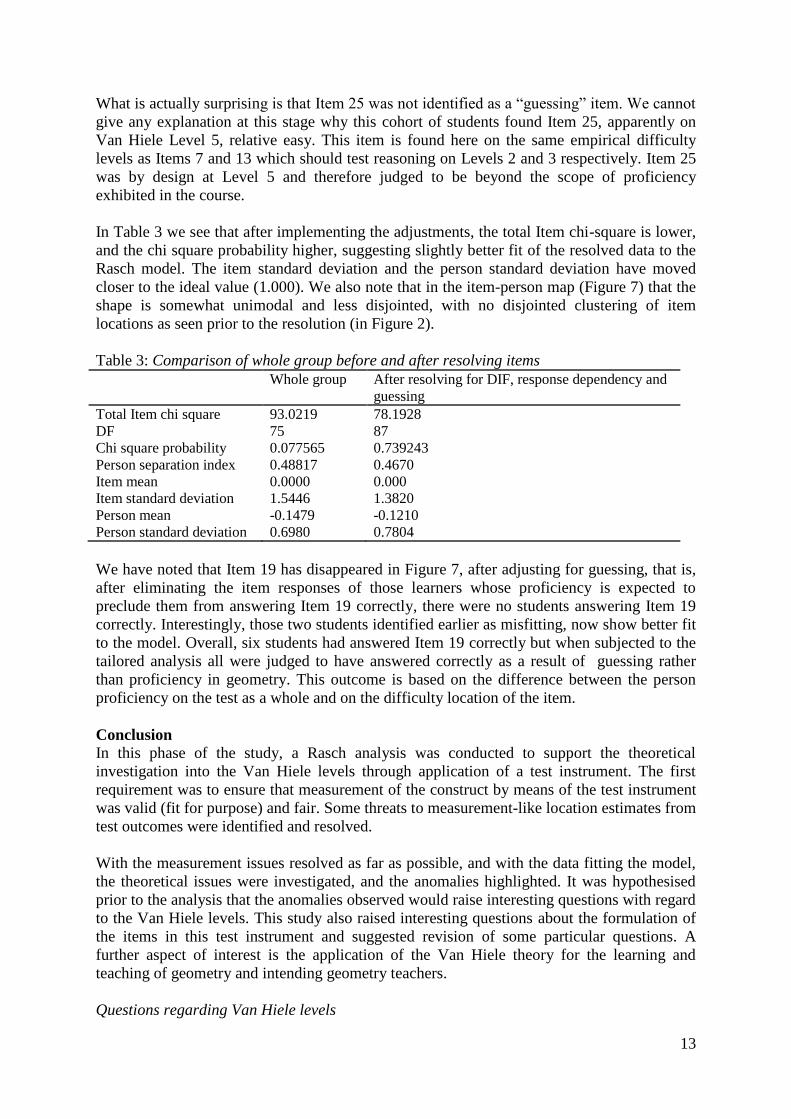
Figure 7. Person Item map after resolving items.
Summary
The revised analysis resulted in a Person Item map which appeared better balanced (see
Figure 7). Note that this Person-Item map includes all the items that have now been resolved.
The problems associated with Item 19 have already been discussed. This item was extremely
difficult for this cohort of students, an outcome not expected according to the Van Hiele
theory. A possible explanation is that the geometry course did not cover knowledge of formal
deductive systems. It was theorised that this omission could lead to guessing. The results of
the tailored analyses tend to confirm this explanation. After adjusting for guessing, Item 19
does not appear in the results, because none of the non-guessers selected the correct response
(see also Figure 7). However, items 7, 9 and 14 still remain problematic, even after the
corrections for guessing.
13
What is actually surprising is that Item 25 was not identified as a “guessing” item. We cannot
give any explanation at this stage why this cohort of students found Item 25, apparently on
Van Hiele Level 5, relative easy. This item is found here on the same empirical difficulty
levels as Items 7 and 13 which should test reasoning on Levels 2 and 3 respectively. Item 25
was by design at Level 5 and therefore judged to be beyond the scope of proficiency
exhibited in the course.
In Table 3 we see that after implementing the adjustments, the total Item chi-square is lower,
and the chi square probability higher, suggesting slightly better fit of the resolved data to the
Rasch model. The item standard deviation and the person standard deviation have moved
closer to the ideal value (1.000). We also note that in the item-person map (Figure 7) that the
shape is somewhat unimodal and less disjointed, with no disjointed clustering of item
locations as seen prior to the resolution (in Figure 2).
Table 3: Comparison of whole group before and after resolving items
Whole group After resolving for DIF, response dependency and
guessing
Total Item chi square 93.0219 78.1928
DF 75 87
Chi square probability 0.077565 0.739243
Person separation index 0.48817 0.4670
Item mean 0.0000 0.000
Item standard deviation 1.5446 1.3820
Person mean -0.1479 -0.1210
Person standard deviation 0.6980 0.7804
We have noted that Item 19 has disappeared in Figure 7, after adjusting for guessing, that is,
after eliminating the item responses of those learners whose proficiency is expected to
preclude them from answering Item 19 correctly, there were no students answering Item 19
correctly. Interestingly, those two students identified earlier as misfitting, now show better fit
to the model. Overall, six students had answered Item 19 correctly but when subjected to the
tailored analysis all were judged to have answered correctly as a result of guessing rather
than proficiency in geometry. This outcome is based on the difference between the person
proficiency on the test as a whole and on the difficulty location of the item.
Conclusion
In this phase of the study, a Rasch analysis was conducted to support the theoretical
investigation into the Van Hiele levels through application of a test instrument. The first
requirement was to ensure that measurement of the construct by means of the test instrument
was valid (fit for purpose) and fair. Some threats to measurement-like location estimates from
test outcomes were identified and resolved.
With the measurement issues resolved as far as possible, and with the data fitting the model,
the theoretical issues were investigated, and the anomalies highlighted. It was hypothesised
prior to the analysis that the anomalies observed would raise interesting questions with regard
to the Van Hiele levels. This study also raised interesting questions about the formulation of
the items in this test instrument and suggested revision of some particular questions. A
further aspect of interest is the application of the Van Hiele theory for the learning and
teaching of geometry and intending geometry teachers.
Questions regarding Van Hiele levels
14
The Van Hiele theory proposes five hierarchical, sequential and discrete levels of geometric
development that are dependent on a learner’s experience. The intention of this study was not
to test the hierarchical and discrete properties of the Van Hiele theory. The study does
address the sequential nature of the theory. In the adjusted person-item map (Figure 7) we can
clearly see a definite ascending trend from Level 1 (Q1 to Q5) through to Level 5 (Q21 to
Q25), as predicted by the Van Hiele theory. Although this Rasch analysis identified a number
of problematic items, it confirms to some strong extent the Van Hiele theory proposal of five
sequential levels of geometric development.
This study confirms the concers of Smith (1987) and De Villiers (1987) about the aspect of
class inclusion. According to them, students found items on hierarchical classification more
difficult than some higher-level questions. This phenomenon also occurred in this study
where students found Item 14 more difficult than other questions on Level 3 (Item 11-15).
Test instrument revision in item construction of items and scoring methods
A dilemma with questions about class inclusion is that class inclusion depends on the kind of
class definitions that we choose. There are different ways to define the distinct quadrilaterals
and until all properties of the various quadrilaterals are elicited explicitly, several plausible
class inclusion structures may exist. Item 14 does not explain the choice of definitions behind
the class inclusion questions. Supplying the definitions may improve the test item.
There are a number of items that require only knowledge of a specific aspect of geometry
instead of clearly testing geometric reasoning skills. These items are consistently out of place.
For example, Item 19 tests the students’ knowledge of the role of definitions in proofs, not
necessarily understanding of the roles. This focus on knowledge, rather than reasoning, also
emerged in items 7 and 9. These questions should test students’ reasoning on a Van Hiele
level 2, but instead they test knowledge of the properties of a rectangle. Level 2 questions
should require students to recognise specific parts and properties of figures and not simply
test their knowledge of properties of figures.
The Van Hiele theory for the learning and teaching of geometry
Both the Van Hiele theory and the CDASSG test as developed by Usiskin and his team in
1982 have some limitations as discussed in the previous two paragraphs. However this test
and the associated Van Hiele theory highlighted limitations in the outcomes of the geometry
course that was presented to future mathematics teachers. The test also raises concerns about
future teachers’ knowledge and geometric reasoning skills. The study shows that a geometry
course for teachers should not assume the mastering of even the basic levels. It should
address and develop geometric reasoning skills on all the Van Hiele levels.
References
Andrich, D. (1988). Rasch models for measurement. Beverly Hills, CA: Sage Publications.
Andrich, D., Marais, I. & Humphry, S. (2011) Using a theorem by Andersen and the
dichotomous Rasch model to assess the presence of random guessing in multiple choice
items. Journal of Educational and Behavioural Statistics, 0(0), 1-26.
Andrich, D.A., & Hagquist, K. (2012). Real and artificial differential item functioning.
Journal of Educational and Behavioural Statistics, 37(3), 387−416.
Andrich, D., Sheridan, B., & Luo, G. (2010). RUMM2030. Perth, Australia: RUMM
Laboratory.
15
Clements, D., & Battista, M. (1992). Geometry and spacial reasoning. In D. Grouws (Ed.),
Handbook of research on mathematics teaching and learning (pp. 420-464). New York:
Macmillan Publishing Company.
De Villiers, M. D. (1987). Research evidence on hierarchical thinking, teaching strategies
and the Van Hiele theory: Some critical comments [Internal RUMEUS report, no 10].
University of Stellenbosch, Stellenbosch, South Africa.
Dunne, T., Long, C., Craig, T., & Venter, E. (2012). Meeting the requirements of both
classroom-based and systemic assessment of mathematics proficiency: The potential of
Rasch measurement theory. Pythagoras, 33(3), Art. #19, 16 pages
Larew, L. W. (1999). The effects of learning geometry using a computer-generated automatic
draw tool on the levels of reasoning of college developmental students. Unpublished
Doctor of Education dissertation, West Virginia University, USA.
http://wvuscholar.wvu.edu:8881//exlibris/dtl/d3_1/apache_media/L2V4bGlicmlzL2R0b
C9kM18xL2FwYWNoZV9tZWRpYS8xMzUyNA==.pdf
Lawrie, C. (1996). First year teacher trainees' understanding of geometry. In Technology in
mathematics education: proceedings of the 19th annual conference of the Mathematics
Education Research Group of Australasia (MERGA), University of Melbourne. Available
from http://www.merga.net.au/documents/RP_Lawrie_1996.pdf
Martin, J.D. (2007). Children's Understanding of Area of Rectangular Regions and Volumes
of Rectangular Shapes and the Relationship of These Measures to Their Linear
Dimensions. Unpublished PhD thesis. Available from http://hdl.handle.net/10427/53098.
Mayberry, J. (1983). The van Hiele levels of geometry thought in undergraduate preservice
teachers. Journal for Research in Mathematics Education, 14(1), 58-69.
Smith, E. C. (1987). ’n Kwalitatiewe en kwantitatiewe vergelyking van enkele Van Hiele-toets
instrumente. Unpublished Master’s dissertation, University of Stellenbosch, Stellenbosch.
Stols, G.H. (2012). Does the use of technology make a difference in pre-service teachers'
geometric cognitive growth? Australasian Journal of Educational Technology, 28(7),
1233-1247.
Usiskin, Z. (1982). Van Hiele levels and achievement in secondary school geometry. (Final
Report of the Cognitive Development and Achievement in Secondary School Geometry
Project). Chicago, Il: University of Chicago.
http://ucsmp.uchicago.edu/resources/van_hiele_levels.pdf
Van Hiele, P. M. (1986). Structure and insight. Orlando: Academic Press.
Wilson, M. (1990). Measuring a van Hiele Geometry Sequence: A Reanalysis. Mathematics,
Journal for Research in Mathematics Education, 21(3), 230-237.