Embed Size (px)
Citation preview

1
Chapter 1
An Overview of the Familyof RaschMeasurement Models
Benjamin D. WrightUniversity of Chicago
Magdalena M. C. MokThe Hong Kong Institute of Education
The family of Rasch measurement models is a way to make sense of theworld. Experience is continuous. But the moment we notice experience,it becomes discrete. We sense the fragrance of flowers. The sensation iscontinuous. But when we distinguish between flowers—with and with-out fragrance; strong from weak fragrance, fragrance we like, don’t mind,or dislike, then our observations become discrete. As we notice and re-member particulars, we begin the counting that can become measurement.Counting is never accidental. It is always underpinned by the intention ofreplication. But replication is never exact. Its approximation depends onthe situation, how much we care and what we are going to do with thecount. A vacationer may count seashells according to size, shape or color.But an Aboriginal would count them according to whether or not theircontents were edible. Any idea that all seashells are sufficiently identicalto be counted is based on a fiction that each shell makes an equal contri-bution to an intention—which for practical purposes we keep constant.
INTRODUCTION TO RASCH MEASUREMENT
Copyright© 2004

2 WRIGHT AND MOK
This is true for all counting. As soon as we start counting, we have de-cided on a useful identity, namely that, at least for us, the objects wecount are sufficiently identical to be infinitely exchangeable.
We choose a dimension according to its utility. Then we definewhat is (and what isn’t)—a sign of the more or less of that dimension.Then we count indicators of the dimension. To make our counting useful,we look beyond the raw objects counted to the dimension which we havedecided our counts imply. We decide, discover and verify the extent towhich counting these particular observations contains inference about thedimension. Our raw data take such forms as:
Yes/NoPresent/AbsentRight/Wrong
Which we score as observations: x = 0,1.
There are situations where indications of more or less of a dimen-sion can be introduced as categories within each observation. Countingin this way gives rise to data such as:
Frequently/Sometimes/Rarely for x = 0, 1, 2Strongly Agree/Agree/Disagree/Strongly Disagree for x = 0, 1, 2, 3
The family of Rasch measurement models provides the means forconstructing interval measures from these kinds of raw data.
All observations begin as counts. But raw counts are only indica-tions of a possible measure. Raw counts cannot be the measures soughtbecause in their raw state, they have little inferential value. To developmetric meaning, the counts must be incorporated into a stochastic processwhich constructs inferential stability. There are many examples in every-day life where raw counts are not useful for inference. Suppose we wantto measure how long we can support a heavy pile of books. We may takea stop-watch to record the length of time, but the seconds counted do not“measure” our experience. The first seconds are easy and pass quickly.But the final seconds become painfully difficult and “take forever”. Inthis situation, each raw second counted has a different experiential mean-ing, depending on when it occurs. As such, the “second” itself is not auseful unit of measurement for how it feels to support heavy books.
Raw counts may give the impression that they are interval (or ratio)measures of experience. But this is always an illusion. In particular, rawcounts at the beginning and end of a raw score scale are problematic be-

RASCH MODELS OVERVIEW 3
cause while the counts necessarily terminate at “none” or “all”, the mea-sures they might imply have no boundaries. Problems with counting canalso occur at other parts of the scale. The question, “How many orangesdo we need to squeeze an 8 ounce glass of orange juice?” makes no sensebecause the answer depends on the size of the oranges. We withdrawfrom the concrete reality of counting real oranges and advance instead toapproximating an abstract fiction of perfect ounces of weight to constructa stable answer. A pint is a pound the world around. Oranges are halfjuice. Therefore it takes 1 pound of oranges to produce 8 ounces of juice.
Consider observations derived from commonly used survey ratingscales such as “strongly agree”/ “agree”/ “disagree”/ “strongly disagree”.The assignment of the number labels (numerals) 1, 2, 3, 4 to these optionsdoes not make these numerals become equally distanced measures. But ifthe category labels are not equally distanced, then none of the conven-tional statistics we like to use, including the mean and standard deviation,provide legitimate processing for these non-interval category labels.
There is also the issue of missing data. Data may be missing because ofoversight or non-compliance. It may result from incidental interference, per-haps from the physical condition of the person. If the purpose of research isto use existing information to make inferences about what is still unknown,then missing data are of the essence. It follows that a useful measurementmodel for constructing inference from observation must be unaffected bymissing data. Further, for a measurement model to be useful, it must enableus to estimate the precision of our inference and it must provide for the detec-tion and evaluation of discrepancy between observation and expectation.
If raw counts cannot be relied upon to serve as measures, how canwe construct inferences from observations? In order for measurement tobe useful for inference, it needs to be linear and reproducible.
A feel for precision can be achieved through replication. The abilityto replicate is the first condition for precision. When similar results occurrepeatedly, we gain confidence that the same will happen in the future.However, replication does not guarantee the accuracy of a measure. If weuse a broken typewriter to measure typist speed, then no matter how manytimes the test is repeated, we will get the wrong measurement of the typingspeed. Likewise, a testing instrument has to operate in the region of acandidate’s proficiency. This is called ‘targeting’. A second condition forprecision is noise control. This includes using a relevant tool to carry outthe observations and making sure that the observations take place under

4 WRIGHT AND MOK
reproducible conditions. A typewriter in good condition should be used formeasuring typing speed and the room should be well-lighted, not too noisyand neither too cold nor too hot. Nevertheless, no matter how hard we try tocontrol the intrusion of noise into the observation process, there are alwaysfactors beyond our control. The person can become careless or have had anargument with their family, which may have affected their performance.Such factors are often unknown to the person collecting the data. It istherefore important that the measurement model has indicators not only ofthe precision of inference but also the quality.
Measures must be as independent as possible of incidental circum-stances. As long as a good typewriter is used, the measure of my typingspeed must not depend on who else before me has been measured on thetypewriter. And, so far as all typewriters are in good conditions, my speedshould not depend on which one I use. The measured proficiency of acandidate cannot depend on who else takes part in the examination or thedifficulty level of the test items. This requirement for measurement iscalled ‘parameter separation’. This condition is met in the family of Raschmeasurement models.
Thus, in order to construct inference from observation, the measure-ment model must: (a) produce linear measures, (b) overcome missing data,(c) give estimates of precision, (d) have devices for detecting misfit, and(e) the parameters of the object being measured and of the measurementinstrument must be separable. Only the family of Rasch measurementmodels solve these problems.
We will begin our discussion with the simplest case, that of a di-chotomous outcome. The method generalizes easily to situations withfiner gradations. Imagine jumpers jumping fences. The jumpers vary instrength from weak to strong, and the fences are of various heights posingdifferent challenges (Figure 1).
The outcomes among jumpers of varying strengths attempting fencesof different heights can be summarized in a data matrix. For any jumper n,(n = 1,...,N) attempting fence i (i = 1,...,L), the outcome is either a success(denoted by x
ni=1) or a failure (denoted by x
ni=0). The attempts of jumper n
against all fences tried can be represented by a response vector such as(1,1,-,0,1,...,0) where a ‘1’ represents a successful attempt by jumper n, ‘0’represents a failed attempt and a ‘-’ records that jumper n was not observed
to attempt that particular fence. A raw count of successes (i∑x
ni = R
n) can be
obtained by summing the elements of a response vector. But unless all

RASCH MODELS OVERVIEW 5
jumpers have an equally fair-shot at all fences, the raw sum of successes Rn
made by jumper n and Rm by jumper m remain incomparable. Because they
do not share the same fences, there is no way one raw sum can be comparedwith another in order to infer that one jumper is better than the other. Simi-larly, for any fence i, the attempts made by all jumpers can be representedby a vector of 1, 0, and –’s, with a total number of successful jumpers equalto the sum of ‘1’s (
n∑x
ni = S
n). Again, unless all fences have been challenged
by all jumpers, the raw sum of successful jumpers over two particular fencescannot be used to compare the relative difficulties of those two fences. Fig-ure 2 shows such a data matrix.
Figure 1. Jumper stronger than fence clears. Jumper weaker than fence tumbles.
Strong jumper
Strong jumper n of strength Bn
Weak jumper m of strength Bm Weak jumper
High Fence Fence of Height Di Low fence
Bn-Di > 0
Bn-Di < 0
Common dimension of length shared by jumper strength and fence height
Figure 2. Observation of jumpers over fences.
Fence 1, … … i …, L 1 1,0,1,1, … 1,0,- ,1,0 .
.
.
1,1,-,0, 1,1,0,1,
… …
1,0,0,0,0 0,1,0,-,-
Jumper n 1=nix ni n
i
x R=∑
. . .
N -,1,1,1, … 0,0,0,0,0
ni in
x S=∑
Because of missing data, cannot compare raw sums for conclusions about relative strength of jumpers
Because of missing data, cannot compare raw sums for conclusions about relative difficulties of fences.

6 WRIGHT AND MOK
While this raw data matrix is all the observation we have, as it stands,it is of limited utility. Even though it contains everything we could ob-serve, as it stands, it doesn’t help us to predict what will happen in thefuture. In order for it to be useful, we must build a useful expectation ofwhether jumper n will succeed on fence i the next time round.
To know about the strength of a jumper, we must challenge him witha fence and to find out about the height of a fence, we must challenge it witha jumper. The meaning of the observation is derived conjointly from fenceand jumper, simultaneously. Nevertheless, we must back away from themere manifestation of jumpers negotiating fences because, after all, we arenot interested in the specific incidents of success and failure on this alreadypassed occasion. Instead, we want to infer from these data, assertions of therelative strengths of jumpers and fences, expectations as to what will hap-pen next. Our expectations must be grounded on an abstraction of thisconjoint situation. Counts are concrete and limiting; expectations are ab-stract and liberating. The ability to expect and so to infer is the impetus of
Figure 3. The spiral of inferential development.

RASCH MODELS OVERVIEW 7
human development, the prime tool of civilization. The transition fromcontinuous sensation to discrete counts, and from discrete observations ofcurrent events to continuous inferences about the future underpins the evo-lution of our ability to survive, let alone build science (Figure 3).
For jumper and fence, the meaning of experience is created by ab-stracting from observations of ‘0’s, ‘-’s, and ‘1’s into expectations, P
ni, as
in Figure 4. In this matrix of expectations there are no missing data.
The basic Rasch model for this kind of analyses can be derived fromthe simplest paired comparison. Consider comparing the strengths of twojumpers or the heights of two fences (Wright and Linacre, 1995). Con-sider jumpers Mike and Nick of strengths B
m and B
n making a jump at the
same fence i. Let xmi
denote the outcome of Mike’s attempt at fence i andx
ni denote the outcome of Nick’s attempt at fence i.
x
mi can be either 0, if
Mike fails to jump fence i, or 1, if he succeeds. xni is also scored 0 or 1,
depending on whether Nick fails or succeeds with fence i. If Mike andNick each makes one jump at fence i, there are 2 x 2 possible outcomes.Of these four possibilities, the two outcomes in which either both jumpover the fence or both fail the fence do not contain any information re-garding the relative strengths of Nick and Mike. Only the two off-diago-nal outcomes are informative, because only these outcomes tell us whetherMike or Nick is a stronger jumper.
To get an idea of who is a stronger jumper, in pursuit of the neces-sity for replication, Mike and Nick make many attempts at fence i and theresults are recorded in Table 1.
Figure 4. The stochastic interpretation of observations of jumpers over fences.
Fence 1 … i … L 1 .
.
.
Jumper n niP nB Strength .
.
.
N iD
Height

8 WRIGHT AND MOK
Let Pni be the probability of Nick jumping fence i and (1-P
ni) be the
probability of Nick failing fence i and the same for Mike with Pmi
and (1-Pmi
).The probabilities of the four possible outcomes are given in Table 2.
Let N10
be the number of times Mike succeeds but Nick fails and N01
be the number of times Mike fails but Nick succeeds. As Nick and Mikecompete on a number of occasions, it is the ratio of times N
10/N
01, rather
than the difference (N10
–N01
), by which Mike beats Nick that produces astable picture of how much Mike is better than Nick. To illustrate thispoint, four possible off-diagonal outcomes are presented in Table 3.
In Table 3, A, B and C describe situations where Mike is nine timesbetter than Nick, a condition clearly stable in the ratios but unstable in thedifferences. Situation D, on the other hand, is clearly a case where Mike andNick are almost identical in strength, as reflected in the ratio N
10/N
01. Their
difference (N10
–N01
) gives a distorted picture because it implies that Mike isas much stronger than Nick as he was in situation A where the
N
10/N
01 ratio
was 9. These examples demonstrate that the ratio N10
/N01
, of the off-diagonalelements contains the replication stable information about the relative strengthsof Mike and Nick. Introducing a probability model for this ratio produces:
Table 2Probability matrix of possible outcomes
Nick Wins 1=nix
Nick Fails 0=nix
Mike Wins
1=mix niP miP miP )1( niP−
Mike Fails 0=mix )1( miP− niP )1( miP− )1( niP−
Table 1Outcome when Mike competes with Nick on many attempts at fence i
Nick Wins 1=nix
Nick Fails 0=nix
Mike Wins
1=mix N11 = the number of times both are successful
(no useful information)
N10 = the number of times Mike beats Nick
Mike Fails
0=mix N01 = the number of times Nick beats Mike
N00 = the number of times both fail
(no useful information)

RASCH MODELS OVERVIEW 9
( )( ) 1
1
01
10
mini
nimi
PP
PP
N
N
−−
≈ ,
which, if Mike and Nick have a meaningful relation, must hold for anyfence i, that is, for all fences. To be objective and hence useful, the com-parison between Mike and Nick cannot depend on which fence they com-pete on. Expressed mathematically this becomes:
( )( )
( )( )−
−≡
−−
1
1
1
1
njmj
njmj
nimi
nimi
PP
PP
PP
PP ,
for all i, j, or
−
−
−≡
− )1(
)1(
)1()1(
mi
mi
mj
mj
nj
nj
ni
ni
P
P
P
P
P
P
P
P .
By the same argument, to maintain objectivity, the relation betweenany pair of fences i and j must hold for any arbitrary jumper m. Anyjumper and any fence can be chosen to define the frame of reference forthese comparisons. Choosing person 0 and fence 0 to be of equal strengthsets P
00 at 0.5. Mathematically, this becomes:
−
−
=
−
−
−
≡
− )1(
)1(
)1(
)1(
)1()1( 0
0
00
00
0
0
i
i
no
no
i
i
no
no
ni
ni
P
P
P
P
P
P
P
P
P
P
P
P ,
that is, )()()1( i
n
ni
ni
d
bignf
P
P=×≡
− , (1)
Table 3Ratios or Differences?
Situation A B C D Mike Succeeds Nick fails
10N 9 90 9000 5004
Mike Fails Nick Succeeds
01N 1 10 1000 4996
Difference 0110 NN − 8 80 8000 8
Ratio 0110 NN 9 9 9 ≅1

10 WRIGHT AND MOK
where ( ) nbnf =
and idig 1)( = .
Equation (1) specifies that, for measurement objectivity to be ob-tained, the odds of jumper n succeeding over fence i must be a product ofa function of jumper strength, represented by f(n)=b
n, and a function of
fence difficulty, represented by
idig 1)( =
and nothing else. Note that
)1( 0
0
n
nn P
Pb
−=
is solely a trait of jumper n and the metric origin, and that
)1(1
0
0
i
i
i P
Pd −
=
is solely a trait of fence i and the same metric origin. In this measurementmodel, the jumper parameter and the fence parameter are completely sepa-rated, making it possible to estimate jumper strength independently of fencedifficulty, and to estimate fence difficulty independently of jumper strength.
The odds ratio is defined as the ratio of bn, which takes the value
between 0 and infinity, depending only on person n and the stipulatedframe of reference, and d
i, which takes the value between 0 and infinity,
depending only on item i and the same frame of reference. We have founda way to estimate which jumper is stronger. The next question is: “Howmuch stronger?” But “How much” is not a ratio question; it is a differ-ence question. Taking the logarithms of both sides of equation (1) gives:
( ) ( )ini
i
n
n
ni
ni dbP
P
P
P
P
Plnln
)1(ln
)1(ln
)1(ln
0
0
0
0 −≡
−
×
−
≡
−
,
ie,
)1(ln in
ni
ni DBP
P−≡
−
, (2)
or
( )( )[ ] exp1
exp
in
inni DB
DBP
−+−= , (3)

RASCH MODELS OVERVIEW 11
where ( )nn
nn b
P
PB ln
1ln
0
0 =
−
=
depends only on attributes of person n and the metric origin,
and ( )ii
ii d
P
PD ln
1ln
0
0 =
−
=
depends only on attributes of fence i and the metric origin.
The Rasch model can be equally well derived by applying the sameargument in the case of one jumper negotiating two fences i and j, i.e.,
10
01
(1 )
(1 )ni nj
ni nj
P PN
N P P
× −≈
− ×, for all n.
Equations (2) and (3) are equivalent forms of the dichotomous Raschmodel. B
n and D
i are commonly referred to as person ability and item
difficulty parameters respectively. All other forms of the Rasch modelcan be derived from this basic form.
The Dichotomous Rasch Model
The simplest Rasch model is for dichotomies (derived in the previ-ous section):
)1(
ln in
ni
ni DBP
P −≡
− , or equivalently,
( )( )[ ] exp1
exp
in
inni DB
DBP
−+−= .
Here, Pni is the probability of person n with ability B
n succeeding on
item i which has difficulty level Di. In the case of one trial, P
ni is the expec-
tation (abstraction) of the observed (concretization) xni. The correspondence
between abstraction and concretization is evaluated by the size of the ob-served discrepancy Y
ni = x
ni - P
ni (Figure 5). A large discrepancy means that
the concrete experience is not a useful example of the abstraction. A smalldiscrepancy implies that the abstraction is robust with respect to the experi-ence and thus by inference to similar future experiences. Since each trial isa Bernoulli experiment, the variance of the x
ni is given by P
ni (1–P
ni), so it is
possible to evaluate the significance of a discrepancy by computing an ap-proximate χ2 with one degree of freedom for each x
ni:

12 WRIGHT AND MOK
21
22 ~
)1(χ
nini
nini PP
yz
−= .
The discrepancy between observed, xni, and expected, P
ni , with ex-
pected model variance Vx = P
ni (1–P
ni) enables us to verify, fine-tune,
and validate our measurement constructions. Each residual, in raw formy
ni = (x
ni–P
ni), or in standardized form,
)1()( ninininini PPPxz −−= ,
shows us a piece of information about the quality of our data and the corre-sponding validity of our construction. A positive residual indicates that theobservation is higher than that expected. A negative residual indicates that theobservation is lower than expected. Large residuals raise doubts with regard tothe match between data and model. We can study these standardized residualsz
ni one at a time. But that can be laborious. To expedite our evaluations we
organize our study of residuals according to three points of view:
1. We begin with the most unexpected, that is improbable, observa-tions to see what they suggest as to data quality and construct validity.
2. We square our residuals in raw and standardized form to calcu-late the outfit and infit mean squares for each person, each item and each
Figure 5. Verification of relation between interpretation and observation.
Fence 1 … i … L 1 .
.
.
Jumper n )( ninini Pxy −=
( )
(1 )ni
ni
ni ni
yz
P P=
−
21
22 ~
)1(χ
nini
nini PP
yz
−=
. . .
N

RASCH MODELS OVERVIEW 13
adjacent category threshold estimate. “Outfit mean square” is shorthandfor “Out-lier sensitive mean square residual goodness of fit statistic” whichis the unweighted version of the fit statistic. It measures the averagemismatch between data and model. The item outfit mean square is calcu-lated by taking the sum of squared residuals averaged over the total num-ber of persons taking the item (Wright and Masters, 1982: 99). That is:
NzuN
nnii ∑
==
1
2 .
Similarly, the person outfit mean square is given by:
LzuL
inin ∑
==
1
2 .
Mean square statistics are sensitive to extreme values. Wright andMasters (1982) caution researchers that outfit mean squares are exagger-ated by unexpected responses made by persons to items for whom theitems are either far too easy or far too difficult.
An alternative suggested by Wright and Masters (1982) to outfitmean squares is the infit mean square statistic, which stands for “informa-tion weighted mean square residual goodness of fit statistic”. The outfitmean square statistic is calculated by taking the weighted average ofsquared residuals so that remote responses are given less weight than proxi-mal responses. Mathematically, this is
∑ ∑ ∑∑= = ==
==N
n
N
n
N
nninini
N
nninii WyWWzv
1 1 1
2
1
2 ,
where weight Wni is the variance W
ni = P
ni(1–P
ni).
3. We decompose the whole matrix of residuals into its principal com-ponents among items and among persons. This brings out whatever pat-terns of misfit lurk among the leftovers from our measurement construct.
Linacre (1998) highlighted several options of factor analysis for iden-tifying multidimensionality. They are factor analysis of the observationsand factor analysis of the residuals, namely, (a) the raw Rasch residuals,(b) the standardized Rasch residuals, and (c) the logit residuals. The math-ematical expressions of these three residuals are presented in Table 1. Onthe basis of a series of simulation studies involving both orthogonal andcorrelated dimensions, Linacre (1998) concludes that although factor analy-sis of the original observations is informative of the factor structure, thismethod does not construct the measures of the factors. Further, principalcomponents factor analysis of the standardized Rasch residuals is most

14 WRIGHT AND MOK
effective amongst the three residual factor analyses in identifying multi-dimensionality of the measurement instrument. It is followed by factoranalysis of the raw Rasch residuals, which is only slightly inferior in ef-fectiveness. Factor analysis of the logit residuals is the least effective inidentifying multidimensionality (Linacre, 1998).
Typically these principal components identify structural differencesbetween positive versus negative questions, feeling versus thought versusbehavior questions and so on.
A stable inference is obtained when experience points repeatedly ina same direction with a same meaning. When jumper ability is strongerthan fence height, we expect the jumper to make the jump most of thetime. There will always be some occasions, however, when a jumper failsa jump, particularly as (B
n–D
i) comes close to zero. On the other hand,
when jumper ability is weaker than fence height, we expect the jumper tofail the jump most of the time, with odd occasions when he is successful,perhaps by luck. When jumper ability is equal to fence height, however,we expect the jumper to fail the jump about half the time. Thus:
5.0 ifonly and if 0)( >>− niin PDB ,
5.0 ifonly and if 0)( ==− niin PDB ,
5.0 ifonly and if 0)( <<− niin PDB .
This function is represented graphically in Figure 6 and mathemati-cally by the Rasch measurement model:
−
=−)1(
ln)(ni
niin P
PDB , or
Figure 6. The response curve.
1
Pni > 0.5
Pni
= 0.5
Pni
< 0.5
0 B
n < D
i B
n = D
i B
n > D
i

RASCH MODELS OVERVIEW 15
( )( )[ ] exp1
exp
in
inni DB
DBP
−+−= .
Rasch Model Overview
There are many Rasch models. We will discuss six of them here. Theirrelationships are shown in the flow diagram in Figure 7 on the next page.
Binomial Trials
Binomial trials (Wright and Masters, 1982: 51) are situations whereseveral independent attempts are made at an item and the number of suc-cesses is counted. In shooting contests, instead of determining the abilityof a shooter from one trial, the shooter is allowed to take several, say m,attempts at a target and the total number of hits, say x, within m attemptsis counted. The probability of a shooter with ability B
n aiming at a target
with difficulty level Di and getting x hits in m attempts is:
xmni
xni
mxnix PPC −−= )1( π ,
where
)!(!
!
xmx
mC m
x −= .
Substituting
( )( )[ ] exp1
exp
in
inni DB
DBP
−+−=
from equation (3) and simplifying gives:
[ ]( )
exp ( )
1 exp
n imnix x m
n i
x B DC
B Dπ
− = + −
.
Similarly, the probability of the shooter getting (x–1) hits in m attempts is:
[ ]( ) ( 1) 1
exp ( 1) ( )
1 exp
n imni x x m
n i
x B DC
B Dπ − −
− − = + −
.
Combining these expressions produces the ratio of probabilities ofshooter n aiming at target i and making x hits instead of (x–1) hits in mattempts, that is, the odds for x rather than (x–1):
16 WRIGHT AND MOK
−
+−=
− )1(
1
)1(
ni
ni
xni
xni
P
P
x
xm
ππ .
Taking the logarithm of both sides gives:
+−−
−
=
− 1ln
1lnln
)1(
xm
x
P
P
ni
ni
xni
xni
ππ , i.e.,
( 1)
ln ni xn i x
ni x
B D Cπ
π −
= − −
,
where 1
lnx
m xC
x
− + = .
Figure 7. Six commonly encountered Rasch models.
Rating scale
model
How many categories?
Multiple attempts to an item?
Dichotomous Rasch model
Start
Do all items have the same threshold
difficulty?
Is there an upper limit to the number
of trials?
Are the observations
ranks?
Binomial trials model
Partial credit model
Rank models
Poisson counts model
2
3+
No
No No
Yes
Yes
Yes
Yes

RASCH MODELS OVERVIEW 17
Poisson counts
If the number of trials in the binomial model is infinite and the prob-ability of success is small, as in the case of counting the number of custom-ers buying a certain product at the supermarket in some given time period,such that the buying behavior of a particular customer is independent ofthat of previous customers, and (mP
nix) remains approximately constant,
then a binomial distribution approaches a Poisson distribution (Wright andMasters, 1982: 52-54).
xmni
xni
mxnix PPC −−= )1( π approaches
( )exp ( ), where exp( ,
!
xni ni
ni n iB - D ) x
λ λλ
−=
ie, [ ][ ] )exp(exp !
)( exp
in
innix DBx
DBx
−−
=π ,
and
[ ][ ] )exp(exp )!1(
)( )1(exp)1(
in
inxni DBx
DBx
−−−−
=−π ,
so that
x
DB in
xni
xni )exp(
)1(
−=
−ππ
,
or,
( 1)
ln ln( )ni xn i
ni x
B D xπ
π −
= − −
.
Rating Scale Model
The previous models are useful for binary outcomes. However, thereare often situations where outcomes can be given finer gradations thanjust “present/absent”, “yes/no” or “right/wrong”. Response categories inLikert questionnaires may include ordered ratings such as “Strongly Dis-agree/ Disagree/ Agree/ Strongly Agree”, to represent a respondent’s in-creasing inclination towards the concept questioned. The response ratingscale, when it works, yields ordinal data which need to be transformed toan interval scale to be useful. This is achieved by the Rasch rating scalemodel (Andrich, 1978). The literature (e.g. Wright and Masters, 1982;Andrich, 1988) discusses many useful applications of the rating scalemodel, including the study of testlets made up of sets of dichotomouslyscored items and the analysis of partial credit test items. A testlet is asection of a test comprising a stimulus, such as a reading passage or dia-

18 WRIGHT AND MOK
gram, with several items referring to the stimulus. An example of stimu-lus and the associated items is given in Figure 8.
It is reasonable to expect responses to the items within a testlet tocorrelate higher with one another than with items on other testlets. As aconsequence, although it is possible to score each item as either right orwrong, to take into account their testlet clustering, a score can be given tothe testlet instead of to the individual items. In the above example (Fig-ure 8), possible testlet scores are 0, 1 and 2 indicating respectively: bothitems wrong, either item correct, and both items correct. A score of 1does not distinguish which item in the testlet is right.
A typical item characteristic curve is in Figure 9. Score x=2 repre-sents a higher level of ability than score x=1, which in turn stands formore than x=0. If the ability level is between x=1 and x=2, that rules outthe possibility that the ability level is x=0. Likewise, if the ability level isbetween x=0 and x=1, that rules out the possibility that the ability level isx=2. As a consequence, response interpretation is always between adja-cent categories.
Similarly, in the case of a Likert item, such as, “What do you think
Stimulus material:
“It was Mother’s Day and every street-kid was given a free phone card so thatthey could call home. John picked up the handset but he hesitated. What if hismother had not forgiven him? It was three years since he spoke to her, althoughthere had not been a single night he went to sleep without thinking about her. Helearned from occasional chats with his brother that she did miss him and hopedthat they were friends again.”
Questions to be answered using the above stimulus material.
1. Each street-kid was given a phone card
so that they could contact their friends.
so that they could talk with their family.
so that they learned to use the phone.
2. Why did John hesitated in ringing?
John hesitated because
his mother missed him.
he had not talked with his mother for a long time.
his mother might not have forgiven him.Figure 8. Examples of a testlet which involves a stimulus material and two testitems.

RASCH MODELS OVERVIEW 19
of the amount of homework this term?” and the response categories are:“Too Much/ Just Right/ Too Little”. If we choose between “Too Much”and “Just Right”, then we have already decided that the amount of home-work given is not “Too Little”, but if we choose between “Just Right” and“Too Little”, then we have already decided that it is not “Too Much”.Thus, no matter how many categories are included in a response scale, theresponse decision and interpretation is always between adjacent catego-ries. The point at which the probability of opting for the next category isequal to that for the previous one is called a threshold. There are twothresholds, represented by F
1 and F
2, in the examples, involving possible
scores of 0 (“Too Much” or “Both item wrong”), 1 (“Just Right” or “Onlyone item correct”) or 2 (“Too Little” or “Both item correct”) as shown inFigure 10. If we don’t like homework, then our inclination is below the
first threshold F1, and we choose category “Too Much”. But, if we enjoy
doing homework, but are not crazy about it, our inclination would passthreshold F
1, but would not pass F
2, so we would choose “Just Right” over
“Too Much”. On the other hand, if we are good students who love home-work, we would choose “Too Little”. The situation is like having twodichotomous items operating simultaneously.
At the boundary of each threshold, there is a possibility of scoringeither ‘0’ or ‘1’, depending on whether the threshold is “failed” or “passed”.
Low Person Abililty (logit) High
Pro
babi
lity
Figure 9. Item characteristic curve for the 0, 1 and 2 responses in a three-category item.

20 WRIGHT AND MOK
This implies that there should be 2 x 2 = 4 possible outcomes in combina-tion. But Figure 10 depicts only 3 of these 4 possible outcomes, namely,(failed, failed), (passed, failed) and (passed, passed). The outcome notincluded in Figure 10 is (failed, passed), which would mean that the re-spondent hates homework but thinks that the amount of homework is “TooLittle”—an obviously illegitimate situation in real life and one that wouldwork against the concept of an underlying continuum.
The probability of passing or failing each threshold can be describedby a Rasch model. If there are only two categories, denoted by ‘0’ and ‘1’respectively (Figure 10), then the probabilities of choosing category eachof ‘1’ and ‘0’ are:
Where C2 is the sum of the two numerators.
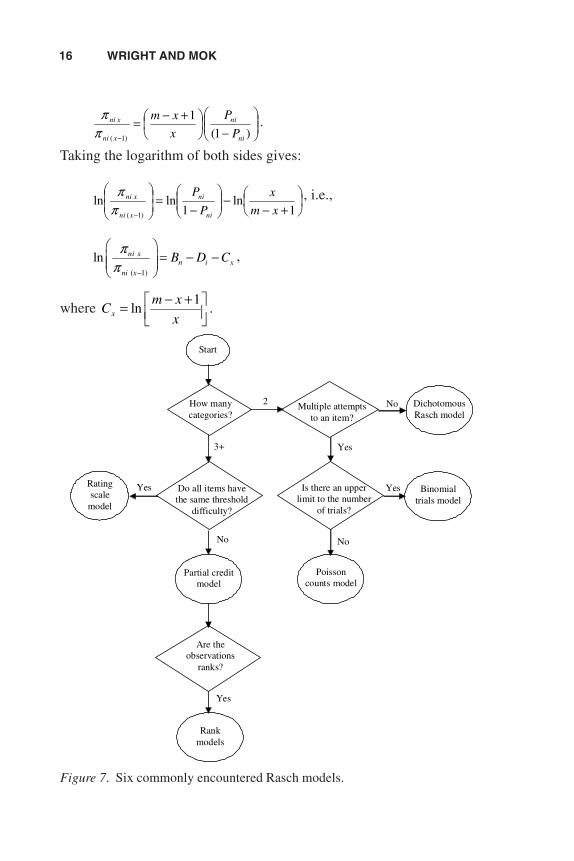
In the case of three categories, denoted by ‘0’, ‘1’ and ‘2’, the prob-abilities of choosing the categories are:
)( DB −
0 1 2
01
CP =
2
1)exp(C
DBP −=
)exp(12 DBC −+=
F1 F2
Too MuchScore on F1 = 0Score on F2 = 0Total score x = 0
(Failed both Thresholds F1
and F2)
Too LittleScore on F1 = 1Score on F2 = 1Total score x = 2
(Passed both Thresholds F1
and F2)
Just RightScore on F1 = 1Score on F2 = 0Total score x = 1
(Passed Threshold F1 butfailed Threshold F2)
Love of homework
Figure 10. Interpretation of thresholds in a three-category item.
RASCH MODELS OVERVIEW 21
Where C3 is the sum of the three numerators.
Similarly, in the case of four categories, denoted by ‘0’, ‘1’, ‘2’ and‘3’, the probabilities of choosing the categories are:
Where C4 is the sum of the four possible numerators.
For this final case, the log-odds of choosing a category over theprevious adjacent one is given by the following computation:
( )1DB − ( )3DB −
0
1
2
3
40
1CP =
4
11
)exp(C
DBP −=
)( 2DB − ( ) ( )[ ]4
212
expC
DBDBP −+−=
( ) ( ) ( )[ ]4
3213
expC
DBDBDBP −+−+−=
( ) ( ) ( )[ ]2114 expexp1 DBDBDBC −+−+−+=
( ) ( ) ( )[ ]321exp DBDBDB −+−+−+
)( 1DB −
0
1
2 3
01
CP =
3
11
)exp(C
DBP −=
)( 2DB − ( ) ( )[ ]3
212
expC
DBDBP −+−=
( ) ( ) ( )[ ]2113 expexp1 DBDBDBC −+−+−+=
)exp( 10
1 DBPP −= , ie, log-odds of ‘1’ over ‘0’ is: ( ) 101ln DBPP −=
)exp( 21
2 DBPP −= , ie, log-odds of ‘2’ over ‘1’ is: ( ) 212ln DBPP −=
)exp( 32
3 DBPP −= , ie, log-odds of ‘3’ over ‘2’ is: 323 )ln( DBPP −=

22 WRIGHT AND MOK
In general, the odds of choosing a category ‘j’ over the previouscategory ‘j–1’ is given by:
and the corresponding log-odds is:
ln(Pj /P
j-1) = (B-D
j), the basic Rasch model.
The general Rasch rating scale model is given by:
( 1)ln
nixn i x
ni x
PB D F
P −
= − −
.
If there are several Likert items sharing the same response catego-ries, it is reasonable to specify that the thresholds for all are the same andthe rating scale model described above can be applied to the group ofitems. On the other hand, if the thresholds are not the same across allitems, then a partial credit model, which will be discussed in the nextsection, is applicable.
Partial Credit Model
The partial credit model is similar to the rating scales model exceptthat now each item has its own threshold parameters (Wright and Mas-ters, 1982). This is achieved by a reparameterization:
ixx FF = ,
and the partial credit model becomes:
ixinxni
nix FDBP
P −−≡
−1
ln .
The examples of partial credit model discussed in the literature(Wright and Masters, 1982) are achievement items where: (a) credits aregiven for partially correct answers, (b) there is a hierarchy of cognitivedemand on respondents in each item, (c) each item requires a sequence oftasks to be completed or (d) there is a batch of ordered response items
)( jDB −
j-1
j )exp(1 jjj DBPP −=−

RASCH MODELS OVERVIEW 23
with individual thresholds for each item. Such examples occur frequentlyin grading situations. For instance, a writing assignment is scored as fol-lows:
3 points for work of a superior quality.2 points for work of predominantly good quality.1 point for work that is satisfactory.0 point for work that is of poor quality.
It is clear from the marking scheme that a score of 3 represents morewriting proficiency than that represented by a score of 2, which in turnrepresents higher proficiency than a score of 1, and so on.
Ranks Model
A Ranks Rasch model is useful when respondents are asked to rankorder a group of objects instead of giving a rating to each object. Ex-amples include a judge ordering pianists from the strongest to the weak-est, or a worker sequencing jobs from most to least urgent. Before 1998,the Higher School Certificate Examination result in New South WalesAustralia was reported in the form of a number which indicated thecandidate’s position in the list formed by the ordering from most to leastable of all candidates who sat the same examination that year.
Rank order is a familiar concept. Most people have preference hier-archies for car models, living styles and personal values. Linacre (1994)highlighted the utility of ranks as a way to avoid the problem of having todefine a rating scale. He also alerted researchers to the drawbacks of rankdata, namely, that rank data are ipsative and that such data contain noinformation about the preference levels of the rankers. That is, in the caseof a judge giving ranks to three objects, the ranks must be “1”, “2”, and“3” irrespective of what the objects are or how much they differ. Forinstance, Mike likes green over purple and he loves both colors. Nickalso prefers green over purple but he hates either color. The ranks them-selves give no information on how much Mike or Nick like these colors.
Further, the ranks assigned to a basket of objects depend on whatelse is in the basket. A child prefers “chocolate” (rank 1) over “straw-berry” (rank 2) if these are the only ice-cream flavors available. But whenmango is available, he prefers it to strawberry. So ranking becomes choco-late (1), mango (2), strawberry (3), if all three flavors are presented. Wesee that ranking differences are not item free and therefore ranks are notmeasures.

24 WRIGHT AND MOK
Linacre conceptualizes ranks as a special case of the rating model inwhich objects are given the rating corresponding to their ranking scale.With this approach the problem of tied ranks is easily solved.
Conclusion
Rasch measurement provides a complete solution to almost everymeasurement problem encountered in science. It is especially apt forsocial science, where the raw data is so unruly and so vaguely conceived.An easy way to begin Rasch measurement is to down load MINISTEPand its manual from www.winsteps.com and to run some of the includedexamples. As one’s understanding increases, one can turn the program to25 item by 100 respondent segments of one’s own data to see how usefulthe program can be for one’s own work. If the result is satisfying and aversion of the program with greater than 25 x 100 capacity is desired,then WINSTEPS itself with capacity 10,000 x 1,000,000 can be obtainedthrough the same home page.
ReferencesAndrich, D. (1978). A rating formulation for ordered response categories.
Psychometrika, 43, 561-573.
Andrich, D. (1988). A general form of Rasch’s extended logistic model for par-tial credit scoring. Applied Measurement in Education, 1, 363-378.
Linacre, J. M. (1994). Many-facet Rasch measurement. Chicago: MESA Press.
Linacre, J. M. (1998). Detecting multidimensionality: Which residual works best.Journal of Outcome Measurement, 2, 266-283.
Wright, B. D., and Linacre, J. M. (1995). Rasch model derived from objectivity.Rasch measurement transactions, Part 1, pp. 5-6. Chicago: MESA Press.
Wright, B. D., and Masters, G. N. (1982). Rating scale analysis. Chicago: MESAPress.