Embed Size (px)
Citation preview

International Journal of Progressive Education, Volume 17 Number 1, 2021 © 2021 INASED
232
Evaluation with Multi-Surface Rasch Measurement Model of Performance Applications in Higher Education Fatih Doğan i
Çanakkale Onsekiz Mart University Dilek Tekin ii Çanakkale Onsekiz Mart University Abstract
The purpose of this research is to analyze the instructional materials prepared by chemistry teacher candidates (CTCs) in universities with the the multifaceted Rasch rating scale model (MRSM) by peer reviews. Also, it is aimed to determine the awareness of instructional technologies and material design courses among CTCs. The sample of this research group is composed of 8 CTCs who continue the undergraduate program of chemistry education in faculty of education in Çanakkale Onsekiz Mart University in the 2019-2020 academic years. These CTCs are enrolled in teaching chemistry course-II and have already take the instructional technologies and material design course. The instructional material preparation skills of CTCs were determined by using a criteria form developed by considering the research project evaluation criteria of TÜBİTAK and the learning outcomes of the course. Results were analyzed according to MRSM. MRSM's surfaces are composed of 8 CTCs, 8 instructional materials and 15 criteria items. According to the results of the data, it was observed that CTCs were separated in terms of severity/leniency behaviour. Also while CTCs were having difficulties related to some criteria, it was observed that they met other criterisa. On the other hand, it was determined that the instructional material preparation skills of CTCs different.
Keywords: Instructional Materials, Multi-Surface Rasch Measurement Model, Item Response Theory
DOI: 10.29329/ijpe.2020.329.15
------------------------------- i Fatih Doğan, Assist. Prof. Dr., Chemistry Education, Çanakkale Onsekiz Mart University, ORCID: 0000-0001-5844-8893 Correspondence: [email protected] ii Dilek Tekin, Chemistry Department, Çanakkale Onsekiz Mart University

International Journal of Progressive Education, Volume 17 Number 1, 2021 © 2021 INASED
233
INTRODUCTION
Evaluation of the education-training process is very important for determining the effectiveness of education. Evaluations provide feedback for activities such as time spent on education, effort etc. As a result of the these evaluations, deficiencies in education are determined and action is taken to overcome this (Haney & Madaus, 1989). Because of the fact that evaluations are an essential part of the education system, they can be performing at the beginning, during and at the end of the education process (Neil & Medina, 1989). Traditional assessment is a set of values that mostly focus on the product rather than the process, which is independent from the teaching process, and has difficulty in determining complex levels of knowledge (Toptaş, 2011; Wolf, 1995). There may be situations where the process and the product need to be evaluated together according to the target set in the teaching. Since traditional assessment could not meet this expectation, alternative measurement approaches were developed (Lumley & McNamara, 1993; Linn & Gronlund, 1994). While traditional assessment methods prioritize the cognitive behavior development processes of the student in general, alternative measurement approaches follow also the development of the cognitive, psychomotor and affective behaviors of students (Çalışkan & Kaşıkçı, 2010). Alternative assessment approaches can asses and evaluate psychological learning such as high-level problem solving, project design, model making and implementation of knowledge into real life (Wiggins, 1989). Alternative measurement approaches can be called "Performance Evaluation", "Authentic Evaluation", "Complementary Evaluation", "Contemporary Evaluation", or "Alternative Evaluation" (DiMartino, Castaneda, Brownstein & Miles, 2007; Hamayan, 1995; Rennert-Ariev, 2005). The important features of alternative assessment approaches are its continuity, application of these approaches to all processes of teaching, and meaningful and interesting evaluations. According to the results of the previous studies when performance-assessed courses are used effectively; active learning is provided, individual learning is supported and students' interest in the course and academic success are positively affected (Apperson, Laws & Scepansky, 2006; Audrey, 2008; Cohen, 1992). Performance evaluation allows students to integrate the gained knowledge in the academic field into social life problems. In this way, the evaluations has become integrated in the real life. Contrary to the true-false questions completed in a given time, performance evaluation provides an opportunity to evaluate the talents of the individual as a result of long-term learning (Gönen, Çelebi & Işıtan, 2004). Unlike traditional evaluation’s limited product number, both the process and the product obtained at the end of the process can be evaluated together. In addition, the performance tasks offered to students also take individual differences into account (Airasian, 1994). Performance evaluation prevents the student from constantly playing passive role and increases the self-efficacy level of the student. It also provides active participation in the evaluation process. This situation changes the role of the student in the evaluation phase. Although the performance tasks given to the students are appropriate for the level of the students, they enable them to cooperate among the students, to make efforts with their knowledge in social life and to get away from the rote system (Zemelman, Daniels & Hyde, 1998). The change in performance not only changes the student's role, but also changes in the teacher’s role in participation level. (Tomlinson, 2001). Traditional assessment methods support a teacher-centered assessment strategy, while performance assessment puts the student at the center. here the teacher is a guide. In this way, students are motivated by focusing more on learning. The teacher should give confidence to the students by providing responsibilities appropriate to the level of the student (Mearoff, 1991; Linn & Gronlund, 1999). The teacher helps students to take responsibilities of their learning and become successful self-assessment experts. Briefly, it is necessary to work precisely and objectively assessment of performance. The reliability of the results to be obtained after the evaluations should also be high. In this context, because the performance evaluation is both precise and the high reliability coefficient, statistical analyzes are generally carried out in the Multi-Surface Rasch Measurement Model. With the Multi-Surface Rasch measurement model, it is possible to analyze the severity/leniency behaviour of the juries, item difficulty, reliability, bias and ability (Akiyama, 2012; Cheng & Warren, 1999; Farrokhi, Esfandiari & Schaefer, 2012; Lynch & McNamara, 1998; Matsuno, 2009 )

International Journal of Progressive Education, Volume 17 Number 1, 2021 © 2021 INASED
234
Multi-Surface Rasch Measurement Model
MRSM was developed by Linacre (1993) which is based on objectivity. The model, which enables obtaining sensitive and realistic analyzes, is an analysis method that provides data from many surfaces in a research (Elhan & Atakurt, 2005). Although there are two surfaces (criteria items and juries) in the Basic Rasch Model (Rasch, 1980) , there is no such limitation in MRSM. In other words it enables multiple juries (Eckes, 2005). Rasch analysis has some superior features compared to traditional measurement methods. Unlike traditional analysis models, MRSM uses measurement values that are free from errors occurring in the measurement. It standardizes the surfaces by combining them on a common denominator to provide an effective and unbiased measurement. It can also compare candidates' scientific research skills, the difficulty of the items, and the severity or leniency behavior of the juries. Apart from the ability levels of individuals and the difficulty values of the items, MRSM is an analysis model that enables other sources of variability that may affect test results, such as scoring key, scoring criteria, and juries (Lynch & McNamara, 1998). Up to now, a number of successful results of the applications of the Rasch model have been reported. For example, Lunz, Wright, and Linacre (1990) conducted a three-surface Rasch analysis that included juries seriousness, performance indicators, and criteria. Then they modeled these three surfaces and calibrated them. Engelhard (1992) used the Rasch model to assess the ability to write and reported significant differences in the severity of the juries even after extensive training. Kenyon and Stansfield (1992) examined the validity of the speech scale used in performance evaluation using Rasch analysis. Looney (1997) analyzed the scoring results from the 1994 Olympic figure skating competition through this model. Bastürk (2008) realized the evaluation of PowerPoint presentation performance in higher education with the versatile Rasch model. Eckes (2009) examined the writing and speaking performances to evaluate the juries effect in TestDaF (the Test of German as a Foreign Language) using the multi-surface Rasch analysis. Chang and Engelhard (2015) examined the psychometric quality of Teachers' Activity Sense Scale (TSES) using a multi-surface Rasch analysis. Also Özbaşı and Arcagök (2018) examined the Projects of Preschool Teachers using a multi-surface Rasch analysis. Park, Kim, Cha, Choi, and soo (2018) examined the effect of visual and cognitive bias on pathological diagnosis with a multi-surface Rasch analysis. Yuzuak, Erten and Kara (2019) examined the laboratory videos of science teacher candidates with many-facet Rasch measurement model. As reported above, Rasch model and Multi-faced Rasch model approach has been used in a steadily increasing number of applications in the different fields. Accordingly, the aim of this study is to analyze the instructional materials prepared by CTCs with MRSM. In this context, it can be claimed that the purpose of the research; i-evaluation of instructional materials by the juries in line with the criteria, ii-criterion hardness analysis, iii- the consistency/severity behaviours and bias analysis of the juries. For the above mentioned purposes these research questions have appeared,
1. What is the status of the calibration map according to the scoring obtained from the evaluation criteria of the instructional materials?
2. What are the statistics results regarding the measurement report of the instructional materials?
3. What are the statistics results of the measurement report of the criteria used in the evaluation of the instructional materials?
4. How do the consistency/severity behaviours of the juries change during the scoring of the instructional materials?
5. Is there any bias between Instructional materials and juries in scoring?
Thus, through the routine use of this procedure, it can increase the standardization of expert judgment in item evaluation.

International Journal of Progressive Education, Volume 17 Number 1, 2021 © 2021 INASED
235
METHOD
The survey design was used in the research. According to Best and Kahn (2006), the survey model should aim to collect data from a wide sample in a certain period. Also, Ekiz (2009) expressed this model is an analysis of the current situation. The data from the study group were obtained in accordance with the criteria table prepared in 5-point likert type. Accordingly, the data obtained were analyzed with MRSM. MRSM surfaces were created from the consistency/severity behaviours of eight CTCs, 8 instructional materials and 15-item of criteria form. J1, J2,…, J8 codes for juries, p1, p2,…, p8 codes for instructional materials and M1, M2,… .M15 codes for criteria items were used.
Working Group
Linacre (1995) stated that in the Rasch measurement model, the results of the data obtained from the sample were not assumed to be generalized to the universe. Therefore, the concept of “working group” was used in the study. Accordingly, eight different instructional material proposals prepared by chemistry teacher candidates (CTCs) in Faculty of Education of Çanakkale Onsekiz Mart University formed the working group of the research. The materials were also prepared within the scope of instructional technologies and material design course in the 2019-2020 academic years. Eight CTCs were included in the peer assessment process in the study. Instructional materials recommended by CTCs are coded as P1: Bohr Atomic Model, P2: Three-dimensional VSPER representation, P3: Chemistry Wheel (Periodic table), P4: Rutherford gold plate experiment, P5: Acid-base wheel, P6: Element cards, P7 : pH taboo, P8: Find the right! get the plus! (mixtures)
Data collection tool
In this research, the criterion form was used as a data collection tool. The criterion form was developed by the research project evaluation criteria of (Scientific and technological research institution in Turkey (TÜBİTAK-2019) and the learning outcomes of the course. The created criterion form was submitted to the approval of a commission consisting of two statistical experts, four chemistry teachers and two experts from chemistry education department. In this context, it was determined with content validity ratio (CVR) whether to use each item in the criterion form. In addition, content validity index (CVI) was calculated to determine whether there is a fit among experts (Lawshe, 1975). "Modified Lawshe Technique" was used for these calculations. Ratings of expert opinions in Lawshe technique were arranged as “Appropriate”, “Appropriate, but should be corrected”, and “Subtracted”. In calculating the content validity ratios of the content, 3 points were given for the “Appropriate” option, 2 points for the “Appropriate. But should be corrected” option and 1 point for the “Subtracted” option. In addition, experts who checked the "should be corrected" option were asked to give a second opinion, "What is your suggestion?". The experts who checked the "Subtracted" option were also asked to give a second opinion, "Why?". According to the evaluations of 8 expert people, the minimum CVR value in the criterion form was found as .86. This value is greater than the critical CRV value (.75) recommended for the opinions of eight experts by Ayre and Scally (2014) at α = .05 significance level. This result, which was obtained, indicated the statistical significance of each item in the criterion form. Also, the CVI value of the sum of all CVRs obtained for the criterion form was calculated as .93. Since there is CVI (.93)> CVR (.86), the content validity of the criterion form was found statistically significant. As a result, a criterion form consisting of 15 items in 5-likert type was prepared between 'not suitable' corresponding to 1 point and 'completely suitable' corresponding to 5 point.
Data Analysis
Quantitative data obtained in the study were analyzed by MRSM. FACETS program’s 3.71.4 version was used to analyze the data (Linacre, 2003). The study was designed as a three-dimensional

International Journal of Progressive Education, Volume 17 Number 1, 2021 © 2021 INASED
236
model with CTCs, criteria items and instructional materials. Accordingly, the data calibration map and three surfaces were evaluated with the same criteria. Detailed information about the interactions of CTCs and Instructional materials was obtained by analyzing the severity/leniency behaviours of CTCs. DeMars (2010) reported that unidimensionality, local independence and model-data fit are assumptions that must be met in order to perform a Rasch analysis. Accordingly, the assumptions of normality analysis, unidimensionality, data model compatibility and local independence, which are required for implementation of MRSM, were tested separately.
Normality Analysis and Unidimensionality
MRSM is a sub-branch of Rasch analysis, one of the forms of item response theory (Linacre, 2003). Namely, in order to interpret correctly the results obtained from MRSM, it must be tested that the data meet the one-dimensional assumption. In here, Explanatory Factor Analysis (EFA) was used to define whether the data was one-dimensional or not. EFA examines the related basic structures in the content of a data set and summarizes these structures. Thus, the normality test of the data was carried out for the feasibility of EFA. For his reason, Skewness and Kurtosis Values were determined as .122±.285 and -.636 ±.563, respectively. Kaiser Mayer Olkin's value for the adequacy of the sample was found as .86. Bartlett sphericity test was also statistically significant (ꭕ2 (105) = 523.097; p <.01). According to the results obtained, the sample was found to be suitable for EFA. EFA results are shown in Table 1. As given in Table 1, when the exploratory factor analysis results were examined, it was seen that the data was one-dimensional. While the smallest factor load value of the criteria was .435, the highest factor load value was calculated as .821. In addition, it was seen that the criteria items in the evaluation tool explained 44.85% of the total variance under one factor.
Table 1. EFA Results for The Material Evaluation Tool
Item Factor load Item Factor load Item Factor load M6 .821 M11 .689 M4 .621 M10 .786 M14 .688 M12 .615 M13 .785 M1 .676 M15 .580 M2 .741 M8 .675 M3 .497 M5 .693 M7 .627 M9 .435
Eigenvalues: 6.72 Announced variance: %44.85
On the other hand, the reliability of the criterion form was provided by the cronbach alpha coefficient and was calculated as .91. This reliability value was found to be quite sufficient. The calculated reliability coefficient of alpha is .91 which indicates that there is a high level of internal consistency between the criteria items. Also, the Cronbach Alpha Coefficient is considered as an indicator of the homogeneity of the criterion form. Accordingly, as Cronbach Alpha Coefficient approaches 1 the criterion form has a one-dimensional structure. Item-Total correlation was also examined as item statistics of the criterion items in the developed evaluation form (Tablo 2). Item total correlation is used to mean the relationship between the score obtained from each criterion and the total score. According to these results, it can be said that the criterion form has dimensionlessness.
Table 2 Item-Total Statistics
Item Scale mean if item deleted
Scale variance if item deleted
Corrected item-total correlation
Cronbach's alpha if item deleted
M1 51.11 81.15 .616 .902 M2 51.38 77.35 .673 .899 M3 51.36 80.55 .440 .907 M4 50.91 79.76 .572 .902 M5 51.21 79.74 .635 .901 M6 51.39 71.87 .773 .894 M7 50.91 79.22 .548 .903 M8 51.32 78.93 .611 .901 M9 51.30 82.13 .371 .909

International Journal of Progressive Education, Volume 17 Number 1, 2021 © 2021 INASED
237
M10 51.50 77.13 .730 .897 M11 51.40 76.01 .633 .900 M12 51.09 79.97 .549 .903 M13 51.43 73.39 .735 .896 M14 51.53 76.50 .626 .900 M15 51.29 78.32 .517 .905
The values in the last column of Table 2 show how the Cronbach alpha value changed with the
criterion item to be deleted. Accordingly, when the reliability values were examined, it was seen that there was not a big change. In short, no criteria item was removed from the criterion form because it did not decrease the reliability value.
Data Model Compatibility and Local Independence
In this study, standardized residual values (unexpected value) were analyzed to check whether the data-model fit for the Rasch model was met. According to Linacre (2003), in order for the model and data to be compatible, the standardized residual values that fall outside the ± 2 range should not exceed 5% of the total data in the study. Also, standardized residual values outside the ± 3 range should not exceed 1% of the total data count. Accordingly, data model compatibility depends on how small the standard residual value (StRes) is. According to the results of the analysis, while the ratio is 1.2% for values outside the ± 2 range, the standard residual rate for values outside the ± 3 range is calculated as .5%. This data showed that model fit is appropriate. However, Lee et al (2010) state that model-data fit can be achieved by meeting the one-dimensional assumption. Hambleton et al (1991) also reported that local independence would be achieved by meeting the one-dimensional assumption. Accordingly that the test meets the one-dimensional assumption criteria is sufficient to accept local independence. Local independence indicates whether there is a relationship between responses to a survey tool and is often associated with one-dimensionality.
RESULTS
Findings of Quantitative Data
In this study quantitative data analysis was conducted according to MRSM. The results obtained from the analysis are specified in tables and figures, and the comments on the results are given;
Variable Map Regarding Criteria, CSCs and Instructional materials
Instructional materials were prepared by CSCs were examined with MRSM. The surfaces used in this analysis are the severity/leniency behaviours of CSCs, the criteria and instructional materials. The data calibration map for these surfaces is given in Figure 1. The left side of Figure 1 shows the logit measurements between (-) and (+) values for the three surfaces.

International Journal of Progressive Education, Volume 17 Number 1, 2021 © 2021 INASED
238
Figure 1. Summary Report of CSCs, Criteria and Instructional Materials (Data Calibration Map)
The data calibration map given in Figure 1 is converted and explained in Table 3, detailly. According to Table 3, instructional material, M2 was found to be more successful (logit = 1.55). Instructional material in the lowest skill level is M8 (logit = -1.34). Table 3 also showed that other instructional materials were scored moderately. On the other hand, when we look at the criteria items in which instructional materials are evaluated from Table 3, the easiest criteria were Crt10 (logit= .41) and Crt14 (logit= .40). These criteria items are related to "Depth principle" and "Availability principle", respectively. The most difficult criterion was Crt4 (logit= -.66) related to the "Visual principle". Finally, when CSCs are evaluated according to Table 3, the most generous CSCs that give the highest scores are J1 (logit = 1.33) and J3 (logit = 1.32). In this context, the stiffness CSCs that give the lowest score are J2 (logit = .73) and J8 (logit = .71). According to the these results it can be claimed that other jury members have positive thoughts due to their closeness to +1 value.
Table 3. Logit Values for CSCs, Instructional Materials and Criteria Items instructional materials logit CSC logit Criterion logit P1: Bohr atomic model -.97 J1 1.33 Crt1: The principle of meaningfulness -.18 P2: VSPER notation 1.55 J2 .73 Crt2: The principle from known to unknown .30 P3: Chemistry wheel .63 J3 1.32 Crt3: Multi-instance principle .29 P4: Rutherford Atom Model -.21 J4 .81 Crt4: Visual principle -.66 P5: Acid-Base Wheel .14 J5 .87 Crt5: Selectivity principle in perception -.09 P6: Element Cards -.61 J6 1.27 Crt6: The principle of completing the subject .28 P7: PH Taboo 1.07 J7 1.18 Crt7: Figure-fund relationship principle -.62 P8: Blends Puzzle -1.34 J8 .71 Crt8: Unification principle .21 J9 .80 Crt9: The principle of invariance .19 Crt10: Depth principle .41 Crt11: The principle of innovation .31 Crt12: Simplicity principle -.19 Crt13: Compliance to target behavior .38 Crt14: Availability policy .40 Crt15: Time adjustment policy -.02
International Journal of Progressive Education, Volume 17 Number 1, 2021 © 2021 INASED
239
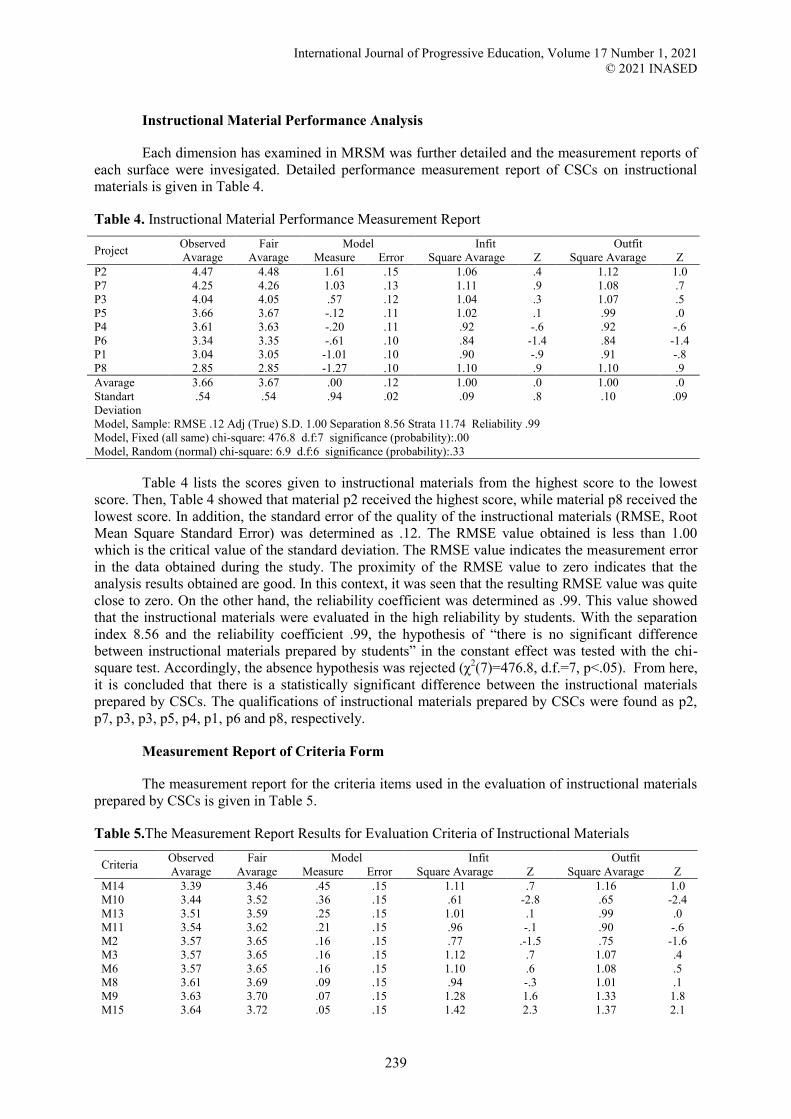
Instructional Material Performance Analysis
Each dimension has examined in MRSM was further detailed and the measurement reports of each surface were invesigated. Detailed performance measurement report of CSCs on instructional materials is given in Table 4.
Table 4. Instructional Material Performance Measurement Report
Project Observed Avarage
Fair Avarage
Model Infit Outfit Measure Error Square Avarage Z Square Avarage Z
P2 4.47 4.48 1.61 .15 1.06 .4 1.12 1.0 P7 4.25 4.26 1.03 .13 1.11 .9 1.08 .7 P3 4.04 4.05 .57 .12 1.04 .3 1.07 .5 P5 3.66 3.67 -.12 .11 1.02 .1 .99 .0 P4 3.61 3.63 -.20 .11 .92 -.6 .92 -.6 P6 3.34 3.35 -.61 .10 .84 -1.4 .84 -1.4 P1 3.04 3.05 -1.01 .10 .90 -.9 .91 -.8 P8 2.85 2.85 -1.27 .10 1.10 .9 1.10 .9 Avarage 3.66 3.67 .00 .12 1.00 .0 1.00 .0 Standart Deviation
.54 .54 .94 .02 .09 .8 .10 .09
Model, Sample: RMSE .12 Adj (True) S.D. 1.00 Separation 8.56 Strata 11.74 Reliability .99 Model, Fixed (all same) chi-square: 476.8 d.f:7 significance (probability):.00 Model, Random (normal) chi-square: 6.9 d.f:6 significance (probability):.33
Table 4 lists the scores given to instructional materials from the highest score to the lowest score. Then, Table 4 showed that material p2 received the highest score, while material p8 received the lowest score. In addition, the standard error of the quality of the instructional materials (RMSE, Root Mean Square Standard Error) was determined as .12. The RMSE value obtained is less than 1.00 which is the critical value of the standard deviation. The RMSE value indicates the measurement error in the data obtained during the study. The proximity of the RMSE value to zero indicates that the analysis results obtained are good. In this context, it was seen that the resulting RMSE value was quite close to zero. On the other hand, the reliability coefficient was determined as .99. This value showed that the instructional materials were evaluated in the high reliability by students. With the separation index 8.56 and the reliability coefficient .99, the hypothesis of “there is no significant difference between instructional materials prepared by students” in the constant effect was tested with the chi-square test. Accordingly, the absence hypothesis was rejected (χ2(7)=476.8, d.f.=7, p<.05). From here, it is concluded that there is a statistically significant difference between the instructional materials prepared by CSCs. The qualifications of instructional materials prepared by CSCs were found as p2, p7, p3, p3, p5, p4, p1, p6 and p8, respectively.
Measurement Report of Criteria Form
The measurement report for the criteria items used in the evaluation of instructional materials prepared by CSCs is given in Table 5.
Table 5.The Measurement Report Results for Evaluation Criteria of Instructional Materials
Criteria Observed Avarage
Fair Avarage
Model Infit Outfit Measure Error Square Avarage Z Square Avarage Z
M14 3.39 3.46 .45 .15 1.11 .7 1.16 1.0 M10 3.44 3.52 .36 .15 .61 -2.8 .65 -2.4 M13 3.51 3.59 .25 .15 1.01 .1 .99 .0 M11 3.54 3.62 .21 .15 .96 -.1 .90 -.6 M2 3.57 3.65 .16 .15 .77 .-1.5 .75 -1.6 M3 3.57 3.65 .16 .15 1.12 .7 1.07 .4 M6 3.57 3.65 .16 .15 1.10 .6 1.08 .5 M8 3.61 3.69 .09 .15 .94 -.3 1.01 .1 M9 3.63 3.70 .07 .15 1.28 1.6 1.33 1.8 M15 3.64 3.72 .05 .15 1.42 2.3 1.37 2.1

International Journal of Progressive Education, Volume 17 Number 1, 2021 © 2021 INASED
240
M5 3.72 3.80 -.09 .16 .63 -2.5 .68 -2.1 M1 3.83 3.91 -.29 .16 .68 -2.0 .80 -1.2 M12 3.83 3.91 -.29 .16 1.11 .6 1.19 1.1 M7 4.01 4.08 -.64 .17 1.12 .7 1.10 .6 M4 4.03 4.10 -.66 .17 .97 -.1 .99 .0 Avarage 3.66 3.74 .00 .15 .99 -.1 1.00 .0 Standart Deviation
.19 .19 .33 .01 .23 1.5 .22 1.4
Model, Sample: RMSE .15 Adj (True) S.D. .30 Separation 1.92 Strata 2.89 Reliability .79 Model, Fixed (all same) chi-square: 60.9 d.f:14 significance (probability):.00 Model, Random (normal) chi-square: 11.4 d.f:13 significance (probability):.58
Table 5 shows a detailed measurement report of the criteria items used in the evaluation of
instructional materials. In this context, it was determined from Table 5 that the criteria that CSCs had most difficulty in preparing instructional materials were M14 regarding the "Readiness principle" and M10 regarding the “Depth Principle”. Also, the simplest criteria items for CSCs were M7 related to “Figure-fund relationship principle” and M4 related to “Visual principle”. Table 5 shows that the standard error value (RMSE) for criteria form in instructional material design has a very small value of .15. The corrected standard deviation value calculated based on this error value was determined as .30. Since this value was below the reference value of 1.00, it was seen that the results were effective in evaluating the criteria items. The reliability coefficient of the criteria used in the evaluation of instructional materials prepared by CSCs was recorded as .79. However, the separation index for the evaluation criteria from Table 5 was found as 1.92. In addition, the absence hypothesis that "there is no significant difference between the difficulties of the criteria used in determining the quality of students' instructional materials" was rejected by chi-square test (χ2(14)=60.9, d.f=14, p<.05). This result showed that the criteria from could evaluate the student instructional materials in different ways and there was a statistically significant difference between the difficulty levels of the criteria items. “İnfit” and “outfit” values of the criteria form are also read from Table 5. According to Baştürk (2010), in the Rasch analysis, for the unexpected answers in decision making about instructional materials, "infit MnSq " and "outfit MnSq " values that are sensitive to distant unexpected answers should be determined. Linacre, Wright and Lunz (1990) reported as 0.6-1.4 the quality control limit range for "infit MnSq " and "outfit MnSq " values in the Rasch analysis. No answers exceeding the limit determined for both indexes were found in Table 5. Accordingly, it was observed that "infit MnSq " and "outfit MnSq " values of the criteria from used in determining the quality of instructional materials prepared by CSCs were among the expected quality control values. As a result, each criterion items was evaluated as appropriate
Rater Measurement Report
Table 6 presents the severity/leniency report obtained as a result of the evaluation of instructional materials in accordance with certain criteria items of CSCs.
Table 6. Measurement Report on The Severity/Leniency Behaviours of Cscs
Judge Observed Avarage
Fair Avarage
Model Infit Outfit Measure Error Square Avarage Z Square Avarage Z
J3 3.86 3.94 1.33 .12 .93 -.4 .95 -.3 J1 3.85 3.93 1.31 .12 1.28 1.9 1.35 2.5 J6 3.78 3.86 1.18 .12 .96 -.2 .96 -.2 J7 3.71 3.79 1.06 .12 .90 -.7 .89 -.8 J5 3.62 3.70 .91 .12 1.04 .3 1.01 .1 J4 3.56 3.64 .81 .12 .82 -1.4 .86 -1.1 J9 3.55 3.63 .80 .12 .88 -.9 .93 -.5 J8 3.52 3.60 .74 .12 .98 -.1 .97 -.2 J2 3.51 3.59 .73 .12 1.12 1.0 1.12 .9 Avarage 3.66 3.74 .98 .12 .99 -.1 1.00 .0 Standart Deviation
.13 .13 .23 .00 .13 1.0 .14 1.0
Model, Sample: RMSE .12 Adj (True) S.D. .21 Separation 1.76 Strata 2.68 Reliability (not inter-rater) .76

International Journal of Progressive Education, Volume 17 Number 1, 2021 © 2021 INASED
241
Model, Fixed (all same) chi-square: 32.0 d.f:8 significance (probability):.00 Model, Random (normal) chi-square: 6.4 d.f:7 significance (probability):.49
Table 6 shows the severity/leniency scores of CSCs from the most generous to the strictest.
Accordingly, it was seen from Table 6 that the most generous CSC was “J3” with 463 points, and the strictest CSC was “J2” with 421 points. On the other hand, according to the scores given by the Juries, the standard error value RMSE for all data except for extremes was determined as .12. The corrected standard deviation value determined by this value is .21. Since these two values are below the reference value of 1.00, it was observed that they comply with the standards. On the other hand, the reliability coefficient of the scores given by CSCs is .76. The separation index of scoring is also determined as 1.76. In addition, according to the chi-square test, the absence hypothesis that “there is no significant difference between them regarding their severity/leniency in line with the scores given by the juries” was rejected (χ2(8)=32, d.f.=8, p<.00). According to these results, there was a statistically significant difference between the severity/leniency of CSCs. With these data, Table 6 showed that all of "infit MnSq" and "outfit MnSq " values are within the range of expected quality control values and these values are consistent within themselves. From all these results, the order of CSCs from the most generous to the strictest was J3, J1, J6, J7, J5, J4, J9, J8, and J2.
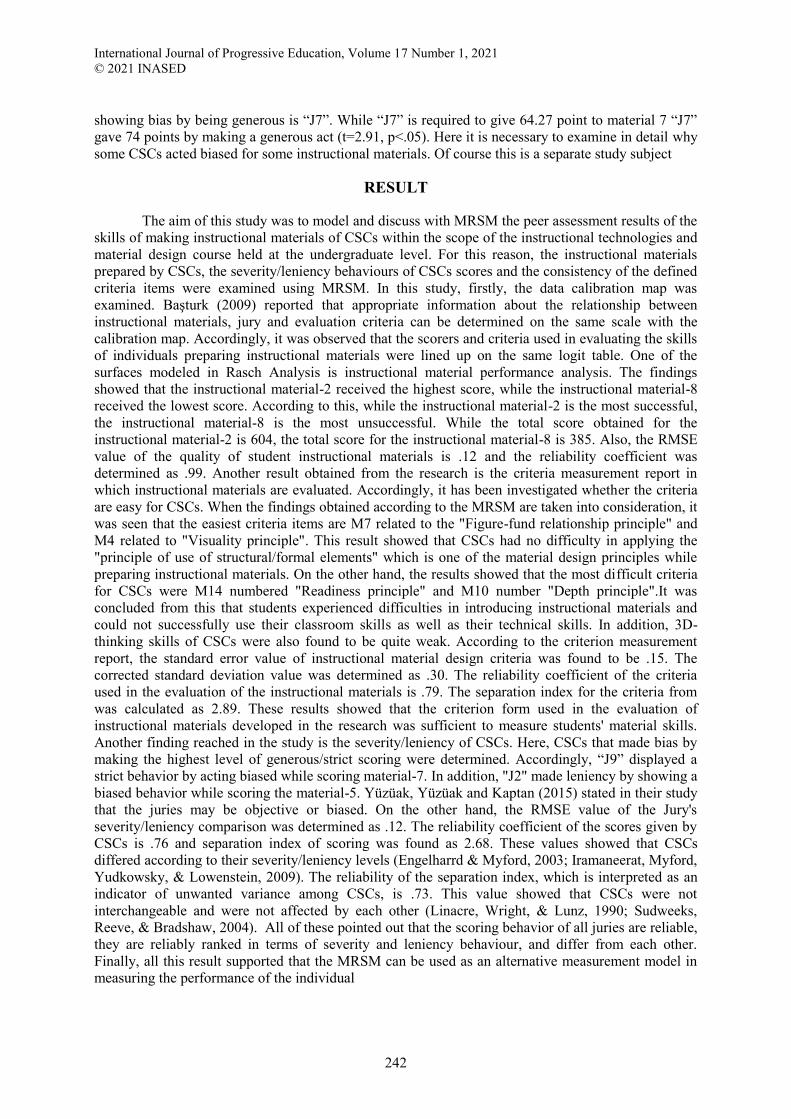
CSCs- instructional materials Bias Analysis
The bias/interaction tables can embody the absolute measurement situation in the evaluation of CSCs and instructional materials. According to this, statistics regarding bias levels of CSCs are given in Table 7.
Table 7. Interaction Analysis of CSCs and Instructional Materials
Table 7 shows the interaction analysis between CSCs and student materials. Accordingly, Table 7 can give information about whether CSCs make bias when scoring the materials. When the t-values related to scores of the CSCs participating in the research are examined it can be said that juries that take value outside the range of -2 and +2 act biased by making strict or generous scoring (Linacre, 2003). In this context, it was obtained that almost all CSCs in Table 7 were biased when scoring student materials. Accordingly, when CSCs that make bias by examining the highest level of generous/strict scoring are examined CSC-“J9” was biased when scoring the instructional material 7. J9 only gave 51 points to the material 7 that should score 62.55 points. That's why J9 made a strict scoring for this material (t=-4.39, p<.05). In addition, J1 gave only 60 points to material 2 While J1 is required to give 68.71 point. It shows that J1 has a strict attitude by being biased in terms of scoring (t=-4.00, p<.05). In addition, from Table 7, it can be clearly identified in the CSCs making bias by generously. Accordingly, the most generous CSCs is “J2”. while “J2” is requred to give 52.48 points to material 5, “J2” was very generous by giving 62 points (t=3.00, p<.05). In addition, another CSC
International Journal of Progressive Education, Volume 17 Number 1, 2021 © 2021 INASED
242
showing bias by being generous is “J7”. While “J7” is required to give 64.27 point to material 7 “J7” gave 74 points by making a generous act (t=2.91, p<.05). Here it is necessary to examine in detail why some CSCs acted biased for some instructional materials. Of course this is a separate study subject
RESULT
The aim of this study was to model and discuss with MRSM the peer assessment results of the skills of making instructional materials of CSCs within the scope of the instructional technologies and material design course held at the undergraduate level. For this reason, the instructional materials prepared by CSCs, the severity/leniency behaviours of CSCs scores and the consistency of the defined criteria items were examined using MRSM. In this study, firstly, the data calibration map was examined. Başturk (2009) reported that appropriate information about the relationship between instructional materials, jury and evaluation criteria can be determined on the same scale with the calibration map. Accordingly, it was observed that the scorers and criteria used in evaluating the skills of individuals preparing instructional materials were lined up on the same logit table. One of the surfaces modeled in Rasch Analysis is instructional material performance analysis. The findings showed that the instructional material-2 received the highest score, while the instructional material-8 received the lowest score. According to this, while the instructional material-2 is the most successful, the instructional material-8 is the most unsuccessful. While the total score obtained for the instructional material-2 is 604, the total score for the instructional material-8 is 385. Also, the RMSE value of the quality of student instructional materials is .12 and the reliability coefficient was determined as .99. Another result obtained from the research is the criteria measurement report in which instructional materials are evaluated. Accordingly, it has been investigated whether the criteria are easy for CSCs. When the findings obtained according to the MRSM are taken into consideration, it was seen that the easiest criteria items are M7 related to the "Figure-fund relationship principle" and M4 related to "Visuality principle". This result showed that CSCs had no difficulty in applying the "principle of use of structural/formal elements" which is one of the material design principles while preparing instructional materials. On the other hand, the results showed that the most difficult criteria for CSCs were M14 numbered "Readiness principle" and M10 number "Depth principle".It was concluded from this that students experienced difficulties in introducing instructional materials and could not successfully use their classroom skills as well as their technical skills. In addition, 3D-thinking skills of CSCs were also found to be quite weak. According to the criterion measurement report, the standard error value of instructional material design criteria was found to be .15. The corrected standard deviation value was determined as .30. The reliability coefficient of the criteria used in the evaluation of the instructional materials is .79. The separation index for the criteria from was calculated as 2.89. These results showed that the criterion form used in the evaluation of instructional materials developed in the research was sufficient to measure students' material skills. Another finding reached in the study is the severity/leniency of CSCs. Here, CSCs that made bias by making the highest level of generous/strict scoring were determined. Accordingly, “J9” displayed a strict behavior by acting biased while scoring material-7. In addition, "J2" made leniency by showing a biased behavior while scoring the material-5. Yüzüak, Yüzüak and Kaptan (2015) stated in their study that the juries may be objective or biased. On the other hand, the RMSE value of the Jury's severity/leniency comparison was determined as .12. The reliability coefficient of the scores given by CSCs is .76 and separation index of scoring was found as 2.68. These values showed that CSCs differed according to their severity/leniency levels (Engelharrd & Myford, 2003; Iramaneerat, Myford, Yudkowsky, & Lowenstein, 2009). The reliability of the separation index, which is interpreted as an indicator of unwanted variance among CSCs, is .73. This value showed that CSCs were not interchangeable and were not affected by each other (Linacre, Wright, & Lunz, 1990; Sudweeks, Reeve, & Bradshaw, 2004). All of these pointed out that the scoring behavior of all juries are reliable, they are reliably ranked in terms of severity and leniency behaviour, and differ from each other. Finally, all this result supported that the MRSM can be used as an alternative measurement model in measuring the performance of the individual

International Journal of Progressive Education, Volume 17 Number 1, 2021 © 2021 INASED
243
Suggestions
Suggestions related to the research or for the researchers are given below;
1. According to the results of the study, some CSCs were biased towards some materials during the evaluation phase. Therefore, a short training course should be given to CSCs to explain how the scoring should be done.
2. Additional measurement methods such as questionnaires and interviews can be used to reveal the causes of bias in studies performed by the Rasch model
3. It should be ensured that the measurement of skills in 3-dimensional design issues should be made more precisely in “instructional technologies and material design” course in the Faculties of Education.
4. For this study, only criteria, project and jury aspects should be considered. Experts can be added to the research as the fourth surface. Thus, students can further specialize in material design and preparation processes.
REFERENCES
Airasian, P. (1994). Classroom assessment, New York: McGraw Hill
Akiyama, T. (2012). A close look at english teacher employment examinations (etees): how do raters assess?. Proceedings of The 17th Conference of Pan-Pacific Association of Applied Linguistics. Erişim: 20.12.2014, http://www.paaljapan.org/conference2012/ proc_PAAL2012/pdf/poster/P-15.pdf
Apperson, J. M. Laws, E. L., & Scepansky, J. A. (2006). The impact of presentation graphics on students’ experience in the classroom. Computers and Education, 47(1), 116-126.
Audrey, R. M-Q. (2008). Utilizing powerpoint presentation to promote fall prevention among older adults. The Health Educator, 40(1), 46-52.
Ayre, C., & Scally A. J. (2014). Critical values for Lawshe’s content validity ratio: revisiting the original methods of calculation. Measurement and Evaluation in Counseling and Development, 47(1), 79–86.
Basturk R., (2008) Applying the many‐facet Rasch model to evaluate powerpoint presentation performance in higher education, Assessment & Evaluation in Higher Education, 33(4), 431-444.
Başturk, R. (2009). Applying the many-facet Rasch model to evaluate powerpoint presentation performance ın higher education, Assesment and Evaluation In Higher Education, 33(4), 431 – 444.
Başturk, R. (2010). Bilimsel araştırma ödevlerinin çok-yüzeyli Rasch ölçme modeli ile değerlendirilmesi. Eğitimde ve Psikolojide Ölçme ve Değerlendirme Dergisi, 1(1), 51-57.
Best, J.W., & Kahn, J.V. (2006), Research in education (10th Ed.), Boston MA. Pearson
Chang M.L. & Engelhard Jr. G. (2015), Examining the teachers’ sense of efficacy scale at the ıtem level with Rasch measurement model , Journal of Psychoeducational Assessment, 34(2), 177-191.

International Journal of Progressive Education, Volume 17 Number 1, 2021 © 2021 INASED
244
Cheng, W., & Warren, M. (1999). Peer and teacher assessment of the oral and written tasks of a group project. Assessment & Evaluation in Higher Education, 24(3), 301
Cohen, J. (1992). Statistical power analysis, Current Directions in Psychological Science, 1(3), 98-101.
Çalışkan, H., & Kaşıkçı, Y. (2010). The application of traditional and alternative assessment and evaluation tools by teachers in social studies. Procedia Social and Behavioral Sciences 2, 4152–4156.
DeMars, C. (2010). Item response theory. Oxford, UK: Oxford University Press.
DiMartino, J., Castaneda, A., Brownstein, M. & Miles, S. (2007). Authentic assessment. Principal’s Research Review, 2(4), 1-8.
Eckes T., (2005) Examining rater effects in TestDaF writing and speaking performance assessments: A many-facet Rasch analysis, Language AssessmentQuarterly: An International Journal, 2(3), 197-221
Eckes, T. (2005). Examining rater effects ın testdaf writing and speaking performance assessments: a many facet Rasch analysis. Language Assessments Quarterly, 2, 197-221.
Ekiz, D. (2009). Bilimsel araştırma yöntemleri (Genişletilmiş 2.Baskı). Ankara: Anı Yayıncılık
Elhan, A. H., & Atakurt, Y. (2005). Ölçeklerin değerlendirilmesinde niçin Rasch analizi kullanılmalı. Ankara Üniversitesi Tıp Fakültesi Mecmuası, 58, 47-50.
Engelhard, G., & Myford, C.M. (2003). Monitoring faculty consultant performance in the Advanced Placement English Literature and Composition Program with a many-faceted Rasch model. ETS Research Report Series, (01). Princeton, NJ: Educational Testing Service
Engelhard, G., Jr. (1992). The measurement of writing ability with a Many-Faceted Rasch model. Applied Measurement in Education, 5. 171-191.
Farrokhi, F., Esfandiari, R., & Schaefer, E. (2012). A many-facet Rasch measurement of differential rater severity/leniency ın three types of assessment. JALT Journal, 34(1), 79-102.
Gönen, M.E., Çelebi, E., & Işıtan, S., (2004). İlköğretim 5., 6. ve 7. sınıf öğrencilerinin okuma alışkanlıklarının incelenmesi, Milli Eğitim Dergisi, 164
Hamayan, E. V. (1995). Approaches to alternative assessment. Annual Rewiew of Applied Linguistics. 15, 212- 226.
Hambleton, R. K., Swaminathan, H., & Rogers, H. J. (1991). Fundamentals of item response theory. Newbury Park, CA: Sage
Haney, W. & Madaus, G. (1989). Searching for alternatives to standardized tests: whys, whats, and whithers. Phi Delta Kappan, 70, 683–687.
Iramaneerat, C., Myford, C.M., Yudkowsky, R., & Lowenstein, T. (2009).Evaluating the effectiveness of rating instruments for a communication skills assessment of medical residents. Advances in Health Sciences Education,14(4), 575-594
Kenyon, D. M., & Stansfield, C. W. (1992, April). Examining the validity of a scale used in a performance assessmentfrom many angles using the Many-Faceted Rasch Madel. Paper

International Journal of Progressive Education, Volume 17 Number 1, 2021 © 2021 INASED
245
presented at the meeting of the American Educational Research Association, San Francisco, CA.
Lawshe, C.H. (1975). A quantitative approach to content validity. Personnel Psychology, 28, 563–575
Lee, M., Peterson, J. J., & Dixon, A. (2010). Rasch calibration of physical activity self-efficacy and social support scale for persons with intellectual disabilities. Research in Developmental Disabilities, 31(4), 903−913.
Linacre, J.M., Wright B.D., & Lunz M.E. (1990). A facets model of judgmental scoring. Memo 61. MESA Psychometric Laboratory. University of Chicago.
Linacre, J. M. (1993). Generalizability theory and many facet Rasch measurement. Annual Meeting of The American Educational Research Association. (April, 13, 1993), (ED 364 573). Atlanta Georgia.
Linacre, J.M. (1995). Rasch measurement transaction. MESA Press, Chichago, USA.
Linacre, J.M. (2003). Size vs. significance: Standardized chi-square fit statistic. Rasch Measurement Transactions, 17(1), 918.
Linn, R.L. & Gronlund, N.E. (1999). Measurement and assessment in teaching (7th Edn), Columbus, OH: Merill.
Looney, M. A. (1997). A many-facet Rasch analysis of 1994 olympic figure skating scores [Abstract]. Research Quarterly for Exercise and Sport, 68(Suppl. I), A-53.
Lumley, T. & McNamara, T.F. (1993). Rater characteristics and rater bias: implications for training. Paper presented at the Language Testing Research Colloquium, Cambridge, UK. ED: 365 091
Lunz, M. E., Wright, B. D., & Linacre, J. M. (1990). Measuring the impact of judge severity of examination scores. Applied Measurement in Education, 3, 331-345.
Lynch, B. K., & McNamara, T. F. (1998). Using G-theory and many-facet Rasch measurement ın the development of performance assessments of the esl speaking skills of immigrants. Language Testing, 15(2), 158–180.
Matsuno, S. (2009). Self-, peer-, and teacher-assessments in japanese university efl writing classrooms. Language Testing, 26(1), 75-100.
Mearoff, G.I. (1991). Assessing alternative assessment. Phi Delta Kappan, 73(4), 272–281.
Neil, D.M. & Medina, N.J. (1989). Standardized testing: harmful to educational health. Phi Delta Kappan, 70, 688–697
Özbaşi D., & Arcagök S., (2019). An ınvestigation of pre-service preschool teachers’ projects using the many-facet Rasch model, International Journal of Progressive Education, 15(4), 157-173,
Park, H., Kim, H. S., Cha, Y. J., Choi, J., Minn, Y., Kim, K. S., & Kim, S. H. (2018). The effect of mental rotation on surgical pathological diagnosis. Yonsei medical journal, 59(3), 445-451.
Rasch, G. (1980). Probabilistic models for some intelligence and attainment tests. Chicago, IL.: MESA Press.

International Journal of Progressive Education, Volume 17 Number 1, 2021 © 2021 INASED
246
Rennert-Ariev, P. (2005). A theoretical model for the authentic assessment of teaching. Practical Assessment Research and Evaluation, 10(2), 1-11.
Sudweeks, R.R., Reeve, S., & Bradshaw, W.S. (2004). A comparison of generalizability theory and many-facet Rasch measurement in an analysis of college sophomore writing. Assessing Writing, 9(3), 239-261
Tomlinson, C.A. (2001). Grading for success. Educational Leadership, 3: 12–15.
Toptaş, V. (2011). Sınıf öğretmelerinin matematik dersinde alternatif ölçme ve değerlendirme yöntemlerinin kullanımı ile ilgili algıları. Eğitim ve Bilim, 36(159), 205-219.
TÜBİTAK (2018). Türkiye bilimsel ve teknolojik araştırma kurumu 1001-bilimsel ve teknolojik araştırma projelerini destekleme programı proje başvuru formu [http://tubitak.gov.tr/tr/destekler/akademik/ulusal-destek-programlari/1001/icerik-basvuruformlari ] web adresinden 2.2.2020 tarihinde indirildi.
Wiggins, G.P. (1989). A true test: toward more authentic and equitable assessment. Phi Delta Kappan, 70, 9, 703–713.
Wolf, A. (1995). Authentic assessments in a competitive sector: institutional prerequisites and cautionary tales. In Evaluating authentic an Assessment, Edited by: Torrance, H. 78–87. Buckingham: Open University Press
Yuzuak, A.V., Erten, S. & Kara, Y. (2019). Analysis of laboratory videos of science teacher candidates with many-facet Rasch measurement model. Journal of Education in Science, Environment and Health (JESEH), 5(2), 146-155.
Yüzüak, A. V., Yüzüak, B., & Kaptan, F. (2015). Performans görevinin akran gruplar ve öğretmen yaklaşımları doğrultusunda çok-yüzeyli Rasch ölçme modeli ile analizi. Eğitimde ve Psikolojide Ölçme ve Değerlendirme Dergisi, 6(1), 1-11
Zemelman, S., Daniels, H. & Hyde, A. (1998). Best practices, Portsmouth, NH: Heinemann.