Embed Size (px)
Citation preview
The use of Rasch Measurement Theory
to address measurement and analysis challenges
in social science research
By
Celeste-Marié Combrinck
A thesis submitted in fulfilment of the requirements for the degree
PhD (Psychology)
In the Department of Psychology at the
UNIVERSITY OF PRETORIA
FACULTY OF HUMANITIES
SUPERVISOR: Professor Vanessa Scherman
CO-SUPERVISOR: Professor David Maree
March 2018

No part of this work may be reproduced in any form or by any means,
electronically, mechanically by print or otherwise without prior written permission
by the author.
Citation for published version (APA): Combrinck, C. (2018). The use of Rasch
Measurement Theory to address measurement and analysis challenges in social science
research. (Doctoral thesis). Pretoria: University of Pretoria
Celeste Combrinck
Centre for Evaluation and Assessment (CEA)
University of Pretoria

Dedications & Acknowledgements
Dedications
God, my Creator and Redeemer
Alletta Combrinck, a mother par excellence
Werner Combrinck, my brother and a truly good man
Thanks and acknowledgements
Vanessa Scherman, a SUPER supervisor and my mentor, friend and cheerleader.
Without you Vanessa, this thesis would never have happened. I owe you more than
I can ever hope to repay
David Maree, who introduced me to Rasch theory and set me on this path. Thank
you for allowing us to do something a little different from the usual SA thesis
Tim Dunne, his insights and patient assistance made the article on anchor items
possible. You are greatly missed Professor Dunne
Caroline Long, my other Rasch mother who is always willing to help and is
ceaselessly supportive
Cilla Dowse, who provided language editing and coached me in academic writing
My colleagues at the CEA for their support and Sarah Howie for the many valuable
opportunities and experiences she provided
Acknowledgements
The financial assistance of the National Research Foundation (NRF) towards this
research is hereby acknowledged. Opinions expressed and conclusions arrived at,
are those of the author and are not necessarily to be attributed to the NRF
The articles presented in this thesis would not have been possible without the other
“supervisors”, the nameless individuals from the journals who reviewed the papers
and provided intensive feedback and insights to improve the quality of the writing
and interpretation of the findings
©University of Pretoria i
ABSTRACT
High quality assessment instruments, in conjunction with best practice for data
processing, analysis and reporting are essential for the monitoring of academic school
achievement. In this thesis, Rasch Measurement Theory (RMT) as the primary method,
addressed issues related to the monitoring of academic achievement. Rasch theory makes
use of logistic regression models, which calibrate instruments by calculating item and
person fit. The main study monitored the academic achievement of 3 697 Grades 8 to 11
learners at seven independent high schools in South Africa over a three- year period.
Monitoring was done via specifically designed assessment instruments for Mathematics,
Science and English Language. The main research question asked: How does the
application of Rasch models address measurement problems in the processing, analysis
and reporting of educational monitoring results? The thesis comprises three articles
(presented as chapters and seen as sub-projects), and investigates challenges arising from
the monitoring project. Measurement challenges addressed includes how to impute
Missing Not At Random Data (Article 1), how to evaluate anchor items and reframe
results (Article 2) and create proficiency bands (Article 3). Recommendations from the
articles consist of using Rasch measures as predictors for imputation models, applying
the Rasch models for evaluating anchor items and reframing test re-test results and the
use of Rasch Item Maps for reporting criterion-referenced results. The thesis concludes
by recommending that psychometric theory and application be taught in social science
courses for the development of high quality instruments and the strengthening of
measurement within the human sciences.
©University of Pretoria ii
KEYWORDS
Academic Achievement
Anchor or Common Items
Binary or Dichotomous items
Cognitive Constructs
Competency Bands
Criterion-Referenced Feedback
Education
Human Sciences
Imputation of Missing Data
Measurement
Missing Not at Random (MNAR) Data
Monitoring & Learning Progression
Monitoring Academic Achievement
Multiple Imputation (MI)
Psychometric Theory
Rasch Item Map Method
Rasch Measurement Theory
Rasch Models
Social Science Research
Structural Equation Modelling (SEM) of Missingness Mechanism
©University of Pretoria iii
TABLE OF CONTENTS
ABSTRACT I
KEYWORDS II
TABLE OF CONTENTS III
LIST OF ABBREVIATIONS VI
LIST OF TABLES VII
LIST OF FIGURES VIII
DECLARATION IX
ORIGINAL PAPERS X
CHAPTER 1 - INTRODUCTION 1
1.1 The main monitoring project 2
1.2 Definition of key terms 9
1.3 Structure of thesis 12
1.4 Conclusion: The article-based thesis as a story 15
CHAPTER 2 - THE EDUCATIONAL LANDSCAPE AND MONITORING 17
2.1 Introduction 17
2.2 Education in South Africa 18
2.3 Assessment in the South African context 19
2.4 Academic achievement, assessment and monitoring 22
2.5 Conclusions 23
CHAPTER 3 - METHODOLOGICAL AND THEORETICAL APPROACHES 25
3.1 Introduction: Ontological point of departure 25
3.2 The principles of measurement 25
3.3 The Rasch model 33
3.4 Measurement in a South African context 36
©University of Pretoria iv
3.5 Conceptual framework 40
3.6 Conclusion 43
CHAPTER 4 - THE MONITORING PROJECT’S METHODOLOGY 44
4.1 Introduction 44
4.2 Study population and sampling 45
4.3 Instruments - design and refinement 47
4.4 Assessment administration 48
4.5 Scoring, capturing and cleaning of data 49
4.6 Instrument reliability and validity 49
4.7 Methods of data analysis 50
4.8 Ethics 51
4.9 Conclusion 51
CHAPTER 5 - MULTIPLE IMPUTATION FOR DICHOTOMOUS MNAR ITEMS USING A
RECURSIVE STRUCTURAL EQUATION MODEL WITH RASCH MEASURES AS
PREDICTORS 53
5.1 Abstract 53
5.2 Introduction 53
5.3 Current Study 54
5.4 Method 56
5.5 Results 59
5.6 Discussion 67
5.7 Conclusion 68
CHAPTER 6 - EVALUATING ANCHOR ITEMS AND REFRAMING ASSESSMENT RESULTS
THROUGH A PRACTICAL APPLICATION OF THE RASCH MEASUREMENT MODEL 70
6.1 Abstract 70
6.2 Introduction 71
6.3 Method 73
6.4 Data analysis 75
©University of Pretoria v
6.5 Results 76
6.6 Discussion 84
6.7 Conclusion 86
CHAPTER 7 - THE USE OF RASCH COMPETENCY BANDS FOR REPORTING CRITERION-
REFERENCED FEEDBACK AND CURRICULUM-STANDARDS ATTAINMENT 87
7.1 Abstract 87
7.2 Context 88
7.3 Methods 92
7.4 Data analysis 96
7.5 Results and discussion 99
7.6 Implications for practice 103
7.7 Future research 105
CHAPTER 8 - DISCUSSION AND CONCLUSIONS 106
8.1 Introduction 106
8.2 Summary of methodology 108
8.3 Summary of results for research questions 111
8.4 Reflection on methodology 113
8.5 Reflection on conceptual framework 116
8.6 Limitations of the study 117
8.7 Recommendations 118
8.8 Conclusion 120
9. REFERENCES 121
10. APPENDICES 137
10.1 Appendix A: Permission letter from the Centre for Evaluation and Assessment, Faculty of Education 137
10.2 Appendix B: Permission letter form the Research Ethics Committee, Faculty of Humanities 138
10.3 Appendix C: Permission letter for external funding agency 139
10.4 Appendix D: Permission letter to learners and parents 141
10.5 Appendix E: Evaluating anchor items study - removed items 143

©University of Pretoria vi
LIST OF ABBREVIATIONS
CAPS Curriculum and Assessment Policy Statements
CEA Centre for Evaluation and Assessment
CTT Classical Test Theory
DBE Department of Basic Education
FET Further Education and Training
GET General Education and Training
IRT Item Response Theory
MCAR Missing Completely at Random Data
MI Multiple Imputation
MNAR Missing Not At Random
NCS National Curriculum Statement
NSC National Senior Certificate (Grade 12)
PCA Principal Component Analysis
PIRLS Progress in International Reading Literacy Study
RUMM Rasch Unidimensional Models for Measurement
RMT Rasch Measurement Theory
SACMEQ The Southern & Eastern African Consortium for Monitoring Educational Quality
SASA South African Schools Act
SEM Structural Equation Modelling
SPSS Statistical Package for the Social Science
TIMSS Trends in Mathematics and Science Study
TST True Score Theory
©University of Pretoria vii
LIST OF TABLES
Table 2.1 Types of assessment and accountability 21
Table 3.1 Comparison of psychometric theories 32
Table 3.2 Rasch Winsteps statistics and their interpretation 38
Table 4.1 Count of learners per grade and per school for each year of study 46
Table 4.2 Gender % and average age in each grade per year 47
Table 5.1 Summary of missing data for MCAR and MNAR items 60
Table 5.2 Standardised direct effects on imputation items 62
Table 5.3 Original data compared to pooled data 65
Table 6.1 Paired t-tests between Grade 8 mean score and Grade 9 mean score 77
Table 6.2 Item means based on raw scores and mean difference 77
Table 6.3 Wilcoxon signed-rank test of anchor items from years 1 to 2 78
Table 6.4 Person and item statistics for independent analysis (all items) 81
Table 6.5 Person and item statistics for stacked analysis of anchor items 82
Table 6.6 Grade 8 and Grade 9 independent measures calibrated descriptives 83
Table 6.7 Paired samples t-tests between Grade 8 independent and Grade 9 83
Table 7.1 Descriptive statistics of sample (percentage by column for grades) 92
Table 7.2 Range of Rasch item fit statistics for instruments from Gr. 8-Gr. 11 94
Table 7.3 Number of items, mean %, comments for grade 9 assessments 95
Table 7.4 Levels per subject and examples of level descriptions 98
Table 7.5 Section of the learner report from a grade 8 Natural Science section 99
Table 8.1 Summary of methodology for each article in thesis 109
Table 8.2 Research questions and results 112
©University of Pretoria viii
LIST OF FIGURES
Figure 1.1 The article-based thesis presented visually 16
Figure 3.1 The levels of measurement as defined by Stevens (1946) 33
Figure 3.2 Conceptual framework of applying Rasch models for best test design 41
Figure 3.3 The principles of measurement demonstrated with a thermometer 42
Figure 5.1 IBM Amos recursive model for imputing missing data 63
Figure 5.2 Q1 histogram predictor 1 64
Figure 5.3 Q9 histogram predictor 1 64
Figure 5.4 Q1 trace plot predictor 1 64
Figure 5.5 Q8 trace plot predictor 1 64
Figure 5.6 Q1 auto-correlation predictor 1 64
Figure 5.7 Q9 auto-correlation predictor 1 64
Figure 5.8 Mean person measures for all items (no MI) versus MI pooled 66
Figure 6.1 Item-measures based on independent Rasch analysis 80
Figure 6.2 Person measures based on stacked Rasch analysis 82
Figure 6.3 Processes followed for refining anchor items & reframing results 86
Figure 7.1 Item map – Example of Gr.8 English Language descriptions 97
Figure 7.2 English language proficiency % of learner in levels per grade 100
Figure 7.3 Mathematics proficiency – percentage of learner in levels per grade 101
Figure 7.4 Science proficiency – percentage of learner in levels per grade 102
Figure 7.5 Process of creating criterion-referenced feedback 103
Figure 8.1 The main processes presented by the articles and ultimate goal 107
Figure 9.1 Item 5 removed from instrument based on analysis 143
Figure 9.2 Item 15 removed from instrument based on analysis 143

©University of Pretoria ix
DECLARATION
I declare that this thesis is my own original work. Where secondary material is used, this
has been carefully acknowledged and referenced in accordance with university
requirements.
I understand what plagiarism is and am aware of university policy and implications in
this regard.
______________________________
Celeste Combrinck
30 August 2017
©University of Pretoria x
ORIGINAL PAPERS
Combrinck, C., Scherman, V., Maree, D. & Howie, S. (2018). Multiple
Imputation for dichotomous MNAR items using a Recursive Structural Equation
Model with Rasch Measures as predictors. Sage Open, 1 (1-12).
< PUBLISHED >
Combrinck, C., Scherman, V. & Maree, D. (2017). Evaluating anchor items and
reframing assessment results through a practical application of the Rasch
Measurement Model. South African Journal of Psychology, 1–14.
< PUBLISHED >
Combrinck, C., Scherman, V. & Maree, D. (2016). The use of Rasch
competency bands for reporting criterion-referenced feedback and curriculum-
standards attainment. Perspectives in Education, 34(4), 62-78.
<PUBLISHED>
©University of Pretoria 1
Chapter 1 - Introduction
A true thing badly expressed becomes a lie.
Fry (2011, p.1)
At the heart of all science is the need to know the subject matter, to truly understand the object
of study deeply, constructively and practically. The subject matter of social sciences focuses
on humans, who are adaptable and embedded in qualitative experiences that create challenges
to objective measurement. In social sciences, measurements are often made of subjects and
constructs, which are latent, hidden from view, but inferable from observations or proxy
variables (Andrich, 2001; Massof, 2011). The measurement of any phenomenon is the defining
of previously unknown quantities in ways that are accessible (Andrich, 2001; Bond & Fox,
2015; Cavanagh & Waugh, 2011; Boone, Staver & Yale, 2014). Theory and observation are
required to access latent traits to make the trait manifest for measurement (Bond & Fox, 2015).
The operationalisation of social constructs, such as learning, memory, feelings, knowledge,
skills and beliefs is the key to making measurement possible (Loubsera, Casteleijn & Bruce,
2015). Practically defining a construct makes it possible to create the ruler with which to
measure.
Years ago at a workshop on Item Response Theory at UNISA, the presenter alleged that it is
possible to measure anything. An objector in the audience immediately responded saying that
this is not true, in that some phenomena, such as ‘love’, cannot be measured. To which the
professor instantly replied: “Madam, you define it and I will measure it”. Without
measurement, science is not possible (Morris & Langari, 2012; Tal, 2017). Without a way to
quantify and classify constructs, the subject remains vague, and cannot be studied scientifically
(Granger, 2008). Disciplines that cannot measure constructs within their field become
metaphysical relegated to pseudoscience without new insights and growth.
To measure is to understand how objects or people move along a continuum on a theoretical
idea (Long, 2015). The construct being measured can be made accessible and explicit, broken
down into its parts along the growth line (Hendriks, Fyfe, Styles, Skinner & Merriman, 2012).
Deeply embedded in measurement theory is the concept of linearity, that one first learns to
©University of Pretoria 2
crawl, then to walk and finally to run (Granger, 2008). The degree to which such linearity can
be applied in more cognitive and psychosocial constructs varies, but evidence for linearity can
be found and documented, even if persons move back and forth on the ruler or skip over certain
points on the scale (Engelhard, 1996). In fact, the failure to master a point on the scale when
moving along to the next one could indicate malfunctioning at later stages, which means that
psychology and education could use these identified gaps on the scale to explain why persons
are further along the pathway but are not functioning as expected.
There is a great need for valid and reliable inferences about constructs; however, the inferences
should be derived from the use of sound instruments (Moutinho & Hutcheson, 2011). The
application of sound measurement principles is not only one of scientific rigour, but also an
ethical responsibility of the user of instruments within societal contexts (Engelhard, 1996;
Wilson, 2005). The Diagnostic and Statistical Manual of Mental Disorders (DSM-V) is in its
fifth edition, and with each new edition, some previously classified disorders are discarded,
new ones added and the scientific and general public left wondering: “Do these disorders exist?
How can it be that professionals trained to use the criteria in the DSM classify the same patient
into different disorders or as having no disorder?” (American Psychiatric Association, 2013).
Measurement theory holds some of the answers to these dilemmas, as the answer lies not only
in training clinicians but also in the development of instruments from which reliable, valid and
invariant inferences can be obtained in the context of the application (Bond & Fox, 2015;
Granger, 2008). The same challenges exist in all the social sciences. In education, the most
topical question is how to accurately measure latent traits such as ability and knowledge and
then to track the development of these constructs over time.
1.1 The main monitoring project
Rasch Measurement is the embodiment of measurement standards; it is the statistical models
that represent the requirements of measurement, and assess the degree to which an instrument
attains the requirements of true measurement (Boone et al., 2014; Bond & Fox, 2015; Wilson,
2005). By applying Rasch models to assess construct validity, the social sciences are in a
position to be able to measure in the same scientifically rigorous ways as is found in the natural
sciences.
©University of Pretoria 3
The research described in this article-based thesis, examined how Rasch measurement models
can be applied to solve present measurement challenges. The articles comprising this thesis
(accepted in journals both national and international), report on an educational monitoring
project involving seven independent high schools in South Africa. The seven schools, funded
by an external agency are located in the provinces of Gauteng, Kwa-Zulu Natal, Western Cape
and Limpopo. These schools specifically recruit learners from deprived homes and schooling
backgrounds and focus on three subjects: Mathematics, Science and English Language.
Measures were required to compare the schools, standardise academic performance across
schools, in addition to finding mechanisms to improve individual schools through interventions
and additional assistance. The schools and funding agency sought a way to monitor learning
progress and put accountability measures in place. The funding agency tasked the Centre for
Evaluation and Assessment (CEA), based in the Faculty of Education, University of Pretoria,
with the design of assessments to monitor academic achievement across the independent
schools. In total, more than three thousand (3 697) high school learners from Grades 8 to 11,
aged 13 to 18 years old, participated in the monitoring project which ran from 2012 to 2014.
Specially designed assessment instruments for the three subjects, Mathematics, Science and
English language, were used to assess the learners. Subject specialists developed the
assessments which were piloted, refined and updated each year to ensure curriculum alignment.
The instruments were analysed using Rasch models to refine items and improve measurement.
The articles report on the practical measurement challenges which arose during the
implementation of the project and each article explores one (or more) methodological
problem(s). The research methodology chosen was deemed appropriate to address the problem
at hand.
1.1.1 Ethical clearance
Ethical clearance was obtained from the Faculty of Education for the study (see Appendix B).
The study was conducted according to ethical guidelines as set out by the University. As the
articles included in this thesis utilised secondary data from the project, the funding agency
consented to the use of the data sets for further research and scientific publications (see
Appendix C). Use of data emanating from the assessments for research purposes required
learner and parental permission (see Appendix D).
©University of Pretoria 4
1.1.2 Problem statement and rationale
The South African education system has undergone many changes since the 1994 political
transformation (Aron, Kahn & Kingdon, 2009; Fleisch, 2008; Jansen, 1998; Lemmer, Van Wyk
& Berkhout, 2010). Several reforms aimed at ensuring quality education for all have taken
place (Bloch, 2008; Carter, 2012; Lemmer et al., 2010). The first reform in 1997 involved the
introduction of a new national curriculum (Davenport & Saunders, 2000; Valero & Skovsmose,
2002). In 2001, a revision was applied to cement the gaps in the curriculum (Valero &
Skovsmose, 2002) and resulted in the Revised National Curriculum Statements Grade R-9 and
the National Curriculum Statement Grades 10-12 in 2002. Further reviews and revisions to the
curriculum occurred during 2009 and 2011 as content disparities still existed in subject
curricula (Bansilal, 2011; Maistry, 2012). The most recent revision resulted in the National
Curriculum Statement (NCS) for Grades R to 12 which incorporate the Curriculum and
Assessment Policy Statement (CAPS) (DBE, 2012). This last round of curriculum revision was
gradually implemented from 2012 onwards (DBE, 2012). The NCS builds on the previous
curriculum but also includes updates in order to provide a clearer specification of what should
be taught in all approved subjects (DBE, 2012). The NCS includes the National policy
pertaining to the programme and promotion requirements of the NCS Grades R-12 and the
National Protocol for Assessment Grades R-12. The far-reaching changes in the curriculum
have meant that monitoring the impact of various phases has become all the more critical
(Davids, 2017; Jansen, 1998), particularly as it has been reported that the newest version of
CAPS (2012) may be a congested curriculum, straining teacher time and resources (Care &
Kim, 2017).
In a system facing many political and social issues and that is constantly changing, the
monitoring of academic achievement becomes all the more crucial. Indeed, monitoring the
quality of education should be developed to help achieve the goals of any education system, in
order to assess changes, adjust curricula and policy as well to devise interventions (Archer,
2011; Scherman & Smit, 2017). In South Africa, monitoring of academic achievement does
take place, in the form of national assessments such as the Grade 12 National Senior Certificate
(NSC) and international studies such as the Progress in International Reading Literacy Study
(PIRLS) and the Trends in Mathematics and Science Study (TIMSS) (Visser, Juan & Feza,
2015). For some time, Annual National Assessments (ANAs) were also conducted and
monitored academic achievement in each grade of the South African school population (Kanjee
©University of Pretoria 5
& Moloi, 2016). Studies such as TIMSS, PIRLS and the Southern and Eastern African
Consortium for Monitoring Educational Quality (SACMEQ) only take place at four, five and
six year intervals respectively (Australian Council for Educational Research, 2015; DBE, 2017;
Howie et al., 2012; Stephens, Warren & Harner, 2015). The overarching study described in this
thesis, developed monitoring instruments due to the unavailability of standardised assessments
for monitoring academic achievement in South African schools. The articles comprising
Chapters 5 to 7 developed out of measurement challenges experienced during the
implementation of the monitoring project.
When data were missing for only one school on the anchor items in the Grade 8 Science
assessment, the missing data were classified as Missing Not At Random (MNAR). Due to the
nature of the missing data, finding models which could impute the values was challenging.
MNAR models have been devised, namely shared parameter models, pattern mixture models
and selection models (Enders, 2010; Resseguier, Giorgi & Paoletti, 2011; Yuan & Little, 2009);
however, both pattern mixture models and selection models have many restrictions and
limitations (Enders, 2010). The possibility of devising a new model was explored, but
abandoned in favour of Multiple Imputation (MI) combined with Structural Equation
Modelling (SEM). Using existing methods rather than developing a new method was
recommended by journal reviewers (when the article was submitted to a journal for review).
The combination of MI and SEM with Rasch scores as predictors was chosen due to the
strength of this design as the missingness can be modelled by SEM with MI being applied for
the imputation (Gottfredson, Sterba & Jackson, 2017). The missing data article (in Chapter 5)
addresses the issue of how to deal with MNAR dichotomous data using a combination of
methods, an area that currently has limited literature and applications (Zhang & Wang, 2013).
The Rasch model played an important role by providing more stable, accurate predictors for
the MI model. Exploring hybrid models such as was used in Article 1 (see Chapter 5) is
recommended for strengthening methods of handling missing data (Aste, Boninsegna, Freno
& Trentin, 2015).
Linked to the importance of monitoring within the South African educational system is the
critical issue of monitoring learning progression across years (Mok, McInerney, Zhu &Or,
2015; Scherman et al., 2017). In order to gain a holistic and accurate picture of academic
achievement in schools, monitoring and systemic evaluations should link assessments through
common items (Howard, 2008; Linacre, 2016; Wang, Kohli & Henn, 2016). Evaluating the
©University of Pretoria 6
functioning of the common (anchor) items is a key issue related to the accuracy of growth
models and monitoring learning progression (Bruin, Dunlosky & Cavalcanti, 2017). In
addition, pre-test post-test results have challenges of comparability as the learners are expected
to change over time (Wright, 1996, 2003). Article 2 (see Chapter 6) demonstrates a hybrid
approach to deal with the challenges found in literature and in the monitoring study by
combining Rasch statistics with parametric and non-parametric tests. The multi-disciplinary
approach was thus designed to strengthen the methodology (Schnotz, 2016).
The last issue was one of dissemination and impact. Literature reveals that when monitoring
results are reported in an interactive and accessible manner, the impact of the findings can be
enhanced (Annual Review of Applied Linguistics, 2009; Archer, 2011; Popham, 2014). The
challenge faced in the third article (see Chapter 7) was how to report assessment results so that
all stakeholders could derive maximum impact, via criterion-referenced feedback (Meyer,
Doromal, Wei & Zhu, 2017). The assessments were designed to evaluate curriculum
knowledge and benchmark schools based on findings but not designed to be diagnostic,
formative or to provide criterion-referenced results (Popham, 2014). Despite the limitation of
test design, Rasch item maps and subject specialist inputs were used to derive diagnostic type
feedback, which could then be converted into descriptive reports. The problem of multi-
purposing assessments was addressed by this article (Lok, McNaught & Young, 2016;
Horodezky & Labercane, 2016). Important to note is that monitoring of academic achievement
is time consuming and expensive; it therefore becomes both an issue of ethical responsibility
and scientific rigour to make use of the results to enhance the system and benefit the most
important stakeholder: the learner (Roach & Frank, 2007; Ungerleider, 2003).
1.1.3 Research questions
The development of instruments that yield reliable and valid inferences, identifying cut scores,
dealing with missing data as well tracking individuals across years to explore the impact of
interventions, are vital issues in psychology as well as education. The project described in
Section 1.1 deals with several measurement challenges which formed the basis for the
overarching research question as well as the sub-questions addressed in each article.
©University of Pretoria 7
The main research question of this thesis is:
How does the application of Rasch models address measurement problems in
the processing, analysis and reporting of educational monitoring results?
Each article had its own research questions, which provided answers for the main research
question. The first article’s research questions focused on how to create a hybrid approach to
impute missing values. The question asked was: How can Missing Not At Random (MNAR)
data be imputed (MI) by modelling the missingness? The research questions for the missing
data article also included identifying a model for imputation, validating the model and
evaluating whether Rasch scores could be used as predictors.
The main research question in the second article was concerned with the evaluation of common
items and their accuracy for tracking learning progression. The article’s main question asked:
To what extent does each anchor item contribute to tracking/monitoring progression? Article
2 incorporated a research question about how to apply the Rasch model to reframe results and
how this would affect the reporting.
The final article about competency bands posed questions about how to combine quantitative
(Rasch item maps) and qualitative (subject specialist evaluations and descriptions) methods to
report results in a criterion-referenced framework. The question was stated as: How can
information from Rasch Item Maps and Subject Specialists be combined and applied to
establish and define learning progression levels? This article also included a research question
about the alignment of competency bands to the curriculum.
The articles, comprising Chapter 5, Chapter 6 and Chapter 7, answer the sub-research questions
and in turn, answer the main research question. Chapter 8 draws the findings together and
examines the big picture and offers recommendations emanating from the findings.
1.1.4 Research methodology
The broad study, from which the articles emanated, was underpinned by methodology based
on the sound and scientific development of instruments in social science contexts: Rasch
Measurement Theory (RMT). Rasch measurement is a philosophy within itself, one of
©University of Pretoria 8
measurement as an established paradigm on which to base the development and evaluation of
instruments. The methodology entailed items being developed according to psychometric
principles (Bond & Fox, 2015) so that:
the constructs were operationalised using the South African school curricula;
the range of the scale was planned (from easier to more difficult items and topics);
the dimensions (subject areas) were weighted;
the item types (multiple choice and constructed response) were weighted according to
dimensions and cognitive levels;
the items were developed by teams of subject specialists, including the development of
common items between years;
the items were reviewed and refined by subject specialists (qualitative evaluation);
the items were piloted and Rasch statistics used to evaluate overall and item specific
functioning; and
the items were refined based on piloting results and updated yearly, based on curricula
requirements and item analysis.
The methodology employed in the individual articles was statistical in nature, with the
application of Rasch models, parametric and non-parametric statistics. The articles were based
on Rasch analyses of the existing data sets. Article 1’s methodology centred on the imputation
of missing data. The article applied multiple imputation (MI) and Bayesian methods via
Structural Equation (SEM) modelling and the application of the Rasch Dichotomous Model as
the methodology for imputing missing values (see Chapter 5).
In Article 2, parametric statistics (paired t-tests), non-parametric statistics (Wilcoxon’s
Matched Pairs Signed-Rank Test, Gamma associations) and the Rasch Partial Credit Model
were applied in a mixture approach. The combinations of the parametric, non-parametric and
Rasch statistics were used as the methods to assess item changes over time and to reframe
results for tracking learning progression (see Chapter 6).
Article 3 used a mixed methodology by combining quantitative techniques (the Rasch model)
and qualitative techniques (descriptions and inputs of subject specialists). Note that Rasch
Measurement Theory requires qualitative input by subject specialists. The Rasch Partial Credit
©University of Pretoria 9
model was used to analyse the data and identify proficiency bands of items in subjects while
subject specialists reviewed grouping of items to generate criterion-referenced feedback for
stakeholders (see Chapter 7).
1.1.5 Current thesis as meta-science study
Mouton (2001) defined a three-world framework: the first is the real world of everyday
problems; the second is the world of science wherein exploration, description and
experimentation take place. The last is the world of meta-science in which lies the philosophy
of science, paradigms, methodology, ethics and the history of science (Vosloo, 2014).
Theoretically, the second world of science should transform the first world through
conceptualisation and action. The third world is where scientists reflect on the integration of
the first and second world and on how underlying philosophies and methodologies influence
the scientific study of the first world.
The world of meta-science, whether examined or ignored, has a pervasive influence on the
second world of scientific study. The studies described in this thesis can be classified as being
meta-science, belonging to the third world as described in Mouton’s framework (Mouton,
2001). Statistical models such as the Rasch Measurement Theory function at the
methodological and paradigmatic level. Models of statistical analysis inform the applications
of scientific methods at the second world level. While meta-science may seem abstract and far
removed from the first world of everyday living and struggles, this thesis makes the argument
that where meta-science informs the world of science, this changes the first world, the “real”
world. Although the methods and conclusions described in this treatise are classified as meta-
science, they influence the real world and the people who need to benefit from science. In
Chapter 3, the underlying principles of Rasch Measurement from a meta perspective are
described and this chapter also includes the reasons for its practical and real world impact.
1.2 Definition of key terms
Many ideas within this thesis are inter-related and woven together to provide insight into
measurement, monitoring of academic achievement and the application of Rasch models. How
the definitions apply to various aspects of data processing, analysis and dissemination in the
articles is explained in this section by offering definitions from literature in the fields and then
relating those definitions to the current thesis.
©University of Pretoria 10
1.2.1 Measurement in educational contexts
Measurement is known to us intrinsically and like language learnt at a young age, the rules and
principles of measurement are deeply imbedded in the subconscious. When more explicit
definitions are sought, the definitions tend to be concerned with quantities, concatenation,
numbers and intervals. In 1920, Campbell defined measurement as the “process of assigning
numbers to represent quantities” (Campbell, 1920, p.4). This lead to a suspicion that
measurement was not possible in the social sciences, as the assigning of numbers to latent traits
to represent quantities could only be done arbitrarily. The definitions of measurement have
since been expanded, and many of the definitions involve the assigning of numerical values to
objects in an ordered manner (Wu & Adams, 2007). “A measure is a location on a line”, that
is to say a point of attainment on a linear line of progression (Wright & Stone, 1979, p.12). The
process of creating linear lines and locating objects, constructs or individuals along the line is
the process of making measures. Wright and Stone’s (1979) definition goes a step further by
stipulating that the numbers assigned represent a continuous scale and not just a ranking (Wu
& Adams, 2007). This definition also specifies that the numbers are indicative of a continuous
variable and that the distances between the numbers are equal. Linear, continuous, meaningful,
invariant and equal interval scales are the fundamental aspects of measurement for which the
social sciences also strive (Boone, 2016; Cavanagh & Waugh, 2011; Wu & Adams, 2007). In
addition, measurement can be defined as a reduction of uncertainty by observing and
quantifying that which is observed (Hubbard, 2010). By applying Rasch Measurement Theory,
the social sciences are now able to move towards measurement (Bond & Fox, 2015). However,
Hubbard (2010) cautions that measurement could fail if the concept of measurement is not well
understood, the object of measurement is not well defined and the methods of measurement
are not based on scientific principles (that is, concept, object, method). Measurement in this
thesis is defined as operationalising a construct, creating units of measurement for a scale,
ordering the units equally along the scale and testing if the scale adheres to the principles of
measurement. A final step is reflection of the construct, asking: Do the measures make sense
in terms of the construct?
1.2.2 Assessment, testing and instruments
Assessment is a form of measurement, and in the current context it refers to gathering empirical
data about what learners know and can do in subject areas (Archer, 2011; Walford, Tucker &
Viswanathan, 2010). Assessments in classrooms and broader contexts should evaluate how far
©University of Pretoria 11
learners have progressed in the subject, and should be used to inform practice and policy
(Black, 1998). There are multiple ways of assessing the content knowledge and skills of
learners, but the onus lies on the teacher to use a vast repertoire of assessment tools and
strategies, which are aligned to the curriculum and assessment protocols (Hanna & Dettmer,
2004). Both formative and summative assessments provide a more holistic picture of each
learner’s progress throughout the year in a particular subject (Black, 1998; Kanjee & Sayed,
2013). Assessments should have a clear aim or objective, therefore assessing should not be for
the sake of assessing but rather for classroom, school or broader requirements (Black, 1998;
Chappuis, 2009; Corrigan, Gunstone & Jones, 2013). The main reasons for assessment include
supporting learning, reporting on the progress of the learning and accountability for
educational systems (Black, 1998). In the context of this thesis, assessment is defined as tests
designed for specific school subjects and utilised for the monitoring of academic achievement.
The terms ‘test’, ‘assessment’ and ‘instrument’ are used interchangeably throughout this
thesis. A test is an assessment of a skill or knowledge and tests in school environments are
often referred to as assessments. Generally, in social science measurement, the term
‘instrument’ is used to denote any form of psychological or cognitive assessment, test, task or
questionnaire aimed at measuring a construct. The term ‘instrument’ is used in this thesis to
refer to the tests/assessments which were designed for the monitoring study. When
measurement is discussed in a general sense in the thesis, instruments refer to tests,
assessments or questionnaires.
1.2.3 Monitoring of academic achievement
There is a need for high-quality monitoring of academic achievement in national and
international contexts (Scherman, 2007; Smith & Smith, 2004; Tymms, Merrell & Wildy,
2015). In the late 20th century, the focus in education was on access to learning, and this goal
has for the most part been reached in many contexts. Now the focus has shifted to the quality
of learning and education (Scherman, 2007; UNESCO, 2013). The fact that the quality of
learning is lower than is desirable globally is supported by various studies and official reports
(Howie, van Staden, Tshele, Dowse & Zimmerman, 2012; Howie, Combrinck, Roux, Palane,
Tshele & Mokoena, 2017; UNESCO, 2013). Good quality instruments are the foundation of
monitoring academic achievement and assist in gauging the quality of teaching and learning.
Thus, feedback into the system can be provided and this contributes to the improvement of
©University of Pretoria 12
systems (Cotton, 1988; Lokshyna, 2005; Scherman, Bosker & Howie, 2017). Not only do
educational monitoring systems have implications for teaching and learning in a broad school
and community sense, but also have implications on the individual child. The quality of the
measures, the structure and level of the data, the consistency and accuracy of the raters or
scorers as well as the analysis techniques used, all play pivotal roles in monitoring systems
(Scherman et al., 2017). When monitoring systems are used, the inferences derived should be
valid and provide results that can be used to track progression and identify cut points. Results
should inform teaching and learning for maximum benefit (Kanjee & Moloi, 2014; The South
African Qualification Authority, 2005). The current thesis views monitoring of academic
achievement as measurements designed to assess learning progress where the results are used
for both benchmarking and the enhancement of teaching and learning within classrooms and
schools.
1.2.4 Measurement, assessment and psychometrics
Terms such as measurement, psychometrics and assessment are closely related, having the
same general meaning but with different nuances (Andrich, 2001). Used in diverse contexts,
the terms could take on various aspects of their meanings. In the current thesis, measuring and
assessment are treated as being approximately equivalent, both being the quantification of
latent traits through the use of instruments such as tests and questionnaires. Psychometrics has
traditionally been defined as the measurement of psychological qualities (Kaplan & Saccuzzo,
2010). Abilities such mathematics and language skills could be seen as cognitive constructs,
and could therefore be defined as psychological constructs. Due to the broad nature of
psychology, the field of psychometrics could thus be applied to many related disciplines such
as education. The current study defines psychometrics as statistical models utilised to inform
the design of social science instruments such as questionnaires, tests, assessments and
checklists.
1.3 Structure of thesis
The remaining thesis chapters are introduced below with a description of each chapter, as well
as an indication of the articles reported on in the three chapters (Chapters 5 - 7).
©University of Pretoria 13
Chapter 2: The educational landscape and monitoring
Chapter 2 situates the meta-science study within the real world context by examining the
educational landscape as well as assessment and monitoring in the South African context. The
chapter also investigates and highlights the role of monitoring academic achievement through
the utilisation of assessment instruments. The chapter includes sections on school types, what
assessment in the South African context entails and the monitoring of education in a multi-
cultural environment.
Chapter 3: Methodological and theoretical approaches of thesis
In the third chapter, the ontological point of departure is explained. The chief methodology,
Rasch Measurement Theory (RMT), is explained in more detail by examining the principles
underlying the method. The application of Rasch models is described via its statistics and
interpretation. This chapter includes a section on the Rasch model, explaining its statistical
structure for both the Dichotomous Model and the Partial Credit Model. The chapter draws
together all the elements of the Rasch models in the conceptual framework, which not only
underpins all three studies (articles), but was also the basis for the overarching project.
Chapter 4: The monitoring project’s methodology
Chapter 4 describes the monitoring study whose results formed the basis for the analyses
reported in the articles. While each article focuses on a different aspect of the monitoring
project (different school subjects, year of participation, facet of project), this chapter describes
the study as a whole, which ran from 2012 to 2014 and incorporated Grades 8 to 11 for all three
years. Descriptions are given of the sample sizes per year and per school, how the assessments
were designed and administered as well as how the results were analysed and utilised for the
monitoring study as a whole.
Chapter 5: Multiple imputation for dichotomous MNAR items using a recursive
structural equation model with Rasch measures as predictors (Article 1)
In Chapter 5, the first article reported on how to deal with missing data, more specifically
Missing Not At Random (MNAR) data when combined with Missing Completely at Random
Data (MCAR) for dichotomous test items. Common items, which linked the tests from one
year to another, were missing for the Grade 8 Science test at one of the seven schools. The
common items, or anchor items, were required for tracking learning and equating. A potential
solution, Multiple Imputation (MI) was identified for use. However, MI has the assumption of
©University of Pretoria 14
data being missing at random and in order to correctly impute the missing data, a model had to
be built, which took into account the pattern of missingness and had strong predictors. IBM
Amos was used to model the missingness with a recursive structural equation model (SEM),
and, in addition, Rasch person measures were used as the predictors. SPSS was used for the
final imputation as it offers the use of a logistic regression imputation, as the items were
dichotomous. Diagnostic checks showed that the differences between the types of missing data
(MNAR and MCAR) as well as performance differences between schools had been maintained.
This is where the Rasch measures were very useful as they contained the pattern of
performance, which could be used to predict the missing data.
Chapter 6: Evaluating anchor items and reframing assessment results through practical
application of the Rasch measurement model (Article 2)
The second study, reported on in this chapter, examined the quality of anchor items for tracking
learning progression. The Rasch Partial Credit Model and non-parametric statistics were used
to evaluate the common items between the English Language Grades 8 and 9 tests. This led to
identifying items that did not contribute to monitoring progression over the years. The items
were refined, or in the case of two items, removed (see Appendix E). The Rasch model was
further used to place the results on the same scale so that progression could be more accurately
identified and reported.
Chapter 7: The use of Rasch competency bands for reporting criterion-referenced
feedback and curriculum-standards attainment (Article 3)
The final study in Chapter 7 is an exemplar of how the Rasch Person Item Map method can be
used to craft criterion-referenced feedback for all the stakeholders. The Grades 8 to 11
monitoring assessments for English Language, Mathematics and Natural Science monitoring
assessments were analysed using the Rasch Partial Credit Model (N=1113). Cut-scores were
identified on the item maps, and subject specialists evaluated the items in each band. The
subject specialists created descriptions of knowledge and skills represented by each level.
Reports were set-up so that a child, the teacher and parents could read a description of what
skills had been gained in a subject area, as well as the next skill level to be attained. This study
shows that the Rasch Person Item Map Method can be used to align assessments and curriculum
standards and report learner results regarding criterion-referenced feedback.
©University of Pretoria 15
Chapter 8: Discussion and conclusions
The last chapter broadly discusses the findings emerging from each of the studies, as well as
the conclusions and recommendations which can be drawn from this thesis overall. Reflections
on the methodology, research questions and conceptual framework are presented in Chapter 8.
The chapter also discusses the limitations and recommendations of the study.
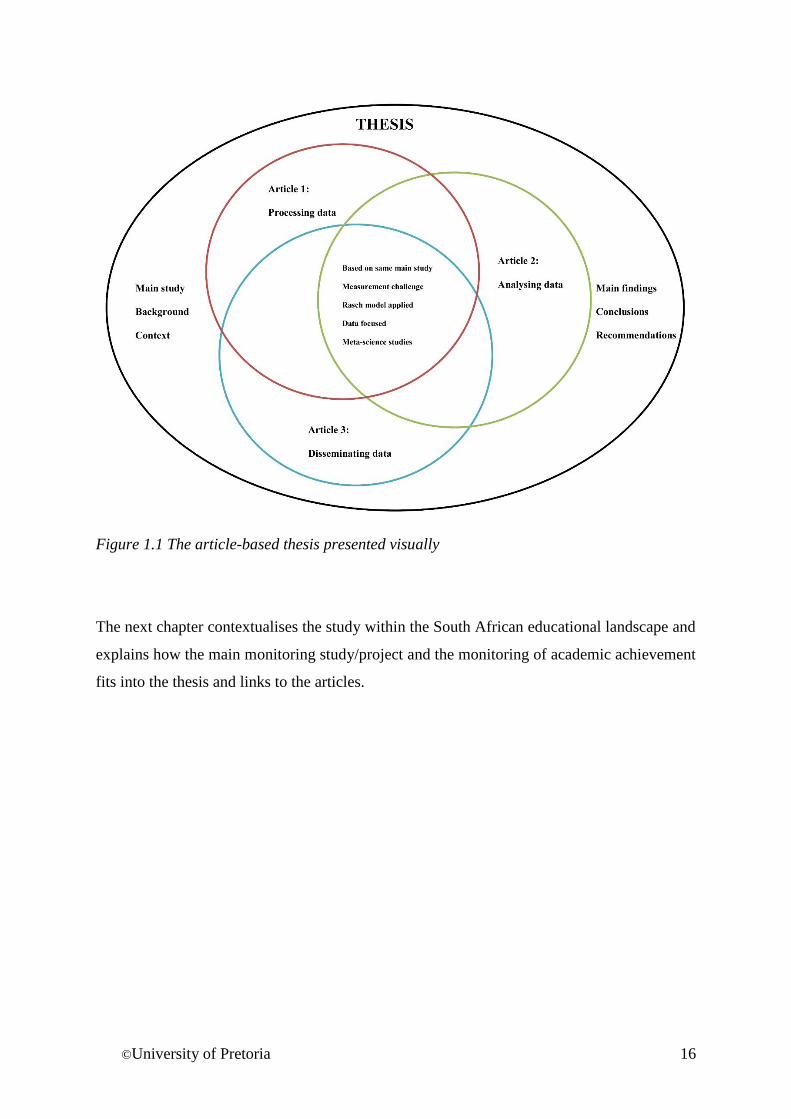
1.4 Conclusion: The article-based thesis as a story
This thesis is article based, but the articles do not stand alone. The articles are contextualised
within the South African school milieu and are based on the same main monitoring study. The
thesis is a story within a story, smaller stories (articles) in the overarching story of measurement
and monitoring of scholastic achievement.
Figure 1.1 displays the structure of the thesis visually. Each article is a step in dealing with the
data from the main monitoring study/project. Article 1 is concerned with processing the data,
whereas Article 2 focuses on analysis of the data. The last article is concerned with how to
disseminate the findings in an impactful and content-based manner. The three articles, based
on the same study, share important aspects and deal with measurement challenges, applying
the Rasch model to meet the measurement challenges, are data focused and fall into the meta-
science category. This thesis as a whole presents the main study and its background
methodology; it also discusses the context of independent high schools in the complex South
African educational system, and finally the thesis draws together the overall findings from the
studies and their implications as well as the conclusions and recommendations emerging
overall.
©University of Pretoria 16
Figure 1.1 The article-based thesis presented visually
The next chapter contextualises the study within the South African educational landscape and
explains how the main monitoring study/project and the monitoring of academic achievement
fits into the thesis and links to the articles.
©University of Pretoria 17
Chapter 2 - The Educational Landscape and Monitoring
The function of education is to teach one to think intensively and to think critically.
Intelligence plus character - that is the goal of true education (King, 1947).
2.1 Introduction
The importance of education as the producer and enabler of future workers, stable economies
and fostering human development is undeniable, making universal access to schooling and
improved quality thereof global and national goals, as stipulated in the United Nations’
Millennium Development Goals (Gyimah-Brempong 2011; Nworgu & Nworgu, 2013; Tikly
& Barrett, 2013; Stijns, 2012). Developing nations face greater challenges in terms of access
to education for all as well as quality of educational systems, especially those with children
living in severe poverty (Tikly & Barrett, 2013; UNESCO, 2015). Being a developing country
and subject to large political fluctuations, South Africa’s education system faces immense
challenges associated with recent and continuing changes.
The Research on Socio-Economic Policy report (RESEP) on the binding constraints in
education emphasises the main reasons the educational system in South Africa maintains its
current problems (van der Berg, Spaull, Wills, Gustafsson & Kotzé, 2016). The RESEP report
identifies weak institutional functionality, undue union influence, weak teacher content
knowledge and pedagogical skills and wasted learning time as the main constraints (van der
Berg et al., 2016). The constraints lead to weak educational outcomes and affect academic
achievement (van der Berg et al., 2016). The current chapter and thesis makes the argument
that unless a system is monitored regularly and accurately, improvements or declines will not
be tracked and, as such, addressing binding constraints will be hindered (UNESCO, 2015).
Specifically, the significance of assessments and monitoring academic achievement is
discussed as a key part of understanding educational development and tracking learning
progression over time. The findings of the RESEP report give a broad indication of the
challenges faced in South Africa to ensure the quality of our educational system. The quality
of an educational system could be defined in many ways, including the well-being of the
learners, the physical and pedagogical teaching and resources, the broader community and
home environment as well as the structure of the educational system and the curriculum

©University of Pretoria 18
(UNICEF, 2000; Tikly & Barrett, 2013). The current thesis is principally concerned with the
quality of key subjects taught in high schools and how to monitor academic achievement.
2.2 Education in South Africa
The South African school system is governed in general by the Department of Basic Education
(DBE). However, each of the nine provinces in South Africa administers its own education
department, with the DBE playing an overall governing function (Davies & the Centre for
Education Law and Education Policy, 2008). The system is comprised of the General Education
and Training (GET) phase which incorporates Grades R-9, and the Further Education and
Training (FET) which includes Grades 10-12 (DBE, 2017b). The sample for this study included
Grades 8 to 11, which means it was conducted within both the GET and FET phases. The South
African education system includes approximately 12 million learners in 30 500 schools (DBE,
2014), in both public (97%) and independent schools (3%). Both the public schools and the
independent schools could be fee-paying or non-fee-paying (RSA, 1996).
2.2.1 Public versus independent schools in South Africa
In accordance with the South African Schools Act (SASA) of 1996 (No 84), two types of
schools are recognised, namely public (ordinary) and independent schools (RSA, 1996). Public
schools receive government funding, whereas independent schools source their own funding,
whether this be from school fees or other sources. Independent schools may receive state
subsidies, though such subsidies are not guaranteed. The right to establish independent schools
is in accordance with the Constitution of South Africa (Section 29), which states that
individuals have the right to establish independent educational institutions at their own expense
(RSA, 1996). Independent educational institutions must be registered with the educational
department, maintain standards comparable to public schools, conform to governmental
conditions and may not discriminate on the basis of race or gender. All seven schools
participating in the monitoring project were independent schools. The schools in the current
study were located in the provinces of Gauteng (3 schools), Limpopo (2 schools), Kwa-Zulu
Natal (1 school) and the Western Cape (2 schools). All seven schools were located in
impoverished townships areas.

©University of Pretoria 19
2.2.2 Fee paying schools versus non fee paying
School fees for both public and independent schools are based on a resolution reached with the
governing body: parents must agree to pay school fees (RSA, 1996). If the majority of parents
adopt the resolution to pay school fees, the governing body can pursue legal action when fees
are not paid. More affluent schools source a larger portion of their funds from the community
(parents), whereas schools in more impoverished areas should receive larger portions of
government funding (Dass & Rinquest, 2017). Schools which are classified as ‘non-fee’ paying
were established to give improvised learners access to education, which is in line with the South
African pro-poor model of funding schools (Dass & Rinquest, 2017; Sayed & Motala, 2012).
In addition, schools are classified according to quintiles, and schools in the lower quintiles
from one to three do not pay school fees. The quintile system classifies schools according to a
poverty index, and lower quintile schools are located in improvised areas and the schools have
few resources available (Dass & Rinquest, 2017). Independent schools are not classified
according to the quintile system; consequently, the schools in the main study in this thesis do
not have a quintile allocation of funds. Out of the seven schools in the current study, six were
non-fee paying. The seventh school correspond with the traditional model of private schools,
where parents pay relatively large fees, but scholarships and funding is also available for a
limited number of learners.
2.2.3 Curricula in South African schools
The South African school system uses a series of curricula documents known as the National
Curriculum Statement Curriculum and Assessment Policy Statement or CAPS, see Chapter 1
for more details (DBE, 2012). The CAPS documents contain detailed layout of subject areas
to be taught in a given year, term, month or even week (DBE, 2012). The independent schools
who participated in the main study implemented their own curricula. However, their curricula
documents were primarily based on CAPS with some appropriate contextual additions. The
CAPS and coalition school documents were used in combination when designing the
instruments for monitoring.
2.3 Assessment in the South African context
Assessment in the South African school context has two purposes: to support teaching and
learning and to inform the learners, schools, guardians, education departments and society of
the progress that learners are making in a given subject (Black, 1997; DBE, 2012; Kanjee &
©University of Pretoria 20
Sayed, 2013). Formative assessment is designed to support teaching and learning, and could
also be termed assessment for learning and as learning (Bennett, 2010, 2011). Summative
assessment is used to inform stakeholders about learner progress, and can be classified as
assessment of learning (Bennett, 2010, 2011; Sambell, McDowell & Montgomery, 2013). Both
types of assessment have an important contribution to make, and can be reported in terms of
criterion-referencing and norm-referencing (Kanjee & Sayed, 2013; Mays, Criticos, Gultig,
Stielau & South African Institute for Distance Education, 2009). Criterion-referencing is more
in line with the philosophy of Rasch theory, which is to define and report developmental
pathways and focus on the individual (Long, 2015). Examples of summative assessment
include not only tests and examinations but also projects, presentations, demonstrations,
performances and practical demonstrations (DBE, 2012).
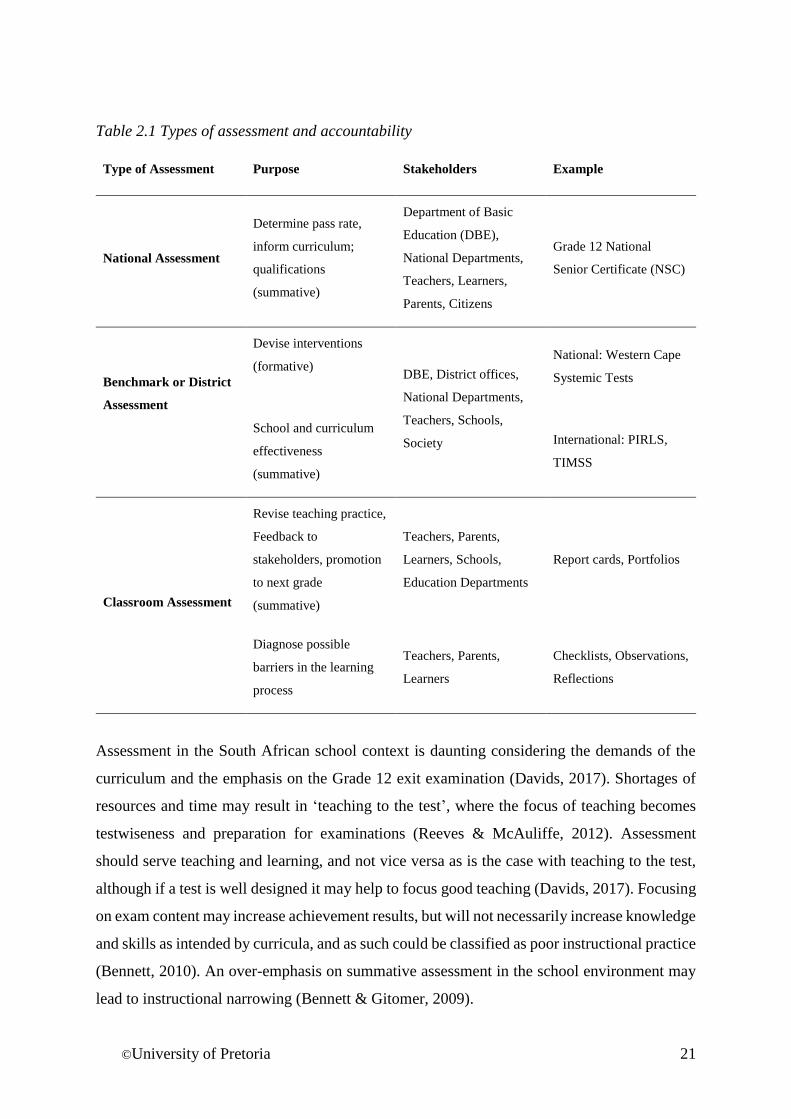
To illustrate assessment in the South African context, Table 2.1 depicts various types of
assessment currently in use (Chappuis, 2009; Kanjee & Sayed, 2013; Long & de Kock, 2014;
Palane, 2014; Roux, 2014). Table 2.1 shows that national assessments, such as the National
Senior Certificate (NSC) at Grade 12 level, are used to set pass rates and promote learners as
well as give access to tertiary education. Similarly, classroom assessments (school
examinations which are summative) can also be used as formative assessments. Benchmark or
district assessments, designed for formative goals such as designing interventions, also
benchmark school, district and provincial performance (Roux, 2014). An example of a
benchmark assessment is the Western Cape Systemic Assessments. In the case of international
studies, such as the PIRLS, the results are used to monitor academic achievement and compare
South African assessment results with other participating countries (Mullis, Martin, Foy &
Drucker, 2012).
The assessments used in South African schools serve a multitude of stakeholders, including
education departments such as the Department of Basic Education (DBE). Parents or guardians
are also stakeholders, and the learners themselves attach assorted meanings to the various types
of assessments (which influences motivation). Teachers in turn use the assessment results from
national assessments, benchmark assessments and classroom assessments to inform their
teaching and to address gaps in learner understanding (Kanjee & Sayed, 2013; Roux, 2014).
Principals also pay attention to assessment results as this gives them indications of teacher
effectiveness as well as school functioning when compared to other schools, districts and
provinces (Reynolds, Livingston & Willson, 2010).
©University of Pretoria 21
Table 2.1 Types of assessment and accountability
Type of Assessment Purpose Stakeholders Example
National Assessment
Determine pass rate,
inform curriculum;
qualifications
(summative)
Department of Basic
Education (DBE),
National Departments,
Teachers, Learners,
Parents, Citizens
Grade 12 National
Senior Certificate (NSC)
Benchmark or District
Assessment
Devise interventions
(formative)
School and curriculum
effectiveness
(summative)
DBE, District offices,
National Departments,
Teachers, Schools,
Society
National: Western Cape
Systemic Tests
International: PIRLS,
TIMSS
Classroom Assessment
Revise teaching practice,
Feedback to
stakeholders, promotion
to next grade
(summative)
Teachers, Parents,
Learners, Schools,
Education Departments
Report cards, Portfolios
Diagnose possible
barriers in the learning
process
Teachers, Parents,
Learners
Checklists, Observations,
Reflections
Assessment in the South African school context is daunting considering the demands of the
curriculum and the emphasis on the Grade 12 exit examination (Davids, 2017). Shortages of
resources and time may result in ‘teaching to the test’, where the focus of teaching becomes
testwiseness and preparation for examinations (Reeves & McAuliffe, 2012). Assessment
should serve teaching and learning, and not vice versa as is the case with teaching to the test,
although if a test is well designed it may help to focus good teaching (Davids, 2017). Focusing
on exam content may increase achievement results, but will not necessarily increase knowledge
and skills as intended by curricula, and as such could be classified as poor instructional practice
(Bennett, 2010). An over-emphasis on summative assessment in the school environment may
lead to instructional narrowing (Bennett & Gitomer, 2009).
©University of Pretoria 22
Archer (2011) argues that the monitoring of academic achievement should be used to feed into
learning and teaching in the school environment. She contends that the impact of monitoring
can be enhanced by increasing data literacy and providing practical information that teachers
and schools could and should use for action and decision-making (Archer, 2011). When the
monitoring of achievement takes place with the goals of accountability and enhancement of
teaching and learning, it serves as a powerful agent of change (Archer, 2011; Scherman, 2007).
While an over-emphasis on assessment for the monitoring of academic achievement could have
negative effects (teaching to the test), these can be negated by using assessment results to
inform stakeholders, and this includes the learners themselves (Lamanauskas, 2012).
2.4 Academic achievement, assessment and monitoring
Globally, more emphasis is being placed on early childhood development, investing in schools
and learners, supporting transitions beyond initial education, equality and equity of
opportunities and lifelong learning (OECD, 2013). Assessment and monitoring of academic
achievement is key to understanding how the goal of enhancing different aspects of learning is
being achieved and of finding ways to address disparities (Aron et al., 2008; Fleisch, 2008). In
the multi-lingual context of South Africa, monitoring academic achievement in all the eleven
official languages is crucial to understanding how well languages are being supported and
implemented (Makgamatha, Heugh, Prinsloo & Winnaar, 2013; Moodley, 2014).
Traditionally, classroom assessments such as class tests, school examinations and the national
matriculation examinations have been utilised to inform teaching and promote learners to the
next levels of education, including tertiary education (Kanjee & Sayed, 2013). However, during
informal (assessment for learning) and formal (assessment of learning) assessment, the teacher
has the responsibility of clarifying for learners what is expected from them (Roux, 2014).
Various types of assessments inform teachers and identify learners requiring additional
assistance in mastering a specific topic and/or informing the school to what degree learners are
on par with the aims of the national curriculum (Bansilal, 2011; Kanjee & Sayed, 2013).
Assessments serve as the method of measurement, the manner in which information is
collected, analysed and interpreted in order to track each learner’s progress throughout the
academic year (Bansilal, 2011). The various types of assessments support and influence
distinct aspects of classroom learning, grade-level promotion, end of school promotions,
benchmarking, policies and broader educational goals (Kanjee & Sayed, 2013).
©University of Pretoria 23
The aim of the study reported in this thesis was to set up a system that monitored academic
achievement. Monitoring the academic achievement of the schools was designed to serve both
as a comparative tool within the system of independent schools, and as feedback for assessment
for learning. Assessment for learning is aimed at enabling teachers and learners to understand
and achieve goals, to provide constructive feedback as well as to encourage learners to take
responsibility of their own learning (Bennett, 2010).
Hattie (2009) conducted a meta-analysis is of more than 52637 studies to identify which factors
are the best predictors of academic achievement. Hattie (2009) used effect size as the key
indicator, with an effect size of 1 indicating that a particular approach to teaching or technique
advanced the learning of the pupils in the study by one standard deviation above the mean.
Interestingly, such strong effect sizes were only found in less than 75 of the 52637 studies in
Hattie’s meta-analysis, the variable most likely to enhance learner achievement was feedback.
The older the learners were, the more cognitive feedback mattered (Hattie, 2009). There is also
a reinforcement component of feedback which helps to shape behaviour, but cognitive
feedback should have explicit information, which helps the learner correct errors and refine the
performance. Assessment is one of the pivotal ways in which teachers can give constructive
feedback in terms of learner progress, as well as areas that require attention and further study.
Good quality assessments and feedback based on the results can play a crucial role in the
academic development of the learner (Kanyee & Sayed, 2013). In summary, the monitoring of
academic achievement informs stakeholders of the progress being made in learning, but can
also be used as feedback within the system as was done with the study reported in this thesis.
2.5 Conclusions
Measuring educational and achievement outcomes leads to understanding, interventions and
change (Lamanauskas, 2012). Without assessment and monitoring, improvement of the South
African educational landscape becomes less likely and less identifiable. Assessment and the
monitoring of academic achievement is pivotal to countering the binding constraints faced in
the educational system. Strengthening the role and application of assessments, both in the
classroom and for broader monitoring of achievement, could enhance the education system. A
positive impact on learning for school children, teaching and learning for teachers and
principals is a potential outcome of improved assessment. High quality assessment for feeding
©University of Pretoria 24
into the development of curricula and policy should also be considered. Feedback, through
assessment of and assessment for learning may reinforce learning pathways and development.
The monitoring of academic achievement can play the dual role of accountability and the
development of a feedback system. Monitoring the changes taking place is key for improving
the educational landscape.
The main study/project, described in Chapters 1 and 4, led to the development of sub-projects
based on questions which arose during the research. The outcome of the sub-projects led to the
publication or acceptance for publication of the articles and were transformed into chapters (5,
6 & 7). The chief methodology employed in the sub-projects, a psychometric theory known as
Rasch modelling is discussed in the next chapter. Psychometric theory can play an important
role in monitoring academic achievement in the South African educational system. Applying
the Rasch Partial Credit and Dichotomous Models presents the opportunity to refine and elevate
the quality of monitoring assessments. In any monitoring system, high quality instruments are
essential to provide precise feedback and indications of improvements or areas where
challenges should be addressed. Connected to the monitoring of the South African education
system is the need to improve monitoring assessments. Chapter 3 explores how psychometric
theory can be applied to assessments and social science instruments generally.
©University of Pretoria 25
Chapter 3 - Methodological and Theoretical Approaches
Experience is tangible. But it needs ideas to become useful. Raw experience is chaotic.
Guidelines are necessary to organize perceptions of reality, to make them recognizable,
and to make some sense of them (Wright & Stone, 2003, p. 912).
3.1 Introduction: Ontological point of departure
The studies described in this thesis are based on the ontology of scientific realism, a view that
the world is knowable and that science is the best method for accessing reality (Putnam, 1962).
Scientific realism fits well with the statistical models that were used to solve the practical
measurement problems: The Rasch family of models. The Rasch models extract the principles
of measurement from the natural sciences and hold measurement in the social sciences to the
same standards (Bond & Fox, 2015; Boone, Staver & Yale, 2014; Long, 2011). If psychology
can be defined as the science of mental and behavioural processes, then the measurement of
those processes should be scientific and conform to the principles of measurement (Holmes,
2005). This chapter describes those principles as well as the Rasch models and their
interpretation. The articles (reported in Chapters 5 to 7) provide prototypes of practical
applications and recommendations for making measurement scientifically and statistically
valid in the social sciences.
3.2 The principles of measurement
By examining the principles of measurement, what it means to measure is operationalised.
Measures should be equally ordered, additive and meaningful approximations of the construct
under consideration (Engelhard, 2013; Massof, 2011; Wilson, 2005). Easy items should be
answered correctly by those who correctly answered the more difficult items. Likewise,
difficult items would not be answered correctly by those who failed the easier items. Known
as the Guttman pattern, the ordering of items and persons in this perfectly structured way is an
ideal that is rarely, if ever, found. It is an important structure in Rasch theorising (Cavanagh &
Waugh, 2011; Engelhard, 2013). Rasch models are based on the probability of success on an
item and assume that the Guttman pattern will not appear and, if it did, it would be an indication
of extreme overfit (Linacre, 2013; Wright, 1977). Science views anything that can be observed,
©University of Pretoria 26
either directly or indirectly, as measurable (Hubbard, 2010). The measurable observations are
a crucial way of distinguishing pseudoscience from real science, finding obvious consequences
for the construct, phenomenon or claim (Tal, 2017). That which cannot be measured has no
claim to scientific reality. If it is real, it can be observed and detected and done so in quantifiable
amounts (Hubbard, 2010). Measuring in the social sciences is more challenging as constructs
are mostly latent, but it is still possible to do so by applying the principles of measurement
described in this section.
3.2.1 Invariance, reliability & validity
Applying a yard stick to different objects should yield the same ordering and intervals, with
the same scale being used again and again (Moutinho & Hutcheson, 2011). The ordering also
holds for the social sciences: items or questions should measure understanding, memory,
beliefs or attitudes in the same ordered way it measured that of another person. The Rasch
Model seeks to make invariance more attainable by ordering items and persons on one scale.
If the instrument is valid and reliable for a population, it should yield the same ordering of
items when another group from the population answers the questions (Andrich, 2011; Golino
& Gomes, 2016; Linacre, 2016). However, if groups are heterogeneous in terms of languages,
cultures and experiences or any other factors, invariance may be at risk and tests become unfair
(ETS, 2014). When a construct as measured by an instrument is invariant in one population,
more effort may be required to adapt it to another group, then applying the measurement model
to ensure the construct is being measured in the same way becomes all the more paramount (de
Bruin, 2011). Invariance means that item order remains constant (Smith & Suh, 2003). A test
may be more difficult for Group B than for Group A, but the item order should be the same for
both groups (Cavanagh & Waugh, 2011; Randall & Engelhard, 2010).
Invariance is closely linked to reliability and validity of inferences and relates to Thorndike’s
requirement that items be free from individual opinion (Linacre, 2000; Thorndike, 1904).
Reliability is the consistency of the measurement; when repeatedly measuring, the results
should be almost identical, barring some small error of measurement (Moutinho & Hutcheson,
2011). Validity is the truthfulness of the instrument for a group, and reveals how appropriate
the inferences are for the given population and construct(s) (Moutinho & Hutcheson, 2011).
Invariance reflects both these concepts. An instrument should measure with consistency but
also yield the same results or concatenation of measures regardless of whom or what is
©University of Pretoria 27
measured. Invariance is closely aligned to the assumption of local independence, discussed
later in this chapter (Andrich, 2001; Curtain, 2007; Smith & Suh, 2003).
3.2.2 Range of scale (targeting)
When the construct assessed is reflected by the measures (items), the measures should also be
sensitive to a range within the construct. Like a ruler that measures a certain length, for
example, 0 to 30 centimetres, the social construct should be measured by the items with an
appropriate and helpful range (Engelhard, 2013). In education, this means having a range of
items that measure from least able to most able within a cohort. In psychology, it means having
items that measure those less likely to endorse statements to those most likely to do so. When
an instrument does not measure those at the lowest or highest end of the scale, floor and ceiling
effects emerge, and the range of the measurement scale may not be broad enough to measure
these individuals (Wilson, 2005). The sensitivity of a measurement is analogous to using a
30cm ruler to measure a rugby field or the width of a hair; in both cases, the sensitivity of the
instrument is not appropriate for the object being measured.
3.2.3 Dimensionality
Strictly unidimensional data do not exist in the empirical world. Even straight lines
have widths as soon as we draw them. So a central question is: How close to
unidimensional is good enough for our purposes? Linacre, 2008, p.1
Unidimensionality is an assumption of the Rasch Model, but constructs can include composite
variables and have more than one dimension or aspect (McCreary, Conrad, Conrad, Scott, Funk
& Dennis, 2013; Linacre, 2016; Massof, 2011). The degree of unidimensional measurement
depends on the precision of the measures to capture a global image or to zoom in on aspects of
the construct (Andrich, 2011; Smith, 2002). An instrument that measures time management
may include component constructs such planning, motivation, prioritising and communication
skills. Including sub-constructs or component variables in a way that builds a clearer picture of
the construct under investigation would lead to a unidimensional construct being measured, for
example, that of time management. Messick (1989, 1996) saw construct under-representation
as a serious threat to validity. Conversely, if there is too much focus on a component, such as
motivation, it may lead to construct-irrelevant variance, and the component may become a
competing construct under consideration (ETS, 2014; Messick, 1996; Randall & Engelhard,
©University of Pretoria 28
2010). While it seems unlikely that a researcher would design an instrument and include
irrelevant questions or items, this could happen in subtle ways, for example, if getting the
answer correct requires not ability but test-wiseness (Baghaei, 2008).
Unidimensionality is always in degrees, and the extent to which the main construct is
represented depends on the focus of the items (Andrich, 2011; Smith, 2002). Too broad an
emphasis on related components and unidimensionality is threatened, while a too narrow focus
could result in construct under-representation. Dimensionality can be assessed with factor
analysis, such as Principal Component Analysis (PCA) (Randall & Engelhard, 2010). Rasch
factor analysis is conducted to test whether any sub-constructs compromise the
unidimensionality principle (Linacre, 2016). The construct under investigation should be the
main explanation for the observed variance.
When various constructs are measured by one instrument and constructs are more independent
than dependent from one another, each construct should be analysed on its own using Rasch
software. Rasch statistics assist in the identification of construct-irrelevant variance (fit
statistics) and construct under-representation (namely the spread of persons to items) (Baghaei,
2008). A lack of invariance, multidimensionality based on groups or populations, can be
identified through differential item functioning (DIF) (Bond, 2003). Measurement requires the
researcher to think deeply about the construct under investigation, to ask questions such as
“What does it mean to have more of this construct? What does it mean to have less?” and “In
what detail do I want to measure this construct? Broadly? In greater detail or focus on an aspect
of the construct?” To measure is to understand what is being measured and to what degree
(Granger, 2008). To measure in the social sciences is to access the construct indirectly, to
measure its influence rather than the thing itself (Andrich, 2011; Wright & Linacre, 1989).
3.2.4 Operationalisation of the construct
What does it mean to have more of or less of the construct? To operationalise a construct is to
define it in practical ways that make measurement possible (Glass & Stanley, 1970). Rasch
statistics also reveal the coherence and coverage of the operationalisation of a construct
(Loubserae et al., 2015). Rasch statistics can be used as a way to assess the construct validity
of an instrument, with implications for how well the construct was operationalised (Bond &
Fox, 2015). Operationalising constructs is a requirement for measurement in the social sciences
©University of Pretoria 29
as the constructs are often latent traits that cannot be directly observed (Julie, Holtman &
Mbekwa, 2011; Peterson, Gischlar & Peterson, 2017; Glass & Stanley, 1970). The definitions
of constructs are continuously evolving. Constructs, whose definitions are continuously
evolving, should be defined within a context and at a particular point of development (Gómez,
Arias, Verdugo, Tassé & Brown, 2015). The operationalisation may also differ for various
population groups. Hubbard (2010) recommends asking those who want to measure something
intangible to try a thought experiment, to imagine that they have to explain to an alien race
what has to measured and why it has to be measured. Lastly, it may be pertinent for social
scientists to ask themselves the question: “Do social constructs exist or are we inventing them?”
(Bond & Fox, 2015). It may be that constructs exist to the degree to which we can define them.
We invent constructs in the same way that we define particular aspects of cognition and
behaviour.
3.2.5 Error of measurement and fit
Error when measuring is a natural and expected phenomenon; no measurement is without error
(Hubbard, 2010). In Classical Test Theory (CTT), all items were treated as having the same
error (Cappelleri, Lundy & Hays, 2014). However, all items are not equal in difficulty; the
easiest and most difficult of items are less accurate and prone to more error. Rasch calculates
each item’s error of measurement independently of other items, the same for persons
(Cavanagh & Waugh, 2011). The Rasch reliability estimates for persons and items are
calculated on an average of error. Use of the logistic distribution to examine item fit is an
advantage of the Rasch models, providing comparable fit indices between items (Törmäkangas,
2011).
3.2.6 Local independence of items
Independence is a key assumption of quantitative research, whether it is the independence of
groups, persons or items, the idea remains that they should not influence one another. If persons
from the control group influence those in the experimental group, bias and confounding
variables are introduced. If persons within either of the groups influence each, the same
problem is presented. Likewise, if individuals are answering a questionnaire or test paper and
influence each other’s answers, the independence of the data is compromised (Field, 2013).
The independence of items falls into the same category; the answers on one question should
not influence the answers on another question. Each item should independently add to the
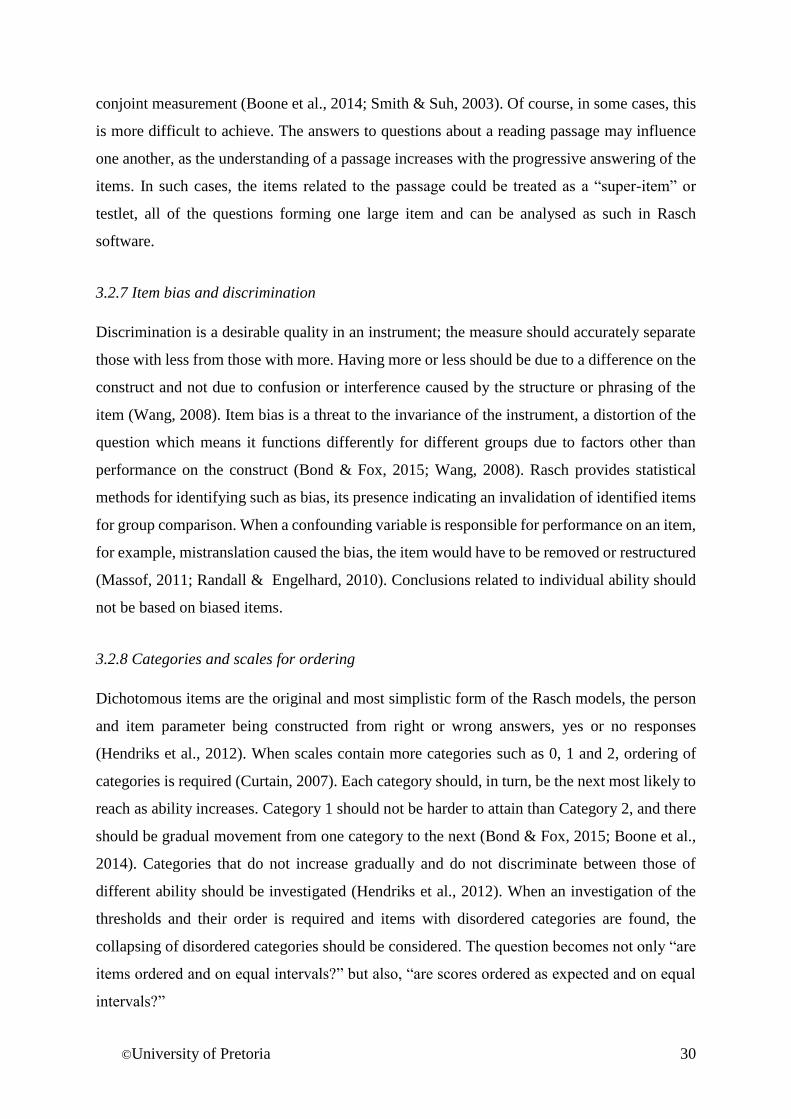
©University of Pretoria 30
conjoint measurement (Boone et al., 2014; Smith & Suh, 2003). Of course, in some cases, this
is more difficult to achieve. The answers to questions about a reading passage may influence
one another, as the understanding of a passage increases with the progressive answering of the
items. In such cases, the items related to the passage could be treated as a “super-item” or
testlet, all of the questions forming one large item and can be analysed as such in Rasch
software.
3.2.7 Item bias and discrimination
Discrimination is a desirable quality in an instrument; the measure should accurately separate
those with less from those with more. Having more or less should be due to a difference on the
construct and not due to confusion or interference caused by the structure or phrasing of the
item (Wang, 2008). Item bias is a threat to the invariance of the instrument, a distortion of the
question which means it functions differently for different groups due to factors other than
performance on the construct (Bond & Fox, 2015; Wang, 2008). Rasch provides statistical
methods for identifying such as bias, its presence indicating an invalidation of identified items
for group comparison. When a confounding variable is responsible for performance on an item,
for example, mistranslation caused the bias, the item would have to be removed or restructured
(Massof, 2011; Randall & Engelhard, 2010). Conclusions related to individual ability should
not be based on biased items.
3.2.8 Categories and scales for ordering
Dichotomous items are the original and most simplistic form of the Rasch models, the person
and item parameter being constructed from right or wrong answers, yes or no responses
(Hendriks et al., 2012). When scales contain more categories such as 0, 1 and 2, ordering of
categories is required (Curtain, 2007). Each category should, in turn, be the next most likely to
reach as ability increases. Category 1 should not be harder to attain than Category 2, and there
should be gradual movement from one category to the next (Bond & Fox, 2015; Boone et al.,
2014). Categories that do not increase gradually and do not discriminate between those of
different ability should be investigated (Hendriks et al., 2012). When an investigation of the
thresholds and their order is required and items with disordered categories are found, the
collapsing of disordered categories should be considered. The question becomes not only “are
items ordered and on equal intervals?” but also, “are scores ordered as expected and on equal
intervals?”
©University of Pretoria 31
3.2.9 Models, theories and measuring
When the world changes, creating new demands, this in turn sparks similar responses in various
locations and disciplines. As the need for scientific testing has increased, via world wars and
greater emphasis on education, so too have models been developed with which to assess the
accuracy of assessments and statistical models with which to analyse test functioning. Classical
Test Theory (CTT), also known as True Score Theory (TST) or Traditional Test Theory was
the most basic of these responses (Cappelleri et al., 2014; Peterson et al., 2017). The
assumption of CTT is that a total score accurately represents whatever has been tested plus
some error (DeVellis, 2006). However, the limitations of CTT soon became evident, such as
the inability of this model to separate items from persons, and as a result, more sophisticated
models were needed. In the United States, Fredrick Lord devised Item Response Theory (IRT)
and in Denmark Georg Rasch worked on his models (Cappelleri et al., 2014; Lord, 1953;
Hambleton et al., 1991).
IRT has similar statistical equations to Rasch models, such as the mathematical modelling of a
response based on ability, person ability and item difficulty, invariance and unidimensionality.
Rasch models and theory differs from IRT in the key area of how measurement is viewed
(Engelhard, 2013). Rasch theory sees measurement principles as the ideal, to which data and
real world measurement should conform (Long, 2011). IRT models are not measurement
models, but statistical models wherein the model must fit the data. In contrast, Rasch models
are measurement models and the data must fit the model (Engelhard, 2013). Table 3.1 shows
the theoretical departure point of each of these approaches to psychometrics (Cappelleri et al.,
2014; Hambleton, Swaminathan & Rogers, 1991; Lord, 1953; Petrillo, Cano, McLeod& Coon,
2015; Reise & Henson, 2003).
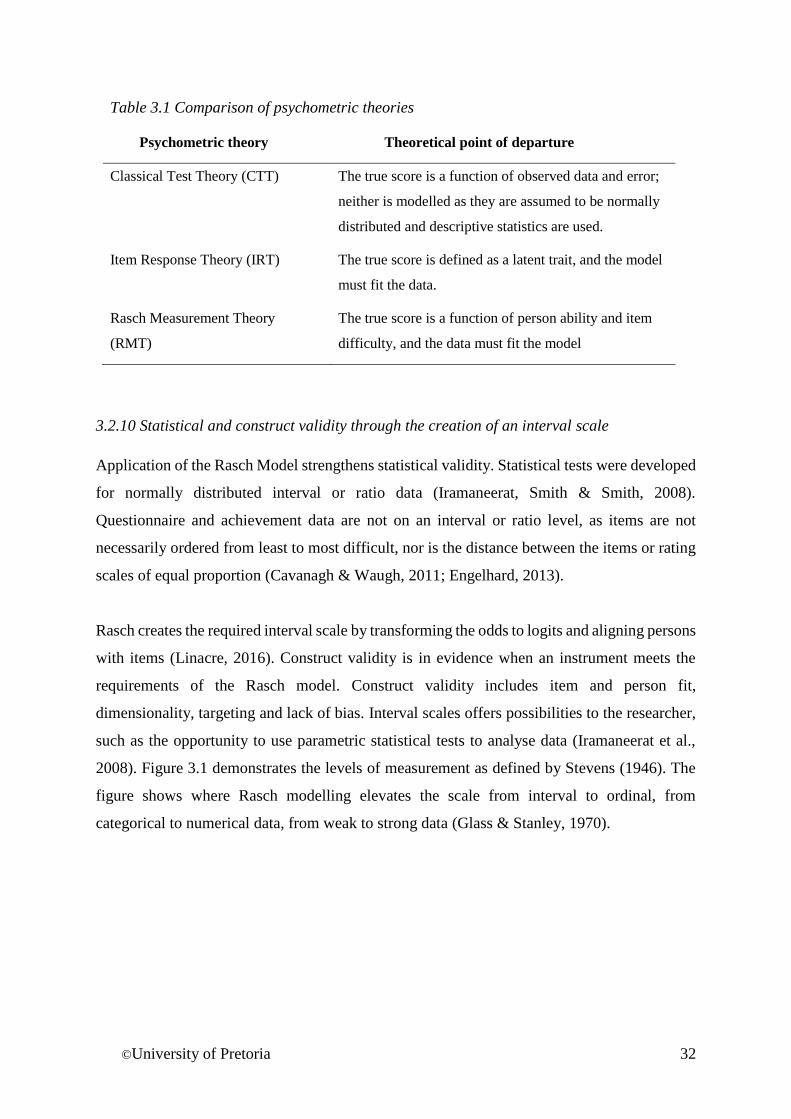
©University of Pretoria 32
Table 3.1 Comparison of psychometric theories
Psychometric theory Theoretical point of departure
Classical Test Theory (CTT) The true score is a function of observed data and error;
neither is modelled as they are assumed to be normally
distributed and descriptive statistics are used.
Item Response Theory (IRT) The true score is defined as a latent trait, and the model
must fit the data.
Rasch Measurement Theory
(RMT)
The true score is a function of person ability and item
difficulty, and the data must fit the model
3.2.10 Statistical and construct validity through the creation of an interval scale
Application of the Rasch Model strengthens statistical validity. Statistical tests were developed
for normally distributed interval or ratio data (Iramaneerat, Smith & Smith, 2008).
Questionnaire and achievement data are not on an interval or ratio level, as items are not
necessarily ordered from least to most difficult, nor is the distance between the items or rating
scales of equal proportion (Cavanagh & Waugh, 2011; Engelhard, 2013).
Rasch creates the required interval scale by transforming the odds to logits and aligning persons
with items (Linacre, 2016). Construct validity is in evidence when an instrument meets the
requirements of the Rasch model. Construct validity includes item and person fit,
dimensionality, targeting and lack of bias. Interval scales offers possibilities to the researcher,
such as the opportunity to use parametric statistical tests to analyse data (Iramaneerat et al.,
2008). Figure 3.1 demonstrates the levels of measurement as defined by Stevens (1946). The
figure shows where Rasch modelling elevates the scale from interval to ordinal, from
categorical to numerical data, from weak to strong data (Glass & Stanley, 1970).
©University of Pretoria 33
2
Nominal Data:
Attributes are only named
Example: Male and Female
Ordinal Data:
Attributes can be ordered
Example: Likert scale
(agree, strongly agree etc)
Interval Data:
Distance is meaningful
Example: Age, height etc
Ratio Data:
Absolute 0
Example: Salary
LEVELS OF MEASUREMENT
WEAKEST DATA
STRONGEST DATA
Raw Scores
Rasch Scores
Figure 3.1 The levels of measurement as defined by Stevens (1946)
3.3 The Rasch model
Rasch Measurement Theory (RMT) was first devised by Danish Mathematician Georg Rasch
in the 1950s (Bond & Fox, 2015; Cavanagh & Waugh, 2011). During the 1960s, a measurement
revolution began as George Rasch, with Ben Wright, promoted Rasch Analysis, and Fredrick
Lord and Ronald Hamilton promoted Item Response Theory (Linacre, 2005; Lord, 1953;
Hambleton et al., 1991). RMT today is comprised of a family of mathematical models and
techniques; however, Georg Rasch originally designed a model for dichotomous test data, also
known as the Simple Logistic Model (Cavanagh & Waugh, 2011). Rasch models map persons
and items on a linear line from less able or difficult, to more able or difficult and then persons
and items are aligned. The central proposition for the dichotomous model is that the response
of a person to a binary item is a function of both item difficulty and person ability. The
probability of a person achieving success is entirely determined by the difference between the
difficulty of the item and the student’s ability. Item difficulty is calibrated with a mean of zero.
From the mean, the relative difficulty of items is calibrated. This is judged by the number of
items answered correctly over the number of items answered incorrectly, i.e. the odds. To
©University of Pretoria 34
create an interval scale, the log-odds of person ability levels and item difficulties are calculated
and used for their communal scale. By calibrating item difficulty and person proficiency,
through individual person and item interaction, persons and items are aligned on the same scale.
The process involves a number of iterations. Where items do not conform to the model and
persons do not conform, misfit is noted. Other RMT models include the Rating Scale Model,
the Partial Credit Model, the Facets Model and the Rasch Pair-Wise Comparison Model
amongst others (Bond & Fox, 2015).
Measurement always has two aspects, the construct that is being measured and the instrument
with which the measurement is done (Iramaneerat et al., 2008). It is measurement in the
classical sense that makes quatitative comparisons possible (Andrich, 2011). In addition, it
should be noted that while ordinal measurement tells us something, what is more, or less, it
does so without the desired property of equal intervals, knowing how much more or less
something is (Hubbard, 2010; Glass& Stanley, 1970). It is here that Rasch Theory makes a
special contribution by placing persons and items on an equally ordered interval scale
(McCreary et al., 2013).
RMT is primarily used to calibrate instruments in the social sciences, by calculating item to
person fit so that non-fitting items and persons can be identified and instruments can be refined.
The logit scale calibrated by RMT also provides an interval scale so that a summative score
derived from an instrument is more precise and gives meaning to distances between persons
and items.
Statistical models primarily try to describe data and relationships therein, whereas the Rasch
Model is prescriptive and the data must fit the model (Acton, 2003). RMT is a measurement
model, and therefore the data should fit the model as is expected for successful measurement
(RMT prescribes the criterion for good measurement). It is proposed that using RMT improves
the quality and usefulness of instruments and that even though the applications of RMT are
extensive they are still being explored and discovered.
3.3.1 The Rasch Dichotomous Model
The dichotomous Rasch model calculates success-to-failure odds for people answering the test
or questionnaire, as well as for the items. The odds are then converted to the natural logarithm
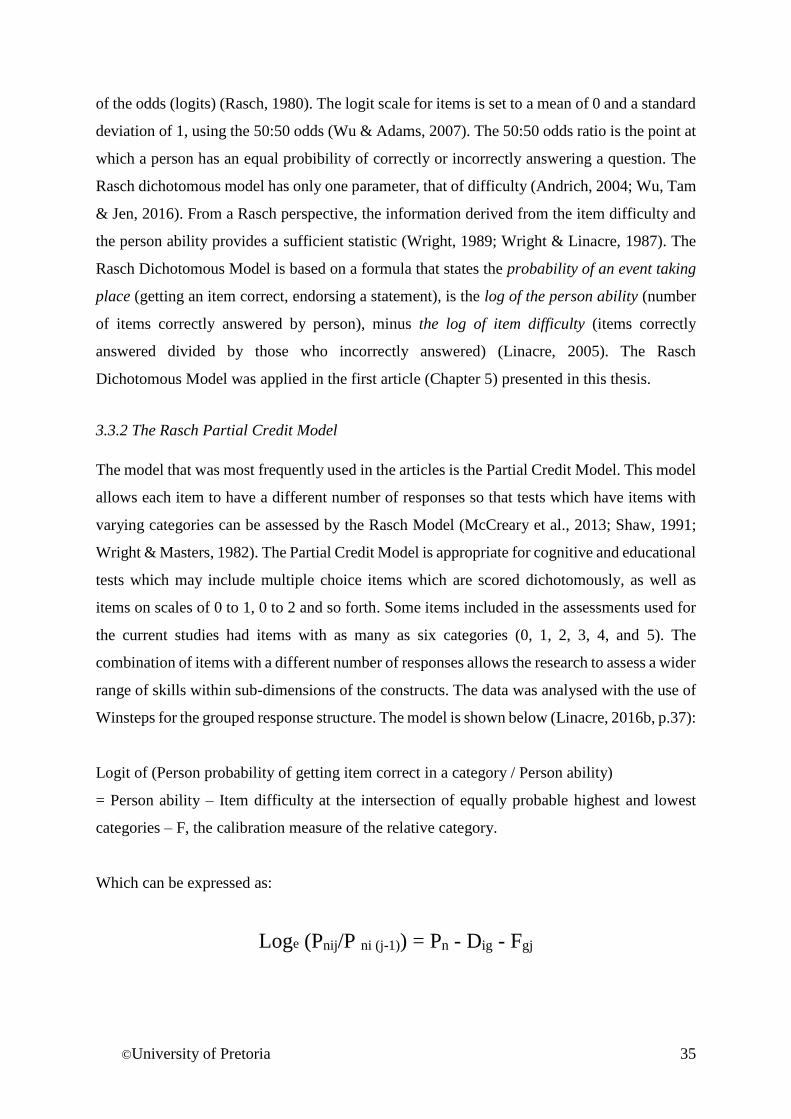
©University of Pretoria 35
of the odds (logits) (Rasch, 1980). The logit scale for items is set to a mean of 0 and a standard
deviation of 1, using the 50:50 odds (Wu & Adams, 2007). The 50:50 odds ratio is the point at
which a person has an equal probibility of correctly or incorrectly answering a question. The
Rasch dichotomous model has only one parameter, that of difficulty (Andrich, 2004; Wu, Tam
& Jen, 2016). From a Rasch perspective, the information derived from the item difficulty and
the person ability provides a sufficient statistic (Wright, 1989; Wright & Linacre, 1987). The
Rasch Dichotomous Model is based on a formula that states the probability of an event taking
place (getting an item correct, endorsing a statement), is the log of the person ability (number
of items correctly answered by person), minus the log of item difficulty (items correctly
answered divided by those who incorrectly answered) (Linacre, 2005). The Rasch
Dichotomous Model was applied in the first article (Chapter 5) presented in this thesis.
3.3.2 The Rasch Partial Credit Model
The model that was most frequently used in the articles is the Partial Credit Model. This model
allows each item to have a different number of responses so that tests which have items with
varying categories can be assessed by the Rasch Model (McCreary et al., 2013; Shaw, 1991;
Wright & Masters, 1982). The Partial Credit Model is appropriate for cognitive and educational
tests which may include multiple choice items which are scored dichotomously, as well as
items on scales of 0 to 1, 0 to 2 and so forth. Some items included in the assessments used for
the current studies had items with as many as six categories (0, 1, 2, 3, 4, and 5). The
combination of items with a different number of responses allows the research to assess a wider
range of skills within sub-dimensions of the constructs. The data was analysed with the use of
Winsteps for the grouped response structure. The model is shown below (Linacre, 2016b, p.37):
Logit of (Person probability of getting item correct in a category / Person ability)
= Person ability – Item difficulty at the intersection of equally probable highest and lowest
categories – F, the calibration measure of the relative category.
Which can be expressed as:
Loge (Pnij/P ni (j-1)) = Pn - Dig - Fgj
©University of Pretoria 36
The Winsteps programme groups items with the same scale, so that an item grouping level is
created and items with the same scale are analysed together (Linacre, 2016a).
3.4 Measurement in a South African context
From an African perspective, it may be that too many Western tools are applied without
adaptation to the context, and operationalising constructs for African languages and cultures is
an urgent measurement challenge (Schutte, Wissing, Ellis, Jose & Vella-Brodrick, 2016).
Psychology’s responsibility to decolonise is becoming a pressing matter in South Africa’s
developing context, in all areas of application (Pillay, 2016). To adequately devise measures
for the African context, two elements are needed: measures should be developed within the
linguistic and cultural context for which it is intended, and the development should be done by
applying sophisticated psychometric principles as presented in this chapter.
The necessity of applying scientific principles to measures, whether they are educational,
psychological or medical in nature is the same in the South African context as found
internationally but is more challenging (Antoninis, Delprato & Benavot, 2016; Bolarinwa,
2015; Dampier, 2014). In a developing context, there may be less awareness of advancements
and applications in psychometric theory (Dampier, 2014). Intellectual capital in the form of
individuals or organisations with the skills and knowledge to apply sophisticated models is less
prominent and fewer in number. The combination of lower demand (due to a lack of awareness)
and fewer resources (in the form of persons and institutions with this knowledge) leads to a
lower application of the Rasch Model in social measurements. Failing to apply measurement
models is to the disadvantage of individuals and society. One example is the National Senior
Certificate (NSC), the exit examination written by Grade 12 learners in South Africa. Even
though hundreds of thousands of learners write these examinations yearly, the examinations
are not linked by anchor or common items from one year to the next, items are not piloted and
item statistics are not used to analyse items (DBE, 2015). While qualitative benchmarking and
equivalence setting processes are used to compare the assessments to national and international
qualifications and tests (Umalusi, 2010), this does not necessarily yield the precision one would
expect from such high stakes testing.
Assessment, high-stakes or otherwise, plays an essential role in the South African educational
landscape (Dampier, 2014; Davids, 2017; Howie, 2012). When taking into account the large
©University of Pretoria 37
amount of resources allocated to international, national and provincial assessments and testing,
the need to understand and apply the underlying principles of measurement to test design and
refinement becomes even more vital and urgent (Bos, Goy, Howie, Kupari & Wendt, 2011;
Dampier, 2014). In the developing context, this means teaching assessment and measurement
theory explicitly in disciplines where social science instruments are used, such as education,
psychology, medical sciences and the humanities in general. Those who design, apply and
refine social science instruments such as tests, questionnaires and other assessments in the
African context should do so after being equipped to apply the same scientific principles of
measurement that are used in the natural sciences (Bos et al., 2011).
3.6 Interpretation of Rasch statistics
Table 3.2 highlights how to interpret Rasch statistics as derived from the Winsteps programme.
When analysing an instrument’s functioning, the researcher should have the responses for each
item captured in a database. After proper cleaning of the data, the data can be imported into
Winsteps from either Excel or SPSS (see Bond & Fox, 2015; Linacre 2016). Values used to
indicate missing information should be in the control file. Winsteps and other similar software
provide large amounts of statistical information about the instrument’s function as a whole, as
well as individual item functioning.
Firstly, the summary statistics should be investigated, most notably the reliability and
separation indexes. Next, examine the item and person fit statistics, as this reveals whether
each item and person contributes to the measurement model as a whole. A rule of thumb is that
outfit is examined first then infit.
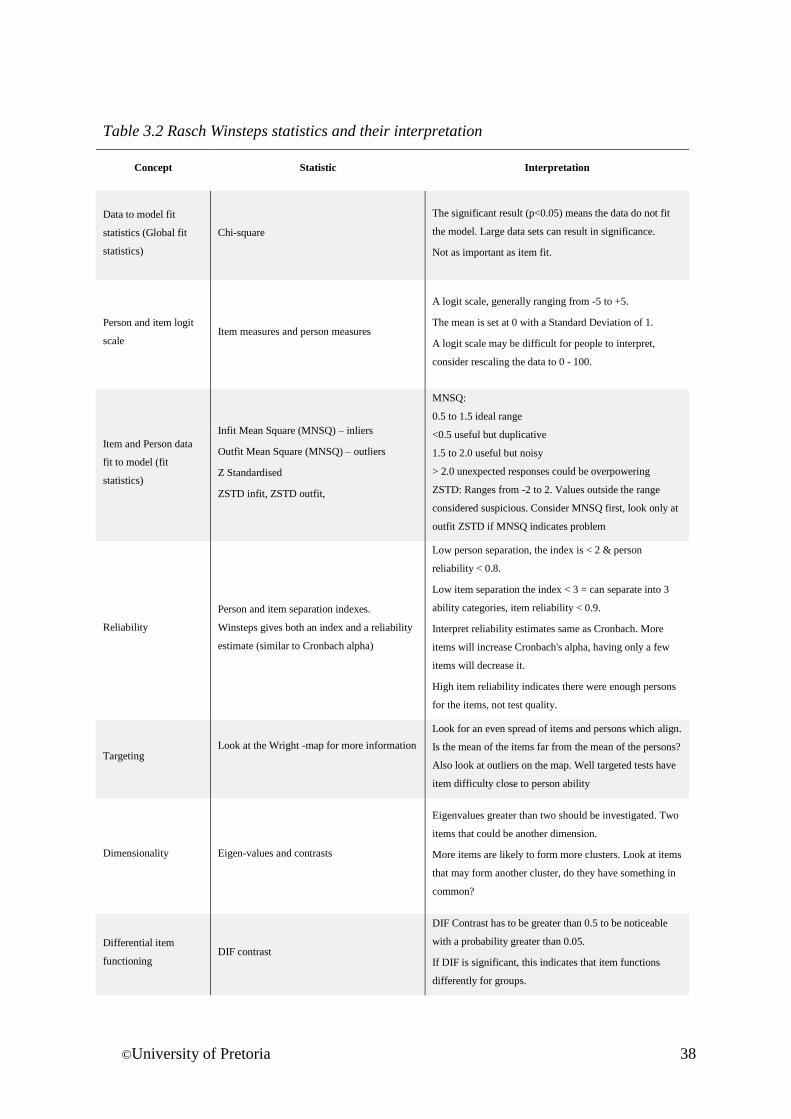
©University of Pretoria 38
Table 3.2 Rasch Winsteps statistics and their interpretation
Concept Statistic Interpretation
Data to model fit
statistics (Global fit
statistics)
Chi-square
The significant result (p<0.05) means the data do not fit
the model. Large data sets can result in significance.
Not as important as item fit.
Person and item logit
scale Item measures and person measures
A logit scale, generally ranging from -5 to +5.
The mean is set at 0 with a Standard Deviation of 1.
A logit scale may be difficult for people to interpret,
consider rescaling the data to 0 - 100.
Item and Person data
fit to model (fit
statistics)
Infit Mean Square (MNSQ) – inliers
Outfit Mean Square (MNSQ) – outliers
Z Standardised
ZSTD infit, ZSTD outfit,
MNSQ:
0.5 to 1.5 ideal range
<0.5 useful but duplicative
1.5 to 2.0 useful but noisy
> 2.0 unexpected responses could be overpowering
ZSTD: Ranges from -2 to 2. Values outside the range
considered suspicious. Consider MNSQ first, look only at
outfit ZSTD if MNSQ indicates problem
Reliability
Person and item separation indexes.
Winsteps gives both an index and a reliability
estimate (similar to Cronbach alpha)
Low person separation, the index is < 2 & person
reliability < 0.8.
Low item separation the index < 3 = can separate into 3
ability categories, item reliability < 0.9.
Interpret reliability estimates same as Cronbach. More
items will increase Cronbach's alpha, having only a few
items will decrease it.
High item reliability indicates there were enough persons
for the items, not test quality.
Targeting Look at the Wright -map for more information
Look for an even spread of items and persons which align.
Is the mean of the items far from the mean of the persons?
Also look at outliers on the map. Well targeted tests have
item difficulty close to person ability
Dimensionality Eigen-values and contrasts
Eigenvalues greater than two should be investigated. Two
items that could be another dimension.
More items are likely to form more clusters. Look at items
that may form another cluster, do they have something in
common?
Differential item
functioning DIF contrast
DIF Contrast has to be greater than 0.5 to be noticeable
with a probability greater than 0.05.
If DIF is significant, this indicates that item functions
differently for groups.
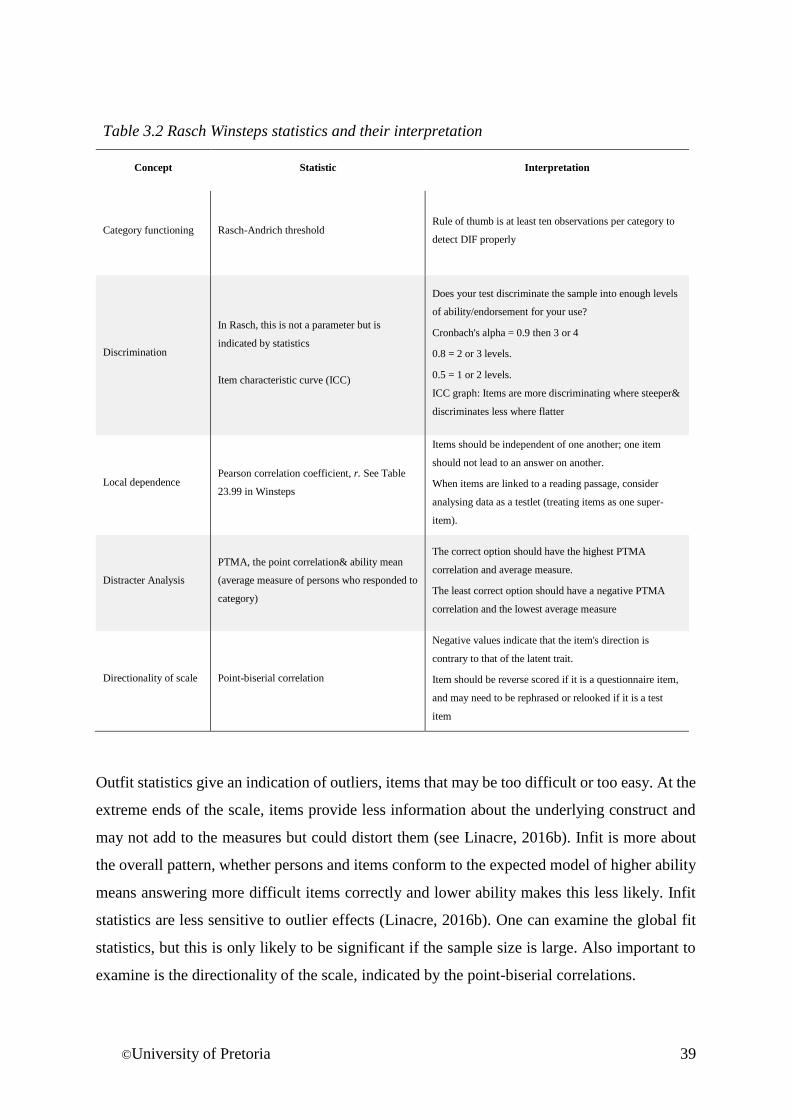
©University of Pretoria 39
Table 3.2 Rasch Winsteps statistics and their interpretation
Concept Statistic Interpretation
Category functioning Rasch-Andrich threshold Rule of thumb is at least ten observations per category to
detect DIF properly
Discrimination
In Rasch, this is not a parameter but is
indicated by statistics
Item characteristic curve (ICC)
Does your test discriminate the sample into enough levels
of ability/endorsement for your use?
Cronbach's alpha = 0.9 then 3 or 4
0.8 = 2 or 3 levels.
0.5 = 1 or 2 levels.
ICC graph: Items are more discriminating where steeper&
discriminates less where flatter
Local dependence Pearson correlation coefficient, r. See Table
23.99 in Winsteps
Items should be independent of one another; one item
should not lead to an answer on another.
When items are linked to a reading passage, consider
analysing data as a testlet (treating items as one super-
item).
Distracter Analysis
PTMA, the point correlation& ability mean
(average measure of persons who responded to
category)
The correct option should have the highest PTMA
correlation and average measure.
The least correct option should have a negative PTMA
correlation and the lowest average measure
Directionality of scale Point-biserial correlation
Negative values indicate that the item's direction is
contrary to that of the latent trait.
Item should be reverse scored if it is a questionnaire item,
and may need to be rephrased or relooked if it is a test
item
Outfit statistics give an indication of outliers, items that may be too difficult or too easy. At the
extreme ends of the scale, items provide less information about the underlying construct and
may not add to the measures but could distort them (see Linacre, 2016b). Infit is more about
the overall pattern, whether persons and items conform to the expected model of higher ability
means answering more difficult items correctly and lower ability makes this less likely. Infit
statistics are less sensitive to outlier effects (Linacre, 2016b). One can examine the global fit
statistics, but this is only likely to be significant if the sample size is large. Also important to
examine is the directionality of the scale, indicated by the point-biserial correlations.
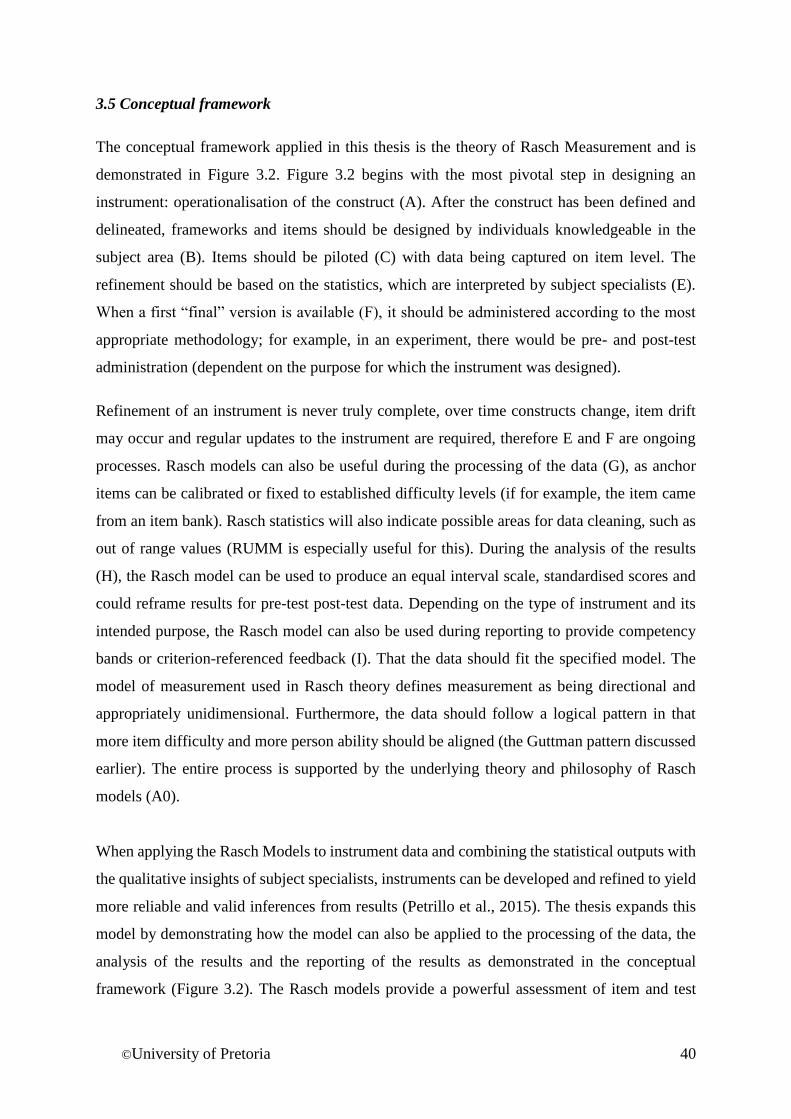
©University of Pretoria 40
3.5 Conceptual framework
The conceptual framework applied in this thesis is the theory of Rasch Measurement and is
demonstrated in Figure 3.2. Figure 3.2 begins with the most pivotal step in designing an
instrument: operationalisation of the construct (A). After the construct has been defined and
delineated, frameworks and items should be designed by individuals knowledgeable in the
subject area (B). Items should be piloted (C) with data being captured on item level. The
refinement should be based on the statistics, which are interpreted by subject specialists (E).
When a first “final” version is available (F), it should be administered according to the most
appropriate methodology; for example, in an experiment, there would be pre- and post-test
administration (dependent on the purpose for which the instrument was designed).
Refinement of an instrument is never truly complete, over time constructs change, item drift
may occur and regular updates to the instrument are required, therefore E and F are ongoing
processes. Rasch models can also be useful during the processing of the data (G), as anchor
items can be calibrated or fixed to established difficulty levels (if for example, the item came
from an item bank). Rasch statistics will also indicate possible areas for data cleaning, such as
out of range values (RUMM is especially useful for this). During the analysis of the results
(H), the Rasch model can be used to produce an equal interval scale, standardised scores and
could reframe results for pre-test post-test data. Depending on the type of instrument and its
intended purpose, the Rasch model can also be used during reporting to provide competency
bands or criterion-referenced feedback (I). That the data should fit the specified model. The
model of measurement used in Rasch theory defines measurement as being directional and
appropriately unidimensional. Furthermore, the data should follow a logical pattern in that
more item difficulty and more person ability should be aligned (the Guttman pattern discussed
earlier). The entire process is supported by the underlying theory and philosophy of Rasch
models (A0).
When applying the Rasch Models to instrument data and combining the statistical outputs with
the qualitative insights of subject specialists, instruments can be developed and refined to yield
more reliable and valid inferences from results (Petrillo et al., 2015). The thesis expands this
model by demonstrating how the model can also be applied to the processing of the data, the
analysis of the results and the reporting of the results as demonstrated in the conceptual
framework (Figure 3.2). The Rasch models provide a powerful assessment of item and test
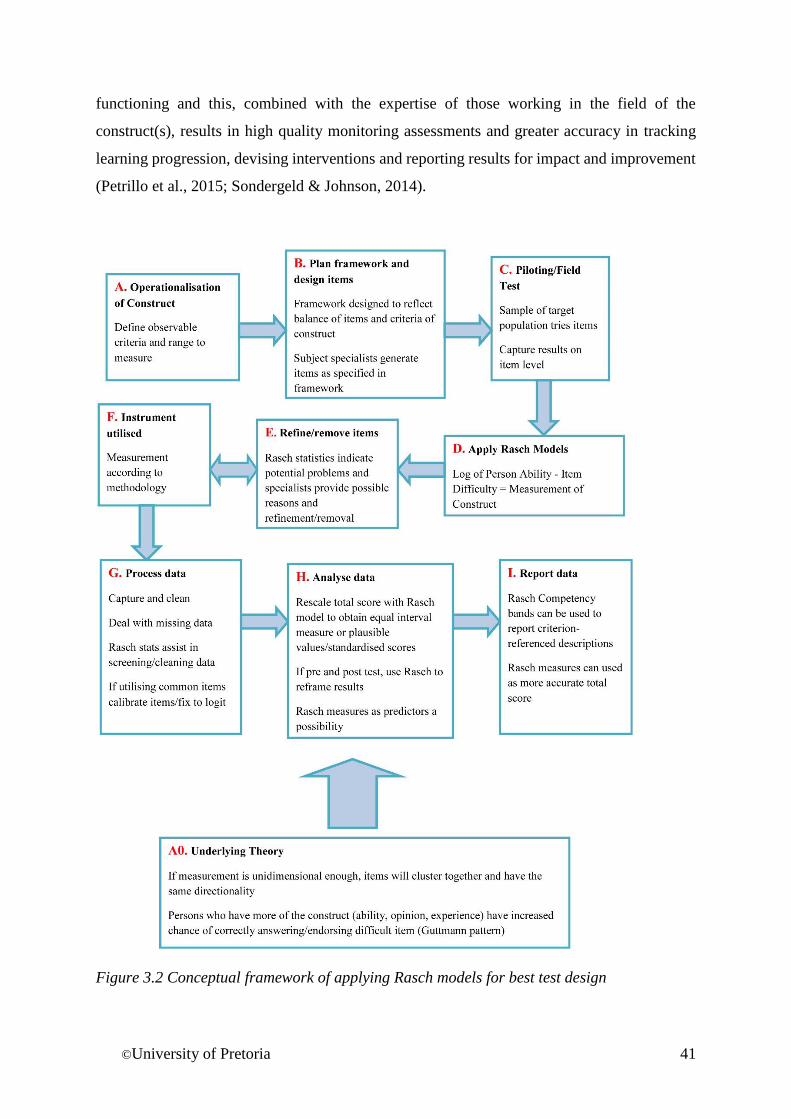
©University of Pretoria 41
functioning and this, combined with the expertise of those working in the field of the
construct(s), results in high quality monitoring assessments and greater accuracy in tracking
learning progression, devising interventions and reporting results for impact and improvement
(Petrillo et al., 2015; Sondergeld & Johnson, 2014).
Figure 3.2 Conceptual framework of applying Rasch models for best test design
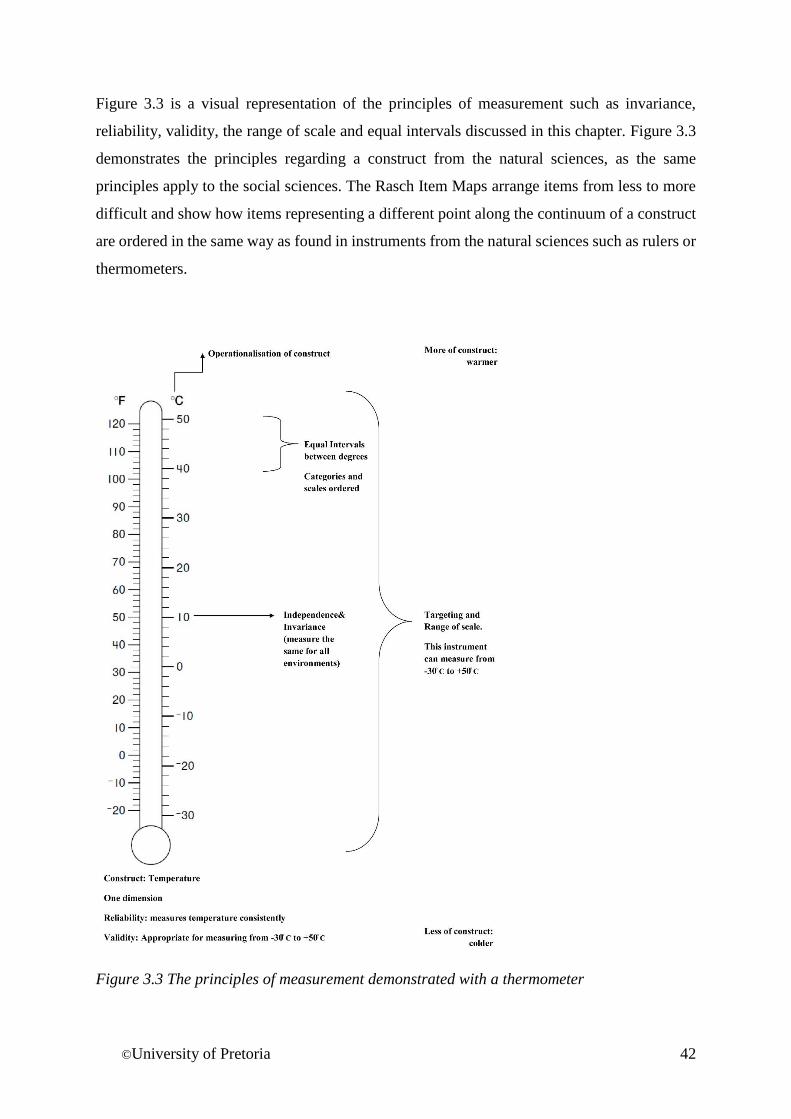
©University of Pretoria 42
Figure 3.3 is a visual representation of the principles of measurement such as invariance,
reliability, validity, the range of scale and equal intervals discussed in this chapter. Figure 3.3
demonstrates the principles regarding a construct from the natural sciences, as the same
principles apply to the social sciences. The Rasch Item Maps arrange items from less to more
difficult and show how items representing a different point along the continuum of a construct
are ordered in the same way as found in instruments from the natural sciences such as rulers or
thermometers.
Figure 3.3 The principles of measurement demonstrated with a thermometer
©University of Pretoria 43
The Rasch model is at its core a very simplistic model: The natural logarithm of the ratio of the
probability of success to the probability of failure is equal to a person’s ability minus the item
difficulty. The basic model is very flexible and has a wide range of applications. Some of these
applications are demonstrated in the articles (see Chapters 5 to 7) that follow on from this
chapter.
3.6 Conclusion
This chapter provided a broad overview of the methodology used in the subsequent articles. In
each of the articles, included as part of the thesis, Rasch models were applied to solve analysis
challenges and to strengthen measurements. The principles, statistics and applications
discussed in the current chapter are implied and explicitly used in the articles. Each article,
based on the same project, described in Chapters 1 and 4, describes the specific methodology
used in its analysis, as well the pivotal role played by the Rasch models. To define a construct
and create an instrument with which to measure the latent trait in the social sciences is no easy
task. We often forget how difficult it has been to create the measurement instruments in the
physical sciences, and that those who formulated the models used today in the social sciences
also spent considerable time developing what we take for granted (Andrich, 2016).
Explicitly understanding measurement principles gives the social sciences the opportunity to
assess with the same precision and thoroughness as found in the natural sciences. Rasch models
provide a way to determine what degree measures have been made and to improve the quality
of the instrument. At first, the Rasch models may seem complex and confusing, but they are
elegant in their simplicity and parsimonious in the application. Modern day technology further
simplifies the application by providing programmes such as Winsteps (Linacre, 2016a) and the
Rasch Unidimensional Models for Measurement (RUMM) which produces all the statistics
needed to evaluate an instrument and refine and improve measures (Andrich & Sheridan,
2009a; 2009b). Rasch models can be used to improve and enhance measures at every step of
the research cycle, from processing data and dealing with missing values, to monitoring
progress and change over time and finally, in the reporting of results for maximum impact.
©University of Pretoria 44
Chapter 4 - The Monitoring Project’s Methodology
Aptitude is just a measure of how long it takes to learn something
(Unknown source)
4.1 Introduction
The monitoring of academic achievement study for seven independent high schools was
conceptualised by the Centre for Evaluation and Assessment (CEA) at the Faculty of
Education, University of Pretoria. A funding agency approached the CEA to design the
monitoring system to assess Mathematics, Natural Science and English Language in Grades 8
to 11 across seven schools who shared a common curriculum. The request from the agency was
based on recognition of the non-availability of standardised assessments at these grades in the
South African context. The project was designed to monitor learning within and across the
seven schools, while at the same time using the results to enhance teaching and learning by
providing feedback in the form of workshops and reports. From October 2011 to February
2013, assessment instruments were designed and revised to assess the quality of learning
broadly in each of the grades and subjects; thereafter, testing took place annually from
November 2012 to November 2014.
The innovations that emerged from the project included:
Designing and administering curriculum-based instruments to assess knowledge gained
in a subject area.
Tracking learning progression from one grade to the next in each subject between
grades.
The assessments were revised and updated yearly to factor in changes in curriculum
and to prevent over-exposure.
Devising feedback for principals, teachers, learners and guardians based on the
assessment results so that teaching and learning could be enhanced.
Providing learner-level feedback that was criterion-referenced.
Merging an external monitoring system with internal school functioning so that learners
and teachers could benefit.
©University of Pretoria 45
Viewed externally, monitoring and feedback may appear to be exclusive, but this project found
ways to merge these processes, gain buy-in from teachers and schools, and make the results
practically applicable so that everyone could benefit from the process.
Subject specific sessions were held in the form of interactive workshops for all three subjects.
Findings were discussed in detail and teachers and subject specialists engaged in consultations
to find ways to enrich teaching and learning. The majority of attendees also indicated that the
sessions provided them with relevant information that they can, and do, use to improve teaching
and school practices.
4.2 Study population and sampling
The total population of learners is represented in Table 4.1 which displays the count of the
learners in each school, per grade and per year (2012, 2013 and 2014) as well as the grand total
for all the years. The number of learners in each grade varied by year, based on the number of
learners recruited by the schools in a specific year, as well as attrition (learners failing a year
and leaving the school).
Each year, new learners also joined in each of the grades. In addition, the schools were still in
a development stage, for example Schools 4, 5 and 6 only added Grades 10 and 11 in 2013 and
2014. As a result, there was a 6 to 10% variation in the population. The schools are independent,
have their own curriculum and smaller class sizes and longer school days than ordinary public
schools. Due to the unique characteristics of the schools, they are seen as a population.
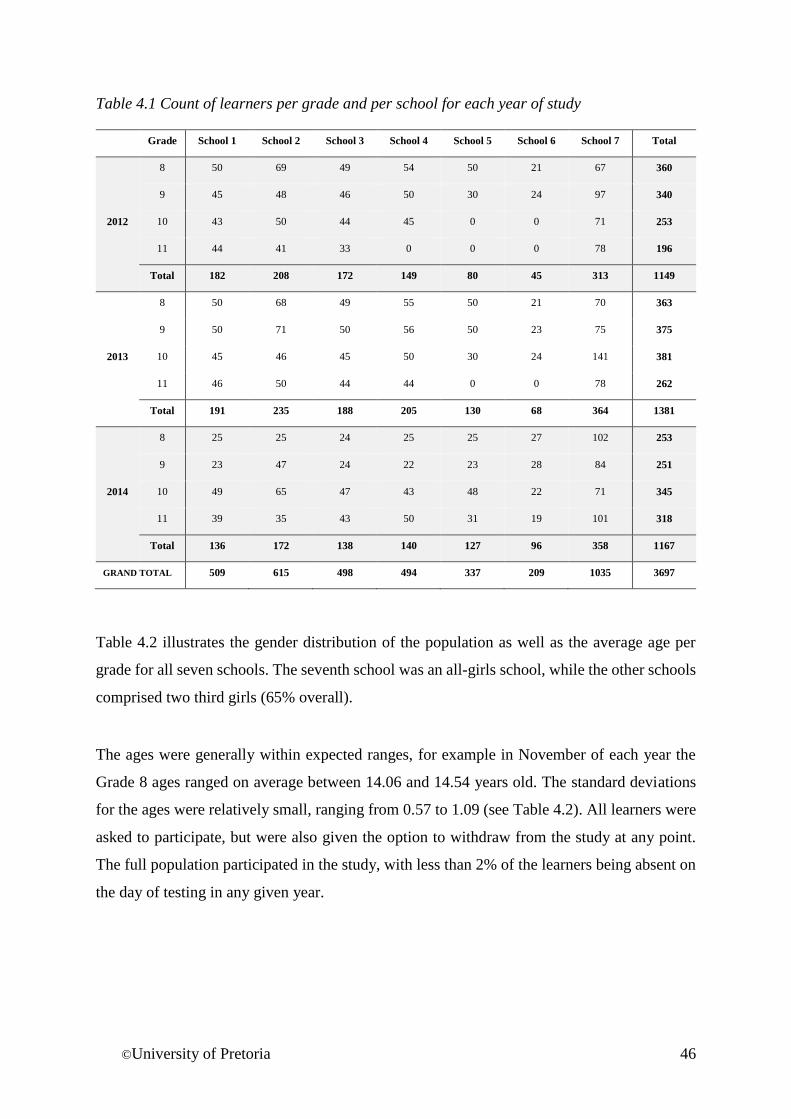
©University of Pretoria 46
Table 4.1 Count of learners per grade and per school for each year of study
Grade School 1 School 2 School 3 School 4 School 5 School 6 School 7 Total
2012
8 50 69 49 54 50 21 67 360
9 45 48 46 50 30 24 97 340
10 43 50 44 45 0 0 71 253
11 44 41 33 0 0 0 78 196
Total 182 208 172 149 80 45 313 1149
2013
8 50 68 49 55 50 21 70 363
9 50 71 50 56 50 23 75 375
10 45 46 45 50 30 24 141 381
11 46 50 44 44 0 0 78 262
Total 191 235 188 205 130 68 364 1381
2014
8 25 25 24 25 25 27 102 253
9 23 47 24 22 23 28 84 251
10 49 65 47 43 48 22 71 345
11 39 35 43 50 31 19 101 318
Total 136 172 138 140 127 96 358 1167
GRAND TOTAL 509 615 498 494 337 209 1035 3697
Table 4.2 illustrates the gender distribution of the population as well as the average age per
grade for all seven schools. The seventh school was an all-girls school, while the other schools
comprised two third girls (65% overall).
The ages were generally within expected ranges, for example in November of each year the
Grade 8 ages ranged on average between 14.06 and 14.54 years old. The standard deviations
for the ages were relatively small, ranging from 0.57 to 1.09 (see Table 4.2). All learners were
asked to participate, but were also given the option to withdraw from the study at any point.
The full population participated in the study, with less than 2% of the learners being absent on
the day of testing in any given year.
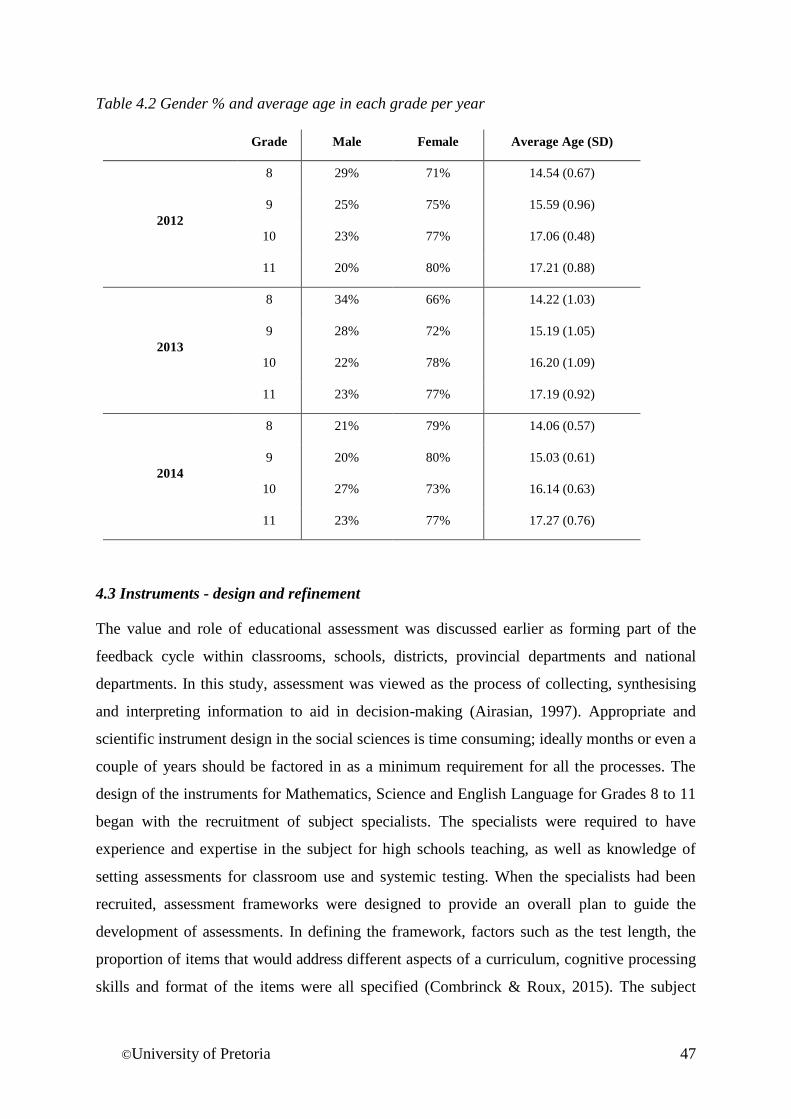
©University of Pretoria 47
Table 4.2 Gender % and average age in each grade per year
Grade Male Female Average Age (SD)
2012
8 29% 71% 14.54 (0.67)
9 25% 75% 15.59 (0.96)
10 23% 77% 17.06 (0.48)
11 20% 80% 17.21 (0.88)
2013
8 34% 66% 14.22 (1.03)
9 28% 72% 15.19 (1.05)
10 22% 78% 16.20 (1.09)
11 23% 77% 17.19 (0.92)
2014
8 21% 79% 14.06 (0.57)
9 20% 80% 15.03 (0.61)
10 27% 73% 16.14 (0.63)
11 23% 77% 17.27 (0.76)
4.3 Instruments - design and refinement
The value and role of educational assessment was discussed earlier as forming part of the
feedback cycle within classrooms, schools, districts, provincial departments and national
departments. In this study, assessment was viewed as the process of collecting, synthesising
and interpreting information to aid in decision-making (Airasian, 1997). Appropriate and
scientific instrument design in the social sciences is time consuming; ideally months or even a
couple of years should be factored in as a minimum requirement for all the processes. The
design of the instruments for Mathematics, Science and English Language for Grades 8 to 11
began with the recruitment of subject specialists. The specialists were required to have
experience and expertise in the subject for high schools teaching, as well as knowledge of
setting assessments for classroom use and systemic testing. When the specialists had been
recruited, assessment frameworks were designed to provide an overall plan to guide the
development of assessments. In defining the framework, factors such as the test length, the
proportion of items that would address different aspects of a curriculum, cognitive processing
skills and format of the items were all specified (Combrinck & Roux, 2015). The subject
©University of Pretoria 48
specialists, serving as the reference group, also defined what would be assessed according to
the material in the national curriculum and the curriculum of the independent schools.
After the constructs had been defined, the cognitive demand of the items was set to be a balance
of item types, item difficulty and to appropriately assess learners from the target population.
Field testing was critical to this process so that item difficulty could be statistically calculated.
Informed by the design of the assessment frameworks, the reference team constructed items
that reflected the constructs to be tested and conform to the framework. The items underwent
two review phases, with comments by the external reviewers being made on the final form of
the items. The assessments were set to have duration of 60 minutes (Grade 8), 90 minutes
(Grade 9) and 120 minutes (Grades 10 and 11). The time constraints for the assessments
controlled the extent to which the curriculum content of a subject for a given year could be
assessed.
The test designers endeavoured to attain a balance of items and subject areas, to produce
assessments that broadly captured knowledge gained in a subject area and subject as a whole
over the course of a year. A variety of formats for the items were developed, such as multiple-
choice items, closed constructed response items, and open ended short response items. More
items than necessary were developed as is best practice in assessment design (Linacre, 2016).
This allowed for field testing items that assessed similar concepts and the selection of the best
fitting items for the final tests. The test administration time as well as curriculum coverage
targets determined the number of items developed. The assessment designers strived to
maintain a balance between multiple choice format and constructed response for Science and
English Language assessments. In the Mathematics assessments, very few multiple choice
items were included, so that learners could demonstrate their ability through calculations.
Within each curriculum section, a balance was also sought among easy, moderate and difficult
items.
4.4 Assessment administration
The field trial was conducted eight months before the official testing began (at the beginning of
2012), and independent schools similar to the target population were used to trial the items. The
field trial provided evidence of question difficulty levels and appropriateness of the items for
the specific group of learners. A larger number of items than required for the final tests was
©University of Pretoria 49
piloted so that less useful items could be eliminated. The tests underwent comprehensive
refinement based on the statistical evidence collected during the field trial and items were
refinement or removed as decided by subject specialists. In addition, on completion of the
assessments, learners were informally asked about their experiences of the items and tests,
which aspects they liked and which sections they disliked or struggled with, all of which
informed the design process. The yearly test administration took place in November each year
and was conducted by the CEA. Standardised assessment procedures were used to ensure that
high quality results were collected. Any problems experienced during testing was reported by
the administrators and taken into account during scoring and data capturing. Testing times were
arranged to fit into the school day and consultations were held with schools to make the
programme minimally disruptive to the schools.
4.5 Scoring, capturing and cleaning of data
The scoring (or marking) was done by experienced teachers who were trained by the subject
specialists. The specialists also conducted the moderation of the scoring to check for accuracy
and consistency. The capturing was done in-house at the CEA and capturing templates were
set up in Microsoft Access. The templates did not allow for the capturing of out of range values
and capturers were trained to use the correct codes. During capturing 20% of captured data
were checked for consistency against paper tests (randomly selected), and the error rate below
1%, was deemed to be acceptable. Cleaning of the data was done by the project coordinator,
and clean data was used to report the results to the schools and funding agency.
4.6 Instrument reliability and validity
Cronbach’s alpha was calculated for the assessments as a whole (all items), as well as subject
areas included in the assessments. All instruments had reliability coefficients above .800
(except one which had an estimate of .702). Several types of validity were investigated for the
assessment, the first being content validity. The content validity was examined by subject
specialists who compared the instruments to the current curriculum, and assessed the
instruments for coverage. This was an ongoing process as the instruments were reviewed every
year and minor adjustments made to ensure that the instruments were aligned to the curriculum.
Construct validity was considered by applying Rasch analysis and the difficulty of the items
aligned well with the ability of the learners. The Rasch results indicated evidence for
unidimensionality and consistency. To estimate the predictive validity of the instruments,
©University of Pretoria 50
correlations of the instruments with the final Matric marks (NSC), were calculated and found
to be high (above .700). Concurrent validity was estimated by correlating school marks of
learners with total scores on the assessment instruments, and these ranged from moderate to
high (.500 to .800).
4.7 Methods of data analysis
During the design and use of the assessment instruments, a variety of statistical techniques was
applied to analyse and report the results in school and learner reports. Schools were provided
with descriptive statistics in terms of their school’s average achievement, as well as that of the
other schools for comparative purposes. Mean achievement results per class per grade were
also provided to schools. In reports, schools were cautioned to keep in mind factors that could
affect achievement on an assessment, such memory effects (learners did not study for the test),
fatigue, diverse backgrounds, motivation and that most of the learners are English second
language speakers. Results per subject were reported to schools, not only as the average
achievement for the subject as a whole but also for different subject areas and cognitive levels.
When the second round of assessment took place, progress in learning was also reported based
on the common items in the assessment. Throughout the monitoring process, Rasch models
were applied to gauge the functioning of the tests and to make adjustments. Rasch item
statistics were also reported to teachers to indicate more about the learning taking place. The
teachers were taught how to interpret the Rasch statistics for better understanding of learner
ability and skills.
The analysis methods were structured to address the aims of the main project:
To compare schools within the coalition to one another, descriptive statistics (mean
achievement) and Rasch scores were shown and discussed in both reports and
workshops.
To identify gaps in the teaching of the curriculum, descriptive statistics were reported
for subject areas (each subject per area). When possible, item statistics were discussed
during the workshops, which was especially useful for Mathematics.
To monitor and track learning progression from one year to the next, performance on
anchor items were analysed using descriptive statistics as well as applying the Rasch
model.
©University of Pretoria 51
To give criterion-referenced feedback, learner reports were developed and distributed
to schools, teachers, learners and parents.
To engage teachers in the results, workshops were held. The workshops and feedback
stimulated classroom interventions.
The analysis, conducted and reported in the articles (see Chapters 5 - 7), was developed during
the life-cycle of the project in response to specific measurement challenges. The first article on
missing data fits with all of the aims discussed above as it is linked to preparing the data for
reporting descriptive and Rasch statistics. The second article, on evaluating anchor items and
reframing results, fits in with the monitoring and tracking goal of the project. The final article,
on competency bands, is an account of how the learner reports were developed and fits in with
the goal of devising criterion-referenced feedback to enhance teaching and learning within the
schools.
4.8 Ethics
Both learners and their guardians signed consent forms before learners participated in the study
each year (see Appendix D). Although, the study was designed as an accountability system for
the funding agency, for ethical and educational reasons, it was deemed as important that
learners, teachers and schools also benefit from the testing programme. Therefore, learner
reports were devised to give learners, teachers and parents a clear indication of subject
knowledge and skills gained as well the next steps learners would need to master. Teachers and
principals received school reports and attended interactive workshops, which in turn ensured
that the testing results informed the design of interventions and Saturday classes. The testing
programme was set up to benefit all stakeholders and not to interfere with teaching or learning.
4.9 Conclusion
The monitoring of the academic achievement study described in this chapter had many broad
aims. The first aim was to compare the academic achievement of high school learners from
Grades 8 to 11 across years and among the various independent schools in the coalition. The
project also evaluated academic achievement within schools by comparing performance among
classes and learners. The project’s goal was to serve as both an accountability system for the
funding agency and schools, while at the same time disseminating the results to schools,
teachers, learners and parents so that gaps in subject areas could be identified and addressed.
©University of Pretoria 52
This chapter described the main monitoring project in general, whereas the articles (Chapter 5,
Chapter 6 and Chapter 7) used data from various cohorts within the main study to investigate
ways to resolve measurement challenges. The articles in this thesis had the overall aim to apply
Rasch models to explore ways to improve measurement in the social sciences as well as solve
measurement challenges within an educational context. The challenges addressed included
dealing with missing data, tracking learning progress over time and providing criterion-
referenced feedback to stakeholders, all of which is based on the data and study described in
this chapter. The study in this thesis falls in the arena of research methods in psychology, more
specifically psychometrics. The study investigates statistical validity (Garcia-Perez, 2012) and
how to use results in a practical and statistically valid way for real world impact and academic
integrity. The main monitoring study provided the data as well as the challenges, and this thesis
contains the exemplars of how the measurement challenges in the study were addressed.
©University of Pretoria 53
Chapter 5 - Multiple Imputation for Dichotomous
MNAR Items Using a Recursive Structural Equation
Model with Rasch Measures as Predictors
Authors: Combrinck, C., Scherman, V., Maree, D. & Howie, S.
Publication: February 2018
5.1 Abstract
Missing Not at Random (MNAR) data present challenges for the social sciences, especially
when combined with Missing Completely at Random (MCAR) data for dichotomous test items.
Missing data on a Grade 8 Science test for one school out of seven could not be excluded as
the MNAR data were required for tracking learning progression onto the next grade. Multiple
Imputation (MI) was identified as a solution, and the missingness patterns were modelled with
IBM Amos applying a Recursive Structural Equation Model (SEM) for 358 cases. Rasch
person measures were utilized as predictors. The final imputations were done in SPSS with
logistic regression Multiple Imputation. Diagnostic checks of the imputations showed that the
structure of the data had been maintained, and that differences between MNAR and non-
MNAR missing data had been accounted for in the imputation process.
Keywords: Missing Not at Random (MNAR) data; Multiple Imputation (MI); Rasch person
measures; Structural Equation Modelling (SEM); Dichotomous or binary items; Social Science
Methods
5.2 Introduction
Perfect data sets do not exist in the real world, and missing data is an authentic challenge facing
social science analysts and researchers. Missing values can bias analyses, especially when high
percentages are missing or there are patterns in the missingness (Allison, 2002; Osborne, 2013;
Wang, Bartlett & Ryan, 2017). The higher the percentage of missing values, the greater the
potential problems (Bennet, 2001; Osborne, 2013). Consequently, the handling of missing data
has been a topical issue in social sciences and methods dealing with missing values have grown
exponentially (Enders, 2010; Little & Rubin, 2002; Peng, Stuart & Allison, 2015; Rubin, 1987;
©University of Pretoria 54
van Buuren, 2012). Treating missing data as incorrect responses and excluding cases, which is
a common practice in large-scale assessments, could lead to significantly biased item parameter
estimates (Hohensinn & Kubinger, 2011; Rose, Schiller, von Davier & Xu, 2010). Model-based
approaches are recommended for handling missing data that provide the opportunity to
consider the likelihood of responding and ability (Peugh & Enders, 2004; Mayer, Muche &
Hohl, 2012; Yucel, 2011).
As methods for handling missing data become easier to access, their limitations, including the
evaluation of imputations and reporting, should be given more attention (Cox, McIntosh,
Reason & Terenzini, 2014; Graham, 2012; Little & Rubin, 2002; van Buuren, 2012). Some
forms of missing data, such as Missing Not at Random (MNAR) data, warrant further research,
which complicates the use of missing data handling techniques as data missing randomly is an
assumption of many imputation methods (Galimard, Chevret, Protopopescu & Resche‐Rigon,
2016). In longitudinal research, large-scale assessments, high-stake studies, and research
designs which gather sensitive data, missing data are particularly problematic, and could
impact statistical validity (Mallinckrodt, Roger, Chuang-stein, Molenberghs, Lane, O’kelly &
Thijs, 2013a; Peng et al, 2003). The most popular and recommended methods for handling
missing data, such as Multiple Imputation (MI) and Maximum Likelihood Estimation (ML),
were originally developed for continuous variables with the assumption of a normal
distribution for data Missing at Random (MAR) or data Missing Completely at Random
(MCAR). Some studies have found that when missingness mechanisms are investigated, MI
can be used for MNAR data (Baraldi & Enders, 2010).
5.3 Current Study
This paper reports on a practical application of Multiple Imputation (MI) using Structural
Equation Modelling (SEM) to model the missingness of MNAR dichotomous data using Rasch
person measures as predictors. The data contained a combination of MNAR and MCAR
dichotomous test anchor items. Data are Missing Not at Random (MNAR) when missingness
on a variable is directly related to the outcome variable (for example, Science proficiency)
(Enders, 2010; Graham, 2012; Kim & Shao, 2014; van Buuren, 2012). When data are missing
due to underlying patterns and variables in the model, the mechanism of missingness is non-
ignorable (Wang et al., 2017). The percentage of missing data can be used to guide the selection
of methods to handle the missingness: with less than 5% of missing values, listwise or pairwise
©University of Pretoria 55
deletion is an option as long as MAR data are present (Allison, 2002). Greater percentages of
missing data may cause bias in analyses and should be investigated and other options, such as
Multiple Imputation should be considered (Mallinckrodt, Lin & Molenberghs, 2013a;
McPherson et al., 2015; Roberts, Sullivan & Winchester, 2017).
The study included seven independent high schools in South Africa. The schools are parts of a
coalition and are sponsored by a funding agent. The funding agent required a set of year-end
assessments to evaluate curriculum knowledge and to ensure that all students in the schools
had achieved the same standards. Science assessment instruments were designed for Grades 8
to 11. During the yearly assessment of the 8th Grade students, one school received a copy of
the Science test that did not contain the anchor (common) items. This was due to a printing
error. The missing data for the anchor items could not be classified as missing randomly as
they were completely missing only for that school. The missing data can be classified as
Missing Not At Random (MNAR) because their absence from the test was unintended and not
part of a planned design. Furthermore, the school with the missing data were different from the
other six schools, as it had consistently higher score averages in all subjects. Using data from
the other schools in the sample to predict the missing data for the seventh school would have
led to the underestimation of achievement.
Treating data which are missing due to a specific variable, in this case one school, as missing
at random could have a biased effect on the imputation (Cleophas & Zwinderman, 2012;
Fielding, Fayers, McDonald, McPherson & Campbell, 2008). The assumption of missingness
has to be carefully investigated and conducting sensitivity analysis to assess the accuracy of
the imputations is essential (Fielding et al., 2008; Keene, Roger, Hartley & Kenward, 2014;
McPherson, Barbosa-Leiker, Mamey, McDonell, Enders & Roll, 2015). According to Roberts
et al. (2017), “Patterns of missingness dictate how data should be analyzed” (p.10). Based on
this specific case of missingness (MNAR), the study aimed to investigate and answer three
research questions:
1. How can MNAR missing data be imputed by modelling the missingness?
2. Which type of model and variables would best to predict the MNAR data and how
would the variables be identified?
3. What contribution could be made by Rasch scores in comparison with raw scores
to build more accurate MI models for missing item responses?
©University of Pretoria 56
5.4 Method
To link the assessments within each subject from one year to the next, common items (anchor
items) were included in the assessment design. The 8th grade tests were of particular importance
as they served as a baseline assessment of student ability and knowledge. The nine anchor items
were present in the tests completed by the other six schools but not the seventh school. This
meant crucial items that would be used for anchoring within the cohort were missing for one
school. For the school in which the items were not included in the test, the data were Missing
Not at Random (MNAR) and were directly related to variables in the data set, namely that of
school and science proficiency for tracking (anchoring). It was not possible to exclude the
missing data as it was crucial to have responses to the items for anchoring in the subsequent
year’s assessment. A hybrid approach was explored to handle the missing data. Hybrid
approaches are recommended for strengthening methods for handling missing data (Aste,
Boninsegna, Freno & Trentin, 2015).
5.4.1 Participants and Ethical Considerations
A total of 358 Grade 8 students from seven independent high schools completed the Science
assessment at the end of the academic year. Parents signed consent forms for testing
participation, as well as for the results to be used for research purposes. The average age of the
Grade 8 students was 15.53 years with a greater number of female participants (71.79%) than
males. The sample included a girls-only school, which accounts for the larger proportion of
females in the sample. The MNAR school, which received the test copies without the anchor
items, accounted for 18.15% of the total sample (65/358).
5.4.2 Instruments and Procedures
The assessments were designed to cover the South African National Curriculum (CAPS) and
measure the knowledge gained over the course of a year (Department of Basic Education,
2012). The Science assessments were administered at the seven schools at the end of each
academic year and were conducted using standardized procedures, with external evaluators
conducting the testing processes at each school. Examination conditions were maintained
during the assessments.
©University of Pretoria 57
4.4.3 Data Analysis
To address the problem of MNAR data for the dichotomous anchor items, this study
investigated methods to handle missing data when the mechanism for missingness is known.
IBM SPSS version 23 and IBM Amos were used in the analysis and a practical application of
modelling the missingness and imputing missing values, based on the model, was
demonstrated. Rasch person measures were identified as the most suitable predictors for the
missing scores. Rasch theory uses logistic regression models to estimate the likelihood of
answering a question correctly and creates an equal interval logit scale for persons and items
(Andrich, 2011; Bond & Fox, 2015; Dunne, Long, Craig & Venter, 2012; Linacre, 2016;
Uebersax, 1993). The Rasch models are quite resilient to missing data in general (Boone, Staver
& Yale, 2014; Bond & Fox, 2015, Linacre, 2016). Winsteps 3.75.0 was used to produce items
and person estimates before the imputation (Linacre, 2016). The measures for both persons and
items were rescaled from 0 to 100 to make the outputs easier to interpret. The anchor items did
not form a scale, and consequently could not be used as predictors; using Rasch person
measures addressed this challenge.
The data contained a combination of both MNAR data (one school did not have the anchor
items) and MCAR data (the other schools had the items but some students elected not to answer
some items). The composition of the two missingness mechanisms is shown in Table 1.
Multiple Imputation was chosen as the method to handle the missing data because it uses
multiple values to estimate parameters and explicitly accounts for the uncertainty associated
with missing data by reflecting the underlying variability (Enders, 2010; Rubin, 1976, 1987;
van Buuren, 2012). MI produces continuous imputations for categorical variables if multiple
linear regression is used, as opposed to logistic imputation (Cox et al., 2014). Rounding off
values so that illogical values fit the original variables’ scale has to be done with caution and
can be especially problematic for dichotomous items (Finch, 2010, 2011; Horton, Lipsitz &
Parzen, 2003). In addition, MI can be used for MNAR data when the missingness is modelled
(Dong & Peng, 2013; Horton & Kleinman, 2007; van Buuren, 2012). For ordinal data with a
monotone pattern, as was the case discussed in this paper, logistic regression was the preferable
method for imputation (Mayer et al., 2012; Schafer, 1999b). Mayer et al. (2012) recommend
using IBM Amos when the researcher knows the reason for missingness, in this way the
missingness can be modelled explicitly with SEM and the imputations will be based on the
model’s structure. The model can also be evaluated for fitness and refined so that the MI will
©University of Pretoria 58
have more accurate imputations which are based on the relationships within the data. It should
be noted that both the percentage of missing data and the sample size have an impact on the
MI model, and when sample sizes are small, such as N < 50 and missing greater than 20% of
values, bias can be introduced into the imputation process and results (Hardt, Herke, Brian &
Laubach, 2013).
For the current study, only the nine anchor items in the Grade 8 Science test needed to be
imputed. The highest percentage of missing values in this study was 30% for one of the
variables and the sample size of 358 was judged to be adequate to estimate the missing data.
When utilizing IBM Amos, Bayesian analysis is conducted for ordered-categorical data and
the Markov Chain Monte Carlo (MCMC) algorithm is employed to draw random values of the
parameters from joint posterior distributions (Arbuckle, 2014b; Grace, 2015; Poleto, Singer &
Paulino, 2011). When dichotomous variables are used in an Amos model, additional constraints
must be added to identify the model (Arbuckle, 2014a; IBM Corp., 2015; Grace, 2015). As
Multiple Imputation uses regression to predict outcomes, SEM is the next natural step and more
complex relationships among imputation variables can be specified. All of the anchor items to
be imputed were dichotomous, and functioned as endogenous variables in the model. For each
item, the residual mean and variance were fixed as 0 and 1, respectively (Arbuckle, 2014b).
Dichotomous variables have only one boundary, and to determine the origin and underlying
scale required for the variable, parameter constraints must be imposed. The constraints act as
priors, restricting the dichotomous variables to a range of 0 to 1. Further priors were not added
in this study, as the aim was to analyze the model for use in SPSS, and uninformative priors
were recommended for this purpose (Grace, 2009).
Modelling the MI in Amos allowed for the testing of several possible models, as well as
refining the model to obtain a model best suited for MI. SPSS was used to conduct the final MI
after modelling was completed in Amos, and the most appropriate model was used to specify
the imputation in SPSS. The main reason for using SPSS for the final imputations was that
SPSS has Logistic Regression Multiple Imputation as an option, which produces categorical
variables within the correct ranges. In contrast, Amos Bayesian multiple regression results
produce variables on a wider, continuous scale and this requires additional formulae for
rescaling and rounding (Graham, 2012). Using Amos to assess the model produced statistics
©University of Pretoria 59
such as regression weights and the posterior predictive p value (Nguyen, Lee & Carlin, 2015).
SPSS outputs limited statistics once the MI process has been conducted, making it challenging
for users of the MI function to assess the statistical validity of their model and imputations
(IBM Corp., 2012). In addition, SPSS does not provide an iteration history for categorical
variables (IBM Corp., 2014), which is where Amos proves to be a more advantageous tool.
The variables for use in the Multiple Imputation model were identified using Pearson’s
Correlation Coefficient (r) to assess the strength of the relationships. Possible predictors for
the MI process were investigated and included auxiliary variables such as gender, school and
age, as well as other items in the instrument, the imputation variables and the composite (total
test) scores. Only variables with small to large significant correlations found in the imputation
variables were used in models for predictive power and improved model functioning.
After the MI process had been performed in SPSS, sensitivity analysis was conducted to
compare non-imputed data to the imputations. In this step, the original anchor items were
compared to the imputed variables using the McNemar and Kruskal-Wallis tests to determine
if the original items differed statistically from the imputed variables when the results were
pooled (Schafer 1999a). Using a hybrid approach by combining SEM in Amos with MI in
SPSS led to a stronger imputation model, as the advantages of each program were utilized and
their limitations were negated.
5.5 Results
Table 5.1 shows the percentage of missing data per item, first showing the percentage of
missing values per item for all types of missingness (MCAR and MNAR), and then illustrating
the percentage missing only for MCAR. Anchor Item 4 has the largest percentage of missing
data at 30% of values missing (valid N = 250/358), with 14.68% of that being MCAR data. All
anchor items were dichotomous and for MCAR and MNAR data combined, 62.57% of cases
and 82.29% of values were complete. For MNAR data only, 76.45% of cases and 93.33% of
values were complete. The MCAR data accounted for 6.67% of missing values, whereas the
MNAR mechanism explained 11.04% of missing data (overall 17.72% of the values were
missing). A monotone pattern of missingness was identified due to data being missing for one
school in particular (IBM, 2013; Rezvan, Lee & Simpson, 2015). Little’s MCAR test of the
data for the schools where the items were completed, confirmed that the missing values were
MCAR for the other schools, χ2 = 195.269, df = 166, p = 0.06 (within SPSS version 23) (Little,
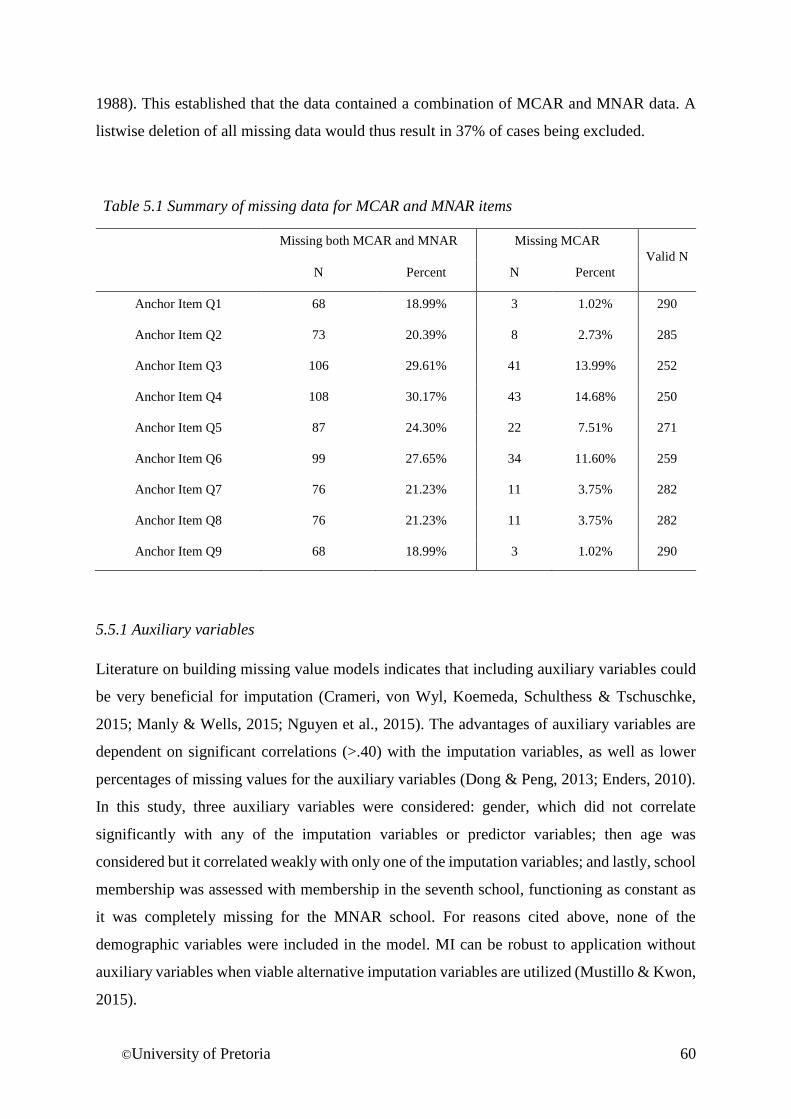
©University of Pretoria 60
1988). This established that the data contained a combination of MCAR and MNAR data. A
listwise deletion of all missing data would thus result in 37% of cases being excluded.
Table 5.1 Summary of missing data for MCAR and MNAR items
Missing both MCAR and MNAR Missing MCAR
Valid N
N Percent N Percent
Anchor Item Q1 68 18.99% 3 1.02% 290
Anchor Item Q2 73 20.39% 8 2.73% 285
Anchor Item Q3 106 29.61% 41 13.99% 252
Anchor Item Q4 108 30.17% 43 14.68% 250
Anchor Item Q5 87 24.30% 22 7.51% 271
Anchor Item Q6 99 27.65% 34 11.60% 259
Anchor Item Q7 76 21.23% 11 3.75% 282
Anchor Item Q8 76 21.23% 11 3.75% 282
Anchor Item Q9 68 18.99% 3 1.02% 290
5.5.1 Auxiliary variables
Literature on building missing value models indicates that including auxiliary variables could
be very beneficial for imputation (Crameri, von Wyl, Koemeda, Schulthess & Tschuschke,
2015; Manly & Wells, 2015; Nguyen et al., 2015). The advantages of auxiliary variables are
dependent on significant correlations (>.40) with the imputation variables, as well as lower
percentages of missing values for the auxiliary variables (Dong & Peng, 2013; Enders, 2010).
In this study, three auxiliary variables were considered: gender, which did not correlate
significantly with any of the imputation variables or predictor variables; then age was
considered but it correlated weakly with only one of the imputation variables; and lastly, school
membership was assessed with membership in the seventh school, functioning as constant as
it was completely missing for the MNAR school. For reasons cited above, none of the
demographic variables were included in the model. MI can be robust to application without
auxiliary variables when viable alternative imputation variables are utilized (Mustillo & Kwon,
2015).
©University of Pretoria 61
5.5.2 Predictor and imputation variables in the model
The anchor items had correlations with one another, ranging from non-existent (r = 0.002) to
weak (r = -0.273), with a principal component analysis showing that the nine anchor items did
not form a factor. Using the anchor items to predict missing values on one another was not
recommended, and when a saturated model was attempted, it failed to converge (Poleto., et al.,
2011, had similar findings when using a saturated model). The other test items in the
assessment were also considered; however, they only correlated well with some of the anchor
items to be imputed and thus could not be used as a group. Inclusion of all 79 items in the
model may have led to the over complication of the model (Hardt et al., 2013). As a result, two
types of composite (total test) scores were considered: raw composite scores and Rasch person
measures. The use of item composite scores creates a variable which contains all the
information from items without MNAR data, to predict MNAR variables. Correlations among
anchor items and raw composite variables showed small to moderate significant correlations
to the raw composite scores with five out of the nine anchor items (correlations ranged from r
= 0.128 to r = 0.424). The Rasch item measures of all items had small to moderate correlations
with six out of the nine anchor items having correlations that ranged from r = 0.133 to r =
0.360. The Rasch item measures variable, based only on anchor items, had small to large
correlations with all anchor items (r = 0.173 to r = 0.667).
5.5.3 The SEM model of missingness
The Structural Equation Model (SEM) of missingness, built for this particular study, was
specified as a recursive model. The imputation variables were the anchor items, nine items
which were all dichotomous, with 18-30% of the values missing in a combination of MCAR
and MNAR mechanisms. The predictor variables included the Rasch person measures of the
anchor items, as well as the Rasch person measures of all test items (excluding the anchor
items). The standardized direct effects (regression weights) indicated good predictive power
for each of the imputation variables, see Table 5.2. Both predictor 1 and 2 worked well in the
model due to their moderate correlation with each other at r = 0.352 (p = 0.000), as well as
small to large significant correlations with the imputation variables. In Amos, five imputations
were generated to assess the model and a total of 10 imputations were generated in SPSS (Dong
& Peng, 2013; Schafer, 1999a; White, Royston & Wood, 2011).
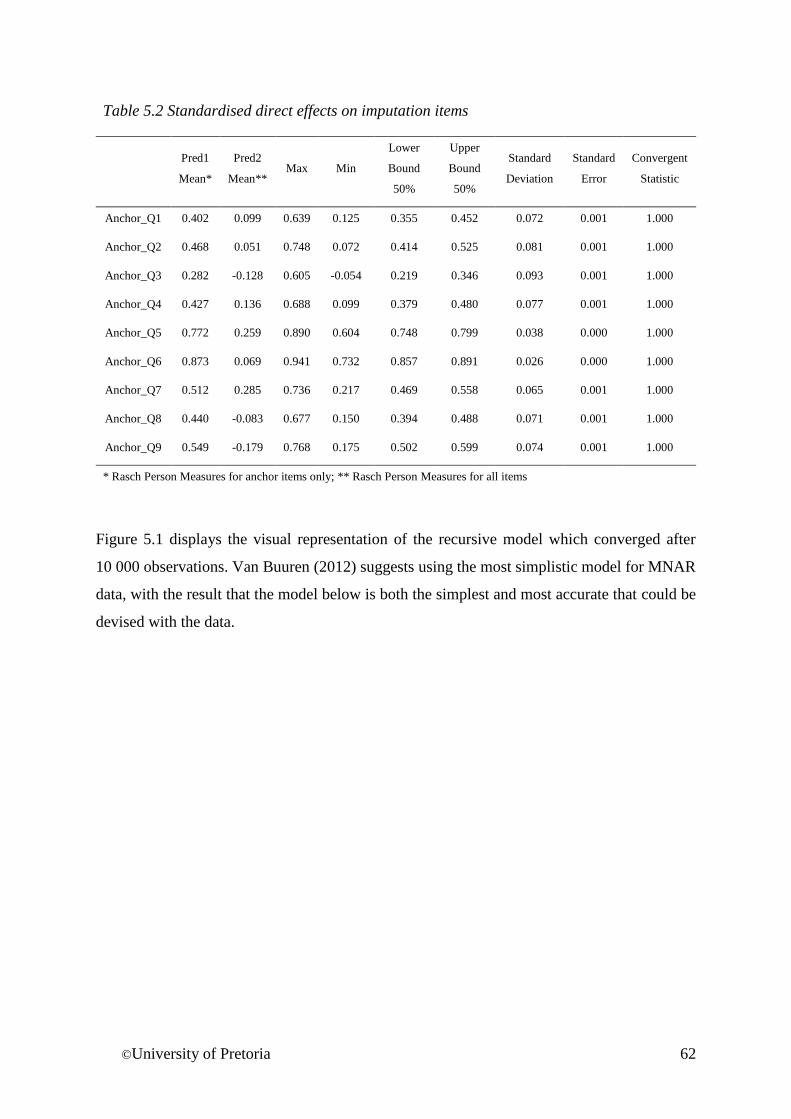
©University of Pretoria 62
Table 5.2 Standardised direct effects on imputation items
Pred1
Mean*
Pred2
Mean** Max Min
Lower
Bound
50%
Upper
Bound
50%
Standard
Deviation
Standard
Error
Convergent
Statistic
Anchor_Q1 0.402 0.099 0.639 0.125 0.355 0.452 0.072 0.001 1.000
Anchor_Q2 0.468 0.051 0.748 0.072 0.414 0.525 0.081 0.001 1.000
Anchor_Q3 0.282 -0.128 0.605 -0.054 0.219 0.346 0.093 0.001 1.000
Anchor_Q4 0.427 0.136 0.688 0.099 0.379 0.480 0.077 0.001 1.000
Anchor_Q5 0.772 0.259 0.890 0.604 0.748 0.799 0.038 0.000 1.000
Anchor_Q6 0.873 0.069 0.941 0.732 0.857 0.891 0.026 0.000 1.000
Anchor_Q7 0.512 0.285 0.736 0.217 0.469 0.558 0.065 0.001 1.000
Anchor_Q8 0.440 -0.083 0.677 0.150 0.394 0.488 0.071 0.001 1.000
Anchor_Q9 0.549 -0.179 0.768 0.175 0.502 0.599 0.074 0.001 1.000
* Rasch Person Measures for anchor items only; ** Rasch Person Measures for all items
Figure 5.1 displays the visual representation of the recursive model which converged after
10 000 observations. Van Buuren (2012) suggests using the most simplistic model for MNAR
data, with the result that the model below is both the simplest and most accurate that could be
devised with the data.
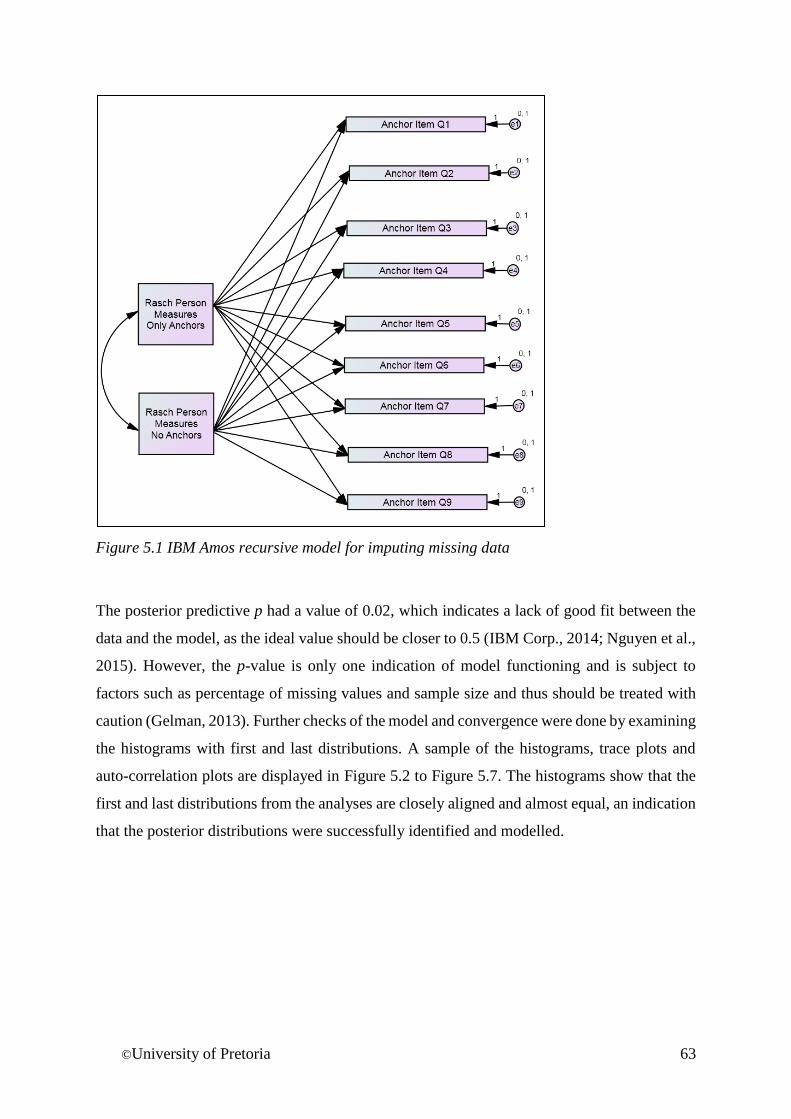
©University of Pretoria 63
Figure 5.1 IBM Amos recursive model for imputing missing data
The posterior predictive p had a value of 0.02, which indicates a lack of good fit between the
data and the model, as the ideal value should be closer to 0.5 (IBM Corp., 2014; Nguyen et al.,
2015). However, the p-value is only one indication of model functioning and is subject to
factors such as percentage of missing values and sample size and thus should be treated with
caution (Gelman, 2013). Further checks of the model and convergence were done by examining
the histograms with first and last distributions. A sample of the histograms, trace plots and
auto-correlation plots are displayed in Figure 5.2 to Figure 5.7. The histograms show that the
first and last distributions from the analyses are closely aligned and almost equal, an indication
that the posterior distributions were successfully identified and modelled.
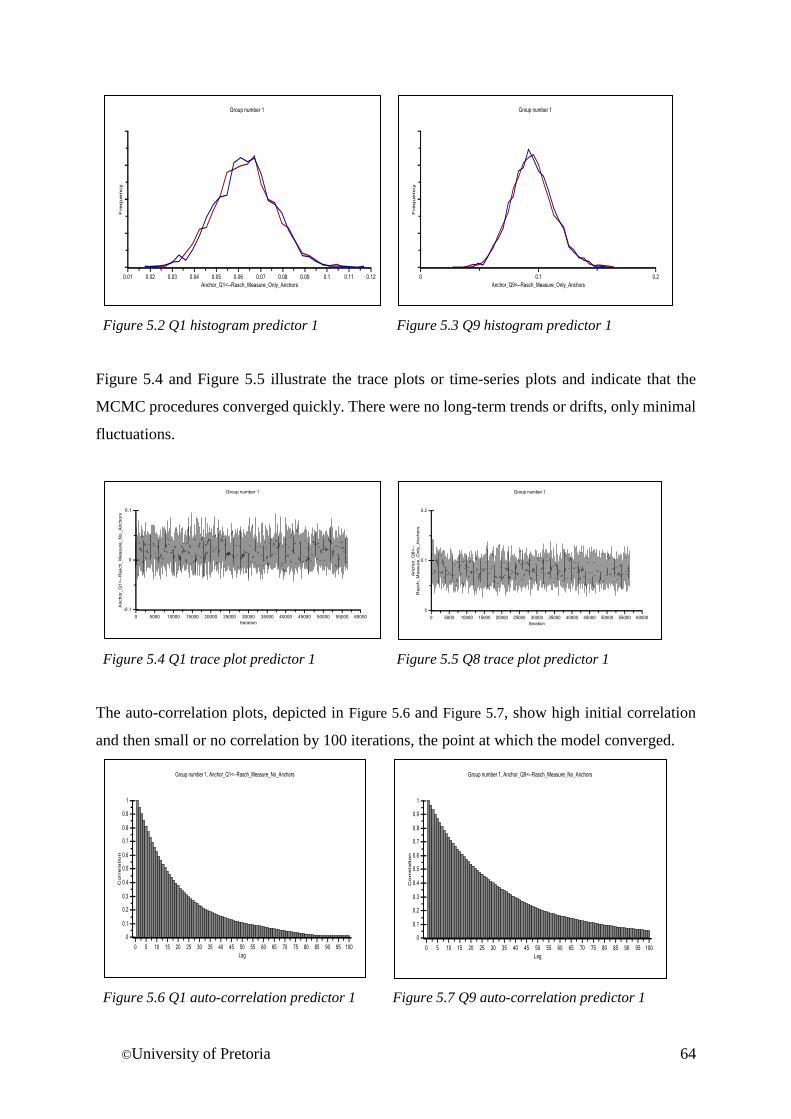
©University of Pretoria 64
Figure 5.2 Q1 histogram predictor 1 Figure 5.3 Q9 histogram predictor 1
Figure 5.4 and Figure 5.5 illustrate the trace plots or time-series plots and indicate that the
MCMC procedures converged quickly. There were no long-term trends or drifts, only minimal
fluctuations.
Figure 5.4 Q1 trace plot predictor 1 Figure 5.5 Q8 trace plot predictor 1
The auto-correlation plots, depicted in Figure 5.6 and Figure 5.7, show high initial correlation
and then small or no correlation by 100 iterations, the point at which the model converged.
Figure 5.6 Q1 auto-correlation predictor 1 Figure 5.7 Q9 auto-correlation predictor 1
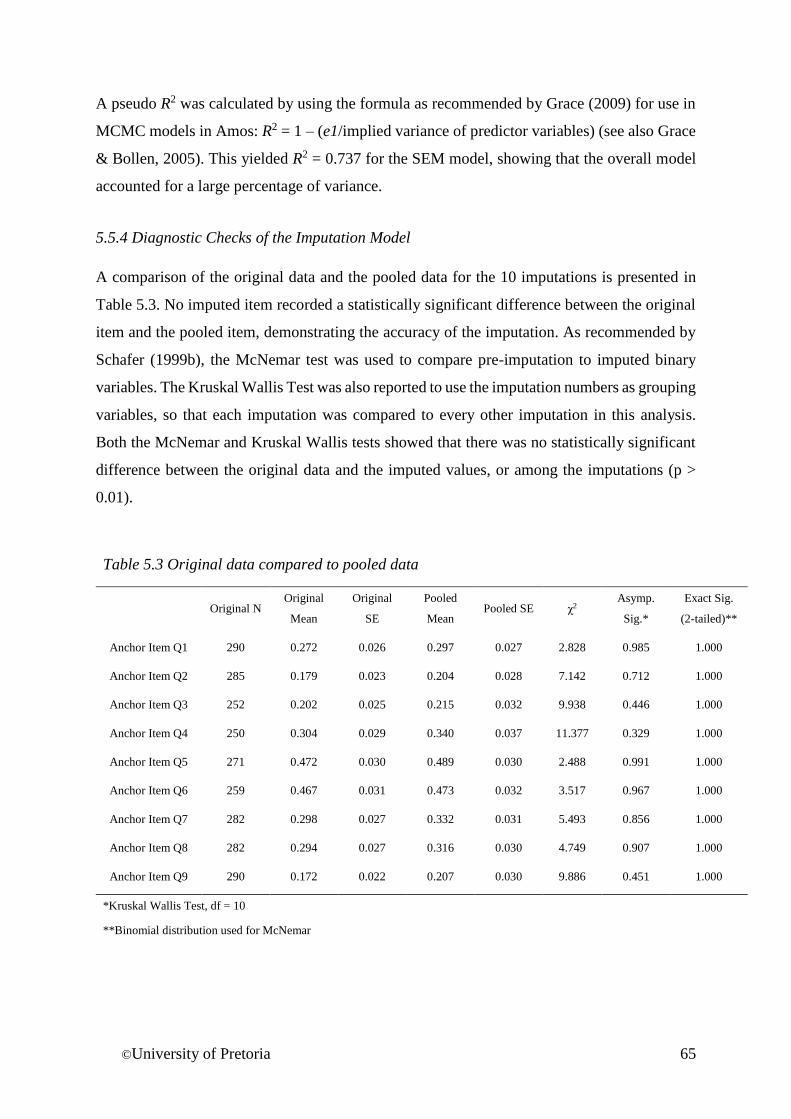
©University of Pretoria 65
A pseudo R2 was calculated by using the formula as recommended by Grace (2009) for use in
MCMC models in Amos: R2 = 1 – (e1/implied variance of predictor variables) (see also Grace
& Bollen, 2005). This yielded R2 = 0.737 for the SEM model, showing that the overall model
accounted for a large percentage of variance.
5.5.4 Diagnostic Checks of the Imputation Model
A comparison of the original data and the pooled data for the 10 imputations is presented in
Table 5.3. No imputed item recorded a statistically significant difference between the original
item and the pooled item, demonstrating the accuracy of the imputation. As recommended by
Schafer (1999b), the McNemar test was used to compare pre-imputation to imputed binary
variables. The Kruskal Wallis Test was also reported to use the imputation numbers as grouping
variables, so that each imputation was compared to every other imputation in this analysis.
Both the McNemar and Kruskal Wallis tests showed that there was no statistically significant
difference between the original data and the imputed values, or among the imputations (p >
0.01).
Table 5.3 Original data compared to pooled data
Original N Original
Mean
Original
SE
Pooled
Mean Pooled SE χ2
Asymp.
Sig.*
Exact Sig.
(2-tailed)**
Anchor Item Q1 290 0.272 0.026 0.297 0.027 2.828 0.985 1.000
Anchor Item Q2 285 0.179 0.023 0.204 0.028 7.142 0.712 1.000
Anchor Item Q3 252 0.202 0.025 0.215 0.032 9.938 0.446 1.000
Anchor Item Q4 250 0.304 0.029 0.340 0.037 11.377 0.329 1.000
Anchor Item Q5 271 0.472 0.030 0.489 0.030 2.488 0.991 1.000
Anchor Item Q6 259 0.467 0.031 0.473 0.032 3.517 0.967 1.000
Anchor Item Q7 282 0.298 0.027 0.332 0.031 5.493 0.856 1.000
Anchor Item Q8 282 0.294 0.027 0.316 0.030 4.749 0.907 1.000
Anchor Item Q9 290 0.172 0.022 0.207 0.030 9.886 0.451 1.000
*Kruskal Wallis Test, df = 10
**Binomial distribution used for McNemar
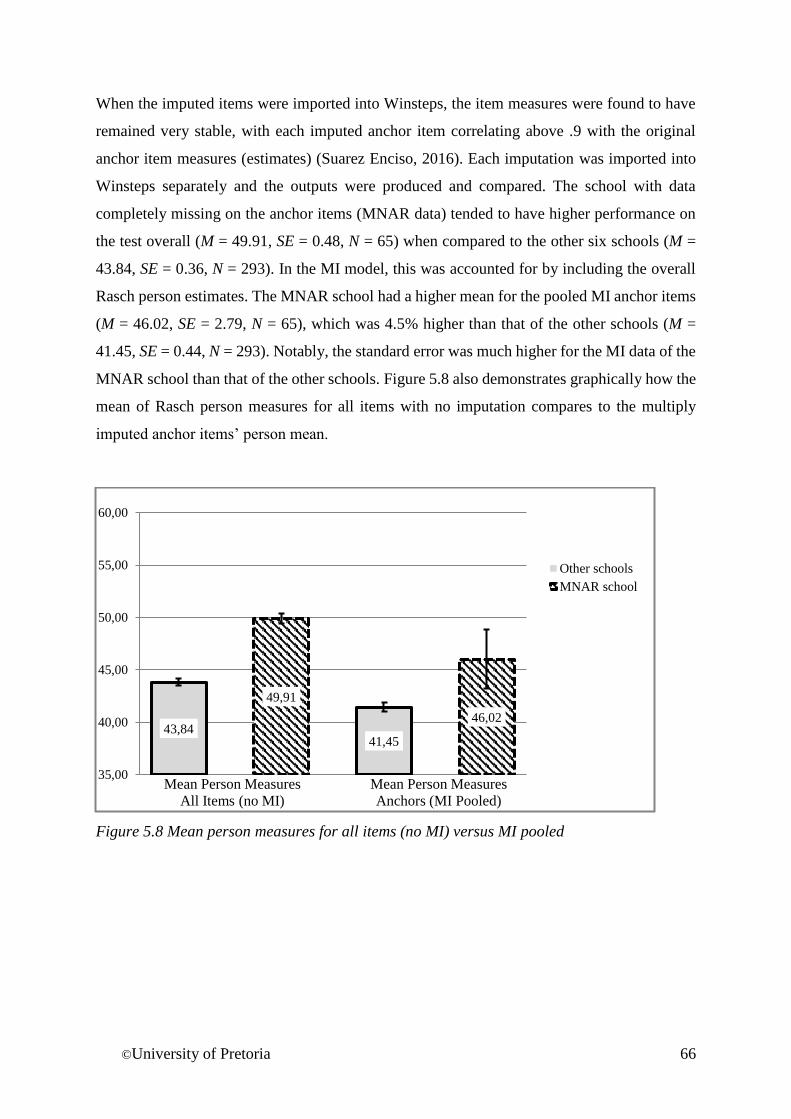
©University of Pretoria 66
When the imputed items were imported into Winsteps, the item measures were found to have
remained very stable, with each imputed anchor item correlating above .9 with the original
anchor item measures (estimates) (Suarez Enciso, 2016). Each imputation was imported into
Winsteps separately and the outputs were produced and compared. The school with data
completely missing on the anchor items (MNAR data) tended to have higher performance on
the test overall (M = 49.91, SE = 0.48, N = 65) when compared to the other six schools (M =
43.84, SE = 0.36, N = 293). In the MI model, this was accounted for by including the overall
Rasch person estimates. The MNAR school had a higher mean for the pooled MI anchor items
(M = 46.02, SE = 2.79, N = 65), which was 4.5% higher than that of the other schools (M =
41.45, SE = 0.44, N = 293). Notably, the standard error was much higher for the MI data of the
MNAR school than that of the other schools. Figure 5.8 also demonstrates graphically how the
mean of Rasch person measures for all items with no imputation compares to the multiply
imputed anchor items’ person mean.
Figure 5.8 Mean person measures for all items (no MI) versus MI pooled
43,84
49,91
41,45
46,02
35,00
40,00
45,00
50,00
55,00
60,00
Other schools
MNAR school
Mean Person Measures
All Items (no MI)
Mean Person Measures
Anchors (MI Pooled)
©University of Pretoria 67
5.6 Discussion
The quality of analyses and findings improves when researchers acknowledge missing data,
investigate the reasons thereof and actively find ways to deal with the missing values
(Carpenter, Bartlett & Kenward, 2010; Manly & Wells, 2015; Peng, Harwell, Liou & Ehman,
2003). By building SEM models with Bayesian analysis to find the best model and assess the
convergence, an MI model could be structured for imputations in SPSS using logistic
regression. Using IBM Amos, a recursive model was built with Rasch person measures as
predictors, and had one predictor based on all items and the other on the anchor items only.
The result was that the Rasch person measures were better predictors compared with using
composite scores of the raw values, and as a result, the recursive model worked best. Other
models were attempted, such as a saturated model and possible path models with either both
or one of the Rasch person measures or with the raw composite scores, but these models either
failed to converge or had poor model fit. Poor fit for the other models is attributed to the fact
that the imputation variables did not form a scale. Finding good predictors for MI models
should be done by identifying variables that correlate moderately to highly with the imputation
variables. For this reason, imputation items alone could not be utilized in the model. This is
where the Rasch scores were useful, since they created an estimate of persons which was on an
equal interval scale, thus providing a more accurate measure. The Rasch measures also
provided significant correlations with the imputation variables while maintaining the pattern
of performance between the MNAR school and the other schools with MCAR missing data.
IBM Amos provided a way to model the missingness and check model functioning. In addition,
Amos produced continuous imputation variables for MI. Considering the problems caused by
rounding off variables and the importance of using the correct MI method for the type of
variables imputed, the model constructed in Amos was used as the guideline for imputation in
SPSS (hybrid approach). Checks of the multiply imputed variables from SPSS showed that
they maintained the structure of the original variables with similar means, standard deviations
and standard errors. The imputed variables were not statistically different from the original
variables (p = 1.000). The MNAR school had a higher mean for all items in comparison with
the other schools in the test. This pattern was maintained by the MI model, with the multiply
imputed anchor items of the MNAR school having a 4.5% higher mean than that of the other
schools after imputation. This is similar to the original pattern of the other items in the
assessment, which had on average 6.0% higher means for the MNAR school items (see Figure
©University of Pretoria 68
8). The impact of the MI on the measurement model was also investigated and it was found
that the item and person parameters remained stable and highly correlated with the original
estimates. However, for the MNAR school, it should be noted that the imputations increased
the standard error.
5.7 Conclusion
MI is mainly conducted by assuming data are MAR or MCAR and the imputation variables are
used as both predictors and imputed variables. Imputations are often conducted without
checking the accuracy of the predictors (Kim & Shao, 2014; Osbourne, 2013). Factors such as
the missingness mechanism, the strength of the predictors in the MI model, variable types for
imputation (such as dichotomous items) and ways to improve the MI model should be
considered and the statistical validity should be strengthened. MNAR data are especially
challenging to handle and this paper is one demonstration of how to take important factors into
consideration and to use MI for dichotomous MNAR items. Other applications have been
carried out with different types of MNAR data and in various disciplines using a variety of
approaches (see for example Galimard et al., 2016; Poleto et al., 2011; Wang et al., 2017). The
study described in this paper adds value due to its realistic set up, and demonstrates a single
application of MI using SEM to model the missingness and Rasch scores as predictors. If
missingness can be modelled, then the best identified model can be used to specify the
imputation process. The usefulness of Rasch scores as predictors was also explored, as well as
the impact of MI values on the measurement model. The following steps were used and could
be considered for similar studies:
(1) The missingness mechanism was known, and correlations of demographic and other
variables with the missing values were calculated to find potential predictor variables.
(2) The MNAR data were modelled with Structural Equation Models (SEMs) to find the
model that best predicted the missingness mechanism.
(3) Predictors were identified by calculating the correlations among imputation variables,
as well as composite scores (outcome variables) and demographic variables. Only
predictors that had significant correlations with the imputation variables were used in
the model. Rasch scores were used as they had higher correlations with the anchor items
than raw total test scores (imputation variables).
(4) Logistic Regression Multiple Imputation was utilized for the dichotomous anchor
items.
©University of Pretoria 69
(5) The imputation model was checked statistically by comparing the imputed variables
with the original. For the Structural Equation Model, the convergence statistics,
goodness of fit and other indicators, such as graphs and plots were checked for evidence
of convergence and goodness of fit. A pseudo R2 was calculated for the model.
(6) The measurement model was assessed by comparing how the imputations affected the
item and person parameters.
Multiple Imputation has become less complicated to apply, particularly with the availability of
statistical programs. Thus, the onus rests on the researcher to investigate the underlying
assumptions before applying MI and finding the most accurate models with which to predict
the missing data (Fielding et al., 2008). It also highlights the importance of strong predictors
in MI models and checking the imputation model after imputations have been completed.
This study was conducted on a relatively small sample (N = 358) and it is suggested that larger
studies with more dichotomously scaled items or ordered categorical variables could expand
knowledge in this area. Several methods are available to deal with MNAR data, including many
different software packages (Mayer et al., 2012). It is recommended that researchers learn how
to handle missing data with software they are familiar with and that they should examine the
advantages and disadvantages of their software for imputing missing data. Researchers should
take into consideration assumptions of imputation models, limitations and sensitivity analyses
when handling missing data. More research is needed in educational and psychological
disciplines so that guidelines can be established for imputing data for special cases, especially
where anchor items are concerned, as well as for MNAR dichotomous test items.
©University of Pretoria 70
Chapter 6 - Evaluating Anchor Items and Reframing
Assessment Results through a Practical Application of
the Rasch Measurement Model
Authors: Combrinck, C., Scherman, V. & Maree, D.
Publication: October 2017
6.1 Abstract
The monitoring of learning over time is critical for determining progression within and across
cohorts of learners. This research investigated the use of the Rasch Measurement Model to
determine the functioning of anchor items as well as an application of the model to convert the
results to the same metric. A group of 321 Grade 8 learners and the same in the following
school year wrote English Additional Language Comprehension Tests aimed at monitoring
learning progression over years. The two tests were linked with 15 anchor items. This study
examined the results of the anchor items from Years 1 and 2, applying non-parametric
statistical tests as well as the Rasch Partial Credit Model to identify items which did not
contribute to monitoring learning progression; these items were removed or refined based on
the results and reviews by subject specialists. Learner results from Grades 8 and 9 were placed
in the same frame of reference by applying the Rasch Partial Credit Model in order to establish
a more accurate representation of the magnitude of learning progression. The first finding
illustrated that applying non-parametric statistics and Rasch Measurement Theory identifies
potentially problematic anchor items, and that when items are improved or removed, the overall
results tend to be more stable and precise. Second, it was found that when applying Rasch item
and threshold calibrations to assessment results, a more accurate indication of learning
progression is obtained which can be used to communicate results to stakeholders and more
importantly, inform teaching and learning.
Keywords
Anchor items, item and threshold calibration, monitoring learning progression, Rasch
Measurement Model, Rasch Partial Credit Model, stacking
©University of Pretoria 71
6.2 Introduction
The accurate monitoring of learning progression is a key issue in psychological and educational
assessment design. Designing anchor items, finding methods to analyse such items for tracking
learning progression, and reporting these findings in useful ways is crucial if monitoring
systems are to serve their purpose and have a positive influence on educational settings
(Wilson, 2009).
Monitoring change in learner understanding over time is a complex task and fraught with
difficulties. This might well be the reason for a shift in thinking regarding interventions to focus
on the issue of teacher training and measuring change in teacher understanding of the content
topic over time (Cunningham & Bradley, 2010). One of the major challenges of monitoring
learner progression is controlling for extraneous variables, especially where the cognitive
development of learners is concerned. This article examines ways in which to determine the
usefulness of anchor items as well as the application of the Rasch Measurement Model (Rasch
Measurement Theory [RMT]) to more accurately report on learning progression.
Monitoring progress is significant for a variety of reasons, which include providing
accountability and information for citizens on the quality of an educational system. Measuring
change over time is challenging, with some studies finding less predictive validity for interim
measurements throughout the year (Petscher, Cummings, Biancarosa & Fien, 2013) while
others show the value of interim monitoring for predicting future performance (Safer &
Fleischman, 2005; Scherman, 2007). Identifying ways to monitor performance is of utmost
importance, and finding ways in which to do so accurately even more so (Bercher, 2012;
Scherman, 2007). Proponents of external assessments, as well as critics of such systems, have,
for decades, argued about the value of monitoring (Popham, 1987). This raises a key question
about the value attached to the monitoring system, as learners, teachers, schools, or external
agents may perceive its significance in various ways (Williams & Ryan, 2000). The impact of
the assessments will, however, be determined by the nature of the feedback and the manner in
which the results are used to inform the schooling system (Lyon, Gettman, Roberts & Shaw,
2015; Stecker & Fuchs, 2000; Van Acker, 2002). A balanced and fair perspective is needed of
the role that monitoring assessments play in the schooling system and the value attached to
them.
©University of Pretoria 72
For this study, an association of independent high schools, with an external funding agency,
requested the development of a monitoring system to determine the level of teaching and
learning across a group of schools. The testing system was intended to serve as an
accountability system but had an added advantage in that it was specifically designed to give
feedback on performance to schools, teachers, and learners. The English Additional Language,
Mathematics and Natural Science assessment instruments were designed, piloted, and refined,
to be administered at the end of each year to all learners in Grades 8–11. Upon further
discussion, it was determined that tracking learner progression should be an additional aim of
the monitoring system. Anchor items were designed for the three subjects to link the grades
(8–11) and monitor learning progression. The schools recruit from low resourced communities
and low functioning schools, focusing on learners who have the potential to perform better if
placed in a resource-rich environment. The medium of instruction at the schools is English but
as learners are not English Home Language speakers, English as an additional language is
offered for learners to acquire and develop the English language skills necessary for learning.
This context has made it crucial to track learner progression, to ascertain whether the schools
have made a difference beyond that of expected development, and the level of development
that could have been expected if learners had remained in their previous educational
environments.
During the progression of the study, the researchers became critically aware of the challenges
of monitoring learning progression, especially in the case of language development as a
medium for learning in second language speakers. The design of the tests presented both
measurement and conceptual challenges. One of these challenges was tracking learning
progression in a subject such as English Additional Language, when the processes of language
development are so integrated, complex, and varied. Another difficulty was measuring learners
in the same frame from year to year, so that measurement is done consistently despite the fact
that learners have changed within that year (developed into new versions of themselves).
Learners constantly develop and change, and therefore one cannot assume that using the same
items would result in measuring the same persons in the same way. This study examined and
compared anchor items in the Grade 8 and Grade 9 English language comprehension
assessments, both the total scores of the anchor items and the scores of the individual anchor
items. Parametric and non-parametric statistical tests, as well as the Rasch Partial Credit Model,
were applied to address the following research questions: (1) To what extent does each anchor
©University of Pretoria 73
item contribute to tracking/monitoring progression? (2) How can the Rasch Measurement
Model be used to more accurately monitor learning progression and report results?
6.3 Method
6.3.1 Participants
Schools in the association are found in rural Limpopo, near Durban in Kwa-Zulu Natal, two
schools near Cape Town and three schools in Gauteng located in or near informal settlements.
All seven schools were included in the study which meant that all learners participated;
therefore, the full population was assessed. As the schools follow a unique implementation of
the curriculum, and is structured differently in terms of smaller class size, providing Saturday
and holiday classes resulting in a more intensive focus on academic achievement, the learners
are considered to be a specific population with unique characteristics.
A total of 321 learners wrote the English Additional Language comprehension test at the end
of Grade 8 in November 2012, and then wrote a different English Additional Language
comprehension test at the end of Grade 9 in November 2013; however, both tests had an anchor
passage with 15 shared items based on that passage. In November 2012, the learner mean age
was 14.1, and in November 2013 the mean age was 15.1, resulting in an age range of 5.78 and
a standard deviation (SD) of .653. A total of 96% of the sample ranged between the ages of 13
and 15 years for Grade 8 and between 14 and 16 years for Grade 9, a range that is within the
grade appropriate range. More girls (78%) than boys (22%) constituted the sample which
included a girls-only school as well as other co-educational schools. However, these tended to
have more girls (65% on average) than boys as schools reported that it was easier to recruit
girls than boys. As previously mentioned, learners were English additional language speakers
but received instruction through the medium of English language.
6.3.2 Instruments
The assessment instruments were two English Additional Language Comprehension tests, one
designed for Grade 8 and the other for Grade 9 learners. Both instruments had 15 common
items based on the same anchor passage. The tests were designed by subject specialists, piloted,
refined, and continuously updated so that they were aligned with the South African national
curriculum (Curriculum Assessment Policy Statements [CAPS]). The two language tests
©University of Pretoria 74
showed high reliability, with the Grade 8 test having a person reliability index of .83, and an
item reliability at .98 (Real root mean square error [RMSE]). The Grade 9 test had a person
reliability index of .81 and an item reliability of .98 (Real RMSE). (Additional information on
Rasch reliability indices is provided in the ‘data analysis’ section).
6.3.3 Procedure
The data collection took place in November of each year, and all learners in Grades 8–11 in
the seven schools wrote the English Additional Language, Mathematics, and Natural Science
assessments over 2 days. The assessments were administered by the monitoring agent and
administration procedures were standardised. Learners were instructed to answer the
assessments to the best of their ability, and were assured that feedback on their performance
would be given and that the results would inform classroom practice. The tests were scored by
specialist teachers and then moderated, after which all data were captured on item level and
analysed. The results were reported to the teachers, principals, and the funding agent, all of
which was facilitated through interactive workshops.
6.3.4 Ethical considerations
Ethical clearance was obtained from the Faculty of Education at the University of Pretoria. The
names of the learners, their parents, school personnel, and names of the schools were strictly
confidential. All steps were taken to ensure the conduct of an ethical research project, which
included obtaining informed assent from learners older than 16, full disclosure of how results
would be used, and consultation with stakeholders. Learners younger than 16 years old
obtained signed consent from their parents, whereas learners 16 years or older submitted both
a signed parental consent form as well as an assent form. The results were fed back into the
school system via interactive workshops with teachers to enhance both teaching and learning
and thus benefit all stakeholders. Learner motivation can be challenging when administering
external monitoring assessments. To encourage learners to participate fully, learners were
given content-level feedback with detailed descriptions of the skills and knowledge gained in
curriculum areas as well as new areas on which to focus. These reports were also sent to
teachers and parents. The possibility of including assessment results as a small percentage of
the final school mark was considered, but schools felt that this may disadvantage learners as
these assessments do not require prior study. However, learner results for English Additional
Language correlated highly with their school marks (r = .756, p < .01), providing concurrent
©University of Pretoria 75
validity that learners were performing at expected levels and were motivated to complete the
assessments as fully as possible. When learners were queried on their motivation to complete
the assessment, 10% responded not very, 48% moderately, and 42% responded being highly
motivated.
6.4 Data analysis
Rasch person and item reliabilities were used to assess the functioning of the instruments.
Reliabilities are calculated slightly differently in RMT than in Classical Test Theory (CTT).
CTT would calculate reliability on an overall standard error of the mean, whereas Rasch theory
calculates the standard error for each item or person. CTT uses Cronbach’s alpha as an
indication of reliability as it is hypothesised that all items should correlate highly in one
construct (Gliem & Gliem, 2003). RMT deviates from this model because in RMT, there is an
assumption that items differ from one another because they should measure different
difficulties (points) along the continuum (Clauser & Linacre, 1999; Linacre, 1997). RMT refers
to reliability values as separation indices and Linacre (2011) sets a minimum value of 2 as an
acceptable value for the person index, and for the item index, a minimum value of 1.5 is
required to measure individuals. Therefore, the reliability index is an indication of overall error
of measurement in the data, which is the reason Rasch theory uses the measures’ standard errors
to calculate the indexes for persons and items. Person reliability is equivalent to the traditional
Cronbach’s alpha, with reliabilities above .80 indicating 2–3 groups of ability being identified
in the sample. Item reliability has no traditional equivalent, but indicates whether a sample is
big enough to locate persons on the latent trait (Boone, Staver & Yale, 2014).
Measurement of change presents a nasty challenge. We expect persons (patients,
learners, experimental subjects) to change from Time 1 to Time 2. But the functioning
of test items and rating scales may also change, even when identical data collection
protocols are used. (Wright, 1996, p. 478)
According to Linacre (2011), a rule of thumb is that a minimum of 10 common items is needed
to prevent distortion of the measurement by problematic items. After problematic items are
removed, 10 items should remain. To examine the functioning of the 15 anchor items, items
were examined using several methods. First, the raw total percentages for the anchor items
from Year 1 (Grade 8) were compared with Year 2 (Grade 9) using paired samples t-tests to
©University of Pretoria 76
obtain a global view of whether all items, as a total score, indicated change from Grade 8 to
Grade 9. Next, the mean raw scores per item were examined and Wilcoxon’s Matched Pairs
Signed-Rank Test was applied to assess whether these raw scores indicated statistically
significant change. Effect sizes were calculated to determine the magnitude of the differences
found when applying t-tests and the Wilcoxon (Field, 2013). Effect sizes were calculated using
Pearson’s Correlation coefficient, r, as a standardised measure of effect size (Tabachnick &
Fidell, 2007). After conducting statistical tests on the raw scores, the Rasch Partial Credit
Model was applied independently to each year, then to stacked data and finally, calibrations
were applied to the Grade 9 anchor items. The Partial Credit Model was utilised as some items
were dichotomous and others were polytomous. The processes are described in more detail
below. The total sample size was 321, with the schools being considered a population.
6.5 Results
The raw total score percentages for Grades 8 and 9 were compared using the paired samples t-
test to ascertain whether the results from the items indicated change from Years 1 to 2. Grade
9 learners achieved discernibly higher mean score percentages (M = 46.631, SD = 16.558) than
in Grade 8 (M = 35.826, SD = 14.245). Pearson’s correlation coefficient was used as an effect
size and Cohen’s criteria for interpreting effect sizes applied (Cohen, 1988; Field, 2013). The
results were significant, t(320) = 13.102 (p < .0001) as can be seen in Table 6.1. A large effect
size, r = .591, was found for the differences between the Grade 8 and 9 results.
To investigate the usefulness of each item, the raw scores were examined. The items were
dichotomous with the exception of Item 8 (maximum score 3), and Items 11 and 15 (maximum
score 2). The dichotomous items were multiple-choice, whereas the other items were
constructed-response. In Winsteps, the guessing parameter can be estimated. Note that this is
still the one parameter model being applied, and the parameters for guessing are estimated but
do not form part of the calculation for the measures, either persons or items. With the Rasch
Measurement Model, guessing and carelessness would be classified as misfit, which is why it
is not parameterised when the data are fit to the model. When examining the output for an
estimation of the guessing parameter, Linacre’s guideline for a lower asymptote of .10 or
greater, was used. However, none of the problematic items had asymptotes greater than .10,
and therefore, guessing does not appear to be a reason for the possible problematic nature of
the items.
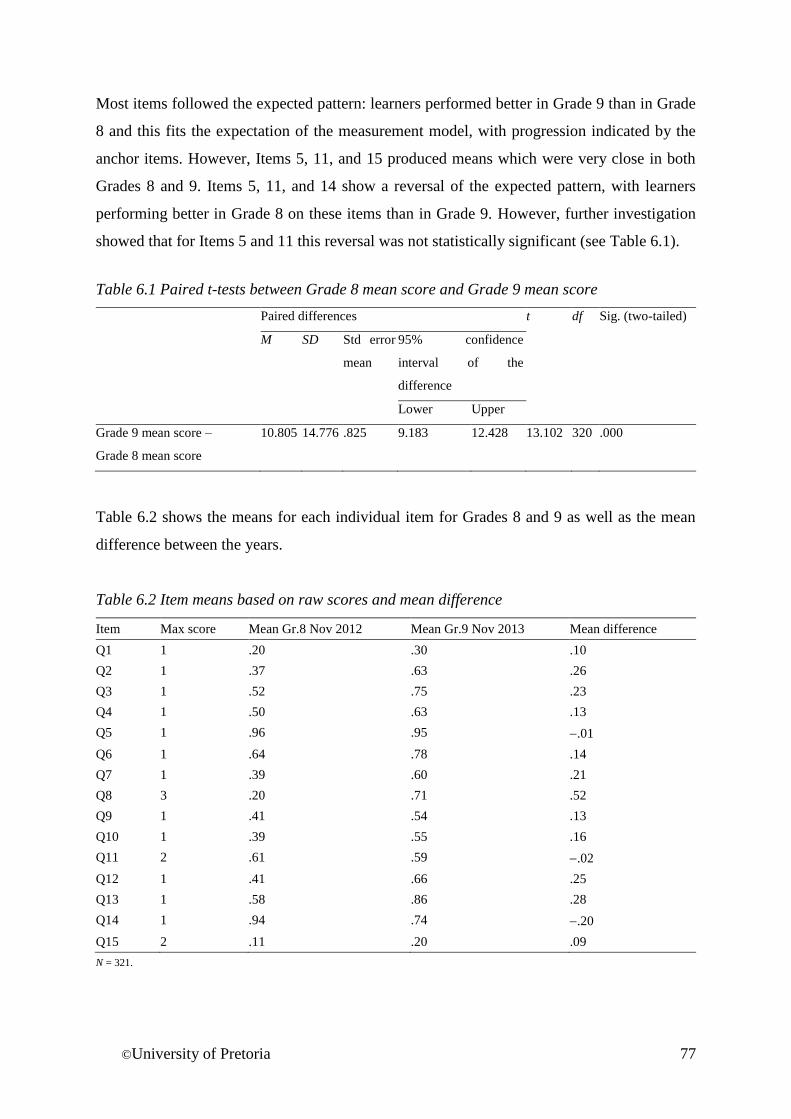
©University of Pretoria 77
Most items followed the expected pattern: learners performed better in Grade 9 than in Grade
8 and this fits the expectation of the measurement model, with progression indicated by the
anchor items. However, Items 5, 11, and 15 produced means which were very close in both
Grades 8 and 9. Items 5, 11, and 14 show a reversal of the expected pattern, with learners
performing better in Grade 8 on these items than in Grade 9. However, further investigation
showed that for Items 5 and 11 this reversal was not statistically significant (see Table 6.1).
Table 6.1 Paired t-tests between Grade 8 mean score and Grade 9 mean score
Paired differences t df Sig. (two-tailed)
M SD Std error
mean
95% confidence
interval of the
difference
Lower Upper
Grade 9 mean score –
Grade 8 mean score
10.805 14.776 .825 9.183 12.428 13.102 320 .000
Table 6.2 shows the means for each individual item for Grades 8 and 9 as well as the mean
difference between the years.
Table 6.2 Item means based on raw scores and mean difference
Item Max score Mean Gr.8 Nov 2012 Mean Gr.9 Nov 2013 Mean difference
Q1 1 .20 .30 .10
Q2 1 .37 .63 .26
Q3 1 .52 .75 .23
Q4 1 .50 .63 .13
Q5 1 .96 .95 .01
Q6 1 .64 .78 .14
Q7 1 .39 .60 .21
Q8 3 .20 .71 .52
Q9 1 .41 .54 .13
Q10 1 .39 .55 .16
Q11 2 .61 .59 .02
Q12 1 .41 .66 .25
Q13 1 .58 .86 .28
Q14 1 .94 .74 .20
Q15 2 .11 .20 .09
N = 321.
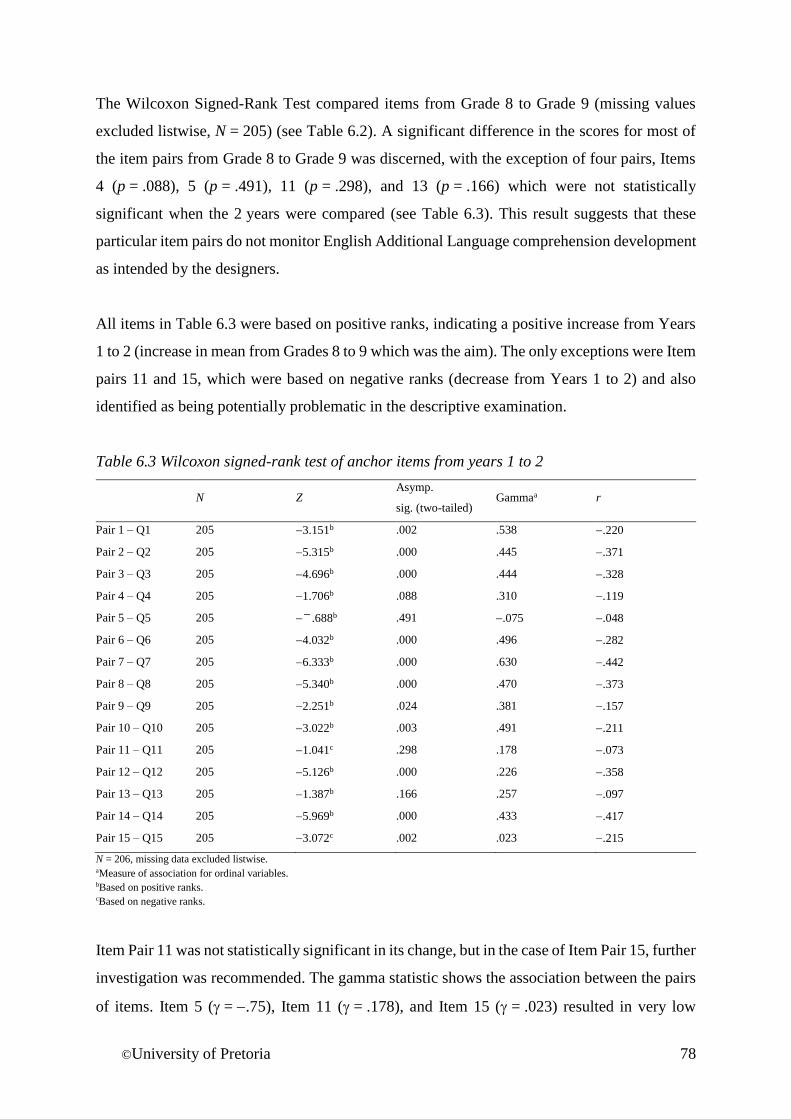
©University of Pretoria 78
The Wilcoxon Signed-Rank Test compared items from Grade 8 to Grade 9 (missing values
excluded listwise, N = 205) (see Table 6.2). A significant difference in the scores for most of
the item pairs from Grade 8 to Grade 9 was discerned, with the exception of four pairs, Items
4 (p = .088), 5 (p = .491), 11 (p = .298), and 13 (p = .166) which were not statistically
significant when the 2 years were compared (see Table 6.3). This result suggests that these
particular item pairs do not monitor English Additional Language comprehension development
as intended by the designers.
All items in Table 6.3 were based on positive ranks, indicating a positive increase from Years
1 to 2 (increase in mean from Grades 8 to 9 which was the aim). The only exceptions were Item
pairs 11 and 15, which were based on negative ranks (decrease from Years 1 to 2) and also
identified as being potentially problematic in the descriptive examination.
Table 6.3 Wilcoxon signed-rank test of anchor items from years 1 to 2
N Z Asymp.
sig. (two-tailed) Gammaa r
Pair 1 – Q1 205 3.151b .002 .538 .220
Pair 2 – Q2 205 5.315b .000 .445 .371
Pair 3 – Q3 205 4.696b .000 .444 .328
Pair 4 – Q4 205 1.706b .088 .310 .119
Pair 5 – Q5 205 .688b .491 .075 .048
Pair 6 – Q6 205 4.032b .000 .496 .282
Pair 7 – Q7 205 6.333b .000 .630 .442
Pair 8 – Q8 205 5.340b .000 .470 .373
Pair 9 – Q9 205 2.251b .024 .381 .157
Pair 10 – Q10 205 3.022b .003 .491 .211
Pair 11 – Q11 205 1.041c .298 .178 .073
Pair 12 – Q12 205 5.126b .000 .226 .358
Pair 13 – Q13 205 1.387b .166 .257 .097
Pair 14 – Q14 205 5.969b .000 .433 .417
Pair 15 – Q15 205 3.072c .002 .023 .215
N = 206, missing data excluded listwise. aMeasure of association for ordinal variables. bBased on positive ranks. cBased on negative ranks.
Item Pair 11 was not statistically significant in its change, but in the case of Item Pair 15, further
investigation was recommended. The gamma statistic shows the association between the pairs
of items. Item 5 ( = .75), Item 11 ( = .178), and Item 15 ( = .023) resulted in very low
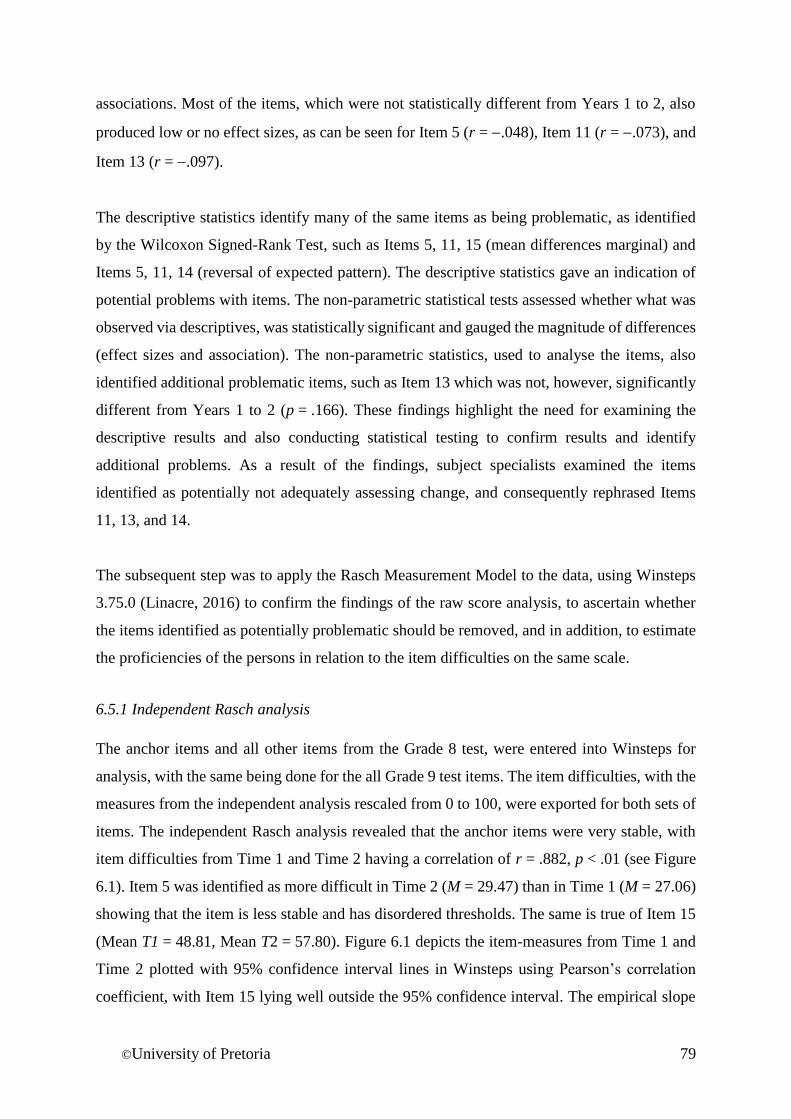
©University of Pretoria 79
associations. Most of the items, which were not statistically different from Years 1 to 2, also
produced low or no effect sizes, as can be seen for Item 5 (r = .048), Item 11 (r = .073), and
Item 13 (r = .097).
The descriptive statistics identify many of the same items as being problematic, as identified
by the Wilcoxon Signed-Rank Test, such as Items 5, 11, 15 (mean differences marginal) and
Items 5, 11, 14 (reversal of expected pattern). The descriptive statistics gave an indication of
potential problems with items. The non-parametric statistical tests assessed whether what was
observed via descriptives, was statistically significant and gauged the magnitude of differences
(effect sizes and association). The non-parametric statistics, used to analyse the items, also
identified additional problematic items, such as Item 13 which was not, however, significantly
different from Years 1 to 2 (p = .166). These findings highlight the need for examining the
descriptive results and also conducting statistical testing to confirm results and identify
additional problems. As a result of the findings, subject specialists examined the items
identified as potentially not adequately assessing change, and consequently rephrased Items
11, 13, and 14.
The subsequent step was to apply the Rasch Measurement Model to the data, using Winsteps
3.75.0 (Linacre, 2016) to confirm the findings of the raw score analysis, to ascertain whether
the items identified as potentially problematic should be removed, and in addition, to estimate
the proficiencies of the persons in relation to the item difficulties on the same scale.
6.5.1 Independent Rasch analysis
The anchor items and all other items from the Grade 8 test, were entered into Winsteps for
analysis, with the same being done for the all Grade 9 test items. The item difficulties, with the
measures from the independent analysis rescaled from 0 to 100, were exported for both sets of
items. The independent Rasch analysis revealed that the anchor items were very stable, with
item difficulties from Time 1 and Time 2 having a correlation of r = .882, p < .01 (see Figure
6.1). Item 5 was identified as more difficult in Time 2 (M = 29.47) than in Time 1 (M = 27.06)
showing that the item is less stable and has disordered thresholds. The same is true of Item 15
(Mean T1 = 48.81, Mean T2 = 57.80). Figure 6.1 depicts the item-measures from Time 1 and
Time 2 plotted with 95% confidence interval lines in Winsteps using Pearson’s correlation
coefficient, with Item 15 lying well outside the 95% confidence interval. The empirical slope
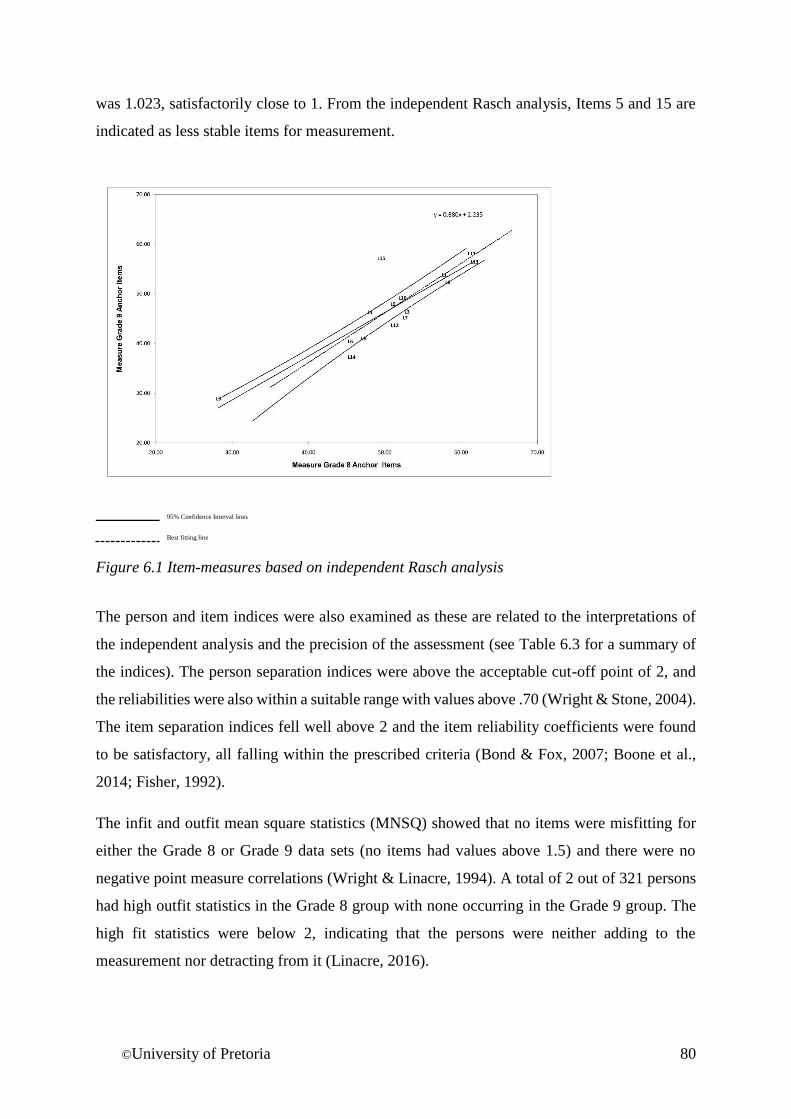
©University of Pretoria 80
was 1.023, satisfactorily close to 1. From the independent Rasch analysis, Items 5 and 15 are
indicated as less stable items for measurement.
95% Confidence Interval lines
Best fitting line
Figure 6.1 Item-measures based on independent Rasch analysis
The person and item indices were also examined as these are related to the interpretations of
the independent analysis and the precision of the assessment (see Table 6.3 for a summary of
the indices). The person separation indices were above the acceptable cut-off point of 2, and
the reliabilities were also within a suitable range with values above .70 (Wright & Stone, 2004).
The item separation indices fell well above 2 and the item reliability coefficients were found
to be satisfactory, all falling within the prescribed criteria (Bond & Fox, 2007; Boone et al.,
2014; Fisher, 1992).
The infit and outfit mean square statistics (MNSQ) showed that no items were misfitting for
either the Grade 8 or Grade 9 data sets (no items had values above 1.5) and there were no
negative point measure correlations (Wright & Linacre, 1994). A total of 2 out of 321 persons
had high outfit statistics in the Grade 8 group with none occurring in the Grade 9 group. The
high fit statistics were below 2, indicating that the persons were neither adding to the
measurement nor detracting from it (Linacre, 2016).
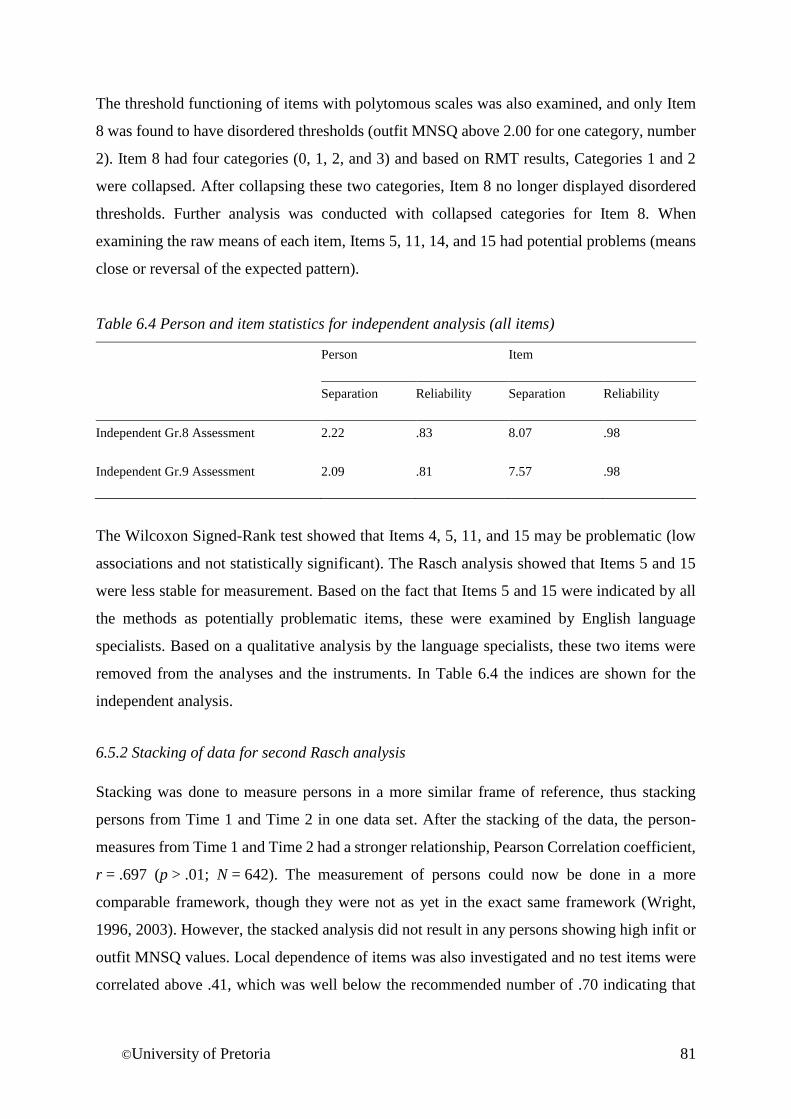
©University of Pretoria 81
The threshold functioning of items with polytomous scales was also examined, and only Item
8 was found to have disordered thresholds (outfit MNSQ above 2.00 for one category, number
2). Item 8 had four categories (0, 1, 2, and 3) and based on RMT results, Categories 1 and 2
were collapsed. After collapsing these two categories, Item 8 no longer displayed disordered
thresholds. Further analysis was conducted with collapsed categories for Item 8. When
examining the raw means of each item, Items 5, 11, 14, and 15 had potential problems (means
close or reversal of the expected pattern).
Table 6.4 Person and item statistics for independent analysis (all items)
Person Item
Separation Reliability Separation Reliability
Independent Gr.8 Assessment 2.22 .83 8.07 .98
Independent Gr.9 Assessment 2.09 .81 7.57 .98
The Wilcoxon Signed-Rank test showed that Items 4, 5, 11, and 15 may be problematic (low
associations and not statistically significant). The Rasch analysis showed that Items 5 and 15
were less stable for measurement. Based on the fact that Items 5 and 15 were indicated by all
the methods as potentially problematic items, these were examined by English language
specialists. Based on a qualitative analysis by the language specialists, these two items were
removed from the analyses and the instruments. In Table 6.4 the indices are shown for the
independent analysis.
6.5.2 Stacking of data for second Rasch analysis
Stacking was done to measure persons in a more similar frame of reference, thus stacking
persons from Time 1 and Time 2 in one data set. After the stacking of the data, the person-
measures from Time 1 and Time 2 had a stronger relationship, Pearson Correlation coefficient,
r = .697 (p > .01; N = 642). The measurement of persons could now be done in a more
comparable framework, though they were not as yet in the exact same framework (Wright,
1996, 2003). However, the stacked analysis did not result in any persons showing high infit or
outfit MNSQ values. Local dependence of items was also investigated and no test items were
correlated above .41, which was well below the recommended number of .70 indicating that
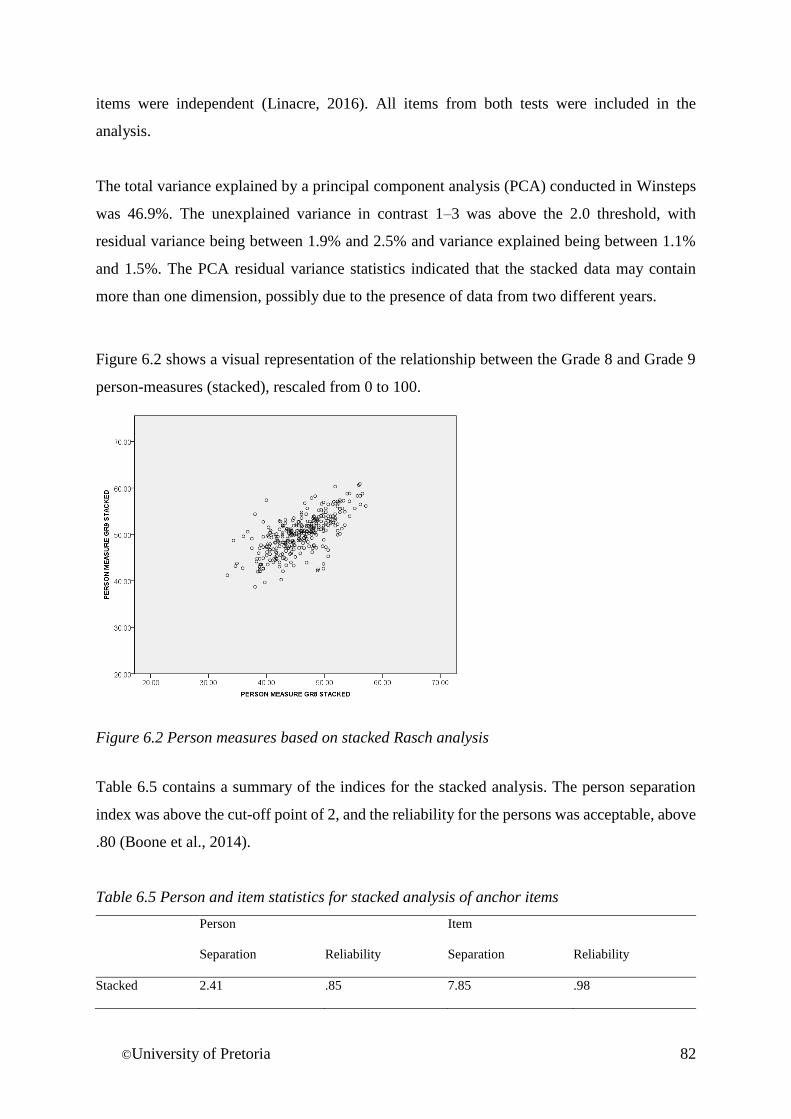
©University of Pretoria 82
items were independent (Linacre, 2016). All items from both tests were included in the
analysis.
The total variance explained by a principal component analysis (PCA) conducted in Winsteps
was 46.9%. The unexplained variance in contrast 1–3 was above the 2.0 threshold, with
residual variance being between 1.9% and 2.5% and variance explained being between 1.1%
and 1.5%. The PCA residual variance statistics indicated that the stacked data may contain
more than one dimension, possibly due to the presence of data from two different years.
Figure 6.2 shows a visual representation of the relationship between the Grade 8 and Grade 9
person-measures (stacked), rescaled from 0 to 100.
Figure 6.2 Person measures based on stacked Rasch analysis
Table 6.5 contains a summary of the indices for the stacked analysis. The person separation
index was above the cut-off point of 2, and the reliability for the persons was acceptable, above
.80 (Boone et al., 2014).
Table 6.5 Person and item statistics for stacked analysis of anchor items
Person Item
Separation Reliability Separation Reliability
Stacked 2.41 .85 7.85 .98
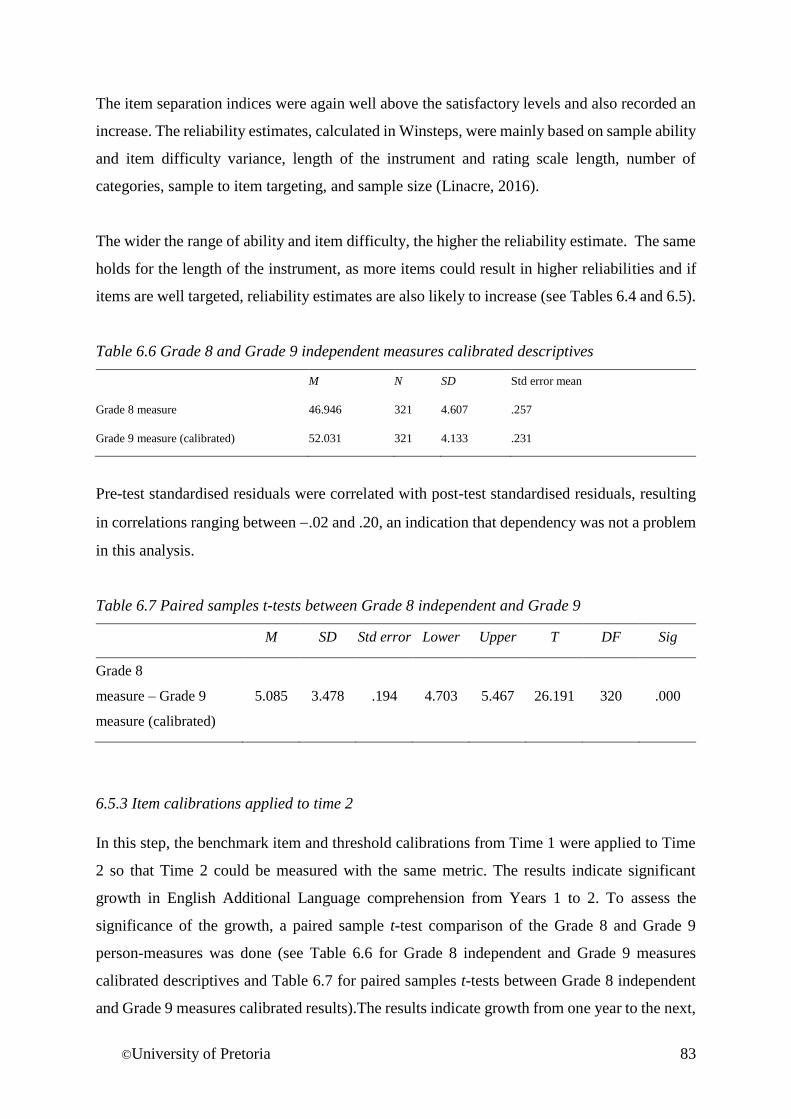
©University of Pretoria 83
The item separation indices were again well above the satisfactory levels and also recorded an
increase. The reliability estimates, calculated in Winsteps, were mainly based on sample ability
and item difficulty variance, length of the instrument and rating scale length, number of
categories, sample to item targeting, and sample size (Linacre, 2016).
The wider the range of ability and item difficulty, the higher the reliability estimate. The same
holds for the length of the instrument, as more items could result in higher reliabilities and if
items are well targeted, reliability estimates are also likely to increase (see Tables 6.4 and 6.5).
Table 6.6 Grade 8 and Grade 9 independent measures calibrated descriptives
M N SD Std error mean
Grade 8 measure 46.946 321 4.607 .257
Grade 9 measure (calibrated) 52.031 321 4.133 .231
Pre-test standardised residuals were correlated with post-test standardised residuals, resulting
in correlations ranging between .02 and .20, an indication that dependency was not a problem
in this analysis.
Table 6.7 Paired samples t-tests between Grade 8 independent and Grade 9
M SD Std error Lower Upper T DF Sig
Grade 8
measure – Grade 9
measure (calibrated)
5.085 3.478 .194 4.703 5.467 26.191 320 .000
6.5.3 Item calibrations applied to time 2
In this step, the benchmark item and threshold calibrations from Time 1 were applied to Time
2 so that Time 2 could be measured with the same metric. The results indicate significant
growth in English Additional Language comprehension from Years 1 to 2. To assess the
significance of the growth, a paired sample t-test comparison of the Grade 8 and Grade 9
person-measures was done (see Table 6.6 for Grade 8 independent and Grade 9 measures
calibrated descriptives and Table 6.7 for paired samples t-tests between Grade 8 independent
and Grade 9 measures calibrated results).The results indicate growth from one year to the next,
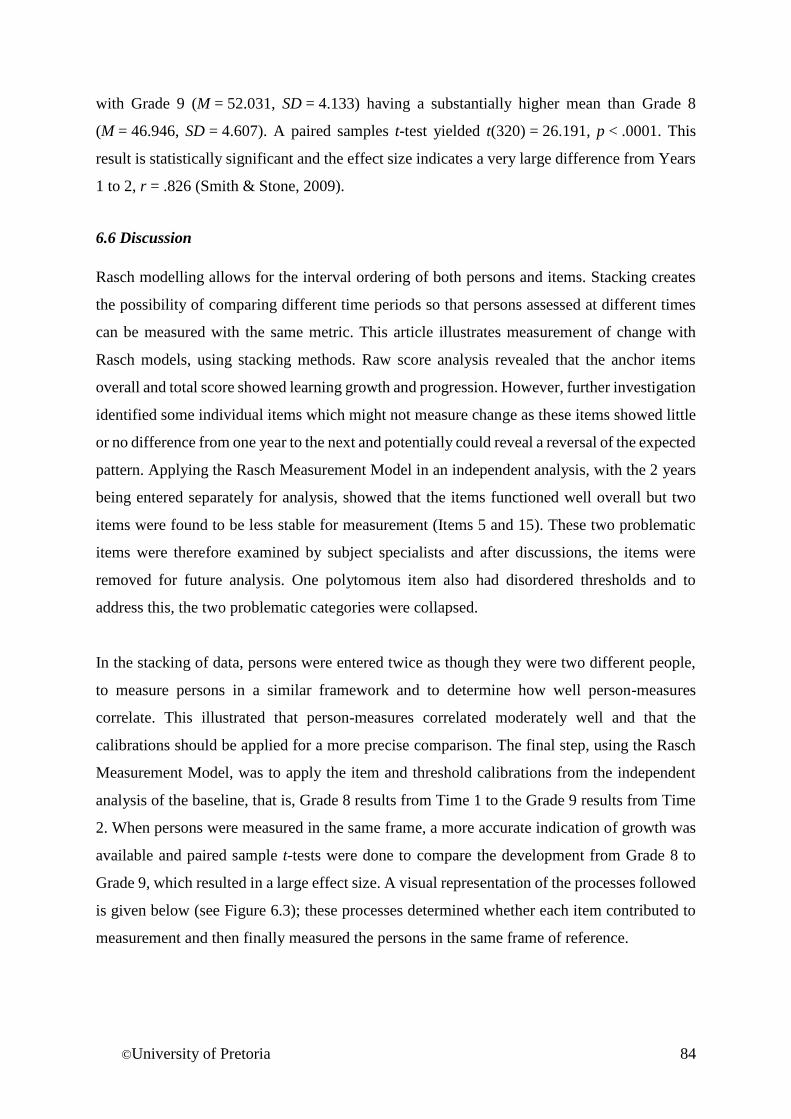
©University of Pretoria 84
with Grade 9 (M = 52.031, SD = 4.133) having a substantially higher mean than Grade 8
(M = 46.946, SD = 4.607). A paired samples t-test yielded t(320) = 26.191, p < .0001. This
result is statistically significant and the effect size indicates a very large difference from Years
1 to 2, r = .826 (Smith & Stone, 2009).
6.6 Discussion
Rasch modelling allows for the interval ordering of both persons and items. Stacking creates
the possibility of comparing different time periods so that persons assessed at different times
can be measured with the same metric. This article illustrates measurement of change with
Rasch models, using stacking methods. Raw score analysis revealed that the anchor items
overall and total score showed learning growth and progression. However, further investigation
identified some individual items which might not measure change as these items showed little
or no difference from one year to the next and potentially could reveal a reversal of the expected
pattern. Applying the Rasch Measurement Model in an independent analysis, with the 2 years
being entered separately for analysis, showed that the items functioned well overall but two
items were found to be less stable for measurement (Items 5 and 15). These two problematic
items were therefore examined by subject specialists and after discussions, the items were
removed for future analysis. One polytomous item also had disordered thresholds and to
address this, the two problematic categories were collapsed.
In the stacking of data, persons were entered twice as though they were two different people,
to measure persons in a similar framework and to determine how well person-measures
correlate. This illustrated that person-measures correlated moderately well and that the
calibrations should be applied for a more precise comparison. The final step, using the Rasch
Measurement Model, was to apply the item and threshold calibrations from the independent
analysis of the baseline, that is, Grade 8 results from Time 1 to the Grade 9 results from Time
2. When persons were measured in the same frame, a more accurate indication of growth was
available and paired sample t-tests were done to compare the development from Grade 8 to
Grade 9, which resulted in a large effect size. A visual representation of the processes followed
is given below (see Figure 6.3); these processes determined whether each item contributed to
measurement and then finally measured the persons in the same frame of reference.
©University of Pretoria 85
The advantages of using the Partial Credit Rasch Model included more accurate measurement
of the longitudinal results. Both the raw score analysis and the Rasch modified results showed
large effect sizes (r = .591 and r = .826). However, the mean score differences between Grade
8 and Grade 9 for the final analysis was smaller than that of the raw score analysis, with mean
difference for raw score = 10.805 versus mean difference for calibrated results = 5.085. These
differences are attributed to the refinements made to the anchor items, such as collapsing
categories for Item 8 and removing Items 5 and 15 (see 10.5 Appendix E: Evaluating anchor
items study - removed items). Also important was the application of the threshold calibrations,
which were applied in the revision of the assessment instruments. All of these changes have
resulted in more precise indications of change from Time 1 to Time 2.
The sample was well placed for measuring improvement using anchor items as the learners in
the sample came from impoverished backgrounds, and had previously attended low-resourced
schools. The anchor items assisted in identifying a significant difference in English Additional
Language performance from the time the learners entered the schools (end of Grade 8) to
having had a year of schooling in these changed circumstances (end of Grade 9). It is important
to note that at the time, the coalition schools began at Grade 9 level and as such, had no Grade
8 track; therefore, learners were tested prior to or just after entering the new school system.
This study illustrated that the use of the Rasch Measurement Model assists in refining the
anchor items and enhances reporting the final results in the most accurate frame of reference.
These results were then fed back into the school system so that teachers and learners could
benefit from the monitoring system which would thus inform teaching and learning.
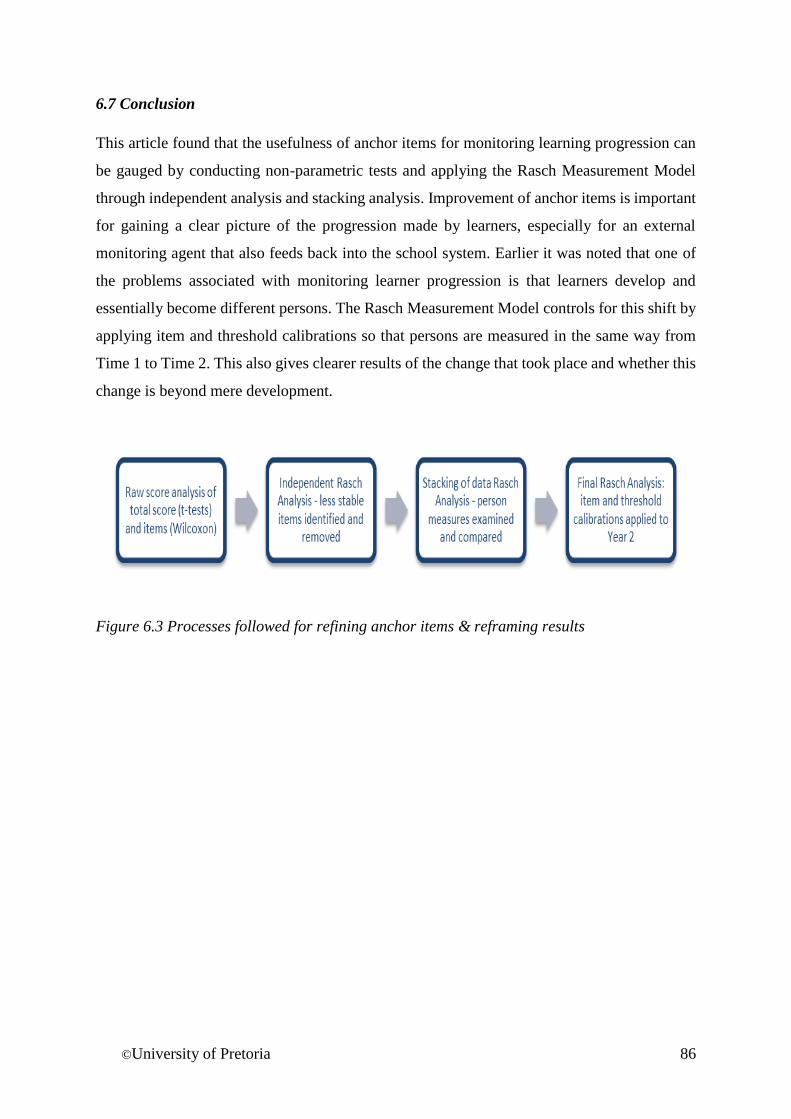
©University of Pretoria 86
6.7 Conclusion
This article found that the usefulness of anchor items for monitoring learning progression can
be gauged by conducting non-parametric tests and applying the Rasch Measurement Model
through independent analysis and stacking analysis. Improvement of anchor items is important
for gaining a clear picture of the progression made by learners, especially for an external
monitoring agent that also feeds back into the school system. Earlier it was noted that one of
the problems associated with monitoring learner progression is that learners develop and
essentially become different persons. The Rasch Measurement Model controls for this shift by
applying item and threshold calibrations so that persons are measured in the same way from
Time 1 to Time 2. This also gives clearer results of the change that took place and whether this
change is beyond mere development.
Figure 6.3 Processes followed for refining anchor items & reframing results
©University of Pretoria 87
Chapter 7 - The Use of Rasch Competency Bands for
Reporting Criterion-Referenced Feedback and
Curriculum-Standards Attainment
Authors: Combrinck, C., Scherman, V. & Maree, D.
Publication: 2016, 34(4): 62-78
7.1 Abstract
This study describes how criterion-referenced feedback was produced from English Language,
Mathematics and Natural Sciences monitoring assessments. The assessments were designed
for grades 8 to 11 to give an overall indication of curriculum-standards attained in a given
subject over the course of a year (N=1113). The Rasch Item Map method was used to set cut-
scores for the Rasch competency bands, after which subject specialists examined the items in
each band. Based on the content and difficulty of the items, descriptions for the proficiency
levels were generated. Learner reports described each individual’s current proficiency level in
a subject area as well as the subsequent level to be attained. This article shows how the Rasch
Item Map method can be used to align assessments and curriculum-standards, which facilitates
reporting learner performance in terms of criterion-referenced feedback and empowers
learners, teachers and parents to focus on subject content and competencies.
Keywords: Rasch competency bands, proficiency levels, criterion-referenced feedback, Rasch
Item Map method, curriculum-standards, reporting learner performance
©University of Pretoria 88
7.2 Context
There is a growing realisation worldwide of the importance of learner content-focused
feedback as opposed to only providing norm-referenced feedback (Bennett, Tognolini &
Pickering, 2012). Norm-referenced feedback is based on numbers, means achieved as well as
a comparison of a learner or groups of learners to others in the cohort(s). But with standards-
referenced feedback, also known as criterion-referenced feedback, the spotlight is on informing
learners about what they know and how they can increase their knowledge and skills (Bennett
et al., 2012, Long, Dunne & Mokoena, 2014). Standards-referenced feedback is crucial for
meeting curriculum requirements as the criteria are based on learning standards set in
curriculum documents (Great Schools Partnership, 2014). The alignment of assessments to
curriculum-standards is linked to this type of feedback. Therefore, assessments would be
designed to provide diagnostic information and feedback in order to inform teaching and
learning.
This article specifically investigates methods using external and internal monitoring
assessments for deriving standards-referenced feedback, which serves the purpose of
developing accountability and a measure for comparability as well as presenting a method for
deriving criterion-referenced feedback. The argument is made that by offering feedback that is
content specific and linked to curriculum-standards, monitoring assessments, which comprise
systemic evaluations, large scale studies and standardised tests in the schooling system, can
serve the additional purpose of enhancing teaching and learning. Content-specific feedback is
empowering to teachers and learners and when monitoring assessments are utilised, all
stakeholders, including the participants, should benefit from the testing system (Long et al.,
2014).
7.2.1 Large scale assessments for norm and criterion-referenced feedback
Systemic and standardised tests are generally not utilised for diagnostic purposes, though such
applications could contribute to an impact on the system they evaluate (Khosa, 2013). The main
goal of most systemic testing systems is to serve as indicators of performance levels, mainly
for norm-referenced comparison and for quality assurance in education (Jiao et al., 2011;
Osman et al., 2008). Designing criterion-referenced tests can be time- and resource-intensive
but has advantages that benefit those being tested and the systems in the long-term (Stone,
Beltyukova & Fox, 2008). Such advantages include monitoring a system but also improving
©University of Pretoria 89
its functioning by identifying attained curriculum standards and pinpointing the next
achievable levels. This approach taps into the notion of competency as moving along a
continuum (Griffin, Gillis & Calvitto, 2007).
Criterion-referenced results give feedback in terms of what skills and knowledge a person has
gained, whereas norm-referenced feedback focuses on comparing a person to others in terms
of achievement. The study described in this article has utilised criterion-referenced and norm-
referenced feedback approaches, using the monitoring assessments to provide learners,
teachers, parents, principals and funders with criterion-referenced and norm-referenced
feedback. Norm-referenced feedback gave schools learner-level insight into where their
school’s achievement was located in relation to other schools. Criterion-referenced feedback
gave insights into school-level proficiency levels and curriculum standards achieved by
learners, in addition to offering subsequent target levels for teachers. During interactive
workshops, teachers and subject specialists discussed ways in which the results could be used
in developing/initiating interventions and thus enhancing classroom practice.
7.2.2 Learner-level feedback as an ethical application of large scale assessment
Large-scale assessments, such as standardised testing and systemic evaluations, are time
consuming and expensive (Khosa, 2013; Popham, 1987). Time is taken from teaching and
learning while results are generally used to broadly inform policy and not necessarily to give
feedback to learners, teachers and parents. Providing learner-level feedback by using methods
such as the Rasch Item Mapping method, is one way of assessing in a more ethical manner as
participants can benefit more directly by receiving feedback which is explicit and useful due
to its content-based nature (Long et al., 2014). By providing criterion-referenced feedback,
teachers can also benefit from the assessments as they become aware of specifically attained
curriculum standards and how to structure their teaching to target standards which have not
been fully achieved. Giving criterion-referenced feedback could also contribute to learner
motivation (Boone, Staver & Yale, 2014). If learners realise that the testing does not influence
their academic performance, they could be less motivated to write such assessments. In
contrast, if learners understand that they will receive usable feedback, which will also be
disseminated to their parents and teachers, they could be more motivated to participate fully.
©University of Pretoria 90
7.2.3 Identifying competency levels
The idea of using the Rasch Measurement Theory (RMT) to align assessments to curriculum
standards is not a new idea. Ingebo (1989) discussed the use of RMT for alignment to
curriculum-standards because the Rasch Model creates an equal interval scale of curriculum
tasks (items in tests) which can be used for a comparison to curriculum-standards.
As dichotomous items that are actually curriculum tasks are lined up and given values with
respect to each other, these calibrations (values) are on an equal interval scale generated
by the confluence of knowledge and position in the curriculum (Ingebo, 1989: 43).
The use of the Rasch Model to set standards and identify proficiency levels has been
demonstrated by several studies (Boone et al., 2014; Grosse & Wright, 1986; Long et al., 2014;
Shen, 2001; Stone, 2000). In fact, aligning item banks to curricula with equal intervals for every
item was one of the main achievements of Benjamin Wright (Ingebo, 1987). Over the course
of the last 30 years, much research on the use of RMT has been conducted in the United States,
Australia, Great Britain, European countries and Southern Africa (Bond & Fox, 2015; Boone
et al., 2014; Wright & Grosse, 1993; Stelmack et al., 2004; Wissing, 2013). Some of the recent
literature on the use of RMT for setting standards and proficiency levels are discussed next.
Holster and Lake (2015) showed how items could be scaled with the use of the Wright map for
diagnostic vocabulary tests and these results can be used to identify learners needing remedial
intervention. Their study also demonstrated how identifying competency levels with the Rasch
Model are applicable for classroom use, curriculum planning and the refinement of vocabulary
tests for placement purposes (Holster & Lake, 2015). In addition, Jiao et al. (2011) used the
Mixed Rasch Model (multi-dimensional) to classify student performance in a simulation into
proficiency levels by analysing item response patterns and the achievement represented on the
latent trait by achievement. This resulted in high student classification accuracy and had the
added advantage of assisting with the classification of borderline case or minimally competent
students. This accurate classification was achieved by fitting the data to the Rasch Model and
using the intersecting points between adjacent distributions to distinguish varying proficiency
levels. Similar studies, such as that of Jiao et al. (2011), are needed as the findings can be
strengthened by using real data as opposed to simulated data. The study presented in this article
is based on empirical data and addresses the limitation of using only simulated data to illustrate
the usefulness of certain approaches.
©University of Pretoria 91
Studies utilising the Rasch Model to create competency bands are based on the theory that the
item difficulty and person ability alignment reflects the complexity of the content and levels of
proficiency in the content areas (Shen, 2001). Shen’s study (2001) on medical licensing data
compared the Angoff method, the Hofstee and the Rasch Item Map method. This study found
that the Angoff method identified test subjects with expertise, whereas the Rasch Item Map
method was more likely to identify those with fundamental knowledge. The Rasch and Hostee
methods gave equivalent results. In the case of Shen’s study, using the Rasch Item Map method
made more sense, as fundamental knowledge was required to practise medicine and was more
significant than specialist knowledge for those entering the field of medicine. The Rasch
method also provided more criterion-referenced results whereas the other methods were more
likely to yield norm-referenced results. The Rasch Item Map method was also more time
efficient, as reviewing maps versus reviewing individual items takes less time. Other methods
may also lack content explanations of what a standard means, a crucial aspect of reporting
learner and student performance levels (Shen, 2001).
Other studies of a similar nature have been conducted with equivalent results, showing the
potential advantages of using the Rasch Item Map method over that of traditional methods
(Wang, 2003). Stone et al. (2008) demonstrated how the multifaceted Rasch Model could be
used to firstly identify minimal competence and then incorporate it into the model of standard
setting, especially for criterion-referenced standards when assessments are scored with rubrics.
They note that the rating scale used, the unique context of their study and their sample size all
influenced the outcome, suggesting that more studies of this nature are required to evaluate the
applicability of modelling minimal competence in other settings. Herrmann-Abell and DeBoer
(2015) used RMT to map science items onto curriculum materials to compare, with precision,
how ideas are taught and how learner understanding of these ideas progress. By aligning items
to curriculum standards and progression of understanding, they were able to identify areas for
improving teaching and learning in the subject areas. It should be noted that Rasch methods
could be combined with other methods, as Bennett et al. (2012) did; the multi-stage Angoff
procedure was used in conjunction with the Rasch theory to establish performance standards
in curriculum-based exams.
The research and findings discussed in this article contribute to the body of knowledge by
demonstrating how monitoring assessments can also be used for standards-referenced
feedback. This article explains how to establish and define progression levels, how to structure
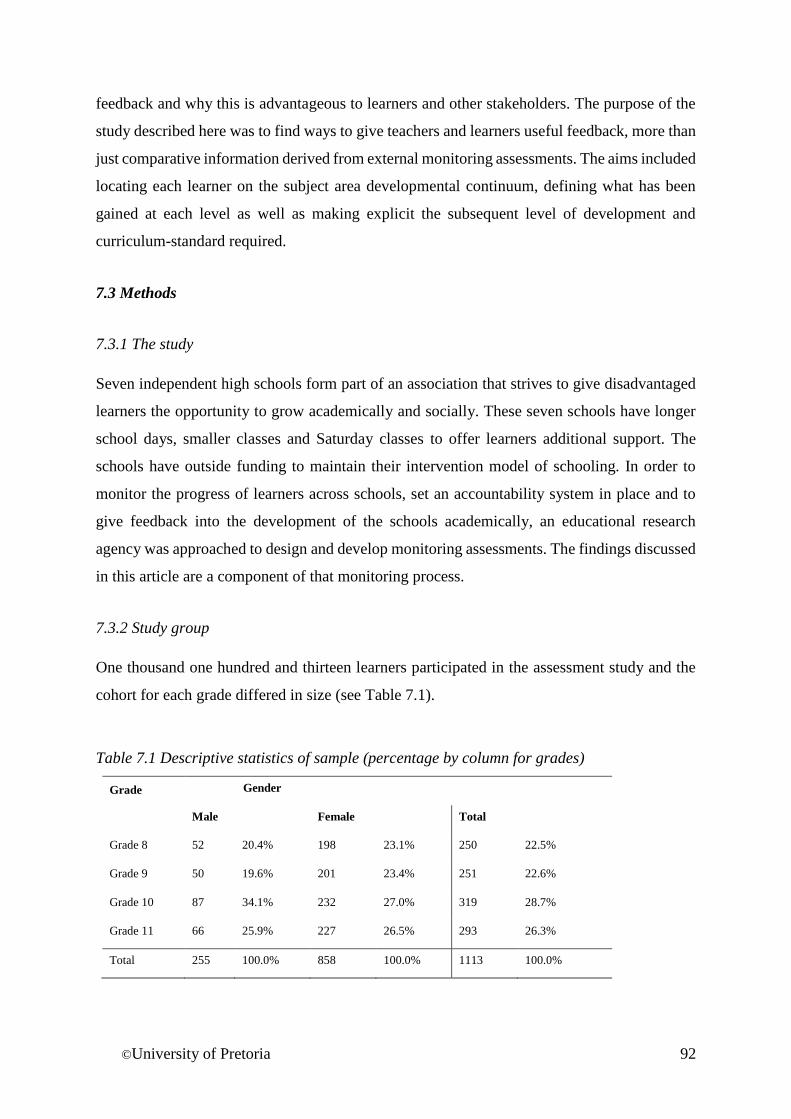
©University of Pretoria 92
feedback and why this is advantageous to learners and other stakeholders. The purpose of the
study described here was to find ways to give teachers and learners useful feedback, more than
just comparative information derived from external monitoring assessments. The aims included
locating each learner on the subject area developmental continuum, defining what has been
gained at each level as well as making explicit the subsequent level of development and
curriculum-standard required.
7.3 Methods
7.3.1 The study
Seven independent high schools form part of an association that strives to give disadvantaged
learners the opportunity to grow academically and socially. These seven schools have longer
school days, smaller classes and Saturday classes to offer learners additional support. The
schools have outside funding to maintain their intervention model of schooling. In order to
monitor the progress of learners across schools, set an accountability system in place and to
give feedback into the development of the schools academically, an educational research
agency was approached to design and develop monitoring assessments. The findings discussed
in this article are a component of that monitoring process.
7.3.2 Study group
One thousand one hundred and thirteen learners participated in the assessment study and the
cohort for each grade differed in size (see Table 7.1).
Table 7.1 Descriptive statistics of sample (percentage by column for grades)
Grade
Gender
Male Female Total
Grade 8 52 20.4% 198 23.1% 250 22.5%
Grade 9 50 19.6% 201 23.4% 251 22.6%
Grade 10 87 34.1% 232 27.0% 319 28.7%
Grade 11 66 25.9% 227 26.5% 293 26.3%
Total 255 100.0% 858 100.0% 1113 100.0%
©University of Pretoria 93
There were 250 grade 8 learners, 251 grade 9 learners, 319 grade 10 learners and 293 grade 11
learners. More girls (77%) than boys (23%) participated in the study due to a girls-only school
being included in the sample, in addition to the other schools having more female than male
learners (a 60% girl: 40% boy composition). The sample sizes, overall and per grade, were
judged to provide adequate power, based on the fact that the whole group participated, with the
independent schools being considered a population on their own due to their unique
intervention model of schooling.
7.3.3 Assessment instruments
The curriculum standards for school subjects are contained in the National Curriculum and
Assessment Policy Statement Grades R-12, also known as CAPS (Department of Basic
Education, 2011, 2012). The CAPS documents aim to set “minimum standards of knowledge
and skills to be achieved at each grade” and this includes high, achievable curriculum standards
(Department of Basic Education, 2016: 1). The documents also endeavour to show progression
in content and context of each subject with development from the basic to the more complex
skills and knowledge. In line with the curriculum standards as set by CAPS, subject specialists
designed the assessment instruments for English Language, Mathematics and Natural Sciences
for grades 8 to 11. The assessments were designed to cover the national curriculum topics that
would be taught within a school year. The results provided an indication of knowledge and
skills gained for a subject within a year and per curriculum area. Multiple-choice items
(approximately 60% of a test) and constructed-response items were included in all the
assessments. The average scores per school, per class and per learner were fed back into the
system via school reports, workshops and data sets containing learner achievement. To give
criterion-referenced feedback, a more qualitative approach was also sought to communicate
the results, which led to the creation of content descriptive reports discussed in this article.
To determine the overall functioning of the monitoring assessments, the Rasch Partial Credit
Model was applied. Rasch Measurement Theory (RMT) holds up the ideal of measurement and
aims to compare real item and person responses to this ideal. Where reality diverges from the
ideal is where there is an indication for potential improvement (Herrmann-Abell & DeBoer,
2015; Linacre, 2016). The Winsteps 3.75.0 programme provides in-fit and outfit mean-square
statistics (MNSQ) which reveal where items and persons fit and where there is misfit (Linacre,
2012). All statistics are reported in terms of log odds units and have a range of -5.00 to +5.00
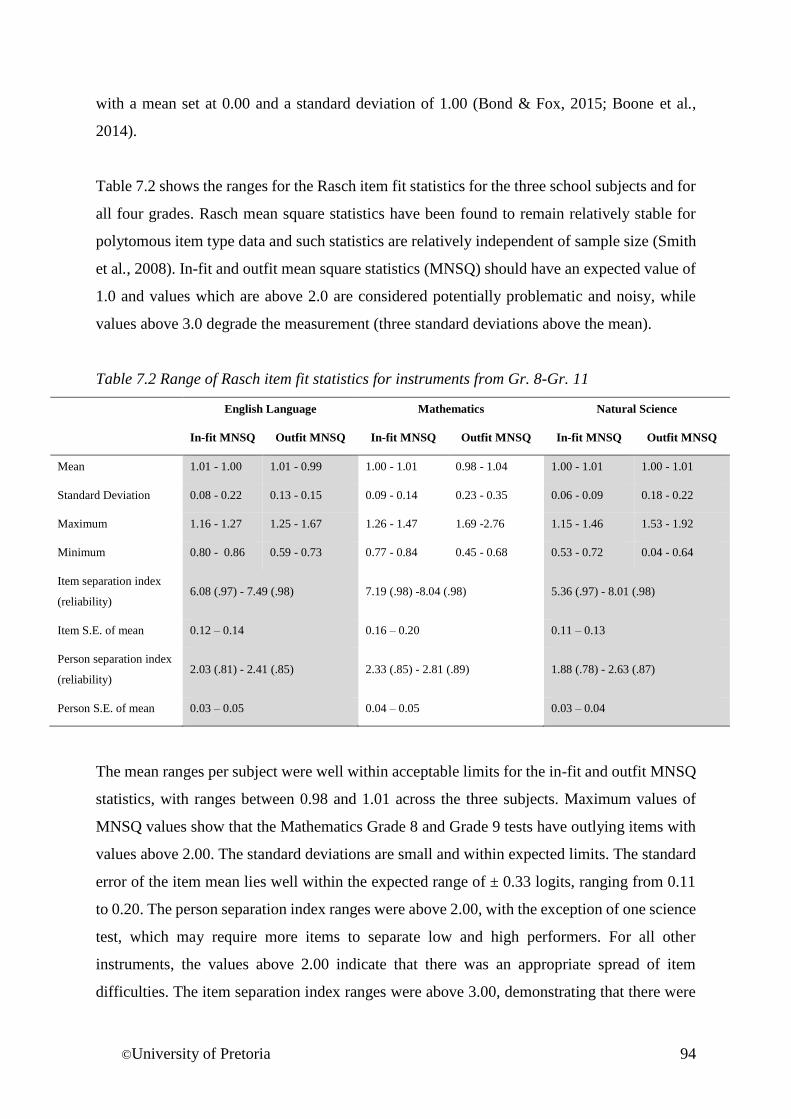
©University of Pretoria 94
with a mean set at 0.00 and a standard deviation of 1.00 (Bond & Fox, 2015; Boone et al.,
2014).
Table 7.2 shows the ranges for the Rasch item fit statistics for the three school subjects and for
all four grades. Rasch mean square statistics have been found to remain relatively stable for
polytomous item type data and such statistics are relatively independent of sample size (Smith
et al., 2008). In-fit and outfit mean square statistics (MNSQ) should have an expected value of
1.0 and values which are above 2.0 are considered potentially problematic and noisy, while
values above 3.0 degrade the measurement (three standard deviations above the mean).
Table 7.2 Range of Rasch item fit statistics for instruments from Gr. 8-Gr. 11
English Language Mathematics Natural Science
In-fit MNSQ Outfit MNSQ In-fit MNSQ Outfit MNSQ In-fit MNSQ Outfit MNSQ
Mean 1.01 - 1.00 1.01 - 0.99 1.00 - 1.01 0.98 - 1.04 1.00 - 1.01 1.00 - 1.01
Standard Deviation 0.08 - 0.22 0.13 - 0.15 0.09 - 0.14 0.23 - 0.35 0.06 - 0.09 0.18 - 0.22
Maximum 1.16 - 1.27 1.25 - 1.67 1.26 - 1.47 1.69 -2.76 1.15 - 1.46 1.53 - 1.92
Minimum 0.80 - 0.86 0.59 - 0.73 0.77 - 0.84 0.45 - 0.68 0.53 - 0.72 0.04 - 0.64
Item separation index
(reliability) 6.08 (.97) - 7.49 (.98) 7.19 (.98) -8.04 (.98) 5.36 (.97) - 8.01 (.98)
Item S.E. of mean 0.12 – 0.14 0.16 – 0.20 0.11 – 0.13
Person separation index
(reliability) 2.03 (.81) - 2.41 (.85) 2.33 (.85) - 2.81 (.89) 1.88 (.78) - 2.63 (.87)
Person S.E. of mean 0.03 – 0.05 0.04 – 0.05 0.03 – 0.04
The mean ranges per subject were well within acceptable limits for the in-fit and outfit MNSQ
statistics, with ranges between 0.98 and 1.01 across the three subjects. Maximum values of
MNSQ values show that the Mathematics Grade 8 and Grade 9 tests have outlying items with
values above 2.00. The standard deviations are small and within expected limits. The standard
error of the item mean lies well within the expected range of ± 0.33 logits, ranging from 0.11
to 0.20. The person separation index ranges were above 2.00, with the exception of one science
test, which may require more items to separate low and high performers. For all other
instruments, the values above 2.00 indicate that there was an appropriate spread of item
difficulties. The item separation index ranges were above 3.00, demonstrating that there were
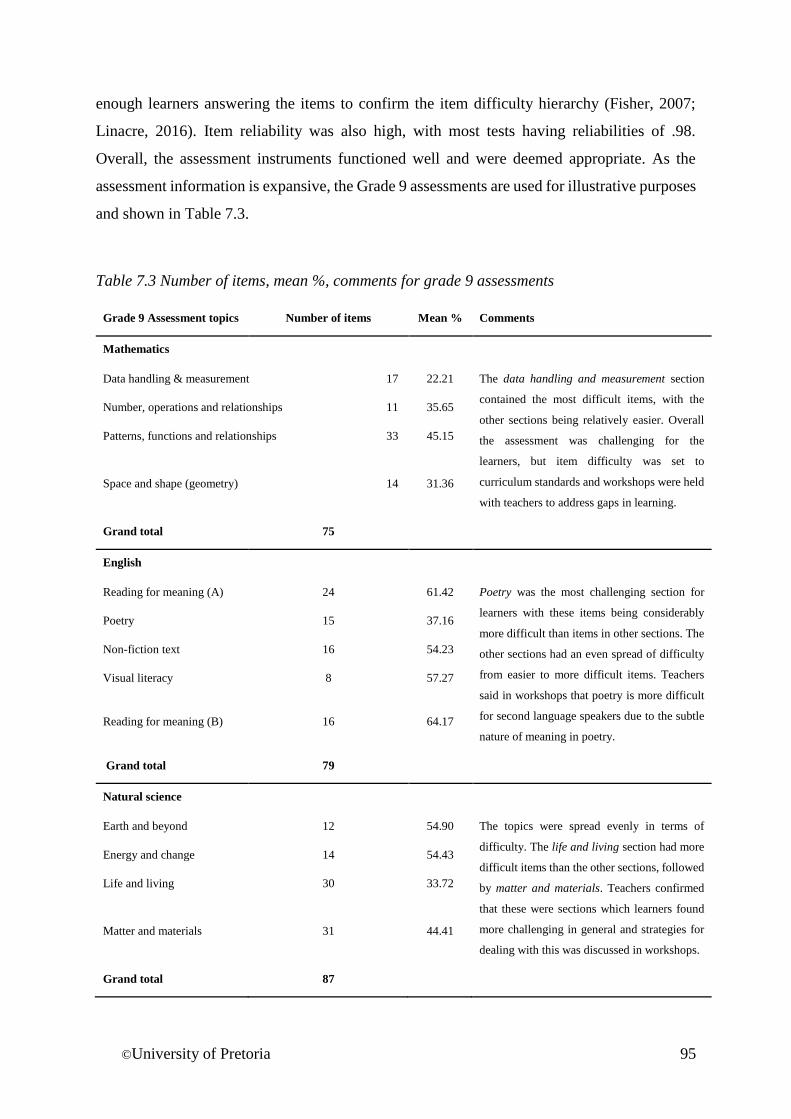
©University of Pretoria 95
enough learners answering the items to confirm the item difficulty hierarchy (Fisher, 2007;
Linacre, 2016). Item reliability was also high, with most tests having reliabilities of .98.
Overall, the assessment instruments functioned well and were deemed appropriate. As the
assessment information is expansive, the Grade 9 assessments are used for illustrative purposes
and shown in Table 7.3.
Table 7.3 Number of items, mean %, comments for grade 9 assessments
Grade 9 Assessment topics Number of items Mean % Comments
Mathematics
Data handling & measurement 17 22.21 The data handling and measurement section
contained the most difficult items, with the
other sections being relatively easier. Overall
the assessment was challenging for the
learners, but item difficulty was set to
curriculum standards and workshops were held
with teachers to address gaps in learning.
Number, operations and relationships 11 35.65
Patterns, functions and relationships 33 45.15
Space and shape (geometry) 14 31.36
Grand total 75
English
Reading for meaning (A) 24 61.42 Poetry was the most challenging section for
learners with these items being considerably
more difficult than items in other sections. The
other sections had an even spread of difficulty
from easier to more difficult items. Teachers
said in workshops that poetry is more difficult
for second language speakers due to the subtle
nature of meaning in poetry.
Poetry 15 37.16
Non-fiction text 16 54.23
Visual literacy 8 57.27
Reading for meaning (B) 16 64.17
Grand total 79
Natural science
Earth and beyond 12 54.90 The topics were spread evenly in terms of
difficulty. The life and living section had more
difficult items than the other sections, followed
by matter and materials. Teachers confirmed
that these were sections which learners found
more challenging in general and strategies for
dealing with this was discussed in workshops.
Energy and change 14 54.43
Life and living 30 33.72
Matter and materials 31 44.41
Grand total 87
©University of Pretoria 96
7.3.4 Procedure
The assessments were administered in November 2014, using standardised procedures and
examination conditions. The educational research centre trained assessment administrators
who implemented the testing process. Informed consent was obtained from parents for learners
in all grades and in addition, assent was obtained from learners older than 16 years. After
administration of the assessments, specifically recruited and trained teachers conducted the
scoring and moderation. Thereafter, the assessments were captured on item level and data
cleaning, processing and analysis was conducted. The competency bands were set using
procedures described in the next sections and thereafter subject specialists crafted the
descriptions. Once descriptions were available, a report structure was created and reports
generated using mail merge. The reports and data files were then sent to the schools to utilise.
7.4 Data analysis
7.4.1 Proficiency levels
The assessments used in this study included items based on a variety of rating scales, from
dichotomous items, which had only right or wrong answers to items of five scores, with each
increasing score denoting higher ability. Considering this, the Rasch Partial Credit Model was
used to analyse the results so that each item could be treated as an individual rating scale.
Rasch-Thurstone thresholds set the 50% probability level (Linacre, 1998). These thresholds
identify rating scaling positions on the latent variable at the precise point where observing each
category is at the 50% probability level (Linacre, 2003, 2009).
This dichotomises rating scales of items, so that that an item with, for example three scores (0,
1, 2), are dichotomised at the 0 and 1 as well as the 1 and 2 intersections (Linacre, 2003, 2009).
This process simplifies the analysis and gives more precise locations as movement from one
category to the next is compared per pair of ratings per item. Based on the 50% probability
levels, the medians were calculated and used to create the number of levels that were decided
upon a priori.
For example, if five levels of grouped ability were hypothesised to exist in the assessment, the
50% probability levels were divided into five sections after sorting ascendingly and the median
of each grouping was calculated which gave the logit points at which to group the person
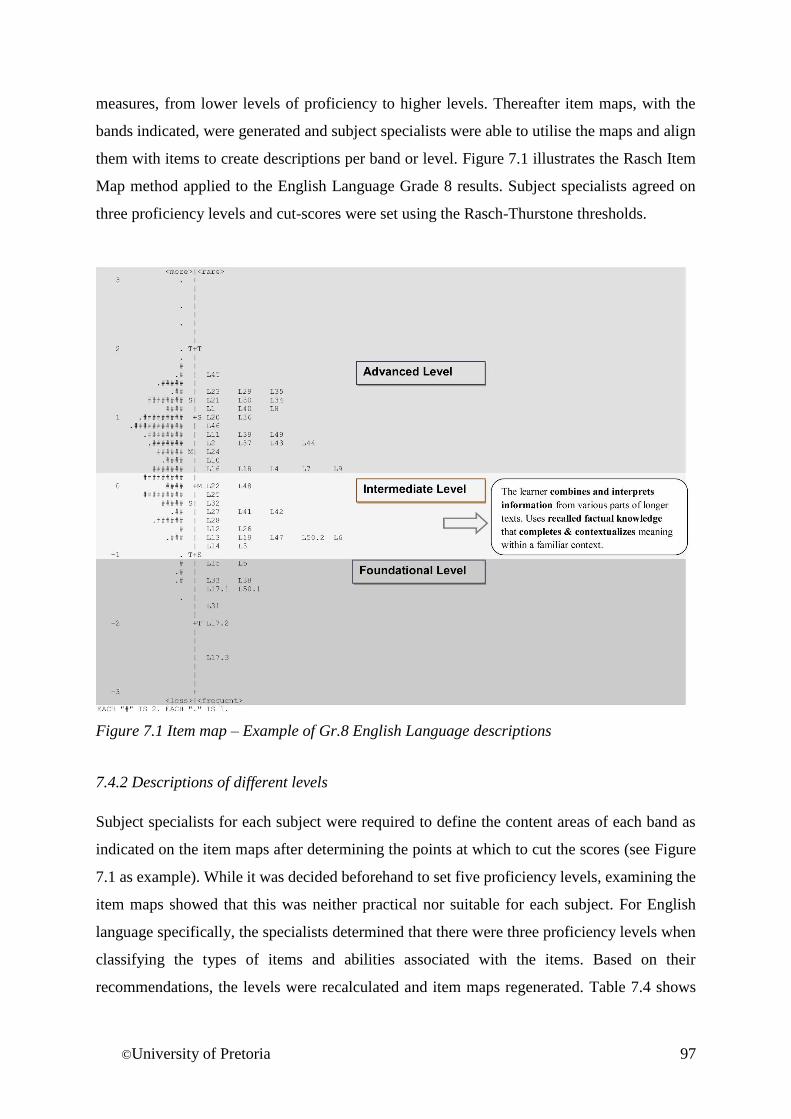
©University of Pretoria 97
measures, from lower levels of proficiency to higher levels. Thereafter item maps, with the
bands indicated, were generated and subject specialists were able to utilise the maps and align
them with items to create descriptions per band or level. Figure 7.1 illustrates the Rasch Item
Map method applied to the English Language Grade 8 results. Subject specialists agreed on
three proficiency levels and cut-scores were set using the Rasch-Thurstone thresholds.
Figure 7.1 Item map – Example of Gr.8 English Language descriptions
7.4.2 Descriptions of different levels
Subject specialists for each subject were required to define the content areas of each band as
indicated on the item maps after determining the points at which to cut the scores (see Figure
7.1 as example). While it was decided beforehand to set five proficiency levels, examining the
item maps showed that this was neither practical nor suitable for each subject. For English
language specifically, the specialists determined that there were three proficiency levels when
classifying the types of items and abilities associated with the items. Based on their
recommendations, the levels were recalculated and item maps regenerated. Table 7.4 shows
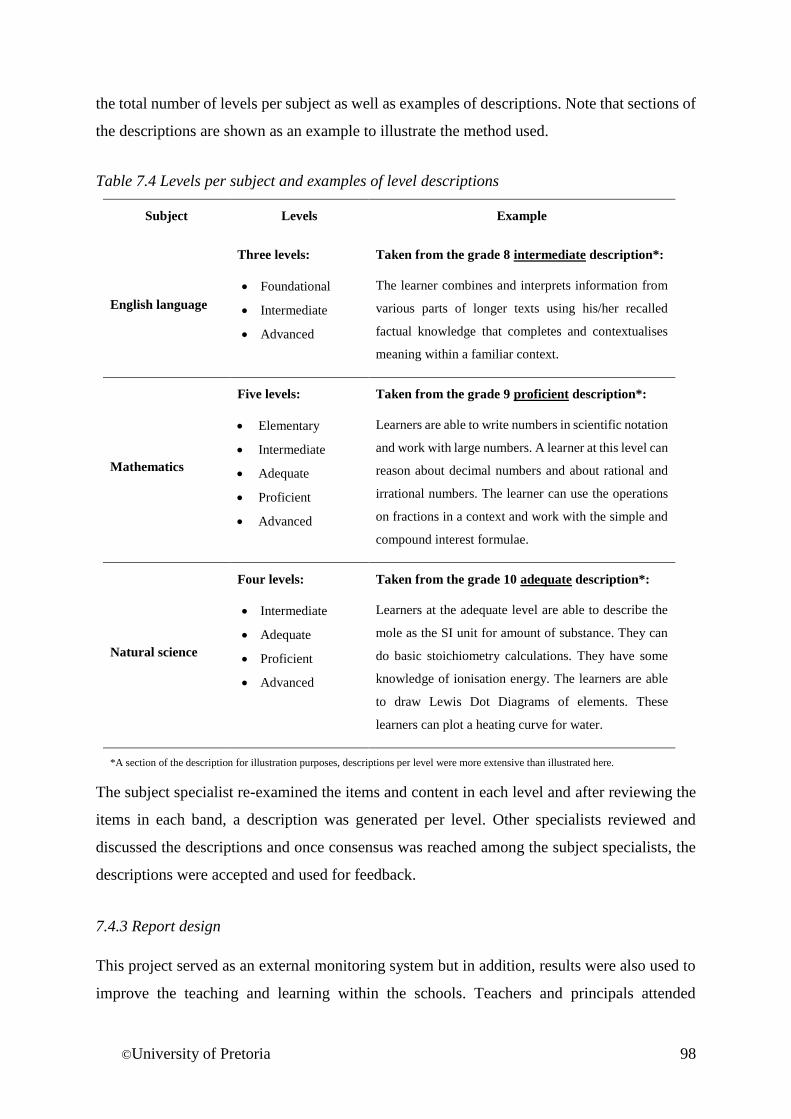
©University of Pretoria 98
the total number of levels per subject as well as examples of descriptions. Note that sections of
the descriptions are shown as an example to illustrate the method used.
Table 7.4 Levels per subject and examples of level descriptions
Subject Levels Example
English language
Three levels:
Foundational
Intermediate
Advanced
Taken from the grade 8 intermediate description*:
The learner combines and interprets information from
various parts of longer texts using his/her recalled
factual knowledge that completes and contextualises
meaning within a familiar context.
Mathematics
Five levels:
Elementary
Intermediate
Adequate
Proficient
Advanced
Taken from the grade 9 proficient description*:
Learners are able to write numbers in scientific notation
and work with large numbers. A learner at this level can
reason about decimal numbers and about rational and
irrational numbers. The learner can use the operations
on fractions in a context and work with the simple and
compound interest formulae.
Natural science
Four levels:
Intermediate
Adequate
Proficient
Advanced
Taken from the grade 10 adequate description*:
Learners at the adequate level are able to describe the
mole as the SI unit for amount of substance. They can
do basic stoichiometry calculations. They have some
knowledge of ionisation energy. The learners are able
to draw Lewis Dot Diagrams of elements. These
learners can plot a heating curve for water.
*A section of the description for illustration purposes, descriptions per level were more extensive than illustrated here.
The subject specialist re-examined the items and content in each level and after reviewing the
items in each band, a description was generated per level. Other specialists reviewed and
discussed the descriptions and once consensus was reached among the subject specialists, the
descriptions were accepted and used for feedback.
7.4.3 Report design
This project served as an external monitoring system but in addition, results were also used to
improve the teaching and learning within the schools. Teachers and principals attended
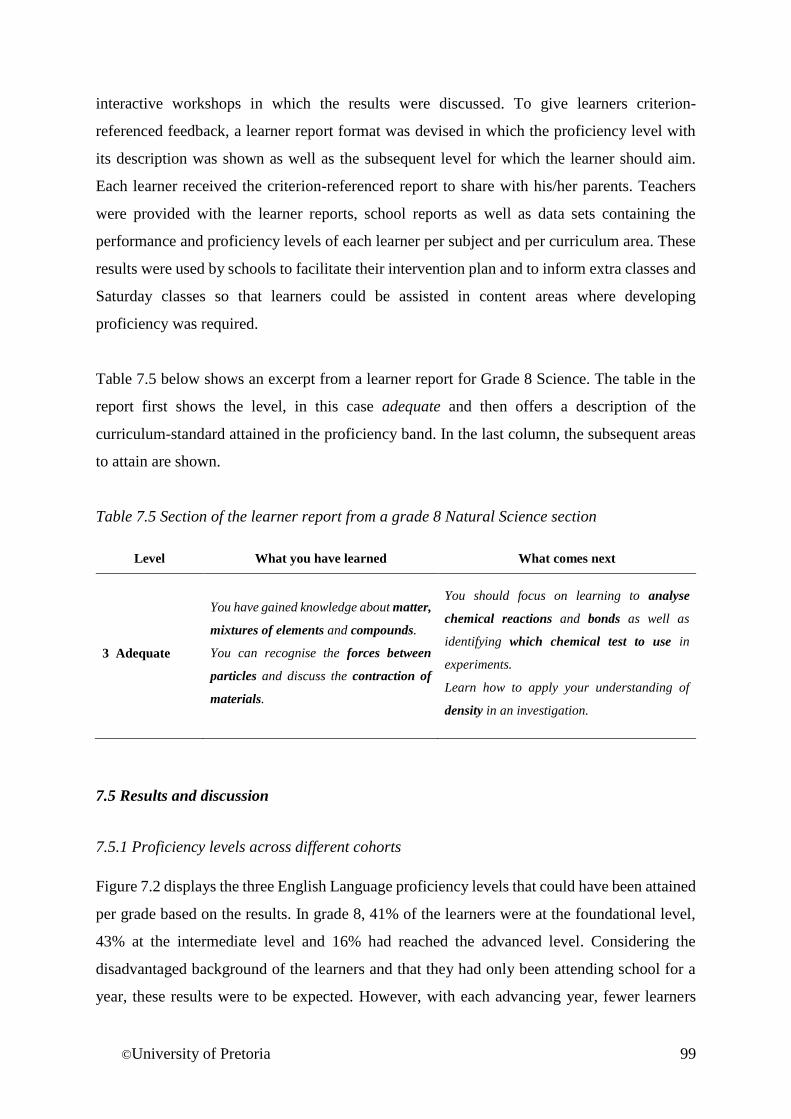
©University of Pretoria 99
interactive workshops in which the results were discussed. To give learners criterion-
referenced feedback, a learner report format was devised in which the proficiency level with
its description was shown as well as the subsequent level for which the learner should aim.
Each learner received the criterion-referenced report to share with his/her parents. Teachers
were provided with the learner reports, school reports as well as data sets containing the
performance and proficiency levels of each learner per subject and per curriculum area. These
results were used by schools to facilitate their intervention plan and to inform extra classes and
Saturday classes so that learners could be assisted in content areas where developing
proficiency was required.
Table 7.5 below shows an excerpt from a learner report for Grade 8 Science. The table in the
report first shows the level, in this case adequate and then offers a description of the
curriculum-standard attained in the proficiency band. In the last column, the subsequent areas
to attain are shown.
Table 7.5 Section of the learner report from a grade 8 Natural Science section
Level What you have learned What comes next
3 Adequate
You have gained knowledge about matter,
mixtures of elements and compounds.
You can recognise the forces between
particles and discuss the contraction of
materials.
You should focus on learning to analyse
chemical reactions and bonds as well as
identifying which chemical test to use in
experiments.
Learn how to apply your understanding of
density in an investigation.
7.5 Results and discussion
7.5.1 Proficiency levels across different cohorts
Figure 7.2 displays the three English Language proficiency levels that could have been attained
per grade based on the results. In grade 8, 41% of the learners were at the foundational level,
43% at the intermediate level and 16% had reached the advanced level. Considering the
disadvantaged background of the learners and that they had only been attending school for a
year, these results were to be expected. However, with each advancing year, fewer learners
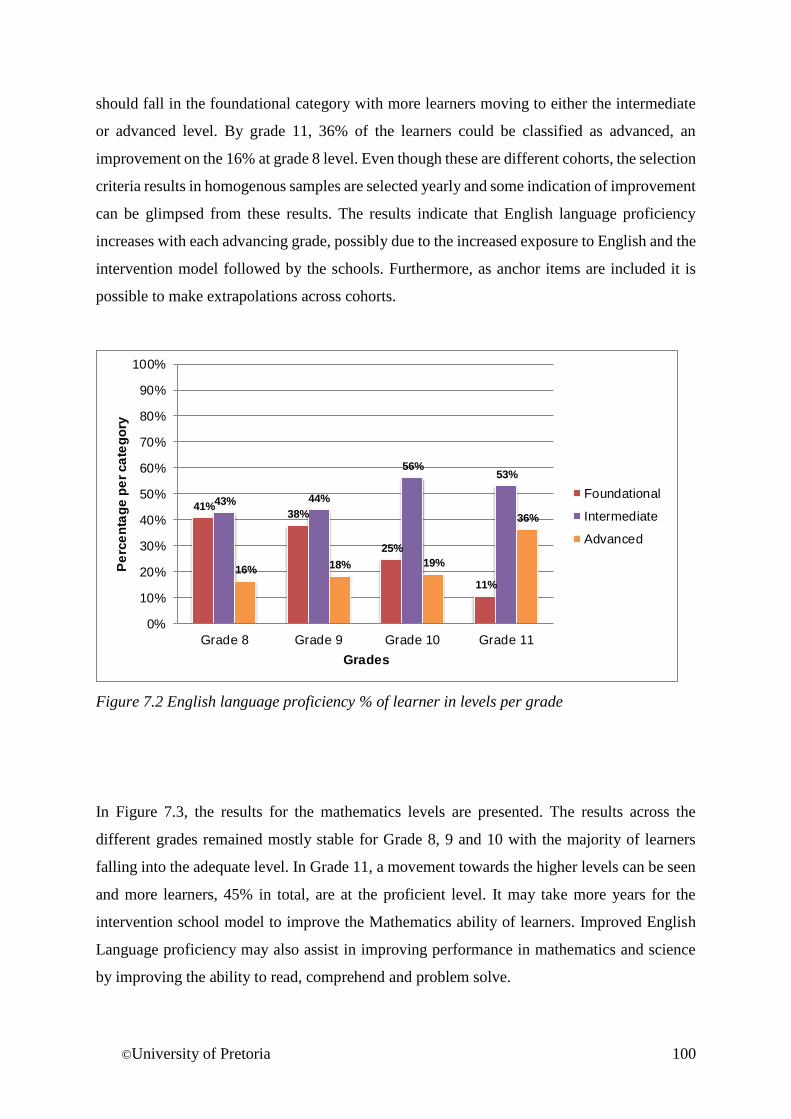
©University of Pretoria 100
should fall in the foundational category with more learners moving to either the intermediate
or advanced level. By grade 11, 36% of the learners could be classified as advanced, an
improvement on the 16% at grade 8 level. Even though these are different cohorts, the selection
criteria results in homogenous samples are selected yearly and some indication of improvement
can be glimpsed from these results. The results indicate that English language proficiency
increases with each advancing grade, possibly due to the increased exposure to English and the
intervention model followed by the schools. Furthermore, as anchor items are included it is
possible to make extrapolations across cohorts.
Figure 7.2 English language proficiency % of learner in levels per grade
In Figure 7.3, the results for the mathematics levels are presented. The results across the
different grades remained mostly stable for Grade 8, 9 and 10 with the majority of learners
falling into the adequate level. In Grade 11, a movement towards the higher levels can be seen
and more learners, 45% in total, are at the proficient level. It may take more years for the
intervention school model to improve the Mathematics ability of learners. Improved English
Language proficiency may also assist in improving performance in mathematics and science
by improving the ability to read, comprehend and problem solve.
41%38%
25%
11%
43% 44%
56%53%
16% 18% 19%
36%
0%
10%
20%
30%
40%
50%
60%
70%
80%
90%
100%
Grade 8 Grade 9 Grade 10 Grade 11
Pe
rce
nta
ge
pe
r ca
teg
ory
Grades
Foundational
Intermediate
Advanced
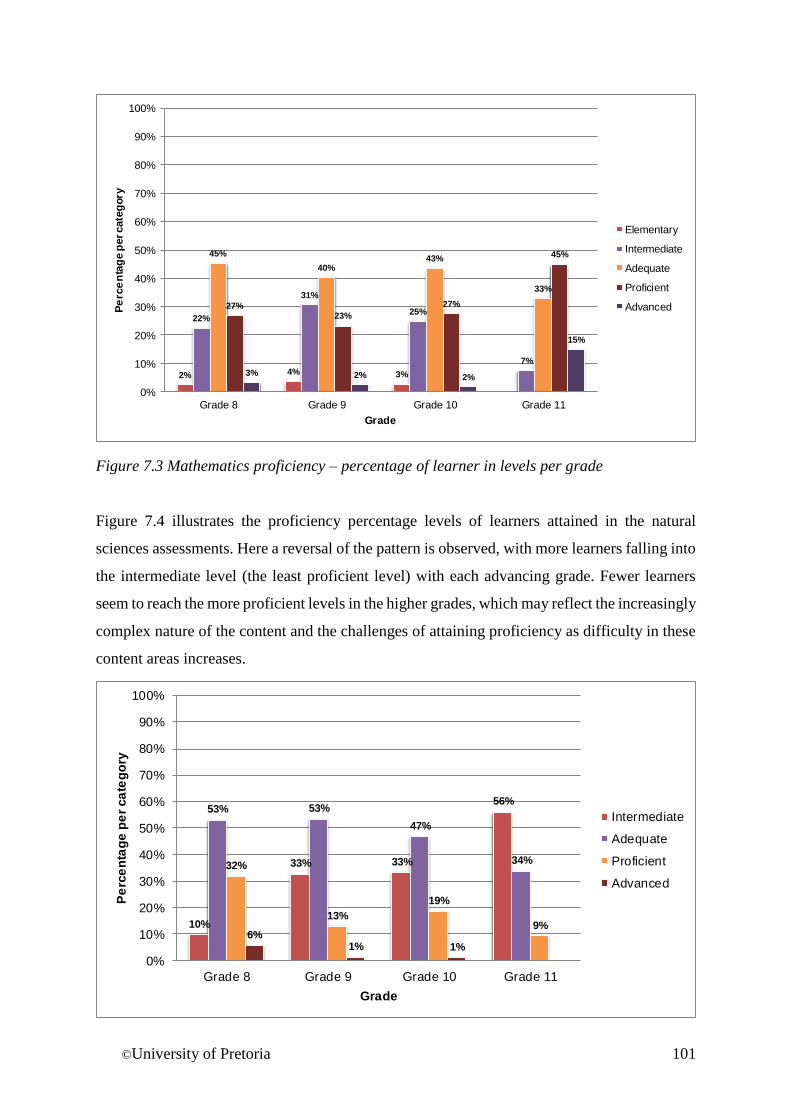
©University of Pretoria 101
Figure 7.3 Mathematics proficiency – percentage of learner in levels per grade
Figure 7.4 illustrates the proficiency percentage levels of learners attained in the natural
sciences assessments. Here a reversal of the pattern is observed, with more learners falling into
the intermediate level (the least proficient level) with each advancing grade. Fewer learners
seem to reach the more proficient levels in the higher grades, which may reflect the increasingly
complex nature of the content and the challenges of attaining proficiency as difficulty in these
content areas increases.
2% 4% 3%
22%
31%
25%
7%
45%
40%43%
33%
27%23%
27%
45%
3% 2% 2%
15%
0%
10%
20%
30%
40%
50%
60%
70%
80%
90%
100%
Grade 8 Grade 9 Grade 10 Grade 11
Pe
rce
nta
ge p
er cate
gory
Grade
Elementary
Intermediate
Adequate
Proficient
Advanced
10%
33% 33%
56%53% 53%
47%
34%32%
13%
19%
9%6%
1% 1%
0%
10%
20%
30%
40%
50%
60%
70%
80%
90%
100%
Grade 8 Grade 9 Grade 10 Grade 11
Pe
rce
nta
ge
pe
r ca
teg
ory
Grade
Intermediate
Adequate
Proficient
Advanced
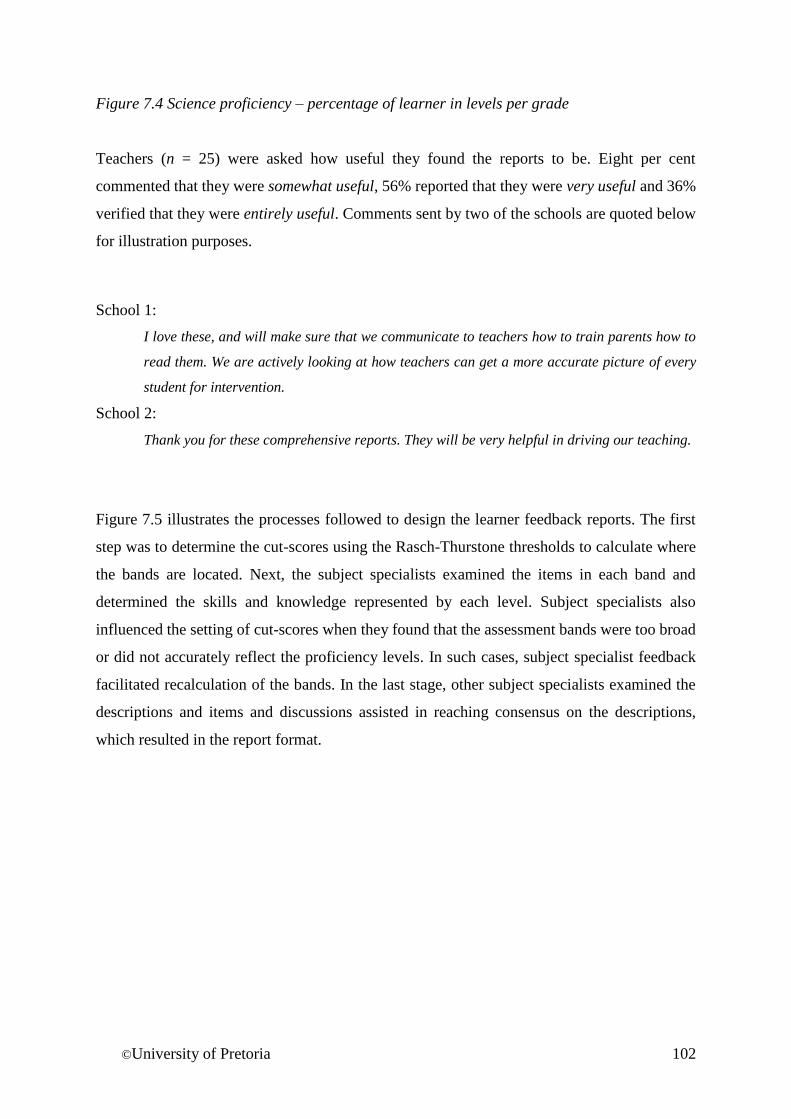
©University of Pretoria 102
Figure 7.4 Science proficiency – percentage of learner in levels per grade
Teachers (n = 25) were asked how useful they found the reports to be. Eight per cent
commented that they were somewhat useful, 56% reported that they were very useful and 36%
verified that they were entirely useful. Comments sent by two of the schools are quoted below
for illustration purposes.
School 1:
I love these, and will make sure that we communicate to teachers how to train parents how to
read them. We are actively looking at how teachers can get a more accurate picture of every
student for intervention.
School 2:
Thank you for these comprehensive reports. They will be very helpful in driving our teaching.
Figure 7.5 illustrates the processes followed to design the learner feedback reports. The first
step was to determine the cut-scores using the Rasch-Thurstone thresholds to calculate where
the bands are located. Next, the subject specialists examined the items in each band and
determined the skills and knowledge represented by each level. Subject specialists also
influenced the setting of cut-scores when they found that the assessment bands were too broad
or did not accurately reflect the proficiency levels. In such cases, subject specialist feedback
facilitated recalculation of the bands. In the last stage, other subject specialists examined the
descriptions and items and discussions assisted in reaching consensus on the descriptions,
which resulted in the report format.
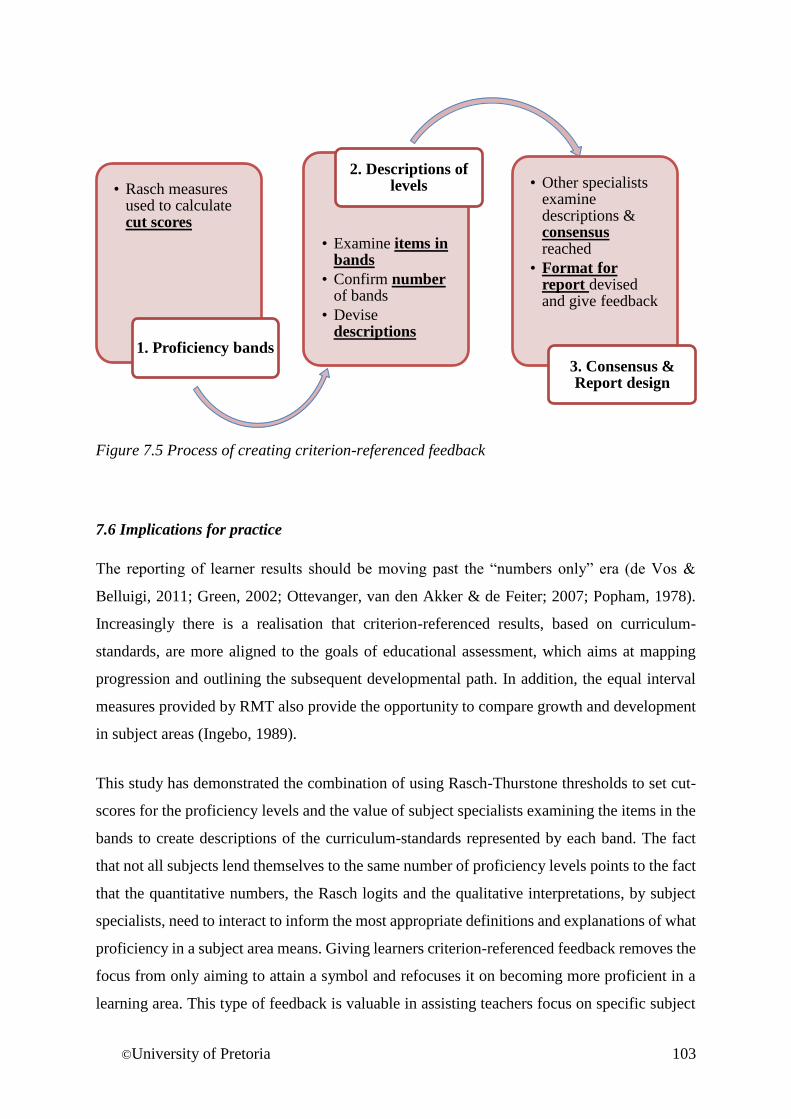
©University of Pretoria 103
Figure 7.5 Process of creating criterion-referenced feedback
7.6 Implications for practice
The reporting of learner results should be moving past the “numbers only” era (de Vos &
Belluigi, 2011; Green, 2002; Ottevanger, van den Akker & de Feiter; 2007; Popham, 1978).
Increasingly there is a realisation that criterion-referenced results, based on curriculum-
standards, are more aligned to the goals of educational assessment, which aims at mapping
progression and outlining the subsequent developmental path. In addition, the equal interval
measures provided by RMT also provide the opportunity to compare growth and development
in subject areas (Ingebo, 1989).
This study has demonstrated the combination of using Rasch-Thurstone thresholds to set cut-
scores for the proficiency levels and the value of subject specialists examining the items in the
bands to create descriptions of the curriculum-standards represented by each band. The fact
that not all subjects lend themselves to the same number of proficiency levels points to the fact
that the quantitative numbers, the Rasch logits and the qualitative interpretations, by subject
specialists, need to interact to inform the most appropriate definitions and explanations of what
proficiency in a subject area means. Giving learners criterion-referenced feedback removes the
focus from only aiming to attain a symbol and refocuses it on becoming more proficient in a
learning area. This type of feedback is valuable in assisting teachers focus on specific subject
• Rasch measures used to calculate cut scores
1. Proficiency bands
• Examine items in bands
• Confirm numberof bands
• Devise descriptions
2. Descriptions of levels • Other specialists
examine descriptions & consensus reached
• Format for report devised and give feedback
3. Consensus & Report design
©University of Pretoria 104
areas in the curriculum, particularly where there are gaps in understanding so that learners can
move more smoothly along the continuum of developing proficiency in a subject area. When
teachers refocus their teaching, they are also likely to align their classroom assessments to the
changes.
There are of course, limitations of implementation. Not all assessments have been designed to
give criterion-referenced feedback. The process of setting cut-scores, creating descriptions for
proficiency levels and validating the process requires expertise and resources to which teachers
may not always have access. It should also be noted that in contexts where there are a greater
number of learners in a class, it might also be more challenging to give each child such detailed
feedback. Where external assessments such as systemic and standardised tests are concerned,
the focus may be on norm-referenced results for comparative purposes. This article suggests
that even when benchmarking and comparing learners, schools or systems is the aim of the
assessment, criterion-referenced reporting should be included as it can positively influence the
learners and teachers and is specifically linked to curriculum-standards attainment. Large-scale
assessments and systemic testing can be costly to implement and time-consuming for learners
while disrupting teaching and school functioning. As a matter of social responsibility, the
findings from such studies and assessments should be used to directly benefit the learners and
criterion-referenced reporting is one way this can be accomplished.
While there are still challenges for reporting criterion-referenced results, the findings in this
article suggests that progressively more emphasis should be placed on this type of feedback
and less on norm-referenced feedback. The Rasch theory can effectively be used to set cut-
scores to create proficiency bands and subject specialists should provide descriptions of each
level and curriculum-standards represented in levels. The Rasch Item Map method can be used
to align assessments and curriculum-standards by linking content to results. This results in
diagnostic type feedback, which can be used by learners, parents and teachers to enhance
teaching and learning.
©University of Pretoria 105
7.7 Future research
It is suggested that continued research could expand the findings by having larger samples and
conducting cross-validation studies using subsets of learners or test items (Jiao et al., 2011).
This would allow for examining the reproducibility of the competency levels in various sample
sizes of learners and items across time. More stable parameters for classifying learners into
competency bands could be identified, increasing the correct classification of persons. Ways
in which to introduce criterion-referenced reporting in the school system should also be
explored. Possibilities include assessments or items on a platform for teacher use which
comprise proficiency bands for reporting purposes.
©University of Pretoria 106
Chapter 8 - Discussion and Conclusions
I was taught that the way of progress was neither swift nor easy.
(Currie, 1923, p.168)
8.1 Introduction
The studies and chapters included in this thesis have all centred on measurement challenges in
the social sciences and how Rasch models and theory can be used to solve problems and
improve results. The studies reported on in Chapter 5, Chapter 6, and Chapter 7 all rest on the
premise that measurement plays an essential role in the discipline of monitoring learning
progress and academic achievement. Accurate measurement is presented as the method through
which education and psychology are established as scientific fields of study. In the South
African educational landscape, monitoring academic achievement can play a pivotal role in
releasing the binding constraints which inhibit the system. Rasch models are the mechanisms
through which the scientific principles of measurement can be applied and the validity of
inferences derived from instruments. Through the application of psychometric theory,
instruments utilised to monitor academic achievement are strengthened and evidence of
construct validity can be collected.
Education and cognitive psychology stand at a pivotal point in history and societies, as
education can give individuals the opportunities for personal and financial improvement and
wellness, escalating their quality of life (Antoninis et al., 2016; Fontannaz, 2012; UNESCO,
2015). The enhancement of education can take place if there is accurate monitoring and
tracking of learning progression (Dampier, 2014). The argument was made throughout this
thesis that monitoring academic achievement should take place via the use of high-quality
assessments to enhance teaching and learning and fill gaps in knowledge and skills (Archer,
2011; Scherman et al., 2017). An emphasis on content-driven feedback is recommended so that
competing with others is less imperative and building the individual’s skills and knowledge
becomes the focus point. The Rasch models offer ways by modelling the developmental
pathways taken in learning a skill (Long, 2015). Internationally, there is a shift to making
measures in the social sciences as explicit and dependable as possible (Panayides, Robinson &
Tymms, 2010). South Africa is also participating in this change, but faces the challenge of
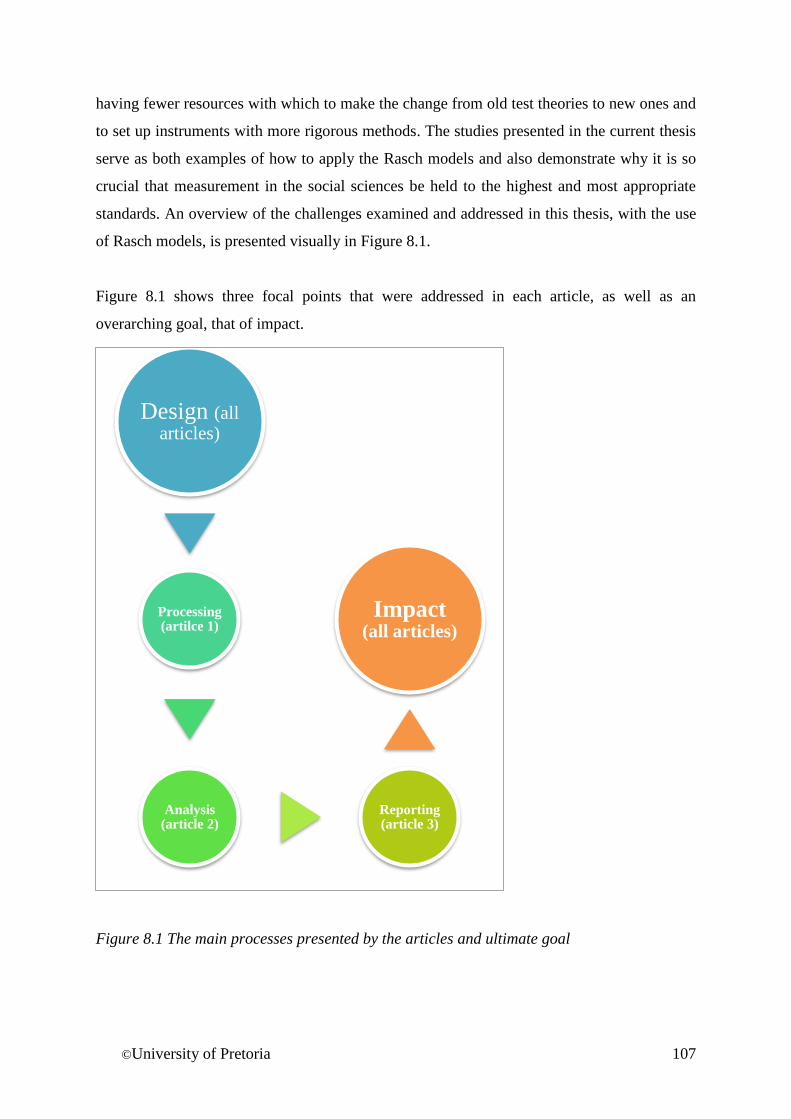
©University of Pretoria 107
having fewer resources with which to make the change from old test theories to new ones and
to set up instruments with more rigorous methods. The studies presented in the current thesis
serve as both examples of how to apply the Rasch models and also demonstrate why it is so
crucial that measurement in the social sciences be held to the highest and most appropriate
standards. An overview of the challenges examined and addressed in this thesis, with the use
of Rasch models, is presented visually in Figure 8.1.
Figure 8.1 shows three focal points that were addressed in each article, as well as an
overarching goal, that of impact.
Figure 8.1 The main processes presented by the articles and ultimate goal
Design (all articles)
Processing (artilce 1)
Analysis (article 2)
Reporting (article 3)
Impact (all articles)
©University of Pretoria 108
Underlying all three articles and the study as a whole, is the scientific design of the instruments
through the application of Rasch models. The first article (see Chapter 5) focussed on dealing
with missing data and processing data. The second article (Chapter 6) dealt with anchor items
and reframing results. The last article in Chapter 7 examined the contribution of Rasch theory
to the reporting of results that are criterion-referenced. While Rasch theory is often referenced
as imperative to the design of an instrument, the articles included here have shown how useful
the models can be at every step of the instrument’s application.
8.2 Summary of methodology
Each phase of instrument design and use can present the researcher with different challenges.
In this thesis, the challenges were: dealing with missing data (processing), tracking learning
progression through common items and reframing results (analysis), and reporting of results
with criterion-referenced bands (dissemination).
Article 1, reported on in Chapter 5, dealt with non-ignorable missing data. The values could
not be dropped or excluded; they were crucial to monitoring learning progression over time. In
this study, multiple imputation (MI) was used to predict missing values with Rasch Person
Measures as predictors after applying Structural Equation Modelling (SEM). Checks of the
accuracy of the imputations showed this to be a suitable solution. Missing values and more
specifically Missing Not At Random (MNAR) data presented a threat to the validity of the
analysis. An innovative and apt method for handling the missing data was sought and found.
Here Rasch models played an important role by providing reliable predicators for the SEM and
consequently, improved the imputations and statistical validity of the results.
The second study, discussed in Chapter 6, examined methods for establishing the usefulness of
anchor items to track learning progression and reframe test results so that pre and post-test
results can be compared more accurately. The problem of evaluating anchor items for accuracy
of tracking learning from one year to the next was resolved by applying non-parametric
statistics and the Rasch Model to identify items that did not contribute to monitoring learning
over time. Placing the results from Time 1 and Time 2 in the same measurement frame was
another aspect of testing and research explored. Applying Rasch models reframed results for
more accurate tracking and monitoring of learning progression and resolved the problem that
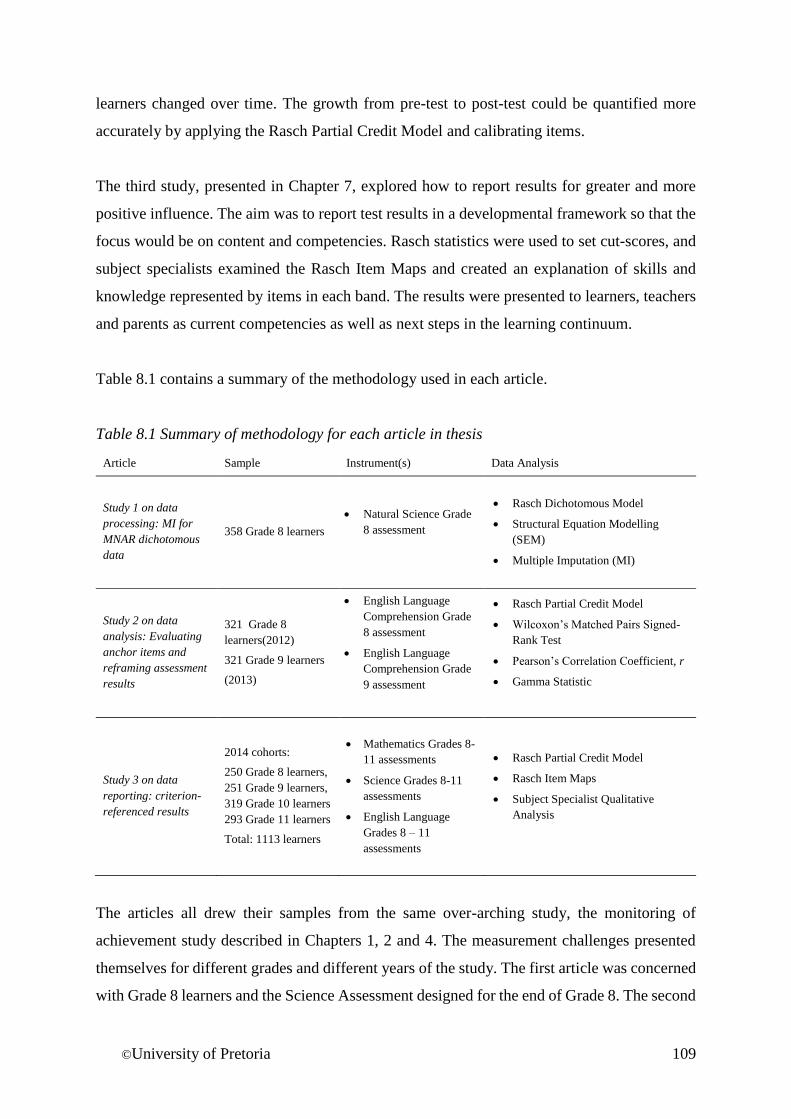
©University of Pretoria 109
learners changed over time. The growth from pre-test to post-test could be quantified more
accurately by applying the Rasch Partial Credit Model and calibrating items.
The third study, presented in Chapter 7, explored how to report results for greater and more
positive influence. The aim was to report test results in a developmental framework so that the
focus would be on content and competencies. Rasch statistics were used to set cut-scores, and
subject specialists examined the Rasch Item Maps and created an explanation of skills and
knowledge represented by items in each band. The results were presented to learners, teachers
and parents as current competencies as well as next steps in the learning continuum.
Table 8.1 contains a summary of the methodology used in each article.
Table 8.1 Summary of methodology for each article in thesis
Article Sample Instrument(s) Data Analysis
Study 1 on data
processing: MI for
MNAR dichotomous
data
358 Grade 8 learners
Natural Science Grade
8 assessment
Rasch Dichotomous Model
Structural Equation Modelling
(SEM)
Multiple Imputation (MI)
Study 2 on data
analysis: Evaluating
anchor items and
reframing assessment
results
321 Grade 8
learners(2012)
321 Grade 9 learners
(2013)
English Language
Comprehension Grade
8 assessment
English Language
Comprehension Grade
9 assessment
Rasch Partial Credit Model
Wilcoxon’s Matched Pairs Signed-
Rank Test
Pearson’s Correlation Coefficient, r
Gamma Statistic
Study 3 on data
reporting: criterion-
referenced results
2014 cohorts:
250 Grade 8 learners,
251 Grade 9 learners,
319 Grade 10 learners
293 Grade 11 learners
Total: 1113 learners
Mathematics Grades 8-
11 assessments
Science Grades 8-11
assessments
English Language
Grades 8 – 11
assessments
Rasch Partial Credit Model
Rasch Item Maps
Subject Specialist Qualitative
Analysis
The articles all drew their samples from the same over-arching study, the monitoring of
achievement study described in Chapters 1, 2 and 4. The measurement challenges presented
themselves for different grades and different years of the study. The first article was concerned
with Grade 8 learners and the Science Assessment designed for the end of Grade 8. The second
©University of Pretoria 110
article used the data from the English Language assessments for Grades 8 and 9. The last article
utilised information from all four grades in the 2014 year of the study.
Rasch models provide the researcher with support for processing data from tests, checklists
and questionnaires. The models can be used to produce a true interval scale, ordering items and
persons according to difficulty and ability, and then aligning them (Boone et al., 2014). Rasch
item and person estimates can be used as variables which are on an interval scale, normally
distributed (if spread of items to persons is well distributed) and more precisely representative
of the construct. Using an interval scale in turn offers more statistical options, such as using
parametric tests and can therefore improve the statistical validity of a study. Finding ways to
deal with missing data is also crucial, and here the Rasch models have two strengths: they are
robust to relatively large quantities of missing data (up to 50%) and can also be used in the
imputation process because of the probabilistic nature of the mathematical model and the
individual person item calibrations. Rasch models also have other advantages during the data
processing stage, such as identifying problematic items which do not add to the measures or
distort the measures. Problematic items can be removed prior to analysis or improved if the
instrument is in a pilot stage. Other processing additives include identifying whether categories
function adequately and collapsing categories where needed. Aspects such as bias in items can
also be examined. In the multi-cultural and multi-lingual context of South Africa, this is
especially important.
The models themselves provide an analysis of the instrument’s functioning. Rasch models can
contribute to data analysis in other ways, as demonstrated in the second article. The most
common goal of research is to measure change, from pre-test to post-test or measure growth at
different points in time. Rasch models can be used to anchor instruments when common items
are built into the framework. Or if the same instrument is used in the pre-test and post-test
design, Rasch modelling can be used to reframe the results so that the change over time is
measured more precisely. In both scenarios, Rasch models have the potential to make
significant contributions to the analysis of the data and to enhancing the accuracy of the results
and reporting. With an emphasis on developmental pathways and monitoring progression,
Rasch models give researchers the opportunity to place more focus on how an individual is
growing or progressing on a given construct. This is in contrast to only comparing persons or
groups. Both norm-referencing and criterion-referencing are vital to understanding a construct
and formulating interventions. But when offering feedback to the individual stakeholders, it
©University of Pretoria 111
may be more beneficial to present evidence of what has been gained and how to progress further
along the line.
8.3 Summary of results for research questions
Each article presented in this thesis offered pioneering solutions for challenges such as missing
data, monitoring progression and reporting results. Table 8.2 displays each research question
for the respective studies as well as the results. For the first article, the research questions were
answered by identifying which variables could be used to model the missingness with
Structural Equation Modelling (SEM). To answer the question of how to best identify a model
which would be appropriate for imputing the missing values, several models were fitted and a
recursive model was found to be the best fit. Applying Rasch theory strengthened the modelling
by providing variables which correlated more highly with the items than raw total scores.
The second article’s research questions were answered by using a combination of Rasch items,
non-parametric and parametric statistics. The result was that items for improvement were
identified and two items were removed from the instrument after consultation with subject
specialists. The second article also examined how the Rasch model could be applied to reframe
measures from different times. The result was that after the application of the model, more
accurate and precise indications of growth was obtained.
The third article looked at the contribution of Rasch models to report criterion-referenced
feedback. Rasch item maps were generated and subject specialists examined the spread of the
items, commented on the utility of the number of the bands and defined the skills within each
band. The result was paragraphed descriptions of what learners can do in each subject area as
well as an explanation of the next set of skills they need to learn. The descriptions were included
in reports which learners, parents and teachers received and used.
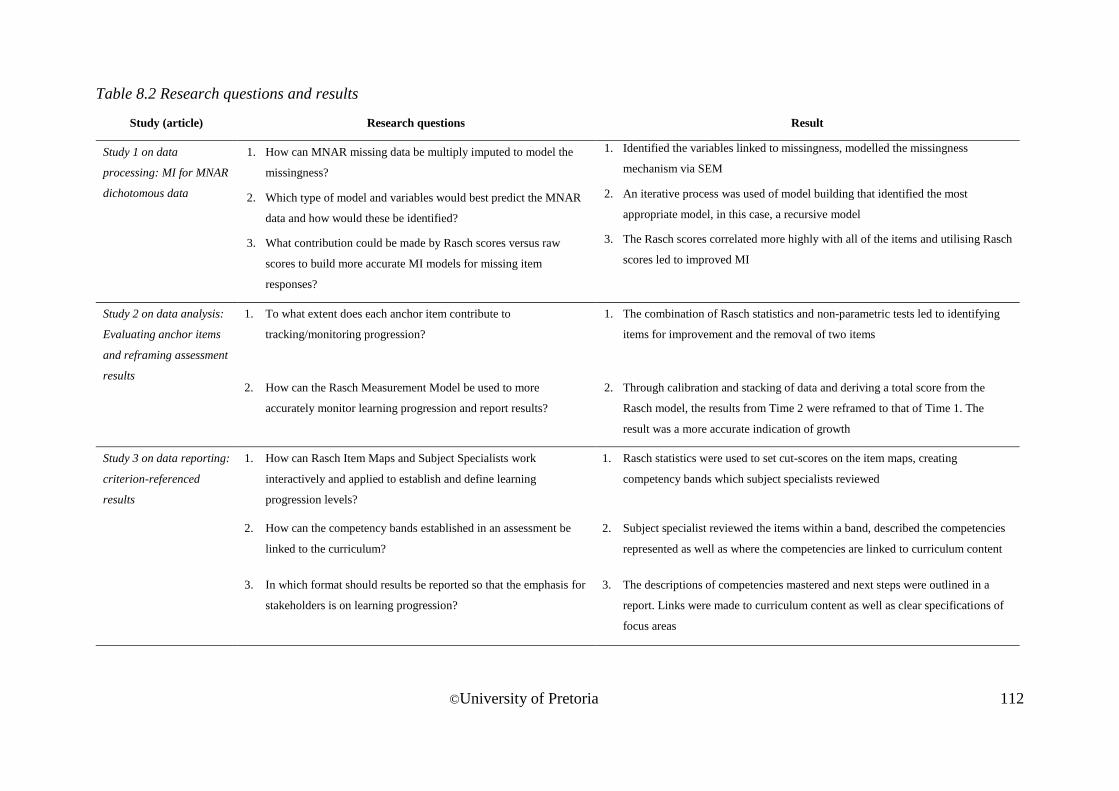
©University of Pretoria 112
Table 8.2 Research questions and results
Study (article) Research questions Result
Study 1 on data
processing: MI for MNAR
dichotomous data
1. How can MNAR missing data be multiply imputed to model the
missingness?
1. Identified the variables linked to missingness, modelled the missingness
mechanism via SEM
2. Which type of model and variables would best predict the MNAR
data and how would these be identified?
2. An iterative process was used of model building that identified the most
appropriate model, in this case, a recursive model
3. What contribution could be made by Rasch scores versus raw
scores to build more accurate MI models for missing item
responses?
3. The Rasch scores correlated more highly with all of the items and utilising Rasch
scores led to improved MI
Study 2 on data analysis:
Evaluating anchor items
and reframing assessment
results
1. To what extent does each anchor item contribute to
tracking/monitoring progression?
1. The combination of Rasch statistics and non-parametric tests led to identifying
items for improvement and the removal of two items
2. How can the Rasch Measurement Model be used to more
accurately monitor learning progression and report results?
2. Through calibration and stacking of data and deriving a total score from the
Rasch model, the results from Time 2 were reframed to that of Time 1. The
result was a more accurate indication of growth
Study 3 on data reporting:
criterion-referenced
results
1. How can Rasch Item Maps and Subject Specialists work
interactively and applied to establish and define learning
progression levels?
1. Rasch statistics were used to set cut-scores on the item maps, creating
competency bands which subject specialists reviewed
2. How can the competency bands established in an assessment be
linked to the curriculum?
2. Subject specialist reviewed the items within a band, described the competencies
represented as well as where the competencies are linked to curriculum content
3. In which format should results be reported so that the emphasis for
stakeholders is on learning progression?
3. The descriptions of competencies mastered and next steps were outlined in a
report. Links were made to curriculum content as well as clear specifications of
focus areas
©University of Pretoria 113
8.4 Reflection on methodology
The blind peer reviewers from the journals, the thesis supervisors and other colleagues
suggested ways to strengthen or change the methodology, analysis and conclusions. This
reflection section contains a consideration of the ways the methodology was improved as well
as the implication of the iterations. During the analysis and write up of the first article (missing
data), an attempt was made to devise a new model to impute the missing data based on the
Rasch model. Reviewers advised that tried and tested methods should be used instead, such as
Multiple Imputation (MI). Existing missing data methods were better options as those methods
were established and refined for the purpose of imputing missing data. Due to the
recommendations, the first article was completely rewritten, with a new methodology and data
analysed afresh. A new methodology was devised, combining existing methods (Multiple
Imputation) with Rasch measures as predictors. The usefulness of modelling the data with
Structural Equation Modelling was explored, where after the imputations were done in SPSS.
The second article went through a similar process, but this time major changes to the
methodology were recommended by Professor Tim Dunne (emeritus professor of statistics at
the University of Cape Town). Originally the second article used only parametric statistics to
analyse the items. But Professor Dunne (statistician) highlighted the fact that dichotomous
items are not on a continuous scale, and therefore not suitable for parametric statistics. Instead
the statistician recommended using the Gamma statistic as well as other non-parametric tests
(Kruskal-Wallis). Based on his recommendations, the methodology was recreated and analysis
for the second article was redone. The main benefit was correct comparisons and more accurate
results.
The third article (bands) had several options for its methodology. Methods for setting cut-scores
and devising competency descriptions were considered for the article, including: Angoff’s
method, Ebel, Nedelsky method, adjusted Angoff’s method and Bookmark methods. Each
method has advantages and disadvantages; for example, the Angoff’s methods has the potential
disadvantage that judges find it difficult to estimate item response probabilities for minimally
competent candidates (Ricker, 2006). Methods such as Angoff’s and the Bookmark method
©University of Pretoria 114
may require not only a panel of experts, but also that such experts receive training to reduce
their propensity to give biased ratings (Arce & Wang, 2012). When Rasch models are applied
and present evidence for construct validity, it becomes possible to use person measures as a
method for setting standards as opposed to relying on raters or judges. According to Khatimin
et al., (2013), using Rasch Objective Standard Setting mitigates some of the problems with
using panellists to set cut scores and standards. The Rasch item map method was applied in the
third article as it presented a viable alternative to panel methods and has built in validation
checks as the bands are determined by performance on the items and not subjective opinion
alone. The Rasch item map method combines the elements of quantitative (performance on
items) with qualitative evaluation of what that performance means. After the major revisions
discussed above were implemented, changes were made to the methodology and this is
explained in more detail in the section below.
Article 1: Missing Data. The blind reviewers advised that details of the methods used in the
study should be explained more clearly, whereas as before only explanations of the software
were provided. Both the introduction and the methods section were too long, which made the
reading of the article tiresome. Writing in a way that is both succinct and yet adequate, is a
challenge for any writer, indeed for any format of communication. The reviewers advised that
the discussion section should be revised to clearly explain the rationale for each finding and
then to discuss how the results could be used as the population selected limits generalisability.
The methodology required clearer justifications for why the data were classified as MNAR, and
why the recursive SEM model was used. The reviewers also recommended providing a pseudo
R2 for the model, an explanation as to why correlations of -.179 and .285 were considered to be
moderate in size. Due to the fact that a Bayesian analysis with MCMC algorithm had been
conducted, one reviewer recommended providing the properties of the prior distribution and to
explain how the model would differ from a conventional path analysis such as using weighted
least squares. The recommendations emanating from the study were judged to be too firm,
considering the limits of the sample used. Instead, it was recommended that the steps be listed
rather than providing pointed recommendations. The official supervisors also added to this
paper by correcting errors; for example, that item and person measures were not calculated
conjointly in the Rasch model, but separately and then aligned.
©University of Pretoria 115
Article 2: Anchor item evaluation. The methods in the second article were significantly
reworked based on the suggested use of the gamma statistic, as well as the use of the Wilcoxon’s
Matched Pairs Signed-Rank Test due to the ordinal nature of item level data. The advice proved
to be invaluable, and the analysis and interpretation were considerably revised based on his
suggestions. The changes results in more accurate comparisons of the anchor items from one
year to the next, especially the identification of items that did not show improvement. The blind
reviewers from the journal added suggestions, these included that the literature section be
rewritten more concisely, that the difference between home language and additional language
learners be explained more clearly as well as why the sample had considerably more girls than
boys. The reviewers also advised that items from the test should be shown, and this was added
as an appendix (see Appendix E). A section on learner motivation was also included in the
paper based on recommendations from the blind reviewers, and this strengthened the argument
as it is important to take into account learner motivation for external assessments. The sample
description was expanded based on suggestions from the official supervisors, and mean age and
gender was added to the methodology section. The blind reviewers asked for a more detailed
description of the Rasch model used as well as justification, and this was added to strengthen
the argument of the paper. The blind reviewers wanted an explanation as to why Pearson’s
Correlation coefficient, r, was used as the effect size indicator when other formulae are
available. Justifications for this method use were also added to the paper (see Chapter 6).
Article 3: Competency Bands. This article was presented at a conference, and later published.
Both the audience at the conference, as well as the blind reviewers from the journal provided
useful insights. The blind reviewers asked for more details on the assessment instruments, such
as how they were developed and how the assessment frameworks were set up. The section on
the methodology was expanded to include a more detailed description of the instruments. The
audience and blind reviewers asked for better explanations of how the different cohorts could
be compared, and the author added a section explaining the use of the anchor items that linked
instruments across years. A member of the audience at the conference challenged the multi-
purpose use of the assessment instruments. The assessments were used for both monitoring of
academic achievement and for feedback into the schooling system. The issue of using
assessment results for multiple purposes as opposed to designing and using results for only one
is debatable. Both sides of the argument can be defended, and the inputs from the audience
©University of Pretoria 116
member contributed to the article by prompting an argument for the multi-purposed use of the
assessment results.
The methods of each article contributed to fields of social science by presenting innovative
ways to deal with measurement challenges faced in the processing, analysis and reporting of
social science data. The overarching methodology of the thesis was the application of Rasch
Measurement Theory (RMT). The usefulness of RMT in contributing to the processing,
analysis and reporting of academic achievement results was presented in each article
respectively. Overall, RMT provides a strong framework for social sciences to approximate
true measurement as found in the natural sciences. Further evidence for the use of RMT as a
guiding methodology was presented in Chapter 3, in terms of making valid inferences from the
assessment instruments. RMT supported the construct validity of the instruments in the
development and refinement of the instruments. Evidence for the content, concurrent and
predictive validity was also collected and was found to be adequate for all the assessment
instruments, further supporting the positive impact that using RMT as methodology had on the
assessment design and development.
8.5 Reflection on conceptual framework
A psychometric model of instrument development and analysis served as the conceptual
framework (see Figure 3.2 in Chapter 3). The model was based on best practice in psychometric
theory as well as guidelines embodied by the Rasch models (Boone, Townsend & Staver, 2011;
Osborne, 2008; Wright, 1977; Wright & Stone, 1979). The conceptual model is suitable for the
type of research reported in this thesis, namely that of meta-science (see Chapter 1). The
conceptual framework represented each phase of instrument development, whereas the studies
described focused on the processing, analysis and reporting phases of the framework (D to I).
The other phases were implied and had been implemented when the instruments were
developed and updated (see Figure 8.1).
The conceptual framework shows the full life cycle of the instrument, from conceptualisation
to application, as well as analysis and reporting of results. The philosophy and theory
underlying the best test design used in this thesis is also shown on the framework, that of Rasch
©University of Pretoria 117
theory (A0). Within the context of this thesis, each step (A to I) was crucial and contributed to
the studies represented here. The instruments (school subject assessments) were developed
prior to the articles being written in a project described in more detail in Chapter 4. The
processes of operationalisation (A), framework and item design (B), piloting (C), application
of the Rasch models (D), instrument refinement (E) and instrument administration (F) all took
place before the secondary analysis but remain crucial stepping stones.
The first article in this thesis dealt with missing data, which fits with the data processing step
(G) in the conceptual model. Article 1 demonstrated how Rasch models can make a useful
contribution to the imputation of missing data as well as using Rasch measures as possible
predictors in SEM models (linked to step H of data analysis). The second article was also based
in part on the processing step (G), as items were anchored and fixed to difficulties. The second
article went to the next step, that of analysing the data (H) where Rasch models were used to
reframe results for more precise measurement of change taking place over time. The third article
dealt with the final step, the dissemination of findings from the instrument administration (I).
Here the value of Rasch theory for reporting criterion-referenced feedback was explored and
demonstrated by creating competency bands to report the results. The conceptual model served
both as guidance for the development of the instruments prior to the studies (A to F), as well as
indications of further uses for the Rasch model when applied in the studies (G to I).
8.6 Limitations of the study
Like all studies, the applications and results are limited to some extent to the sample population:
South African high school learners as well as the sample sizes and the constructs. The
assessments were designed to assess Grades 8 to 11 in Science, Mathematics and English
Language and findings may be more relevant for the subjects. The fact that the independent
schools in the study are seen as a separate population, also means that the generalisability of
the findings are limited. The methods in the current studies could be applied to larger samples,
to constructs other than cognitive abilities and to a wider variety of populations. An important
limitation of Rasch models should also be noted here: they cannot negate the effects of
inadequate instrument design.
©University of Pretoria 118
Valid inferences from assessments may be limited when:
the construct was not well-defined;
the range was not considered;
the items were not designed with inputs from subject specialists;
the context of the population not taken into consideration; and
refinement of items based on pilot results did not take place.
As all steps were followed, as shown in the conceptual framework, the following limitation is
not applicable to the current studies but should be mentioned as a general limitation of the
models. Applying Rasch models after the design of an ill-planned instrument cannot undo or
redo what has not been done. In such cases, Rasch models could show which items lack fit, as
well as the overall functioning of the instrument but the onus lies with the designers to address
the underlying issues of construct validity. The processing, analysis and reporting of data
derived from an instrument which lacks the basis of good design would also be questionable.
The studies rested on the assumptions that the first phases of the conceptual framework were
firmly in place and had been adequately applied.
8.7 Recommendations
Each article has its own results and recommendations (see Table 8.2). The main
recommendation emanating from the thesis as a whole is that Rasch Measurement Theory be
taught in social science courses as well as in statistics, qualitative and quantitative research
courses. This will equip future researchers with the skills and knowledge to develop high quality
and appropriate instruments within their field. This in turn would strengthen any given field
and have a positive impact on the individuals, groups and societies they study and serve. The
conceptual framework (see Figure 3.2) can be used as a basic guide for developing an
instrument and utilising its data for dissemination.
©University of Pretoria 119
The five main recommendations emanating from this thesis are:
1) For practice, use the best available models and processes as demonstrated in the
conceptual framework and throughout this thesis. When instruments are designed
according to the principles of measurement as presented by RMT, more evidence for
valid inferences can be assembled and instruments can conform to higher standards.
2) Future research for the monitoring of academic achievement can be enhanced by the
application of Rasch models at each stage of instrument design, refinement, use and
reporting of results. Future research can investigate the application of Rasch models to
evaluate anchor items and reframe test re-test results. Other areas for investigation
include the examination of Rasch measures in MI and SEM, and how the models can
be used to report results as content feedback.
3) The Rasch models are exemplars of how measurement principles can be applied in the
social sciences. To strengthen disciplines such as psychology and education, it is
recommended that the models be taught as a part of statistical courses at fourth year
level.
4) Monitoring systems such as the one upon which the studies in thesis are based, can also
be used to inform teaching and learning practices. The external monitoring of academic
achievement, such as is found in this study and other systemic evaluations, should
benefit all the stakeholders. This was demonstrated in the final article on the creation of
competency bands for criterion-referenced feedback.
5) The use of sophisticated psychometric methods such as RMT in developing contexts
may be more limited than is desirable due to socio-economic constraints and lack of
knowledge. To promote the application of statistical models such as Rasch models,
various forms of marketing should be done by proponents of the models. This includes
workshops, conferences, presentations and publications for government and non-
government stakeholders. Rasch could be applied to a variety of disciplines, including
education and psychology.
Investing in sound measurement is the best way forward and will lead to quality instruments
being designed. In turn reliable and valid inferences can be drawn from educational monitoring
programmes. Sound measurement produces fair comparisons, the identification of areas for
©University of Pretoria 120
enhancement and identifies if system-wide improvements are taking place. Sound measurement
is both a scientific and social justice issue for future research.
8.8 Conclusion
Rasch measurement theory makes an especially vital contribution to the construction of
instruments in the social sciences, by converting the principles of measurement into models and
producing statistics which indicate to what extent an instrument conforms to the principles.
Following the principles of measurement allows for approaching true measures, moving
towards accessing of latent constructs in the softer sciences and elevates fields such as
education and psychology. Progress can be assessed with greater precision and improvement
more accurately tracked over time. Considering that constructs in the soft sciences are latent
and socially constructed, it is all the more important to find evidence of their existence and to
measure with some degree of certainty. It is here that Rasch modelling offers social scientists a
golden opportunity: the scientific development and application of instruments. Throughout the
chapters and articles included here, various aspects of the Rasch theory have been examined
and applied. More importantly, the contribution of the models to three pivotal phases of the
research process was examined: data processing, analysis and reporting. In each of the three
research processes, the Rasch models were applied to serve as innovative and useful solutions
to problems or challenges. The applications of the Rasch models continue to be explored in
various fields, including the natural sciences. More uses for Rasch Theory continue to be found,
and this thesis contributes to that body of knowledge and to the strengthening of measurement.
©University of Pretoria 121
9. References
Acton, G. S. (2003). What Is Good About Rasch Measurement? Rasch Measurement Transactions, 16, 902-903.
Airasian, P. (1997). Classroom assessment (3rd ed.). New York: McGraw-Hill.
Allison, P. D. (2002). Missing Data. California: Sage.
American Psychiatric Association. (2013). Diagnostic and statistical manual of mental disorders: DSM-5. Washington,
D.C: American Psychiatric Association.
Andrich, D. (2001). Introduction: Administering Analysing and Improving Tests. This reviews the concepts used in the
analysis of test data. Rasch Measurement Transactions 14 (4).
Andrich, D. (2004). Controversy and the Rasch model: A characteristic of incompatible paradigms? Medical Care, 42, 7-16.
Andrich, D. (2011). Rasch Models for Measurement. United States of America: Sage.
Andrich, D. (2016). Georg Rasch and Benjamin Wright’s Struggle with the Unidimensional Polytomous Model with
Sufficient Statistics. Educational and Psychological Measurement, 76(5), 713–723.
Andrich, D., Sheridan, B. & Luo, G. (2009a). Interpreting RUMM 2030 Manuals. Perth: RUMM Laboratory.
Andrich, D., Sheridan, B. & Luo, G. (2009b). RUMM 2030: Rasch Unidimensional Models for Measurement [Computer
Software]. Perth: RUMM Laboratory.
Annual Review of Applied Linguistics. (2009). Language assessment in education: Tests, Curricula and Teaching.
(2009). Annual Review of Applied Linguistics: An Official Journal of the American Association for Applied
Linguistics, 29(1), 90-100.
Antoninis, M., Delprato, M. & Benavot, A. (2016). Inequality in education: the challenge of measurement. In: World social
science report, 2016: Challenging inequalities; pathways to a just world. Paris: UNESCO.
Arbuckle, J. L. (2014a). Amos (Version 23.0) [Computer Program]. Chicago: IBM SPSS.
Arbuckle, J. L. (2014b). Amos 23.0 User's Guide. Chicago: IBM SPSS.
Arce, A. J., & Wang, Z. (2012). Applying Rasch Model and Generalizability Theory to Study Modified-Angoff Cut Scores.
International Journal of Testing, 12, 44–60.
Archer, E. (2011). Bridging the gap: optimising a feedback system for monitoring learner performance. (Doctoral of
Education, University of Pretoria, Pretoria South Africa).
Aron, J., Kahn, B., & Kingdon, G. (2009). South African economic policy under democracy. Oxford: Oxford University
Press.
Aste, M., Boninsegna, M., Freno, A., & Trentin, E. (2015). Techniques for dealing with incomplete data: A tutorial and
survey. Pattern Analysis and Applications, 18(1), 1-29.
Australian Council for Educational, R. (2015). The Southern and Eastern Africa Consortium for Monitoring Educational
Quality. Perth: Assessment GEMS (8).
Baghaei, P. (2008). The Rasch Model as a Construct Validation Tool. Rasch Measurement Transactions, 22(1), 1145-1146.
©University of Pretoria 122
Bansilal, S. (2011). Assessment reform in South Africa: opening up or closing spaces for teachers? Educational Studies in
Mathematics, 78(1), 91-107.
Bennett, R. E. and Gitomer, D. H. (2009). Transforming K-12 Assessment: Integrating Accountability Testing, Formative
assessment and professional Support. New York: Princeton.
Bennett, J., Tognolini, J. & Pickering, S. (2012). Establishing and applying performance standards for curriculum-based
examinations, Assessment. Education: Principles, Policy & Practice, 19(3), 321-339.
Bennett, R. E. (2010). Cognitively based assessment of, for, and as learning: A preliminary theory of action for summative
and formative assessment. Measurement: Interdisciplinary Research and Perspectives 8 (2), 70–91.
Bennett, R. E. (2011). Formative assessment: a critical review. Assessment in Education: Principles, Policy & Practice, 18
(1), 5-25.
Bercher, D. A. (2012). Self-monitoring tools and student academic success: When perception matches reality. Journal of
College Science Teaching, 41(5), 26–32.
Bertoli-Barsotti, L. & Punzo, A. (2013). Rasch Analysis for Binary Data with Nonignorable Nonresponses. Psicologica,
34(1), 97–123.
Black, P. (1998). Testing: Friend or Foe? Theory and Practice of Assessment and Testing. NY: Routledge Falmer.
Bloch, G. (2008). Investment choices for South African education. Johannesburg, South Africa: Wits University Press.
Bolarinwa, O. A. (2015). Principles and methods of validity and reliability testing of questionnaires used in social and health
science researches. Nigerian Postgraduate Medical Journal, 22,195-201.
Bond, T. G., & Fox, C. M. (2015). Applying the Rasch Model: Fundamental Measurement in the Human Sciences (Ed. 3).
New York: Routledge.
Bond, T. G. (2003). Validity and assessment: a Rasch measurement perspective. Metodología de las Ciencias del
Comportamiento 5(2), 179–194.
Boone, W. J. (2016). Rasch Analysis for Instrument Development: Why, When, and How? CBE Life Sciences Education,
15(4), rm4. http://doi.org/10.1187/cbe.16-04-0148
Boone, W. J. (2016). Rasch Analysis for Instrument Development: Why, When, and How? The American Society for Cell
Biology: Life Sciences Education, 15 (4), 1–7.
Boone, W. J., Staver, J. R. & Yale, M. S. (2014). Rasch analysis in the human sciences. London: Springer.
Boone, W. J., Townsend, J. S. and Staver, J. (2011). Using Rasch theory to guide the practice of survey development and
survey data analysis in science education and to inform science reform efforts: An exemplar utilizing STEBI self-
efficacy data. Science Education, 95, 258–280.
Bos, W., Goy, M., Howie, S. J., Kupari, P. & Wendt, H. (2011). Rasch measurement in educational contexts Special issue 2:
Applications of Rasch measurement in large-scale assessments, Educational Research and Evaluation: An
International Journal on Theory and Practice, 17(6), 413-417.
Bruin, A. B. H., Dunlosky, J. and Cavalcanti, R. B. (2017). Monitoring and Regulation of Learning in Medical Education:
The Need for Predictive Cues. Medical Education, 51(6), 575–584.
©University of Pretoria 123
Campbell, N. R. (1920). Physics, the elements. Cambridge: Cambridge University Press.
Cappelleri, J. C., Lundy, J. J., & Hays, R. D. (2014). Overview of Classical Test Theory and Item Response Theory for
Quantitative Assessment of Items in Developing Patient-Reported Outcome Measures. Clinical Therapeutics, 36(5),
648–662.
Care, E. & Kim, H. (2017). Skills for a changing world: South Africa in context. Massachusetts: Brooking Institute.
Carpenter, J., Bartlett, J. & Kenward, M. (2010). Guidelines for handling missing data in Social Science Research. Retrieved
30 January 2014, from www.missingdata.org.uk
Carter, P. (2012). Stubborn roots: Race, culture, and inequality in U.S. and South African schools. New York: Oxford
University Press.
Cavanagh, R. F. & Waugh, R. F. (2011). The Utility of Rasch Measurement for Learning Environments Research. In
Cavanagh, R.F. & Waugh, R.F. (Eds.), Applications of Rasch Measurement in Learning Environments Research, (pp
3 - 15). Rotterdam: Sense Publishers.
Chappuis, J. (2009). Seven Strategies of Assessment for Learning. New York: Pearson.
Clauser, B. E., & Linacre, J. M. (1999). Relating Cronbach and Rasch reliabilities. Rasch Measurement Transactions, 13,
696.
Cohen, D. (1988). Statistical power analysis for the behavioral sciences (2nd ed.). Hillsdale, NJ: Lawrence Erlbaum.
Combrinck, C. & Roux, K. (2015). Michael and Susan Dell Foundation (MSDF) Project Overview: A Developmental
Approach to Information Driven Teaching: Tracking Progression, towards Improving Teaching and Learning in
Coalition Schools. Unpublished Report: University of Pretoria, Pretoria.
Corrigan, D., Gunstone, R., & Jones, A. (Eds.). (2013). Valuing assessment in science education: pedagogy, curriculum,
policy. Retrieved from http://ebookcentral.proquest.com.uplib.idm.oclc.org
Cotton, K. (1988). School Improvement Research Series: Monitoring Student Learning in the Classroom. Washington: U.S.
Department of Education.
Cox, B. E., McIntosh, K. L., Reason, R. D. & Terenzini, P. T. (2014). Working with Missing Data in Higher Education
Research: A Primer in Real-World Example. Review of Higher Education, 37(3), 377-402.
Crameri, A., von Wyl, A., Koemeda, M., Schulthess, P. & Tschuschke, V. (2015). Sensitivity analysis in multiple imputation
in effectiveness studies of psychotherapy. Frontiers in Psychology, 6, 1042.
Cunningham, J. D., & Bradley, K. D. (2010). Applying the Rasch model to measure change in student performance over
time. Paper presented at the 2010 AERA Annual Meeting, Denver, CO.
Currie, M. (1923) Autobiographical Notes. New York: Macmillan.
Curtin, J. A. (2007). Testing the Assumption of Sample Invariance of Item Difficulty Parameters in the Rasch Rating Scale
Model. Utah: Brigham Young University.
Dampier, G. A. (2014). The need for invariant assessments in South African education. South African Journal of Education,
34(2).
©University of Pretoria 124
Dass, S. & Rinquest, A. (2017). School Fees. In Veriava, F., Thom, A. & Fish Hodgson, T. (2017). Basic Education Rights
Handbook – Education Rights in South Africa. Johannesburg: Centre for Child Law.
Davenport, T., & Saunders, C. (2000). South Africa: a modern history. Retrieved from
http://ebookcentral.proquest.com.uplib.idm.oclc.org
Davids, N. (2017). On the Un-Becoming of Measurement in Education. Educational Philosophy and Theory, 49(4), 422-433.
Davies, E. H. and Centre for Education Law and Education Policy (South Africa) (2008). Administration of the education
system and school governance. 2nd ed. Pretoria: Centre for Education Law and Education Policy (Education
transformation).
De Bruin, I. (2011). Exploring how objects used in a Picture Vocabulary Test influence validity. (Master’s thesis, University
of Pretoria, Pretoria South Africa).Retrieved from http://repository.up.ac.za/handle/2263/25218.
de Vos, M. & Belluigi, D.Z. (2011). Formative assessment as mediation. Perspectives in Education, 29(2), 39-47.
Department of Basic Education (DBE). (2011). Curriculum and assessment policy statement (CAPS) grades 10-12: Physical
sciences. Pretoria: Government Printing Works.
Department of Basic Education (DBE). (2012). National protocol for assessment in grades R-12. Pretoria: Government
Printing Works.
Department of Basic Education (DBE). (2014). Education Statistics in South Africa 2014. Pretoria: Government Works.
Department of Basic Education (DBE). (2015). National Senior Certificate Examination Report 2015. Pretoria: Government
Printing Works.
Department of Basic Education (DBE). (2016). National curriculum statements (NCS) grades R-2. Available
athttp://www.education.gov.za/Curriculum/NationalCurriculumStatementsGradesR-12.aspx [Accessed 20 October
2016].
Department of Basic Education (DBE). (2017a). The SACMEQ IV Project in South Africa: A Study of the Conditions of
Schooling and the Quality of Education. Pretoria: Government Printers.
Department of Basic Education (DBE). (2017b). Education in South Africa: Statistical Overview. Available at
https://www.education.gov.za/EducationinSA.aspx
DeVellis, R. F. (2006). Classical Test Theory. Medical Care, 44 (11), 50-59.
Dong, Y. & Peng, C. J. (2013). Principled missing data methods for researchers. Springer Plus Methodology, 2 (222).
Dunne, T., Long, C., Craig, T., & Venter, E. (2012). Meeting the requirements of both classroom-based and systemic
assessment of mathematics proficiency: The potential of Rasch measurement theory. Pythagoras, 33(3).
Enders, C. K. (2010). Applied Missing Data Analysis. Guildford Publications: New York.
Engelhard, G. (1996). Objective Measurement: Theory into Practice. New York: Greenwood Publishing Group.
Engelhard, G. (2013). Invariant Measurement: Using Rasch Models in the Social, Behavioral, and Health Sciences. New
York: Routledge.
ETS. (2014). Standards for Quality and Fairness. United States of America: Educational Testing Service.
©University of Pretoria 125
Fatima, Z., Tirmizi, S., Latif, M. & Gardezi, A. (2015). Development and Rasch Analysis of an Achievement Test at Master
Level (Philosophy of Education). Pakistan Journal Of Commerce & Social Sciences, 9(1), 269-281.
Field, A. P. (2013). Discovering statistics using SPSS: (and sex and drugs and rock 'n' roll). Los Angeles: SAGE
Publications.
Finch, W. H. (2010). Imputation Methods for Missing Categorical Questionnaire Data: A Comparison of Approaches.
Journal of Data Science 8, 361-378.
Finch, W. H. (2011). The Use of Multiple Imputation for Missing Data in Uniform DIF Analysis: Power and Type I Error
Rates. Applied Measurement in Educational Assessment, 24, 281–301.
Fisher, W. (1992). Reliability statistics. Rasch Measurement Transactions, 6, 238.
Fisher, W. P. (2007). Rating scale instrument quality criteria. Rasch Measurement Transactions, 2(1), 1095.
Fleisch, B. (2008). Primary education in crisis: Why South African schoolchildren underachieve in reading and mathematics.
Cape Town: Juta.
Fontannaz, S. (2012). Education handbook. Stellenbosch, South Africa: Argo.
Fry, S. (2011). Christopher Hitchens Is Hailed by Stephen Fry as a Man of Style and Wit. The Daily Beast,
http://www.thedailybeast.com/articles/2011/12/16/christopher-hitchens-is-hailed-by-stephen-fry-as-a-man-of-style-
and-wit.html
Gelman, A. (2013). Two simple examples for understanding posterior p-values whose distributions are far from uniform.
Electronic Journal of Statistics, 7, 2595–2602.
Glass, G. V. & Stanley, J. C. (1970). Statistical Methods in Education and Psychology. New Jersey: Prentice Hall.
Gliem, J. A., & Gliem, R. R. (2003). Calculating, interpreting, and reporting Cronbach’s alpha reliability coefficient for
Likert-Type Scales. In Proceedings of the Midwest Research to Practice Conference in Adult, Continuing and
Community Education (pp. 82–88). Columbus: Ohio State University.
Golino, H. F. & Gomes, C. M. A. (2016). Random forest as an imputation method for education and psychology research: its
impact on item fit and difficulty of the Rasch model. International Journal of Research & Method in Education,
39(4), 401-421.
Gómez, L. E., Arias, B., Verdugo, M. Á., Tassé, M. J. & Brown, I. (2015). Operationalisation of quality of life for adults with
severe disabilities. Journal of Intellectual Disability Research, 59 (10), 925–941.
Gottfredson, N. C., Sterba, S. K. & Jackson, K. M. (2017). Explicating the Conditions Under Which Multilevel Multiple
Imputation Mitigates Bias Resulting from Random Coefficient-Dependent Missing Longitudinal Data. Prevention
Science, 18 (12).
Grace, J. B. (2015). SE Modelling when some response variables are categorical: The special case of binary (dichotomous)
variables. Modelling with Structural Equations. Retrieved on 12 October 2016 from:
http://www.structuralequations.com/AmosTutorials.html
Graham, J. W. (2012) Missing data: Analysis and design. New York: Springer.
Granger, C. (2008). Rasch Analysis is Important to Understand and Use for Measurement. Rasch Measurement Transactions,
21 (3), 1122-1123.
©University of Pretoria 126
Great Schools Partnership. (2014). Criterion referenced test. Available at http://edglossary.org/criterion-referenced-test/
[Accessed 1 August 2016].
Green, S. (2002). Criterion referenced assessment as a guide to learning – the importance of progression and reliability.
Paper presented at the ASEESA conference, Johannesburg. Available at
http://www.cambridgeassessment.org.uk/images/109693-criterion-referenced-assessment-as-a-guide-to-learning-the-
importance-of-progression-and-reliability.pdf [Accessed 1 August 2016].
Griffin, P., Gillis, S. & Calvitto, L. (2007). Standards-referenced assessment for vocational education and training in schools.
Australian Journal of Education, 51(1), 19-38.
Grosse, M., & Wright, B. D. (1986). Setting, evaluating, and maintaining certification standards with the Rasch model.
Evaluation and the Health Professions, 9(3), 267-285.
Gyimah-Brempong, K. (2011). Education and Economic Development in Africa. African Development Review 23(2), 219-
236.
Hambleton, R. K., Swaminathan, H., & Rogers, H. J. (1991). Fundamentals of item response theory. Newbury Park, CA:
Sage.
Hardt, J., Herke, M., Brian, T. & Laubach, W. (2013). Multiple Imputation of Missing Data: A Simulation Study on a Binary
Response. Open Journal of Statistics, 3, 370-378.
Hattie, J. (2009). Visible Learning: A synthesis of over 800 meta-analyses relating to achievement. London: Routlege.
Hendriks, J., Fyfe, S., Styles, S., Skinner, R. & Merriman, G. (2012). Scale construction utilising the Rasch unidimensional
measurement model: A measurement of adolescent attitudes towards abortion. Australian Medical Journal, 5(5),
251–261.
Herrmann-Abell, C. F. & DeBoer, G. E. (2015). Using Rasch modelling to explore students’ understanding of elementary
school ideas about energy. Paper presented at the NARST annual conference, Chicago. Available at
http://www.aaas.org/sites/default/files/CHA%26GDB-NARST%202015%20final.pdf [Accessed 1 August 2016].
Hohensinn, C., & Kubinger, K. D. (2011). On the Impact of Missing Values on Item Fit and the Model Validness of the
Rasch model. Psychological Test and Assessment Modelling 53 (3), 380–393.
Holmes, D. (2005). Psychology: The Science of Behavior and Mental Processes. New York: Thomson Custom Publishing.
Holster, T. A. & Lake, J. W. (2015). From raw scores to Rasch in the classroom. Shiken, 19(1), 32-41.
Horodezky, B. & Labercane, G. (2016). Criterion-Referenced Tests As Predictors of Reading Performance. Educational and
Psychological Measurement, 43(2), 657–662.
Horton, H. J., Lipsitz, S. R. & Parzen, M. (2003). A Potential for Bias When Rounding in Multiple Imputation. The American
Statistician, 57 (4), 229-232.
Horton, N. J., & Kleinman, K. P. (2007). Much Ado about Nothing: A Comparison of Missing Data Methods and Software to
Fit Incomplete Data Regression Models. The American Statistician, 61(1), 79-90.
Howard, B. (2008). Common features and design principles found in exemplary educational technologies. International
Journal of Information and Communication Technology Education, 4(4), 31-52.
©University of Pretoria 127
Howie, S. (2012). High-stakes testing in South Africa: friend or foe? Assessment in Education: Principles, Policy & Practice,
19 (1), 81-98.
Howie, S. J., van Staden, S., Tshele, M., Dowse, C., & Zimmerman, L. (2012). PIRLS 2011 Summary Report: South African
Children's Reading Literacy Achievement. Pretoria: Centre for Evaluation and Assessment.
Howie, S. J., Combrinck, C., Roux, K., Palane, N., Tshele, M. & Mokoena, G. (2017). (In Press). PIRLS 2016 Summary
Report: South African Children's Reading Literacy Achievement. Pretoria: Centre for Evaluation and Assessment.
Hubbard, D. W. (2010). How to measure anything: Finding the value of “intangibles” in Business. New Jersey: John Wiley
& Sons.
IBM Corporation (2013). Released 2013. IBM SPSS Statistics for Windows, Version 23.0. Armonk, NY: IBM Corp.
IBM Corporation. (2012). Statistical Package for the Social Sciences (SPSS) Support Centre - Method: Multiple Imputation.
Retrieved from:
https://www.ibm.com/support/knowledgecenter/en/SSLVMB_21.0.0/com.ibm.spss.statistics.help/idh_idd_mi_metho
d.htm?view=embed
IBM Corporation. (2014). IBM SPSS Missing Values 23. Armonk, NY: IBM Corp.
IBM Corporation. (2015). Bayesian Estimation. IBM SPSS Amos for Structural Equation Modelling. Retrieved on 1 October
2016 from: http://amosdevelopment.com/features/bayesian/index.html
Ingebo, G. (1989). Educational research and Rasch measurement. Rasch Measurement Transactions, 3(1), 43-46.
Iramaneerat, C., Smith, E.V. & Smith, R.M. (2008). An Introduction to Rasch Measurement. In Osborne, J. (Ed). Best
Practices in Quantitative Methods. New York: Sage Publications.
Jansen, J. (1998). Curriculum reform in South Africa: A critical analysis of outcomes-based education. Cambridge Journal of
Education, 28(3), 321-331.
Jiao, H., Lissitz, R. W., Macready, G., Wang, S. & Liang, S. (2011). Exploring levels of performance using the mixture
Rasch model for standard setting. Psychological Test and Assessment Modelling, 53(4), 499-522.
Julie, C., Holtman, L. & Mbekwa, M. (2011). Rasch modelling of Mathematics and Science teachers’ preferences of real-life
situations to be used in Mathematical Literacy. Pythagoras, 32(1), http://dx.doi.org/10.4102/pythagoras
Kanjee, A. & Sayed, Y. (2013). Assessment policy in post-apartheid South Africa: challenges for improving education
quality and learning. Assessment in Education: Principles, Policy & Practice, 20(4), 442-469.
Kanjee, A., & Moloi, Q. (2014). South African teachers’ use of national assessment data. South African Journal of Childhood
Education, 4(2), 90-113.
Kanjee, A., & Moloi, Q. (2016). A Standards-Based Approach for Reporting Assessment Results in South Africa.
Perspectives in Education, 34(4), 29-51.
Kaplan, R. M., & Saccuzzo, D. P. (2010). Psychological Testing: Principles, Applications, and Issues. (8th ed.). Belmont,
CA: Wadsworth, Cengage Learning.
Khatimin, N., Aziz, A. A., Zaharim, A., & Yasin, S. H. M. (2013). Development of Objective Standard Setting Using Rasch
Measurement Model in Malaysian Institution of Higher Learning. International Education Studies, 6(6).
©University of Pretoria 128
Khosa, G. (2013). Systemic school improvement interventions in South Africa: Some practical lessons from development
practitioners. Cape Town: JET Education Services.
Kim, J. K. & Shao, J. (2014). Statistical methods for handling incomplete data. New York: CRC Press.
King, L. M. (Jr.) (1947). The Purpose of Education. Atlanta: The Moon Tiger.
Lamanauskas, V. (2012). Some features of educational monitoring. Problems of Management In The 21St Century, 4, 4-6.
Lemmer, E., Van Wyk, N., & Berkhout, S. (2010). Themes in South African education: For the comparative educationist.
Cape Town: Pearson Education South Africa.
Linacre, J. M. (1997). KR-20/Cronbach alpha or Rasch reliability: Which tells the ‘truth’? Rasch Measurement Transactions,
11, 580–581.
Linacre, J. M. (2005). Rasch dichotomous model vs. One-parameter Logistic Model. Rasch Measurement Transactions, 19,
1032.
Linacre, J. M. (2012). Winsteps Computer Software Version 3.75.0. Beaverton, OR: Winsteps.
Linacre, J. M. (2016). Winsteps® Rasch measurement computer program User's Guide. Beaverton, Oregon: Winsteps.com.
Linacre, J. M. (2008, June 18). Using RASCH to determine uni-dimensionality [Online forum comment]. Message posted to
https://www.rasch.org/forum2008.htm
Linacre, J. M. (1998). Thurstone thresholds and the Rasch Model. Rasch Measurement Transactions, 12(2), 634-635.
Linacre, J. M. (2000). The Rasch Model derived from E. L. Thorndike's 1904 Criteria. Rasch Measurement Transactions,
2000, 14(3), 763.
Linacre, J. M. (2003). Estimating 50% cumulative probability (Rasch-Thurstone) thresholds from Rasch-Andrich thresholds
and vice-versa. Rasch Measurement Transactions, 16(3), 901.
Linacre, J. M. (2009). Dichotomizing rating scales and Rasch-Thurstone thresholds. Rasch Measurement Transactions,
23(3), 1228.
Linacre, J. M. (2011). Winsteps® Rasch measurement computer program user's guide. Beaverton, Oregon: Winsteps.
Available at http://www.winsteps.com/manuals.htm[Accessed 1 August 2016].
Linacre, J. M. (2012). Winsteps® Computer Software version 3.75.0. Beaverton, Oregon: Winsteps.com.
Linacre, J. M. (2013). Disconnected Subsets, Guttman Patterns and Data Connectivity. Rasch Measurement Transactions,
27(2), 1415-1417.
Little, R. J. A. (1988). A Test of Missing Completely at Random for Multivariate Data with Missing Values. Journal of the
American Statistical Association, 83 (404), 1198-1202.
Little, R. J. A., & Rubin, D. B. (2002). Statistical Analysis with Missing Data (2 ed.). New Jersey: John Wiley & Sons.
Lok, B., McNaught, C., & Young, K. (2016). Criterion-Referenced and norm-Referenced assessments: Compatibility and
complementarity. Assessment & Evaluation in Higher Education, 41(3), 450-465.
Lokshyna, O. (2005). Education Quality Monitoring: Development in Ukraine. Ukraine: Local Press.
©University of Pretoria 129
Long, C. & de Kock, H. (2014). Michael and Susan Dell Foundation (MSDF): Mathematics Assessment Review Report.
Unpublished manuscript.
Long, C. (2011). Mathematical, cognitive and didactic elements of the multiplicative conceptual field investigated within a
Rasch assessment and measurement framework (Doctorate thesis, University of Cape Town, South Africa).
Long, C. (2015). Learning pathways within the multiplicative conceptual field: insights reflected through a Rasch
measurement framework. Waxmann Verlag: Germany.
Long, C., Dunne, T. & Mokoena, G. (2014). A model for assessment: Integrating external monitoring with classroom-based
practice. Perspectives in Education, 32(1), 158-178.
Lord, F. M. (1953). The Relation of Test Score to the Trait Underlying the Test. Educational and Psychological
Measurement, 13(4), 17–549.
Loubsera, H. J., Casteleijn, D & Bruce, J. C. (2015). The BETA® nursing measure: Calibrating construct validity with Rasch
analyses. Health SA Gesondheid, 20 (1), 22-32.
Lyon, J. S., Gettman, H. J., Roberts, S. P., & Shaw, C. E. (2015). Measuring and improving the climate for teaching: A multi-
year study. Journal on Excellence in College Teaching, 26, 111–138.
Maistry, S. M. (2012). Standardising Assessment in an Era of Curriculum Reform: The Case of High School Exit-Level
Economics Examinations in South Africa. Journal of Social Sciences, 33(1), 43-53.
Makgamatha, M. M., Heugh, K., Prinsloo, C. H., & Winnaar, L. (2013). Equitable language practices in large-scale
assessment: Possibilities and limitations in South Africa. Southern African Linguistics & Applied Language Studies,
31(2), 251-269.
Manly, C. A. & Wells, R. S. (2015). Reporting the Use of Multiple Imputation for Missing Data in Higher Education
Research. Research in Higher Education, 56 (4), 397- 409.
Massof, R. W. (2011). Understanding Rasch and Item Response Theory Models: Applications to the Estimation and
Validation of Interval Latent Trait Measures from Responses to Rating Scale Questionnaires. Ophthalmic
Epidemiology, 18(1), 1–19.
Mayer, B., Muche, R. & Hohl, K. (2012). Software for the handling and imputation of missing data: an overview. Clinical
Trials, 2(1), 1–8. Available online at http://www.omicsgroup.org/journals/JCTR/JCTR-2–103.php?aid=3766
Mays, T., Criticos, C., Gultig, J., Stielau, J., & South African Institute for Distance Education. (2009). Getting practical:
About classroom-based teaching for the national curriculum statement (2nd ed. / ed.). Cape Town: Oxford
University Press.
McCreary, L. L., Conrad, K. M., Conrad, K. J., Scott, C. K., Funk, R. R., & Dennis, M. L. (2013). Using the Rasch
Measurement Model in Psychometric Analysis of the Family Effectiveness Measure. Nursing Research, 62(3), 149–
159.
Messick, S. (1989). Validity. In R. Linn (Ed.). Educational measurement, (3rd ed.). Washington, D.C.: American Council on
Education.
Messick, S. (1996). Validity and washback in language testing. Language Testing 13 (3), 241-256.
©University of Pretoria 130
Meyer, J., Doromal, J., Wei, X., & Zhu, S. (2017). A criterion-Referenced approach to student ratings of
instruction. Research in Higher Education: Journal of the Association for Institutional Research,58 (5), 545-567.
Mirowsky, J. & Ross, C. E. (2002). Measurement for a Human Science. Journal of Health and Social Behavior, 43 (2), 152-
170.
Mok, M. M., McInerney, D. M., Zhu, J. & Or, A. (2015). Growth Trajectories of Mathematics Achievement: Longitudinal
Tracking of Student Academic Progress. The British journal of educational psychology, 85(2).
Moodley, V. (2014). Quality and inequality in the assessment of visual literacy in Grade 12 examination papers across six
South African languages. Language Matters: Studies In The Languages Of Africa, 45(2), 204-223.
Morris, A. S. & Langari, R. (2012). Measurement and Instrumentation - Theory and Application. Elsevier. Online version
available at: http://app.knovel.com/hotlink/toc/id:kpMITA0001/measurement-instrumentation/measurement-
instrumentation
Moutinho, L. & Hutcheson, G. D. (2011). The SAGE Dictionary of Quantitative Management Research. London: Sage
Publications.
Mouton, J. (2001). The practice of social research. Cape Town: Wadsworth Publishing Company.
Mullis, I. V. S., & Martin, M. O. (2013). TIMSS 2015 Assessment Frameworks. Chestnut Hill, MA: TIMSS & PIRLS
International Study Center, Boston College.
Mullis, I. V., Martin, M. O., Foy, P. & Drucker, K. T. (2012). PIRLS 2011 International Results in Reading. United States of
America: Boston College.
Nguyen, C. D., Lee, K. J. & Carlin, J. B. (2015). Posterior predictive checking of multiple imputation models. Biometrical
Journal, 57 (4), 676-694.
Nworgu, B. G. & L. N. Nworgu (2013). Urban-Rural Disparities in Achievement at the Basic Education Level: The Plight of
the Rural Child in a Developing Country. Developing Country Studies,3 (14), 128 – 140.
OECD (2008). Reviews of National Policies for Education: South Africa 2008. OECD Publishing, Paris.
OECD, 2013. Education Today: The OECD Perspective. OECD Publishing.
Osborne, J. (Ed). (2008). Best Practices in Quantitative Methods. New York: Sage Publications.
Osman, S. A., Badaruzzaman, W. H. W., Hamid, R., Taib, K., Khalim, R., Hamzah, N. & Jaafar, O. (2008). Assessment on
students’ performance using Rasch model in reinforced concrete design course examination. Recent Researches in
Education, 193-198.
Ottevanger, W., van den Akker, J. J. H. & de Feiter, L. (2007). Developing science, mathematics, and ICT education in Sub-
Saharan Africa: Patterns and promising practices. South Africa: World Bank Publications.
Palane, N. (2014). Michael and Susan Dell Foundation (MSDF): English Language Assessment Review Report. Unpublished
manuscript.
Peng, C.-Y. J., Harwell, M., Liou, S.-M. & Ehman, L. H. (2003). Advances in Missing Data Methods and Implications for
Educational Research. Paper presented at the 2002 Chinese American Educational Research and Development
Association Conference, Tapei.
©University of Pretoria 131
Peng, J. L., Stuart, E. A & Allison, D. B. (2015). Multiple Imputation: A Flexible Tool for Handling Missing Data. JAMA
Guide to Statistics and Methods, 314 (18), 1966 -1967.
Peterson, C. H., Gischlar, K. L & Peterson, N.A. (2017). Item Construction Using Reflective, Formative, or Rasch
Measurement Models: Implications for Group Work. The Journal for Specialists in Group Work, 42, 17-32.
Petrillo, J., Cano, S. J., McLeod, L. D. & Coon, C. D. (2015). Using Classical Test Theory, Item Response Theory, and
Rasch Measurement Theory to Evaluate Patient-Reported Outcome Measures: A Comparison of Worked Examples.
Value in Health, 18, 25 – 34.
Petscher, Y. M., Cummings, K., Biancarosa, G., & Fien, H. (2013). Advanced (measurement) applications of curriculum-
based measurement in reading. Assessment for Effective Intervention, 38, 71–75.
Peugh, J. L., & Enders, C. K. (2004). Missing data in educational research: a review of reporting practices and suggestions
for improvement. Review of Educational Research, 74(4), 525-556.
Pillay, S. R. (2016). Silence is violence: (critical) psychology in an era of Rhodes Must Fall and Fees Must Fall. South
African Journal of Psychology, 46(2), 155–159.
Popham, M. (1987). The merits of measurement driven instruction. Phi Delta Kappan, 68, 679–682.
Popham, W. (2014). Criterion-Referenced measurement: Half a century wasted? Educational Leadership, 71(6), 62-66.
Popham, W. J. (1978). Well-crafted criterion-referenced Tests. United States of America: Association for Supervision and
Curriculum Development.
Putnam, H. (1962). What Theories are Not. In Ernst Nagel et al. (1962). Logic, Methodology, and Philosophy of Science.
Stanford: Stanford University Press.
Randall, J. & Engelhard, G. (2010). Using Confirmatory Factor Analysis and the Rasch Model to Assess Measurement
Invariance in a High Stakes Reading Assessment. Applied Measurement in Education, 23(3), 286-306.
Rasch, G. (1980). Probabilistic models for some intelligence and attainment tests. University of Chicago Press, Chicago.
Reeves, C., & McAuliffe, S. (2012). Is curricular incoherence slowing down the pace of school mathematics in South Africa?
A methodology for assessing coherence in the implemented curriculum and some implications for teacher education.
Journal of Education, 61, 6–11.
Reise, S. P., & Henson, J. M. (2003). A discussion of modern versus traditional psychometrics as applied to personality
assessment scales. Journal of Personality Assessment, 81, 93–103.
Republic of South Africa (RSA). 1996. South African Schools Act 1996 (Act No 84 of 1996). Pretoria: Government Printers.
Resseguier, N., Giorgi, R., & Paoletti, X. (2011). Sensitivity Analysis When Data Are Missing Not-at-random.
Epidemiology, 22(2), 282-283.
Reynolds, C. R., Livingston, R. B., & Willson, V. (2010). Measurement and Assessment in Education (2nd Ed.). New York:
Pearson.
Rezvan, P. H., Lee, K. J. & Simpson, J. A. (2015). A review of the reporting and implementation of multiple imputation in
medical research. Paper presented at the Annual Conference of the International Society for Clinical Biostatistics,
Utrecht the Netherlands on August 24, 2015.
©University of Pretoria 132
Ricker, K. L. (2006). Setting Cut-Scores: A Critical Review of the Angoff and Modified Angoff Methods. The Alberta
Journal of Educational Research, 52(1), 53-64.
Roach, A., & Frank, J. (2007). Large-Scale assessment, rationality, and scientific management. Journal of Applied School
Psychology, 23(2), 7-25.
Rose, N., von Davier, M. & Xu, X. (2010). Modelling Nonignorable Missing Data With Item Response Theory (IRT). Report
No. ETS RR-10-1. Princeton, New Jersey: Educational Testing Service (ETS).
Roux, K. (2014). Michael and Susan Dell Foundation (MSDF): Science Assessment Review Report. Unpublished manuscript.
Rubin, D. B. (1976). Inference and missing data. Biometrika, 63, 581-592.
Rubin, D. B. (1987). Multiple Imputation for Nonresponse in Surveys. New York: John Wiley & Sons.
Safer, N., & Fleischman, S. (2005). How student progress monitoring improves instruction. Research Matters, 62, 81–83.
Retrieved from http://www.ascd.org/publications/educational-leadership/feb05/
vol62/num05/How-Student-Progress-Monitoring-Improves-Instruction.aspx
Sambell, K., McDowell, L., & Montgomery, C. (2013). Assessment for learning in higher education. Oxon England:
Routledge.
Sayed, Y. & Motala, S. (2012). Equity and ‘No Fee’ Schools in South Africa: Challenges and Prospects. Social Policy and
Administration, 46 (6), 672–687.
Schafer, J. L. (1999a). Multiple imputation: a primer. Statistical methods in medical research, 8(1), 3-15.
Schafer, J. L. (1999b). NORM users’ guide (Version 2). University Park: The Methodology Center, Penn State. Retrieved
fromhttp://methodology.psu.edu
Schafer, J. L., & Graham, J. W. (2002). Missing Data: Our View of the State of the Art. Psychological Methods, 7(2), 147-
177.
Scherman, V. & Smit, B. (2017). Using mixed methods to explore the validity of a secondary school monitoring system: A
case from South Africa (SAGE research methods. cases). London: SAGE Publications.
Scherman, V. (2007). The validity of value-added measures in secondary schools. Pretoria: University of Pretoria.
Scherman, V., Bosker, R. J. & Howie, S. J. (Eds.). (2017). Monitoring the Quality of Education in Schools: Examples of
Feedback from Developed and Emerging Economies. Rotterdam: Sense Publishers.
Schnotz, W. (2016). Learning and Instruction: a review of main research lines during recent decades, Erziehungswiss,
19,101–119.
Schutte, L., Wissing, M. P., Ellis, S. M., Jose, P. E. & Vella-Brodrick, D.A. (2016). Questionnaire among adults from South
Africa, Australia, and New Zealand. Health and Quality of Life Outcomes, 14(12).
Shaw, F. (1991). Descriptive IRT vs. Prescriptive Rasch. Rasch Measurement Transactions, 5(1), 131.
Shen, L. (2001). A comparison of Angoff and Rasch model based item map methods in standard setting. Paper presented at
the annual meeting of the American Educational Research Association, Seattle. Available at
http://eric.ed.gov/?id=ED452213[Accessed 22 August 2016]
©University of Pretoria 133
Smith, A. B., Rush, R., Fallowfield, L. J., Velikova, G., & Sharpe, M. (2008). Rasch fit statistics and sample size
considerations for polytomous data. BMC Medical Research Methodology: Open Peer Review reports. Available at
http://bmcmedresmethodol.biomedcentral.com/articles/10.1186/1471-2288-8-33 [1 August 2016].
Smith, E. V. & Smith, R. M. (Eds.) (2004). Introduction to Rasch Measurement: Theory, Models and Applications.
Minnesota: JAM Press.
Smith, E. V. (2002). Detecting and evaluating the impact of multidimensionality using item fit statistics and principal
component analysis of residuals. Journal of Applied Measurement, 3, 205–231.
Smith, R. M. & Suh, K. K. (2003). Rasch fit statistics as a test of the invariance of item parameter estimates. Journal Applied
Measurement, 4(2), 153–163.
Sondergeld, T. A. & Johnson, C. C. (2014). Using Rasch Measurement for the Development and Use of Affective
Assessments in Science Education Research. Science education, 98, 581–613.
Stecker, P. M., & Fuchs, L. S. (2000). Effecting superior achievement using curriculum-based measurement: The importance
of individual progress monitoring. Learning Disabilities Research & Practice, 15, 128–134.
Stelmack, J., Szlyk, J. P., Stelmack, T. & Babcock-Parziale, J. (2004). Use of Rasch person-item map in exploratory data
analysis: A clinical perspective. Journal of Rehabilitation Research & Development, 41(2), 233-242.
Stephens, M., Warren, L. K. & Harner, A. L. (2015). Comparative Indicators of Education in the United States and Other G-
20 Countries. United States of America: National Center for Education Statistics.
Stevens, S. S. (1946). On the Theory of Scales of Measurement. Science, 103 (2684), 677–680.
Stijns, J. P. (2012). The cost of measures to fight poverty and to improve health and Education. In Can we still Achieve the
Millennium Development Goals? From Costs to Policies, OECD, Publishing, Paris.
Stone, G. E. (2000). A standard vision. Popular Measurement: Journal of the Institute for Objective Measurement, 4, 40-41.
Stone, G. E., Beltyukova, S. & Fox, C.M. (2008). Objective standard setting for judge-mediated examinations. International
Journal of Testing, 8, 180-196.
Suarez Enciso, S. M. (2016). The effects of missing data treatment on person ability estimates using IRT models. Published
Master’s Thesis. University of Nebraska-Lincoln, Nebraska. Open access at:
http://digitalcommons.unl.edu/cehsdiss/274
Tabachnick, B. G., & Fidell, L. S. (2007). Using multivariate statistics. Boston, MA: Pearson.
Tal, E. (2017). Measurement in Science. Stanford: The Stanford Encyclopaedia of Philosophy. Available at:
https://plato.stanford.edu/archives/spr2017/entries/measurement-science/
The South African Qualification Authority (SAQA) (2005). Guidelines for integrated assessment. Pretoria: Public Works.
Thorndike, E. L. (1904). An introduction to the theory of mental and social measurements. New York: Teacher's College.
Tikly, L., & Barrett, A. M. (Eds.). (2013). Education quality and social justice in the global south: challenges for policy,
practice and research. United States of America: Taylor and Francis. Retrieved from
http://ebookcentral.proquest.com.uplib.idm.oclc.org
©University of Pretoria 134
Törmäkangas, K. (2011) Advantages of the Rasch measurement model in analysing educational tests: an applicator's
reflection. Educational Research and Evaluation, 17(5), 307-320.
Panayides, P., Robinson, C. and Tymms, P. (2010). The assessment revolution that has passed England by: Rasch
measurement. British Educational Research Journal, 36 (4), 611–626.
Tymms, P., Merrell, C. & Wildy, H. (2015). The progress of pupils in their first school year across classes and
educational systems. British Educational Research Journal, 41 (3), 365 – 380.
Uebersax, J. (1993). Rasch model software and FAQ. Retrieved 18 June, 2014 from http://www.john-
uebersax.com/stat/rasch.txt
Umalusi (2010). Evaluating the South African National Senior Certificate in relation to selected international qualifications:
A self-referencing exercise to determine the standing of the NSC. Pretoria: Higher Education South Africa (HESA).
UNESCO. (2013). EFA Global Monitoring Report: Teaching and Learning, achieving equality for all. France: United
Nations Educational, Scientific and Cultural Organization.
UNESCO. (2015) Education for All (EFA) Global Monitoring Report: Achievement and Challenges: France, Paris: United
Nations Educational, Scientific and Cultural Organization.
Ungerleider, C. (2003). Large-Scale student assessment: Guidelines for policymakers. International Journal of Testing, 3(2),
119-28.
UNICEF. (2000). Defining Quality in Education. The International Working Group on Education. New York: United
Nations Children's Fund.
Valero, P. & Skovsmose, O. (2002) (Eds.). Proceedings of the 3rd International Mathematics Education and Society
Conference. Copenhagen: Centre for Research in Learning Mathematics.
Van Acker, R. (2002). Establishing and monitoring a school and classroom climate that promotes desired behavior and
academic achievement (CASE/CCBD Mini-Library Series on Safe, Drug-Free, and Effective Schools). Council for
Children with Behavioral Disorder.
van Buuren, S. (2012). Flexible imputation of missing data. Boca Raton, FL: CRC Press.
van der Berg, S., Spaull, N., Wills, G., Gustafsson, M. & Kotzé, J. (2016). Identifying Binding Constraints in Education:
Synthesis Report for the Programme Pro-Poor Policy Development (PSPPD). Research on Socio-Economic Policy
(RESEP). Stellenbosch: Department of Economics at the University of Stellenbosch.
Visser, M., Juan, A., & Feza, N. (2015). Home and School Resources as Predictors of Mathematics Performance in South
Africa. South African Journal of Education, 35(1).
Vosloo, J. J. (2014). A sport management programme for educator training in accordance with the diverse needs of South
African schools. Doctoral Thesis, North-West University, Campus of Potchefstroom. Retrieved from
https://repository.nwu.ac.za/handle/10394/12269?show=full
Walford, G., Tucker, E. & Viswanathan, M. (2010). The SAGE handbook of measurement. London: SAGE Publications.
Wang, C., Kohli, N. & Henn, L. (2016). A Second-Order Longitudinal Model for Binary Outcomes: Item Response Theory
Versus Structural Equation Modelling. Structural Equation Modelling: A Multidisciplinary Journal, 23(3), 455–465.
©University of Pretoria 135
Wang, N. (2003). Use of the Rasch IRT model in standard setting: An item mapping method. Journal of Educational
Measurement, 40(3), 231-253.
Wang, W. C. (2008). Assessment of differential item functioning. Journal of Applied Measurement, 9, 387–408.
Warren, S. M. & Harner, A. L. (2015). Comparative Indicators of Education in the United States and Other G-20 Countries:
2015. NCES 2016-100. United States: National Center for Education Statistics.
White, I. R., Royston, P. & Wood, A. M. (2011). Multiple imputation using chained equations: Issues and guidance for
practice. Statistics in Medicine, 30, 377-399.
Williams, J., & Ryan, J. (2000). National testing and the improvement of classroom teaching: Can they coexist? British
Educational Research Journal, 26, 49–73.
Wilson, M. (2005). Constructing Measures: An Item Response Modelling Approach. New York: Psychology Press.
Wilson, M. (2009). The Structured Constructs Model (SCM): A family of statistical models related to learning progressions.
Paper presented at the Learning Progressions in Science (LeaPS) Conference, Iowa City, IO.
Wissing, M. P. (2013). Well-being research in South Africa: 4 Cross-cultural advancements in positive psychology. South
Africa: Springer.
Wright, B. D. (1996). Time 1 to time 2 (pre-test to post-test) comparison and equating: Racking and stacking. Rasch
Measurement Transactions, 10, 478. Retrieved from http://www.rasch.org/rmt/rmt101f.htm
Wright, B. D. (2003). Rack and stack: Time 1 vs. time 2 or pre-test vs. post-test. Rasch Measurement Transactions, 17, 905–
906. Retrieved from http://www.rasch.org/rmt/rmt171a.htm
Wright, B. D., & Linacre, J. M. (1994). Reasonable mean-square fit values. Rasch Measurement Transactions, 8, 370.
Retrieved from http://www.rasch.org/rmt/rmt83b.htm
Wright, B. D., & Masters, G. (1982). Rating Scale Analysis. Chicago: MESA Press.
Wright, B. D., & Stone, G. E. (2004). Making measures. Chicago, IL: Phaneron Press.
Wright, B. D., & Stone, M. H. (1979). Best Test Design. Chicago: MESA Press.
Wright, B. D. & Grosse, M. (1993). How to set standards. Rasch Measurement Transactions, 7(3), 315.
Wright, B. D. & Linacre, J. M. (1987). Dichotomous Rasch model derived from specific objectivity. Rasch Measurement
Transactions, 1(1), 5-6.
Wright, B. D. & Linacre, J. M. (1989). Observations are always ordinal; measurements, however, must be interval. Archives
of Physical Measurement and Rehabilitation, 70(12), 857 – 860.
Wright, B. D. & Stone, M. H. (2003). Five Steps to Science: Observing, Scoring, Measuring, Analyzing, and Applying.
Rasch Measurement Transactions, 17 (1), 912-913. Available at: https://www.rasch.org/rmt/rmt171j.htm
Wright, B. D. (1977). Solving measurement problems with the Rasch Model. Journal of Educational Measurement, 14, 97-
116.
Wright, B. D. (1989). Dichotomous Rasch Model derived from Counting Right Answers: Raw Scores as Sufficient Statistics.
Rasch Measurement Transactions, 3(2), 62.
©University of Pretoria 136
Wright, B. D. (1993). Thinking with Raw Scores. Rasch Measurement Transactions, 7(2), 299-300.
Wu, M., & Adams, R. (2007). Applying the Rasch model to psycho-social measurement: A practical approach. Melbourne:
Educational Measurement Solutions.
Wu, M., Tam, H. P., Jen, T. H. (2016). Rasch Model (The Dichotomous Case). Educational Measurement for Applied
Researchers. Springer.
Yuan, Y., & Little, R. J. A. (2009). Mixed-Effect Hybrid Models for Longitudinal Data with Nonignorable Dropout. Journal
of the international biometric society, 26(2), 478–486.
Yucel, R. M. (2011). State of the Multiple Imputation Software. Journal of Statistical Software, 45 (1), 1-7.
Zhang, Z. &Wang, L. (2013). Methods for Mediation Analysis with Missing Data. Psychometrika, 78(1), 154–84.
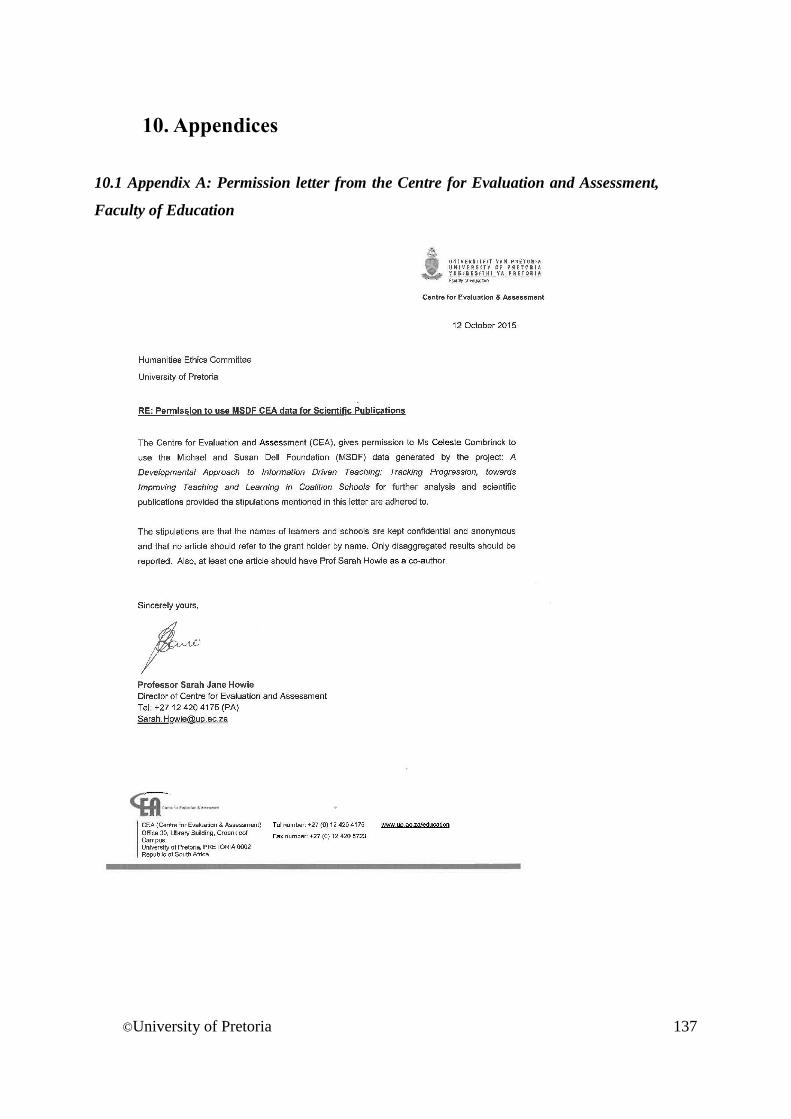
©University of Pretoria 137
10. Appendices
10.1 Appendix A: Permission letter from the Centre for Evaluation and Assessment,
Faculty of Education
©University of Pretoria 138
10.2 Appendix B: Permission letter form the Research Ethics Committee, Faculty of
Humanities
©University of Pretoria 139
10.3 Appendix C: Permission letter for external funding agency
©University of Pretoria 140
©University of Pretoria 141
10.4 Appendix D: Permission letter to learners and parents
©University of Pretoria 142
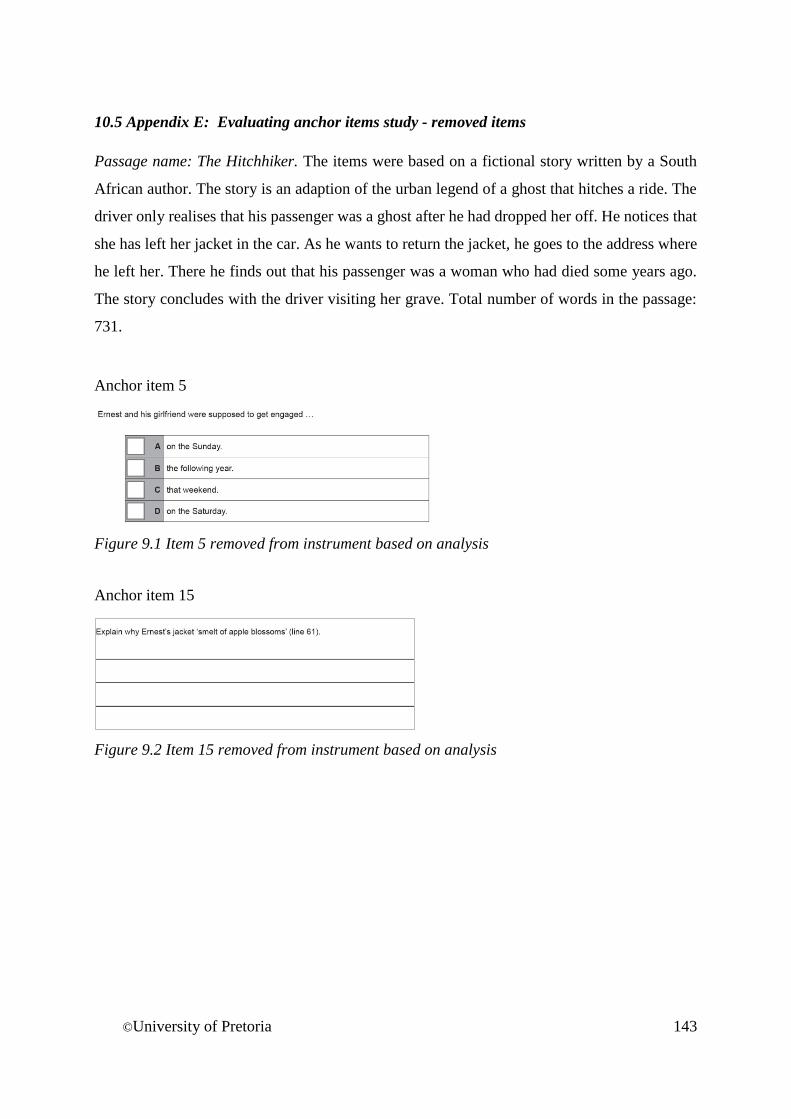
©University of Pretoria 143
10.5 Appendix E: Evaluating anchor items study - removed items
Passage name: The Hitchhiker. The items were based on a fictional story written by a South
African author. The story is an adaption of the urban legend of a ghost that hitches a ride. The
driver only realises that his passenger was a ghost after he had dropped her off. He notices that
she has left her jacket in the car. As he wants to return the jacket, he goes to the address where
he left her. There he finds out that his passenger was a woman who had died some years ago.
The story concludes with the driver visiting her grave. Total number of words in the passage:
731.
Anchor item 5
Figure 9.1 Item 5 removed from instrument based on analysis
Anchor item 15
Figure 9.2 Item 15 removed from instrument based on analysis