Embed Size (px)
Citation preview
c:randres/documents/program review
Allan Hancock College Program Review 2015-16 Annual Update
Program and Department: Economics Program, Social and Behavioral Sciences
Date submitted: April 8, 2016
Submitted by: Herb Elliott
SLOS report update □ Revised Plan of Action □
The Annual Update is conducted by all programs at the college and consists of an analysis of changes affecting the program as well as significant new funding needs for staff, resources, facilities, and equipment. It should be submitted or renewed every year by the end of the second week in April in anticipation of budget planning for the following year, which begins at the planning retreat in November. *Note that if there is no change from the previous year, you may simply resubmit the information in that report (or any portion that remains unchanged) from the prior year.
Programs and units should support their planning efforts with quantifiable data, conduct appropriate analyses, and make supportable conclusions. For your use, standardized IT data reports will be provided and sent to departments under separate cover. You may also report on your own internally-generated data. Labor market data is required for all vocational programs at least every two years.
Place your responses in the expandable text boxes below each question.
I. Program Mission (must align with college mission)
Describe the need that is met by the program or the purpose of the program. ( Sample: The Health, Physical Education, and Recreation Division is committed to providing excellent education opportunities to our students for their affective, cognitive and psychomotor development as they pursue sport, recreation, physical education, health education and wellness. We will encourage our students to further and sustain their individual endeavors toward the regular, lifelong pursuit of physical activity and a healthy lifestyle.) In addition, for vocational programs only, data must show need and that “the program does not represent an unnecessary duplication of other vocational or occupational training programs in the area.”
c:randres/documents/program review
The economic program provides courses that enable students to complete lower division prerequisites and general education requirements to transfer to institutions of higher learning. The program consists of Econ 101: Principles of Macroeconomics, Econ 102: Principles of Microeconomics, Econ 121/BUS 121: Business Economics, ECON 141/BUS 141/GBST 141: Global Economics, and Econ 130/BUS 130/FCS 130: Family and Consumer Finance. Econ 101 and Econ102 are part of a sequence for business, economics, and other majors at the University of California, California State University system and other universities. They also satisfy lower division general education requirements. Econ 130 and Econ 121 are designed primarily for students who are occupationally oriented, or specifically those seeking an associate degree as a terminal educational goal. These courses are also transferable as electives to the University of California, California State and other university systems.
II. Progress on Comprehensive Program Review Final Plan of Action
Review the final plan of action (post validation) from the last comprehensive program review and any previous annual updates. Summarize the progress the program has made on recommendations targeted for this last year as well as any outstanding or incomplete items from previous years. What is the status of these recommendations? Include the original target date, action taken and results, and reasons for any changes.
The Course Identification Numbering System (C-ID) descriptors for both Econ 101: Principles of Macroeconomics, and Econ 102: Principles of Microeconomics now requires Math 311: Elementary Algebra as prerequisite. In Spring 2013 AP&P approved Math 311: Elementary Algebra as a prerequisite for both Econ 101: Principles of Macroeconomics, and Econ 102: Principles of Microeconomics. Enrollment Changes Recommend the district provide consistent tutorial services support for students enrolled in the economics program. [Fall 2015] In addition to adopting Canvas as our online platform, and in alignment with the district’s stated goals of reducing disproportionate impact and promoting student success, we recommend that the district also provide online tutorial services beyond Basic Skills, and 24/7 technical support for students enrolled in online classes. Motion passed at Academic Senate Meeting 11.3.2015
c:randres/documents/program review
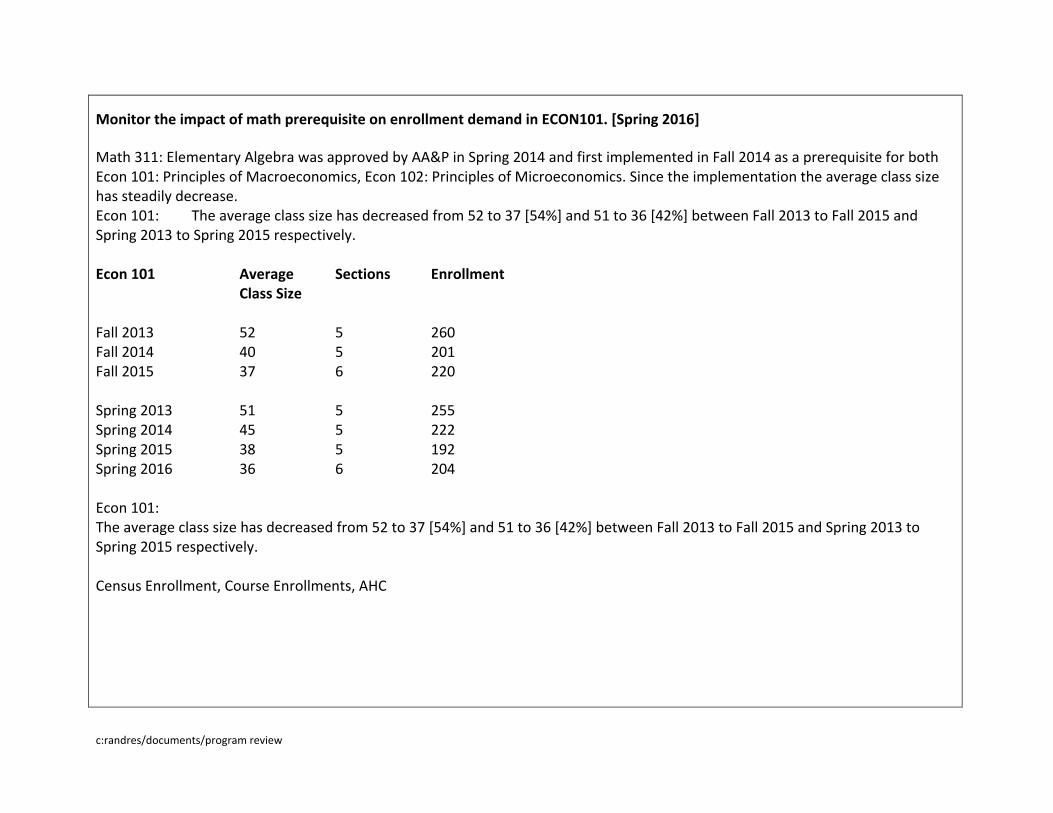
Monitor the impact of math prerequisite on enrollment demand in ECON101. [Spring 2016] Math 311: Elementary Algebra was approved by AA&P in Spring 2014 and first implemented in Fall 2014 as a prerequisite for both Econ 101: Principles of Macroeconomics, Econ 102: Principles of Microeconomics. Since the implementation the average class size has steadily decrease. Econ 101: The average class size has decreased from 52 to 37 [54%] and 51 to 36 [42%] between Fall 2013 to Fall 2015 and Spring 2013 to Spring 2015 respectively. Econ 101 Average Sections Enrollment Class Size Fall 2013 52 5 260 Fall 2014 40 5 201 Fall 2015 37 6 220 Spring 2013 51 5 255 Spring 2014 45 5 222 Spring 2015 38 5 192 Spring 2016 36 6 204 Econ 101: The average class size has decreased from 52 to 37 [54%] and 51 to 36 [42%] between Fall 2013 to Fall 2015 and Spring 2013 to Spring 2015 respectively. Census Enrollment, Course Enrollments, AHC
c:randres/documents/program review
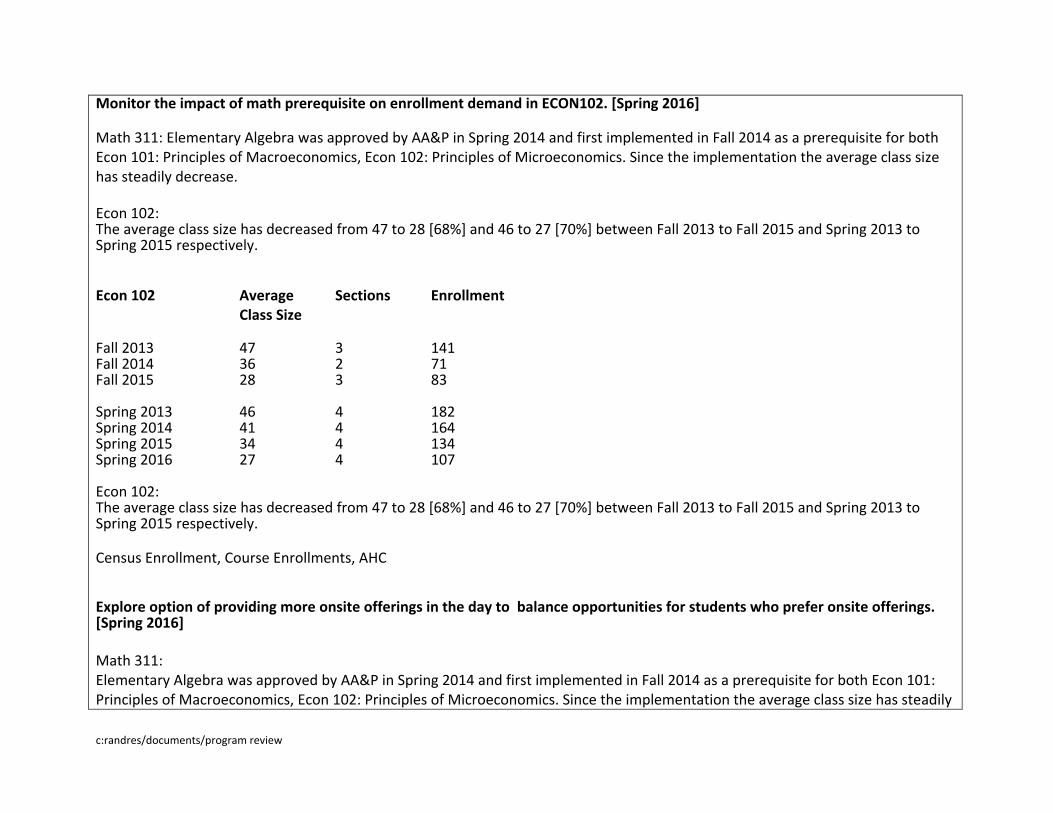
Monitor the impact of math prerequisite on enrollment demand in ECON102. [Spring 2016] Math 311: Elementary Algebra was approved by AA&P in Spring 2014 and first implemented in Fall 2014 as a prerequisite for both Econ 101: Principles of Macroeconomics, Econ 102: Principles of Microeconomics. Since the implementation the average class size has steadily decrease. Econ 102: The average class size has decreased from 47 to 28 [68%] and 46 to 27 [70%] between Fall 2013 to Fall 2015 and Spring 2013 to Spring 2015 respectively. Econ 102 Average Sections Enrollment Class Size Fall 2013 47 3 141 Fall 2014 36 2 71 Fall 2015 28 3 83 Spring 2013 46 4 182 Spring 2014 41 4 164 Spring 2015 34 4 134 Spring 2016 27 4 107 Econ 102: The average class size has decreased from 47 to 28 [68%] and 46 to 27 [70%] between Fall 2013 to Fall 2015 and Spring 2013 to Spring 2015 respectively. Census Enrollment, Course Enrollments, AHC Explore option of providing more onsite offerings in the day to balance opportunities for students who prefer onsite offerings. [Spring 2016] Math 311: Elementary Algebra was approved by AA&P in Spring 2014 and first implemented in Fall 2014 as a prerequisite for both Econ 101: Principles of Macroeconomics, Econ 102: Principles of Microeconomics. Since the implementation the average class size has steadily
c:randres/documents/program review
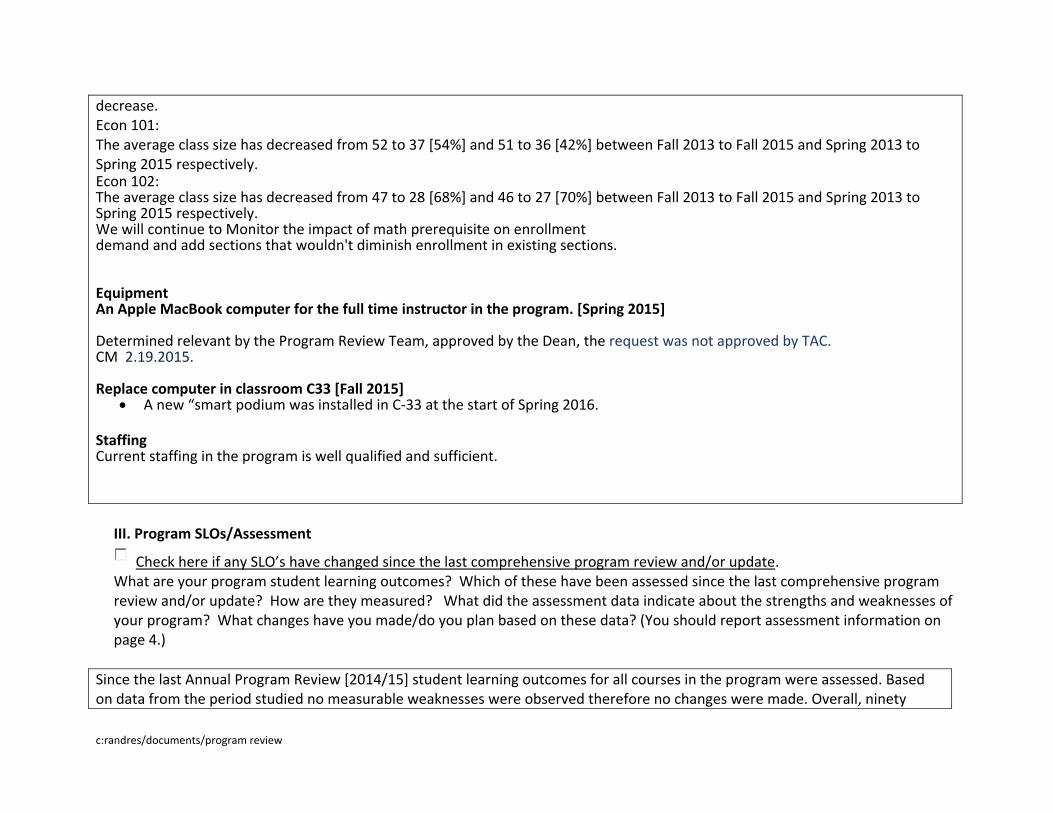
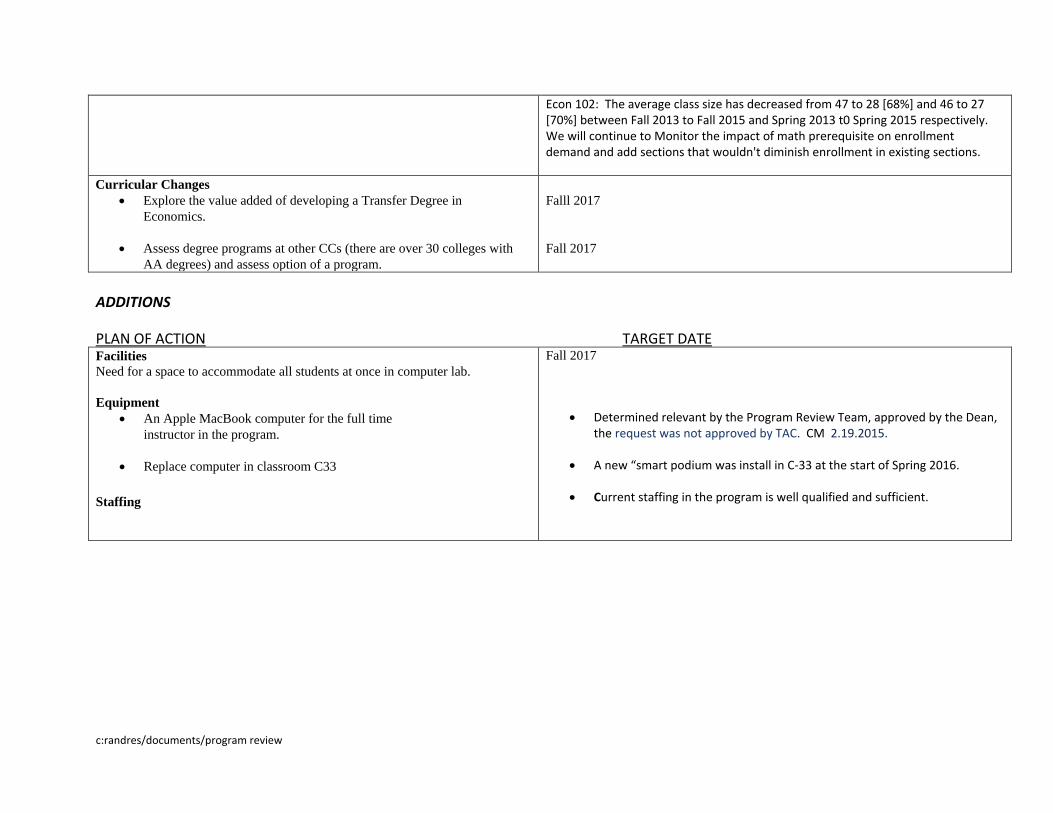
decrease. Econ 101: The average class size has decreased from 52 to 37 [54%] and 51 to 36 [42%] between Fall 2013 to Fall 2015 and Spring 2013 to Spring 2015 respectively. Econ 102: The average class size has decreased from 47 to 28 [68%] and 46 to 27 [70%] between Fall 2013 to Fall 2015 and Spring 2013 to Spring 2015 respectively. We will continue to Monitor the impact of math prerequisite on enrollment demand and add sections that wouldn't diminish enrollment in existing sections. Equipment An Apple MacBook computer for the full time instructor in the program. [Spring 2015] Determined relevant by the Program Review Team, approved by the Dean, the request was not approved by TAC. CM 2.19.2015. Replace computer in classroom C33 [Fall 2015]
A new “smart podium was installed in C-33 at the start of Spring 2016. Staffing Current staffing in the program is well qualified and sufficient.
III. Program SLOs/Assessment
Check here if any SLO’s have changed since the last comprehensive program review and/or update. What are your program student learning outcomes? Which of these have been assessed since the last comprehensive program review and/or update? How are they measured? What did the assessment data indicate about the strengths and weaknesses of your program? What changes have you made/do you plan based on these data? (You should report assessment information on page 4.)
Since the last Annual Program Review [2014/15] student learning outcomes for all courses in the program were assessed. Based on data from the period studied no measurable weaknesses were observed therefore no changes were made. Overall, ninety
c:randres/documents/program review
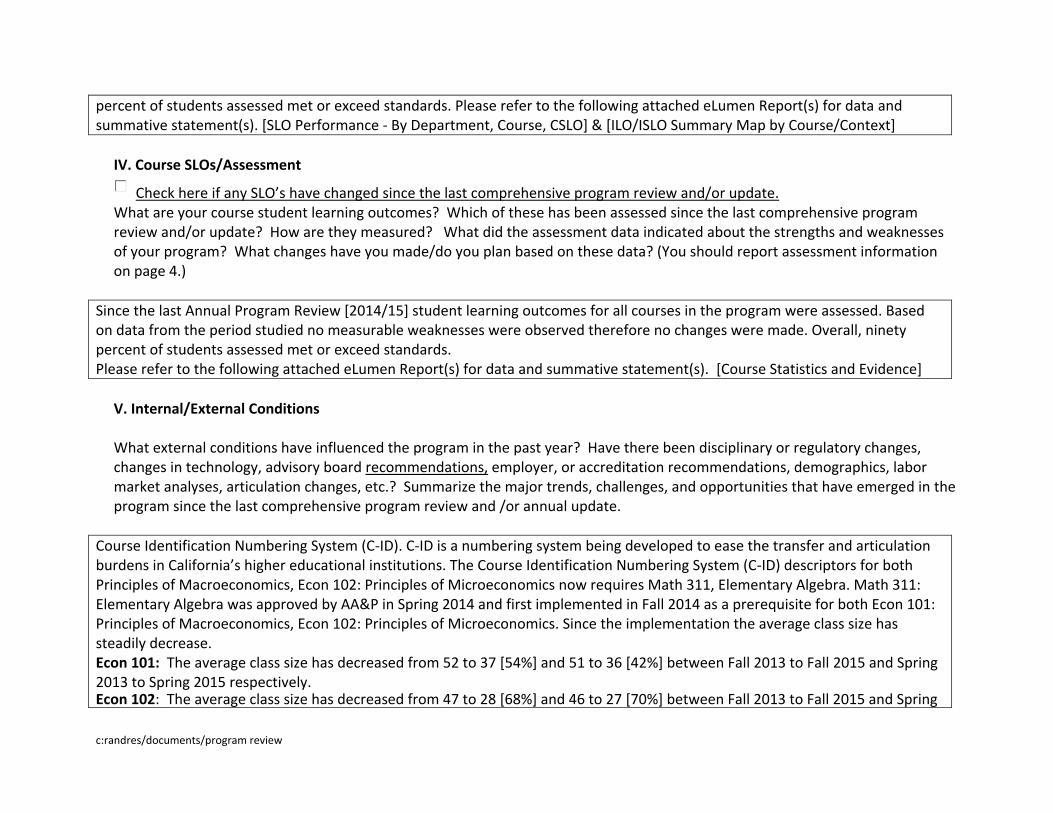
percent of students assessed met or exceed standards. Please refer to the following attached eLumen Report(s) for data and summative statement(s). [SLO Performance - By Department, Course, CSLO] & [ILO/ISLO Summary Map by Course/Context]
IV. Course SLOs/Assessment
Check here if any SLO’s have changed since the last comprehensive program review and/or update. What are your course student learning outcomes? Which of these has been assessed since the last comprehensive program review and/or update? How are they measured? What did the assessment data indicated about the strengths and weaknesses of your program? What changes have you made/do you plan based on these data? (You should report assessment information on page 4.)
Since the last Annual Program Review [2014/15] student learning outcomes for all courses in the program were assessed. Based on data from the period studied no measurable weaknesses were observed therefore no changes were made. Overall, ninety percent of students assessed met or exceed standards. Please refer to the following attached eLumen Report(s) for data and summative statement(s). [Course Statistics and Evidence]
V. Internal/External Conditions
What external conditions have influenced the program in the past year? Have there been disciplinary or regulatory changes, changes in technology, advisory board recommendations, employer, or accreditation recommendations, demographics, labor market analyses, articulation changes, etc.? Summarize the major trends, challenges, and opportunities that have emerged in the program since the last comprehensive program review and /or annual update.
Course Identification Numbering System (C-ID). C-ID is a numbering system being developed to ease the transfer and articulation burdens in California’s higher educational institutions. The Course Identification Numbering System (C-ID) descriptors for both Principles of Macroeconomics, Econ 102: Principles of Microeconomics now requires Math 311, Elementary Algebra. Math 311: Elementary Algebra was approved by AA&P in Spring 2014 and first implemented in Fall 2014 as a prerequisite for both Econ 101: Principles of Macroeconomics, Econ 102: Principles of Microeconomics. Since the implementation the average class size has steadily decrease. Econ 101: The average class size has decreased from 52 to 37 [54%] and 51 to 36 [42%] between Fall 2013 to Fall 2015 and Spring 2013 to Spring 2015 respectively. Econ 102: The average class size has decreased from 47 to 28 [68%] and 46 to 27 [70%] between Fall 2013 to Fall 2015 and Spring
c:randres/documents/program review
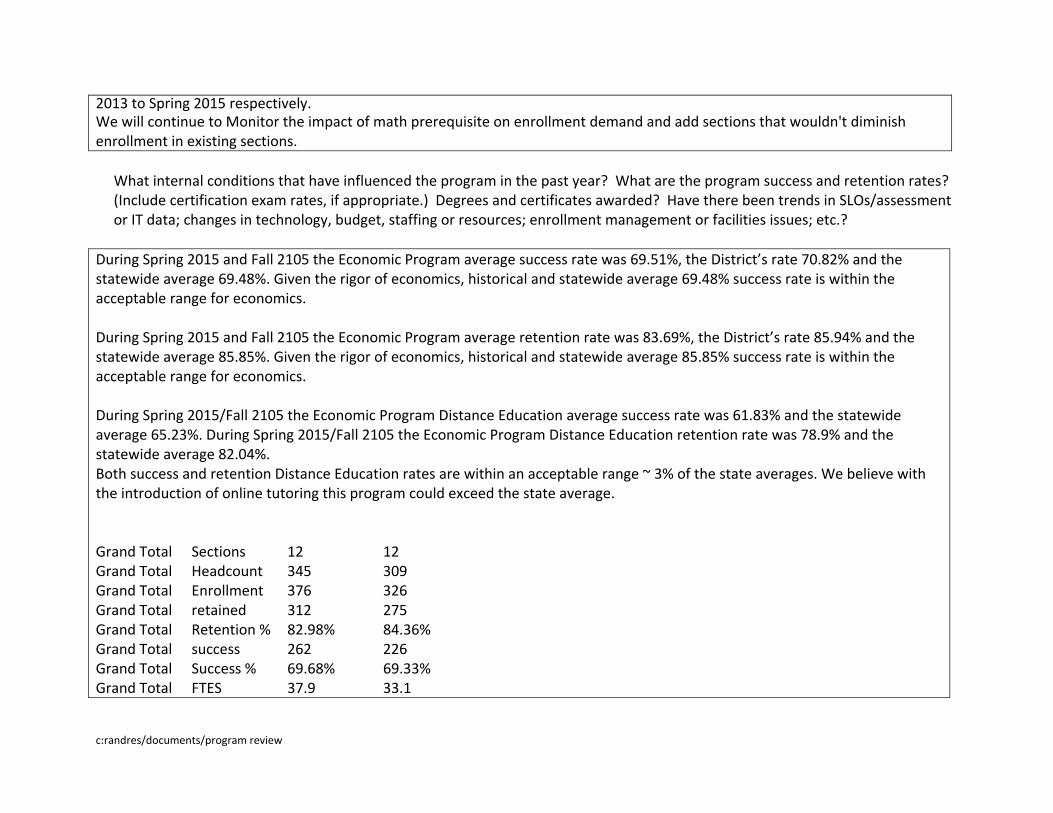
2013 to Spring 2015 respectively. We will continue to Monitor the impact of math prerequisite on enrollment demand and add sections that wouldn't diminish enrollment in existing sections.
What internal conditions that have influenced the program in the past year? What are the program success and retention rates? (Include certification exam rates, if appropriate.) Degrees and certificates awarded? Have there been trends in SLOs/assessment or IT data; changes in technology, budget, staffing or resources; enrollment management or facilities issues; etc.?
During Spring 2015 and Fall 2105 the Economic Program average success rate was 69.51%, the District’s rate 70.82% and the statewide average 69.48%. Given the rigor of economics, historical and statewide average 69.48% success rate is within the acceptable range for economics. During Spring 2015 and Fall 2105 the Economic Program average retention rate was 83.69%, the District’s rate 85.94% and the statewide average 85.85%. Given the rigor of economics, historical and statewide average 85.85% success rate is within the acceptable range for economics. During Spring 2015/Fall 2105 the Economic Program Distance Education average success rate was 61.83% and the statewide average 65.23%. During Spring 2015/Fall 2105 the Economic Program Distance Education retention rate was 78.9% and the statewide average 82.04%. Both success and retention Distance Education rates are within an acceptable range ~ 3% of the state averages. We believe with the introduction of online tutoring this program could exceed the state average. Grand Total Sections 12 12 Grand Total Headcount 345 309 Grand Total Enrollment 376 326 Grand Total retained 312 275 Grand Total Retention % 82.98% 84.36% Grand Total success 262 226 Grand Total Success % 69.68% 69.33% Grand Total FTES 37.9 33.1
c:randres/documents/program review
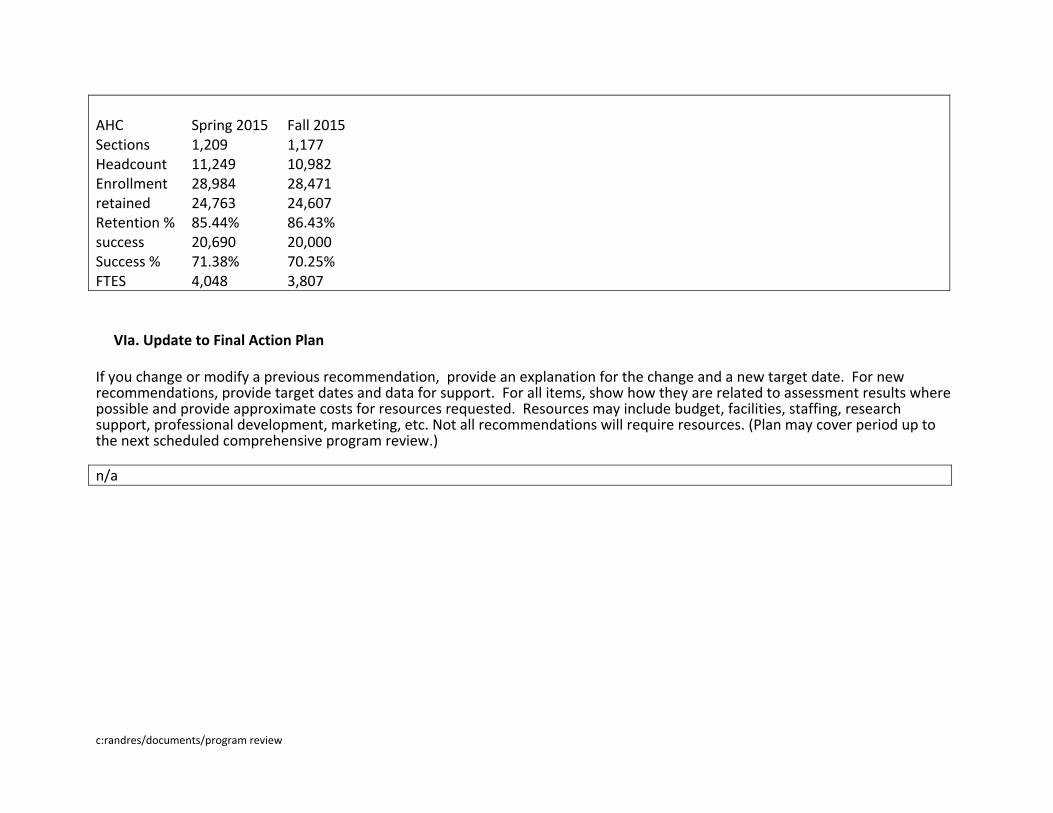
AHC Spring 2015 Fall 2015 Sections 1,209 1,177 Headcount 11,249 10,982 Enrollment 28,984 28,471 retained 24,763 24,607 Retention % 85.44% 86.43% success 20,690 20,000 Success % 71.38% 70.25% FTES 4,048 3,807
VIa. Update to Final Action Plan
If you change or modify a previous If you change or modify a previous recommendation, provide an explanation for the change and a new target date. For new recommendations, provide target dates and data for support. For all items, show how they are related to assessment results where possible and provide approximate costs for resources requested. Resources may include budget, facilities, staffing, research support, professional development, marketing, etc. Not all recommendations will require resources. (Plan may cover period up to the next scheduled comprehensive program review.)
n/a
c:randres/documents/program review
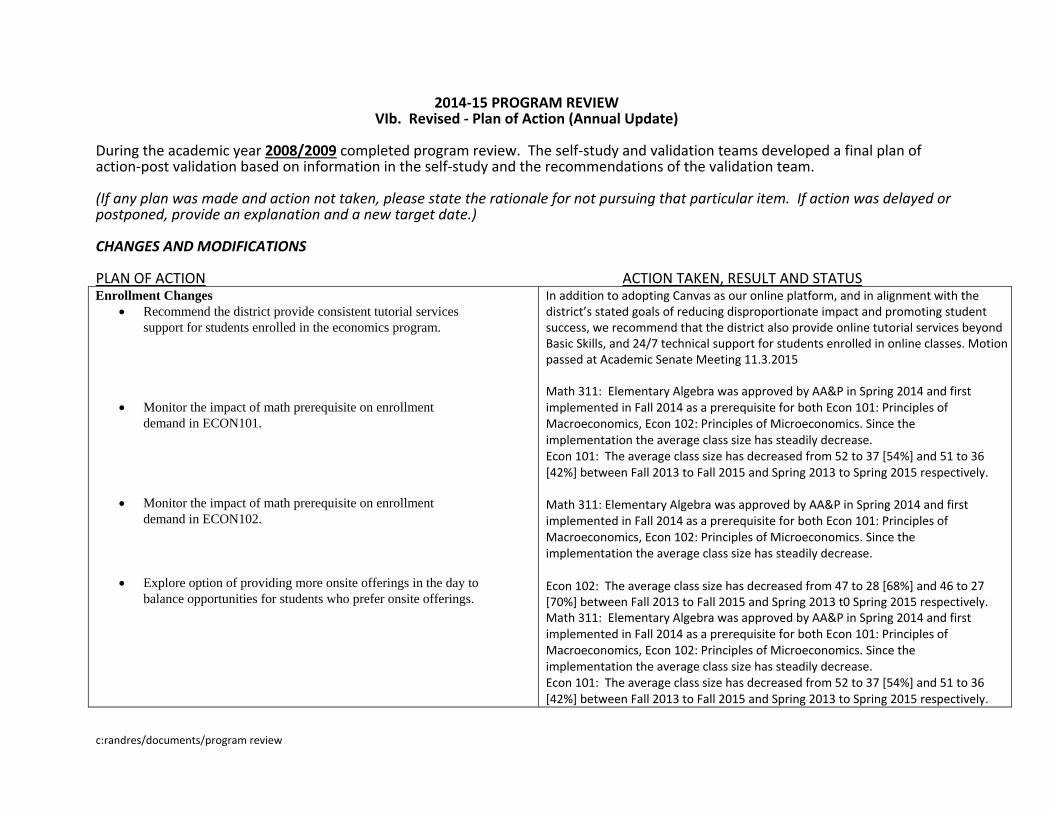
2014-15 PROGRAM REVIEW VIb. Revised - Plan of Action (Annual Update)
During the academic year 2008/2009 completed program review. The self-study and validation teams developed a final plan of action-post validation based on information in the self-study and the recommendations of the validation team. (If any plan was made and action not taken, please state the rationale for not pursuing that particular item. If action was delayed or postponed, provide an explanation and a new target date.) CHANGES AND MODIFICATIONS PLAN OF ACTION ACTION TAKEN, RESULT AND STATUS Enrollment Changes
Recommend the district provide consistent tutorial services
support for students enrolled in the economics program.
Monitor the impact of math prerequisite on enrollment
demand in ECON101.
Monitor the impact of math prerequisite on enrollment
demand in ECON102.
Explore option of providing more onsite offerings in the day to
balance opportunities for students who prefer onsite offerings.
In addition to adopting Canvas as our online platform, and in alignment with the district’s stated goals of reducing disproportionate impact and promoting student success, we recommend that the district also provide online tutorial services beyond Basic Skills, and 24/7 technical support for students enrolled in online classes. Motion passed at Academic Senate Meeting 11.3.2015 Math 311: Elementary Algebra was approved by AA&P in Spring 2014 and first implemented in Fall 2014 as a prerequisite for both Econ 101: Principles of Macroeconomics, Econ 102: Principles of Microeconomics. Since the implementation the average class size has steadily decrease. Econ 101: The average class size has decreased from 52 to 37 [54%] and 51 to 36 [42%] between Fall 2013 to Fall 2015 and Spring 2013 to Spring 2015 respectively. Math 311: Elementary Algebra was approved by AA&P in Spring 2014 and first implemented in Fall 2014 as a prerequisite for both Econ 101: Principles of Macroeconomics, Econ 102: Principles of Microeconomics. Since the implementation the average class size has steadily decrease. Econ 102: The average class size has decreased from 47 to 28 [68%] and 46 to 27 [70%] between Fall 2013 to Fall 2015 and Spring 2013 t0 Spring 2015 respectively. Math 311: Elementary Algebra was approved by AA&P in Spring 2014 and first implemented in Fall 2014 as a prerequisite for both Econ 101: Principles of Macroeconomics, Econ 102: Principles of Microeconomics. Since the implementation the average class size has steadily decrease. Econ 101: The average class size has decreased from 52 to 37 [54%] and 51 to 36 [42%] between Fall 2013 to Fall 2015 and Spring 2013 to Spring 2015 respectively.
c:randres/documents/program review
Econ 102: The average class size has decreased from 47 to 28 [68%] and 46 to 27 [70%] between Fall 2013 to Fall 2015 and Spring 2013 t0 Spring 2015 respectively. We will continue to Monitor the impact of math prerequisite on enrollment demand and add sections that wouldn't diminish enrollment in existing sections.
Curricular Changes
Explore the value added of developing a Transfer Degree in
Economics.
Assess degree programs at other CCs (there are over 30 colleges with
AA degrees) and assess option of a program.
Falll 2017
Fall 2017
ADDITIONS PLAN OF ACTION TARGET DATE Facilities
Need for a space to accommodate all students at once in computer lab.
Equipment
An Apple MacBook computer for the full time
instructor in the program.
Replace computer in classroom C33
Staffing
Fall 2017
Determined relevant by the Program Review Team, approved by the Dean, the request was not approved by TAC. CM 2.19.2015.
A new “smart podium was install in C-33 at the start of Spring 2016.
Current staffing in the program is well qualified and sufficient.
c:randres/documents/program review
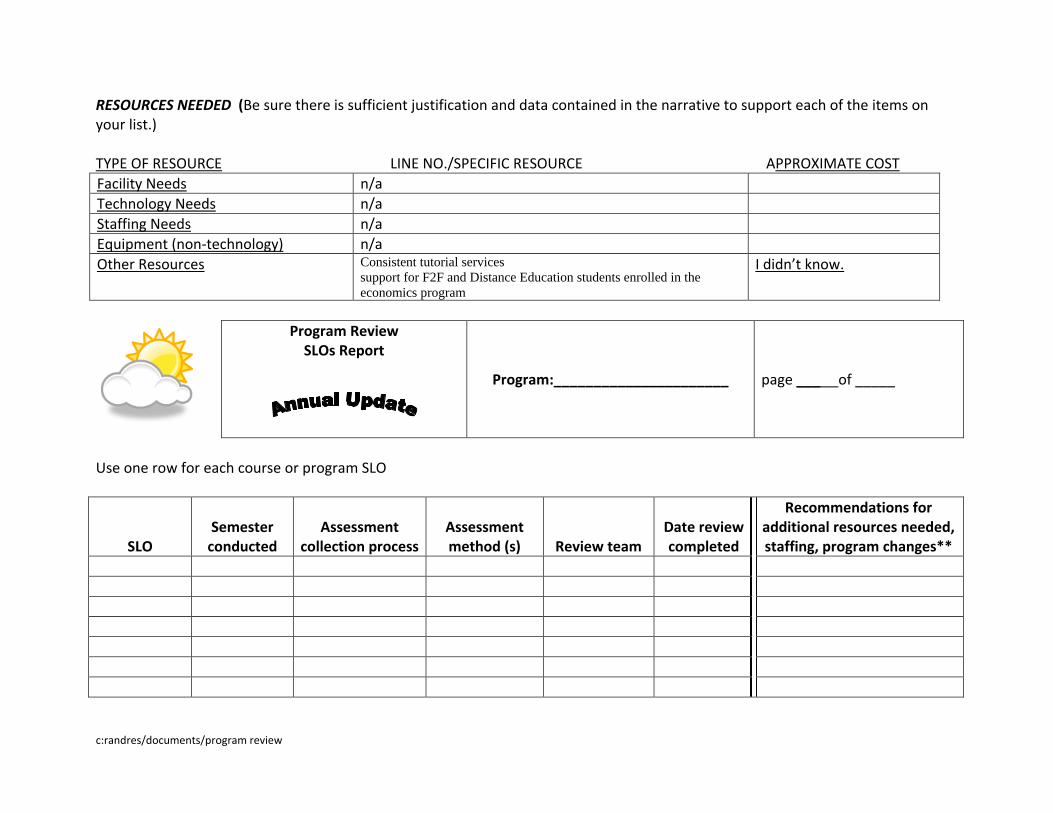
RESOURCES NEEDED (Be sure there is sufficient justification and data contained in the narrative to support each of the items on your list.) TYPE OF RESOURCE LINE NO./SPECIFIC RESOURCE APPROXIMATE COST
Facility Needs n/a
Technology Needs n/a
Staffing Needs n/a
Equipment (non-technology) n/a
Other Resources Consistent tutorial services
support for F2F and Distance Education students enrolled in the
economics program
I didn’t know.
Program Review SLOs Report
Program:______________________ page ___ of _____
Use one row for each course or program SLO
SLO Semester
conducted Assessment
collection process Assessment method (s) Review team
Date review completed
Recommendations for additional resources needed, staffing, program changes**
c:randres/documents/program review
**DO NOT LEAVE FINAL COLUMN BLANK
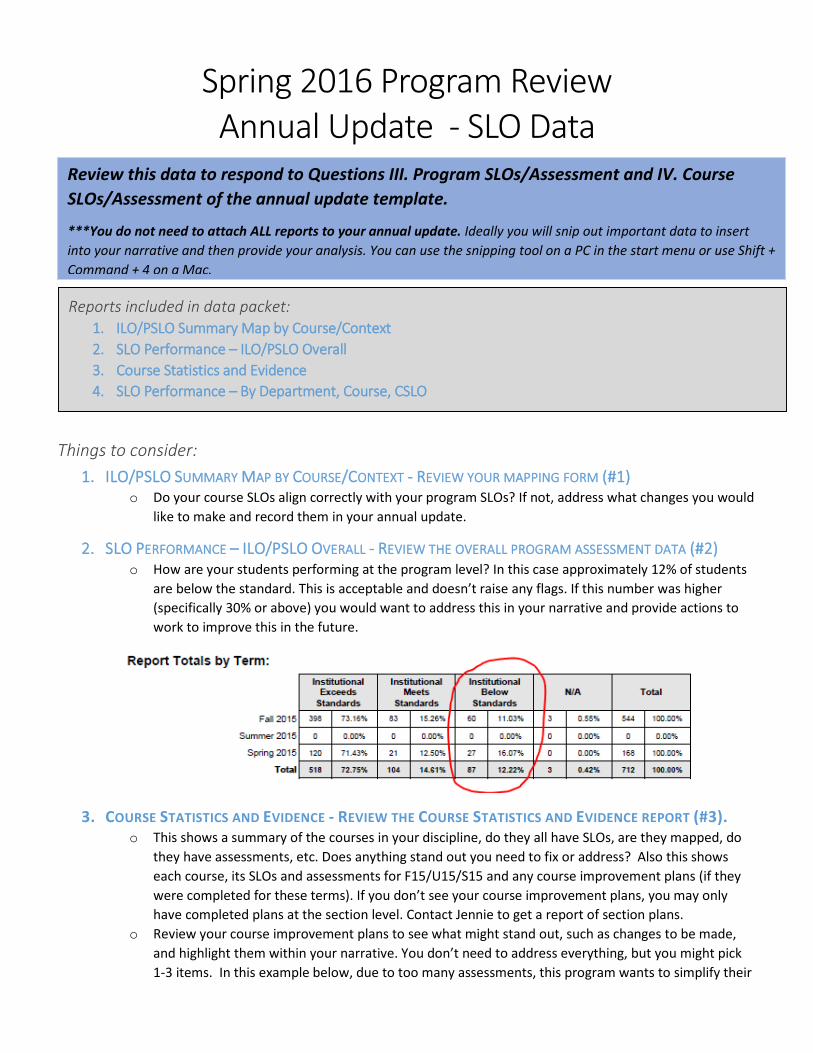
Spring 2016 Program Review Annual Update - SLO Data
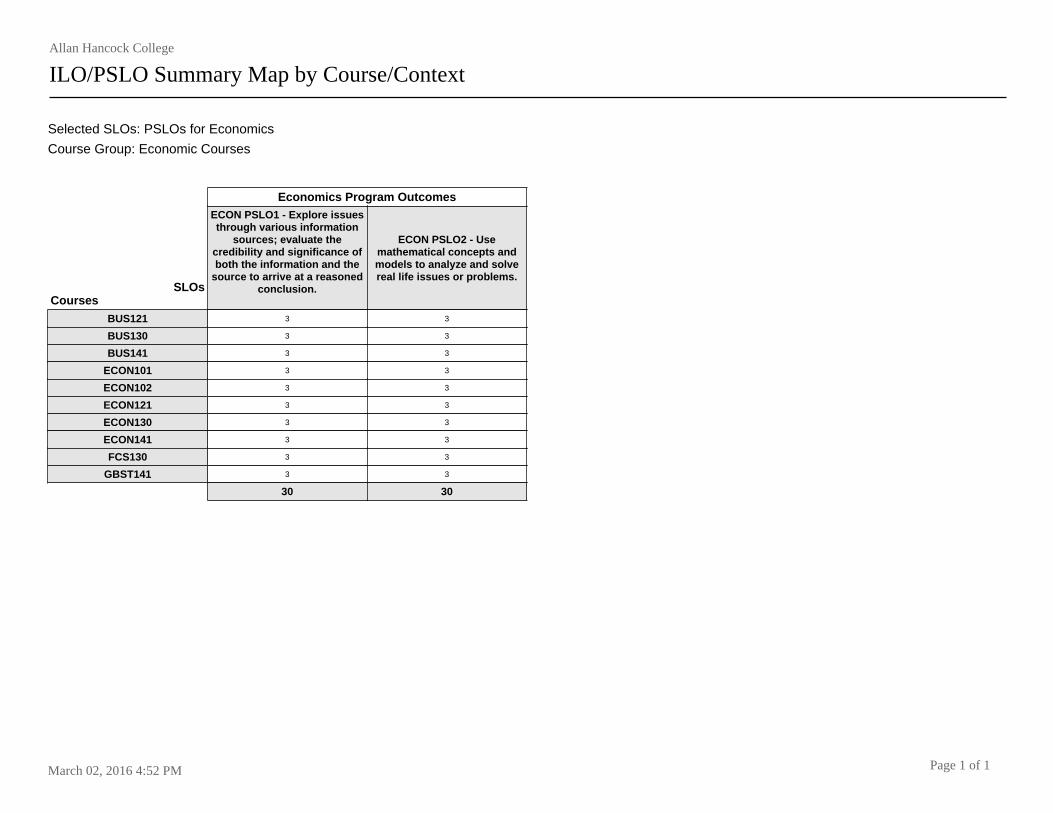
Things to consider: 1. ILO/PSLO SUMMARY MAP BY COURSE/CONTEXT - REVIEW YOUR MAPPING FORM (#1)
o Do your course SLOs align correctly with your program SLOs? If not, address what changes you would like to make and record them in your annual update.
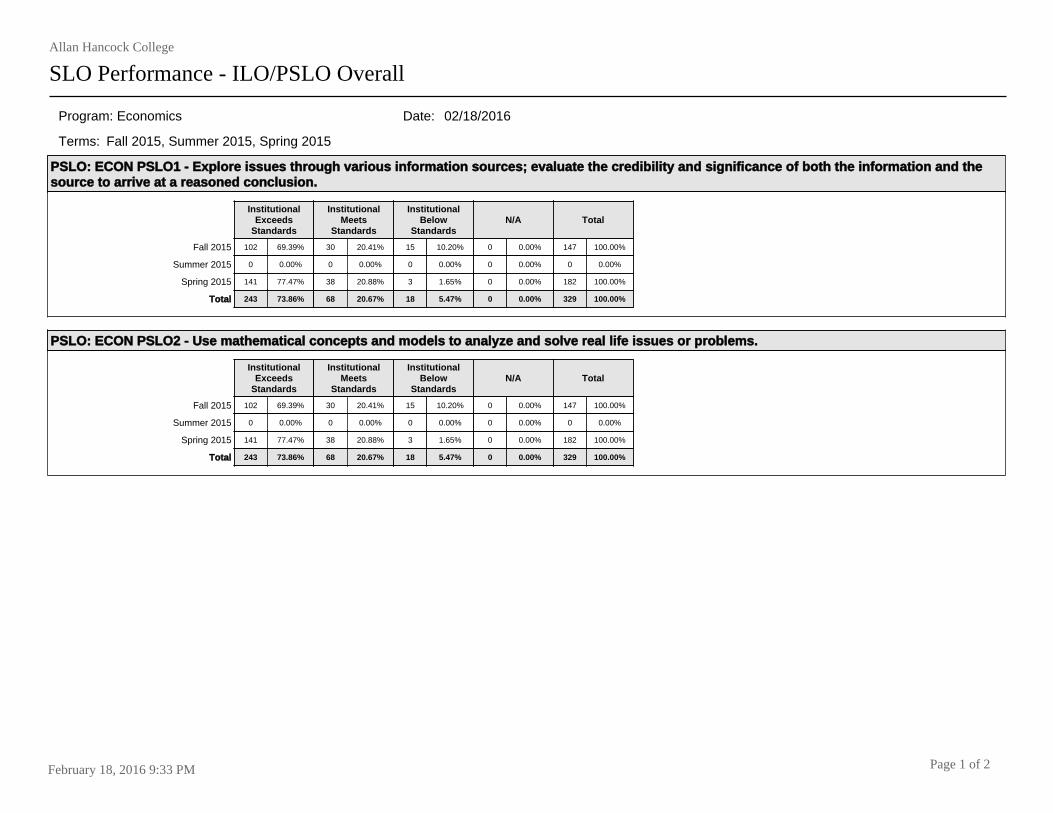
2. SLO PERFORMANCE – ILO/PSLO OVERALL - REVIEW THE OVERALL PROGRAM ASSESSMENT DATA (#2) o How are your students performing at the program level? In this case approximately 12% of students
are below the standard. This is acceptable and doesn’t raise any flags. If this number was higher (specifically 30% or above) you would want to address this in your narrative and provide actions to work to improve this in the future.
3. COURSE STATISTICS AND EVIDENCE - REVIEW THE COURSE STATISTICS AND EVIDENCE REPORT (#3). o This shows a summary of the courses in your discipline, do they all have SLOs, are they mapped, do
they have assessments, etc. Does anything stand out you need to fix or address? Also this shows each course, its SLOs and assessments for F15/U15/S15 and any course improvement plans (if they were completed for these terms). If you don’t see your course improvement plans, you may only have completed plans at the section level. Contact Jennie to get a report of section plans.
o Review your course improvement plans to see what might stand out, such as changes to be made, and highlight them within your narrative. You don’t need to address everything, but you might pick 1-3 items. In this example below, due to too many assessments, this program wants to simplify their
Review this data to respond to Questions III. Program SLOs/Assessment and IV. Course SLOs/Assessment of the annual update template.
***You do not need to attach ALL reports to your annual update. Ideally you will snip out important data to insert into your narrative and then provide your analysis. You can use the snipping tool on a PC in the start menu or use Shift + Command + 4 on a Mac.
Reports included in data packet: 1. ILO/PSLO Summary Map by Course/Context 2. SLO Performance – ILO/PSLO Overall 3. Course Statistics and Evidence 4. SLO Performance – By Department, Course, CSLO
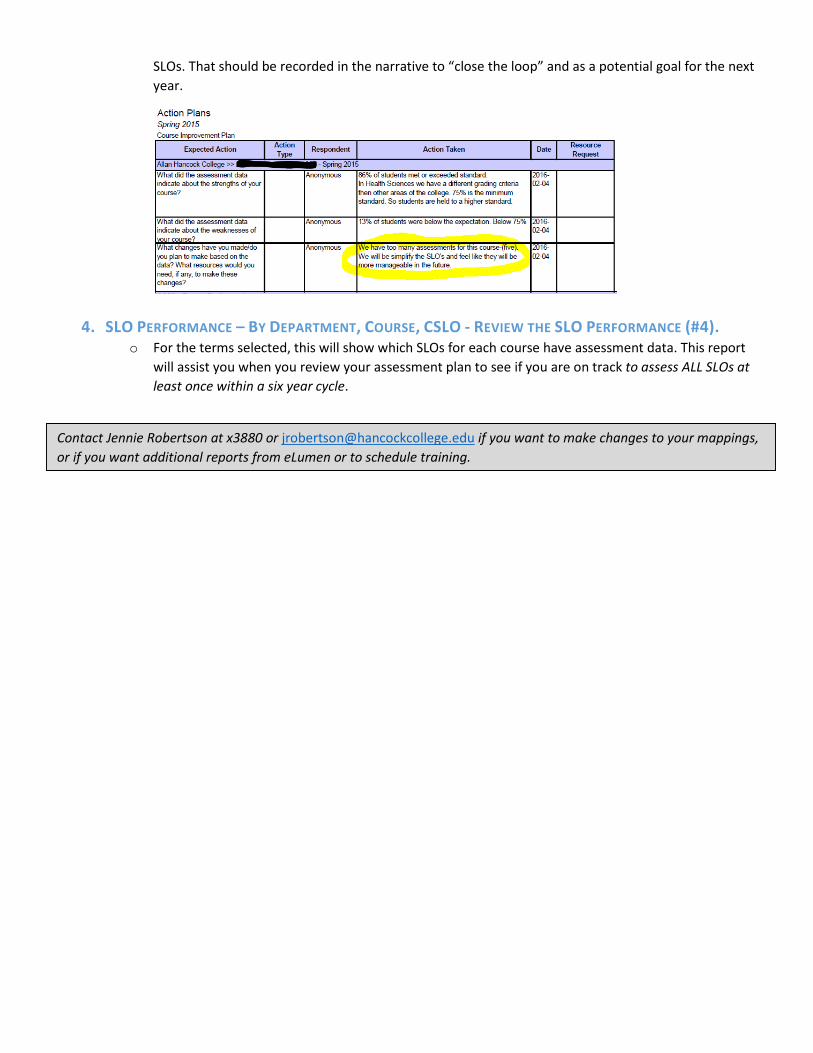
SLOs. That should be recorded in the narrative to “close the loop” and as a potential goal for the next year.
4. SLO PERFORMANCE – BY DEPARTMENT, COURSE, CSLO - REVIEW THE SLO PERFORMANCE (#4). o For the terms selected, this will show which SLOs for each course have assessment data. This report
will assist you when you review your assessment plan to see if you are on track to assess ALL SLOs at least once within a six year cycle.
Contact Jennie Robertson at x3880 or [email protected] if you want to make changes to your mappings, or if you want additional reports from eLumen or to schedule training.
Allan Hancock College
ILO/PSLO Summary Map by Course/Context
Selected SLOs: PSLOs for Economics
Course Group: Economic Courses
SLOsCourses
Economics Program OutcomesECON PSLO1 - Explore issuesthrough various information
sources; evaluate thecredibility and significance ofboth the information and the
source to arrive at a reasonedconclusion.
ECON PSLO2 - Usemathematical concepts andmodels to analyze and solvereal life issues or problems.
BUS121 3 3
BUS130 3 3
BUS141 3 3
ECON101 3 3
ECON102 3 3
ECON121 3 3
ECON130 3 3
ECON141 3 3
FCS130 3 3
GBST141 3 3
30 30
March 02, 2016 4:52 PM Page 1 of 1
Allan Hancock College
SLO Performance - ILO/PSLO Overall
Date: 02/18/2016Program: Economics
Terms: Fall 2015, Summer 2015, Spring 2015
PSLO: ECON PSLO1 - Explore issues through various information sources; evaluate the credibility and significance of both the information and thesource to arrive at a reasoned conclusion.
InstitutionalExceeds
Standards
InstitutionalMeets
Standards
InstitutionalBelow
StandardsN/A Total
Fall 2015 102 69.39% 30 20.41% 15 10.20% 0 0.00% 100.00%147
Summer 2015 0 0.00% 0 0.00% 0 0.00% 0 0.00% 0.00%0
Spring 2015 141 77.47% 38 20.88% 3 1.65% 0 0.00% 100.00%182
Total 243 73.86% 68 20.67% 18 5.47% 0 0.00% 100.00%329
PSLO: ECON PSLO2 - Use mathematical concepts and models to analyze and solve real life issues or problems.
InstitutionalExceeds
Standards
InstitutionalMeets
Standards
InstitutionalBelow
StandardsN/A Total
Fall 2015 102 69.39% 30 20.41% 15 10.20% 0 0.00% 100.00%147
Summer 2015 0 0.00% 0 0.00% 0 0.00% 0 0.00% 0.00%0
Spring 2015 141 77.47% 38 20.88% 3 1.65% 0 0.00% 100.00%182
Total 243 73.86% 68 20.67% 18 5.47% 0 0.00% 100.00%329
2Page 1 ofFebruary 18, 2016 9:33 PM
Allan Hancock College SLO Performance - ILO/PSLO Overall
Report Totals by Term:
Grand Totals:
InstitutionalExceeds
Standards
InstitutionalMeets
Standards
InstitutionalBelow
StandardsN/A Total
Fall 2015 204 69.39% 60 20.41% 30 10.20% 0 0.00% 100.00%294
Summer 2015 0 0.00% 0 0.00% 0 0.00% 0 0.00% 0.00%0
Spring 2015 282 77.47% 76 20.88% 6 1.65% 0 0.00% 100.00%364
Total 486 73.86% 136 20.67% 36 5.47% 0 0.00% 100.00%658
InstitutionalExceeds
Standards
InstitutionalMeets
Standards
InstitutionalBelow
StandardsN/A Total
Total 486 73.86% 136 20.67% 36 5.47% 0 0.00% 100.00%658
2Page 2 ofFebruary 18, 2016 9:33 PM
Date:
Terms:
»
»
»
»
»
»
»
Mapped PSLOs
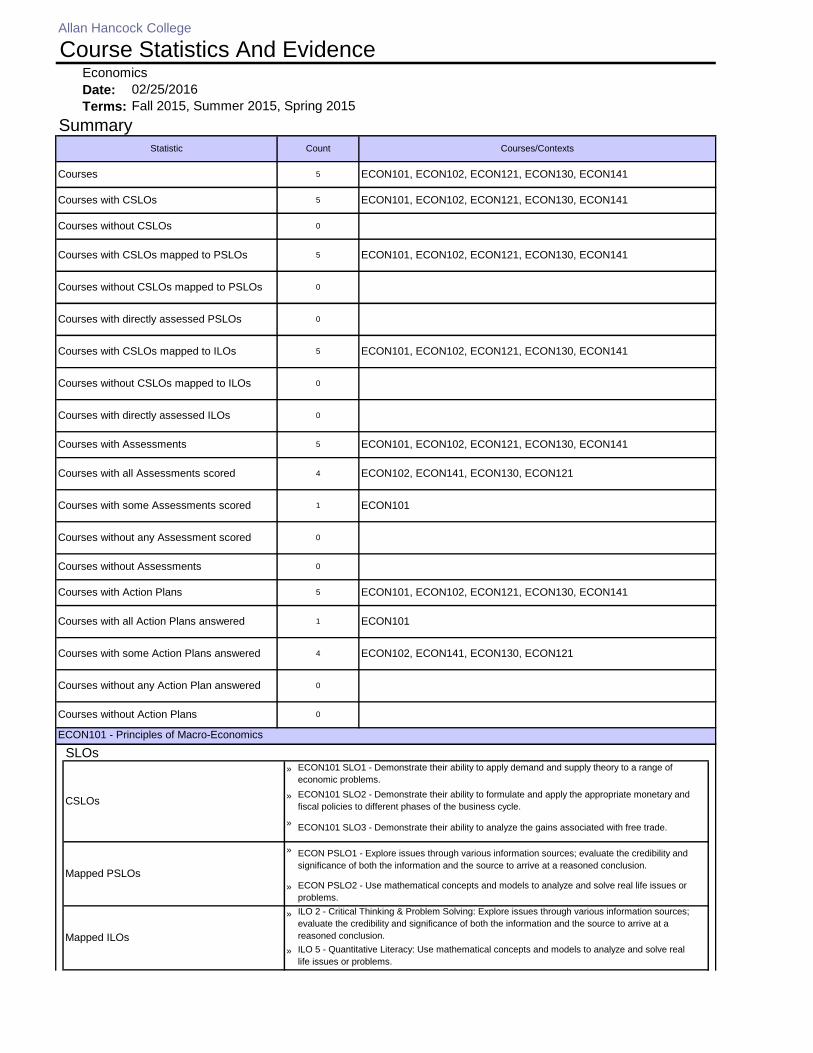
ECON PSLO1 - Explore issues through various information sources; evaluate the credibility and
significance of both the information and the source to arrive at a reasoned conclusion.
ECON PSLO2 - Use mathematical concepts and models to analyze and solve real life issues or
problems.
Mapped ILOs
ILO 2 - Critical Thinking & Problem Solving: Explore issues through various information sources;
evaluate the credibility and significance of both the information and the source to arrive at a
reasoned conclusion.
ILO 5 - Quantitative Literacy: Use mathematical concepts and models to analyze and solve real
life issues or problems.
ECON101 - Principles of Macro-Economics
SLOs
CSLOs
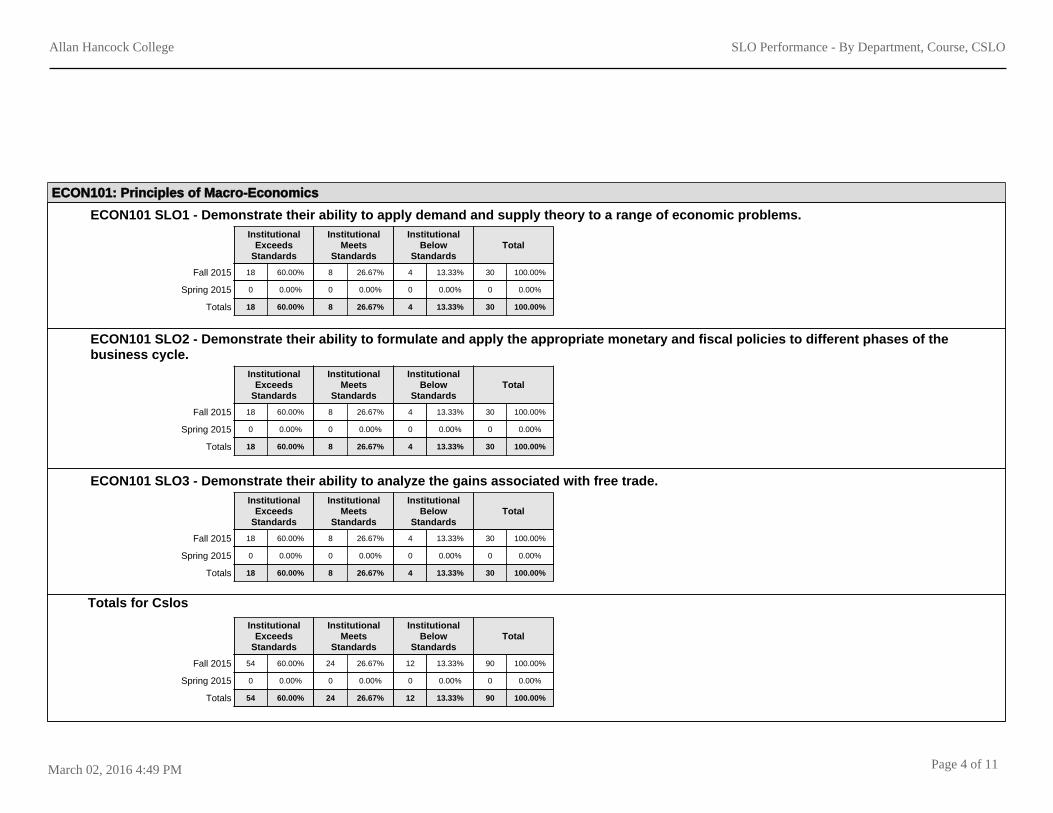
ECON101 SLO1 - Demonstrate their ability to apply demand and supply theory to a range of
economic problems.
ECON101 SLO2 - Demonstrate their ability to formulate and apply the appropriate monetary and
fiscal policies to different phases of the business cycle.
ECON101 SLO3 - Demonstrate their ability to analyze the gains associated with free trade.
Courses without any Action Plan answered 0
Courses without Action Plans 0
Courses with all Action Plans answered 1 ECON101
Courses with some Action Plans answered 4 ECON102, ECON141, ECON130, ECON121
Courses without Assessments 0
Courses with Action Plans 5 ECON101, ECON102, ECON121, ECON130, ECON141
Courses with some Assessments scored 1 ECON101
Courses without any Assessment scored 0
Courses with Assessments 5 ECON101, ECON102, ECON121, ECON130, ECON141
Courses with all Assessments scored 4 ECON102, ECON141, ECON130, ECON121
Courses without CSLOs mapped to ILOs 0
Courses with directly assessed ILOs 0
Courses with directly assessed PSLOs 0
Courses with CSLOs mapped to ILOs 5 ECON101, ECON102, ECON121, ECON130, ECON141
Courses with CSLOs mapped to PSLOs 5 ECON101, ECON102, ECON121, ECON130, ECON141
Courses without CSLOs mapped to PSLOs 0
Courses with CSLOs 5 ECON101, ECON102, ECON121, ECON130, ECON141
Courses without CSLOs 0
Summary
Statistic Count Courses/Contexts
Courses 5 ECON101, ECON102, ECON121, ECON130, ECON141
Allan Hancock College
Course Statistics And EvidenceEconomics
02/25/2016
Fall 2015, Summer 2015, Spring 2015
Institutional Below
Standards
13.33%
13.33%
13.33%
»
»
»
»
»
»
»
Institutional Below
Standards
5.26%
5.26%
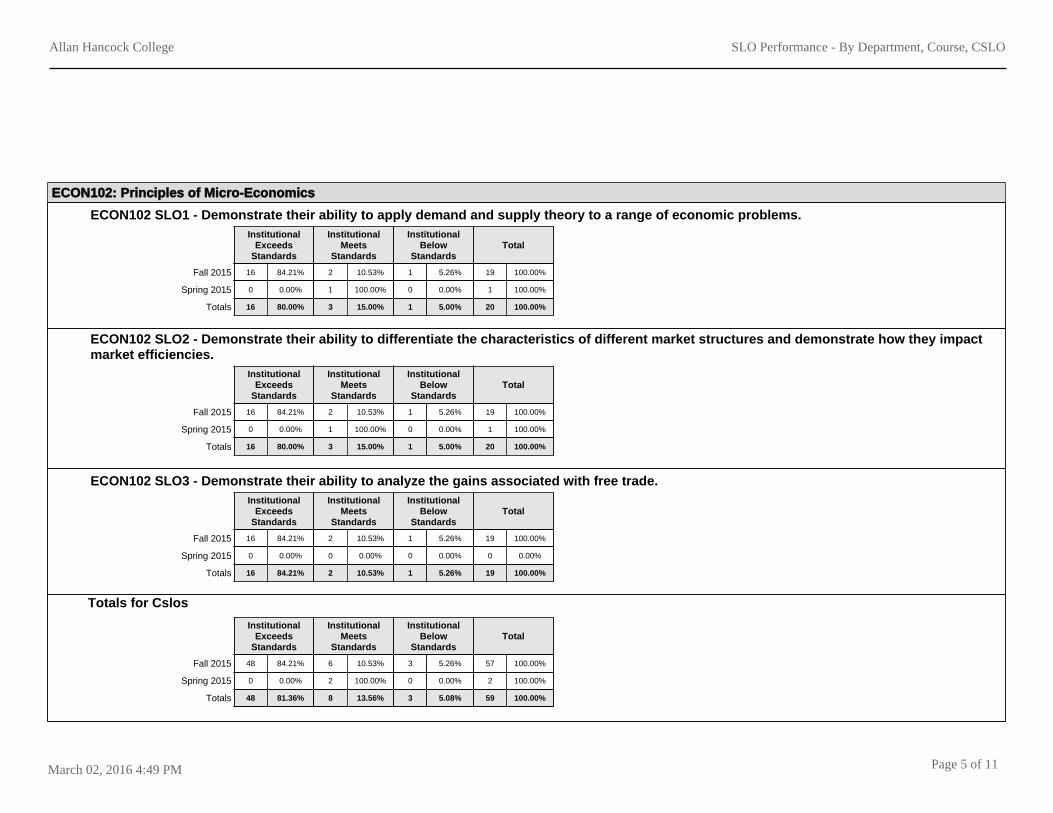
ECON102 SLO1 - Demonstrate their ability to
apply demand and supply theory to a range of
economic problems.
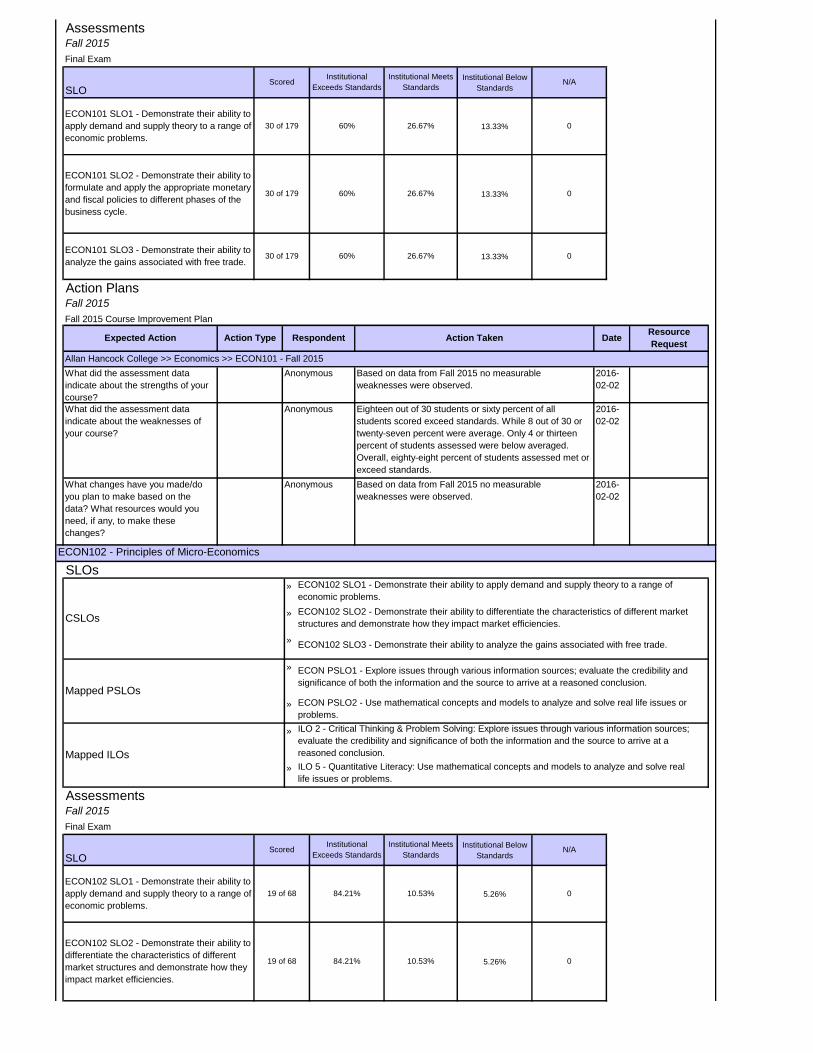
19 of 68 84.21% 10.53% 0
ECON102 SLO2 - Demonstrate their ability to
differentiate the characteristics of different
market structures and demonstrate how they
impact market efficiencies.
19 of 68 84.21% 10.53% 0
Final Exam
SLOScored
Institutional
Exceeds Standards
Institutional Meets
StandardsN/A
Fall 2015
Assessments
Mapped PSLOs
ECON PSLO1 - Explore issues through various information sources; evaluate the credibility and
significance of both the information and the source to arrive at a reasoned conclusion.
ECON PSLO2 - Use mathematical concepts and models to analyze and solve real life issues or
problems.
Mapped ILOs
ILO 2 - Critical Thinking & Problem Solving: Explore issues through various information sources;
evaluate the credibility and significance of both the information and the source to arrive at a
reasoned conclusion.
ILO 5 - Quantitative Literacy: Use mathematical concepts and models to analyze and solve real
life issues or problems.
ECON102 - Principles of Micro-Economics
SLOs
CSLOs
ECON102 SLO1 - Demonstrate their ability to apply demand and supply theory to a range of
economic problems.
ECON102 SLO2 - Demonstrate their ability to differentiate the characteristics of different market
structures and demonstrate how they impact market efficiencies.
ECON102 SLO3 - Demonstrate their ability to analyze the gains associated with free trade.
What changes have you made/do
you plan to make based on the
data? What resources would you
need, if any, to make these
changes?
Anonymous Based on data from Fall 2015 no measurable
weaknesses were observed.
2016-
02-02
What did the assessment data
indicate about the weaknesses of
your course?
Anonymous Eighteen out of 30 students or sixty percent of all
students scored exceed standards. While 8 out of 30 or
twenty-seven percent were average. Only 4 or thirteen
percent of students assessed were below averaged.
Overall, eighty-eight percent of students assessed met or
exceed standards.
2016-
02-02
Allan Hancock College >> Economics >> ECON101 - Fall 2015
What did the assessment data
indicate about the strengths of your
course?
Anonymous Based on data from Fall 2015 no measurable
weaknesses were observed.
2016-
02-02
Fall 2015
Fall 2015 Course Improvement Plan
Expected Action Action Type Respondent Action Taken DateResource
Request
ECON101 SLO3 - Demonstrate their ability to
analyze the gains associated with free trade.30 of 179 60% 26.67% 0
Action Plans
ECON101 SLO1 - Demonstrate their ability to
apply demand and supply theory to a range of
economic problems.
30 of 179 60% 26.67% 0
ECON101 SLO2 - Demonstrate their ability to
formulate and apply the appropriate monetary
and fiscal policies to different phases of the
business cycle.
30 of 179 60% 26.67% 0
Final Exam
SLOScored
Institutional
Exceeds Standards
Institutional Meets
StandardsN/A
Fall 2015
Assessments
5.26%
»
»
»
»
»
»
»
Institutional Below
Standards
0%
0%
0%
Allan Hancock College >> Economics >> ECON121 - Spring 2015
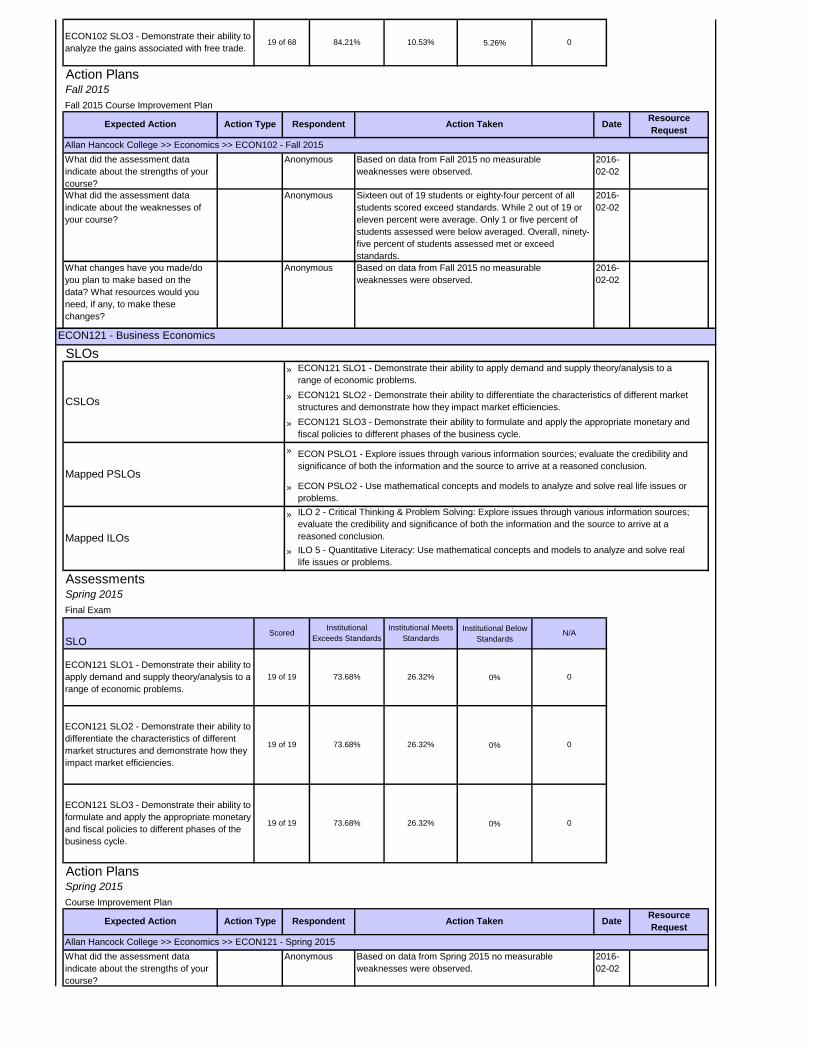
What did the assessment data
indicate about the strengths of your
course?
Anonymous Based on data from Spring 2015 no measurable
weaknesses were observed.
2016-
02-02
Spring 2015
Course Improvement Plan
Expected Action Action Type Respondent Action Taken DateResource
Request
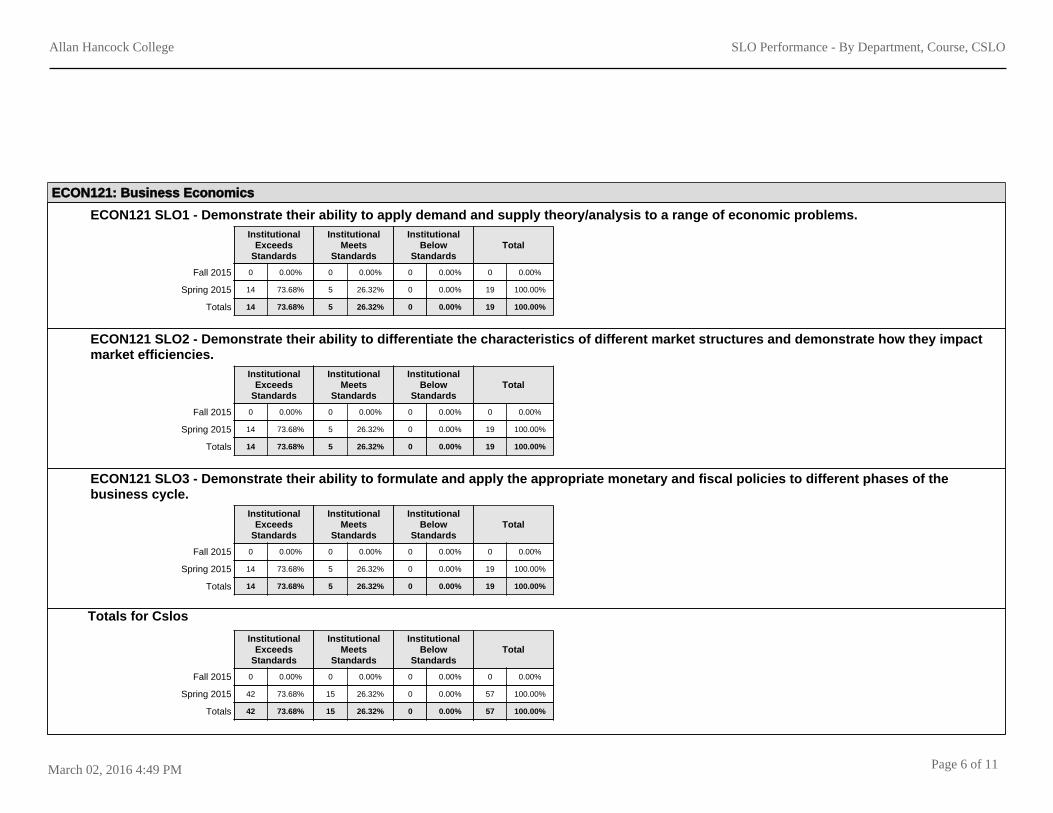
ECON121 SLO3 - Demonstrate their ability to
formulate and apply the appropriate monetary
and fiscal policies to different phases of the
business cycle.
19 of 19 73.68% 26.32% 0
Action Plans
ECON121 SLO1 - Demonstrate their ability to
apply demand and supply theory/analysis to a
range of economic problems.
19 of 19 73.68% 26.32% 0
ECON121 SLO2 - Demonstrate their ability to
differentiate the characteristics of different
market structures and demonstrate how they
impact market efficiencies.
19 of 19 73.68% 26.32% 0
AssessmentsSpring 2015
Final Exam
SLOScored
Institutional
Exceeds Standards
Institutional Meets
StandardsN/A
Mapped PSLOs
ECON PSLO1 - Explore issues through various information sources; evaluate the credibility and
significance of both the information and the source to arrive at a reasoned conclusion.
ECON PSLO2 - Use mathematical concepts and models to analyze and solve real life issues or
problems.
Mapped ILOs
ILO 2 - Critical Thinking & Problem Solving: Explore issues through various information sources;
evaluate the credibility and significance of both the information and the source to arrive at a
reasoned conclusion.
ILO 5 - Quantitative Literacy: Use mathematical concepts and models to analyze and solve real
life issues or problems.
ECON121 - Business Economics
SLOs
CSLOs
ECON121 SLO1 - Demonstrate their ability to apply demand and supply theory/analysis to a
range of economic problems.
ECON121 SLO2 - Demonstrate their ability to differentiate the characteristics of different market
structures and demonstrate how they impact market efficiencies.
ECON121 SLO3 - Demonstrate their ability to formulate and apply the appropriate monetary and
fiscal policies to different phases of the business cycle.
What changes have you made/do
you plan to make based on the
data? What resources would you
need, if any, to make these
changes?
Anonymous Based on data from Fall 2015 no measurable
weaknesses were observed.
2016-
02-02
What did the assessment data
indicate about the weaknesses of
your course?
Anonymous Sixteen out of 19 students or eighty-four percent of all
students scored exceed standards. While 2 out of 19 or
eleven percent were average. Only 1 or five percent of
students assessed were below averaged. Overall, ninety-
five percent of students assessed met or exceed
standards.
2016-
02-02
Allan Hancock College >> Economics >> ECON102 - Fall 2015
What did the assessment data
indicate about the strengths of your
course?
Anonymous Based on data from Fall 2015 no measurable
weaknesses were observed.
2016-
02-02
Fall 2015
Fall 2015 Course Improvement Plan
Expected Action Action Type Respondent Action Taken DateResource
Request
ECON102 SLO3 - Demonstrate their ability to
analyze the gains associated with free trade.19 of 68 84.21% 10.53% 0
Action Plans
»
»
»
»
»
»
»
Institutional Below
Standards
0%
0%
0%
What changes have you made/do
you plan to make based on the
data? What resources would you
need, if any, to make these
changes?
Anonymous Based on data from Spring 2015 no measurable
weaknesses were observed.
2016-
02-02
What did the assessment data
indicate about the weaknesses of
your course?
Anonymous This Course Improvement Plan reflects combined data
form this cross-listed course - Consumer and Family
Finance - ECON 130 or BUS 130 or FCS 130.
Thirty-two out of 50 students or sixty-four percent of all
students scored exceed standards. While 14 out of 30 or
twenty-eight percent were average. Only 4 or eight
percent of students assessed were below averaged.
Overall, ninety-two percent of students assessed met or
exceed standards.
2016-
02-02
Allan Hancock College >> Economics >> ECON130 - Spring 2015
What did the assessment data
indicate about the strengths of your
course?
Anonymous Based on data from Spring 2015 no measurable
weaknesses were observed.
2016-
02-02
Spring 2015
Course Improvement Plan
Expected Action Action Type Respondent Action Taken DateResource
Request
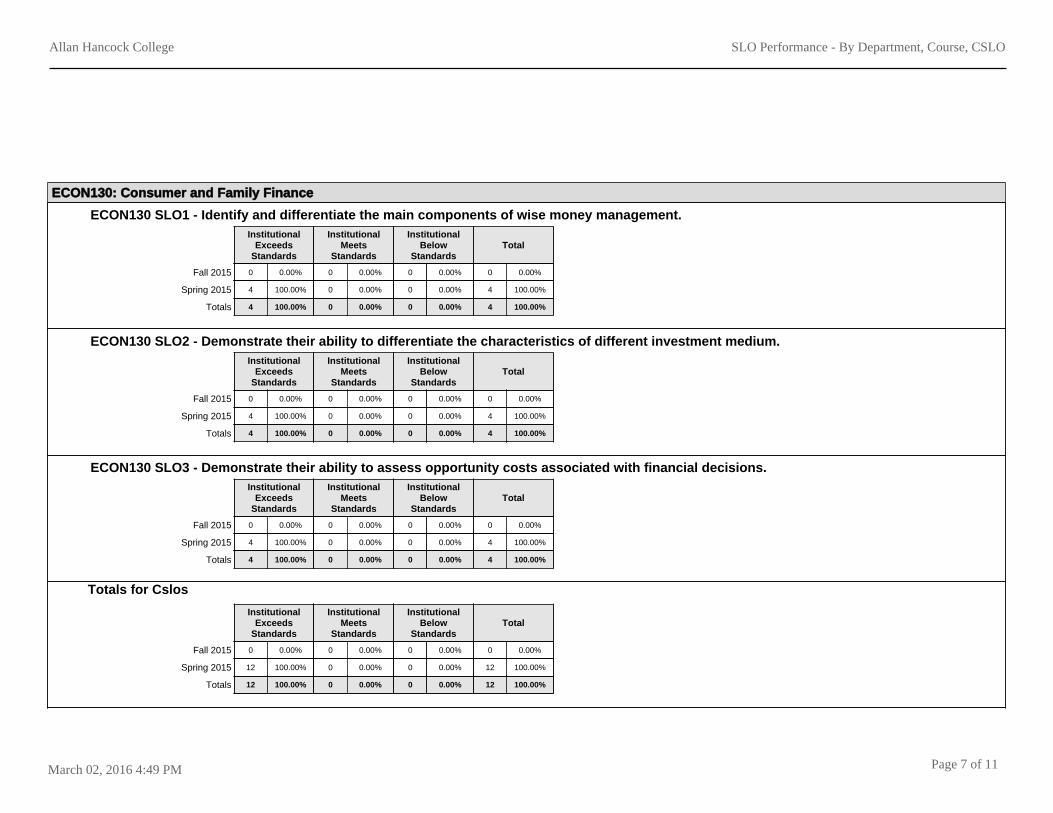
ECON130 SLO3 - Demonstrate their ability to
assess opportunity costs associated with
financial decisions.
4 of 4 100% 0% 0
Action Plans
ECON130 SLO1 - Identify and differentiate
the main components of wise money
management.
4 of 4 100% 0% 0
ECON130 SLO2 - Demonstrate their ability to
differentiate the characteristics of different
investment medium.
4 of 4 100% 0% 0
AssessmentsSpring 2015
Final Exam
SLOScored
Institutional
Exceeds Standards
Institutional Meets
StandardsN/A
Mapped PSLOs
ECON PSLO1 - Explore issues through various information sources; evaluate the credibility and
significance of both the information and the source to arrive at a reasoned conclusion.
ECON PSLO2 - Use mathematical concepts and models to analyze and solve real life issues or
problems.
Mapped ILOs
ILO 2 - Critical Thinking & Problem Solving: Explore issues through various information sources;
evaluate the credibility and significance of both the information and the source to arrive at a
reasoned conclusion.
ILO 7 - Personal Responsibility & Development: Take the initiative and responsibility to assess
your own actions with regard to physical wellness, learning opportunities, career planning,
creative contribution to the community and ethical integrity in the home, workplace and
community.
ECON130 - Consumer and Family Finance
SLOs
CSLOs
ECON130 SLO1 - Identify and differentiate the main components of wise money management.
ECON130 SLO2 - Demonstrate their ability to differentiate the characteristics of different
investment medium.
ECON130 SLO3 - Demonstrate their ability to assess opportunity costs associated with financial
decisions.
What changes have you made/do
you plan to make based on the
data? What resources would you
need, if any, to make these
changes?
Anonymous Based on data from Spring 2015 no measurable
weaknesses were observed.
2016-
02-02
What did the assessment data
indicate about the weaknesses of
your course?
Anonymous This Course Improvement Plan reflects combined data
form this cross-listed course - Business Economics
[ECON 121 / BUS 121]
Nineteen out of 32 students or sixty percent of all
students scored exceed standards. While 12 out of 32 or
thirty-eight percent were average. Only 1 or three percent
of students assessed were below averaged. Overall,
eighty-four percent of students assessed met or exceed
standards.
2016-
02-02
»
»
»
»
»
»
»
Institutional Below
Standards
7.14%
7.14%
7.14%
What changes have you made/do
you plan to make based on the
data? What resources would you
need, if any, to make these
changes?
Anonymous Based on data from Spring 2015 no measurable
weaknesses were observed.
2016-
02-02
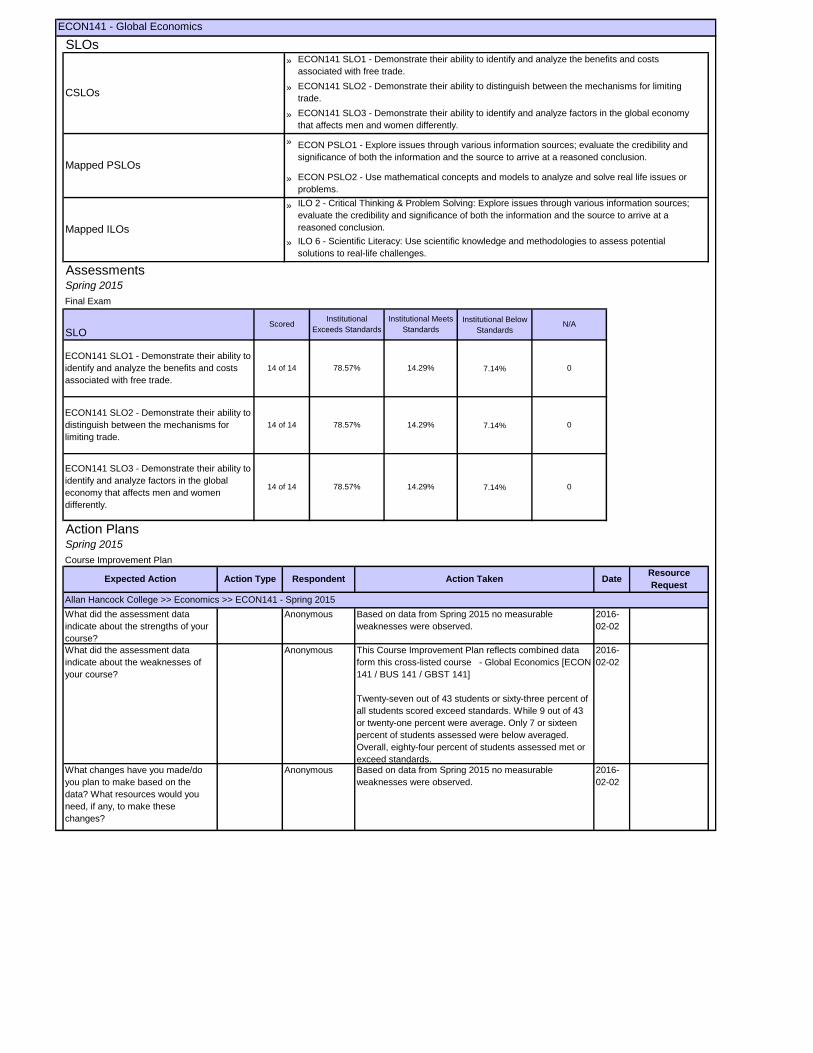
What did the assessment data
indicate about the weaknesses of
your course?
Anonymous This Course Improvement Plan reflects combined data
form this cross-listed course - Global Economics [ECON
141 / BUS 141 / GBST 141]
Twenty-seven out of 43 students or sixty-three percent of
all students scored exceed standards. While 9 out of 43
or twenty-one percent were average. Only 7 or sixteen
percent of students assessed were below averaged.
Overall, eighty-four percent of students assessed met or
exceed standards.
2016-
02-02
Allan Hancock College >> Economics >> ECON141 - Spring 2015
What did the assessment data
indicate about the strengths of your
course?
Anonymous Based on data from Spring 2015 no measurable
weaknesses were observed.
2016-
02-02
Spring 2015
Course Improvement Plan
Expected Action Action Type Respondent Action Taken DateResource
Request
ECON141 SLO3 - Demonstrate their ability to
identify and analyze factors in the global
economy that affects men and women
differently.
14 of 14 78.57% 14.29% 0
Action Plans
ECON141 SLO1 - Demonstrate their ability to
identify and analyze the benefits and costs
associated with free trade.
14 of 14 78.57% 14.29% 0
ECON141 SLO2 - Demonstrate their ability to
distinguish between the mechanisms for
limiting trade.
14 of 14 78.57% 14.29% 0
AssessmentsSpring 2015
Final Exam
SLOScored
Institutional
Exceeds Standards
Institutional Meets
StandardsN/A
Mapped PSLOs
ECON PSLO1 - Explore issues through various information sources; evaluate the credibility and
significance of both the information and the source to arrive at a reasoned conclusion.
ECON PSLO2 - Use mathematical concepts and models to analyze and solve real life issues or
problems.
Mapped ILOs
ILO 2 - Critical Thinking & Problem Solving: Explore issues through various information sources;
evaluate the credibility and significance of both the information and the source to arrive at a
reasoned conclusion.
ILO 6 - Scientific Literacy: Use scientific knowledge and methodologies to assess potential
solutions to real-life challenges.
ECON141 - Global Economics
SLOs
CSLOs
ECON141 SLO1 - Demonstrate their ability to identify and analyze the benefits and costs
associated with free trade.
ECON141 SLO2 - Demonstrate their ability to distinguish between the mechanisms for limiting
trade.
ECON141 SLO3 - Demonstrate their ability to identify and analyze factors in the global economy
that affects men and women differently.
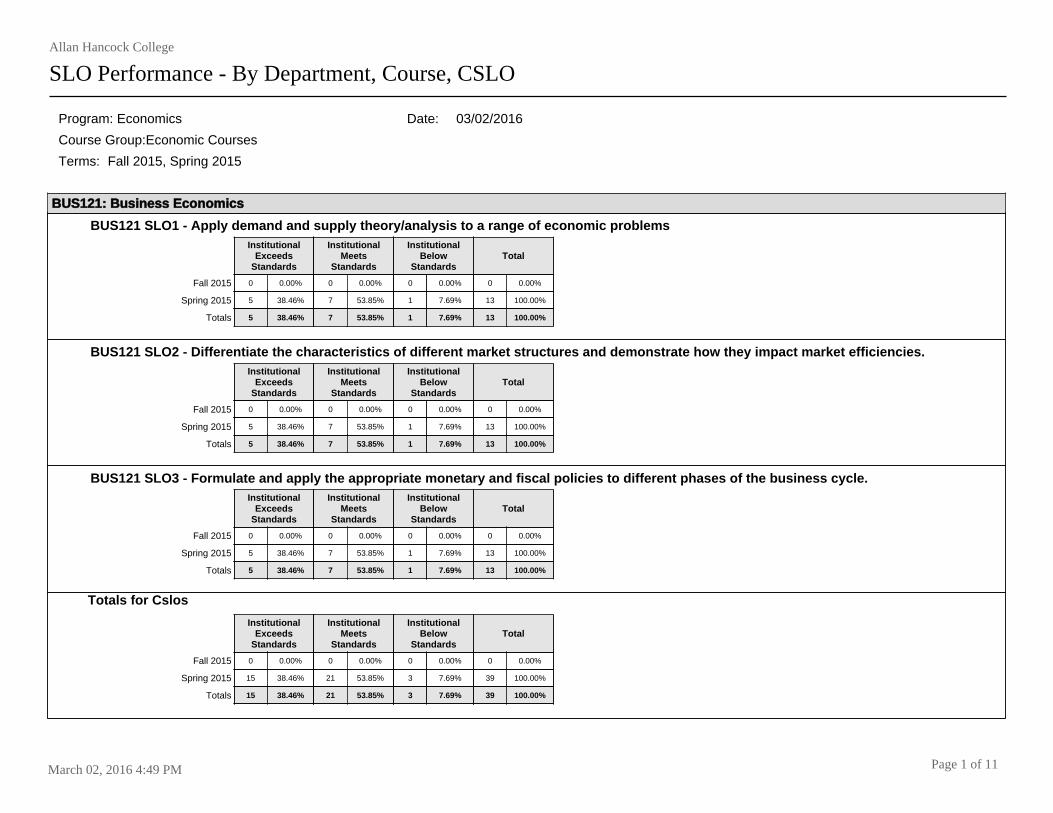
Allan Hancock College
SLO Performance - By Department, Course, CSLO
03/02/2016Program: Economics
Course Group:Economic Courses
Date:
Terms: Fall 2015, Spring 2015
BUS121: Business Economics
BUS121 SLO1 - Apply demand and supply theory/analysis to a range of economic problemsInstitutional
ExceedsStandards
InstitutionalMeets
Standards
InstitutionalBelow
StandardsTotal
Fall 2015 0 0.00% 0 0.00% 0 0.00% 0.00%0
Spring 2015 5 38.46% 7 53.85% 1 7.69% 100.00%13
Totals 5 38.46% 7 53.85% 1 7.69% 100.00%13
BUS121 SLO2 - Differentiate the characteristics of different market structures and demonstrate how they impact market efficiencies.Institutional
ExceedsStandards
InstitutionalMeets
Standards
InstitutionalBelow
StandardsTotal
Fall 2015 0 0.00% 0 0.00% 0 0.00% 0.00%0
Spring 2015 5 38.46% 7 53.85% 1 7.69% 100.00%13
Totals 5 38.46% 7 53.85% 1 7.69% 100.00%13
BUS121 SLO3 - Formulate and apply the appropriate monetary and fiscal policies to different phases of the business cycle.Institutional
ExceedsStandards
InstitutionalMeets
Standards
InstitutionalBelow
StandardsTotal
Fall 2015 0 0.00% 0 0.00% 0 0.00% 0.00%0
Spring 2015 5 38.46% 7 53.85% 1 7.69% 100.00%13
Totals 5 38.46% 7 53.85% 1 7.69% 100.00%13
InstitutionalExceeds
Standards
InstitutionalMeets
Standards
InstitutionalBelow
StandardsTotal
Fall 2015 0 0.00% 0 0.00% 0 0.00% 0.00%0
Spring 2015 15 38.46% 21 53.85% 3 7.69% 100.00%39
Totals 15 38.46% 21 53.85% 3 7.69% 100.00%39
Totals for Cslos
11Page 1 ofMarch 02, 2016 4:49 PM
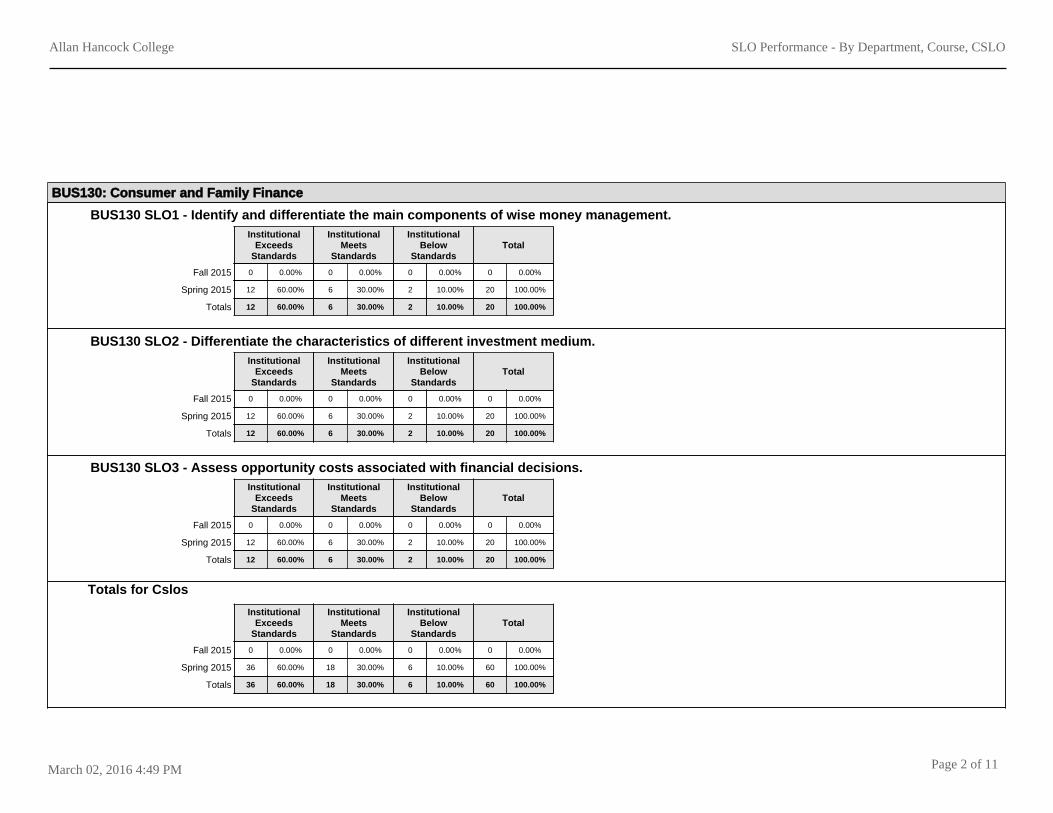
Allan Hancock College SLO Performance - By Department, Course, CSLO
BUS130: Consumer and Family Finance
BUS130 SLO1 - Identify and differentiate the main components of wise money management.Institutional
ExceedsStandards
InstitutionalMeets
Standards
InstitutionalBelow
StandardsTotal
Fall 2015 0 0.00% 0 0.00% 0 0.00% 0.00%0
Spring 2015 12 60.00% 6 30.00% 2 10.00% 100.00%20
Totals 12 60.00% 6 30.00% 2 10.00% 100.00%20
BUS130 SLO2 - Differentiate the characteristics of different investment medium.Institutional
ExceedsStandards
InstitutionalMeets
Standards
InstitutionalBelow
StandardsTotal
Fall 2015 0 0.00% 0 0.00% 0 0.00% 0.00%0
Spring 2015 12 60.00% 6 30.00% 2 10.00% 100.00%20
Totals 12 60.00% 6 30.00% 2 10.00% 100.00%20
BUS130 SLO3 - Assess opportunity costs associated with financial decisions.Institutional
ExceedsStandards
InstitutionalMeets
Standards
InstitutionalBelow
StandardsTotal
Fall 2015 0 0.00% 0 0.00% 0 0.00% 0.00%0
Spring 2015 12 60.00% 6 30.00% 2 10.00% 100.00%20
Totals 12 60.00% 6 30.00% 2 10.00% 100.00%20
InstitutionalExceeds
Standards
InstitutionalMeets
Standards
InstitutionalBelow
StandardsTotal
Fall 2015 0 0.00% 0 0.00% 0 0.00% 0.00%0
Spring 2015 36 60.00% 18 30.00% 6 10.00% 100.00%60
Totals 36 60.00% 18 30.00% 6 10.00% 100.00%60
Totals for Cslos
11Page 2 ofMarch 02, 2016 4:49 PM
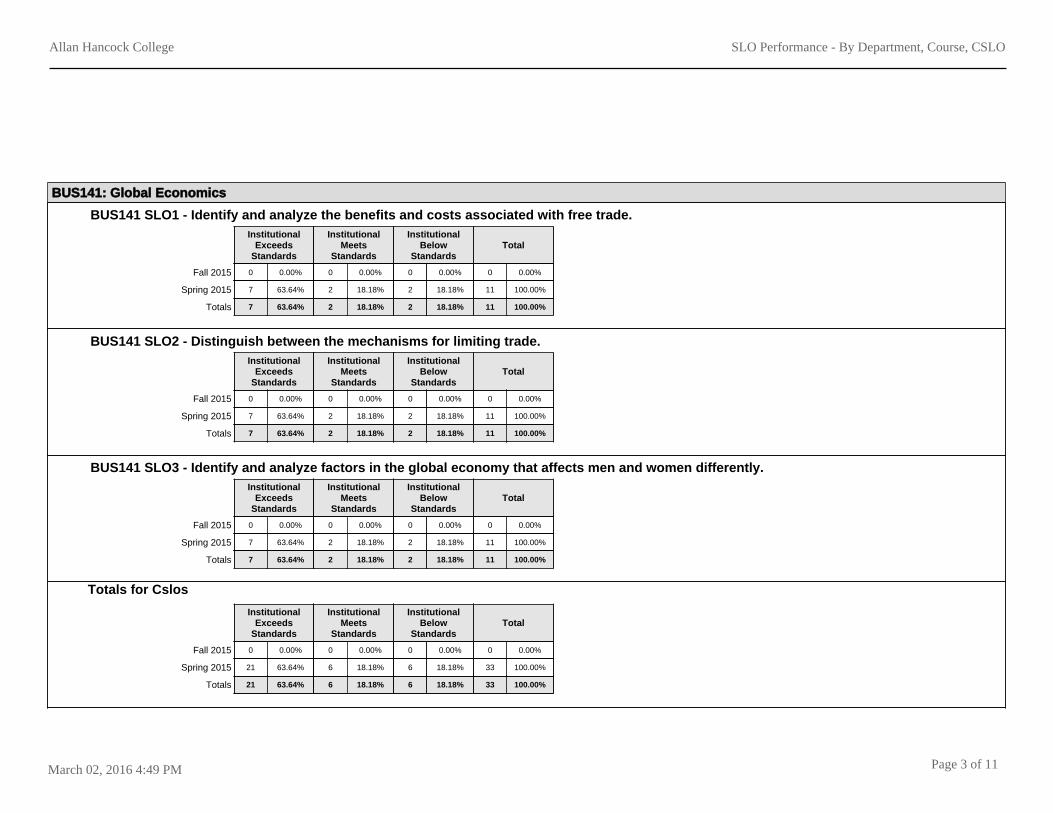
Allan Hancock College SLO Performance - By Department, Course, CSLO
BUS141: Global Economics
BUS141 SLO1 - Identify and analyze the benefits and costs associated with free trade.Institutional
ExceedsStandards
InstitutionalMeets
Standards
InstitutionalBelow
StandardsTotal
Fall 2015 0 0.00% 0 0.00% 0 0.00% 0.00%0
Spring 2015 7 63.64% 2 18.18% 2 18.18% 100.00%11
Totals 7 63.64% 2 18.18% 2 18.18% 100.00%11
BUS141 SLO2 - Distinguish between the mechanisms for limiting trade.Institutional
ExceedsStandards
InstitutionalMeets
Standards
InstitutionalBelow
StandardsTotal
Fall 2015 0 0.00% 0 0.00% 0 0.00% 0.00%0
Spring 2015 7 63.64% 2 18.18% 2 18.18% 100.00%11
Totals 7 63.64% 2 18.18% 2 18.18% 100.00%11
BUS141 SLO3 - Identify and analyze factors in the global economy that affects men and women differently.Institutional
ExceedsStandards
InstitutionalMeets
Standards
InstitutionalBelow
StandardsTotal
Fall 2015 0 0.00% 0 0.00% 0 0.00% 0.00%0
Spring 2015 7 63.64% 2 18.18% 2 18.18% 100.00%11
Totals 7 63.64% 2 18.18% 2 18.18% 100.00%11
InstitutionalExceeds
Standards
InstitutionalMeets
Standards
InstitutionalBelow
StandardsTotal
Fall 2015 0 0.00% 0 0.00% 0 0.00% 0.00%0
Spring 2015 21 63.64% 6 18.18% 6 18.18% 100.00%33
Totals 21 63.64% 6 18.18% 6 18.18% 100.00%33
Totals for Cslos
11Page 3 ofMarch 02, 2016 4:49 PM
Allan Hancock College SLO Performance - By Department, Course, CSLO
ECON101: Principles of Macro-Economics
ECON101 SLO1 - Demonstrate their ability to apply demand and supply theory to a range of economic problems.Institutional
ExceedsStandards
InstitutionalMeets
Standards
InstitutionalBelow
StandardsTotal
Fall 2015 18 60.00% 8 26.67% 4 13.33% 100.00%30
Spring 2015 0 0.00% 0 0.00% 0 0.00% 0.00%0
Totals 18 60.00% 8 26.67% 4 13.33% 100.00%30
ECON101 SLO2 - Demonstrate their ability to formulate and apply the appropriate monetary and fiscal policies to different phases of thebusiness cycle.
InstitutionalExceeds
Standards
InstitutionalMeets
Standards
InstitutionalBelow
StandardsTotal
Fall 2015 18 60.00% 8 26.67% 4 13.33% 100.00%30
Spring 2015 0 0.00% 0 0.00% 0 0.00% 0.00%0
Totals 18 60.00% 8 26.67% 4 13.33% 100.00%30
ECON101 SLO3 - Demonstrate their ability to analyze the gains associated with free trade.Institutional
ExceedsStandards
InstitutionalMeets
Standards
InstitutionalBelow
StandardsTotal
Fall 2015 18 60.00% 8 26.67% 4 13.33% 100.00%30
Spring 2015 0 0.00% 0 0.00% 0 0.00% 0.00%0
Totals 18 60.00% 8 26.67% 4 13.33% 100.00%30
InstitutionalExceeds
Standards
InstitutionalMeets
Standards
InstitutionalBelow
StandardsTotal
Fall 2015 54 60.00% 24 26.67% 12 13.33% 100.00%90
Spring 2015 0 0.00% 0 0.00% 0 0.00% 0.00%0
Totals 54 60.00% 24 26.67% 12 13.33% 100.00%90
Totals for Cslos
11Page 4 ofMarch 02, 2016 4:49 PM
Allan Hancock College SLO Performance - By Department, Course, CSLO
ECON102: Principles of Micro-Economics
ECON102 SLO1 - Demonstrate their ability to apply demand and supply theory to a range of economic problems.Institutional
ExceedsStandards
InstitutionalMeets
Standards
InstitutionalBelow
StandardsTotal
Fall 2015 16 84.21% 2 10.53% 1 5.26% 100.00%19
Spring 2015 0 0.00% 1 100.00% 0 0.00% 100.00%1
Totals 16 80.00% 3 15.00% 1 5.00% 100.00%20
ECON102 SLO2 - Demonstrate their ability to differentiate the characteristics of different market structures and demonstrate how they impactmarket efficiencies.
InstitutionalExceeds
Standards
InstitutionalMeets
Standards
InstitutionalBelow
StandardsTotal
Fall 2015 16 84.21% 2 10.53% 1 5.26% 100.00%19
Spring 2015 0 0.00% 1 100.00% 0 0.00% 100.00%1
Totals 16 80.00% 3 15.00% 1 5.00% 100.00%20
ECON102 SLO3 - Demonstrate their ability to analyze the gains associated with free trade.Institutional
ExceedsStandards
InstitutionalMeets
Standards
InstitutionalBelow
StandardsTotal
Fall 2015 16 84.21% 2 10.53% 1 5.26% 100.00%19
Spring 2015 0 0.00% 0 0.00% 0 0.00% 0.00%0
Totals 16 84.21% 2 10.53% 1 5.26% 100.00%19
InstitutionalExceeds
Standards
InstitutionalMeets
Standards
InstitutionalBelow
StandardsTotal
Fall 2015 48 84.21% 6 10.53% 3 5.26% 100.00%57
Spring 2015 0 0.00% 2 100.00% 0 0.00% 100.00%2
Totals 48 81.36% 8 13.56% 3 5.08% 100.00%59
Totals for Cslos
11Page 5 ofMarch 02, 2016 4:49 PM
Allan Hancock College SLO Performance - By Department, Course, CSLO
ECON121: Business Economics
ECON121 SLO1 - Demonstrate their ability to apply demand and supply theory/analysis to a range of economic problems.Institutional
ExceedsStandards
InstitutionalMeets
Standards
InstitutionalBelow
StandardsTotal
Fall 2015 0 0.00% 0 0.00% 0 0.00% 0.00%0
Spring 2015 14 73.68% 5 26.32% 0 0.00% 100.00%19
Totals 14 73.68% 5 26.32% 0 0.00% 100.00%19
ECON121 SLO2 - Demonstrate their ability to differentiate the characteristics of different market structures and demonstrate how they impactmarket efficiencies.
InstitutionalExceeds
Standards
InstitutionalMeets
Standards
InstitutionalBelow
StandardsTotal
Fall 2015 0 0.00% 0 0.00% 0 0.00% 0.00%0
Spring 2015 14 73.68% 5 26.32% 0 0.00% 100.00%19
Totals 14 73.68% 5 26.32% 0 0.00% 100.00%19
ECON121 SLO3 - Demonstrate their ability to formulate and apply the appropriate monetary and fiscal policies to different phases of thebusiness cycle.
InstitutionalExceeds
Standards
InstitutionalMeets
Standards
InstitutionalBelow
StandardsTotal
Fall 2015 0 0.00% 0 0.00% 0 0.00% 0.00%0
Spring 2015 14 73.68% 5 26.32% 0 0.00% 100.00%19
Totals 14 73.68% 5 26.32% 0 0.00% 100.00%19
InstitutionalExceeds
Standards
InstitutionalMeets
Standards
InstitutionalBelow
StandardsTotal
Fall 2015 0 0.00% 0 0.00% 0 0.00% 0.00%0
Spring 2015 42 73.68% 15 26.32% 0 0.00% 100.00%57
Totals 42 73.68% 15 26.32% 0 0.00% 100.00%57
Totals for Cslos
11Page 6 ofMarch 02, 2016 4:49 PM
Allan Hancock College SLO Performance - By Department, Course, CSLO
ECON130: Consumer and Family Finance
ECON130 SLO1 - Identify and differentiate the main components of wise money management.Institutional
ExceedsStandards
InstitutionalMeets
Standards
InstitutionalBelow
StandardsTotal
Fall 2015 0 0.00% 0 0.00% 0 0.00% 0.00%0
Spring 2015 4 100.00% 0 0.00% 0 0.00% 100.00%4
Totals 4 100.00% 0 0.00% 0 0.00% 100.00%4
ECON130 SLO2 - Demonstrate their ability to differentiate the characteristics of different investment medium.Institutional
ExceedsStandards
InstitutionalMeets
Standards
InstitutionalBelow
StandardsTotal
Fall 2015 0 0.00% 0 0.00% 0 0.00% 0.00%0
Spring 2015 4 100.00% 0 0.00% 0 0.00% 100.00%4
Totals 4 100.00% 0 0.00% 0 0.00% 100.00%4
ECON130 SLO3 - Demonstrate their ability to assess opportunity costs associated with financial decisions.Institutional
ExceedsStandards
InstitutionalMeets
Standards
InstitutionalBelow
StandardsTotal
Fall 2015 0 0.00% 0 0.00% 0 0.00% 0.00%0
Spring 2015 4 100.00% 0 0.00% 0 0.00% 100.00%4
Totals 4 100.00% 0 0.00% 0 0.00% 100.00%4
InstitutionalExceeds
Standards
InstitutionalMeets
Standards
InstitutionalBelow
StandardsTotal
Fall 2015 0 0.00% 0 0.00% 0 0.00% 0.00%0
Spring 2015 12 100.00% 0 0.00% 0 0.00% 100.00%12
Totals 12 100.00% 0 0.00% 0 0.00% 100.00%12
Totals for Cslos
11Page 7 ofMarch 02, 2016 4:49 PM
Allan Hancock College SLO Performance - By Department, Course, CSLO
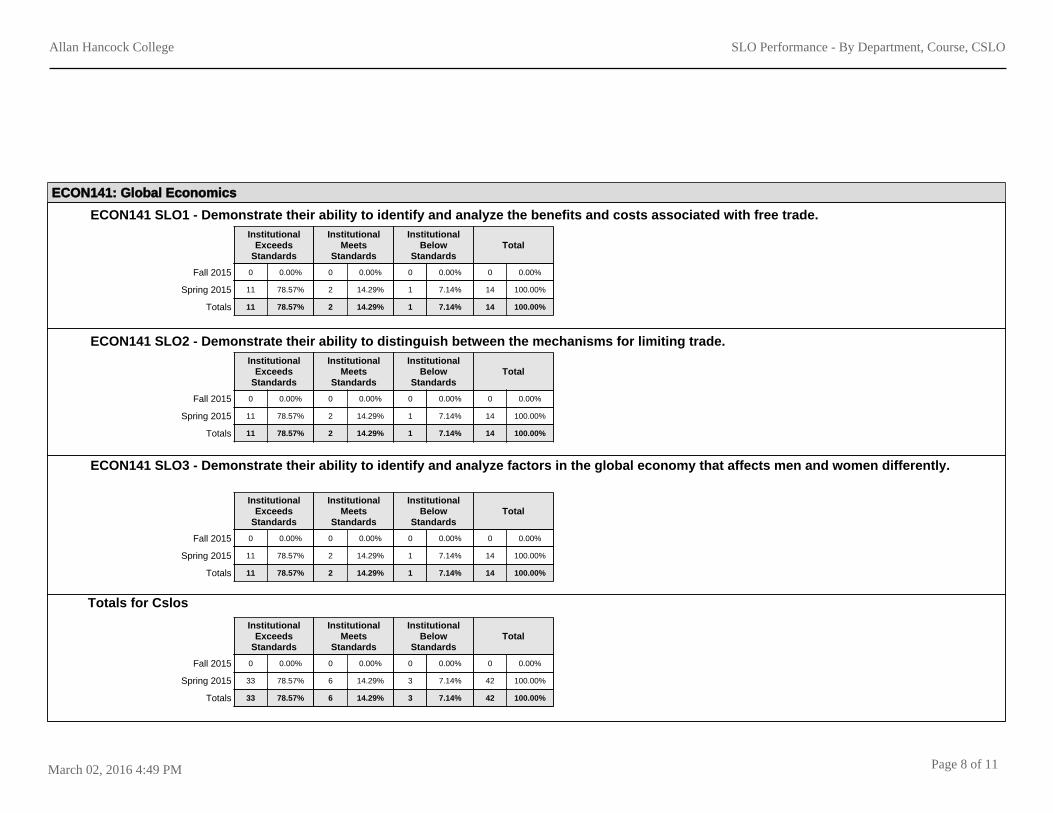
ECON141: Global Economics
ECON141 SLO1 - Demonstrate their ability to identify and analyze the benefits and costs associated with free trade.Institutional
ExceedsStandards
InstitutionalMeets
Standards
InstitutionalBelow
StandardsTotal
Fall 2015 0 0.00% 0 0.00% 0 0.00% 0.00%0
Spring 2015 11 78.57% 2 14.29% 1 7.14% 100.00%14
Totals 11 78.57% 2 14.29% 1 7.14% 100.00%14
ECON141 SLO2 - Demonstrate their ability to distinguish between the mechanisms for limiting trade.Institutional
ExceedsStandards
InstitutionalMeets
Standards
InstitutionalBelow
StandardsTotal
Fall 2015 0 0.00% 0 0.00% 0 0.00% 0.00%0
Spring 2015 11 78.57% 2 14.29% 1 7.14% 100.00%14
Totals 11 78.57% 2 14.29% 1 7.14% 100.00%14
ECON141 SLO3 - Demonstrate their ability to identify and analyze factors in the global economy that affects men and women differently.
InstitutionalExceeds
Standards
InstitutionalMeets
Standards
InstitutionalBelow
StandardsTotal
Fall 2015 0 0.00% 0 0.00% 0 0.00% 0.00%0
Spring 2015 11 78.57% 2 14.29% 1 7.14% 100.00%14
Totals 11 78.57% 2 14.29% 1 7.14% 100.00%14
InstitutionalExceeds
Standards
InstitutionalMeets
Standards
InstitutionalBelow
StandardsTotal
Fall 2015 0 0.00% 0 0.00% 0 0.00% 0.00%0
Spring 2015 33 78.57% 6 14.29% 3 7.14% 100.00%42
Totals 33 78.57% 6 14.29% 3 7.14% 100.00%42
Totals for Cslos
11Page 8 ofMarch 02, 2016 4:49 PM

Allan Hancock College SLO Performance - By Department, Course, CSLO
FCS130: Consumer and Family Finance
FCS130 SLO1 - Identify and differentiate the main components of wise money management.Institutional
ExceedsStandards
InstitutionalMeets
Standards
InstitutionalBelow
StandardsTotal
Fall 2015 0 0.00% 0 0.00% 0 0.00% 0.00%0
Spring 2015 0 0.00% 2 100.00% 0 0.00% 100.00%2
Totals 0 0.00% 2 100.00% 0 0.00% 100.00%2
FCS130 SLO2 - Differentiate the characteristics of different investment medium.Institutional
ExceedsStandards
InstitutionalMeets
Standards
InstitutionalBelow
StandardsTotal
Fall 2015 0 0.00% 0 0.00% 0 0.00% 0.00%0
Spring 2015 0 0.00% 2 100.00% 0 0.00% 100.00%2
Totals 0 0.00% 2 100.00% 0 0.00% 100.00%2
FCS130 SLO3 - Assess opportunity costs associated with financial decisions.Institutional
ExceedsStandards
InstitutionalMeets
Standards
InstitutionalBelow
StandardsTotal
Fall 2015 0 0.00% 0 0.00% 0 0.00% 0.00%0
Spring 2015 0 0.00% 2 100.00% 0 0.00% 100.00%2
Totals 0 0.00% 2 100.00% 0 0.00% 100.00%2
InstitutionalExceeds
Standards
InstitutionalMeets
Standards
InstitutionalBelow
StandardsTotal
Fall 2015 0 0.00% 0 0.00% 0 0.00% 0.00%0
Spring 2015 0 0.00% 6 100.00% 0 0.00% 100.00%6
Totals 0 0.00% 6 100.00% 0 0.00% 100.00%6
Totals for Cslos
11Page 9 ofMarch 02, 2016 4:49 PM
Allan Hancock College SLO Performance - By Department, Course, CSLO
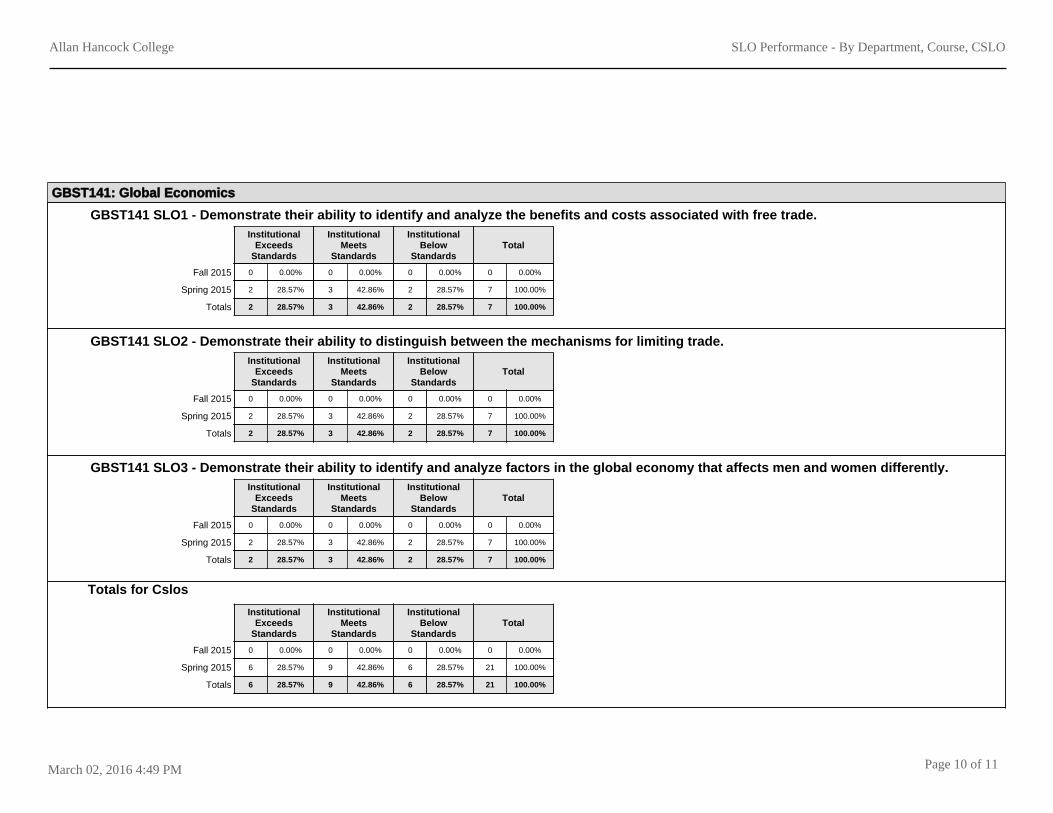
GBST141: Global Economics
GBST141 SLO1 - Demonstrate their ability to identify and analyze the benefits and costs associated with free trade.Institutional
ExceedsStandards
InstitutionalMeets
Standards
InstitutionalBelow
StandardsTotal
Fall 2015 0 0.00% 0 0.00% 0 0.00% 0.00%0
Spring 2015 2 28.57% 3 42.86% 2 28.57% 100.00%7
Totals 2 28.57% 3 42.86% 2 28.57% 100.00%7
GBST141 SLO2 - Demonstrate their ability to distinguish between the mechanisms for limiting trade.Institutional
ExceedsStandards
InstitutionalMeets
Standards
InstitutionalBelow
StandardsTotal
Fall 2015 0 0.00% 0 0.00% 0 0.00% 0.00%0
Spring 2015 2 28.57% 3 42.86% 2 28.57% 100.00%7
Totals 2 28.57% 3 42.86% 2 28.57% 100.00%7
GBST141 SLO3 - Demonstrate their ability to identify and analyze factors in the global economy that affects men and women differently.Institutional
ExceedsStandards
InstitutionalMeets
Standards
InstitutionalBelow
StandardsTotal
Fall 2015 0 0.00% 0 0.00% 0 0.00% 0.00%0
Spring 2015 2 28.57% 3 42.86% 2 28.57% 100.00%7
Totals 2 28.57% 3 42.86% 2 28.57% 100.00%7
InstitutionalExceeds
Standards
InstitutionalMeets
Standards
InstitutionalBelow
StandardsTotal
Fall 2015 0 0.00% 0 0.00% 0 0.00% 0.00%0
Spring 2015 6 28.57% 9 42.86% 6 28.57% 100.00%21
Totals 6 28.57% 9 42.86% 6 28.57% 100.00%21
Totals for Cslos
11Page 10 ofMarch 02, 2016 4:49 PM
Allan Hancock College SLO Performance - By Department, Course, CSLO
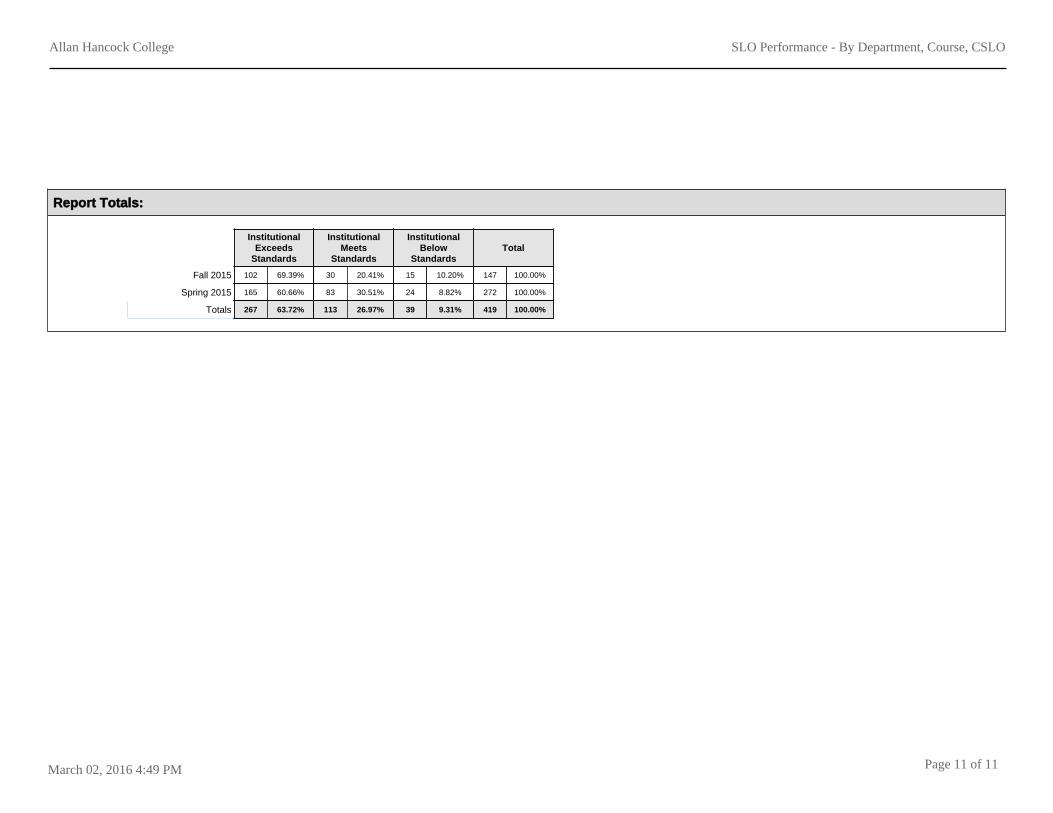
Report Totals:
InstitutionalExceeds
Standards
InstitutionalMeets
Standards
InstitutionalBelow
StandardsTotal
Fall 2015 102 69.39% 30 20.41% 15 10.20% 147 100.00%
Spring 2015 165 60.66% 83 30.51% 24 8.82% 272 100.00%
Totals 267 63.72% 113 26.97% 39 9.31% 419 100.00%
11Page 11 ofMarch 02, 2016 4:49 PM
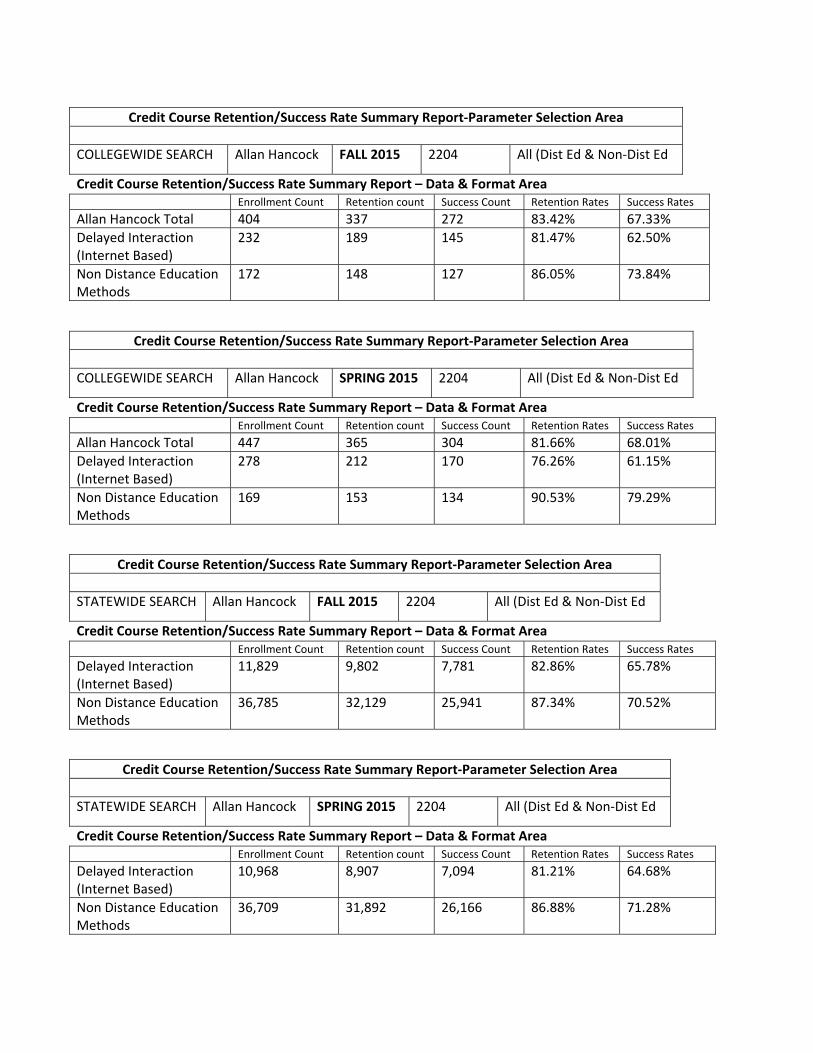
Credit Course Retention/Success Rate Summary Report‐Parameter Selection Area
COLLEGEWIDE SEARCH Allan Hancock FALL 2015 2204 All (Dist Ed & Non‐Dist Ed
Credit Course Retention/Success Rate Summary Report – Data & Format Area Enrollment Count Retention count Success Count Retention Rates Success Rates
Allan Hancock Total 404 337 272 83.42% 67.33%
Delayed Interaction (Internet Based)
232 189 145 81.47% 62.50%
Non Distance Education Methods
172 148 127 86.05% 73.84%
Credit Course Retention/Success Rate Summary Report‐Parameter Selection Area
COLLEGEWIDE SEARCH Allan Hancock SPRING 2015 2204 All (Dist Ed & Non‐Dist Ed
Credit Course Retention/Success Rate Summary Report – Data & Format Area Enrollment Count Retention count Success Count Retention Rates Success Rates
Allan Hancock Total 447 365 304 81.66% 68.01%
Delayed Interaction (Internet Based)
278 212 170 76.26% 61.15%
Non Distance Education Methods
169 153 134 90.53% 79.29%
Credit Course Retention/Success Rate Summary Report‐Parameter Selection Area
STATEWIDE SEARCH Allan Hancock FALL 2015 2204 All (Dist Ed & Non‐Dist Ed
Credit Course Retention/Success Rate Summary Report – Data & Format Area Enrollment Count Retention count Success Count Retention Rates Success Rates
Delayed Interaction (Internet Based)
11,829 9,802 7,781 82.86% 65.78%
Non Distance Education Methods
36,785 32,129 25,941 87.34% 70.52%
Credit Course Retention/Success Rate Summary Report‐Parameter Selection Area
STATEWIDE SEARCH Allan Hancock SPRING 2015 2204 All (Dist Ed & Non‐Dist Ed
Credit Course Retention/Success Rate Summary Report – Data & Format Area Enrollment Count Retention count Success Count Retention Rates Success Rates
Delayed Interaction (Internet Based)
10,968 8,907 7,094 81.21% 64.68%
Non Distance Education Methods
36,709 31,892 26,166 86.88% 71.28%


![Gloria Arevalo, Ventura College Dave DeGroot, Allan Hancock College [Duane Short, San Diego Miramar College] Articulation Fundamentals](https://img.pdfslide.us/doc/110x75/56649d345503460f94a0b7d9/gloria-arevalo-ventura-college-dave-degroot-allan-hancock-college-duane.jpg)