Embed Size (px)
Citation preview
Drivers and patterns of students’ and graduates’ mobility in Poland. Evidence from social media network.Mikołaj Herbst, Jakub Rok1
AbstractIn this paper we use a unique, large dataset collected from a social networking website to develop a typology of the educational and post-educational mobility in Poland, to identify regions that are winning or losing in terms of human capital accumulation, and to elaborate on factors of human capital migration using empirical model of interregional flows of students and graduates. We find out that the mobility of Poland’s human capital is rather low, with graduates being more prone to migrate than students while enrolling to universities.
The average Polish region manages to absorb one third of incoming students (born and raised in other regions) on the local labour market, and it pulls back about 50% of students who originated from the region, but studied elsewhere. However, only five of sixteen Polish regions experience net gain of human capital in consequence of skilled migration. All of them include big metropolitan cities – Warsaw, Poznań, Gdańsk, Wrocław, and Kraków. The remaining eleven regions are subjects of a brain drain
Physical distance between potential donor and destination regions is the most significant determinant of human capital flow. Although distance plays crucial role in both student and graduate decisions, it is more significant at student level. Students prefer to migrate to large metropolitan cities, regardless of their economic performance. In turn, graduates are more willing to leave the areas with low GDP per capita. They migrate to affluent regions, with large central cities, although, as a qualified labour force, they don’t care much for unemployment rate. The share of population with higher education is also a significant pull factor.
1. Introduction The two decades of transformation following the fall of communism in 1989 were the time of profound socio-economic changes in Poland. Democratization and opening of the economy was accompanied by a spectacular development of Polish higher education sector. The transformation of the 1990s triggered a change from elite to mass tertiary education system. Net enrolment rate grew from 9.8% in an academic year 1990/1991 to 40.8% 20 years later. Share of people aged 25-64 that attained tertiary education grew between 1997 and 2010 by 7.2% annually in Poland, doubling the average OECD rate of growth for this period.
The policy rationale of the first years of transformation can be summarized as a constant increase of access to higher education for all social groups through privatization and marketization (cf. Kwiek 2011). Under communist regime all higher education institutions in Poland were publicly owned and free of charge. The 1990 law on higher education allowed the private capital to establish tertiary schools, and public schools were permitted to offer paid part-time programs. The new legal framework led to rapid growth of enrolment and a growing differentiation of higher education institutions (Simonova and Antonowicz 2006). In academic year 2012/2013, in addition to 132 operating public tertiary school there are 321 non-public institutions (Główny Urząd Statystyczny 2013). The former group, attended by 27.4% of students, consists mainly of bachelor and part-time
1 University of Warsaw, Centre for European Regional and Local Studies (EUROREG). Contact the authors at: [email protected]
programs. Second axis of differentiation is a mode of study, with part-time programs chosen by 53% of students – by far exceeding the OECD average of 22 % (OECD 2013). Despite the constitutional right to study free of charge, the number of students paying tuition fees (i.e. part-time students from public HEIs and all the students from non-public HEIs) accounts for 47,1% of the total student population in Poland (Główny Urząd Statystyczny 2013). A study by Herbst and Rok (2014) show that the probability of attending a tuition-based program is much higher for students with low income and low parental human capital, as compared with students with a more privileged background.
Transformation to market economy provided an incentive, or even a pressure, for attaining higher education, in order to keep pace in the increasingly competitive conditions (cf. Sojkin, Bartkowiak and Skuza 2012). Uneven distribution of tertiary institutions, especially those of higher quality, has driven a significant migration flows to universities. On the other hand, expansion of tertiary institutions notably improved the accessibility of higher education outside of the traditional academic centres. In 2012 there was at least one higher education institution operating in 65 out of 66 statistical sub-regions (NTS-3) in Poland. Simultaneously, clustering of labour market chances in biggest cities, observed in Poland over the transformation period, influenced the migration of graduates. Metropolization processes lead to growing concentration of highly-skilled, highly-paid jobs in just several locations in Poland. Pull factors for graduates seeking decent wages were further strengthened after Polish accession to EU in 2004 and opening of labour markets in Great Britain, Ireland and other EU countries.
Graduates are a particularly interesting group, because their spatial movements allow us to follow how the knowledge is transferred between regions and into labour market (Marinelli 2013). Studying their sub-national mobility in Poland provides an insight into a spatial economic and innovative impact of higher education in the transition period. The sparse economic research on the sub-national mobility in Poland lacks the specific focus on the high human capital individuals. The results obtained for general population show that migration is a response to unemployment, wages, and urbanization (Fidrmuc 2003), to unemployment, income, distance, housing provision, education and road infrastructure (Ghatak et al. 2008), and to EU funding, FDI and level of international migration (Thomas 2013). However, all these studies assess migration flows using the data that fails to capture the significant part of spatial movements – especially temporal relocations and youth mobility (it is based on officially declared place of residence). We seek an opportunity to overcome this challenge by applying the user-generated data from a social media network. The spatial connotations of social media seem to be still not enough explored, but this research stream constantly gains in popularity and representativeness (Sagl et al. 2012, Hawelka et al. 2013).
Polish higher education boom, shift towards a market economy, partial abolition of country borders within the EU, and metropolization of economic development together constitute a unique opportunity to study human capital mobility in a transforming society. Whilst applying the innovative dataset derived from a web-based social networking platform enable novel capacities to analyse large-scale human dynamics in a more integrated manner (Sagl et al. 2012). Thus, the goal of this paper is fourfold:
- to measure the educational and post-educational mobility in Poland, and to identify major trends with respect to skilled migration;
- to discuss a typology of student and graduate sequential migration in Poland, based upon the categories proposed by Faggian et al. (2007)
- to identify regions that are winning or losing in terms of human capital accumulation, based on indicators proposed by Hoare and Corver (2010)
- to elaborate on factors of human capital migration using empirical model of interregional flows of students and graduates
The paper is organized as follows. Section 2 reviews the literature on the role of human capital in economic development and the major determinants of skilled migration. In section 3 we discuss the conceptual framework and data we use in the analyses. Section 4 presents the results of our empirical analyses concerning the interregional mobility of students and graduates in Poland. Section 5 concludes.
2. Human capital, economic growth, and major migration mechanismsAccording to economic theory, supported by rich empirical evidence, the ability of an economy to accumulate a high quality human capital is an important factor of economic growth. The effect of human capital on economic growth is realized either through the impact on labour productivity (Lucas 1988) or through the impact on so-called total factor productivity (Nelson and Phelps 1966).
The empirical literature on the human capital effect on economic growth rate typically used a regression models to verify this effect. Some works focused on the relationship between the change in human capital stock and the growth rate. Such a relationship, if confirmed, is considered an argument in favour of the direct impact of labour productivity on growth rate (in accordance with the findings from labour economics and the Lucas model). In turn, studies investigating the relationship between the initial level of human capital (instead of change in human capital stock) and the subsequent growth rate are built on the concept of technology development and diffusion being the main channel through which education may affect growth. The milestones of the empirical literature on the human capital’s influence on economic growth were the works of Mankiw, Romer and Weil (1992), Benhabib and Spiegel (1994), Krueger and Lindahl (1999), Barro (1999), Chen and Dahlman (2004), Barro and Sala-i-Martin (2004), and more recently - Ciccone and Papaioannou (2009), and Arnold et al. (2011). Despite some early research studies shed doubt on human capital’s influence on the economic growth, most of the recent works (both using national and regional data) confirm that the rate of economic growth is positively affected by the stock and quality of human capital.
Since economies better endowed with human capital grow at a higher rate, the mobility of skilled individuals should have a meaningful effect on the economic perspectives of different countries and regions. It is thus important to understand what are the factors determining migration of talents
Broadly speaking, there are two streams of research on spatial features that drive migration2. Traditional approach is based on gravity models that emphasize the role of structural factors, such as size of and a distance between areas of origin and destination. Second approach, i.e. mainstream economic theory, explains population flows in terms of moving from poorer to economically flourishing areas. It often includes both personal characteristics of an individual (human capital
2 A comprehensive review of the literature on human capital migration was recently done by Herbst and Rok (2013).
model) and economic characteristics of the origin and destination regions (job-competition model). The mainstream economic theory has been systematically broadened to include softer factors, like quality of life and various amenities (cf. Florida 2002) or a notion of migration as a collective rather than individual decision (Stark 1991). Ghatak et al. (2008) provides a concise typology, where migration flows might be attributed to: (1) relative economic opportunity, (2) availability of publicly provided facilities, (3) distance between origin and destination, and (4) human capital of an individual.
There is a significant body of research focusing on students’ and graduates’ mobility, which provides a more detailed view on factors pertaining to the skilled migration. We distinguish two broad groups of determinants – first one relates to characteristics of an individual (micro-scale), while the second one to characteristics of origin and destination regions (macro-scale).
Most often, personal variables taken under consideration include gender and age as well as type and quality of qualification obtained. Results regarding gender are mixed, with some evidence suggesting that highly skilled women are more migratory than their male counterparts (Faggian et al. 2007), while other studies find gender insignificant (cf. Groen 2004, Haapanen and Tervo 2011). Mosca and Wright (2010) suggest that after the age of 30, likelihood of migrating sharply declines. According to Haapanen and Tervo (2011) the migration probability increases two years before graduation, peaks in the year of graduation and then rapidly decreases due to the cumulative inertia, i.e. growing attachment to the place of residence. Similarly, stronger family ties – e.g. marriage, children enrolment in school – deter migration (cf. Parsad and Gray 2005, Haapanen and Tervo 2011). Other personal variables proved important for explaining mobility patterns include class of qualification obtained – better graduates are more likely to migrate (cf. Faggian et al. 2006, Mosca and Wright 2010, Ishitani 2011), field of study - findings are mixed, probably due to differences in institutional settings of various national higher education systems (cf. Faggian et al. 2006, Faggian et al. 2007, Venhorst et al. 2010, Haapnanen and Tervo 2011), and earlier migratory experience – highly correlated with subsequent migration (cf. Kodrzycki 2001, Gottlieb and Joseph 2006, Mosca and Wright 2010).
Migration decisions are made by individuals, but this process does not happen in a void. There is always a variety of attraction and repulsion incentives (push and pull factors), which are often derived from features of a given locality. In our study we use a spatial approach, looking for migration patterns that emerge when sufficient people converge on choosing destination regions with particular characteristics.
According to gravity models, physical distance plays a crucial role in explaining migration likelihoods, but many studies on skilled migration focus only on the socio-economical features and neglect the spatial perspective. However, the distance deterrence effect is found both in regard to students’ flows (Sa et al. 2004, Gibbons and Vignoles 2012) and graduates’ migration (Marinelli 2011). In the former case, the well-developed network of higher education institutions seems to diminish the role of distance in explaining the behaviour of prospective students (Alm and Winters 2009, Gibbons and Vignoles 2012).
Mainstream economic theory emphasizes the role of a region economy in determining migration flows. Graduates tend to leave economically lagging, peripheral regions (Ritsila and Ovaskainen 2001, Haapanen and Tervo 2011) and move towards or stay in more prosperous ones (Ishitani 2011),
especially knowledge intensive regions (cf. Gottlieb and Joseph 2006, Delisle and Shearmur 2010, Winters 2011). Present value of expected income and regional differences in return to skills are both well established as drivers of human capital mobility (Kodrzycki 2001, Di Cintio and Grassi 2011). Absorptive labour market is an important pull factor for students and graduates (cf. Krugman 1991, Gottlieb and Joseph 2006), while high unemployment level encourages outmigration (Haapanen and Tervo 2011). However, Faggian et al. (2006) argue that graduates are a self-selected group with lower unemployment risk and thus labour market features might be of relatively less relevance for their migration behaviour, than for the general population.
Economically flourishing regions, which provide both employment opportunities and high wages, have a potential disadvantage, i.e. high living costs. Apparently, students tend to avoid institutions located in higher-cost areas (Baryla and Dotterweich 2001, Faggian et al. 2006), but there is no sufficient evidence to support this claim in regard to graduates.
Different kind of amenities are often included in modelling migration flows, following the notion that highly skilled migrants look for quality of life when choosing a place to settle (cf. Florida 2002). The concept of amenities is rather vague and lacks well-established variables that would prove to have a robust impact on highly skilled migration. However, studies on general population mobility in Poland found that service availability is an important pull factor for migrants, notably housing provision (Ghatak et al. 2008, Thomas 2013) as well as healthcare availability (Thomas 2013) and density of road network (Ghatak et al. 2008, Sarra and Del Signore 2010).
Drawing on the literature review we define four categories of macro-scale factors relevant for investigating the highly skilled mobility in Poland, e.g. physical distance, regional economies, living costs and service availability.
3. Data and conceptual frameworkEmpirical research on student and graduate migration commonly use data from longitudinal labour force surveys or university databases designed to register students and track graduates’ careers. So far, there is no such data available for Poland. Public statistics on interregional migration is based on officially declared place of residence, which means it overlooks major part of actual mobility, and it does not include information on educational attainment of migrants. Existing longitudinal research in Poland does not investigate the issue of spatial mobility deeply enough to provide useful data. Although most tertiary schools run electronic registers of students, these databases are not fully comparable between schools, and most schools do not track graduates in any systematic way. Moreover, none of the data in statistical system provide enough observations to evaluate the performance of particular regions in attracting and accumulating human capital.
In this paper we use a source of data outside the sphere of public statistics. A large, unique dataset is collected from a social networking website nk.pl, allowing individuals to renew contacts with their former classmates in schools at all tiers. In order to find classmates, the potential user needs to virtually register in real schools and classes which he or she attended. Once the user admits to a school, it becomes visible in his or her user profile. Since the user declares also his or her current place of residence, in fact all information about user’s mobility is revealed, which makes data collected from user profiles highly useful for our research. Moreover, there are two major advantages of nk.pl in terms of its use for academic studies. First, despite unofficial character of the data, the reliability of information is high. Users registering to the service need to reveal actual
schools they’ve attended if they want to contact their classmates. Second, what distinguishes the nk.pl website form other web-based services of this kind is its mass popularity. At the beginning of 2009 (when our data has been collected), the website had over 11 million registered users, which accounted for about one-third of web-active Polish citizens.
Using such an innovative dataset calls for a careful review of misrepresentation concerns. First question regards the uneven access to internet in Poland. It is certainly biased towards younger and better educated people, but this is the group that we focus on in our research. Secondly, there are different social networking websites, which might have varying target groups. However, in the beginning of 2009 nk.pl was by far the most popular service of this kind in Poland – in January 2009 it had almost 13 times more users than Facebook (Rzeczpospolita 2010). Hawelka et al. (2013) conclude that despite its limited penetration and a bias towards a younger part of the population, web-based social media is a source of an increasingly robust data on patterns of human mobility.
In this article we focus on migration related to university admission or job seeking after graduation. That is we restrict our attention to tertiary school students and graduates. Within category of graduates we focus on those who terminated their studies after 1989 (although for some analyses we include also broader cohorts, for example those graduating between 1965 and 2008). After imposing appropriate selection queries on the nk.pl database we obtained 1.98 million observations, of which 1.27 million referred to graduates, and 0.71 were students at the time data was collected (January 2009).
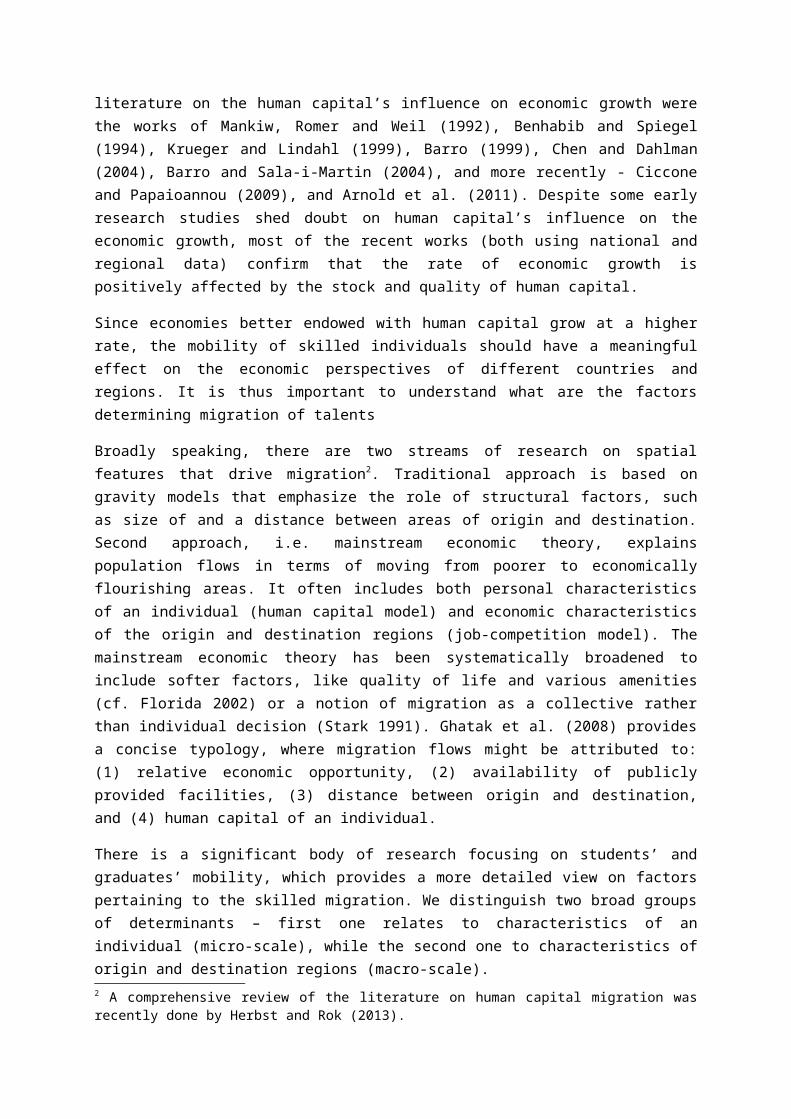
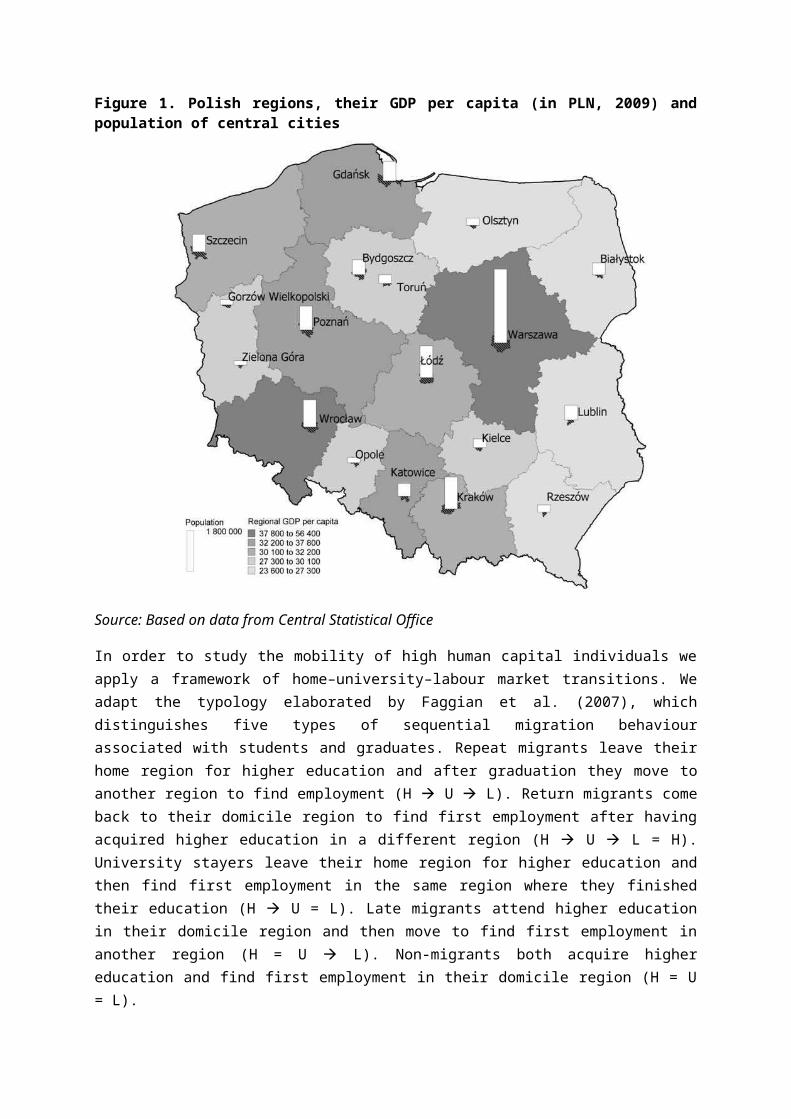
We conduct our analyses on regional level, investigating the flows of students and graduates between 16 Polish provinces (NTS-2). The basic information on the regions, including the population, location of central cities, as well as recent GDP per capita is presented on Figure 1.
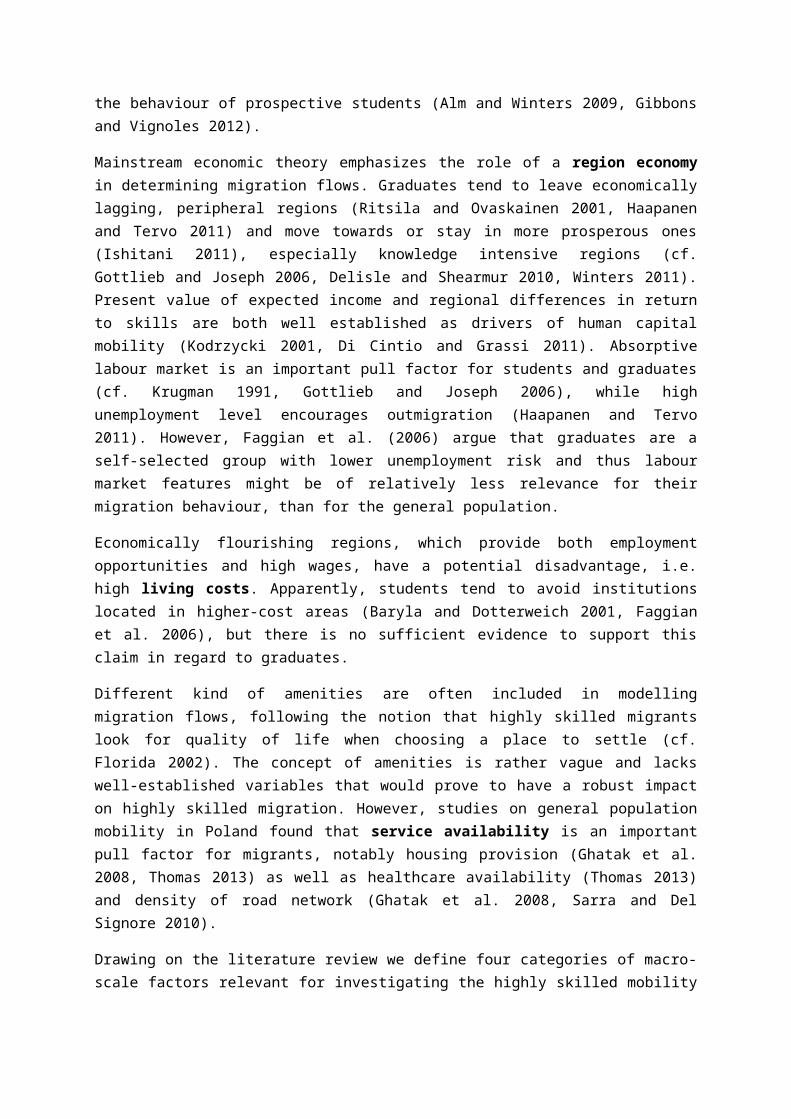
Figure 1. Polish regions, their GDP per capita (in PLN, 2009) and population of central cities
Source: Based on data from Central Statistical Office
In order to study the mobility of high human capital individuals we apply a framework of home–university–labour market transitions. We adapt the typology elaborated by Faggian et al. (2007), which distinguishes five types of sequential migration behaviour associated with students and graduates. Repeat migrants leave their home region for higher education and after graduation they move to another region to find employment (H U L). Return migrants come back to their domicile region to find first employment after having acquired higher education in a different region (H U L = H). University stayers leave their home region for higher education and then find first employment in the same region where they finished their education (H U = L). Late migrants attend higher education in their domicile region and then move to find first employment in another region (H = U L). Non-migrants both acquire higher education and find first employment in their domicile region (H = U = L).
When assessing regional performance in attracting human capital, sequential migration behaviour might be transformed into regional conversion rates. Regional conversion rates confront the actual number of graduates attracted by a given region’s labour market with the potential number of individuals that might have been recruited through one of four pathways. We follow the approach of Hoare and Corver (2010) and calculate the regional conversion rates for 16 Polish regions with respect to four pathways of home-university-labour market transitions: locals, returners, stayers, and outsiders. For example, the locals’ conversion rate would be defined as a ratio of individuals domiciled in region x, who studied in region x and find employment there (those actually attracted),
to individuals domiciled in region x, who studied in region x, and find employment either in region x or y (those, who might potentially be recruited through a local pathway).
4. Mobility of human capital in Poland – results
4.1. Basic trendsThe mobility of skilled individuals in Poland is much higher after graduation than while deciding where to acquire higher education. Among individuals who enrolled to a tertiary school after 1989 67,9% chose universities in their home regions (same to these where they graduated from secondary school). The average distance between the place of completion of secondary and tertiary education (including students remaining in the same city during the whole educational career) was 72 km. In turn, the average distance between the university from which an individual has graduated and his or her current place of residence (observed in 2009) is 219 km.
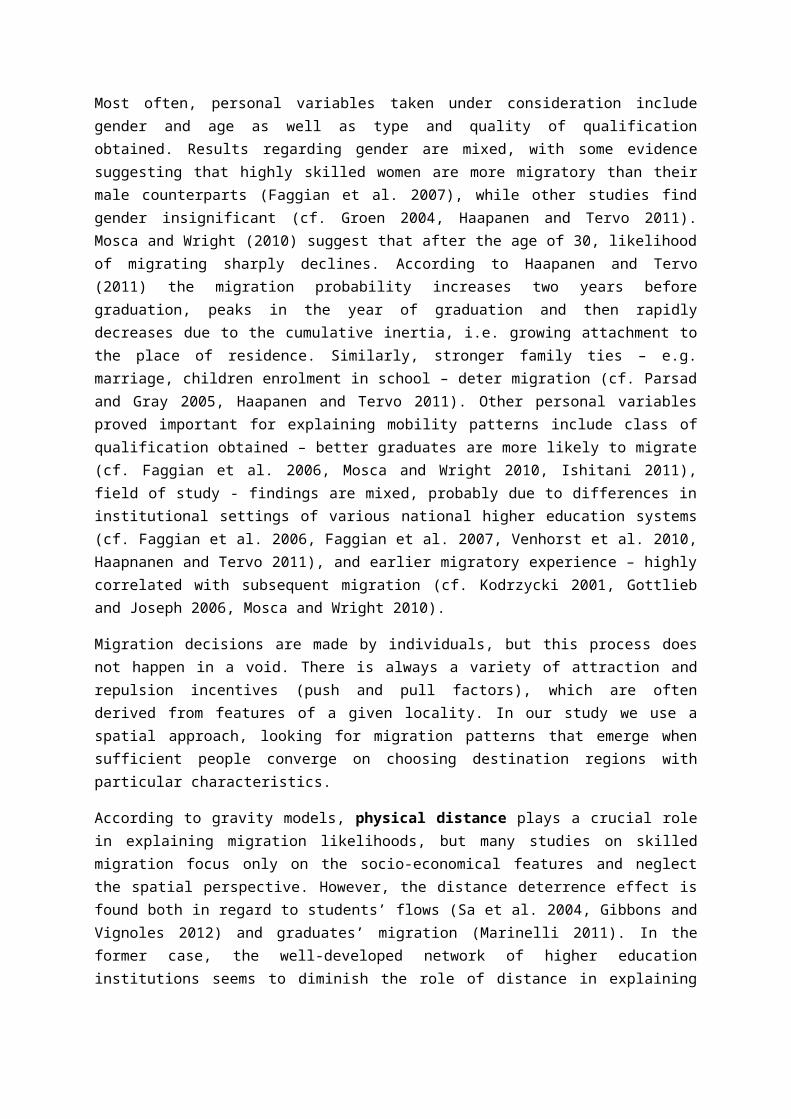
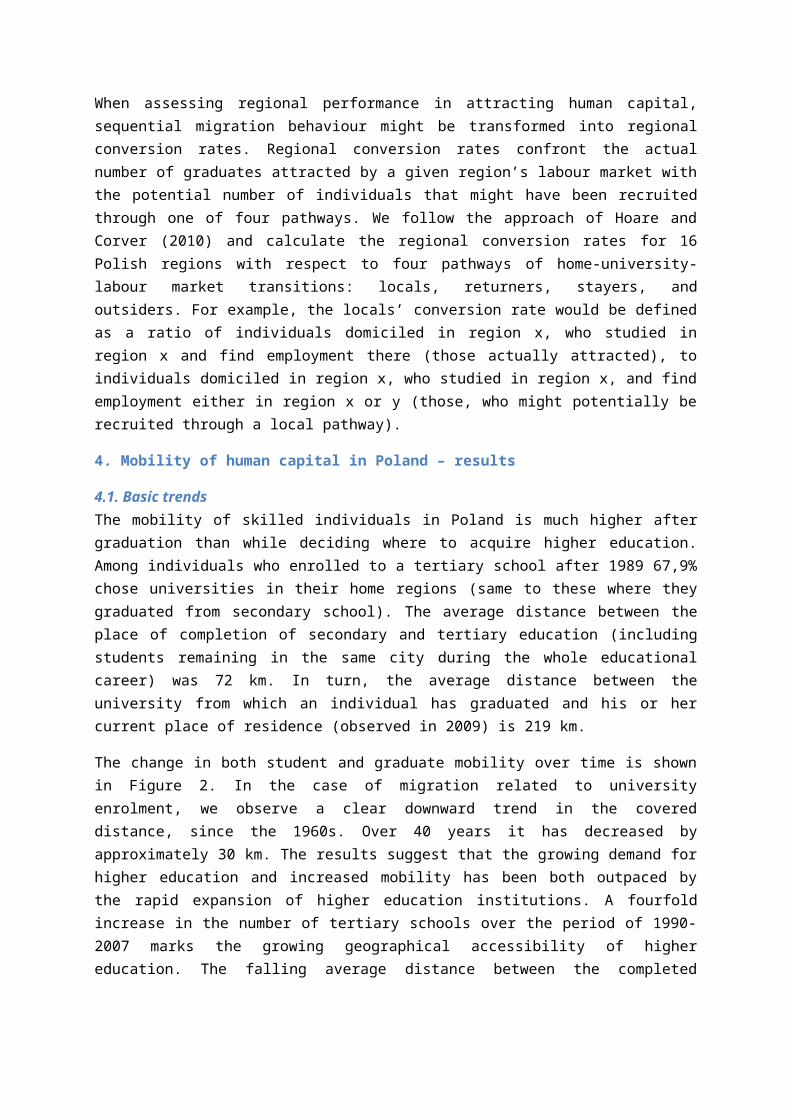
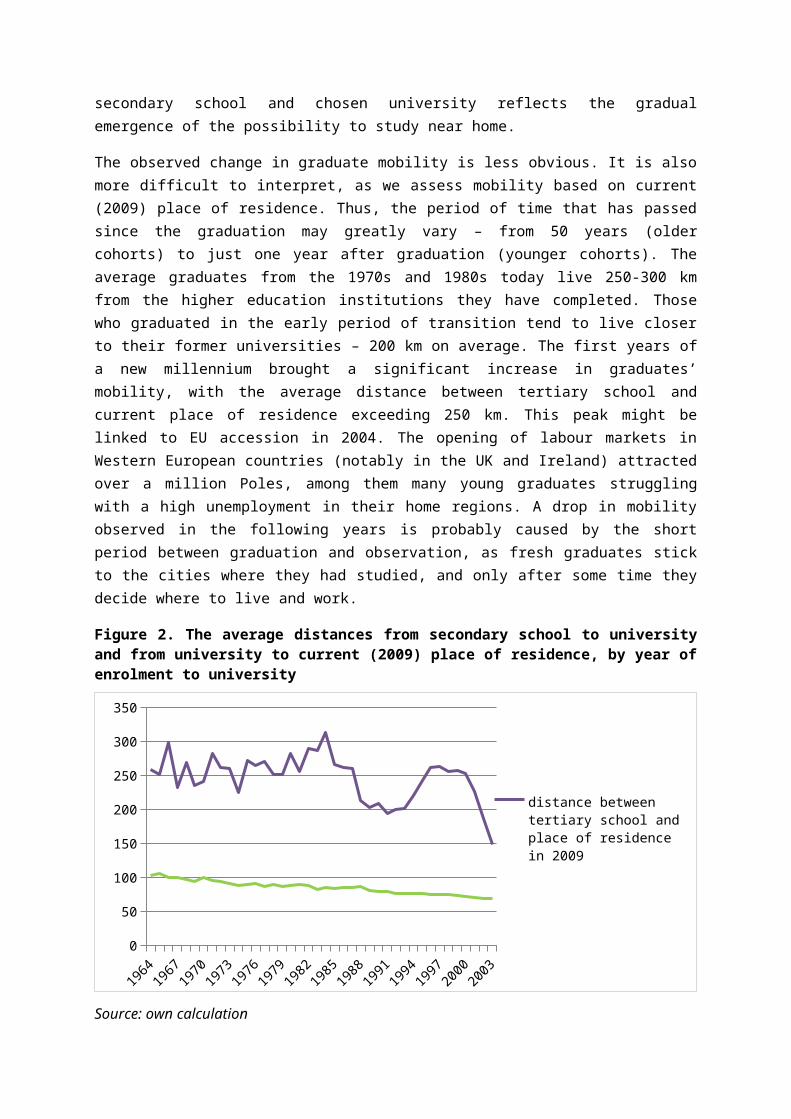
The change in both student and graduate mobility over time is shown in Figure 2. In the case of migration related to university enrolment, we observe a clear downward trend in the covered distance, since the 1960s. Over 40 years it has decreased by approximately 30 km. The results suggest that the growing demand for higher education and increased mobility has been both outpaced by the rapid expansion of higher education institutions. A fourfold increase in the number of tertiary schools over the period of 1990-2007 marks the growing geographical accessibility of higher education. The falling average distance between the completed secondary school and chosen university reflects the gradual emergence of the possibility to study near home.
The observed change in graduate mobility is less obvious. It is also more difficult to interpret, as we assess mobility based on current (2009) place of residence. Thus, the period of time that has passed since the graduation may greatly vary – from 50 years (older cohorts) to just one year after graduation (younger cohorts). The average graduates from the 1970s and 1980s today live 250-300 km from the higher education institutions they have completed. Those who graduated in the early period of transition tend to live closer to their former universities – 200 km on average. The first years of a new millennium brought a significant increase in graduates’ mobility, with the average distance between tertiary school and current place of residence exceeding 250 km. This peak might be linked to EU accession in 2004. The opening of labour markets in Western European countries (notably in the UK and Ireland) attracted over a million Poles, among them many young graduates struggling with a high unemployment in their home regions. A drop in mobility observed in the following years is probably caused by the short period between graduation and observation, as fresh graduates stick to the cities where they had studied, and only after some time they decide where to live and work.
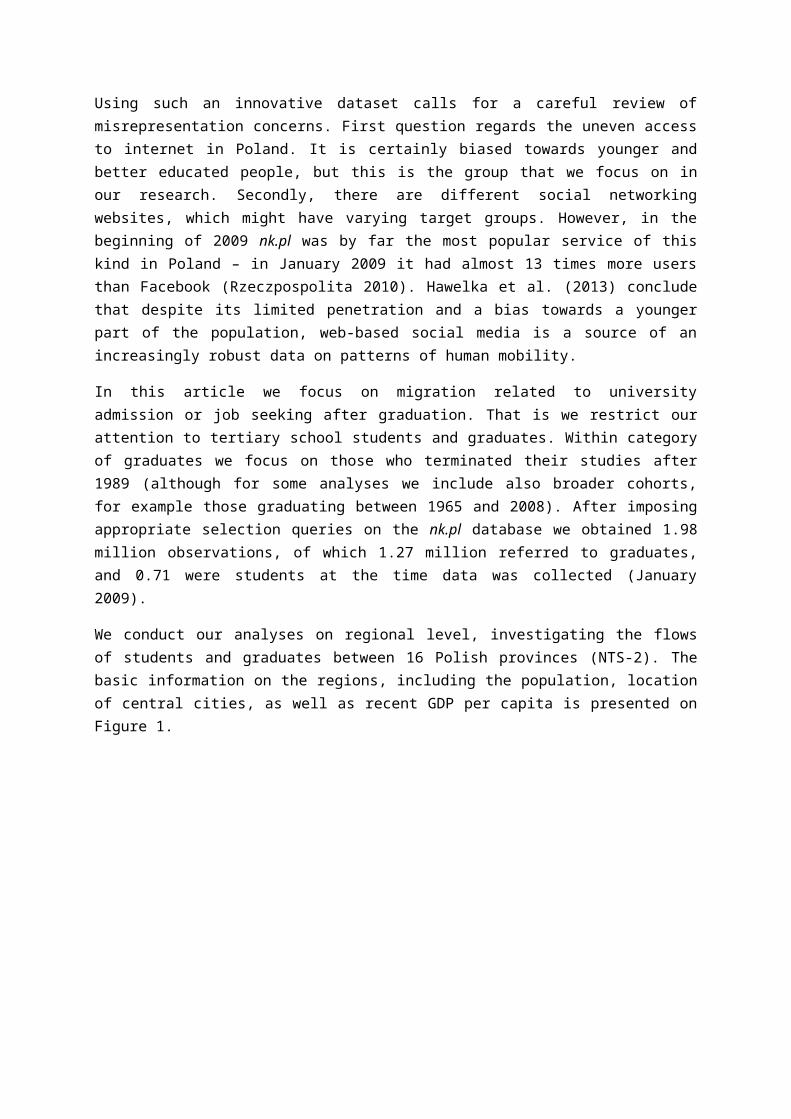
Figure 2. The average distances from secondary school to university and from university to current (2009) place of residence, by year of enrolment to university
19641967
19701973
19761979
19821985
19881991
19941997
20002003
0
50
100
150
200
250
300
350
distance between tertiary school and place of residence in 2009
distance between secondary school and tertiary school
Source: own calculation
The two panels of the Figure 3 show that with respect to spatial structure of tertiary education in Poland we face both de-concentration and centralization processes running at the same time. On one hand, the spatial availability of tertiary schools has been improving over last decades, resulting in an increase of the percentage of students studying in their home regions – from 55% in 1965 to 70% in 2007. Simultaneously, the percentage of individuals studying in the capital region also rises. The upward trend in the latter case is apparent for over 40 years, but the attractiveness of Warsaw has increased sharply over the last decade, with capital’s share in the total higher education market reaching 15%.
Figure 3. Percent of students enrolling to tertiary school in their home region (left panel) and in the Warsaw region (right panel), by year of enrolment
Source: own calculation
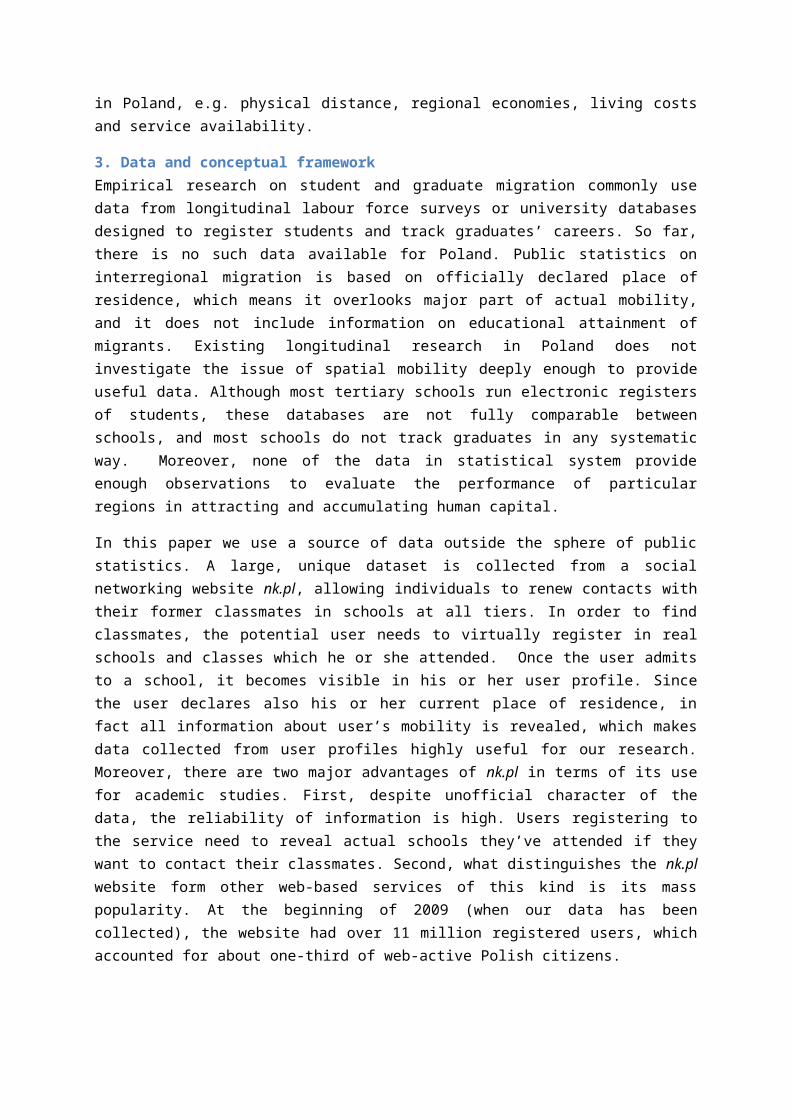
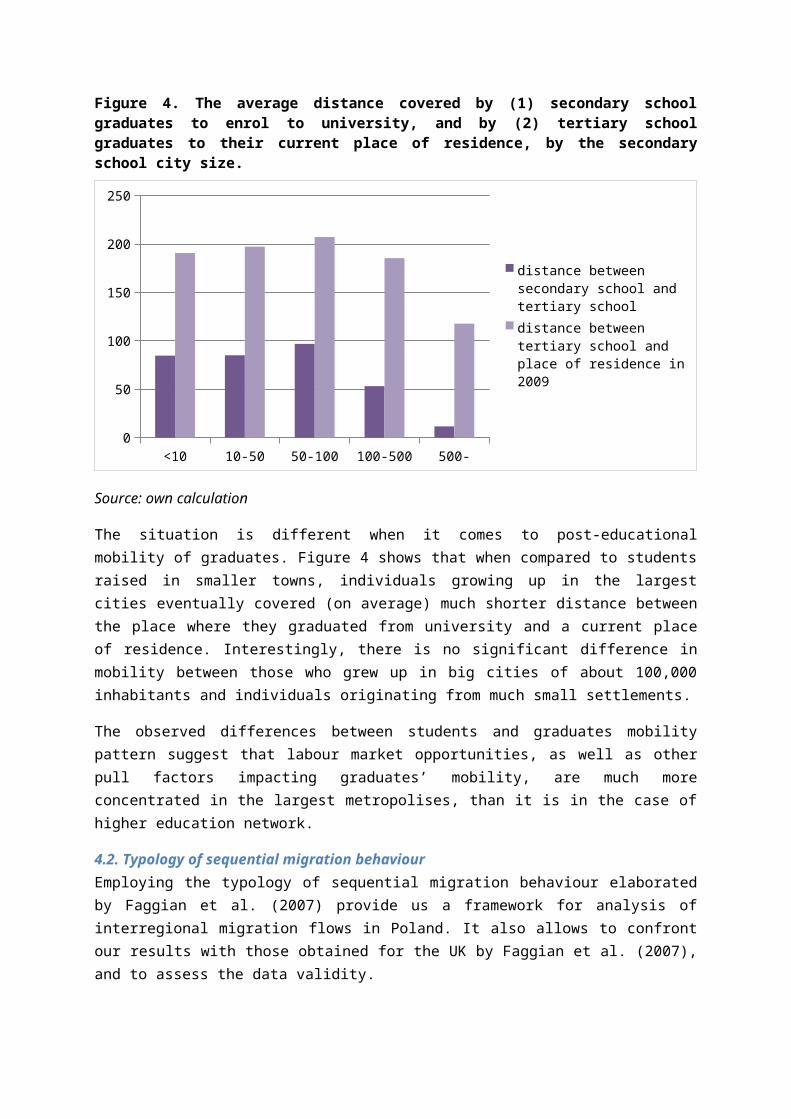
Previous research show that prior to 1989 the accessibility of higher education institutions for the residents of smaller towns in Poland was limited, but improved notably over the 1990s and 2000s, along with the development of tertiary school network (Herbst and Rok 2014). Even though the schools came closer to people residing in peripheral regions, they are still being located prevalently in cities with population exceeding 100,000. This is reflected in mobility patterns of prospective students. As shown in the Figure 4, based on data for students entering tertiary education between 2000 and 2009, the average individual graduating from secondary school covers similar distance to university regardless if he or she originates from a small town (population below 10,000), medium-sized town (10,000-50,000), or a city with population between 50,000 and 100,000. With respect to students raised in big cities (100,000-500,000), the mean distance between secondary schools and
Studying in home region Studying in Warsaw region
universities drops by 40% - to 50 km, and those raised in large metropolises with population exceeding 500,000 most often study in their home cities.
Figure 4. The average distance covered by (1) secondary school graduates to enrol to university, and by (2) tertiary school graduates to their current place of residence, by the secondary school city size.
<10 10-50 50-100 100-500 500-0
50
100
150
200
250
distance between secondary school and tertiary schooldistance between tertiary school and place of residence in 2009
Source: own calculation
The situation is different when it comes to post-educational mobility of graduates. Figure 4 shows that when compared to students raised in smaller towns, individuals growing up in the largest cities eventually covered (on average) much shorter distance between the place where they graduated from university and a current place of residence. Interestingly, there is no significant difference in mobility between those who grew up in big cities of about 100,000 inhabitants and individuals originating from much small settlements.
The observed differences between students and graduates mobility pattern suggest that labour market opportunities, as well as other pull factors impacting graduates’ mobility, are much more concentrated in the largest metropolises, than it is in the case of higher education network.
4.2. Typology of sequential migration behaviourEmploying the typology of sequential migration behaviour elaborated by Faggian et al. (2007) provide us a framework for analysis of interregional migration flows in Poland. It also allows to confront our results with those obtained for the UK by Faggian et al. (2007), and to assess the data validity.
The empirical investigation conducted by Faggian et al. (2007) for the UK 3 shows that the most common path is repeat migration (53,7% of female students and 51,6% of male students), followed 3 The study was conducted on 482,558 UK domiciled students who graduated from UK higher education institutions between 1997 and 2000 and were in full-time permanent employment between six and eighteen months after graduation. The data on unit post codes of the location of the student’s domicile, the higher education institution attended and the first employment were derived from the HESA student leavers’ questionnaire. Finally, the sample consisted of 74,800 observations, where all three post code locations were available (Faggian et al. 2007).
by university stayers (20,2% and 23,8% respectively), and non-migrants (18,0% and 15,5% respectively). It is important to notice that the authors considered migration as a move covering distance of at least 15 km. Thus, individuals moving within this range were classified as non-migrants.
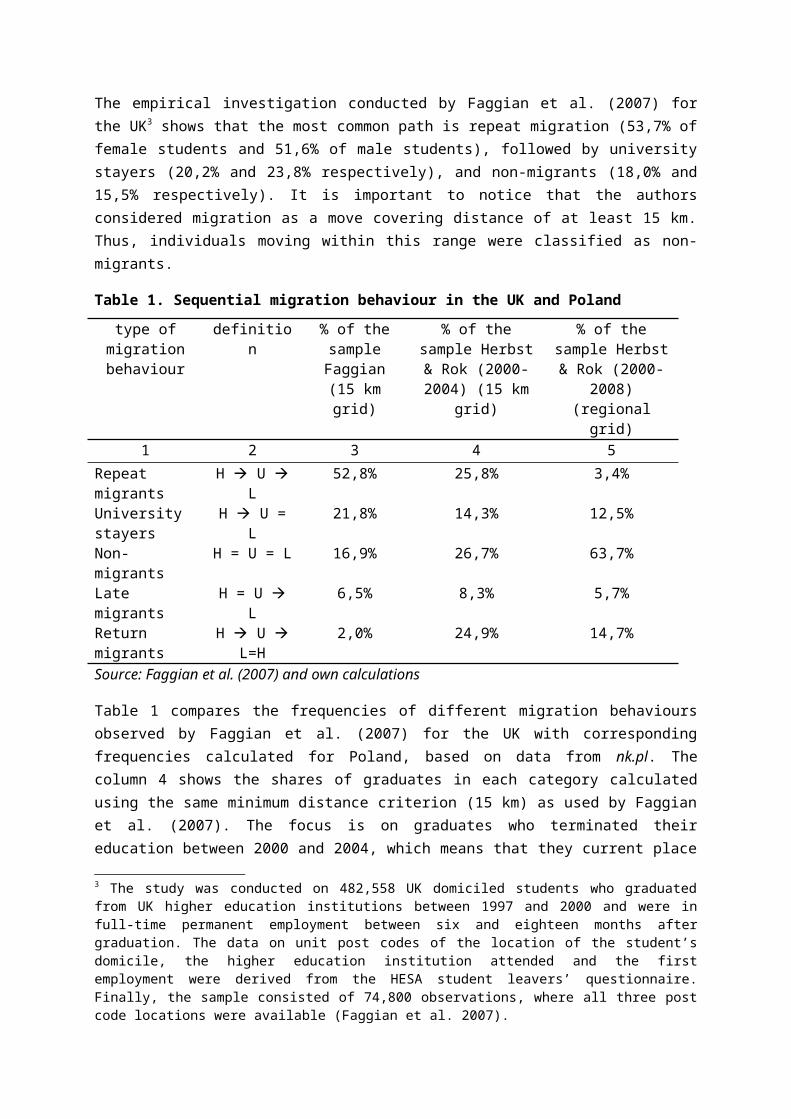
Table 1. Sequential migration behaviour in the UK and Poland
type of migration behaviour
definition % of the sample Faggian
(15 km grid)
% of the sample Herbst & Rok (2000-2004) (15 km grid)
% of the sample Herbst & Rok (2000-2008)
(regional grid)1 2 3 4 5
Repeat migrants H U L 52,8% 25,8% 3,4%University stayers
H U = L 21,8% 14,3% 12,5%
Non-migrants H = U = L 16,9% 26,7% 63,7%Late migrants H = U L 6,5% 8,3% 5,7%Return migrants H U
L=H2,0% 24,9% 14,7%
Source: Faggian et al. (2007) and own calculations
Table 1 compares the frequencies of different migration behaviours observed by Faggian et al. (2007) for the UK with corresponding frequencies calculated for Poland, based on data from nk.pl. The column 4 shows the shares of graduates in each category calculated using the same minimum distance criterion (15 km) as used by Faggian et al. (2007). The focus is on graduates who terminated their education between 2000 and 2004, which means that they current place of residence is recorded between five and nine years after graduation (in comparison to six to eighteen months in case of the UK study).
Several differences can be observed between the distribution of graduates across categories in the UK and Poland. First, the spatial mobility of educated individuals in Poland seems to be much lower, with only one in four graduates falling into the repeat migration category (compared to 53% in the UK). Similarly, the share of non-migrants in the total population of graduates is much higher in Poland (26,7%), than in the UK (16,9%). In both cases, the late migration occurs rarely, with 6,5% of UK graduates falling into this category, and 8,3% in case of Poland. On the other hand, the university stayers seem to be more common in the UK than in Poland. Differences in the last two categories might be attributed to shorter average period of time between graduation and data collection in case of the UK.
The most striking difference, however, is in the prevalence of return migration behaviour – 24,9% of total population of graduates in Poland, and only 2% in the UK. But this observation may be biased by the specific way in which the university location is provided in the nk.pl. The user is asked about the localisation of his/her school and not where he or she lived while studying. This implies that at least some of the graduates classified as return migrants may actually have never left their primary place of residence, in a sense of moving permanently to another city. Instead, these students might have commuted on a daily basis to the university destination4. In other words, the return migration
4 Some of them may have also studied in a non-stationary mode, although the attempt was made to exclude non-stationary students from the sample. The information on the mode of studies is not always provided by nk.pl users, so a certain number of non-stationary students may be still present in the sample.
category may include the cases of circular migration to university without changing the place of residence5.
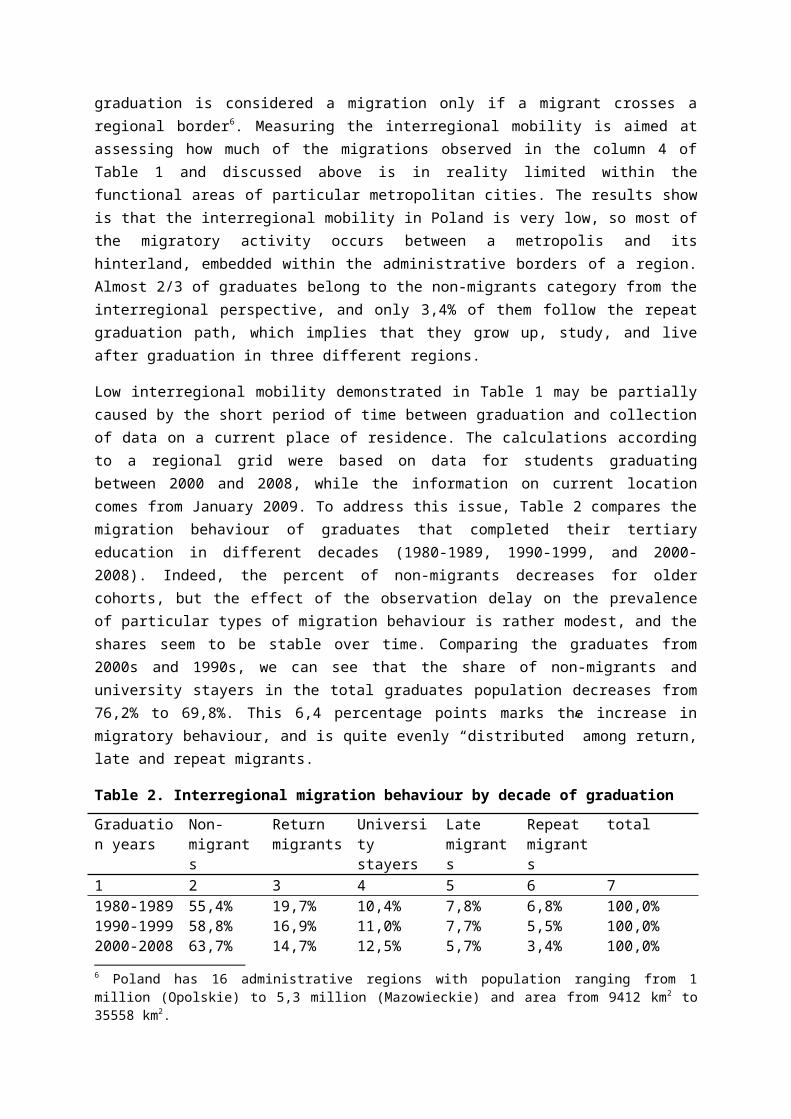
Column 5 in Table 1 shows the frequencies of different sequential migration behaviours in Poland using regional, instead of a 15 km, grid. It means that individual’s displacement to university or after graduation is considered a migration only if a migrant crosses a regional border6. Measuring the interregional mobility is aimed at assessing how much of the migrations observed in the column 4 of Table 1 and discussed above is in reality limited within the functional areas of particular metropolitan cities. The results show is that the interregional mobility in Poland is very low, so most of the migratory activity occurs between a metropolis and its hinterland, embedded within the administrative borders of a region. Almost 2/3 of graduates belong to the non-migrants category from the interregional perspective, and only 3,4% of them follow the repeat graduation path, which implies that they grow up, study, and live after graduation in three different regions.
Low interregional mobility demonstrated in Table 1 may be partially caused by the short period of time between graduation and collection of data on a current place of residence. The calculations according to a regional grid were based on data for students graduating between 2000 and 2008, while the information on current location comes from January 2009. To address this issue, Table 2 compares the migration behaviour of graduates that completed their tertiary education in different decades (1980-1989, 1990-1999, and 2000-2008). Indeed, the percent of non-migrants decreases for older cohorts, but the effect of the observation delay on the prevalence of particular types of migration behaviour is rather modest, and the shares seem to be stable over time. Comparing the graduates from 2000s and 1990s, we can see that the share of non-migrants and university stayers in the total graduates population decreases from 76,2% to 69,8%. This 6,4 percentage points marks the increase in migratory behaviour, and is quite evenly “distributed” among return, late and repeat migrants.
Table 2. Interregional migration behaviour by decade of graduation
Graduation years
Non-migrants
Return migrants
University stayers
Late migrants
Repeat migrants
total
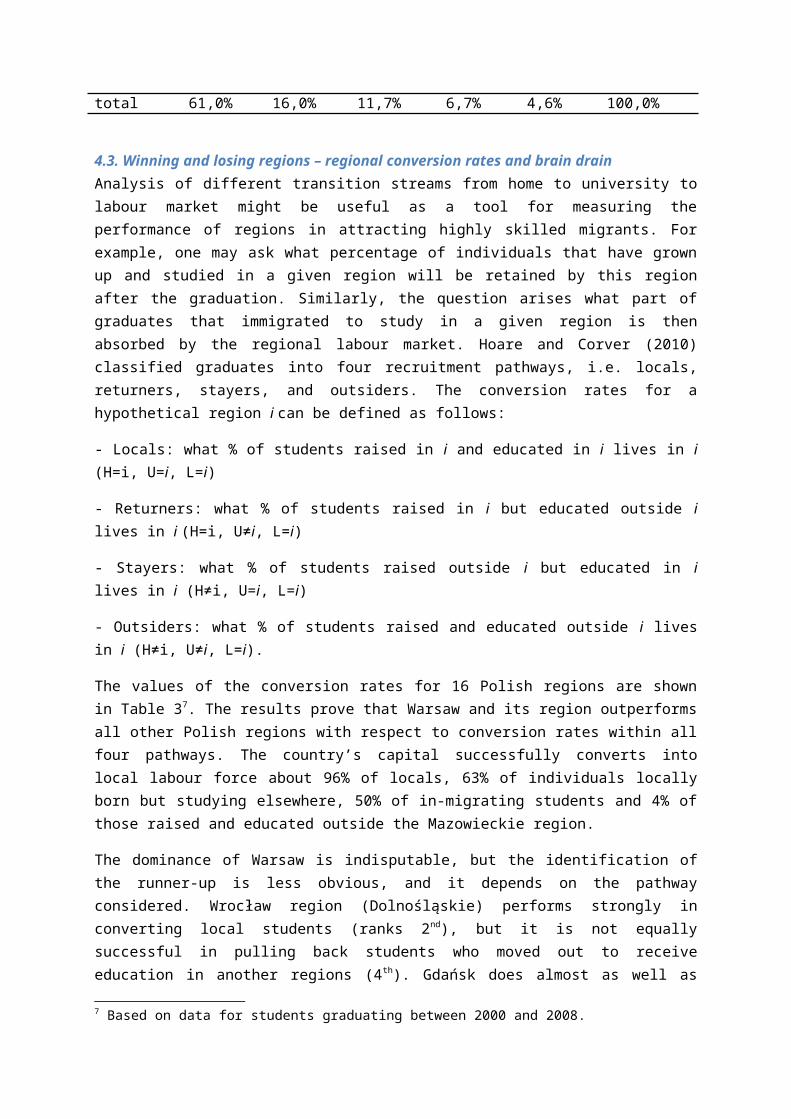
1 2 3 4 5 6 71980-1989 55,4% 19,7% 10,4% 7,8% 6,8% 100,0% 1990-1999 58,8% 16,9% 11,0% 7,7% 5,5% 100,0% 2000-2008 63,7% 14,7% 12,5% 5,7% 3,4% 100,0% total 61,0% 16,0% 11,7% 6,7% 4,6% 100,0%
4.3. Winning and losing regions – regional conversion rates and brain drainAnalysis of different transition streams from home to university to labour market might be useful as a tool for measuring the performance of regions in attracting highly skilled migrants. For example, one may ask what percentage of individuals that have grown up and studied in a given region will be retained by this region after the graduation. Similarly, the question arises what part of graduates that immigrated to study in a given region is then absorbed by the regional labour market. Hoare and
5 It is important to remind at this point that, according to previous research, a vast majority (about 85%) of Poles aged 18-24 still live with their parents (Herbst and Rok 2014).6 Poland has 16 administrative regions with population ranging from 1 million (Opolskie) to 5,3 million (Mazowieckie) and area from 9412 km2 to 35558 km2.
Corver (2010) classified graduates into four recruitment pathways, i.e. locals, returners, stayers, and outsiders. The conversion rates for a hypothetical region i can be defined as follows:
- Locals: what % of students raised in i and educated in i lives in i (H=i, U=i, L=i)
- Returners: what % of students raised in i but educated outside i lives in i (H=i, U≠i, L=i)
- Stayers: what % of students raised outside i but educated in i lives in i (H≠i, U=i, L=i)
- Outsiders: what % of students raised and educated outside i lives in i (H≠i, U≠i, L=i).
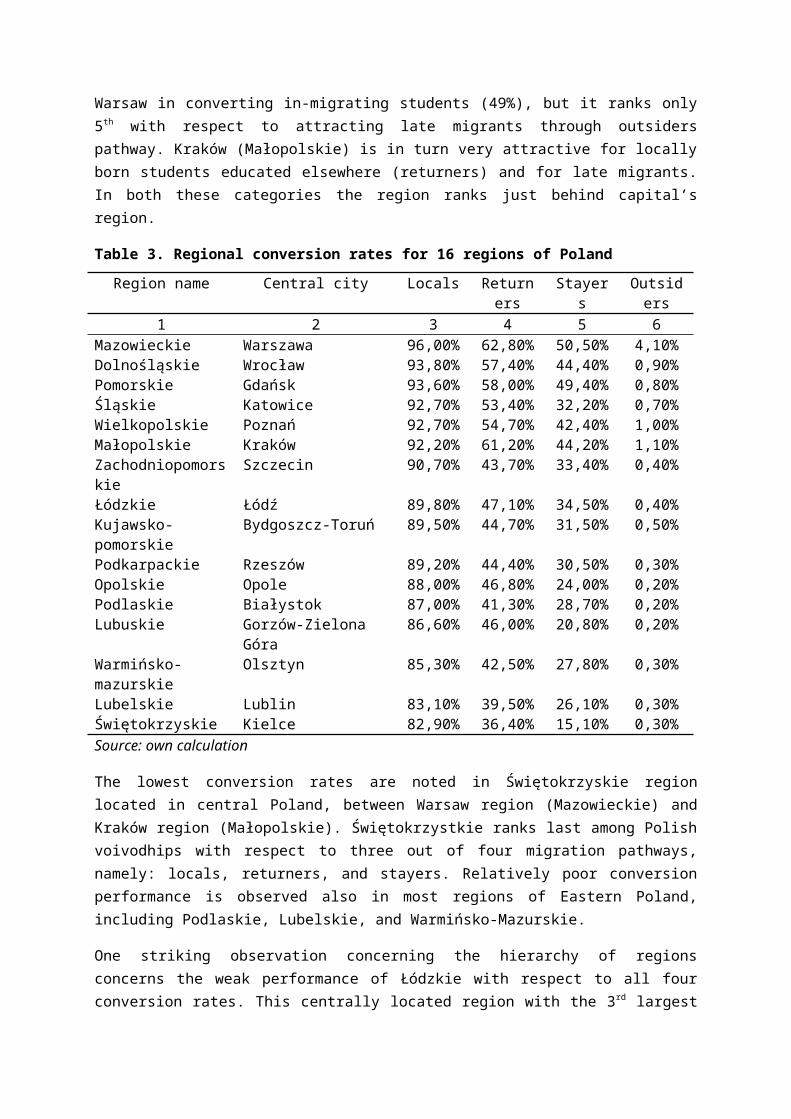
The values of the conversion rates for 16 Polish regions are shown in Table 37. The results prove that Warsaw and its region outperforms all other Polish regions with respect to conversion rates within all four pathways. The country’s capital successfully converts into local labour force about 96% of locals, 63% of individuals locally born but studying elsewhere, 50% of in-migrating students and 4% of those raised and educated outside the Mazowieckie region.
The dominance of Warsaw is indisputable, but the identification of the runner-up is less obvious, and it depends on the pathway considered. Wrocław region (Dolnośląskie) performs strongly in converting local students (ranks 2nd), but it is not equally successful in pulling back students who moved out to receive education in another regions (4th). Gdańsk does almost as well as Warsaw in converting in-migrating students (49%), but it ranks only 5th with respect to attracting late migrants through outsiders pathway. Kraków (Małopolskie) is in turn very attractive for locally born students educated elsewhere (returners) and for late migrants. In both these categories the region ranks just behind capital’s region.
Table 3. Regional conversion rates for 16 regions of Poland
Region name Central city Locals Returners Stayers Outsiders
1 2 3 4 5 6Mazowieckie Warszawa 96,00% 62,80% 50,50% 4,10%Dolnośląskie Wrocław 93,80% 57,40% 44,40% 0,90%Pomorskie Gdańsk 93,60% 58,00% 49,40% 0,80%Śląskie Katowice 92,70% 53,40% 32,20% 0,70%Wielkopolskie Poznań 92,70% 54,70% 42,40% 1,00%Małopolskie Kraków 92,20% 61,20% 44,20% 1,10%Zachodniopomorskie Szczecin 90,70% 43,70% 33,40% 0,40%Łódzkie Łódź 89,80% 47,10% 34,50% 0,40%Kujawsko-pomorskie Bydgoszcz-Toruń 89,50% 44,70% 31,50% 0,50%Podkarpackie Rzeszów 89,20% 44,40% 30,50% 0,30%Opolskie Opole 88,00% 46,80% 24,00% 0,20%Podlaskie Białystok 87,00% 41,30% 28,70% 0,20%Lubuskie Gorzów-Zielona Góra 86,60% 46,00% 20,80% 0,20%Warmińsko-mazurskie Olsztyn 85,30% 42,50% 27,80% 0,30%Lubelskie Lublin 83,10% 39,50% 26,10% 0,30%Świętokrzyskie Kielce 82,90% 36,40% 15,10% 0,30%Source: own calculation
7 Based on data for students graduating between 2000 and 2008.
The lowest conversion rates are noted in Świętokrzyskie region located in central Poland, between Warsaw region (Mazowieckie) and Kraków region (Małopolskie). Świętokrzystkie ranks last among Polish voivodhips with respect to three out of four migration pathways, namely: locals, returners, and stayers. Relatively poor conversion performance is observed also in most regions of Eastern Poland, including Podlaskie, Lubelskie, and Warmińsko-Mazurskie.
One striking observation concerning the hierarchy of regions concerns the weak performance of Łódzkie with respect to all four conversion rates. This centrally located region with the 3 rd largest city in Poland (Łódź) ranks between 6th and 8th. The explanation of this phenomenon is twofold. Łódź economy, in the past relying on textile industry, suffered heavily from economic transformation. Following the collapse of local industry and rising unemployment, the city population began to fall in the 1990s and this process continues till present. Between 1995 and 2011 Łódź lost 12% of its residents. Low converting rates reflect poor job opportunities at the local labour market. The second reason behind the relatively low attractiveness of Łódź for graduates is its proximity to Warsaw (133 km). Better employment prospects and higher wages make Warsaw intercept some of the graduates who could potentially arrive to Łódź (cf. Herbst 2010).
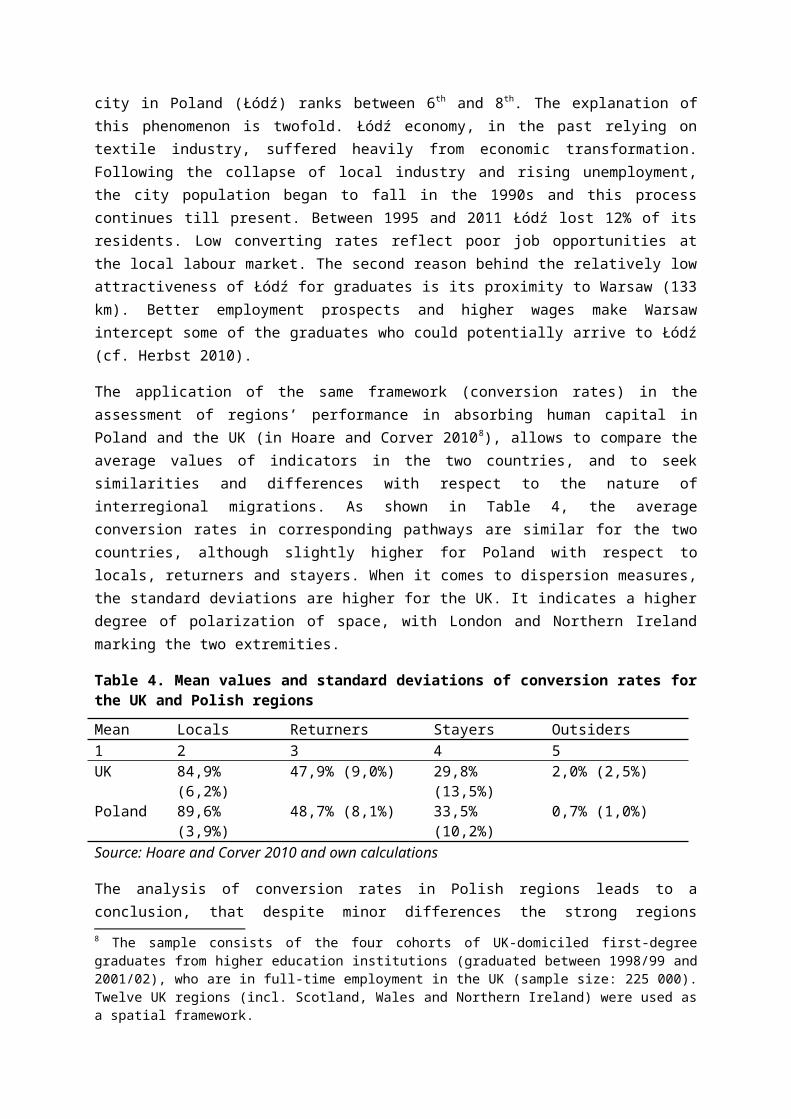
The application of the same framework (conversion rates) in the assessment of regions’ performance in absorbing human capital in Poland and the UK (in Hoare and Corver 2010 8), allows to compare the average values of indicators in the two countries, and to seek similarities and differences with respect to the nature of interregional migrations. As shown in Table 4, the average conversion rates in corresponding pathways are similar for the two countries, although slightly higher for Poland with respect to locals, returners and stayers. When it comes to dispersion measures, the standard deviations are higher for the UK. It indicates a higher degree of polarization of space, with London and Northern Ireland marking the two extremities.
Table 4. Mean values and standard deviations of conversion rates for the UK and Polish regions
Mean Locals Returners Stayers Outsiders 1 2 3 4 5UK 84,9% (6,2%) 47,9% (9,0%) 29,8% (13,5%) 2,0% (2,5%) Poland 89,6% (3,9%) 48,7% (8,1%) 33,5% (10,2%) 0,7% (1,0%)Source: Hoare and Corver 2010 and own calculations
The analysis of conversion rates in Polish regions leads to a conclusion, that despite minor differences the strong regions generally perform well with respect to all migration schemes, while the poorer ones exhibit low rates of conversion in all categories. This suggests that the aggregated differences between the top performing and worst performing regions are substantial and migrations may further aggravate the unequal distribution of human capital stock between voivodships. Moreover, the geography of conversion rates shows that low attractiveness for graduates characterizes predominantly the regions of Eastern Poland. It may cause a massive brain drain from the whole eastern macroregion to the benefit of the metropolitan areas in central and western Poland. To illustrate this problem we propose a measure of brain drain at regional level based on the sequential
8 The sample consists of the four cohorts of UK-domiciled first-degree graduates from higher education institutions (graduated between 1998/99 and 2001/02), who are in full-time employment in the UK (sample size: 225 000). Twelve UK regions (incl. Scotland, Wales and Northern Ireland) were used as a spatial framework.
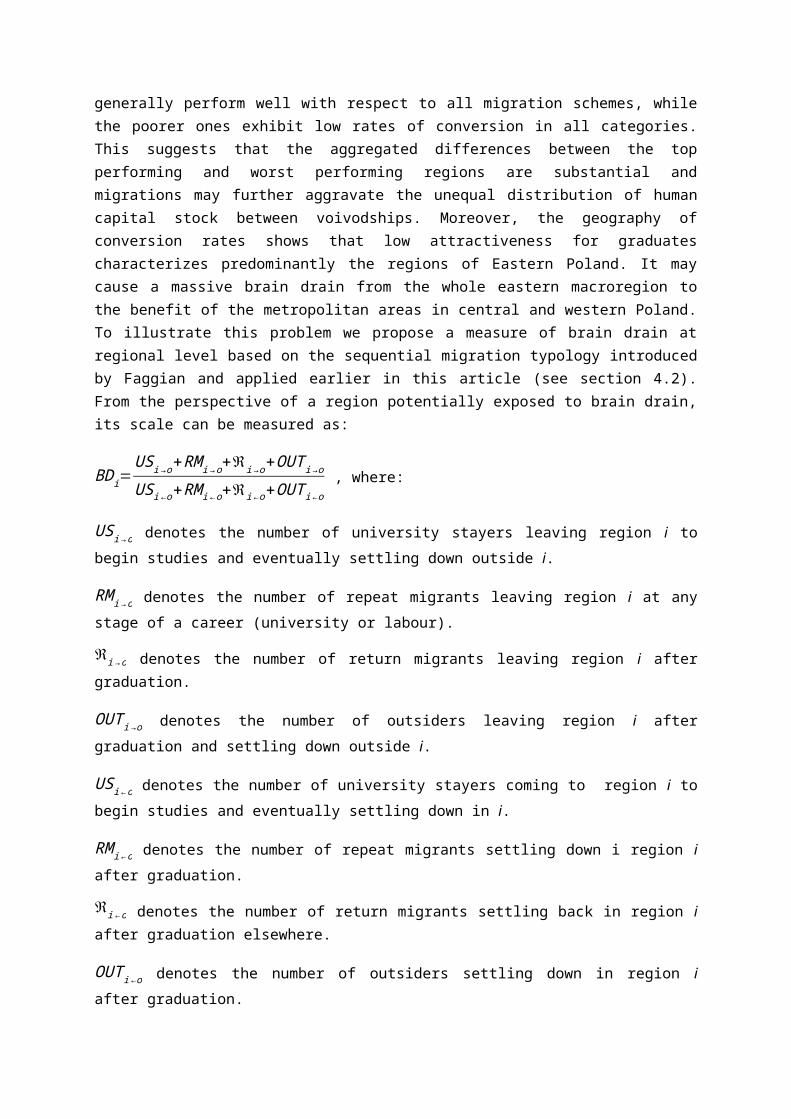
migration typology introduced by Faggian and applied earlier in this article (see section 4.2). From the perspective of a region potentially exposed to brain drain, its scale can be measured as:
BDi=US i→o+RM i→o+ℜi→o+OUT i→o
US i←o+RM i←o+ℜi←o+OUT i←o , where:
USi→o denotes the number of university stayers leaving region i to begin studies and eventually settling down outside i.
RM i→o denotes the number of repeat migrants leaving region i at any stage of a career (university or labour).
ℜi→o denotes the number of return migrants leaving region i after graduation.
OUT i→o denotes the number of outsiders leaving region i after graduation and settling down outside i.
USi←o denotes the number of university stayers coming to region i to begin studies and eventually settling down in i.
RM i←o denotes the number of repeat migrants settling down i region i after graduation.
ℜi←o denotes the number of return migrants settling back in region i after graduation elsewhere.
OUT i←o denotes the number of outsiders settling down in region i after graduation.
The BDi equal to zero (hypothetically possible although non-existing in reality) means that region i doesn’t lose any human capital, as all future graduates passing through the region at any stage of educational career are eventually absorbed by the local labour market. BD i between 0 and 1 suggests that there is some outflow of skilled individuals from the region, but the net effect of human capital migrations is positive, as the region attracts more talent than it loses. The BD i value above 1 indicates that the region is subject to a brain drain. The higher is the BD i value, the larger human capital loss relative to its inflow to the region.
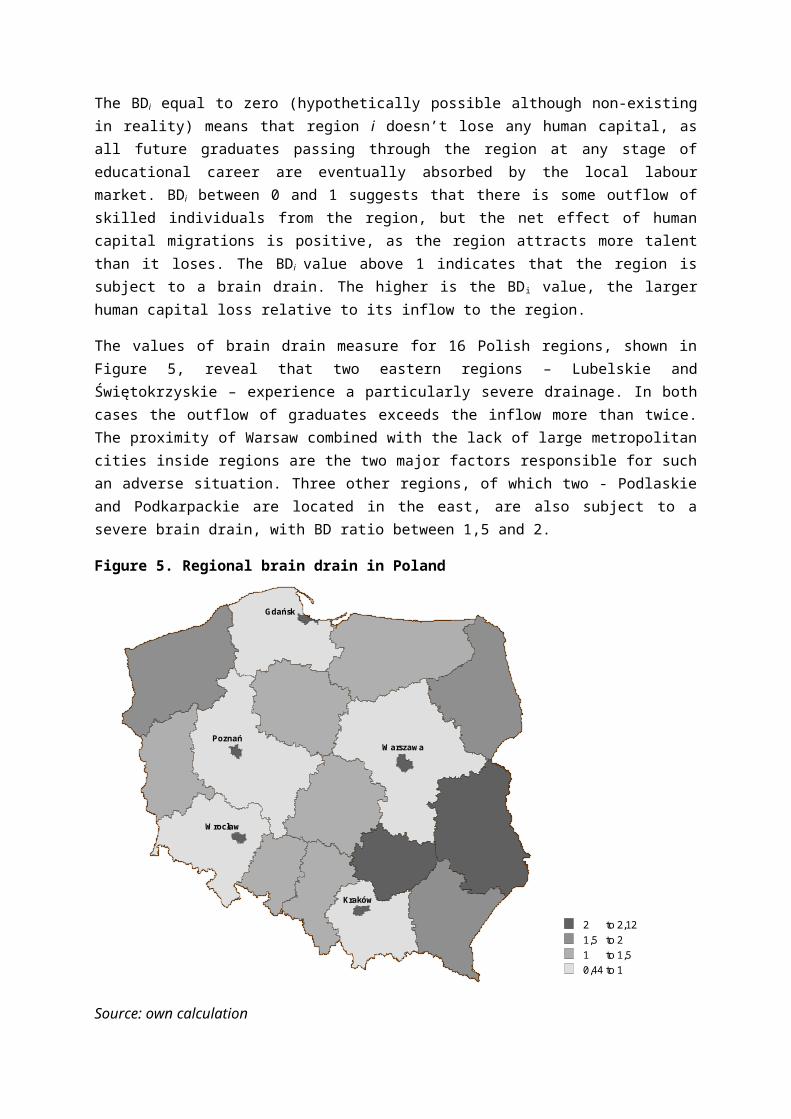
The values of brain drain measure for 16 Polish regions, shown in Figure 5, reveal that two eastern regions – Lubelskie and Świętokrzyskie – experience a particularly severe drainage. In both cases the outflow of graduates exceeds the inflow more than twice. The proximity of Warsaw combined with the lack of large metropolitan cities inside regions are the two major factors responsible for such an adverse situation. Three other regions, of which two - Podlaskie and Podkarpackie are located in the east, are also subject to a severe brain drain, with BD ratio between 1,5 and 2.
Figure 5. Regional brain drain in Poland
Kraków
Wrocław
Warszawa
Gdańsk
Poznań
2 to 2,121,5 to 21 to 1,50,44 to 1
Source: own calculation
In turn, there are five regions clearly benefiting from the mobility of skilled individuals, i.e. Mazowieckie, Małopolskie, Dolnośląskie, Wielkopolskie, and Pomorskie. Not surprisingly all five host the largest and most flourishing Polish cities – Warsaw, Kraków, Wrocław, Poznań, and Gdańsk, respectively. In line with earlier considerations, Łódź remains the only metropolis which seems to lose more talent than it attracts.
4.4. Determinants of interregional flow of human capital (empirical model)The investigation of human capital mobility between regions should involve the identification of major determinants of regional success or failure in attracting educated migrants. As shown in the introductory part of this article, such issues are often addressed by estimating models of individual migration decisions, using micro data. In this study we have too little information at individual level to build such a model. Instead we propose the empirical model of human capital flow between regions, using aggregate data on human capital flows between the 16 regions of Poland. Similar attempt has been made earlier by Ghatak et al. (2008).
The empirical model of human capital flows between regions has the following form:
ijjiij XXM
where,
Mij – is a measure of hc migration from region i to j
Xi and Xj – are vectors of explanatory variables, characteristics of i and j
, – are model parameters
ij – is estimation error
The coefficients assigned to the characteristics of a donor region (i) can be interpreted as measures of importance of push factors, while the parameters referring to destination region ( j) describe the strength of particular pull factors.
Based on the literature review we identified four groups of push or pull factors potentially determining the attractiveness of different regions for skilled individuals. We considered separately (1) the migration of secondary school graduates to university, and (2) the mobility of university graduates, related to entering the labour market. For natural reasons we expect the push and pull factors work differently for these two populations.
The four groups of factors are defined as follows:
- Physical distance between the home and destination region
- Performance of home/destination region’s economy and labour market
- Living cost in home/destination region
- Specific service availability in home/destination region
The endogenous variable is the natural logarithm of the share of students (graduates) migrating from any region i (home region) to any region j (destination region) in the total population of students (graduates) registered in the home region over the researched period. The data cover students enrolling to universities between 2005 and 2008 and graduates completing their tertiary education between 2001 and 2005. Therefore both samples include four year cohorts The reason why we choose to investigate earlier period for graduates than for students is that we acknowledge some graduates don’t make decision on their place of residence immediately after graduation, but they hesitate and try different possibilities before settling down somewhere. The analysis of migration behaviour based on nk.pl database shows that the shares of different migration patterns in the population become stable only if we consider graduates observed 3 years after graduation or later. Thus, since the observation took place in January 2009, we chose to ignore individuals graduating after 2005. In turn, with respect to migration related to university admission we wanted to consider the most recent available data, which implied choosing 2005-2008 period.
Every record in the dataset represents one combination of a home (donor) region i and destination region j. As there are 16 regions in Poland, the dataset contains 240 observations (16x15)
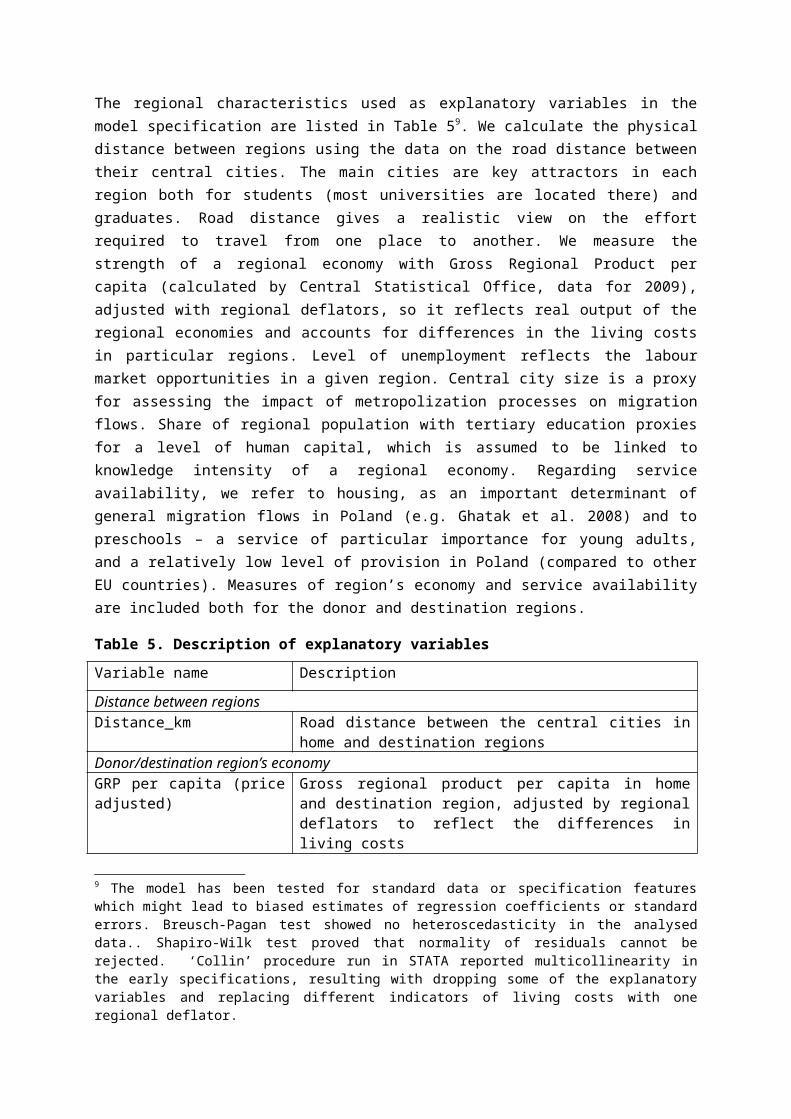
The regional characteristics used as explanatory variables in the model specification are listed in Table 59. We calculate the physical distance between regions using the data on the road distance between their central cities. The main cities are key attractors in each region both for students (most
9 The model has been tested for standard data or specification features which might lead to biased estimates of regression coefficients or standard errors. Breusch-Pagan test showed no heteroscedasticity in the analysed data.. Shapiro-Wilk test proved that normality of residuals cannot be rejected. ‘Collin’ procedure run in STATA reported multicollinearity in the early specifications, resulting with dropping some of the explanatory variables and replacing different indicators of living costs with one regional deflator.
universities are located there) and graduates. Road distance gives a realistic view on the effort required to travel from one place to another. We measure the strength of a regional economy with Gross Regional Product per capita (calculated by Central Statistical Office, data for 2009), adjusted with regional deflators, so it reflects real output of the regional economies and accounts for differences in the living costs in particular regions. Level of unemployment reflects the labour market opportunities in a given region. Central city size is a proxy for assessing the impact of metropolization processes on migration flows. Share of regional population with tertiary education proxies for a level of human capital, which is assumed to be linked to knowledge intensity of a regional economy. Regarding service availability, we refer to housing, as an important determinant of general migration flows in Poland (e.g. Ghatak et al. 2008) and to preschools – a service of particular importance for young adults, and a relatively low level of provision in Poland (compared to other EU countries). Measures of region’s economy and service availability are included both for the donor and destination regions.
Table 5. Description of explanatory variables
Variable name Description
Distance between regionsDistance_km Road distance between the central cities in home and destination
regionsDonor/destination region’s economyGRP per capita (price adjusted) Gross regional product per capita in home and destination
region, adjusted by regional deflators to reflect the differences in living costs
Unemployment Unemployment rate in home and destination regionCentral city size Population of region’s central cityShare_higher_edu Share of regional population with university degreeService availability in donor/destination regionPreschool availability Share of 3-5 years old childred enrolled to preschoolsHousing availability Number of apartments per capita
The results of model estimation are shown in Tables 6 and 7, for students and graduates respectively. The first observation concerning mobility from home to university is the striking importance of physical distance. Despite increasing number of available options and growing competition for enrolees between the higher education institutions, students tend to choose schools located close to their place of residence. The increase of the distance to a potential destination by 100 km is associated with a 70% drop in the measure of migration propensity. Understandably, migration for education is unlikely in the case of students residing in large metropolitan areas. A hypothetical increase of the home region central city population by 10% is statistically associated with a drop of student outflow from this region by 4,5%. Interestingly, the level of regional human capital (proxied by the share of population with higher education) is positively associated with student outflow. One way of explaining this phenomenon is that students raised in more educated environment are generally more mobile when it comes to seeking optimal university or faculty, while these originating from less academic environment tend to choose education opportunities closer to the their family nest.
While choosing destination region, migrating students prefer large metropolitan cities, but they do not attach importance to the economic performance of destination region. Regional income per capita has insignificant effect on migration, and unemployment prospects are not decisive, as the statistical impact of destination region’s unemployment rate of migration turns out to be positive.
The role of apartments and preschool availability as a student pull factor is not clear. The results suggest students tend to choose the regions with better developed preschool care, but at the same time they are more willing to migrate to regions with lower apartment availability.
Table 6. The model estimation results for migration to study
log_migr_stud Coef. Std. Err. t P>t
distance between regionsdistance_km -0,007 0,000 -18,450 0,000donor region economylog GDP per capita (price adjusted) -0,298 0,735 -0,410 0,686log unemployment 0,287 0,453 0,630 0,526log central city size -0,451 0,184 -2,450 0,015share_higher_edu 20,726 6,639 3,120 0,002service availability in donor regionlog preschool availability -1,114 0,595 -1,870 0,062log apartment availability 0,350 1,267 0,280 0,783destination region economylog GDP per capita (price adjusted) -0,411 0,735 -0,560 0,577log unemployment 1,721 0,453 3,800 0,000log central city size 1,811 0,184 9,830 0,000share_higher_edu -1,721 6,639 -0,260 0,796service availability in destination regionlog preschool availability 1,976 0,595 3,320 0,001log apartment availability -6,511 1,267 -5,140 0,000
N 240Adjusted R2 0,735Source: own calculations
The determinants of university graduates interregional migration, observed between 3 and 8 years after graduation, are shown in Table 7. Although graduates entering the labour market are definitely more mobile than students while choosing university, a distance to travel still plays an important role in degree holders’ decision about where to live. A distance 10 km longer is associated with 5% decrease in migration flow, which means that distance coefficient in graduates model is 30% smaller that in the student model.
With respect to home region characteristics (push factors), graduates are more willing to leave the areas with low GDP per capita, and high share of degree holders in population. The reason for the former is that weaker economy offers fewer opportunities for professional career and lesser wage premiums. However, the unemployment rate in home region proves to be insignificant as a determinant of human capital flow.
The positive effect of the home region’s average education attainment on the outward migration stems from the fact that academic centres act as gathering points for students enrolled at universities, who eventually decide where to live. Thus, a human capital ‘donor’ function is natural for big academic centres. Note that by focusing on the flows of graduates between regions (pair-wise), the considered sample does not cover graduates settling down in the region of studies after graduation.
The effect of service availability in the donor region on graduate migration is inconclusive. The availability of preschools and housing doesn’t seem to affect the decision on whether to leave the region of studies.
The pattern is clearer in the case of pull factors. The characteristics of a destination region significantly influence a scale of graduate immigration. Degree holders prefer to migrate to affluent regions, with large central cities, although, as a qualified labour force, they don’t care so much for unemployment rate. The share of population with higher education is both a significant pull and push factor, indicating that graduates from more academic places are also more mobile, but when seeking new destination they still prefer regions with high level of human capital. There are two ways of explaining this phenomenon. First, referring to social networking, is that graduates feel better in more educated environment. Second, education attainment of a region reflects a structure of regional economy (its knowledge intensity) and demand for highly skilled labour force.
Again, it is difficult to determine whether the availability of specific services matters for graduates location choices. Graduates inflow seems to be positively associated with preschool availability, but negatively – to housing opportunities.
Table 7. The model estimation results for migration of graduates
log_grad05_stu Coef. Std. Err. t P>t
distance between regionsdistance_km -0,0053 0,000272 -19,5 0donor region economylog GDP per capita (price adjusted) -0,58476 0,533336 -1,1 0,274log unemployment 1,400715 0,328703 4,26 0log central city size 0,248428 0,133573 1,86 0,064share_higher_edu 11,56017 4,816556 2,4 0,017service availability in donor regionlog preschool availability 0,542083 0,431821 1,26 0,211log apartment availability -2,85609 0,919166 -3,11 0,002destination region economylog GDP per capita (price adjusted) 1,703037 0,533351 3,19 0,002log unemployment -0,21737 0,328626 -0,66 0,509log central city size 0,316507 0,133579 2,37 0,019share_higher_edu 11,12908 4,816404 2,31 0,022service availability in destination regionlog preschool availability -1,16631 0,431817 -2,7 0,007log apartment availability -3,48512 0,919057 -3,79 0
N 240Adjusted R2 0,735
Source: own calculations
5. ConclusionsThe goal of this paper was fourfold: to measure the mobility of students and graduates in Poland, to discuss the typology of skilled migration, to identify the winning regions and those which are subject of brain drain, and to identify major push and pull factors determining interregional flows of human capital. We combine different datasets, but the crucial and unique data on migrations is collected from a social networking website nk.pl.
The mobility of Poland’s human capital is low. Graduates seeking for employment are more prone to migrate than students while choosing a university to study, but still only 24% of graduates move to another region after completing tertiary education, and almost two thirds of these migrants actually come back to their domicile region.
Despite increasing returns from education, the average mobility of students, proxied by the average distance between the secondary school and the chosen university, has been decreasing during 1990s and 2000s, following the long term trend. Clearly, the supply effect (fast developing network of tertiary schools outside large metropolises) has offset the impact of demand for education. In turn, there is no clear trend in the mobility of graduates, whose propensity to migrate seem more linked to the socio-economic situation in Poland at the time they were entering labour market.
The most common strategy in Poland, according to the typology of sequential migration behaviour, is non-migrating (27%). However, repeat and return migrations are almost equally common (26% and 25% respectively). Although difference in the type of analyzed data makes direct comparison between countries difficult, it seems that Polish graduates are less mobile than those in the UK. In particular, the share of non-migrants and return migrants is much higher than in the UK and the share of repeat migrants and university stayers – significantly lower.
Applying the conversion rates framework to the analysis of human capital migration between the regions of Poland shows that almost 90% of locally born students remain in their home region after graduation. The average Polish region manage to absorb on the local labour market one third of incoming students (born and raised in other regions), and it pulls back about 50% of students who originated from the region, but studied elsewhere.
Five of sixteen Polish regions experience net gain of human capital in consequence of skilled migration. All of them include big metropolitan cities – Warsaw, Poznań, Gdańsk, Wrocław, and Kraków. The remaining eleven regions are subjects of a brain drain, but the scale of net outflow varies significantly. The most severe brain drain is observed in the eastern Poland, particularly in the two economically lagging regions, i.e. Lubelskie and Świętokrzyskie.
Physical distance between potential donor and destination regions is the most significant determinant of human capital migration. Although distance plays crucial role in both student and graduate decisions, it is more important for students. Students prefer to migrate to large metropolitan cities, regardless of their economic performance.
Graduates are more willing to leave the areas with low GDP per capita. Weaker economy offers fewer opportunities for professional career. They also tend to migrate from the regions with high
share of degree holders in population. This probably stems from the fact that academic centres act as gathering points for students enrolled at universities, who eventually decide where to settle.
Degree holders prefer to migrate to affluent regions, with large central cities, although, as a qualified labour force, they don’t care so much for unemployment rate. The share of population with higher education is also a significant pull factor. It is possible that graduates choose destinations with higher human capital level for reasons related to social networking (better quality of life), as well as more knowledge intensive economy providing better employment opportunities for the skilled labour force.
The results of this study add to our understanding of the polarization processes taking place in the transition economies. Despite the growing dispersion of higher education institutions, fuelled by marketization and privatization of this sector, the highly skilled individuals tend to cluster in biggest cities. The level of spatial concentration rises systematically with home to study and then, study to work transitions. Relatively high levels of return migration are not sufficient to counteract the concentration of talents in core regions. Thus, the brain drain seems to outweigh the diffusion processes, which strengthen the human capital potential in peripheral regions. Given the role of human capital in the regional development, the question of, rethinking, enabling and facilitating the diffusion processes arise.
ReferencesAlm, J. and J. V. Winters (2009). "Distance and intrastate college student migration." Economics of Education Review 28(6): 728-738.
Arnold, J., A. Bassanini, et al. (2011). "Solow or Lucas? Testing speed of convergence on a panel of OECD countries." Research in Economics 65(2): 110-123.
Barro, R. J. (1999). "Human capital and growth in cross-country regressions." Swedish Economic Policy Review 6(2): 237-277.
Barro, R. J. and X. Sala-i-Martin (2004). Economic Growth. Cambridge: MIT Press.
Baryla, E. A. and D. Dotterweich (2001). “Student migration: Do significant factors vary by region?” Education Economics, 9(3): 269–280.
Benhabib, J. and M. Spiegel (1994). "The role of human capital in economic development." Journal of Monetary Economics 34(2): 143-173.
Chen, D. H. C. and C. J. Dahlman (2004). Knowledge and Development: A Cross-Section Approach, The World Bank, Policy Research Working Paper Series: 3366.
Ciccone, A. and E. Papaioannou (2009). "Human Capital, the Structure of Production, and Growth." The Review of Economics and Statistics 91: 66-82.
Delisle, F. and R. Shearmur (2010). "Where does all the talent flow? Migration of young graduates and nongraduates, Canada 1996-2001." Canadian Geographer, 54(3): 305-323.
Di Cintio, M. and E. Grassi (2011). "Internal migration and wages of Italian university graduates." Papers in Regional Science.
Faggian, A. and P. McCann (2009). "Human capital, graduate migration and innovation in British regions." Cambridge Journal of Economics 33(2): 317-333.
Faggian, A. and P. McCann (2007). "Some evidence that women are more mobile than men: Gender differences in U.K. graduate migration behavior." Journal of Regional Science 47(3): 517-539.
Faggian, A., P. McCann, et al. (2006). "An analysis of ethnic differences in UK graduate migration behaviour." The Annals of Regional Science 40(2): 461-471.
Fidrmuc J. (2003) “Migration and regional adjustment to asymmetric shocks in transition economies.” Journal of Comparative Economics, 32(2): 230-247.
Florida, R. (2002). The Rise of the Creative Class: And How it’s transforming work, leisure, community and everyday life. New York: Perseus Book Group.
Ghatak S., A. Mulhern, J. Watson (2008) “Internal migration in transition economies: the case of Poland.” Review of Development Economics, 12(1): 209-222.
Gibbons, S. and A. Vignoles (2012). "Geography, choice and participation in higher education in England." Regional Science and Urban Economics 42(1-2): 98-113.
Gottlieb, P. D., and G. Joseph (2006). “College-to-work migration of technology graduates and holders of doctorates within the United States.” Journal of Regional Science, 46: 627-659.
Groen, J. (2004). "The effect of college location on migration of college-educated labor." Journal of Econometrics 121(1-2): 125-142.
GUS (2013). Szkoły Wyższe i ich Finanse w 2012 roku. Statistical Information and Elaborations. Warszawa: Central Statistical Office.
Haapanen, M. and H. Tervo (2011). "Migration of the Highly Educated: Evidence From Residence Spells of University Graduates." Journal of Regional Science 51(5): 1-19.
Hawelka B., I. Sitko, E. Beinat, S. Sobolevsky, P. Kazakopoulos and C. Ratti (2013) “Geo-located twitter as the proxy for global mobility patterns.” cs.SI 1311.0680, arXiv.org
Herbst, M. (2010). "Creation and Absorption of Human Capital by Academic Cities in Poland." Studia Regionalne i Lokalne (special issue): 59-76.
Herbst M. and Rok J. (2013) “Mobility of human capital and its effect on regional economic development. Review of theory and empirical literature", MPRA Paper 45755, University Library of Munich.
Herbst M. and Rok J. (2014) “Equity in an Educational Boom: lessons from the expansion and marketisation of tertiary schooling in Poland.” European Journal of Education 49(3)
Hoare, A. and M. Corver (2010). "The Regional Geography of New Young Graduate Labour in the UK." Regional Studies 44(4): 477-494.
Ishitani, T. T. (2011) “The Determinants of Out-Migration Among In-State College Students in the United States.” Research in Higher Education, 52(2): 107-122.
Kodrzycki, Y. K. (2001). "Migration of Recent College Graduates : Evidence from the National Longitudinal Survey of Youth." New England Economic Review, 1: 13-34.
Krueger and Lindahl (1999),
Krugman, P. (1991). "Increasing returns and economic geography." Journal of Political Economy, 99: 483-499.
Kwiek M. (2011). “The public/private dynamics in Polish higher education: Demand-absorbing private growth and its implications”, Higher Education Forum, 8: 37–59
Lucas 1988
Mankiw, Romer and Weil (1992),
Marinelli, E. (2013) “Sub-national graduate mobility and knowledge flows: An exploratory analysis of onward- and return-migrants in Italy.” Regional Studies, 47(10): 1618-33
Marinelli, E. (2011). “Graduate migration in Italy - Lifestyle or necessity?” ERSA conference papers, European Regional Science Association.
Mosca, I. and R. E. Wright (2010). "National and international graduate migration flows." Population trends, 141: 36-53.
Nelson and Phelps 1966
OECD (2013). Education at a Glance: OECD Indicators 2013, OECD
Parsad, B., and L. Gray (2005) “Interstate migration patterns of recent recipients of bachelor’s and master’s degrees in science and engineering”. Arlington: National Science Foundation.
Ritsila, J. and M. Ovaskainen (2001) "Migration and regional centralization of human capital." Applied Economics 33(3): 317-325.
Rzeczpospolita (2010) “5-6 mln użytkowników Facebooka w Polsce?”, Rzeczpospolita online, data publikacji 04-01-2010, www.ekonomia.rp.pl/artykul/414808.html [dostęp: 30.04.2014]
Sa, C., R. Florax and P. Rietveld (2004) “Determinants of the Regional Demand for Higher Education in The Netherlands: A Gravity Model Approach.” Regional Studies, 38: 375-392.
Sagl G., B. Resch, B. Hawelka and E. Beinat (2012) “From social sensor data to collective human behaviour patterns: analysing and visualising spatio-temporal dynamics in selected environments”, in: Proceedings of the GI_Forum 2012 conference, 03–06 July 2012, Salzburg, Austria
Sarra, A. L. And M. Del Signore (2010) “A Dynamic Origin-constrained Spatial Interaction Model Applied to Poland’s Inter-provincial Migration”, Spatial Economic Analysis, 5(1): 29-41.
Simonova N. and D. Antonowicz (2006) “Czech and Polish Higher Education - from Bureaucracy to Market Competition.” Czech Sociological Review, 42(3): 517-536.
Sojkin B., P. Bartkowiak P. and A. Skuza (2012) “Determinants of higher education choices and student satisfaction: the case of Poland.” Higher education, 63(5): 565-581.
Stark, O. (1991) The Migration of Labor. Cambridge, Mass: Blackwell.
Thomas, M. (2013) “The Effect of EU Accession on Internal Migration in Poland”, Studies in Comparative International Development, 48: 482-502.
Venhorst, V., J. Van Dijk, et al. (2010). "Do the Best Graduates Leave the Peripheral Areas of the Netherlands?" Tijdschrift voor economische en sociale geografie 101(5): 521-537.
Winters, J. V. (2011). "Why Are Smart Cities Growing? Who Moves and Who Stays." Journal of Regional Science 51(2): 253-270.