Embed Size (px)
Citation preview
medium pos itive impact(-0.35 - -0.3)low pos itive impact(>0.3- -0.1)no / marginal impact(>-0.1-0.1)low negative impact(>0.1-0.3)medium negative impact(>0.3-0.5)highes t negative impact(>0.5-1)
no data
reduced data
Aggregate potential impac t of
c limate c hange
Aggregated potential impac t of c limate c hange
Note: R egions with reduceddata are mis s ing informationrelated to environmentals ens itivity and expos ure. F ormore details s ee E S P ONC limate Update Annex.
R egional level: NUT S 3 (2013) S ource: E S P ON Database, E S P ON C limate Update, plan - risk consult, 2014
Origin of data: E E A, 2012, 2013 (C OR IN 2006), 2014 (NAT UR A2000), E -P R T R 2012, OS M2014, G IS C O 2006, E urostat 2006, 2011, 2013, 2014, J R C 2006, 2012 (E NS E MB LE S ), 2013a (E urosoils ),2013b (LIS F LOOD), 2013c, 2014, US G S 2011, DIVA 2004, AT S R 2014, S tatis tics Iceland 2011, B undesamt fur S tatis tik 2011, 2014, Amt fur S tatis tik Liechtenstein 2014, 2011, HE S T A, 2014.
UMS R IAT E for administrative boundaries
© E S P ON, 2019
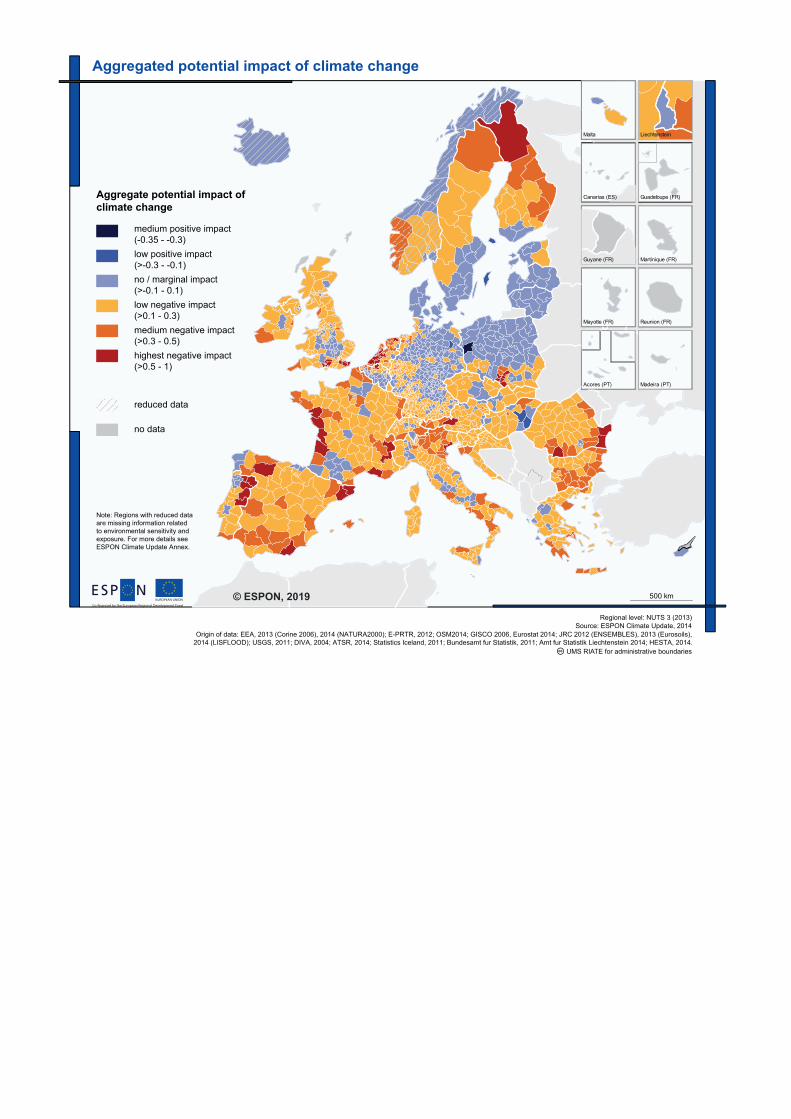
medium positive impact (-0.35 - -0.3)low positive impact (>-0.3 - -0.1) no / marginal impact (>-0.1 - 0.1)low negative impact (>0.1 - 0.3)medium negative impact (>0.3 - 0.5)
Aggregate potential impact of climate change
highest negative impact (>0.5 - 1)
no data
reduced data
Aggregated potential impact of climate change
Regional level: NUTS 3 (2013)Source: ESPON Climate Update, 2014
Origin of data: EEA, 2013 (Corine 2006), 2014 (NATURA2000); E-PRTR, 2012; OSM2014; GISCO 2006, Eurostat 2014; JRC 2012 (ENSEMBLES), 2013 (Eurosoils),2014 (LISFLOOD); USGS, 2011; DIVA, 2004; ATSR, 2014; Statistics Iceland, 2011; Bundesamt fur Statistik, 2011; Amt fur Statistik Liechtenstein 2014; HESTA, 2014.
UMS RIATE for administrative boundaries
© ESPON, 2019
Note: Regions with reduced dataare missing information relatedto environmental sensitivity and exposure. For more details seeESPON Climate Update Annex.