Embed Size (px)
Citation preview

1
CLIMATE FINANCE SHADOW
REPORT 2018ASSESSING PROGRESS TOWARDS THE $100 BILLION COMMITMENT

2
SUMMARY
There are only two years before the deadline by which developed countries have committed to jointly mobilize $100bn per year to support climate action in developing countries.1 This year will also see governments at the 24th Conference of Parties (COP24) in Katowice agree new rules to govern how climate finance is accounted under the Paris Agreement – rules that will shape the quality and transparency of climate finance provision for many years to come.
The $100bn commitment has a pivotal role to play in supporting developing countries to reduce their emissions and adapt to the impacts of climate change. Over the past year, millions of the world’s poorest women and men have been living the hell of climate-exacerbated impacts: from the devastating Atlantic hurricane season, to catastrophic flooding across South Asia, to the 20 million people dangerously hungry today in East Africa. The need for financial support for people and countries that have done the least to cause climate change, yet are suffering its worst effects, is urgent and rising. Increasing the quality and quantity of climate finance is also necessary for the world to maintain a chance of keeping temperature increases to within 1.5°C above pre-industrial levels.
Oxfam’s Climate Finance Shadow Report 2018 offers an assessment of progress towards the $100bn goal. The second in a series, this report looks at the latest donor figures for 2015–16, with a strong focus on public finance. It considers how close we are to the $100bn goal; where the money is coming from; where it is going; what it is being spent on; and how donors are counting the money they report.
While the focus of this report is squarely on the broad trends in donor provision of climate finance, we nonetheless acknowledge the critical role that climate policies and enabling conditions in developing countries also play in achieving adaptation and mitigation outcomes, and ensuring climate finance meets the needs of those who need it most.
What’s changed since 2013–14, when donors last reported on their climate finance?
The overall picture for 2015–16 is concerning. Taking donor reports at face value, we estimate total public climate finance has increased. However, reported levels continue to overstate support (net climate-specific assistance) provided to developing countries by a huge margin. Most loans continue to be counted at their full value, rather than the net amount of money given to a developing country (the grant equivalent). There are also significant inaccuracies in how the climate component of broader development projects are counted.
A closer look reveals that overall increases in climate finance appear to be largely the result of an upsurge in loans, in particular to middle-income countries. Whilst loans have an important role to play in the right circumstances, it is concerning that loans constitute an estimated two-thirds of public climate finance 2015–16.2 Public grant-based support is too low to meet needs, and is rising too slowly. Funding for adaptation to climate change − the priority of the world’s poorest countries – continues to be neglected, as do flows of finance to the world’s least developed countries (LDCs).
For millions living in the world’s poorest countries and communities, trends in climate finance are alarming. There remains a brutal disconnect between the resources developing countries have to adapt to climate change and the increasing risks they face.
CLIMATE FINANCE EFFORTS BY DEVELOPED COUNTRIES ARE AT A CRITICAL JUNCTURE.

3
CLIMATE FINANCE IN 2015–16: KEY TAKEAWAYS1. Estimated net climate-specific assistance is far lower than reported climate financE: Aggregated reported donor numbers for public climate finance in 2015–16 amount to an estimated $48bn per year. However, these numbers cannot be taken at face value: Oxfam estimates net climate-specific assistance may be just $16–21bn.
2. The value of loans are being over-reported:Oxfam estimates loans and other non-grant instruments may have been reported at up to almost two times the net transfer of funds to developing countries.
3. The climate-relevance of bilateral funding is being over-reported: If the finance for development projects that only partially cover climate change were reported more accurately, annual bilateral flows of public climate finance could be between $10bn and $15bn lower than reported.
4. Grant-based assistance is too low and is rising too slowly: While donor reports suggest overall public climate finance may be increasing, the rise is coming mainly from an increase in loans and other non-grant instruments. In 2015–16, only an estimated $11–13bn was given as grants per year, forming just 23–27 percent of the total. This is a small increase compared to 2013–14 when we estimated $10bn per year was grant-based.
5. Assistance for climate adaptation remains too low and is rising too slowly: An estimated $9.5bn of public climate finance annually was dedicated to adaptation in 2015–16, forming just 20 percent of the total. This compares to around $8bn per year in 2013–14 –19 percent of the total.
6. Assistance to LDCs remains too low and is rising too slowly: Only an estimated $9bn of annual public climate finance went to the 48 LDCs in 2015–16, forming just 18 percent of total public climate finance. This is a small increase compared to the $7.4bn per year we estimated went to LDCs in 2013–14 – also 18 percent of the total.
7. Climate finance continues to take a growing share of aid: Public climate finance amounted to 21 percent of total global official development assistance (ODA) budgets in 2015–16; the vast majority of this was counted against donor commitments to increase ODA to 0.7 percent of gross national income (GNI).
8. Counting mobilized private finance has increased: Donor reports for 2015–16 show an increase in the number of countries counting mobilized private finance against their climate finance commitments. There is currently no common methodology to account for it.

BOX 1: WHAT IS ‘NET CLIMATE-SPECIFIC ASISTANCE’ AND HOW IS IT DIFFERENT TO REPORTED NUMBERS?
Oxfam believes donors should count ‘net climate-specific assistance’ in their climate finance reports to the UN Framework Convention on Climate Change (UNFCCC), because anything outside of this does not constitute a net financial transfer to developing countries in support of climate action. There are two main issues in attempting to estimate net climate-specific assistance.
The first is how loans are counted. Oxfam’s estimate of net climate-specific assistance counts only the grant element of concessional loans or other non-grant instruments, not their face value. These instruments play an important role in low-carbon, climate-resilient development, but it is only their grant equivalent that represents the net financial value transferred to recipient countries. This is because even concessional loans, for example, come with obligations for the repayment of interest and administration by developing countries. Our estimate counts grants at 100 percent and non-concessional instruments at 0 percent. Data on the grant equivalent of financial instruments in climate finance is patchy. Therefore, concessional instruments other than grants are counted in line with each country’s average grant element of ODA loans in 2015–16 as reported to the OECD.3 (See Section 2 for more analysis.)
The second issue is that donors report funds for projects that only partially cover climate action4 which is justified given that a great deal of climate action takes place in the context of broader development projects.5 However, the Rio Marker methodology used by most donors to determine the value of the climate component of such projects lacks rigour, which results in the climate-relevance of funds being overstated.6 Oxfam’s estimate discounts for this. In our low-end estimate, we assume 20 percent of funds are climate relevant for projects in which climate change is one of multiple objectives; our high-end estimate assumes 50 percent. We consider this to be a defensible range based on the varying relevance of such projects to climate change, as well as the varying percentages that are applied by donor countries themselves. (See Section 3 for more detail.)
RECOMMENDATIONS
Decisions this year in national capitals, at donor meetings and at the UN climate negotiations must increase confidence that the $100bn goal will be met in a fair and robust way. This means ensuring that those on the frontlines of climate impacts get far more of the support they need and have been promised. It also means addressing accounting challenges that allow climate finance to be over-calculated in donor reports.
Negotiations on the ‘modalities of accounting’ for climate finance that are due to conclude at COP24 present a long overdue opportunity to agree more robust standards. Crucially, this must include agreement to report climate finance on a grant-equivalent basis, which as agreed by the OECD Development Assistance Committee (DAC) will become the standard for reporting headline ODA figures from 2018. 7 This is needed to improve the integrity and comparability of reported numbers, and to ensure climate finance keeps apace with improving standards for aid accounting. Grant-equivalent reporting would also create a much-needed incentive for greater provision of grant-based support.
4 4

5
Rules to report the value of loans:• All parties should agree rules and accounting guidelines under the UN Framework Convention on Climate
Change (UNFCCC) that ensure countries count the grant equivalent of non-grant instruments towards their UNFCCC obligations (in line with new standards for ODA reporting from 2018).
• Non-concessional instruments should not be counted towards UNFCCC climate finance obligations.• Country reports should provide full data on all instruments, including whether loans are provided at
market rate.
Rules to increase accuracy in counting climate-relevance:• The UNFCCC and OECD should develop clear common guidelines to determine the value of a project’s climate
component; and all contributing countries should be required to use these guidelines on a project-by-project basis for finance counted against UNFCCC obligations.
• Reporting of climate finance by countries and Multilateral Development Banks (MDBs) should include both the full value of a programme/project, as well as the estimated finance specifically targeting climate change.
Rules to count mobilized private finance:• Parties to the UNFCCC should agree on a collective reporting approach for mobilized private finance that
limits the risk of double-counting; it should also include reporting by MDBs.• Reporting on mobilized private finance should be conservative to build trust and take account of measures
by developing countries themselves to attract investors; no flat leverage ratios should be applied, but instead causality between public investment and mobilized private finance should be established on a project-by-project basis.
To increase grant-based support:• All donors should work to urgently increase the overall share and amount of their grant-based assistance;
and ensure it is prioritized for adaptation and the poorest and most vulnerable countries.
To increase finance for adaptation:• All developed countries should increase their financing for adaptation, and commit to ensuring that it
constitutes at least 50 percent of their overall public climate finance contributions by 2020.
To increase support to LDCs:• UNFCCC rules and reporting guidelines should require donors to report the share of climate finance they are
contributing to LDCs and small island developing states.• All contributing countries should commit to a minimum of 25 percent of their public climate finance being
dedicated to LDCs by 2018.
To increase new sources of climate finance outside of aid commitments:• As a first step, developed countries should commit to ensure future increases of climate finance that
qualify as ODA form part of an overall aid budget that is increasing at least at the same rate as climate finance, so that other development priorities are not sidelined.
• All countries need to support urgent action to get the most promising new national and international sources of climate finance off the ground (such as carbon pricing for international aviation and maritime transport, and a financial transaction tax).
6
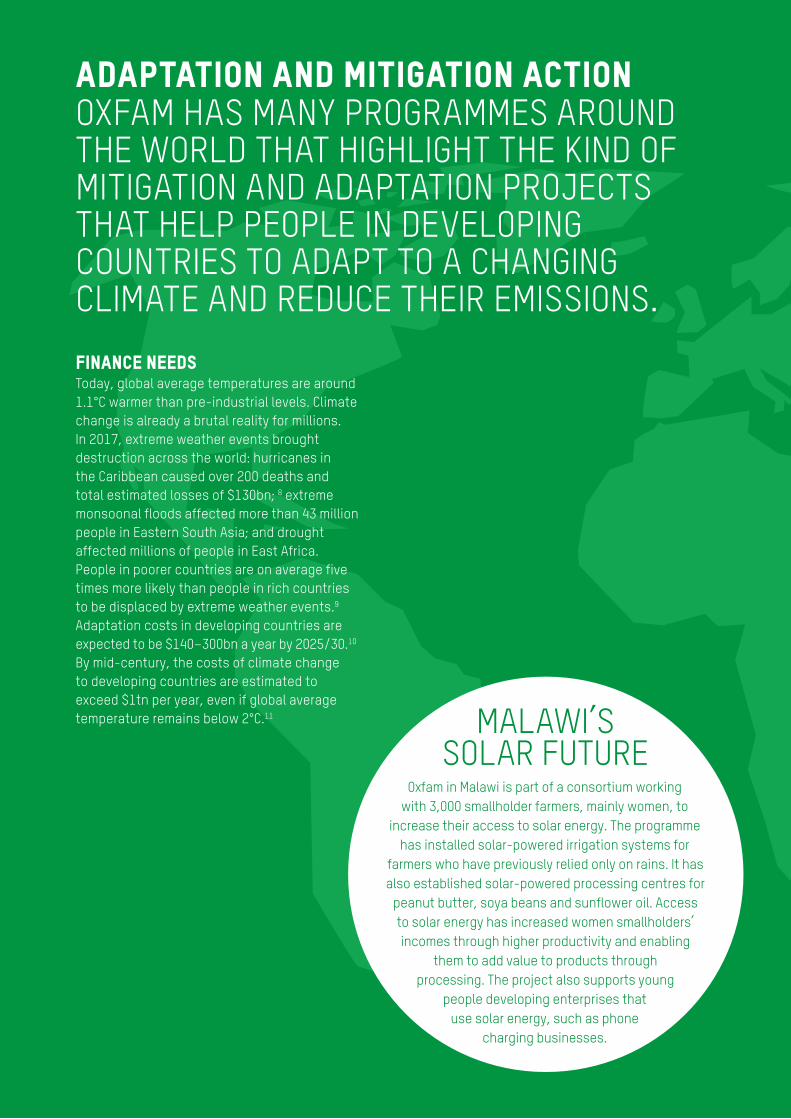
ADAPTATION AND MITIGATION ACTIONOXFAM HAS MANY PROGRAMMES AROUND THE WORLD THAT HIGHLIGHT THE KIND OF MITIGATION AND ADAPTATION PROJECTS THAT HELP PEOPLE IN DEVELOPING COUNTRIES TO ADAPT TO A CHANGING CLIMATE AND REDUCE THEIR EMISSIONS.
FINANCE NEEDSToday, global average temperatures are around 1.1°C warmer than pre-industrial levels. Climate change is already a brutal reality for millions. In 2017, extreme weather events brought destruction across the world: hurricanes in the Caribbean caused over 200 deaths and total estimated losses of $130bn; 8 extreme monsoonal floods affected more than 43 million people in Eastern South Asia; and drought affected millions of people in East Africa. People in poorer countries are on average five times more likely than people in rich countries to be displaced by extreme weather events.9 Adaptation costs in developing countries are expected to be $140–300bn a year by 2025/30.10
By mid-century, the costs of climate change to developing countries are estimated to exceed $1tn per year, even if global average temperature remains below 2°C.11 MALAWI’S
SOLAR FUTUREOxfam in Malawi is part of a consortium working
with 3,000 smallholder farmers, mainly women, to increase their access to solar energy. The programme
has installed solar-powered irrigation systems for farmers who have previously relied only on rains. It has also established solar-powered processing centres for
peanut butter, soya beans and sunflower oil. Access to solar energy has increased women smallholders’ incomes through higher productivity and enabling
them to add value to products through processing. The project also supports young
people developing enterprises that use solar energy, such as phone
charging businesses.
7
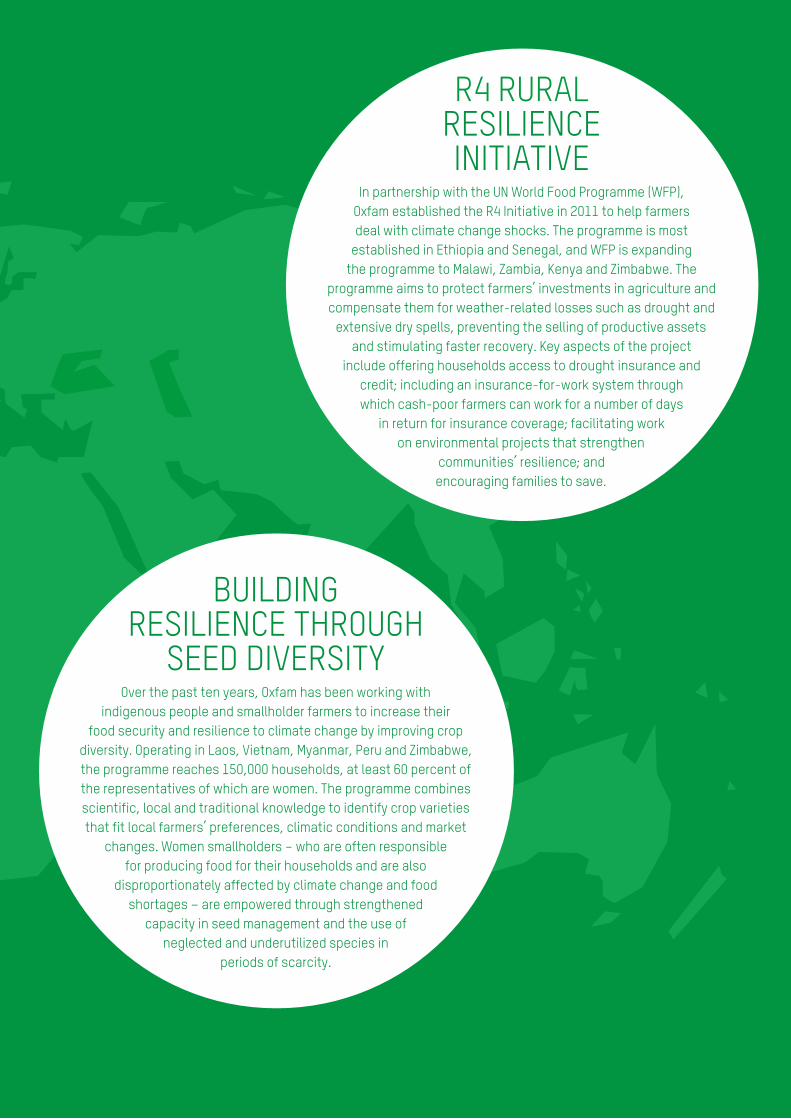
BUILDING RESILIENCE THROUGH
SEED DIVERSITYOver the past ten years, Oxfam has been working with
indigenous people and smallholder farmers to increase their food security and resilience to climate change by improving crop
diversity. Operating in Laos, Vietnam, Myanmar, Peru and Zimbabwe, the programme reaches 150,000 households, at least 60 percent of the representatives of which are women. The programme combines scientific, local and traditional knowledge to identify crop varieties that fit local farmers’ preferences, climatic conditions and market
changes. Women smallholders − who are often responsible for producing food for their households and are also
disproportionately affected by climate change and food shortages – are empowered through strengthened
capacity in seed management and the use of neglected and underutilized species in
periods of scarcity.
R4 RURAL RESILIENCE INITIATIVE
In partnership with the UN World Food Programme (WFP), Oxfam established the R4 Initiative in 2011 to help farmers deal with climate change shocks. The programme is most
established in Ethiopia and Senegal, and WFP is expanding the programme to Malawi, Zambia, Kenya and Zimbabwe. The
programme aims to protect farmers’ investments in agriculture and compensate them for weather-related losses such as drought and
extensive dry spells, preventing the selling of productive assets and stimulating faster recovery. Key aspects of the project
include offering households access to drought insurance and credit; including an insurance-for-work system through which cash-poor farmers can work for a number of days
in return for insurance coverage; facilitating work on environmental projects that strengthen
communities’ resilience; and encouraging families to save.

8
1THE PICTURE IN 2015–16: OF THE ESTIMATED $48BN IN PUBLIC CLIMATE FINANCE REPORTED PER YEAR, NET CLIMATE-SPECIFIC ASSISTANCE MAY BE JUST $16–21BN.
In 2016, developed countries published Roadmap to US$100 Billion, which laid out how they could meet their $100bn per year climate finance commitment. This stated that public climate finance levels had reached $41bn per year in 2013–14.12
Aggregating donor reports of public climate finance to the UNFCCC and OECD in 2015–16, using largely the same approach as the roadmap, totals $48bn.13 As neither the UNFCCC nor OECD have published total public climate finance figures for 2015–16, this figure represents our best guess estimate of what donor reports might amount to in aggregate if they were compiled in the same way today.14 It is not an endorsement of donor methodologies.
From the perspective of developing countries, only counting net climate-specific assistance is a fairer way of calculating climate finance than the approaches donors currently use. Because anything outside of this does not constitute a net financial transfer to developing countries in support of climate action.
Using OECD data, we estimate net climate-specific assistance to be significantly lower than $48bn (aggregated donor reports): between $16bn and $21bn per year, of which between just $5bn and $7bn per year is for adaptation (see Figure 1).15 These figures are not exact, but indicative. Even if one assumes a large margin of error, they point to a significant difference between what donors report and net climate-specific assistance.
Box 1 sets out the basis on which we have estimated net climate-specific assistance. First, rather than counting loans and other non-grant instruments at their full face value, we have estimated their grant equivalent using donor averages for concessional official development assistance (ODA) loans in 2015–16. In addition, for projects that only partially cover climate action, we have assumed 20 percent of full project value at the lower end of our estimate, and 50 percent at the higher end.
EVEN IF ONE ASSUMES A LARGE MARGIN OF ERROR, THE FIGURES POINT TO A SIGNIFICANT DIFFERENCE BETWEEN WHAT DONORS REPORT AND NET CLIMATE-SPECIFIC ASSISTANCE.

9
RECOMMENDATIONS
• All parties should agree rules and accounting standards under the UNFCCC that ensure countries report the grant equivalent of non-grant instruments and better reflect the climate-relevance of provided funds, thereby reporting climate finance in a way that better reflects its real value to developing countries. This should be agreed at COP24 in the context of negotiations on the ‘modalities of accounting’ for climate finance as part of the Paris rulebook. (See Sections 2 and 3 for further recommendations on reporting of loans and for projects in which climate change is one of multiple objectives.)
Sources: Third Biennial Reports (2018), data from Common Tabular Format tables; OECD (2018a).
Our estimate of net climate-specific assistance is based on OECD reported figures (see Box 1 for details),16 whereas reported bilateral finance in biennial reports to the UNFCCC can include funds that are not reported to the OECD. We estimate this difference accounts for up to $4bn of the difference between our estimate of reported public climate finance and our estimate of net climate-specific assistance (see shaded area in the net climate-specific assistance bar).17
Low High
2015–16 ANNUAL
AVERAGE
$48bn
$16-21bn
$4bn
$5-7bn
NET CLIMATE SPECIFIC
ASSISTANCE
...OF WHICH ADAPTATION
SPECIFIC
$ bi
llion
per
yea
r
60
50
40
30
20
10
0
Figure 1: Aggregated reports of public climate finance and Oxfam estimate of net climate-specific assistance (2015-16 annual average)

10
2OVER-REPORTED LOAN VALUE: IN 2015–16, LOANS MAY HAVE BEEN REPORTED AT UP TO NEARLY TWO TIMES THEIR NET VALUE TO DEVELOPING COUNTRIES.
Oxfam estimates the grant equivalent of reported public climate finance in 2015–16 at between $25bn and $26bn (annual average).
This is significantly less than our estimate of $48bn for the aggregated reported donor numbers. This means that loans and other non-grant instruments may have been reported at almost two times the net transfer of funds to developing countries.
Under the right circumstances, concessional and non-concessional loans, equity or guarantees all have an important part to play in providing and mobilizing climate finance. But reporting these instruments only at their face value – the current practice of most developed countries – obscures the level of assistance developing countries receive by a huge margin.
Reporting non-grant instruments at their full face value also means donors supplying a high proportion of loans – such as France, Germany, Spain and Japan – can claim credit for providing more climate finance than they are compared to those countries providing mainly grants.
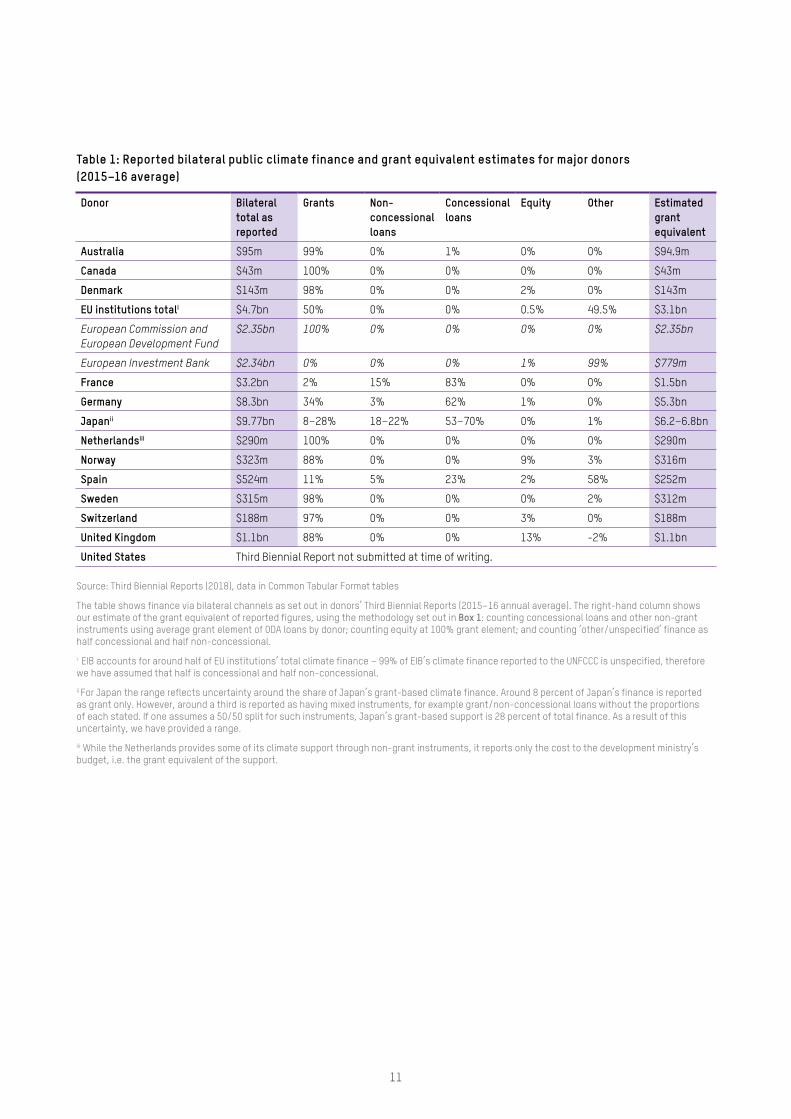
Table 1 estimates bilateral climate finance on a grant-equivalent basis for major donors. The climate-relevance of this bilateral climate finance is looked at in Section 3.
RECOMMENDATIONS
• All parties should agree rules and accounting guidelines under the UNFCCC that ensure countries count the grant equivalent of their climate finance towards their UNFCCC obligations (in line with new standards for ODA reporting from 2018). Methodologies for counting the grant element of climate finance should be agreed under the UNFCCC, as they have been by the OECD Development Assistance Committee (DAC).18 Standards for climate finance should not lag behind aid rules.
• Non-concessional instruments should not be counted towards UNFCCC climate finance obligations.
• Country reports should provide full data on both concessional and non-concessional instruments, including the terms for loans. Including information on concessional and non-concessional instruments at their face value is acceptable in country reports, provided there is a clear distinction between what is reported and what is counted towards fulfilling a country’s UNFCCC obligations, which should be the grant equivalent.
REPORTING THESE INSTRUMENTS ONLY AT THEIR FACE VALUE – THE CURRENT PRACTICE OF MOST DEVELOPED COUNTRIES – OBSCURES THE LEVEL OF ASSISTANCE DEVELOPING COUNTRIES RECEIVE BY A HUGE MARGIN.
11
Table 1: Reported bilateral public climate finance and grant equivalent estimates for major donors (2015–16 average)
Donor Bilateral total as reported
Grants Non-concessional loans
Concessional loans
Equity Other Estimated grant equivalent
Australia $95m 99% 0% 1% 0% 0% $94.9m
Canada $43m 100% 0% 0% 0% 0% $43m
Denmark $143m 98% 0% 0% 2% 0% $143m
EU institutions totali $4.7bn 50% 0% 0% 0.5% 49.5% $3.1bn
European Commission and European Development Fund
$2.35bn 100% 0% 0% 0% 0% $2.35bn
European Investment Bank $2.34bn 0% 0% 0% 1% 99% $779m
France $3.2bn 2% 15% 83% 0% 0% $1.5bn
Germany $8.3bn 34% 3% 62% 1% 0% $5.3bn
Japanii $9.77bn 8–28% 18–22% 53–70% 0% 1% $6.2–6.8bn
Netherlandsiii $290m 100% 0% 0% 0% 0% $290m
Norway $323m 88% 0% 0% 9% 3% $316m
Spain $524m 11% 5% 23% 2% 58% $252m
Sweden $315m 98% 0% 0% 0% 2% $312m
Switzerland $188m 97% 0% 0% 3% 0% $188m
United Kingdom $1.1bn 88% 0% 0% 13% -2% $1.1bn
United States Third Biennial Report not submitted at time of writing.
Source: Third Biennial Reports (2018), data in Common Tabular Format tables
The table shows finance via bilateral channels as set out in donors’ Third Biennial Reports (2015–16 annual average). The right-hand column shows our estimate of the grant equivalent of reported figures, using the methodology set out in Box 1: counting concessional loans and other non-grant instruments using average grant element of ODA loans by donor; counting equity at 100% grant element; and counting ‘other/unspecified’ finance as half concessional and half non-concessional.
i EIB accounts for around half of EU institutions’ total climate finance – 99% of EIB’s climate finance reported to the UNFCCC is unspecified, therefore we have assumed that half is concessional and half non-concessional.
ii For Japan the range reflects uncertainty around the share of Japan’s grant-based climate finance. Around 8 percent of Japan’s finance is reported as grant only. However, around a third is reported as having mixed instruments, for example grant/non-concessional loans without the proportions of each stated. If one assumes a 50/50 split for such instruments, Japan’s grant-based support is 28 percent of total finance. As a result of this uncertainty, we have provided a range.
iii While the Netherlands provides some of its climate support through non-grant instruments, it reports only the cost to the development ministry’s budget, i.e. the grant equivalent of the support.

12
3 COUNTING FUNDS THAT ARE NOT FOCUSED ON CLIMATE CHANGE: IF THE SIGNIFICANCE OF CLIMATE CHANGE AS A FUNDING OBJECTIVE WERE TAKEN INTO ACCOUNT, BILATERAL FLOWS OF PUBLIC CLIMATE FINANCE IN 2015–16 COULD BE BETWEEN $11BN AND $15BN LOWER THAN REPORTED.
The current system of reporting climate finance against UNFCCC commitments allows for gross over-estimation of the climate relevance of reported funds. We estimate bilateral flows of public climate-specific finance may be between $11–15bn lower each year in 2015–16 than reported figures suggest (see Figure 2).
This issue arises because a great deal of climate finance is (justifiably) spent on projects in which mitigation or adaptation is not the primary objective, but one of many in a broader development project. For bilateral finance, the way this is accounted depends exclusively on developed countries’ self-reporting, which has led to the use of disparate and in many instances questionable methods. Adaptation finance is particularly affected, because a high share of bilateral adaptation finance is derived from projects in which adaptation is a secondary objective.19
Integrating climate change into aid spending to support low-carbon, climate-resilient development is a vital and laudable objective, and a prerequisite for meeting the Paris Agreement and Sustainable Development Goals. However, political pressure to meet the $100bn commitment, combined with an absence of clarity on how to define what proportion of a project to count as climate finance, gives an incentive to overcount the climate-relevance of development spending.
Indeed, analysis suggests huge discrepancies in how the climate component of such projects is estimated, particularly for adaptation. In a review of over 5,000 projects, AdaptationWatch found that three quarters of projects listed as supporting developing countries to adapt to climate change appeared to be overcounted.20
Table 2 highlights how countries’ approaches to counting the climate finance component of mixed projects vary significantly. It considers projects classified as ‘Rio Marker 1’, i.e. those in which climate adaptation or mitigation are a significant but not primary objective, under OECD DAC criteria.21
BILATERAL FINANCE AS REPORTED IN THE BIENNIAL REPORTS
HIGH ESTIMATE FOR CLIMATE- RELEVANCE
LOW ESTIMATE FOR CLIMATE- RELEVANCE
Figure 2: Oxfam’s estimate of climate relevance in bilateral finance (2016–16 average)
The first bar shows bilateral finance as reported in the Third Biennial Reports (where countries use their own methods to calculate the climate relevance of provided funds) minus EIB. The middle and bottom bars give Oxfam’s high and low estimates for these figures, taking into account climate relevance. In our low estimate, we assume 20 percent of funds for projects in which climate is one of multiple objectives. In our high estimate, we assume 50 percent. Our estimates are based on OECD reported figures whereas bilateral finance reported in Third Biennial Reports can include funds that are not reported to the OECD. We estimate this difference could account for up to $5bn of the difference between our estimates of climate relevance and reported numbers. See Box 1 and Figure 1 for more on our methodology.
Sources: Third Biennial Reports (2018), own calculations based on OECD (2018a)
0 10 20 30
$ billion

13
RECOMMENDATIONS
• The UNFCCC and OECD should develop clear and common guidelines to determine the value of a project’s climate component; all contributing countries should be required to use these guidelines on a project-by-project basis for finance counted against UNFCCC obligations.
• Reporting of climate finance by countries and MDBs should include both the full value of a programme/project, as well as the estimated finance specifically targeting climate change.
In reporting to the UNFCCC only a few countries – including Switzerland, the UK, and the US – calculate the value of Rio Marker 1 projects on a project-by-project basis. Most countries apply blanket percentages, generally between 30–50 percent to all Rio Marker 1 projects – an approach which does not allow accurate assessment by project. A number of countries, including Japan, Iceland and Greece, count the climate finance dimension as 100 percent of the project budget, despite the definition of Rio Marker 1 categorization meaning that climate change is not a primary objective.
Table 2: Country approaches to counting the value of climate activities when projects include multiple objectives (Rio Marker 1, OECD)
Donor Percentage applied
Australia 30%i
Canada 30%
Denmark 50%
EU institutions 40%
France 40%
Germany 50%
Greece 100%
Iceland 100%
Japan 100%
Netherlands 40%
New Zealand 30% or 50%
Norway 40%
Spain 20–40%
Sweden 40%
Switzerland 1–50% by project
United Kingdom Own method by project
United States Own method by project
Source: OECD (2015) unless countries have stated otherwise in their Third Biennial Reports (2018)
i Assessment of activities where feasible; otherwise 30 percent of project value

14
4GRANT-BASED ASSISTANCE IS TOO LOW: ONLY ABOUT A QUARTER OF REPORTED PUBLIC CLIMATE FINANCE IN 2015–16 WAS IN THE FORM OF GRANTS.
Of the estimated $48bn reported annual public climate finance, only an estimated $11–13bn was provided in the form of grants (23–27 percent). This is significantly less than the estimated $35–37bn provided through other instruments, such as loans, equity or guarantees (see Figure 3). It represents a small increase since 2013–14, when we estimated $10bn per year was provided in the form of grants.22
Grant-based support in 2015 and 2016 did not increase at the same pace as overall climate finance. The amount of climate finance that is being provided in the form of grants remains woefully inadequate. This is deeply concerning because grants to least developed countries (LDCs) and others with high vulnerability and low capacity to adapt to changing climates are vital. Private finance and loans are ill-suited to meet the critical adaptation needs of poor and marginalized people – to ensure disaster preparedness, food and water security and other action to increase resilience.23
Using OECD data, we roughly estimate the share of grant-based finance being dedicated to adaptation is around 38 percent.24 This suggests some prioritization of grant-based support for adaptation by donors, which is positive – but much more is needed.
Figure 3: Estimated grant finance via bilateral and multilateral channels, 2015–16 (annual average)
RECOMMENDATIONS
• All donors should work to urgently increase the overall share and amount of grant-based assistance; and ensure it is prioritized for adaptation and the poorest and most vulnerable countries.
Unspecified
Non-concessional instruments
Concessional non-grants
Grants
2015–16 ANNUAL AVERAGE
$1.6-1.7bn
$14-14.3bn
$19.2-20.8bn
$10.9–12.8bn
Sources: Third Biennial Reports (2018), data in Common Tabular Format tables; own calculations based on OECD (2018a)25
50
40
30
20
10
0
$bn

15
Figure 4 sets out the amounts and proportions of climate finance reported by major donors that was provided in the form of grants and other instruments. It is positive that a number of major donors including the UK, the Netherlands and Sweden provide over 90 percent of their climate finance in the form of grants. France scores the lowest – providing just seven percent of their finance in the form of grants in 2015–16. While this represents an improvement on their two percent in 2013–14, it remains too low.
Source: Third Biennial Reports (2018), data in Common Tabular Format tables
Countries also contribute to climate finance through core finance to multilateral institutions (such as MDBs) but the instrument portfolios of these institutions cannot easily be attributed back to donor contributions, and are therefore not included in this particular breakdown.26 Note that the numbers listed for percentage of grant-based support are different to Table 1, which is focused on bilateral finance only.
i For Japan the range reflects uncertainty around the share of Japan’s grant-based climate finance. Around 8 percent of Japan’s finance is reported as grant only. However, around a third is reported as having mixed instruments, for example grant/non-concessional loans without the proportions of each stated. If one assumes a 50/50 split for such instruments, Japan’s grant-based support is 28 percent of total finance. As a result of this uncertainty, we have provided a range.
Aust
ralia
Cana
da
EU in
stit
utio
ns to
tal
Fran
ce
Germ
any
Denm
ark
Neth
erla
nds
Japa
ni
Norw
ay
Spai
n
Swed
en
Swit
zerla
nd
Unit
ed K
ingd
om
Unit
ed S
tate
s
$ bi
llion
99.6
%
100% 99
%
8-28
%36%
100%
50%
0%
7%
100%
92%
18%
99%
98%
92%
Euro
pean
Com
mis
sion
and
Eur
opea
n De
velo
pmen
t Fun
dEu
rope
an In
vest
men
t Ban
k
Third
Bie
nnia
l Rep
ort n
ot s
ubm
itted
at t
ime
of w
ritin
g
Prov
ided
thro
ugh
othe
r ins
trum
ents
Prov
ided
as g
rant
s
109
87
65
43
21
0
Figure 4: Proportion of climate finance reported as grants by major donors delivered through bilateral and multilateral channels 2015–16 (annual average)

16
5ASSISTANCE FOR ADAPTATION REMAINS TOO LOW AND IS RISING VERY SLOWLY: AN ESTIMATED $9.5BN OF PUBLIC CLIMATE FINANCE WAS DEDICATED TO ADAPTATION IN 2015-16, JUST 20 PERCENT OF TOTAL PUBLIC CLIMATE FINANCE.
Using reported donor numbers, we estimate that in 2015–16, an average of only 20 percent of reported public climate finance was allocated to adaptation, while 71 percent was allocated to mitigation and 9 percent to cross-cutting projects.27 Compared to 2013–14, we estimate adaptation’s share of public climate finance has only increased slightly – from around $8bn, 19 percent of public climate finance per year.28
There is a significant gap between the resources developing countries have to adapt to climate change and the increasing risks they face. These estimates suggest that despite bold promises, developed countries are failing to truly move the needle on adaptation finance.
There needs to be a sharp increase in adaptation support between now and 2020 if developed countries are to come anywhere close to achieving the Paris Agreement goal to ‘balance’ adaptation and mitigation finance,29 as well as making good on the commitment in their $100bn roadmap to significantly increase adaptation finance.30
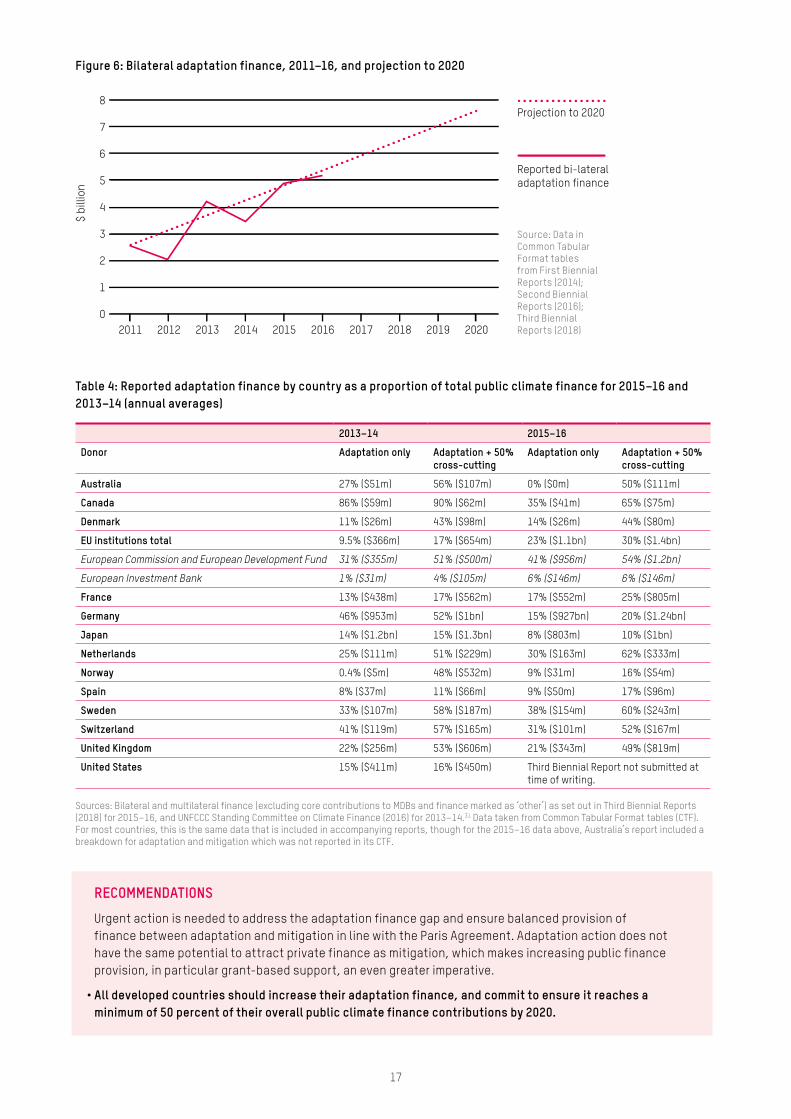
Bilateral flows of public finance demand particular attention. In 2015–16, we estimate that annual bilateral flows for adaptation were only around $5bn (17 percent of total bilateral climate finance); compared to MDB finance, which was $3.6bn (24 percent of total); and multilateral funds, which provided around $1.1bn (41 percent of total). As Figure 6 shows, if bilateral adaptation finance continues to increase at the current slow pace, it will only reach around $7.5bn by 2020.
Table 4 summarizes the adaptation finance provision of major donors in 2013–14 and 2015–16. The Netherlands, Sweden, Canada and Switzerland should be applauded for providing a high share of their finance to adaptation. The EU should also be recognized for having made significant progress in addressing its adaptation finance gap since 2013–14, through European Commission and European Development Fund spending (though spending on adaptation by the EIB remains low at only 6%). For most other countries that allocated a small proportion of their public climate finance to adaptation in the last reporting period, including France and Japan, the gap has persisted. And Germany’s adaptation share has reduced since 2013–14.
20%: Adaptation
71%: Mitigation
9%: Cross-cutting
Figure 5: Global shares of mitigation, adaptation and cross-cutting finance in 2015-16
ClimateFinance
Sources: Third Biennial Reports (2018); own calculations based on OECD (2018a)
17
RECOMMENDATIONS
Urgent action is needed to address the adaptation finance gap and ensure balanced provision of finance between adaptation and mitigation in line with the Paris Agreement. Adaptation action does not have the same potential to attract private finance as mitigation, which makes increasing public finance provision, in particular grant-based support, an even greater imperative.
• All developed countries should increase their adaptation finance, and commit to ensure it reaches a minimum of 50 percent of their overall public climate finance contributions by 2020.
Figure 6: Bilateral adaptation finance, 2011–16, and projection to 2020
Table 4: Reported adaptation finance by country as a proportion of total public climate finance for 2015–16 and 2013–14 (annual averages)
8
7
6
5
4
3
2
1
0
$ bi
llion
2020201920182017201620152014201320122011
Reported bi-lateraladaptation finance
Projection to 2020
2013–14 2015–16
Donor Adaptation only Adaptation + 50% cross-cutting
Adaptation only Adaptation + 50% cross-cutting
Australia 27% ($51m) 56% ($107m) 0% ($0m) 50% ($111m)
Canada 86% ($59m) 90% ($62m) 35% ($41m) 65% ($75m)
Denmark 11% ($26m) 43% ($98m) 14% ($26m) 44% ($80m)
EU institutions total 9.5% ($366m) 17% ($654m) 23% ($1.1bn) 30% ($1.4bn)
European Commission and European Development Fund 31% ($355m) 51% ($500m) 41% ($956m) 54% ($1.2bn)
European Investment Bank 1% ($31m) 4% ($105m) 6% ($146m) 6% ($146m)
France 13% ($438m) 17% ($562m) 17% ($552m) 25% ($805m)
Germany 46% ($953m) 52% ($1bn) 15% ($927bn) 20% ($1.24bn)
Japan 14% ($1.2bn) 15% ($1.3bn) 8% ($803m) 10% ($1bn)
Netherlands 25% ($111m) 51% ($229m) 30% ($163m) 62% ($333m)
Norway 0.4% ($5m) 48% ($532m) 9% ($31m) 16% ($54m)
Spain 8% ($37m) 11% ($66m) 9% ($50m) 17% ($96m)
Sweden 33% ($107m) 58% ($187m) 38% ($154m) 60% ($243m)
Switzerland 41% ($119m) 57% ($165m) 31% ($101m) 52% ($167m)
United Kingdom 22% ($256m) 53% ($606m) 21% ($343m) 49% ($819m)
United States 15% ($411m) 16% ($450m) Third Biennial Report not submitted at time of writing.
Sources: Bilateral and multilateral finance (excluding core contributions to MDBs and finance marked as ‘other’) as set out in Third Biennial Reports (2018) for 2015–16, and UNFCCC Standing Committee on Climate Finance (2016) for 2013–14.31 Data taken from Common Tabular Format tables (CTF). For most countries, this is the same data that is included in accompanying reports, though for the 2015–16 data above, Australia’s report included a breakdown for adaptation and mitigation which was not reported in its CTF.
Source: Data in Common Tabular Format tables from First Biennial Reports (2014); Second Biennial Reports (2016); Third Biennial Reports (2018)

18
6ASSISTANCE FOR LEAST DEVELOPED COUNTRIES REMAINS TOO LOW AND IS RISING SLOWLY: ONLY AN ESTIMATED 18 PERCENT OF PUBLIC CLIMATE FINANCE WENT TO LDCS IN 2015–16.
The biennial reports donors submit to the UNFCCC do not include data on the share of climate finance provided to LDCs, but OECD data provides a good basis for estimating it. The latter indicates that, on average, around 18 percent of total public climate finance went to LDCs in 2015–16. If we assume the same proportion of climate finance reported to the UNFCCC went to LDCs, then this would amount to around $9bn per year.32 This is a small increase compared to the $7.4bn per year we estimated went to LDCs in 2013–14.33
On average, nearly half of the population living in the world’s 48 LDCs live in extreme poverty, compared to 12 percent in other developing countries.34 LDCs’ contribution to global carbon emissions are negligible. However, they are among the hardest hit by climate shocks and stresses, and are least able to respond due to limited institutional capacity and resources to adapt, and economic growth highly dependent on climate-sensitive sectors.
Nine billion per year equates to a mere $190m per LDC if it were shared equally. Urgently and significantly increasing grant-based climate finance to LDCs is essential if they are to receive the support they need, are entitled to and have been promised. LDCs’ ability to attract private investment is extremely limited, and loans are ill-suited to meet the critical adaptation needs of poor and marginalized populations. This is not to mention the principled objection to the use of loans to protect people living in poverty from the excess carbon emissions of rich countries.
Using OECD data, Oxfam’s rough estimate is that of total grant funding for adaptation in 2015–16, LDCs received 48 percent.35 It is positive that LDCs appear to be receiving a justifiably large share of what grant-based adaptation support exists, but the global pot is too small.
Figure 7: Estimated share of climate finance to LDCs in 2015-16
18%: LDCs
82%: Other
ClimateFinance

19
Table 5: Estimated share of finance to LDCs by major donors, 2015–16 (annual average)
Donor Percentage share to LDCs
Australia 23%
Canada 27%
Denmark 40%
EU institutions total 22%
European Commission and European Development Fund 32%
European Investment Bank 8%
France 14%
Germany 11%
Japan 18%
Netherlands 28%
Norway 14%
Spain 21%
Sweden 39%
Switzerland 16%
United Kingdom 32%
United States 20%
RECOMMENDATIONS
Levels of climate finance flowing to LDCs need to increase significantly, above all for adaptation. To achieve this, grant-based support will need to increase.
• UNFCCC rules and reporting guidelines should require donors to report the share of climate finance they are contributing to LDCs and small island developing states.
• All contributing countries should commit to a minimum floor of 25 percent of their public climate finance being dedicated to LDCs by 2018, in line with wider donor commitments on aid that at least 25 percent of aid should go to LDCs.
Source: OECD (2018a)
Estimates of finance directly targeting LDCs.36

20
7CLIMATE FINANCE CONTINUES TO TAKE A GROWING SHARE OF AID: PUBLIC CLIMATE FINANCE AMOUNTED TO 21 PERCENT OF THE TOTAL GLOBAL ODA BUDGET IN 2015–16; THE VAST MAJORITY OF THIS COUNTED TOWARDS DONOR COMMITMENTS TO INCREASE AID TO 0.7 PERCENT OF GNI.
Between the reporting periods 2013–14 and 2015–16, we estimate the increase in climate finance was equivalent to around a third of the increase in overall ODA levels.37 Donor reports show that most climate finance was ODA counted against donor commitments to increase aid to 0.7 percent of gross national income (GNI). This contributed to climate finance rising to 21 percent of the total global ODA budget in 2015–16.38
A central concern of developing countries is that climate finance should be ‘new and additional’ to aid commitments they were already set to receive, such as the UN target to provide 0.7 percent of GNI as aid. Yet, in 2016, only six countries met their commitment to keep ODA at or above 0.7 percent GNI; ODA fell in seven countries; and the DAC member average was only 0.32 percent of GNI.39 Climate finance is rising faster than the overall ODA budgets of some donors, including Japan and the EU, or is being provided in the context of declining aid budgets, as is the case for Australia.40
The climate finance developing countries receive is already at risk of displacing ODA spending on education, health and other lifesaving areas. As we move closer to the $100bn deadline and beyond, it is clear that ODA budgets will not be sufficient to meet rising climate finance costs alongside other critical development needs. For adaptation alone, the UN Environment Programme estimates that, by 2025/30, the costs of adaptation could range from $140bn to $300bn.41 In line with UNFCCC obligations, developed countries would be expected to provide a significant share of this.
Article 4.3 of the UN Climate Convention requires the provision of financial resources to be ‘new and additional’, but there is no internationally agreed definition of what that means. In their reports to the UNFCCC, countries are asked to determine how the finance they provide qualifies. Table 6 summarizes the definitions offered by major donors. Most claim their finance is new and additional because it is newly committed or disbursed during the period being reported. Very few donors state that climate finance comes on top of their commitment to the 0.7 percent target or is in line with a rising aid trajectory.

21
The imperative of developing new sources of climate finance outside traditional ODA budgets demands renewed political attention. New innovative sources of climate finance, such as carbon pricing for shipping and aviation, a financial transaction tax and an equitable fossil fuel extraction levy, are crucial to help address the large and growing gap between existing levels of finance and growing needs.
Table 6: Definitions of ‘new and additional’ given by major donors
Donor Summary of statements in Third Biennial Reports
Australia New and additional budget appropriations passed by the Australian Parliament on an annual basis.
EU, France, Germany, the Netherlands and Japan
Newly committed or disbursed climate finance during the reporting period 2015 and 2016. Or (along similar lines) finance that is new and additional to the financial resources reported in the previous National Communication/Biennial Report. Budgets are approved on an annual basis, therefore representing new and additional resources.
Canada Supporting climate projects that are above and beyond what was planned prior to the Convention and Copenhagen Accord.
Norway and Sweden Total ODA has exceeded 0.7 per cent of GNI, which has covered the increase in climate finance.
Switzerland Increased climate finance and strategic decisions have led to a remarkable progression compared to previous efforts.
UK The provision of climate finance is not resulting in a diversion of wider development spend. The UK has achieved the 0.7 percent GNI target for aid. New climate finance is provided in addition to a growing overall aid budget.
US Third Biennial Report not submitted at time of writing.
RECOMMENDATIONS
Oxfam believes that the provision of climate finance should be additional to aid commitments, which means that funds reported towards meeting UNFCCC obligations should not be reported towards meeting the commitment to give 0.7 percent of GNI as aid.
• As a first step, developed countries should commit to ensure future increases of climate finance that qualify as ODA form part of an overall aid budget that is increasing at least at the same rate as climate finance.
• All countries need to support urgent action to get the most promising new national and international sources of climate finance off the ground. New sources are critical to address the large and widening gap between existing levels of climate finance and growing needs. Possible sources include a financial transaction tax, carbon pricing for international aviation and maritime transport, and domestic or regional carbon pricing/carbon markets, including the allocation of EU emissions trading system revenues to climate finance.
Source: Third Biennial Reports (2018)

22
8COUNTING MOBILIZED PRIVATE FINANCE HAS INCREASED: DONOR REPORTS FOR 2015-16 SHOW AN INCREASE IN THE NUMBER OF COUNTRIES COUNTING MOBILIZED PRIVATE FINANCE AGAINST THEIR CLIMATE FINANCE COMMITMENTS; BUT THERE IS CURRENTLY NO COMMON METHODOLOGY TO ACCOUNT FOR IT.
The Roadmap to US$100 Billion that developed countries published in 2016 assumes that mobilized private finance will provide at least a quarter of climate finance.42 Yet, there is currently no agreement between parties of the UNFCCC on what should be counted and how.38
Over the past decade, donors have increasingly used public finance to mobilize private finance by ‘blending’ the two. For climate change, this is rooted in a recognition that investment in low-carbon resilient development requires both public and private money. Pressured domestic budgets and the desire to promote donor countries’ own commercial interests has also contributed to this trend.43
Fifteen countries and the EU institutions claimed to have mobilized private finance in their 2015–16 reports to the UNFCCC, of which nine countries provided estimates of the amounts mobilized (see Table 7). This compares to only four countries in the 2013–14 reporting period.44 Donors have accounted for this finance in very different ways: France and Japan report overall estimates; Canada only reports estimated private finance mobilized through MDBs; the Netherlands gives figures for several programmes and rough estimates for others. Reports do not disaggregate private finance mobilized for adaptation and mitigation. However, it is notable that most examples documented are for mitigation.
It is vital that new rules for climate finance accounting include modalities for mobilized private finance. The roadmap included principles on how developed countries would report mobilized private finance. These included accounting on a project-by-project basis and reporting only mobilized private finance where there is a clear causal link between public resources from the donor and the subsequent mobilized investment.45 These basic principles should be included in decisions reached at COP24. It is also important that donor countries only claim credit for funds mobilized through public finance (not public interventions), and not claim the share of private finance mobilized due to actions by developing countries.
OVER THE PAST DECADE, DONORS HAVE INCREASINGLY USED PUBLIC FINANCE TO MOBILIZE PRIVATE FINANCE BY ‘BLENDING’ THE TWO.

There is no doubt that the private sector has a crucial role to play in keeping global warming below 1.5°C/2°C, for example by investing in increasingly profitable renewable energy projects. But it is essential that scarce public resources are directed to cutting-edge investments, and projects where there is clear financial additionality in terms of donor finance having been necessary for a project to go ahead.
Finally, it should be noted that the $100bn commitment will only deliver its objectives if all public decisions, from public policies (which can incentivize private investments) to direct funding of both domestic and overseas projects, are consistent with the goals of the Paris Agreement.
Table 7: Information on private finance mobilized in donor reports (2015–16)
Austria $1m in 2016
Australia No estimate
Belgium $13m for the period 2014–17
Canada $234m since 2011 through facilities at MDBs
Denmark $192,000 in 2015; $221,000 in 2016i
European Union (including EIB) No estimate but mentions various funds and blending facilities designed to catalyze private sector investments.
Finland No estimate
France $767m in 2015; $1.1bn in 2016
Germany $395m in 2015. No estimate available yet for 2016i
Japan $3.8bn total over 2015 and 2016
Netherlands $80m in 2015; $189m in 2016, including $130m through MDBs (excluding EIB) in 2016i
Norway No estimate
Spain No estimate
Sweden No estimate
Switzerland No estimate
UK Since 2011, $763m.i For 2015–16: examples of private finance investments with different time periods with full list provided in annex
US Third Biennial Report not submitted at time of writing.
RECOMMENDATIONS
• Parties to the UNFCCC should agree on a collective reporting approach for mobilized private finance that limits the risk of double-counting; it should also include reporting by MDBs.
• Reporting on mobilized private finance should be conservative to build trust and take account of measures undertaken by developing countries themselves to attract investors. No flat leverage ratios should be applied; instead causality between public investment and mobilized private finance should be established on a project-by-project basis.
Source: Third Biennial Reports (2018)The reports of Australia, Finland, Norway, Spain, Sweden and Switzerland list some programmes that mobilize private climate finance. Some mention how much public finance is invested, but none estimate private finance mobilized. i Using OECD exchange rate for 2015, 1US$ = €0.902 = AU$1.331 = DKK 6.728; GBP0.655
2323

24
REFERENCES
All links last accessed April 2018, unless otherwise specified.
Adaptation Watch (Weikmans et al.). (2016). Towards Transparency: The 2016 Adaptation Finance Transparency Gap Report. http://www.adaptationwatch.org/s/Adaptation-Watch-Report-2016-Digital-FIN.pdf
J. Appelt and H.P. Dejgaard. (2017). Counting What Counts: Analysis of Norwegian Climate Finance and International Climate Finance Reporting. Norwegian Church Aid, Rainforest Foundation Norway, WWF Norway and the Norwegian Forum for Development and Environment. www.forumfor.no/assets/docs/Analysis-of-Norwegian-Climate-Finance.pdf
OECD-CPI. (2015). Climate Finance in 2013–14 and the USD 100 billion goal: A report by the OECD in collaboration with Climate Policy Initiative. www.oecd.org/env/cc/OECD-CPI-Climate-Finance-Report.pdf
OECD. (2016). Attribution of multilateral climate finance in the report “Climate Finance in 2013−14 and the USD 100 billion goal”. www.oecd.org/environment/cc/Explanatory-note-attribution-TWGmethodology-climate-finance.pdf
OECD. (2018a). Climate Change: OECD DAC External Development Finance Statistics. www.oecd.org/dac/stats/climate-change.htm
OECD. (2018b). Official Development Assistance 2017 – Preliminary Data. www2.compareyourcountry.org/oda?cr=20001&cr1=oecd&lg=en&page=1
T. Carty, J. Kowalzig and A. Peterson. (2016). Climate Finance Shadow Report 2016: Lifting the lid on progress towards the $100 billion commitment. Oxfam briefing paper. policy-practice.oxfam.org.uk/publications/climate-finance-shadow-report-2016-lifting-the-lid-on-progress-towards-the-100-620138
UN Environment Programme (UNEP). (2016). The Adaptation Gap Report 2016: The adaptation finance gap. http://web.unep.org/adaptationgapreport/2016
First Biennial Reports (2014) submitted to the UNFCCC covering the period 2011–12 can be found here: unfccc.int/national_reports/biennial_reports_and_iar/submitted_biennial_reports/items/9356.php
Second Biennial Reports (2016) submitted to the UNFCCC covering the period 2013–14 can be found here: unfccc.int/national_reports/biennial_reports_and_ iar/submitted_biennial_reports/items/7550.php
Third Biennial Reports (2018) submitted to the UNFCCC covering the period 2015–16 can be found here (accessed February 2018): https://unfccc.int/process/transparency-and-reporting/reporting-and-review-under-the-convention/national-communications-and-biennial-reports-annex-i-parties/submitted-biennial-reports-brs-from-annex-i-parties
UNFCCC. (2016). UNFCCC Standing Committee on Climate Finance: 2016 Biennial Assessment and Overview of Climate Finance Flows (includes summary of First and Second Biennial Reports in Annex F). http://unfccc.int/files/cooperation_and_support/financial_mechanism/standing_committee/application/pdf/2016_ba_technical_report.pdf
Roadmap to US$100 Billion. (2016). https://www.gov.uk/government/publications/climate-finance-roadmap-to-us100-billion
25
NOTES All links last accessed April 2018, unless otherwise specified.
1 The $100bn commitment is set out in both the Copenhagen Accord (2009): https://unfccc.int/documentation/documents/advanced_search/items/6911.php?priref=600005735#beg; and the Cancun Agreements (2010): http://unfccc.int/resource/docs/2010/cop16/eng/07a01.pdf
2 See endnote 13 for a breakdown of data used to make this calculation.
3 See Table 20 in OECD. (2017). Statistics on resource flows to developing countries. http://www.oecd.org/dac/stats/statisticsonresourceflowstodevelopingcountries.htm The average grant elements of ODA loans as recorded by the OECD for 2015–16 are: Australia 73.7%; Belgium 87.9%; Canada 17.8%; France 53.8%; Germany 46.5%; Italy 94%; Japan 78.7%; Poland 80%; Slovak Republic 64.1%; UK 60.6%. For countries not listed, we applied the average for the DAC countries listed in Table 20 (minus Korea) 65.7%. For funds in which the instrument was not specified, we further assumed that half of those funds were concessional and the other half non-concessional. Equity is counted as fully grant-equivalent in line with OECD.
4 Those classified as ‘Rio Marker 1’ projects under the OECD DAC categorization.
5 Such as the cost involved in building a hospital and making it flood resistant – only the additional cost of making the hospital flood resistant should count as adaptation finance, not the full cost of building the hospital.
6 The Rio Markers were introduced to track the mainstreaming of the Rio Convention into development action – they were not designed to monitor financial pledges.
7 In 2016, the DAC required that, starting with 2018 data, the new grant-equivalent measure will become the standard for reporting, with the headline ODA figures published on that basis. OECD. (2016). Converged statistical reporting directives for the creditor reporting system (CRs) and the annual DAC questionnaire: Chapters 1–6. https://www.oecd.org/dac/financing-sustainable-development/development-finance-standards/DCDDAC(2016)3FINAL.pdf
8 E. Wilkinson. (2018) Towards a more resilient Caribbean after the 2017 hurricanes. Overseas Development Institute working paper. https://www.odi.org/publications/11076-towards-more-resilient-caribbean-after-2017-hurricanes
9 J-A. Richards and S. Bradshaw. (2017). Uprooted by climate change: Responding to the growing risk of displacement. Oxfam briefing note. https://policy-practice.oxfam.org.uk/publications/uprooted-by-climate-change-responding-to-the-growing-risk-of-displacement-620357
10 UNEP. (2016). Op cit.
11 F. Baarsch et al. (2015). Impacts of low aggregate INDCs ambition: Research commissioned by OXFAM, Technical summary. Climate Analytics. https://www.oxfam.org/en/research/impacts-low-aggregate-indcs-ambition
12 Roadmap to US$100 Billion. (2016). Op cit.
13 We used available data on what donors have reported for public climate finance in 2015–16, and in broad terms compiled it the way OECD (2015) did for the Roadmap to US$100 Billion (2016). We used Third Biennial Reports for bilateral funds (excluding EIB and export credits) for $29.5bn; developed country attributed MDB finance (including EIB) as recorded in OECD (2018a) at $15.5bn; multilateral climate funds (Green Climate Fund, Climate Investment Funds, Adaptation Fund) as recorded in OECD (2018a) at $1.4bn; other multilateral institutions (Global Environment Facility, Global Green Growth Institute, International Fund for Agricultural Development, Nordic Development Fund) at $1.3bn. We estimated imputed contributions to MDBs institution-specific percentages provided in OECD (2016). The United States has not yet submitted a Third Biennial Report; therefore we used the 2013–14 levels set out in their Second Biennial Report to estimate bilateral flows. An assumption that levels of climate finance remained constant is based on a recognition that third reporting period (2015–16) was still under the Obama administration. Developed countries’ $100bn Roadmap (2016) did not include climate finance for efficient coal in 2013–14 (even though Australia and Japan included it in their Second Biennial Reports). Third Biennial Reports (2018) appear to include some climate finance for efficient coal (provided by Japan), but lack of data in the report means it is not possible to calculate what this amounts to in order to subtract it from the total.
14 It should be noted that there are some confusing and possibly distorting elements in some biennial reports about which the OECD was able to consult with countries in a way that we have not.
15 The adaptation range is rounded up from $4.8–6.6bn. It increases to $6–8.4bn if 50 percent of cross-cutting finance is also included. See Box 1 and endnote 16 for details of how we calculated net climate-specific assistance and why we used OECD data.
16 Countries’ biennial reports do not provide the data required to formulate Oxfam’s estimate of net climate-specific assistance (because bilateral finance is already discounted for Rio Marker 1 projects), therefore figures are calculated using OECD data for 2015–16 as a proxy. While OECD data constitutes the basis of most developed countries’ reporting to the UNFCCC, these numbers do not equal the exact climate finance figures for their biennial reports. However, they are close enough to be a reasonable basis on which to estimate.

26
17 Up to $4bn is estimated by comparing the individual Third Biennial Report reporting for countries and their calculation method compared to the high-end estimation of net climate-specific assistance for each country by Oxfam. The difference is primarily a result of higher reported figures in Third Biennial Reports for some countries (but it is unclear exactly what these additional funds include), as well as some donors reporting climate finance based on disbursements, whereas Oxfam’s estimate is based solely on commitments.
18 See endnote 7.
19 OECD. (2018a). Op cit.
20 Weikmans, R. et al. (2017). Assessing the credibility of how climate adaptation aid projects are categorized, Development in Practice, vol. 27, n°4, p. 458-471.
21 In 1998, OECD DAC set up the Rio Marker system to track development finance flows following the themes of the Rio Convention: biodiversity, desertification, climate change mitigation, and climate change adaptation. Rio Marker 1 projects indicate a theme is a ‘significant’, but not primary, objective of the project. Rio Marker 2 projects indicate a theme is a ‘principle’ objective and a main motivation for establishing the project.
22 For 2013–14 we estimated $10bn was provided in the form of grants, which was around 25 percent. See T. Carty, J. Kowalzig and A. Peterson (2016). Breakdown of total $10.9–12.8bn: Bilateral support from Third Biennial Reports (2018) $9.6–11.4bn; for US grant-based support, the same levels as 2013–14 were assumed using Second Biennial Reports (2016) $0.77bin; MDBs from OECD (2018a) imputed contributions estimated using the latest available institution-specific percentages from OECD (2016) $146m; and other multilaterals from OECD (2018a) $1.19bn, assuming Rio Marker 1 climate significant projects at 50 percent. See endnote 13 for our justification in using the Second Biennial Report of the United States to estimate bilateral finance.
23 Private finance favours richer developing countries because they are more capable of absorbing private investment. The resilience of poor people to climate change relies on basic essential services and public goods that require public finance. The poorest are also often badly connected to markets, and community-based adaptation approaches that do not generate internal returns are unlikely to attract private sector investment. See T. Carty (2013). Adaptation and the $100 billion Commitment: Why private investment cannot replace public finance in critical climate adaptation. Oxfam issue brief. https://policy-practice.oxfam.org.uk/publications/adaptation-and-the-100-billion-commitment-why-private-investment-cannot-replace-305370
24 Rising to 56% if grant-based, cross-cutting finance is included. OECD (2018a) assuming Rio Marker 1 climate-significant projects at 50%.
25 In line with the method set out in endnote 13, we used available data on financial instruments in 2015–16: Third Biennial Reports for bilateral funds, plus developed-country-attributed MDB and multilateral climate funds and other institutions as recorded in OECD (2018a). We estimated imputed contributions using the latest available institution specific percentages provided by OECD (2016). We classified equity under ‘concessional non-grant’. The ranges reflect uncertainty around the share of Japan’s grant-based finance. See explanatory notes for Table 1.
26 On the whole, donors do not include core contributions to MDBs or multilateral institutions in the list of climate-specific support to multilaterals in tables 7(a) of their biennial reports, but among major donors we noted that Austria, the Netherlands and Spain have done so in their Third Biennial Reports.
27 In line with the method set out in endnote 7, we used available data on public climate finance that donors have reported for adaptation, mitigation and cross-cutting finance in 2015–16. Even if half of the cross-cutting finance is allocated to adaptation, it would still only represent 24 percent of total public climate finance.
28 Calculated using reported public climate finance data in OECD-CPI (2015). If 50 perecent of cross-cutting climate finance is also included, it rises to around 24%. Of total climate finance (i.e. also including private finance mobilized and export credits), in 2013–14 the share of finance to adaptation was 16% OECD-CPI (2015). We have not estimated non-public finance and therefore have not estimated the equivalent percentage for 2015–16.
29 Paris Agreement Article 9, paragraph 4. https://unfccc.int/sites/default/files/english_paris_agreement.pdf
30 The Roadmap to US$100 Billion (2016) committed to significantly increase adaptation support. It also committed to double adaptation finance between 2014 and 2020, which Oxfam’s considers to be insufficient.
31 See endnote 26.
32 We used OECD data (2018a) for estimates, as countries’ biennial reports do not include a breakdown of recipient countries by income group. This includes MDBs and all developing country donors’ contributions to bilateral finance and multilateral climate funds. This estimate assumes Rio Marker 1 climate-significant projects at 50 percent. It is uncertain what proportion of regional/unspecified recipient flows LDCs receive, but if one assumed a share in line with what LDCs receive as direct recipients, our estimate is LDCs global share of public climate finance may rise to 21 percent.
33 T. Carty, J. Kowalzig and A. Peterson. (2016).
34 Representing 13 percent of the world’s population. Extreme poverty is here defined as the proportion of people living on less than $1.90 per day. OECD. (2016). Taking stock of aid to least developed countries (LDCs). https://www.oecd.org/dac/financing-sustainable-development/Taking-stock-of-aid-to-least-developed-countries.pdf

35 OECD data does not perfectly match data reported in biennial reports, therefore this is an estimate.
36 Calculated using the approach set out in endnote 32.
37 We estimate aggregated donor reports show an increase in annual public climate finance of $7bn: from $41bn in 2013–14 to $48bn in 2015–16. Over the same period, ODA rose by $21.5bn. See OECD (2018b).
38 OECD. (2018a). Op cit.
39 In 2016, the largest ODA declines were seen in Australia, Finland, the Netherlands and Sweden. Norway, Sweden, Luxembourg, Denmark, Germany and the UK were meeting their 0.7 GNI commitment. Twenty-three other donors were under the threshold. OECD. (2017, April 11). Development aid rises again in 2016 but flows to poorest countries dip. http://www.oecd.org/dac/financing-sustainable-development/development-aid-rises-again-in-2016-but-flows-to-poorest-countries-dip.htm
40 Comparing 2013–14 averages with 2015–16 averages shows: Japan’s aid increased by $230m while their climate finance increased by $1.8bn; EU institution’s aid (including EIB) increased by $900m while their climate finance increased by $1.68bn (around 40 percent of this was classified as other official flows (OOF) and other, nonetheless climate finance counted as ODA still slightly exceeded overall increases in aid over the period); Australia’s aid declined by $420m while climate finance increased by $33m. Sources: OECD (2018b); Third Biennial Reports (2018); Second Biennial Reports (2016).
41 UNEP. (2016). Op cit.
42 The roadmap estimated that $67bn of funding will come from public finance while the other $26–66bn will come from mobilized private finance. The latter wide range derives from applying different private-public finance ratios and project mixes. Roadmap to US$100 Billion. (2016).
43 For more information, see: Eurodad. (2017). Private-finance blending for development: Risks and opportunities. Oxfam briefing paper. https://www.oxfam.org/sites/www.oxfam.org/files/bp-private-finance-blending-for-development-130217-en.pdf
44 T. Carty, J. Kowalzig and A. Peterson. (2016). Op cit.
45 See the Joint Statement on Tracking Progress Towards the $100 Billion Goal written by developed country governments: http://www.news.admin.ch/NSBSubscriber/message/attachments/40866.pdf in Paris on 6 September 2015.
2727

28
© Oxfam International May 2018
This paper was written by Tracy Carty and Armelle le Comte. Oxfam gratefully acknowledges the assistance of Hans Peter Dejgaard, Jonas Appelt and Mikkel Frederiksen from INKA Consult who carried out most of the technical analysis underpinning this report. Oxfam would also like to thank Jan Kowalzig, Bertram Zagema, Simon Bradshaw, Simon Hernandez-Arthur, Robin Willoughby, Gideon Rabinowitz, Ruth Segal, Julie Seghers, Jesse Young, Kristen Hite, Prof. J Timmons, Joe Thwaites, Sarah Conway and Romain Weikmans.
For further information on the issues raised in this paper please email [email protected]
This publication is copyright but the text may be used free of charge for the purposes of advocacy, campaigning, education, and research, provided that the source is acknowledged in full. The copyright holder requests that all such use be registered with them for impact assessment purposes. For copying in any other circumstances, or for re-use in other publications, or for translation or adaptation, permission must be secured and a fee may be charged.
E-mail [email protected].
The information in this publication is correct at the time of going to press.
Published by Oxfam GB for Oxfam International under ISBN 978-1-78748-238-8 in May 2018.DOI: 10.21201/2018.2388
Oxfam GB, Oxfam House, John Smith Drive, Cowley, Oxford, OX4 2JY, UK.


![Climate Finance Gaps and Challenges - UNESCAP 5. Climate finance gaps...Climate Finance Gaps and Challenges ... protection, disaster risk reduction) ... Lending interest rate [%] OECD](https://img.pdfslide.us/doc/110x75/5ab54ce47f8b9a156d8ca701/climate-finance-gaps-and-challenges-5-climate-finance-gapsclimate-finance.jpg)