Embed Size (px)
Citation preview

Olmsted County, Rochester, MN 55904 | 507-328-7100
NOTICE You are hereby notified of the Rochester-Olmsted Council of Governments meeting to be held on Wednesday, June 24, 2020 at 12:00 PM in Skype Meeting located at Olmsted County, Rochester, MN 55904.
I. ADMINISTRATIVE BUSINESS 1. Call the meeting to order
2. Approve minutes of May 27, 2020, meeting
II. AGENDA ITEMS 1. 2045 Long Range Plan Background Review: Chapter 12 Financial Assessment – Transit and
Commuter Parking element (Informational)
2. 2045 Long Range Plan Background Review: Chapter 11 Financial Assessment – Street and Highway Network (Informational)
III. OTHER BUSINESS 1. Retirements (Informational)
2. Surface Transportation Reauthorization (Informational)
3. As may be brought up by Members
IV. ADJOURNMENT 1. PowerPoint Presentations
AGENDA

DRAFT
Minutes of the regular meeting of the Rochester-Olmsted Council of Governments held at 12:00 p.m. via Skype on Wednesday, May 27, 2020 in Conference Room A located at 2122 Campus Drive S.E., Rochester, MN 55904.
Members Present: Mr. Lenny Laures (Chair), Townships Mr. Ken Brown (Vice-Chair), County Commissioner Mr. Mark Thein, County Commissioner Mr. Greg Wright, County Commissioner Mr. Mark Bilderback, Rochester City Council Mr. Randy Staver, Rochester City Council Mr. Nick Campion, Rochester City Council Mr. Bill Schimmel, Small Cities Ms. Kelly Leibold, Small Cities Mr. John Johnson, Townships Mr. Jeff Kappers, School District #535 Mr. Gene Peters, Resident Representative Ms. Regina Mustafa, Resident Representative Mr. Patrick Keane, Rochester City Council Ms. Kim Norton, Mayor, City of Rochester
Members Absent: Ms. Mary Blair-Hoeft, Small Cities
Staff Present: Mr. Ben Griffith, ROCOG Executive Director Mr. Dave Pesch, Transportation Planning Coordinator Mr. Bryan Law, Principal Transportation Planner Mr. Muhammad Khan, Principal Transportation Planner Ms. Jennifer Garness, Executive Support Supervisor Mr. Charlie Reiter, Principal Transportation Planner Ms. Sandi Goslee, Principal Planner Mr. Jeff Ellerbusch, Planning Policy and Analysis Supervisor
Others Present: Ms. Heidi Welsch, County Administrator Mr. Michael Sheehan, Deputy County Administrator Mr. Aaron Parrish, Rochester Assistant Administrator Ms. Kaye Bieniek, Director of Olmsted County Public Works
1.2
Packet Pg. 2

DRAFTRochester-Olmsted Council of Governments May 27, 2020 Page 2
2
Ms. Bobbi Retzlaff, MnDOT Planning Program Coordinator Ms. Megan Neeck, MnDOT Planning Program Coordinator Ms. Heather Lukes, MnDOT District 6 Planning Director Ms. Voni Vegar, MnDOT, Small Urban Transit Grant Manager Mr. Ben Johnson, Olmsted County Assistant County Engineer Mr. Greg Paulson, MnDOT Mr. Dillon Dombrovski, Rochester City Engineer Mr. Sam Budznya, Rochester City Traffic Engineer Ms. Ia Xiong, Rochester Physical Development Manager Mr. Jarrett Hubbard, City of Rochester Project Manger Ms. Jaymi Wilson, City of Rochester Project Manager Mr. Logan Tjossem, WSN Consulting Mr. Patrick Seeb, DMC - EDA Ms. Karen Cohen, Rochester Pedestrian and Bicycle Advisory Committee Mr. Michael Wojcik, Rochester City Council
ADMINISTRATIVE BUSINESS: Mr. Laures, Chair, called the meeting to order at 12:00 pm.
Mr. Thein moved to approve the minutes of May 13, 2020. Mr. Wright seconded the motion. The motion carried unanimously.
PUBLIC HEARING: 1. Public Hearing to Amend the 2040 Long Range Transportation Plan to
Include the Rapid Transit Locally Preferred Alternative (LPA)
Mr. Pesch presented his May 23, 2020 and March 27, 2020 memos which are on file at the Olmsted County Planning Department and attached to the official meeting packet on the meeting portal. His memo and presentation discussed:
• Purpose of project and implementation phases. • All projects that are eligible to use federal highway or federal transit funds (or are
regionally significant) must be shown in the MPO transportation plan and in the Transportation Improvement Program when funds are programmed.
• March and April ROCOG meetings were canceled and the public input process was extended from March 23 to May 27, 2020 due to COVID-19.
• A new Phased approach to implementing the LPA was approved by the Rochester City Council on May 4 and that information was extended to the public via ROCOG public input measures.
1.2
Packet Pg. 3
DRAFTRochester-Olmsted Council of Governments May 27, 2020 Page 3
3
• City of Rochester and agency partners to apply in September 2020 to the Small Starts program of the Federal Transit Administration to begin the process of implementing the Rapid Transit system in the downtown Rochester area.
• One public comment was received and responded to as of May 16, 2020 from Ms. Karen Cohen.
Ms. Leibold expressed appreciation for packet materials and refresher on elements within the project.
Ms. Norton joined the meeting.
Mr. Wright questioned if the parking plan in Phase 1 had any bearing on the application.
Mr. Pesch responded that only the West Village would have commuter parking.
Mr. Staver stated that it should not be perceived as a Mayo Clinic parking strategy as there are other phases of the project. He explained the need for timeline changes and phasing of project due to current pandemic and recovery efforts.
Ms. Leibold stated that the transit line would help with projected growth in downtown Rochester and solve immediate needs.
Mr. Johnson questioned whether Phase 2 would include another public hearing and public comment period.
Mr. Pesch stated that, by having the full Locally Preferred Alternative (LPA) in the 2045 Long Range Transportation Plan that will be adopted in September, it provides the base documentation for the City of Rochester to submit another application for Phase 2. Therefore, an amendment would not be needed and a 45-day comment period would not be required.
Mr. Laures questioned what would happen with phases of the project if property were sold prior to implementation due to financial constraints.
Mr. Reiter stated that the City of Rochester has made a commitment to areas served by the south leg to facilitate further planning involving redevelopment of some sites. They plan to engage the community in a long-range transportation and land use planning project and reviewing all options for rapid transit corridor.
Mr. Laures asked if it binds Olmsted County from doing anything in the future with regard to their property regarding the east transit village.
1.2
Packet Pg. 4

DRAFTRochester-Olmsted Council of Governments May 27, 2020 Page 4
4
Mr. Pesch responded it would not. He explained that everything in the LPA is subject to study over time. The ROCOG Long Range Plan doesn’t bind any particular land use by LPA being part of the plan.
Mr. Laures opened the public hearing. No one came forward.
Mr. Bilderback moved to close the public hearing. Mr. Johnson seconded the motion. The motion carried unanimously.
Mr. Pesch described the resolution and supporting documentation.
Mr. Brown moved to approve Resolution 2020-08 Amending ROCOG 2040 Long Range Transportation Plan Re-affirmation to include the Rapid Transit Locally Preferred Alternative (PA). Ms. Mustafa seconded the motion. The motion carried unanimously.
OTHER AGENDA ITEMS: 1. Financial Assessment of the Active Transportation Network for the 2045
Long Range Transportation Plan (LRTP)
Mr. Reiter presented his May 20, 2020 memo which is on file at the Olmsted County Planning Department and attached to the official meeting packet on the meeting portal. His memo and presentation discussed:
• Federal guidelines for MPO long range transportation plans • Expected federal funding • Expected state funding • Expected local funding • Analysis of historic City of Rochester funding • Estimated City of Rochester funding for active transportation • Evaluation of costs associated with preservation of existing system • Trail and path
o Network o Statistics o Treatment costs
• Transportation bridges • Costs for future active transportation development improvements • Location and implementation category of projects • Assessment of implementation feasibility • Summary of program costs by primary implementation category
1.2
Packet Pg. 5
DRAFTRochester-Olmsted Council of Governments May 27, 2020 Page 5
5
• List of future active transportation projects proposed for inclusion into long range plan • Preliminary fiscal constraint finding
Mr. Peters asked if there are fees for bicyclists for local match.
Mr. Reiter responded no.
Mr. Laures recognized Mr. Reiter for the overwhelming task of categorizing, summarizing, and putting materials together for a constrained budget.
2. Preliminary Discussion of Financial Assessment of the Transit Element of the 2045 Long Range Transportation Plan (LRTP)
Mr. Reiter gave a PowerPoint presentation discussing the financial assessment of the transit element of the 2045 LRTP. This presentation is on file at the Olmsted County Planning Department. His presentation discussed:
• Today’s transit overview o 2 systems: fixed route w/direct service and dial-a-ride w/taxi component o Ridership o Operations and costs o Capital costs
• Tomorrow’s transit / system components o Neighborhood fixed route expansion o Expanded need for commuter service o Mode shifts
Mr. Keane and Mr. Campion left the meeting.
o Permanent park and ride hubs o Downtown rapid transit serving inner park and ride hubs o Primary transit network
Due to time constrains, Mr. Reiter stated he would need to continue his presentation with the board at their next meeting.
Ms. Leibold asked for a copy of the PowerPoint presentation.
Mr. Reiter stated that staff would email the presentation to the members.
1.2
Packet Pg. 6

DRAFTRochester-Olmsted Council of Governments May 27, 2020 Page 6
6
OTHER BUSINESS: 1. August 2020 ROCOG meeting will change from August 26 to August 19
Mr. Griffith explained that the August ROCOG meeting would need to be changed to August 19th due to a 30-day notice requirement for the Long Range Transportation Plan (LRTP). He indicated that Ms. Garness would send a revised meeting invitation to members.
2. As may be brought up by Members
There was no further business.
ADJOURNMENT: Ms. Mustafa moved to adjourn the meeting. Mr. Bilderback seconded the motion. The meeting adjourned at 1:41 pm.
__________________________________ Lenny Laures, ROCOG Chair
__________________________________ Ben Griffith, ROCOG Executive Director
jlg
1.2
Packet Pg. 7

Memo Date: 6/18/2020 To: ROCOG Policy Board From: Charlie Reiter / Principal Transportation Planner Subject: 2045 Long Range Plan Background Review
Financial Assessment – Transit and Commuter Parking element (Chapter 12) Action: Review and Comment
Contents
Background ..................................................................................................................... 2
Financial Assessment Summary ........................................................................................ 3
Introduction to Financial Review ....................................................................................... 8
Overview of Federal - State - Local Transit Funding ........................................................... 9
Federal Transit Funds ................................................................................................... 9
State Funds ............................................................................................................... 12
Local Funds................................................................................................................ 15
Prospectus for Future Transit Services ............................................................................ 18
2021-2045 Prospectus for ZIPS Dial – A – Ride Service .................................................... 18
2021-2045 Prospectus for Fixed Route Neighborhood Service ........................................... 20
2021-2045 Prospectus for Downtown Rapid Transit ......................................................... 22
2021-2045 Prospectus for Commuter Parking Demand / Rochester Park & Ride Facilities ... 27
Investing in Park and Ride Capacity ............................................................................. 29
2021 Prospectus for Commuter Direct / Express Transit Service ....................................... 34
2021-2045 Prospectus for the Primary Transit Network (PTN) .......................................... 35
Appendix: Funding Risks ............................................................................................. 39
2.1
Packet Pg. 8

Chapter 12: Transit Financial Assessment 2
Background
Federal guidelines for MPO Long Range Transportation Plans require a financial assessment be included that discusses system-level estimates of costs associated with operation of federally supported transit system(s) and likely sources and magnitude of revenues that may be available to support the system(s). This information forms the basis of a “Fiscally Constrained Plan” finding that demonstrates the amount of investment that can be supported by historically available funding or potential new revenue sources for which there is a level of certainty regarding availability in the future.
The fiscal constraint finding is important in the subsequent programming of federal dollars in that projects programmed for federal funding in the Transportation Improvement Program (TIP) need to be consistent with the fiscally constrained Plan. Transit is somewhat unique in that allocation of federal transit dollars is to the state, not individual public transit authorities, and the allocation of these federal dollars along with state transit dollars occurs through a collaborative process involving the MnDOT State Transit Office and public transit authorities. Funding allocation recommendations are forwarded on to Area Transportation Partnerships (ATP) and MPO’s for inclusion in the TIP/STIP. A limited amount of federal highway dollars can also be flexed and used for transit capital investment; final decisions regarding use of these Surface Transportation Block Grant funds rest with the ATP (with MPO concurrence) as these bodies are responsible for final distribution of the MNDOT share of federal highways funds allocated to District 6. Rochester also enters an era where success in seeking discretionary federal funds through competitive grant programs will be important for development of new services such as the Downtown Rapid Transit project and the Primary Transit Network.
In the 2045 Plan the variety and complexity of transit service expands as one looks to the future as transit is no longer simply to a traditional fixed route service and dial-a-ride service for eligible elderly and handicapped users. The next 25 years are expected to see the notable change in the transit services as a Downtown Rapid Transit Line is developed, the City of Rochester transitions from a Park and Ride program where parking capacity is leased from private businesses to one where Rochester establishes permanent park and ride hubs along major regional highways, and the initial phases of a Primary Transit Network as identified in the 2018 City of Rochester Comprehensive Plan emerge. These expanded and new services will by necessity expand the variety of funding sources that need to be considered, and may necessitate the need for consideration of different funding models for operating certain services, particularly related to serving commuters.
2.1
Packet Pg. 9
Chapter 12: Transit Financial Assessment 3
Financial Assessment Summary
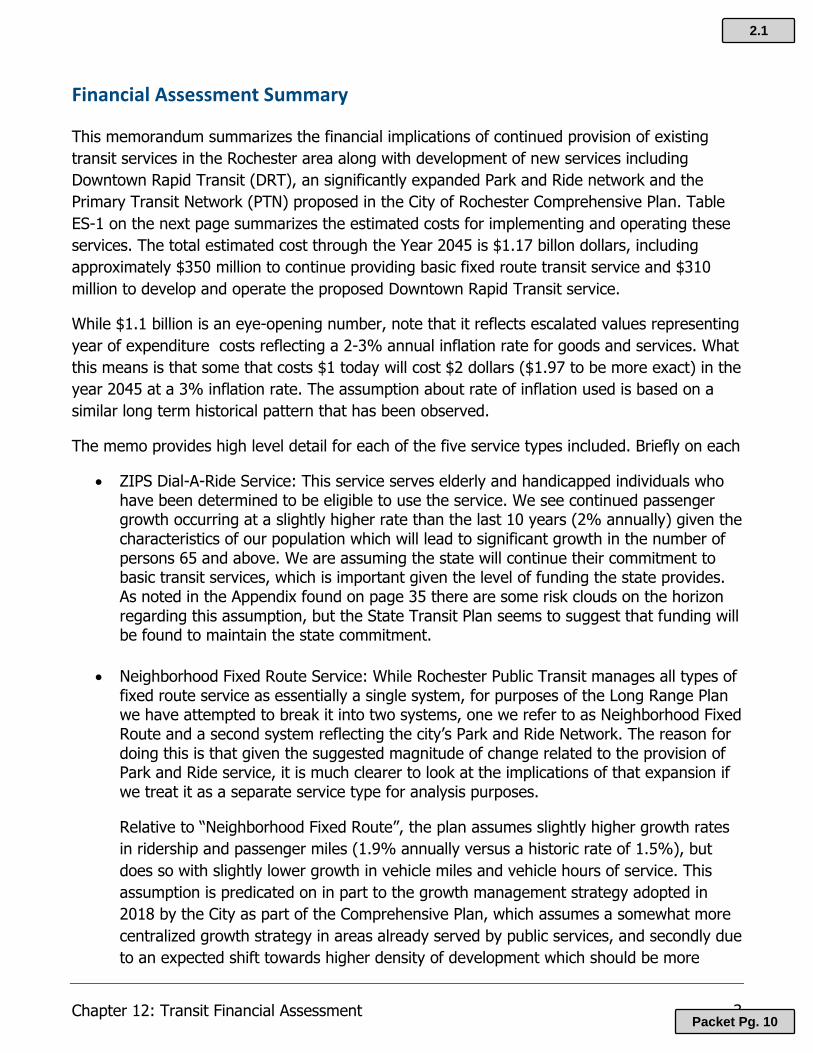
This memorandum summarizes the financial implications of continued provision of existing transit services in the Rochester area along with development of new services including Downtown Rapid Transit (DRT), an significantly expanded Park and Ride network and the Primary Transit Network (PTN) proposed in the City of Rochester Comprehensive Plan. Table ES-1 on the next page summarizes the estimated costs for implementing and operating these services. The total estimated cost through the Year 2045 is $1.17 billon dollars, including approximately $350 million to continue providing basic fixed route transit service and $310 million to develop and operate the proposed Downtown Rapid Transit service.
While $1.1 billion is an eye-opening number, note that it reflects escalated values representing year of expenditure costs reflecting a 2-3% annual inflation rate for goods and services. What this means is that some that costs $1 today will cost $2 dollars ($1.97 to be more exact) in the year 2045 at a 3% inflation rate. The assumption about rate of inflation used is based on a similar long term historical pattern that has been observed.
The memo provides high level detail for each of the five service types included. Briefly on each
• ZIPS Dial-A-Ride Service: This service serves elderly and handicapped individuals who have been determined to be eligible to use the service. We see continued passenger growth occurring at a slightly higher rate than the last 10 years (2% annually) given the characteristics of our population which will lead to significant growth in the number of persons 65 and above. We are assuming the state will continue their commitment to basic transit services, which is important given the level of funding the state provides. As noted in the Appendix found on page 35 there are some risk clouds on the horizon regarding this assumption, but the State Transit Plan seems to suggest that funding will be found to maintain the state commitment.
• Neighborhood Fixed Route Service: While Rochester Public Transit manages all types of
fixed route service as essentially a single system, for purposes of the Long Range Plan we have attempted to break it into two systems, one we refer to as Neighborhood Fixed Route and a second system reflecting the city’s Park and Ride Network. The reason for doing this is that given the suggested magnitude of change related to the provision of Park and Ride service, it is much clearer to look at the implications of that expansion if we treat it as a separate service type for analysis purposes.
Relative to “Neighborhood Fixed Route”, the plan assumes slightly higher growth rates in ridership and passenger miles (1.9% annually versus a historic rate of 1.5%), but does so with slightly lower growth in vehicle miles and vehicle hours of service. This assumption is predicated on in part to the growth management strategy adopted in 2018 by the City as part of the Comprehensive Plan, which assumes a somewhat more centralized growth strategy in areas already served by public services, and secondly due to an expected shift towards higher density of development which should be more
2.1
Packet Pg. 10

Chapter 12: Transit Financial Assessment 4
efficient to serve. Here again, with neighborhood fixed route being part of the “basic” transit service provided to the community, we assume the state will continue it’s past commitment to funding this service at a similar level as in the past.
• Downtown Rapid Transit: As the recent amendment to the current ROCOG Long Range Plan demonstrated, the City has a reasonable funding plan in place related to rapid transit development using existing funding sources, and is currently actively engaged in developing a plan to support annual operating costs to submit as part of the Federal Small Starts application they will submit this fall. Thus we assume this particular service program is financially constrained at this point, recognizing work is ongoing related to the plan for funding ongoing operations.
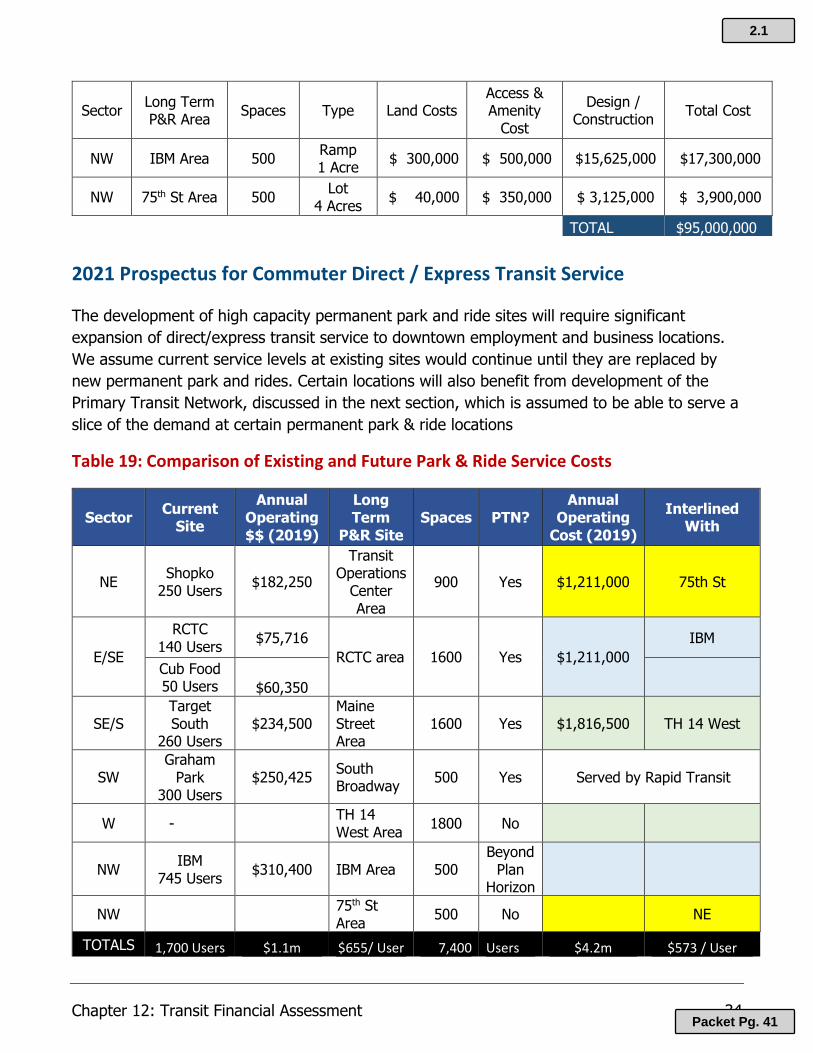
• Commuter Parking Development and Express Park and Ride Bus: The Long Range Plan
describes a program for developing 7400 new spots for commuter parking over the horizon of the plan, largely around the periphery of the city, along with peak period express bus service to bring users into downtown.
Given the tradeoff between the higher cost of building a parking ramp (typically at a cost of around $25,000 per parking space) and building a surface lot (typically at a cost of around $5000 per space), we assume for the most part these parking facilities will be surface lots at least in their first iteration. The estimated cost of full development of 7400 spaces is approximately $74 million dollars in. The plan includes a scenario planning exercise that evaluates the phasing in of parking capacity at different points in time at the various locations given expected demand for commuter parking from different regional geographic sectors, which was studied as part of the City’s 2017 Transit Development Plan. Given that the MNDOT Area Transportation Partnership has funded proposed park and ride facility development in the past (the 75th St NW park and ride being the most recent example), we believe most of these facilities will be supported in part by federal funding, and that DMC Transit Aid being provided by Olmsted County and the State of Minnesota can also contribute to development.
With the greatly expanded capacity will come the need for an expanded fleet of buses over time to serve these users; it is expected the vehicle of choice will be 60’ articulated Electric Buses at a cost of $82 million (which includes first purchase and some replacement purchases). Based on the literature ROCOG has reviewed it is possible this cost is an overestimate, as individuals in the bus manufacturing industry believe the cost of vehicles will decline over the next 10-15 years as the technology matures and demand grows.
Finally, in regards to operating cost, the plan assumes Rochester will use the same model currently used for park and ride operations where a combination of user fees and employer contributions will provide most of the funding to operate the service. Overall,
2.1
Packet Pg. 11
Chapter 12: Transit Financial Assessment 5
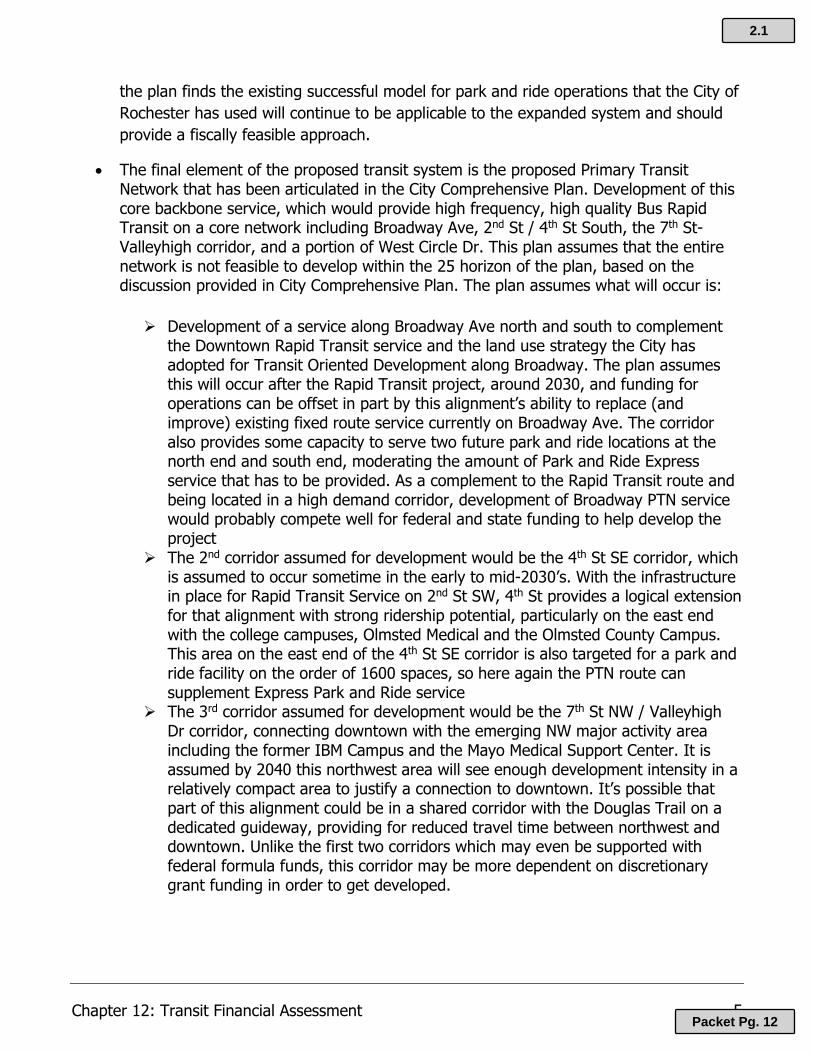
the plan finds the existing successful model for park and ride operations that the City of Rochester has used will continue to be applicable to the expanded system and should provide a fiscally feasible approach.
• The final element of the proposed transit system is the proposed Primary Transit Network that has been articulated in the City Comprehensive Plan. Development of this core backbone service, which would provide high frequency, high quality Bus Rapid Transit on a core network including Broadway Ave, 2nd St / 4th St South, the 7th St-Valleyhigh corridor, and a portion of West Circle Dr. This plan assumes that the entire network is not feasible to develop within the 25 horizon of the plan, based on the discussion provided in City Comprehensive Plan. The plan assumes what will occur is:
Development of a service along Broadway Ave north and south to complement
the Downtown Rapid Transit service and the land use strategy the City has adopted for Transit Oriented Development along Broadway. The plan assumes this will occur after the Rapid Transit project, around 2030, and funding for operations can be offset in part by this alignment’s ability to replace (and improve) existing fixed route service currently on Broadway Ave. The corridor also provides some capacity to serve two future park and ride locations at the north end and south end, moderating the amount of Park and Ride Express service that has to be provided. As a complement to the Rapid Transit route and being located in a high demand corridor, development of Broadway PTN service would probably compete well for federal and state funding to help develop the project
The 2nd corridor assumed for development would be the 4th St SE corridor, which is assumed to occur sometime in the early to mid-2030’s. With the infrastructure in place for Rapid Transit Service on 2nd St SW, 4th St provides a logical extension for that alignment with strong ridership potential, particularly on the east end with the college campuses, Olmsted Medical and the Olmsted County Campus. This area on the east end of the 4th St SE corridor is also targeted for a park and ride facility on the order of 1600 spaces, so here again the PTN route can supplement Express Park and Ride service
The 3rd corridor assumed for development would be the 7th St NW / Valleyhigh Dr corridor, connecting downtown with the emerging NW major activity area including the former IBM Campus and the Mayo Medical Support Center. It is assumed by 2040 this northwest area will see enough development intensity in a relatively compact area to justify a connection to downtown. It’s possible that part of this alignment could be in a shared corridor with the Douglas Trail on a dedicated guideway, providing for reduced travel time between northwest and downtown. Unlike the first two corridors which may even be supported with federal formula funds, this corridor may be more dependent on discretionary grant funding in order to get developed.
2.1
Packet Pg. 12

Chapter 12: Transit Financial Assessment 6
Table ES-1 Summary of Estimated Transit Costs
Transit Service Summary Sheet (all figures in Millions of Dollars)
Near Term 2021-2027
Mid Term 2028-2035
Long Term 2036-2045 Total Plan Costs
OVERALL COSTS $281.83 $386.09 $505.63 $1,173.55 Dial A Ride $10.48 $13.80 $21.49 $45.77 Annual Operating Cost $8.70 $11.86 $17.90 $38.46
Vehicle Replacement $1.53 $1.64 $3.20 $6.37 Vehicle Fleet Expansion $0.25 $0.30 $0.39 $0.94
Neighborhood Fixed Route $79.85 $114.77 $156.40 $351.02 Annual Operating Cost $51.50 $74.25 $90.10 $215.85
Vehicle Replacement $13.25 $18.92 $30.90 $63.07 Vehicle Fleet Expansion $2.60 $3.70 $6.10 $12.40
Other Capital Investment $12.50 $17.90 $29.30 $59.70 Downtown Rapid Transit $116.30 $130.92 $62.54 $309.76 Phase 1 Project Development $107.40 $107.40 Phase 2 Project Development $96.00 $96.00
Operating Cost $8.90 $33.30 $50.95 $93.15 Vehicle Replacement $1.62 $11.59 $13.21
Park & Ride Facility Cost $20.40 $22.70 $31.10 $74.20 NE Sector $8.90 $8.90
E/SE Sector $13.80 $13.80 South Sector $15.10 $15.10
SW Sector Done with Rapid Transit $0.00 West Sector $7.60 $7.60 $15.20
NW Sector $3.90 $17.30 $21.20 TABLE ES-1 CONTINUED ON
FOLLOWING PAGE
2.1
Packet Pg. 13
Chapter 12: Transit Financial Assessment 7
Near Term 2021-2027
Mid Term 2028-2035
Long Term 2036-2045 Total Plan Costs
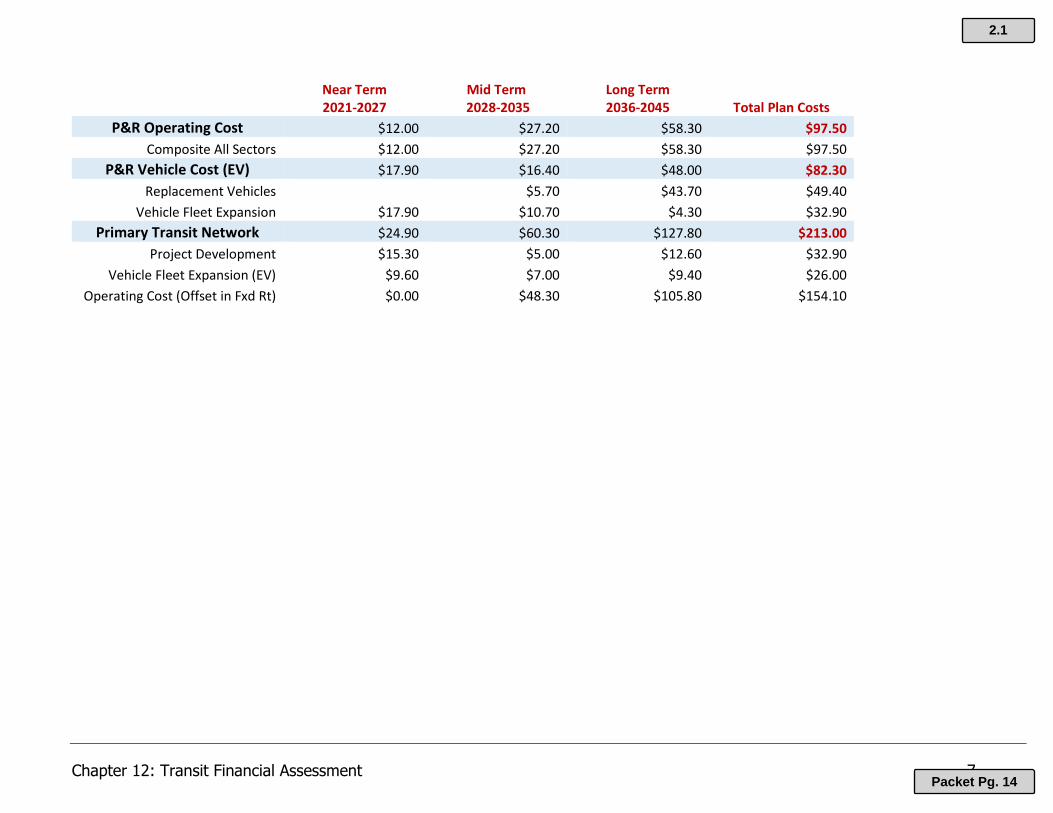
P&R Operating Cost $12.00 $27.20 $58.30 $97.50 Composite All Sectors $12.00 $27.20 $58.30 $97.50
P&R Vehicle Cost (EV) $17.90 $16.40 $48.00 $82.30 Replacement Vehicles $5.70 $43.70 $49.40
Vehicle Fleet Expansion $17.90 $10.70 $4.30 $32.90 Primary Transit Network $24.90 $60.30 $127.80 $213.00
Project Development $15.30 $5.00 $12.60 $32.90 Vehicle Fleet Expansion (EV) $9.60 $7.00 $9.40 $26.00
Operating Cost (Offset in Fxd Rt) $0.00 $48.30 $105.80 $154.10
2.1
Packet Pg. 14

Chapter 12: Transit Financial Assessment 8
Introduction to Financial Review
The analysis as noted above focuses on those transit services or transit related facilities supported by federal or state funding for which ROCOG has a programming role. These services generally fall into one of two categories:
1. Regular Route Service: Transit service offered by or under a contract issued by a designated public authority, open to the general public and running on a regular schedule.
2. Point to Point transportation service for persons who cannot use standard public transit
due to physical or cognitive disability, based on the following factors:
• They are physically unable to get to the regular fixed-route bus (OR) • They are unable to navigate regular fixed-route once they are on board (OR) • They are unable to board and exit the bus at some locations
Note that other transit services operated within the ROCOG planning area play a role in serving the traveling public, but are managed outside the purview of ROCOG. These include:
1. Rochester City Lines Commuter Bus Service: Commuter-focused (but open to general public) peak period service providing workday service to downtown Rochester from over 30 regional communities. This service serves an annual daily average of over 2000 riders, helping to manage the flow of private vehicle demand into downtown Rochester.
2. Rolling Hills Regional Bus Service: Headquartered in Rushford, a reservation-based, point to point service serving five counties in southeastern Minnesota, open to the general public for any trip purpose on weekdays. In Olmsted County, it serves the Stewartville, Eyota, Dover and Byron areas. This service does receive federal funding support from what is known as the 5311 Rural Area Formula program for operating and capital expenses, which is managed by the State Transit Office through ATP-6.
3. There are also various private shuttle services operated by entities such as the Mayo Clinic, area hotels and area group housing development to meet the needs of employees, customers or residents.
The remaining sections of the report will focus on the Rochester Public Transit System and will address the following topics:
• Overview of Federal, State and local transit funding • 2021-2045 Prospectus for Dial a Ride Service • 2021-2045 Prospectus for Fixed Route Neighborhood Service • 2021-2045 Prospectus for Commuter Parking served by Public Transit • 2021-2045 Prospectus for Downtown Rapid Transit • 2021 Prospectus for Commuter Direct / Express Transit Service • 2021-2045 Prospectus for the Primary Transit Network
2.1
Packet Pg. 15

Chapter 12: Transit Financial Assessment 9
Overview of Federal - State - Local Transit Funding
Currently transit services in the State of Minnesota are supported by a mix of federal, state and local funds that are available to be used for transit purposes.
Federal Transit Funds
There are two types of federal grant programs available for transit, known as “Formula” programs and “Discretionary” programs. Formula programs are those where federal legislation establishes a guaranteed amount of annual dollars for the life of the legislation to be distributed through an allocation formula set by the Federal Transit Administration (FTA). Discretionary programs involve grants that are made through a competitive selection process. Each Discretionary program will have its own set of criteria, eligibility and rules, and these types of programs typically are subject to annual congressional appropriations. All FTA programs are intended for capital investment; they are not for operating costs or to subsidize user except in limited circumstances.
The Formula Programs available to smaller urban areas such as Rochester include:
The Urbanized Area Formula Program (“5307”).
Require at least 20% local share of costs.
Provides funds to public transit systems in urbanized areas greater than 50,000 in population primarily for capital investment, although planning and subsidies for job access programs are also eligible. Areas with populations greater than 50,000, but less than 200,000, are also eligible to spend 5307 funds on transit operations, and up to 20% of funds may fund ADA paratransit costs. Funding for smaller urban areas such as Rochester is channeled as a single grant allocation to the state; MnDOT then apportions dollars to each small urban area on the basis of population and population density.
Enhanced Mobility for Seniors and Individuals with Disabilities Formula Program (“5310”)
Provides funding to states for the purpose of assisting in meeting the transportation needs of the elderly and persons with disabilities. Again the FTA small urban area funds are channeled to MnDOT as a single grant and then apportioned to each urban area. Different eligible expenditures are subject to different match requirements; Accessible vehicles or shelters are funded at up to 85% of cost, while operating assistance is funded at no more than a 50% share. Funds under 5310 are allocated based on ridership and revenue miles of service.
Bus and Bus Facilities Program (“5339”)
A capital investment program established in the current federal FAST Act. MnDOT receives and distributes the funds under this program to Greater Minnesota transit programs. The funds can only be used for certain capital investments (replacing, rehabilitating, purchasing buses and bus-related
2.1
Packet Pg. 16

Chapter 12: Transit Financial Assessment 10
equipment and constructing bus-related facilities). Here again the funding comes to Minnesota as a single allocation to the state.
The Discretionary Programs available for funding transit facilities are of two types – programs administered by the FTA that are restricted to transit, and general U.S. DOT programs where transit is one of the eligible uses of funds. The transit specific programs include
Capital Investment Grants (CIG Program)
A program targeting fixed guideway transit which will provide up to 80% of projects, though projects with a proposed federal share of less than 50% will receive greater consideration. Funds are distributed through multiple programs; Rochester is seeking funding through one of these programs (Small Starts) which targets projects under $300 million in cost.
Low and No Emission Program (“Low-No”)
Provides funding to purchase or lease low or no-emission transit buses , or to lease, construct or rehab facilities to support low or no-emission buses.
Bus/Bus Facility Investment Program
Requires 20% local match
Provides funding to replace, rehabilitate and purchase buses, related equipment and construct bus-related facilities. The program is a source of funds for major improvements to bus transit systems that would not be achievable through Formula allocations.
Mobility on Demand Sandbox
FTA research program for projects that promote innovative business models to deliver high quality, seamless and equitable mobility options. Funds may be used to license or provide direct services.
Pilot Program for Transit Oriented Development Planning
A planning grant providing funding to local communities to integrate land use and transportation planning with new fixed guideway capital investment. Funded planning must examine ways to improve economic development and ridership, foster multimodal connectivity and accessibility, improve transit access for pedestrian and bicycle traffic, engage the private sector, identify infrastructure needs, and enable mixed-use development near transit stations.
Other programs involving discretionary decision making where transit is but one of range of potential uses include the following funding programs:
2.1
Packet Pg. 17

Chapter 12: Transit Financial Assessment 11
BUILD Grants The BUILD (Better Utilizing investments to Leverage Development) program, the Trump Administration successor to what was known as the TIGER program under the Obama Administration, provides grants for planning and capital investments in surface transportation infrastructure, awarded on a competitive basis for projects that will have a significant local or regional impact. BUILD funding can support roads, bridges, transit, rail, ports or intermodal transportation.
Surface Transportation Block Grant (STBG) program
The STBG program is a Federal Highway Administration program that allows states flexibility to program dollars for multi-modal transportation uses, thus providing transportation agencies and communities the ability to target funding to address state and local priorities.
Volkswagen Settlement Grant
Minnesota will receive $47 million from the nationwide VW settlement over 10 years (beginning in 2018) to clean up air pollution in the state. Among the actions the MPCA proposes to use the funds for are the replacement of older polluting diesel vehicles, and the agency can spend up to 15% of funds on EV charging stations or electric vehicles. Phase 2 of the program will have $23.5 million available during the 2020-2023 period, with transit buses an eligible cost item in categories towards which 45% of funds will be directed
Since Federal funding for transit primarily provides for capital investment, a breakdown of historic capital funding levels that Rochester Public Transit has realized is illustrated in Figure 1. Over the last 10 years RPT has received over $82 million for capital investment through the STIP process, with 72% of that coming from the federal government. Table 1 illustrates the use of those funds.
Figure 1: Capital Funding Sources (62% FTA-10% FHWA-28% Local)
77% 77% 52% 70% 80% 69% 80% 23% 50% 61%
$16.33$14.78
$2.24 $3.15 $2.42 $1.98$0.12
$7.00
$18.74
$14.96
$-
$5
$10
$15
$20
2011 2012 2013 2014 2015 2016 2017 2018 2019 2020
Mill
ions
Sources of Funds for Transit CapitalFTA FHWA
2.1
Packet Pg. 18

Chapter 12: Transit Financial Assessment 12
Table 1: Use of Federal Transit Capital Investment 2010-2019
Category 2011-2020 total Share Bus Garage $33,425,000 41% Bus Shelters $64,000 0.1% Downtown Transit Hub $550,000 0.7% EV Charging Infrastructure $2,237,500 2.7% NW Transit Hub Planning $300,000 0.4% Park & Ride Development $3,150,000 3.8% St. Mary's Transit Station planning $1,620,000 2.0% Transit Technology $2,270,000 2.8% Transit Vehicles $38,653,231 47% 10 Year Total $82,269,731
State Funds
MnDOT disburses funds to Greater Minnesota transit properties through the Public Transit Participation Program. Greater Minnesota transit providers annually apply for operating, capital and planning funds, with the largest share of state funding going to operating expenses. The amount of service that Minnesota transit systems can provide is closely tied to the amount of funding provided by the state; for example, in 2017, state funding covered approximately 65 percent of transit system operating costs throughout the state. The three major sources of State Funding for transit are:
Motor Vehicle Sales Tax (MVST)
A percentage of funding from the state Motor Vehicle Sales Tax is constitutionally dedicated to public transit. 40% of receipts are dedicated to transit, of which Greater Minnesota systems receive 4%.
MVST from Leased Vehicles
Greater Minnesota also receives a portion of MVST revenues from leased vehicles, which are split among the state general fund and county state-aid highways.
Public transit assistance (General Fund allocation)
Every two years during the biannual legislative session a decision is made regarding the allocation of General Fund dollars to the State Transit Account. This amount will fluctuate and if zeroed out, as it was in the 2018, it can have a significant impact, reducing the overall funding available by approximately 20%.
Minnesota state law requires local funding participation from public transit services that receive federal and state funding. A fixed share funding formula sets a required local share of the transit operating costs depending on the type of service. Table 2 summarizes the requirements.
2.1
Packet Pg. 19

Chapter 12: Transit Financial Assessment 13
Table 2: State Match Requirements for Transit Funds
Peer Group Federal and State Share
Local Share Requirement
Rural (population less than 2,500) 85% 15%
Urbanized (population more than 50,000) 80% 20%
Elderly and disabled (ADA paratransit) 85% 15%
Small urban (population 2,500 - 50,000) 80% 20%
State funding primarily provides support for operating expenses, as illustrated in Figures 2 and 3. For Fixed Route Transit, the share of state funding increased significantly in 2016 due to legislative action to dedicate a share of Motor Vehicle Sales Tax funds to transit. The state share of funding for fixed route service as more than doubled since that time as shown in Figure 2, while the share of state funding for ZIPS Dial a Ride Service increased by approximately 50% as shown in Figure 3.
Figure 2: Funding of Fixed Route Operating Costs
12% 19% 16% 26% 19% 22% 19% 21% 45%56%
46% 62%46% 44% 47% 44%
53% 48% 48% 42% 40%
26%25%
10%
$4,359,471
$6,083,428 $6,613,455
$10,655,000
$-
$2,000,000
$4,000,000
$6,000,000
$8,000,000
$10,000,000
$12,000,000
2008 2009 2010 2011 2012 2013 2014 2015 2016 2017 2018 2019Budg
Funding of Operating Costs for Rochester Fixed Route Transit
Federal Share State GF State MVST Local Share Total
2.1
Packet Pg. 20

Chapter 12: Transit Financial Assessment 14
Figure 3: Funding of Dial A Ride Operating Costs
Beginning in 2020, the process of programming transit funding will change from one focused on annual allocations to one where funds will be distributed through four separate investment categories with up to four years of dollars being programmed. The investment categories are:
1. Operations: MnDOT’s Office of Transit and Active Transportation will issue solicitations for operating funding and award two-year operating grants.
2. Vehicle Replacement: Agencies will identify vehicles that need to be replaced over a four year period, with state prioritization of funding based on criteria that include vehicle age, mileage, and maintenance costs.
3. Facilities and Capital needs greater than $5,000: Agencies will identify facility and large capital expenditures, with selection for funding based on a set of criteria.
4. New Service: Agencies can request funding for service expansion including the operation, purchase of additional vehicles or investment in facilities to accommodate an extension of service hours and/or geographic reach.
The purpose of the multi-year programming strategy is to improve the transparency of investment decisions, establish greater certainty for transit provides over a multi-year period that better aligns with the STIP/TIP and the Transit Development Plans that are typically required of agencies every 5-7 years, and to establish a process that facilitates consideration of trade-offs based on four year programming windows.
59%44% 45%
28% 38% 28% 25%40%
22% 19% 20% 21%
16%39% 38% 54% 46% 45% 46%
40%63% 58% 61%
74%25%18% 16% 18% 17%
27%30%
19%15%
23%19%
5%
$648,340 $622,548
$730,000
$859,608
$1,033,001
$-
$200,000
$400,000
$600,000
$800,000
$1,000,000
$1,200,000
2008 2009 2010 2011 2012 2013 2014 2015 2016 2017 2018 2019Budg
Zips Dial A Ride Annual Operating Costs
Federal Share State GF State MVST Local Share Total
2.1
Packet Pg. 21

Chapter 12: Transit Financial Assessment 15
Local Funds
Local funding for transit services and capital investment is provided through a variety of mechanisms that differ according to whether it is funding for operating purposes or funding for capital investment. As noted previously in the review of federal and state programs, there is typically a required match or share of project or program costs that must be provided by the local operator.
Local Operating Funds
The local share of operating revenues in Rochester are derived from three primary sources:
• Fares and passes: Includes standard fares and various classes of passes, including agency fares and fare scholarships, as well as funding agreements for operating certain routes.
• Advertising is revenue that the transit program receives for advertising on buses and public information sources, which is approximately $100,000 per year.
• Other local funding generally comes from the City of Rochester general fund, which is used to make up any difference between operating costs and the revenue raised from federal, state, fares and advertising.
Figure 4 provides a breakdown of local funding for the combined operating costs of fixed route and dial a ride service, based on reporting from the National Transit Database. Fares have generally fluctuated between $1.8 and $2.1 million annually, but with the infusion of state funds discussed in the prior section the share of costs covered by fares has declined from the low 30% range to 19% in 2018.
Figure 4: Local Funding for Transit Operations
2010 2011 2012 2013 2014 2015 2016 2017 2018Fares and Passes $1,909,17 $1,812,69 $2,118,31 $2,104,48 $2,097,46 $2,268,07 $1,569,52 $1,741,19 $1,828,14Local (Tax Levy) $262,903 $349,184 $285,899 Other (Advertising) $61,112 $66,468 $76,610 $70,691 $137,995 $130,042 $116,726 $95,911FareBox Return 34% 31% 32% 31% 29% 32% 21% 20% 19%
0%5%10%15%20%25%30%35%40%
$-
$500,000
$1,000,000
$1,500,000
$2,000,000
$2,500,000
Local Funding for Transit Operating Costs
2.1
Packet Pg. 22
Chapter 12: Transit Financial Assessment 16
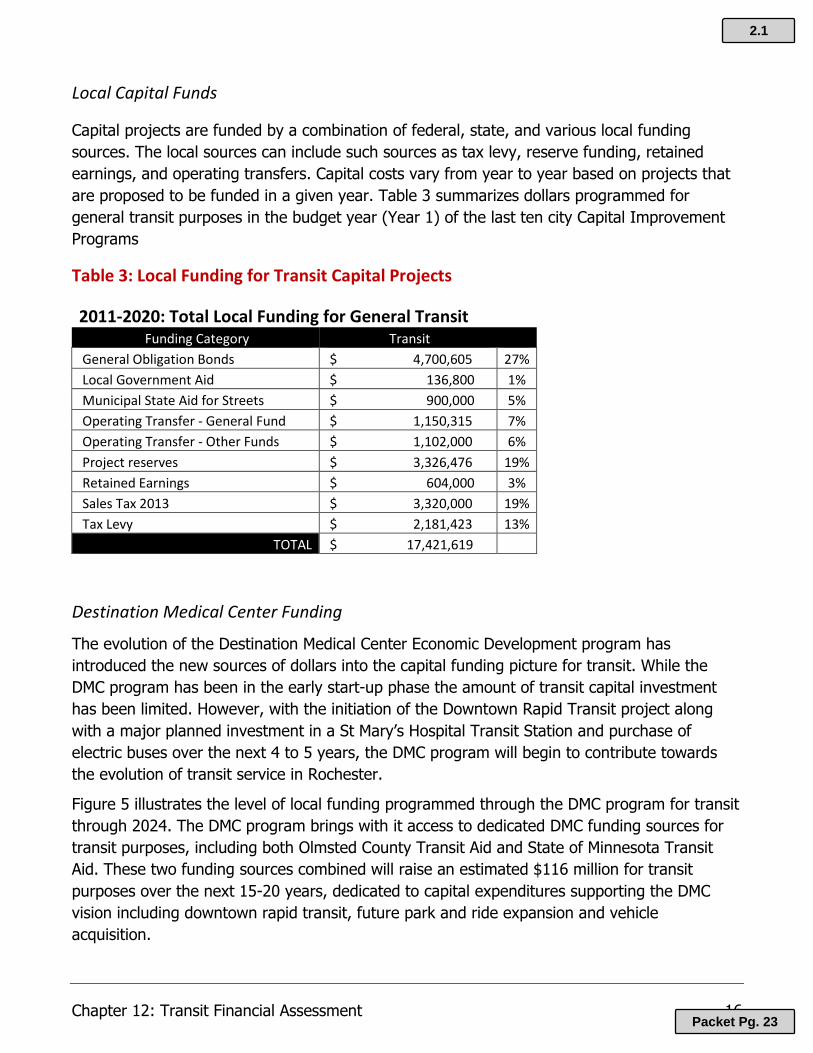
Local Capital Funds
Capital projects are funded by a combination of federal, state, and various local funding sources. The local sources can include such sources as tax levy, reserve funding, retained earnings, and operating transfers. Capital costs vary from year to year based on projects that are proposed to be funded in a given year. Table 3 summarizes dollars programmed for general transit purposes in the budget year (Year 1) of the last ten city Capital Improvement Programs
Table 3: Local Funding for Transit Capital Projects
2011-2020: Total Local Funding for General Transit Funding Category Transit
General Obligation Bonds $ 4,700,605 27% Local Government Aid $ 136,800 1% Municipal State Aid for Streets $ 900,000 5% Operating Transfer - General Fund $ 1,150,315 7% Operating Transfer - Other Funds $ 1,102,000 6% Project reserves $ 3,326,476 19% Retained Earnings $ 604,000 3% Sales Tax 2013 $ 3,320,000 19% Tax Levy $ 2,181,423 13%
TOTAL $ 17,421,619
Destination Medical Center Funding
The evolution of the Destination Medical Center Economic Development program has introduced the new sources of dollars into the capital funding picture for transit. While the DMC program has been in the early start-up phase the amount of transit capital investment has been limited. However, with the initiation of the Downtown Rapid Transit project along with a major planned investment in a St Mary’s Hospital Transit Station and purchase of electric buses over the next 4 to 5 years, the DMC program will begin to contribute towards the evolution of transit service in Rochester.
Figure 5 illustrates the level of local funding programmed through the DMC program for transit through 2024. The DMC program brings with it access to dedicated DMC funding sources for transit purposes, including both Olmsted County Transit Aid and State of Minnesota Transit Aid. These two funding sources combined will raise an estimated $116 million for transit purposes over the next 15-20 years, dedicated to capital expenditures supporting the DMC vision including downtown rapid transit, future park and ride expansion and vehicle acquisition.
2.1
Packet Pg. 23

Chapter 12: Transit Financial Assessment 17
Figure 5: Five Year DMC Program for Funding Transit Investment
2020 2021 2022 2023 2024Expected Federal Funds $5,350,000 $4,560,000 $38,115,200 $11,000,000 $7,590,000Local Share 65% 72% 31% 50% 57%State DMC Funds $5,000,000 $3,000,000DMC Transit Aids / State $3,043,200 $5,239,200 $10,190,400 $6,600,000 $6,054,000DMC Transit Aids / Olmsted $2,028,800 $3,492,800 $6,793,600 $4,400,000 $4,036,000
$0$5
$10$15$20$25$30$35$40$45
Mill
ions
DMC Program Funds Supporting Transit 2020-2024
2.1
Packet Pg. 24

Chapter 12: Transit Financial Assessment 18
Prospectus for Future Transit Services
The following sections of the report summarize projected service levels and costs for various types of existing and future transit services planned for the Rochester urban area.
2021-2045 Prospectus for ZIPS Dial – A – Ride Service
Table 4 highlights historic operating characteristics for the ZIPS Dial-A-Ride service serving elderly and handicapped individuals in the community. As shown in the Passenger Trips and particularly the Trips per Capita columns, annual ridership has fluctuated in a fairly narrow range up until 2014, after which ridership has risen by 15-20%. In 2017 taxi service was introduced to complement bus service during peak demand times and evenings to respond to increasing demand more efficiently. As is seen in the Passenger per hour and Passenger per mile metrics, the taxi element of the service does provide for more efficient service, but as can be seen in the Cost per Hour column, that efficiency does come with a cost.
Table 4: Historic ZIPS Dial a Ride Operating Characteristics
Looking to the future, ROCOG projects that the amount of ZIPS service and ridership will need to increase to respond to the changing demographics of the community. Figure 6 on the following page is taken from the City’s Comprehensive Plan and illustrates the significant growth in the number of individuals 60-74 and over 75 years of age expected by the Year
Vehicle Type Year
Total Operating
CostPassenger
TripsPassenger
MilesVehicle Miles
Vehicle Hours
Trips per Capita
Passengers per hour
Passengers per veh
mile
Cost per
Hour BUS 2009 631,827$ 39,868 295,236 183,074 12,197 0.38 3.27 0.22 51.80$ BUS 2010 647,773$ 40,717 303,923 178,161 12,176 0.38 3.34 0.23 53.20$ BUS 2011 685,133$ 40,471 279,750 176,107 13,194 0.38 3.07 0.23 51.93$ BUS 2012 672,827$ 38,503 287,286 177,067 13,425 0.35 2.87 0.22 50.12$ BUS 2013 $ 768,414 39,288 276,299 217,621 14,352 0.36 2.74 0.18 53.54$ BUS 2014 826,482$ 41,897 297,111 241,945 14,947 0.38 2.80 0.17 55.29$ BUS 2015 854,442$ 45,062 318,476 272,293 17,198 0.40 2.62 0.17 49.68$ BUS 2016 909,639$ 46,635 329,626 278,970 17,054 0.41 2.73 0.17 53.34$ BUS 2017 649,028$ 31,993 224,492 205,401 10,978 0.28 2.91 0.16 59.12$ TAXI 2017 386,377$ 16,176 66,413 66,413 4,179 0.14 3.87 0.24 92.46$ Total 2017 1,035,405$ 48,169 290,905 271,814 15,157 0.42 3.18 0.18 68.31$ BUS 2018 588,936$ 25,944 177,791 163,348 10,460 0.22 2.48 0.16 56.30$ TAXI 2018 495,995$ 20,189 88,967 88,967 5,457 0.17 3.70 0.23 90.89$ Total 2018 1,084,931$ 46,133 266,758 252,315 15,917 0.39 2.90 0.18 68.16$
8% 2% -1% 4% 3% 0% -1% -2% 4%Ann Ave Growth
2.1
Packet Pg. 25
Chapter 12: Transit Financial Assessment 19
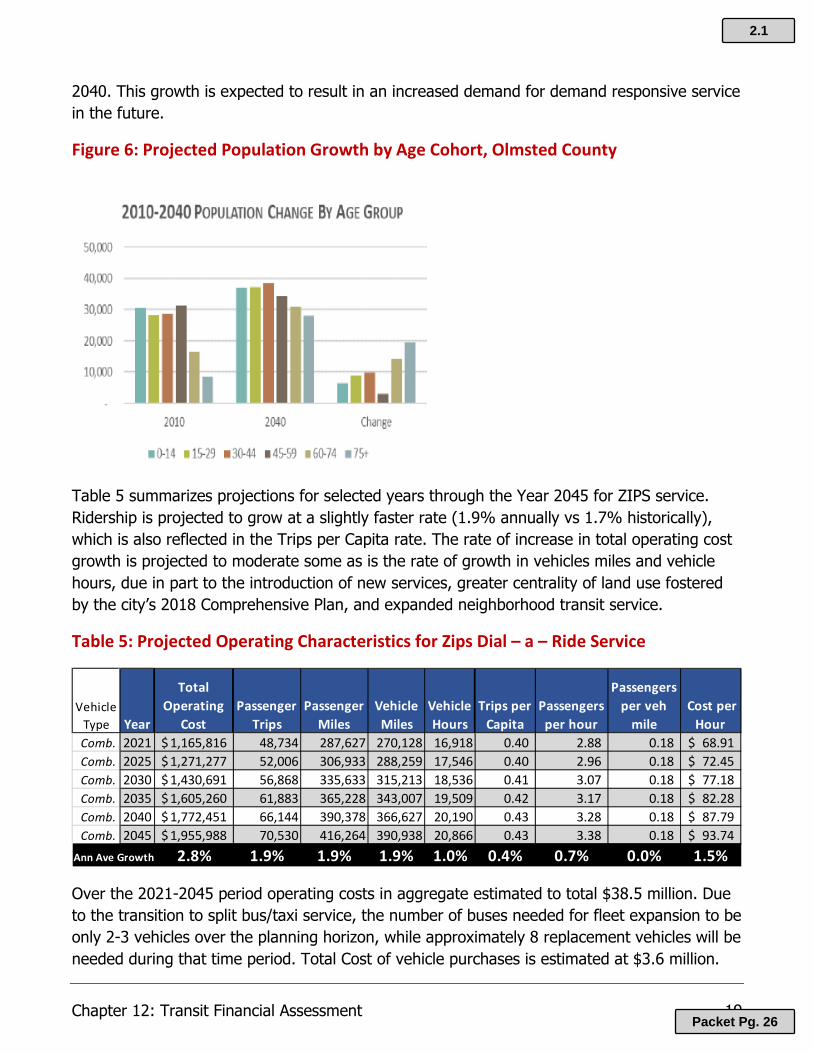
2040. This growth is expected to result in an increased demand for demand responsive service in the future.
Figure 6: Projected Population Growth by Age Cohort, Olmsted County
Table 5 summarizes projections for selected years through the Year 2045 for ZIPS service. Ridership is projected to grow at a slightly faster rate (1.9% annually vs 1.7% historically), which is also reflected in the Trips per Capita rate. The rate of increase in total operating cost growth is projected to moderate some as is the rate of growth in vehicles miles and vehicle hours, due in part to the introduction of new services, greater centrality of land use fostered by the city’s 2018 Comprehensive Plan, and expanded neighborhood transit service.
Table 5: Projected Operating Characteristics for Zips Dial – a – Ride Service
Over the 2021-2045 period operating costs in aggregate estimated to total $38.5 million. Due to the transition to split bus/taxi service, the number of buses needed for fleet expansion to be only 2-3 vehicles over the planning horizon, while approximately 8 replacement vehicles will be needed during that time period. Total Cost of vehicle purchases is estimated at $3.6 million.
Vehicle Type Year
Total Operating
CostPassenger
TripsPassenger
MilesVehicle Miles
Vehicle Hours
Trips per Capita
Passengers per hour
Passengers per veh
mile Cost per
Hour Comb. 2021 1,165,816$ 48,734 287,627 270,128 16,918 0.40 2.88 0.18 68.91$ Comb. 2025 1,271,277$ 52,006 306,933 288,259 17,546 0.40 2.96 0.18 72.45$ Comb. 2030 1,430,691$ 56,868 335,633 315,213 18,536 0.41 3.07 0.18 77.18$ Comb. 2035 1,605,260$ 61,883 365,228 343,007 19,509 0.42 3.17 0.18 82.28$ Comb. 2040 1,772,451$ 66,144 390,378 366,627 20,190 0.43 3.28 0.18 87.79$ Comb. 2045 1,955,988$ 70,530 416,264 390,938 20,866 0.43 3.38 0.18 93.74$
2.8% 1.9% 1.9% 1.9% 1.0% 0.4% 0.7% 0.0% 1.5%Ann Ave Growth
2.1
Packet Pg. 26
Chapter 12: Transit Financial Assessment 20
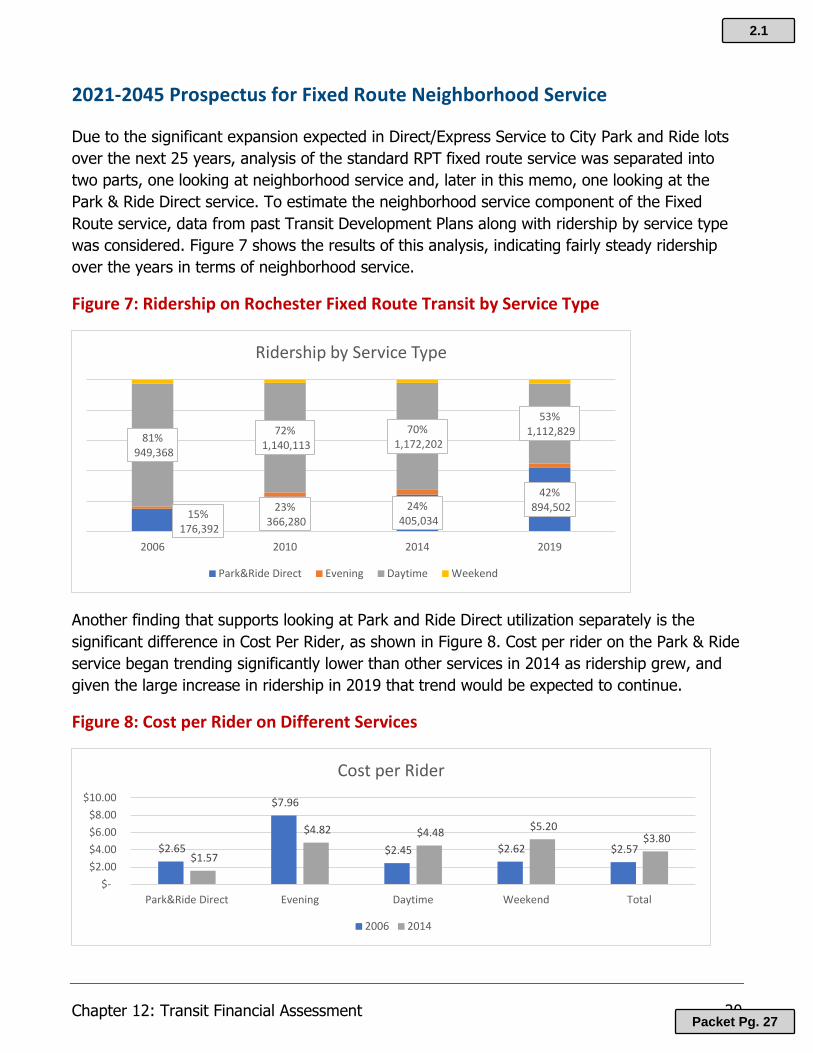
2021-2045 Prospectus for Fixed Route Neighborhood Service
Due to the significant expansion expected in Direct/Express Service to City Park and Ride lots over the next 25 years, analysis of the standard RPT fixed route service was separated into two parts, one looking at neighborhood service and, later in this memo, one looking at the Park & Ride Direct service. To estimate the neighborhood service component of the Fixed Route service, data from past Transit Development Plans along with ridership by service type was considered. Figure 7 shows the results of this analysis, indicating fairly steady ridership over the years in terms of neighborhood service.
Figure 7: Ridership on Rochester Fixed Route Transit by Service Type
Another finding that supports looking at Park and Ride Direct utilization separately is the significant difference in Cost Per Rider, as shown in Figure 8. Cost per rider on the Park & Ride service began trending significantly lower than other services in 2014 as ridership grew, and given the large increase in ridership in 2019 that trend would be expected to continue.
Figure 8: Cost per Rider on Different Services
15%176,392
23%366,280
24%405,034
42%894,502
81%949,368
72%1,140,113
70%1,172,202
53%1,112,829
2006 2010 2014 2019
Ridership by Service Type
Park&Ride Direct Evening Daytime Weekend
$2.65
$7.96
$2.45 $2.62 $2.57 $1.57
$4.82 $4.48 $5.20 $3.80
$- $2.00 $4.00 $6.00 $8.00
$10.00
Park&Ride Direct Evening Daytime Weekend Total
Cost per Rider
2006 2014
2.1
Packet Pg. 27

Chapter 12: Transit Financial Assessment 21
Table 6 highlights historic operating characteristics for the ZIPS Dial-A-Ride service serving elderly and handicapped individuals in the community. As shown in the Passenger Trips and particularly the Trips per Capita column, annual ridership has fluctuated within a fairly narrow level of range over the last 10 years. This reflects in part an increased effort to transition more users to regular route bus service. In 2017 the service introduced taxi service during peak demand times and evenings in an effort to respond to increasing demand more efficiently. As is seen in the passenger per hour and passenger per mile metrics, the taxi element of the service does provide for more efficient service, but as can be seen in the cost per hour column, that efficiency does come with a cost.
Table 6: Fixed Route Operating Characteristics 2009-2018
The results indicate that service expansion in the 2017/2018 period contributed to a noticeable rise in operating costs but has not yet translated into increased ridership, with preliminary 2019 still remaining largely unchanged from 2017/2018 numbers. The city will be implementing a some significant changes in 2020 in terms of expanded service.
Table 7: Projected Operating Characteristics for Fixed Route (Non-Express) Service 2021-2045
Year
Total Operating
CostPassenger
TripsPassenger
MilesVehicle Miles
Vehicle Hours
Trips per Capita
Passengers per hour
Passengers per veh
mileCost Per
Hour2009 $3,423,776 1,094,976 4,341,020 695,007 46,850 10.47 23.37 1.58 $73.082010 $3,700,226 1,127,625 4,470,456 695,678 47,535 10.56 23.72 1.62 $77.842011 $3,863,129 1,160,274 4,599,891 697,686 48,048 10.78 24.15 1.66 $80.402012 $4,496,348 1,192,923 4,729,327 685,403 47,454 10.96 25.14 1.74 $94.752013 $4,562,110 1,225,571 4,858,762 703,527 48,226 11.10 25.41 1.74 $94.602014 $4,754,271 1,258,220 4,988,198 749,477 50,993 11.33 24.67 1.68 $93.232015 $4,687,922 1,253,443 4,969,258 769,598 52,554 11.20 23.85 1.63 $89.202016 $4,934,858 1,248,665 4,950,317 773,317 52,084 11.02 23.97 1.61 $94.752017 $5,637,422 1,243,888 4,931,377 847,224 61,717 10.74 20.15 1.47 $91.342018 $6,423,438 1,239,110 4,912,437 1,002,825 72,119 10.55 17.18 1.24 $89.07
9.7% 1.5% 1.5% 4.9% 6.0% 0.1% -2.9% -2.4% 2.4%Ann Ave Growth
Year
Total Operating
CostPassenger
TripsPassenger
MilesVehicle Miles
Vehicle Hours
Trips per Capita
Passengers per hour
Passengers per veh
mileCost Per
Hour2021 $6,591,307 1,371,798 4,911,038 920,963 63,680 11.23 21.54 1.49 $103.512025 $7,616,338 1,473,965 5,276,794 1,023,455 69,039 11.47 21.35 1.44 $110.322030 $8,897,626 1,601,673 5,733,989 1,167,413 75,737 11.61 21.15 1.37 $117.482035 $10,178,915 1,729,381 6,191,184 1,331,189 82,435 11.72 20.98 1.30 $123.482040 $11,460,204 1,857,089 6,648,379 1,517,452 89,134 11.99 20.83 1.22 $128.572045 $12,741,492 1,984,797 7,105,575 1,729,223 95,832 12.23 20.71 1.15 $132.96
3.9% 1.9% 1.9% 3.7% 2.1% 0.4% -0.2% -1.0% 1.2%Ann Ave Growth
2.1
Packet Pg. 28
Chapter 12: Transit Financial Assessment 22
The projections indicate some moderation in operating cost growth along with service growth over the long term looking forward. The route and services changes being instituted in 2020 will likely cause a short term spike in service and costs that is probably not captured in these projections, but over time we would expect the projected numbers to “catch up” to any spike in operating numbers.
Over the 2021-2045 period operating costs for fixed route neighborhood service in aggregate estimated to total $241.6 million. Expected costs for vehicle replacement over the plan horizon are $75.5 million, including purchase of 86 replacement places (approximately 7 vehicles every 2 years working out to a 15 year replacement cycle) and fleet expansion of 17 vehicles.
2021-2045 Prospectus for Downtown Rapid Transit
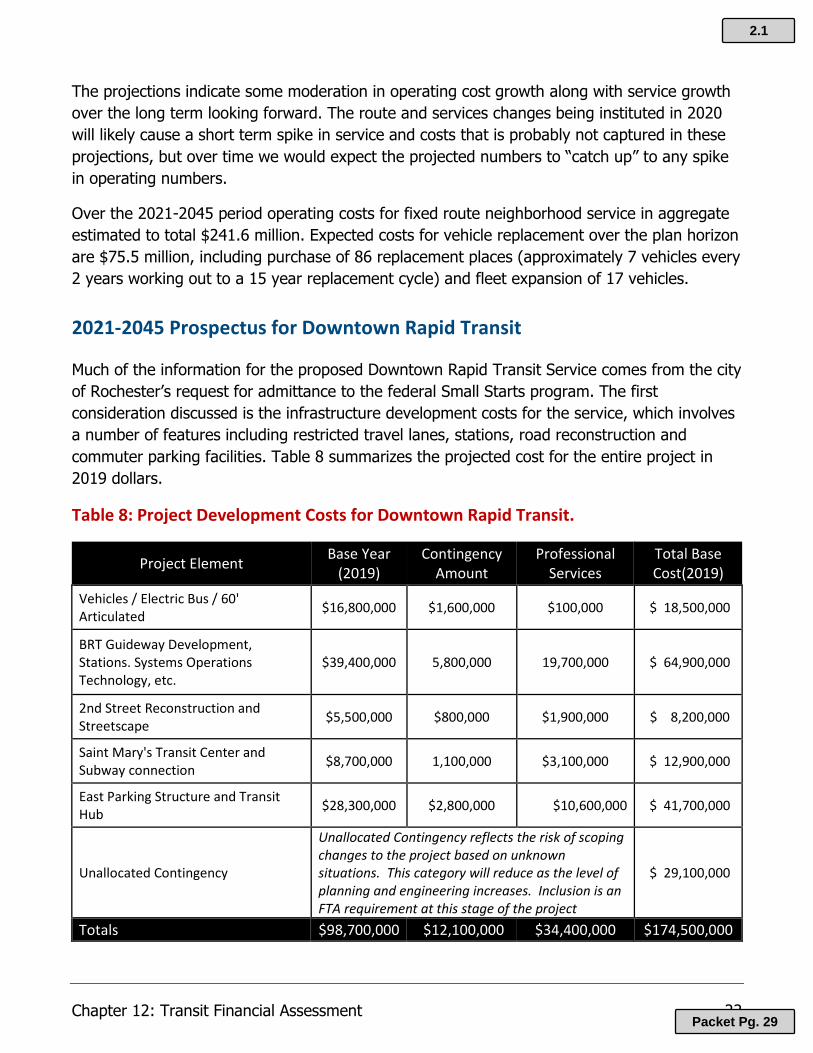
Much of the information for the proposed Downtown Rapid Transit Service comes from the city of Rochester’s request for admittance to the federal Small Starts program. The first consideration discussed is the infrastructure development costs for the service, which involves a number of features including restricted travel lanes, stations, road reconstruction and commuter parking facilities. Table 8 summarizes the projected cost for the entire project in 2019 dollars.
Table 8: Project Development Costs for Downtown Rapid Transit.
Project Element Base Year (2019)
Contingency Amount
Professional Services
Total Base Cost(2019)
Vehicles / Electric Bus / 60' Articulated $16,800,000 $1,600,000 $100,000 $ 18,500,000
BRT Guideway Development, Stations. Systems Operations Technology, etc.
$39,400,000 5,800,000 19,700,000 $ 64,900,000
2nd Street Reconstruction and Streetscape $5,500,000 $800,000 $1,900,000 $ 8,200,000
Saint Mary's Transit Center and Subway connection $8,700,000 1,100,000 $3,100,000 $ 12,900,000
East Parking Structure and Transit Hub $28,300,000 $2,800,000 $10,600,000 $ 41,700,000
Unallocated Contingency
Unallocated Contingency reflects the risk of scoping changes to the project based on unknown situations. This category will reduce as the level of planning and engineering increases. Inclusion is an FTA requirement at this stage of the project
$ 29,100,000
Totals $98,700,000 $12,100,000 $34,400,000 $174,500,000
2.1
Packet Pg. 29

Chapter 12: Transit Financial Assessment 23
With the decision by the City to phase the project, the Year of Expenditure costs required for the LRTP must be calculated separately for each phase. Phase 1 is assumed to be under construction and includes the east-west portion of the permanent project along with interim routing at the east end of the facility. Table 9 summarizes the cost for this phase of the project.
Table 9: Phase 1 Development Costs for Downtown Rapid Transit
Project Element Base Year (2019)
Contingency Amount
Professional Services Total Base Cost YOE (2024)
Cost Vehicles / Electric Bus / 60' Articulated $16,800,000 $1,600,000 $100,000 $ 18,500,000 $21,400,000
BRT Guideway Development, Stations. Systems Operations Technology, etc.
$21,400,000 $3,200,000 $10,700,000 $ 35,300,000 $40,900,000
2nd Street Reconstruction and Streetscape
$5,500,000 $800,000 $1,900,000 $ 8,200,000 $9,500,000
Saint Marys Transit Center and Subway connection
$8,700,000 $1,100,000 $3,100,000 $ 12,900,000 $15,000,000
Unallocated Contingency
$ 17,800,000 $20,600,000
Totals $98,700,000 $12,100,000 $34,400,000 $ 92,700,000 $107,400,000
Table 10 summarizes the expected development costs for the 2nd phase of the project, which would involve an extension southward from downtown to a future East Transit Village. For the purposes of this plan this project in assumed to occur in 2029.
Table 10: Phase 2 Development Costs for Downtown Rapid Transit
Project Element Base Year (2019)
Contingency Amount
Professional Services Total Base Cost YOE (2029)
Cost BRT Guideway Development, Stations. Systems Operations Technology, etc.
$18,000,000 $2,600,000 $9,000,000 $29,600,000 $36,400,000
East Parking Structure and Transit Hub $28,300,000 $2,800,000 $10,600,000 $41,700,000 $51,300,000
Unallocated Contingency $ 6,750,000 $8,300,000
Totals $98,700,000 $12,100,000 $34,400,000 $ 78,050,000 $96,000,000
2.1
Packet Pg. 30
Chapter 12: Transit Financial Assessment 24
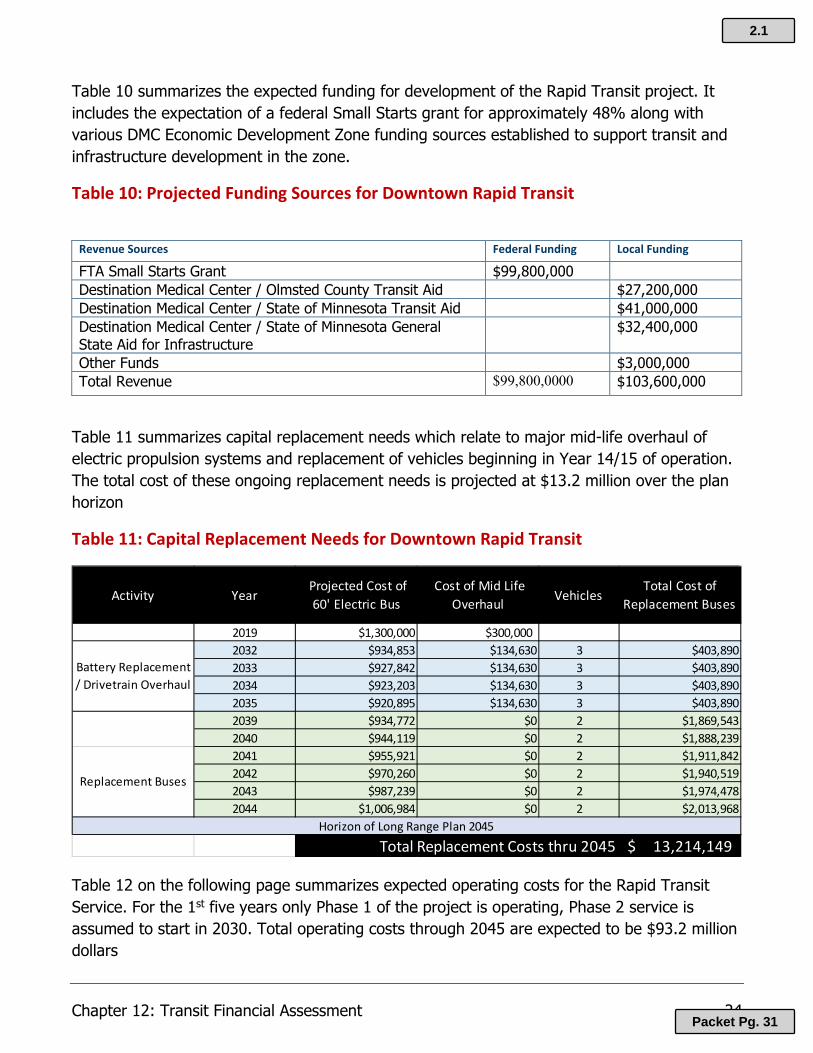
Table 10 summarizes the expected funding for development of the Rapid Transit project. It includes the expectation of a federal Small Starts grant for approximately 48% along with various DMC Economic Development Zone funding sources established to support transit and infrastructure development in the zone.
Table 10: Projected Funding Sources for Downtown Rapid Transit
Revenue Sources Federal Funding Local Funding
FTA Small Starts Grant $99,800,000 Destination Medical Center / Olmsted County Transit Aid $27,200,000 Destination Medical Center / State of Minnesota Transit Aid $41,000,000 Destination Medical Center / State of Minnesota General State Aid for Infrastructure
$32,400,000
Other Funds $3,000,000 Total Revenue $99,800,0000 $103,600,000
Table 11 summarizes capital replacement needs which relate to major mid-life overhaul of electric propulsion systems and replacement of vehicles beginning in Year 14/15 of operation. The total cost of these ongoing replacement needs is projected at $13.2 million over the plan horizon
Table 11: Capital Replacement Needs for Downtown Rapid Transit
Table 12 on the following page summarizes expected operating costs for the Rapid Transit Service. For the 1st five years only Phase 1 of the project is operating, Phase 2 service is assumed to start in 2030. Total operating costs through 2045 are expected to be $93.2 million dollars
Activity Year Projected Cost of
60' Electric Bus Cost of Mid Life
Overhaul VehiclesTotal Cost of
Replacement Buses
2019 $1,300,000 $300,0002032 $934,853 $134,630 3 $403,8902033 $927,842 $134,630 3 $403,8902034 $923,203 $134,630 3 $403,8902035 $920,895 $134,630 3 $403,8902039 $934,772 $0 2 $1,869,5432040 $944,119 $0 2 $1,888,2392041 $955,921 $0 2 $1,911,8422042 $970,260 $0 2 $1,940,5192043 $987,239 $0 2 $1,974,4782044 $1,006,984 $0 2 $2,013,968
Total Replacement Costs thru 2045 13,214,149$ Horizon of Long Range Plan 2045
Battery Replacement / Drivetrain Overhaul
Replacement Buses
2.1
Packet Pg. 31

Chapter 12: Transit Financial Assessment 25
Table 12: Estimating Downtown Rapid Transit Annual Operating Costs
Hourly Vehicle Operating Cost
Standard Fixed Route
Hourly Vehicle Operating Cost
Premium BRT Service
Annual Operating Costs (Original Assumption was 34,150
Hours of Service - needs to be phased in)
Base Year 2017 $ 91.34 $105.04
Year 1 Phase 1 2025 $ 102.89 $118.33 $2,940,000
Year 5 Phases 1&2
2030 $ 110.85 $127.47 $4,353,000 2035 $ 119.41 $137.32 $4,690,000 2040 $ 128.64 $147.94 $5,052,000 2045 $ 138.58 $159.37 $5,443,000
Operating Cost Total through Year 2045 $93,210,000
The project $93.2 million in operating funds for the Downtown Rapid Transit service is projected to be provided through a mix of existing and new revenues as shown in Table 13. Fares and/or Employer Contributions, state transit operating assistance and existing riders shifting to the new service are expected to provide the bulk of the service.
Table 13: Rochester Downtown Rapid Transit Operating Revenue Assumptions
Table
Year
Fares / Employer
Contribution
Reallocation of Service
State Transit Operating Assistance
Federal City Local Share Advertising Total
% Share 25% 25% 40% 2.5% 2.5% 5% 100%
2025 $735,000 $735,000 $1,176,000 $73,500 $73,500 $147,000 $2,940,000
2030 $1,088,250 $1,088,250 $1,741,200 $108,825 $108,825 $217,650 $4,353,0002035 $1,172,500 $1,172,500 $1,876,000 $117,250 $117,250 $234,500 $4,690,0002040 $1,263,000 $1,263,000 $2,020,800 $126,300 $126,300 $252,600 $5,052,0002045 $1,360,750 $1,360,750 $2,177,200 $136,075 $136,075 $272,150 $5,443,000
TOTAL $23,302,500 $23,302,500 $37,284,000 $2,330,250 $2,330,250 $4,660,500 $93,210,000
Operating Cost Revenue Assessment
2.1
Packet Pg. 32

Chapter 12: Transit Financial Assessment 26
2.1
Packet Pg. 33

Chapter 12: Transit Financial Assessment 27
2021-2045 Prospectus for Commuter Parking Demand / Rochester Park & Ride Facilities
To help manage the flow of peak period traffic in and out of downtown Rochester, the City of Rochester for a number of years has operated a network of leased park and ride lots across the city, served by buses that provide non-stop service to downtown for 2-3 hours in both morning and afternoon peak work shift times. Table 14 illustrates how this system has grown over time to serve between 1750 and 2000 users on an average day.
Table 14: Historic Growth in Park and Ride Users
Location 2006 Users Replacement
Location 2014 Users New Location 2018 Users Shopko North 67 248 253 Wal Mart North 280 IBM 614 744 Shopko South 80 Target South 218 257 Bethel 57 Graham Park 194 297 Cub Foods 35 41 48 RCTC 139 Total 519 1315 1738
The Downtown Master Plan and DMC Development Plan both recommended strategies to reduce peak period traffic downtown built on significant expansion of park and ride capacity. This demand management is needed as the downtown workforce is expected to grow from 40,000 workers to over 60,000 workers.
Figure 9: Minimum Downtown Mode Split Targets
71% 67% 62% 56% 50%
11% 14% 16% 19% 23%
13% 14% 15% 16% 17%
5% 6% 8% 9% 10%
0%
10%
20%
30%
40%
50%
60%
70%
80%
90%
100%
Base Year Year 5 Year 10 Year 15 Year 20
Minimum Mode Split Targets
Drive Alone % Transit % Carpool % PedBike %
2.1
Packet Pg. 34

Chapter 12: Transit Financial Assessment 28
Figure 9 on the previous page highlights the goal / target for mode shift among workers who work at a downtown location over the next 20 years. The Year 20 targets are expected to be the minimum needed to avoid serious growth in peak period congestion, particularly on the major entry corridors to downtown Rochester. The Downtown Master Plan and DMC Plans also suggested that the mode shift targets may need to be more stringent (Drive Alone reduced to 43-45% and transit share raised to 29%) to support additional growth beyond that projected in these plans.
Achieving these mode shift goals will require changing motorist behavior and also providing the needed infrastructure and service to accommodate significantly increased number of persons riding some type of transit service into downtown. Figure 10 illustrates a scenario assuming growth in downtown employment is steady over the next 20 years, and illustrates the resulting number of transit, carpool, pedestrians and cyclists using those respective modes for their trip to work.
Figure 10: Travelers by Mode under Proposed Work Trip Mode Shift
Focusing on the transit numbers, we see than going from an 11% transit mode share to a 23% mode share suggests the number of transit users will grow from 4,800 to a 13,800 under a steady growth scenario. Table 15 breaks down how these transit commutes might be distributed among different services.
Table 15: Split of Transit Commuters into Downtown Rochester 2020 & 2040
Mode Today 20 Years Rochester Neighborhood Transit ~1050 ~1650 Regional Commuter Bus ~2000 ~3,000 Downtown Rapid Transit Commuter Parking 0 ~3500 Park and Ride ~1750 ~5600-5700 Total 4,800 13,800
2.1
Packet Pg. 35
Chapter 12: Transit Financial Assessment 29
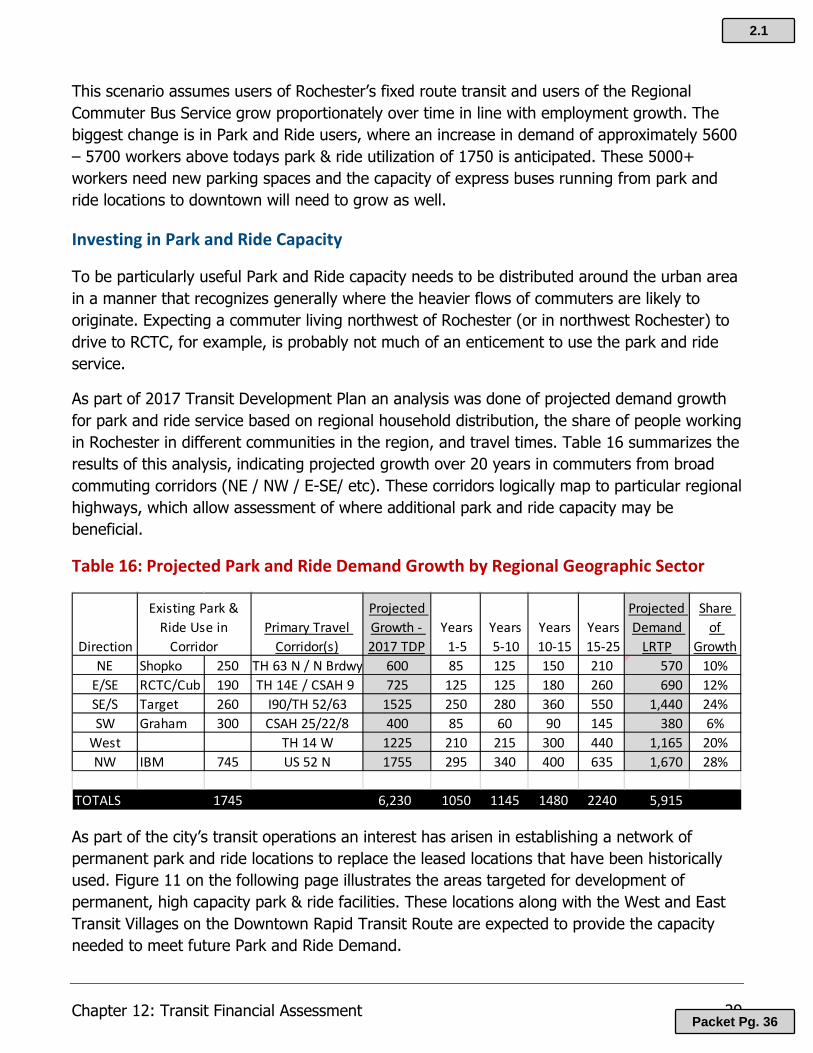
This scenario assumes users of Rochester’s fixed route transit and users of the Regional Commuter Bus Service grow proportionately over time in line with employment growth. The biggest change is in Park and Ride users, where an increase in demand of approximately 5600 – 5700 workers above todays park & ride utilization of 1750 is anticipated. These 5000+ workers need new parking spaces and the capacity of express buses running from park and ride locations to downtown will need to grow as well.
Investing in Park and Ride Capacity
To be particularly useful Park and Ride capacity needs to be distributed around the urban area in a manner that recognizes generally where the heavier flows of commuters are likely to originate. Expecting a commuter living northwest of Rochester (or in northwest Rochester) to drive to RCTC, for example, is probably not much of an enticement to use the park and ride service.
As part of 2017 Transit Development Plan an analysis was done of projected demand growth for park and ride service based on regional household distribution, the share of people working in Rochester in different communities in the region, and travel times. Table 16 summarizes the results of this analysis, indicating projected growth over 20 years in commuters from broad commuting corridors (NE / NW / E-SE/ etc). These corridors logically map to particular regional highways, which allow assessment of where additional park and ride capacity may be beneficial.
Table 16: Projected Park and Ride Demand Growth by Regional Geographic Sector
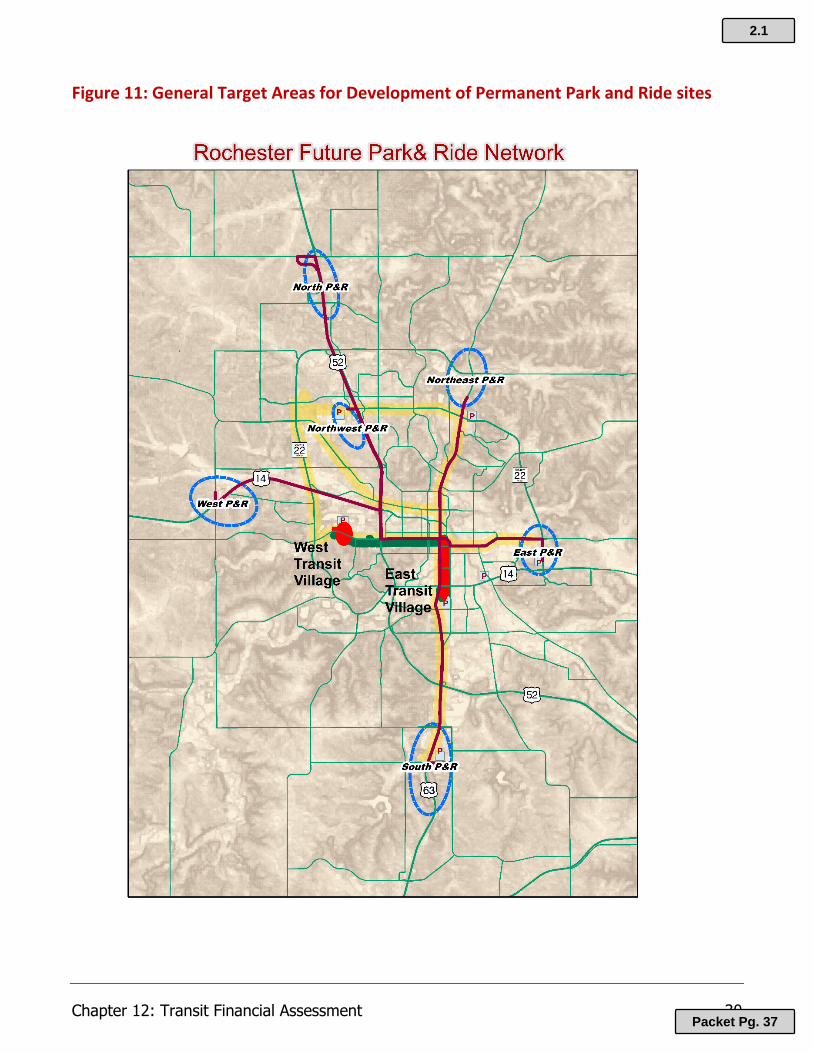
As part of the city’s transit operations an interest has arisen in establishing a network of permanent park and ride locations to replace the leased locations that have been historically used. Figure 11 on the following page illustrates the areas targeted for development of permanent, high capacity park & ride facilities. These locations along with the West and East Transit Villages on the Downtown Rapid Transit Route are expected to provide the capacity needed to meet future Park and Ride Demand.
DirectionPrimary Travel
Corridor(s)
Projected Growth - 2017 TDP
Years 1-5
Years 5-10
Years 10-15
Years 15-25
Projected Demand
LRTP
Share of
GrowthNE Shopko 250 TH 63 N / N Brdwy 600 85 125 150 210 570 10%
E/SE RCTC/Cub 190 TH 14E / CSAH 9 725 125 125 180 260 690 12%SE/S Target 260 I90/TH 52/63 1525 250 280 360 550 1,440 24%SW Graham 300 CSAH 25/22/8 400 85 60 90 145 380 6%
West TH 14 W 1225 210 215 300 440 1,165 20%NW IBM 745 US 52 N 1755 295 340 400 635 1,670 28%
TOTALS 1745 6,230 1050 1145 1480 2240 5,915
Existing Park & Ride Use in
Corridor
2.1
Packet Pg. 36
Chapter 12: Transit Financial Assessment 30
Figure 11: General Target Areas for Development of Permanent Park and Ride sites
2.1
Packet Pg. 37
Chapter 12: Transit Financial Assessment 31
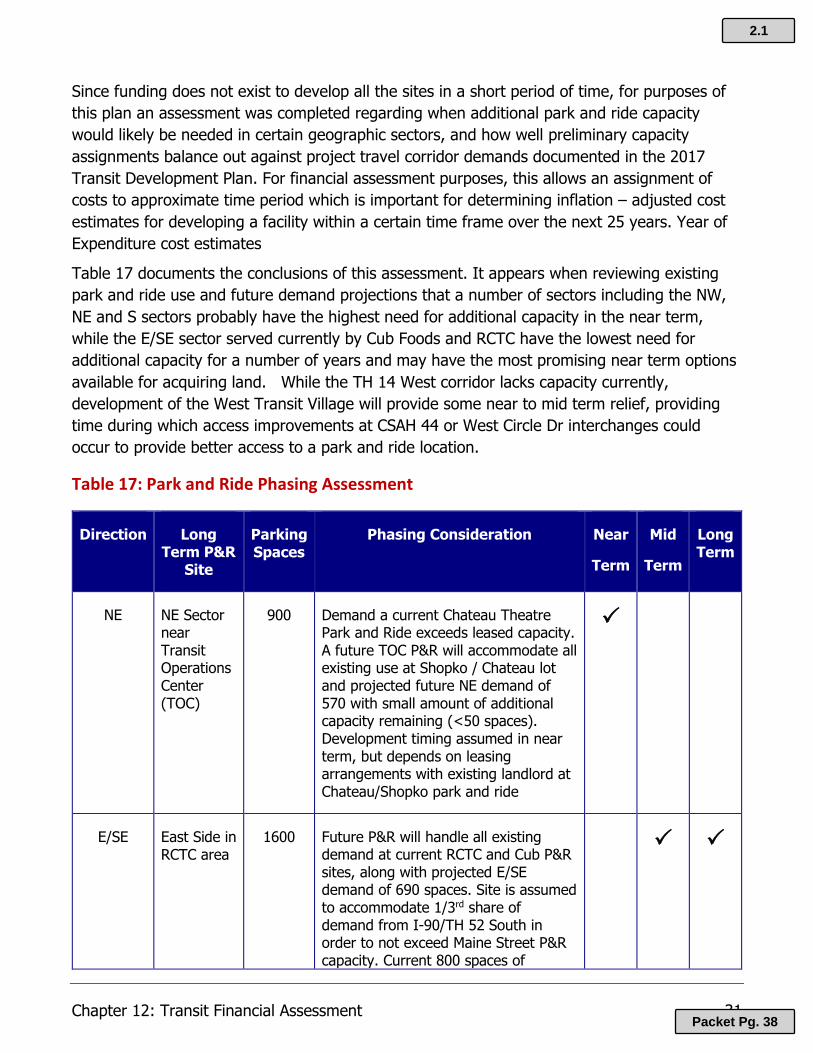
Since funding does not exist to develop all the sites in a short period of time, for purposes of this plan an assessment was completed regarding when additional park and ride capacity would likely be needed in certain geographic sectors, and how well preliminary capacity assignments balance out against project travel corridor demands documented in the 2017 Transit Development Plan. For financial assessment purposes, this allows an assignment of costs to approximate time period which is important for determining inflation – adjusted cost estimates for developing a facility within a certain time frame over the next 25 years. Year of Expenditure cost estimates
Table 17 documents the conclusions of this assessment. It appears when reviewing existing park and ride use and future demand projections that a number of sectors including the NW, NE and S sectors probably have the highest need for additional capacity in the near term, while the E/SE sector served currently by Cub Foods and RCTC have the lowest need for additional capacity for a number of years and may have the most promising near term options available for acquiring land. While the TH 14 West corridor lacks capacity currently, development of the West Transit Village will provide some near to mid term relief, providing time during which access improvements at CSAH 44 or West Circle Dr interchanges could occur to provide better access to a park and ride location.
Table 17: Park and Ride Phasing Assessment
Direction Long Term P&R
Site
Parking Spaces
Phasing Consideration Near
Term
Mid
Term
Long Term
NE NE Sector near Transit Operations Center (TOC)
900 Demand a current Chateau Theatre Park and Ride exceeds leased capacity. A future TOC P&R will accommodate all existing use at Shopko / Chateau lot and projected future NE demand of 570 with small amount of additional capacity remaining (<50 spaces). Development timing assumed in near term, but depends on leasing arrangements with existing landlord at Chateau/Shopko park and ride
E/SE East Side in RCTC area
1600 Future P&R will handle all existing demand at current RCTC and Cub P&R sites, along with projected E/SE demand of 690 spaces. Site is assumed to accommodate 1/3rd share of demand from I-90/TH 52 South in order to not exceed Maine Street P&R capacity. Current 800 spaces of
2.1
Packet Pg. 38
Chapter 12: Transit Financial Assessment 32
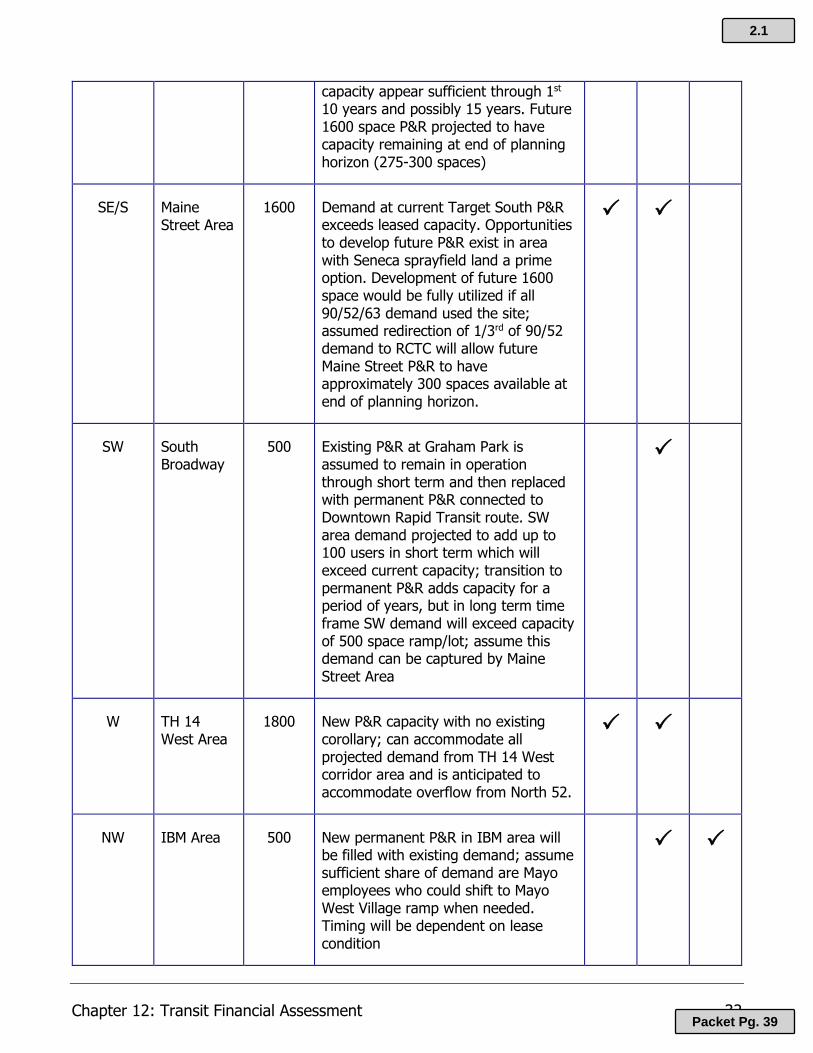
capacity appear sufficient through 1st 10 years and possibly 15 years. Future 1600 space P&R projected to have capacity remaining at end of planning horizon (275-300 spaces)
SE/S Maine Street Area
1600 Demand at current Target South P&R exceeds leased capacity. Opportunities to develop future P&R exist in area with Seneca sprayfield land a prime option. Development of future 1600 space would be fully utilized if all 90/52/63 demand used the site; assumed redirection of 1/3rd of 90/52 demand to RCTC will allow future Maine Street P&R to have approximately 300 spaces available at end of planning horizon.
SW South Broadway
500 Existing P&R at Graham Park is assumed to remain in operation through short term and then replaced with permanent P&R connected to Downtown Rapid Transit route. SW area demand projected to add up to 100 users in short term which will exceed current capacity; transition to permanent P&R adds capacity for a period of years, but in long term time frame SW demand will exceed capacity of 500 space ramp/lot; assume this demand can be captured by Maine Street Area
W TH 14 West Area
1800 New P&R capacity with no existing corollary; can accommodate all projected demand from TH 14 West corridor area and is anticipated to accommodate overflow from North 52.
NW IBM Area 500 New permanent P&R in IBM area will be filled with existing demand; assume sufficient share of demand are Mayo employees who could shift to Mayo West Village ramp when needed. Timing will be dependent on lease condition
2.1
Packet Pg. 39

Chapter 12: Transit Financial Assessment 33
NW 75th St Area
500 75th St area programmed for development in near term. Proposed 500 spaces will not meet demand from North 52 Corridor; with excess demand of 1170 spaces in 20 years. Assume excess will shift to West Village (60% Mayo, 40% City) and TH 14 West
West Village –
Mayo
2500 A ramp with an anticipated capacity of 2500 spaces is proposed by Mayo at the West Transit Village. With existing parking of 900 at the site, provides an additional 1600 spaces which handles Mayo overflows from SW and NW areas through the horizon of the plan
West Village -
City
400 Assume an initial surface parking lot replace in mid-term with a ramp facility that would accommodate non-Mayo overflow from SW and NW; depending on status of TH 14 P&R may also handle some demand from TH 14 corridor area in early years.
Table 18 provides a high level estimate of development costs for sites in the various areas that have been targeted for park and ride development. These cost would accrue along the timelines indicated in Table 17.
Table 18: High Level Estimate of Park and Ride Development Cost
Sector Long Term P&R Area Spaces Type Land Costs
Access & Amenity
Cost Design /
Construction Total Cost
(2019)
NE Transit
Operations Center Area
900 Lot ~ 7 Acres
$1,200,000 $ 450,000 $ 5,625,000 $ 8,900,000
E/SE RCTC area 1600 Lot 12 Acres
$1,200,000 $ 700,000 $10,000,000 $13,800,000
SE/S Maine Street Area 1600 Lot
12 Acres
$2,100,000 $ 450,000 $10,000,000 $15,100,000
SW South Broadway 500 Ramp
1 Acre $ 500,000 $ 500,000 $18,750,000 $20,800,000
W TH 14 West Area 1800 Lot
13 Acres
$1,300,000 $ 650,000 $11,250,000 $15,200,000
2.1
Packet Pg. 40
Chapter 12: Transit Financial Assessment 34
Sector Long Term P&R Area Spaces Type Land Costs
Access & Amenity
Cost Design /
Construction Total Cost
NW IBM Area 500 Ramp 1 Acre $ 300,000 $ 500,000 $15,625,000 $17,300,000
NW 75th St Area 500 Lot 4 Acres $ 40,000 $ 350,000 $ 3,125,000 $ 3,900,000
TOTAL $95,000,000
2021 Prospectus for Commuter Direct / Express Transit Service
The development of high capacity permanent park and ride sites will require significant expansion of direct/express transit service to downtown employment and business locations. We assume current service levels at existing sites would continue until they are replaced by new permanent park and rides. Certain locations will also benefit from development of the Primary Transit Network, discussed in the next section, which is assumed to be able to serve a slice of the demand at certain permanent park & ride locations
Table 19: Comparison of Existing and Future Park & Ride Service Costs
Sector Current Site
Annual Operating $$ (2019)
Long Term
P&R Site Spaces PTN?
Annual Operating
Cost (2019) Interlined
With
NE Shopko 250 Users $182,250
Transit Operations
Center Area
900 Yes $1,211,000 75th St
E/SE
RCTC 140 Users $75,716
RCTC area 1600 Yes $1,211,000 IBM
Cub Food 50 Users $60,350
SE/S Target South
260 Users $234,500
Maine Street Area
1600 Yes $1,816,500 TH 14 West
SW Graham
Park 300 Users
$250,425 South Broadway 500 Yes Served by Rapid Transit
W - TH 14 West Area 1800 No
NW IBM 745 Users $310,400 IBM Area 500
Beyond Plan
Horizon
NW 75th St Area 500 No NE
TOTALS 1,700 Users $1.1m $655/ User 7,400 Users $4.2m $573 / User
2.1
Packet Pg. 41

Chapter 12: Transit Financial Assessment 35
2021-2045 Prospectus for the Primary Transit Network (PTN)
The PTN is a proposed transit network centered on downtown Rochester that will feature higher frequency, higher speed transit service with modern amenities that connect major centers of activity (downtown, employment centers, higher education, shopping) along a select set of corridors planned for mixed-use, transit oriented development along with service to a number of Park and Ride facilities in the city. The PTN corridors are envisioned ultimately to be served by Bus Rapid Transit (BRT), which frames both a service concept as well as an “infrastructure plan” for transit. Figure 12 frames the features that will distinguish BRT service from standard fixed route transit service in the city.
Figure 12: Features of Bus Rapid Transit
One of main attractions of PTN service will be standard 15 (peak) and 20 minute service across an 18 hour (weekday) or 14 hour (weekend) service period. As proposed in the City Comprehensive Plan, the ultimate plan is for core PTN network on the Broadway Ave and 2nd St SW / 4th St SE corridors, with long term extensions serving northwest areas on the 7th St / Valleyhigh Dr, 37th St NW, and West Circle Dr Corridors. The network is illustrated in Figure 13.
2.1
Packet Pg. 42
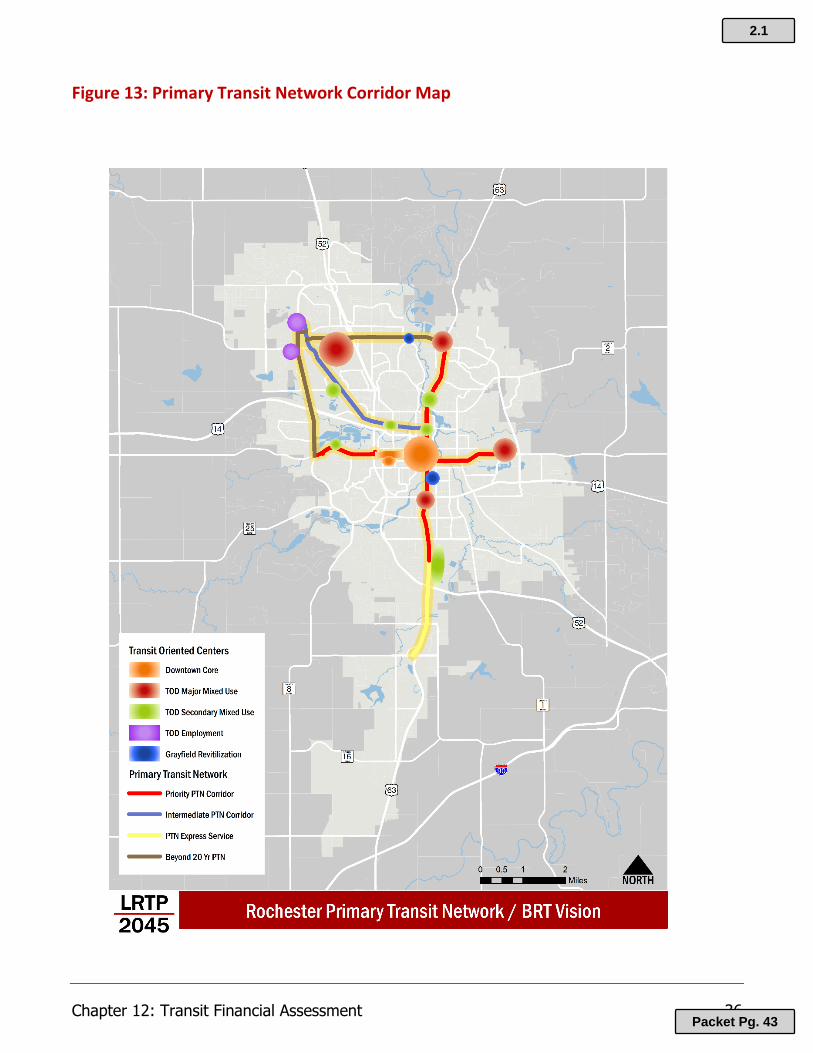
Chapter 12: Transit Financial Assessment 36
Figure 13: Primary Transit Network Corridor Map
2.1
Packet Pg. 43

Chapter 12: Transit Financial Assessment 37
Estimated Costs associated with development and operation of the PTN network are summarized in Table 20.
Table 20: PTN Development and Service Costs
Annual Operating Costs
PTN Route Peak
Vehicles Off Peak Vehicles
Travel Time
Annual Vehicle Hours
Annual Operating
Cost
Broadway Ave Corridor 6 4 35 min
33,700 $3,835,000
2nd St SW / 4th St SE Corridor 4 4 22 min
24,520 $2,790,000
7th St NW / Valleyhigh Corridor 4 4 24 min
24,520 $2,790,000
37th S NW Corridor 4 4 14 min
24,520 $2,790,000
West Circle Dr Corridor 2 2 8 min
12,260 $1,400,000
Totals 20 18
119,520 $ 13,605,000
Development Costs
PTN Route
Corridor Length
(mi) Stations
Project Costs
(millions) Timing Escalated
Cost (millions)
Broadway Ave Corridor 9 11* $12.6 Near Term $15.3
2nd St SW / 4th St SE Corridor 5 4* $3.5 Mid Tern $5.0
7th St NW / Valleyhigh Corridor 5 4 $7.0 Long Term $12.6
37th S NW Corridor 5.5 5 $7.7 Post-2045 $16.1
West Circle Dr Corridor 8 6 $11.2 Post-2045 $23.5
*The PTN will share stations with Downtown Rapid Transit on this corridors Totals 32.5 miles $42.0 million $72.5
It is estimated that development of the Broadway Corridor will allow certain regular fixed route service routes to be eliminated, providing a cost savings that can be applied to PTN operations. This is estimated to be approximately $1.13 million dollars. Development
2.1
Packet Pg. 44

Chapter 12: Transit Financial Assessment 38
costs include station costs, pedestrian improvements along the corridors, communications and traffic control infrastructure such as transit signal priority and real time information systems, lighting improvements and construction related items such as project and construction management. Figure 14 illustrates a conceptual plan for station locations are targeted areas in need of pedestrian improvement along the PTN corridors.
Figure 14: PTN Network Concept Plan for Stations / Pedestrian Enhancement
2.1
Packet Pg. 45

Chapter 12: Transit Financial Assessment 39
Appendix: Funding Risks
NOTE: This information comes from State Transit Investment Plan and discusses prospects for state funding transit assistance targets to met by available state funds.
With the planned expansions to achieve the goal of meeting 90 percent of (estimated transit) need by 2025, expenses will start to exceed revenues in 2021 (Figure 9-14). By 2025, the annual deficit between revenues and expenses will climb to about $31 million. It will increase by about $5 million per year.
Figure 9-14. Program Revenues, Expenses and Cost Gap
Greater Minnesota transit is fortunate to have an existing balance in the Greater Minnesota Transit Account (GMTA). Figure 9-15 illustrates the balance. Each year shows to bars reflecting the balance before and after the annual MVLST deposit is made. The green bar depicts the GMTA balance after the books are closed after a fiscal year. The red bar depicts the GMTA balance just before that year’s MVLST revenues are deposited. That deposit happens at the end of the fiscal year. As shown in Figure 9-15, by 2024, the
2.1
Packet Pg. 46

Chapter 12: Transit Financial Assessment 40
positive balance in the GMTA will be exhausted and additional funding will be needed from that year forward to continue to meet 90 percent of the transit need. MnDOT strives to keep a $10 million balance in the GMTA so it can help transit systems in emergencies as well as to weather lower than expected revenues. To achieve the goal by 2025 and hold there through 2027 (in other words, the next ten-year period of 2018 through 2027) will require approximately $120 million of additional revenue. This is based on the $110 million deficit shown by the red bar in 2027 plus the $10 million minimum balance MnDOT strives to maintain.
Figure 9-15: Greater Minnesota Transit Account Balance
MnDOT’s first priority for Greater Minnesota transit is to fund each system at a level sufficient to sustain the current level of service and add additional hours to reach the baseline span of service. Greater Minnesota transit is fortunate to currently have the resources to start on a path of expansion. However, financial conditions could change over time such that a transition to a preservation or contraction investment scenario would be required. If there weren’t enough funds to sustain a level of service, MnDOT would depend on
2.1
Packet Pg. 47

Chapter 12: Transit Financial Assessment 41
local transit providers to prioritize their services and, if necessary, eliminate the lowest.
The scenarios that follow comply with the above investment scenario model. The fiscally constrained scenario expands service according to the baseline plan until the expected revenues can no longer support expansion. Then it preserves that level of service through the remainder of the 2018 to 2027 period. The pilot program scenarios accelerate the expansion earlier to provide mobility benefits to the citizens of Greater Minnesota longer. They both reach a point where expected revenues are exhausted and would either need an injection of more revenue or a transition to the contraction funding scenario in the later years.
2.1
Packet Pg. 48

Olmsted County Planning Department 2122 Campus Drive SE, Suite 100, Rochester MN 55904
507 328-7100 www.rocogmn.org
Memo Date: 6/18/20 To: ROCOG Policy Board From: Charlie Reiter – Principal Transportation Planner Subject: 2045 Long Range Plan Background Review
Financial Assessment – Street and Highway Network (Chapter 11) Action: Review and Comment
NOTE: It is my intent to send information regarding the financial assessment of the Street and Highway Network out to Policy Board on Monday. Preparation of this information is still in progress, and we have a Technical Advisory Committee meeting on Monday morning, whose review I would like to have before sending out the final packet.
Charlie
2.2
Packet Pg. 49
Olmsted County Planning Department 2122 Campus Drive SE, Suite 100, Rochester MN 55904
507 328-7100 www.rocogmn.org
Memo Date: June 17, 2020 To: ROCOG Board Members From: Ben Griffith, Executive Director Subject: Retirement Action: None - Informational
Transportation Planning Coordinator Dave Pesch has been with Olmsted County providing transportation planning for ROCOG for the past 22 years. July 2nd will be Dave’s last day, when he will grab his tennis racket and ride his bicycle off into the retirement sunset. The June 24th ROCOG meeting will be Dave’s last. Please be sure to join us in wishing him well in his retirement!
Olmsted County Deputy Administrator Mike Sheehan will also be retiring after 43 years of service to Olmsted County. His last day will be July 6th and he plans to travel and spend time with his wife and 10 grandchildren!
3.1
Packet Pg. 50

Olmsted County Planning Department 2122 Campus Drive SE, Suite 100, Rochester MN 55904
507 328-7100 www.rocogmn.org
Memo Date: June 17, 2020 To: ROCOG Board Members From: Ben Griffith, Executive Director Subject: INVEST in America Act Action: None - Informational
From the June 3, 2020 Association of Metropolitan Planning Organizations (AMPO) newsletter:
Committee Leaders Unveil the INVEST in America Act, a Transformational Surface Transportation Bill to Bring Nation’s Infrastructure into a New Era
Washington, DC - Today, Chair of the House Committee on Transportation and Infrastructure Peter DeFazio (D-OR), released text of the Investing in a New Vision for the Environment and Surface Transportation in America (INVEST in America) Act, a key component of the Moving Forward Framework that House Democrats, led by Chair DeFazio, released earlier this year. The bill’s original cosponsors are Subcommittee on Highways and Transit Chair Eleanor Holmes Norton and Subcommittee on Railroads, Pipelines, and Hazardous Materials Chair Dan Lipinski. The Committee will consider the INVEST in America Act at a Committee markup scheduled for Wednesday, June 17th. The current surface transportation authorization expires September 30th.
The INVEST in America Act, which enables the completion of critical projects through long-term, sustainable funding and is fueled by American workers and ingenuity thanks to strong Buy America provisions and labor protections, authorizes nearly $500 billion over five years to address some of the country’s most urgent infrastructure needs, including:
• Tackling the massive backlog of roads, bridges, and transit systems in need of repair and replacement
• Building resilient infrastructure that will withstand the impacts of climate change and extreme weather
• Designing streets that are safer for all road users, including pedestrians and cyclists
• Putting the U.S. on a path toward zero emissions from the transportation sector by prioritizing carbon pollution reduction, investing in public transit and the national rail
3.2
Packet Pg. 51

INVEST in America Act 2
network, building out fueling infrastructure for low- and zero-emission vehicles, and deploying technology and innovative materials
• Sharply increasing funding for public transit options in urban, suburban and rural areas in order to integrate technology and increase routes and reliability with tools such as bus-only lanes and priority signaling
• Making transformational investments in Amtrak in order to create a robust, reliable rail system and to address long-neglected maintenance needs in the Northeast Corridor and throughout the country while also enhancing rail worker and passenger safety and helping communities address grade crossing issues
• Improving access to Federal funding to help communities around the country undertake transformative projects that are smarter, safer, and made to last
The INVEST in America Act also accounts for the economic downturn caused by the global pandemic and ensures States, cities, tribes, territories, and transit agencies can administer programs, advance projects, and preserve jobs in the aftermath of the COVID-19 crisis. The INVEST in America Act authorizes a sharp increase in funding to continue current programs in the first year of enactment of the bill (FY 2021) with wider policy implementation occurring in FY 2022.
“The bulk of our nation’s infrastructure—our roads, bridges, public transit and rail systems, the things that hundreds of millions of American families and businesses rely on every single day— is not only badly outdated, in many places it’s downright dangerous and holding our economy back. Yet for decades, Congress has repeatedly ignored the calls for an overhaul and instead simply poured money into short-term patches. The result? We’re still running our economy on an inefficient, 1950s-era system that costs Americans increasingly more time and money while making the transportation sector the nation’s biggest source of carbon pollution,” Chair DeFazio said. “That all changes with the INVEST in America Act. After holding nearly 20 Committee hearings, receiving testimony from dozens and dozens of witnesses and Members of Congress, and engaging with hundreds of advocates and transportation agencies, I am proud to bring together the ideas and the needs into one transformational bill that will catapult our country into a new era of how we plan, build, and improve U.S. infrastructure. The INVEST in America Act is our opportunity to replace the outdated systems of the past with smarter, safer, more resilient infrastructure that fits the economy of the future, creates millions of jobs, supports American manufacturing, and restores U.S. competitiveness.”
“I am proud to have joined with Chair DeFazio and Chair Norton to craft this innovative bill that not only makes robust investments in roads, bridges, passenger rail, transit, bike/ped, and other infrastructure, but will also profoundly transform mobility, protect the environment, and improve the quality of life for all Americans," Chair Lipinski said. "As Chairman of the Rail Subcommittee, I am especially proud of the significant increase in funding and other support for commuter rail as well as Amtrak, and provisions to help eliminate problems for communities heavily impacted by railroads."
3.2
Packet Pg. 52
Presentations Shown During Meeting
4.1
Packet Pg. 53

Chapter 11Street & Highway System
Development & Preservation Costs
ROCOG Policy BoardJune.24.2020
4.1
Packet Pg. 54

Main Categories of Street and Highway System Costs
Street System Improvement Costs Regional Highway Access Upgrades (Interchanges / Major Intersections) Regional Highway Access Management (Grade Separation / Supporting Road Network) Regional Network Development / Improve Safety & Mobility Urban Major Network / Improve Safety & Mobility Urban Major Network Development / Support Growth Management Plan Urban Major Network Development / Support Economic Development Safety & Mobility Programs Rail Crossing (Illustrative)
Street System Preservation Costs Street Preservation Bridge Network Preservation MNDOT / Olmsted / Rochester
4.1
Packet Pg. 55

Expected Funding Available to Road Agencies for Capital Projects
$313.60
$600
$367
$12.55 $24 $14.60 $0.00
$100.00
$200.00
$300.00
$400.00
$500.00
$600.00
$700.00
MNDOT Olmsted Rochester
Expected Road Agency Revenues2021-2045
Millions of Dollars
25 Year Revenues Annual Average
4.1
Packet Pg. 56
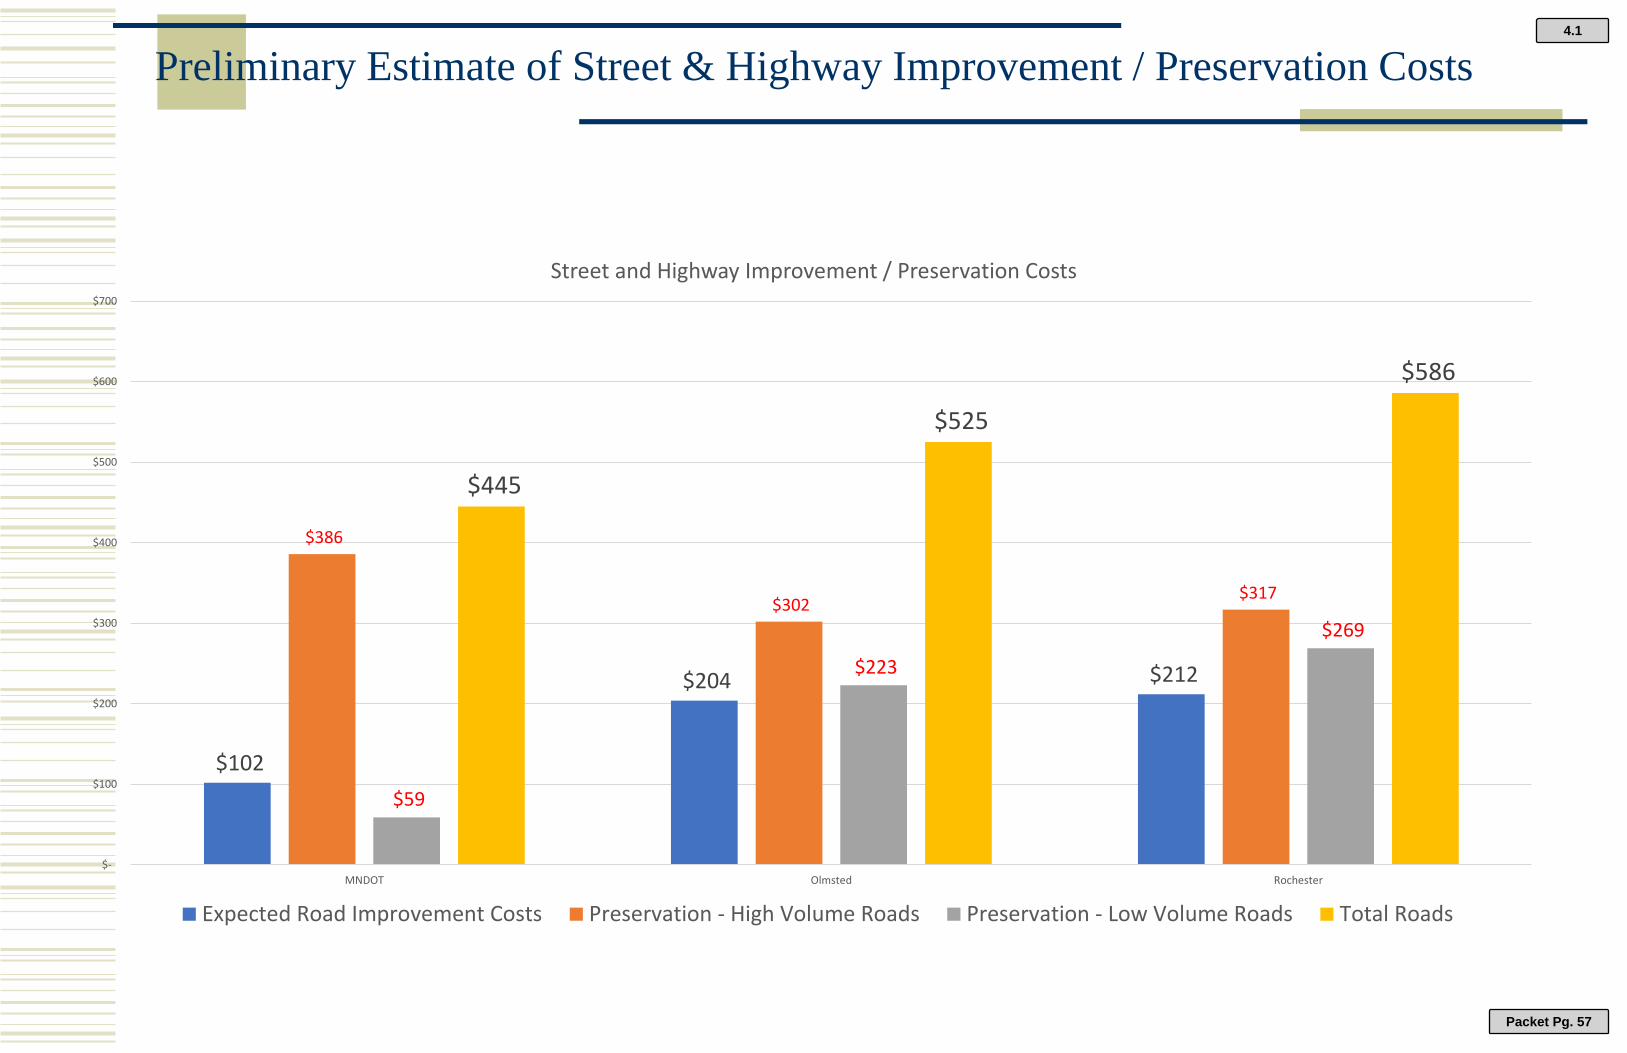
Preliminary Estimate of Street & Highway Improvement / Preservation Costs
$102
$204 $212
$386
$302 $317
$59
$223
$269
$445
$525
$586
$-
$100
$200
$300
$400
$500
$600
$700
MNDOT Olmsted Rochester
Street and Highway Improvement / Preservation Costs
Expected Road Improvement Costs Preservation - High Volume Roads Preservation - Low Volume Roads Total Roads
4.1
Packet Pg. 57
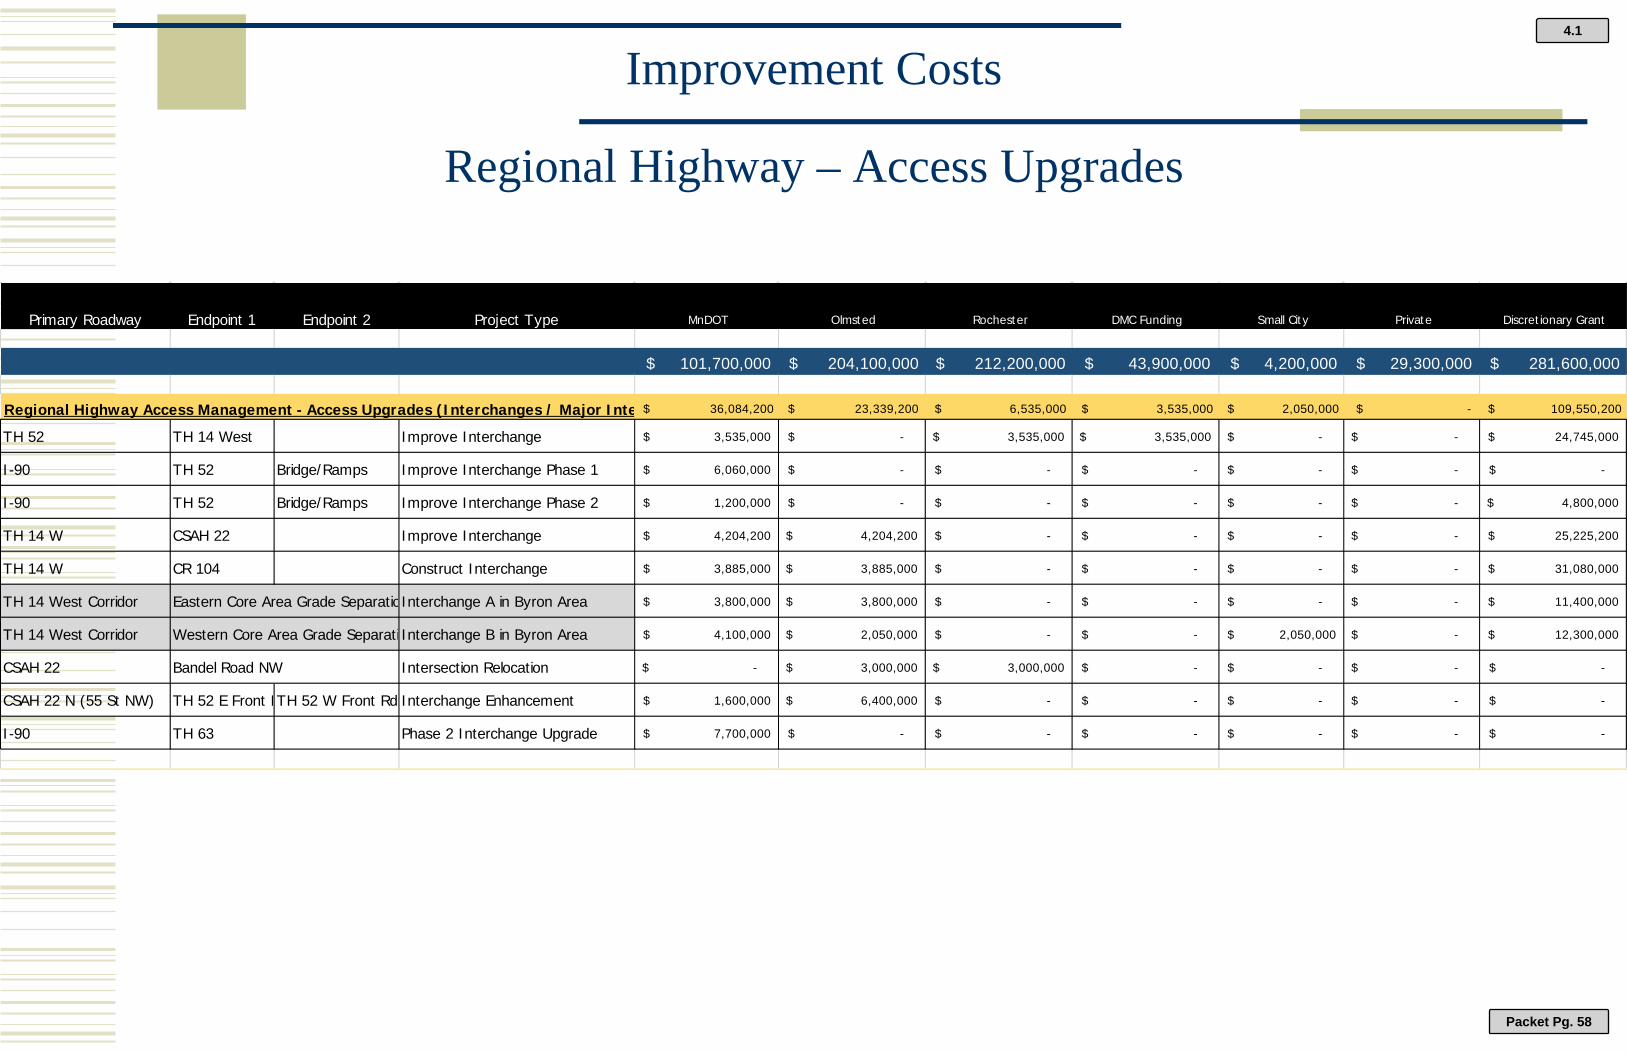
Improvement Costs
Regional Highway – Access Upgrades
Primary Roadway Endpoint 1 Endpoint 2 Project Type MnDOT Olmsted Rochester DMC Funding Small City Private Discretionary Grant
$ 101,700,000 $ 204,100,000 $ 212,200,000 $ 43,900,000 $ 4,200,000 $ 29,300,000 $ 281,600,000
Regional Highway Access Management - Access Upgrades (Interchanges / Major Inte $ 36,084,200 $ 23,339,200 $ 6,535,000 $ 3,535,000 $ 2,050,000 $ - $ 109,550,200
TH 52 TH 14 West Improve Interchange 3,535,000$ -$ 3,535,000$ 3,535,000$ -$ -$ 24,745,000$
I-90 TH 52 Bridge/Ramps Improve Interchange Phase 1 6,060,000$ -$ -$ -$ -$ -$ -$
I-90 TH 52 Bridge/Ramps Improve Interchange Phase 2 1,200,000$ -$ -$ -$ -$ -$ 4,800,000$
TH 14 W CSAH 22 Improve Interchange 4,204,200$ 4,204,200$ -$ -$ -$ -$ 25,225,200$
TH 14 W CR 104 Construct Interchange 3,885,000$ 3,885,000$ -$ -$ -$ -$ 31,080,000$
TH 14 West Corridor Eastern Core Area Grade SeparatioInterchange A in Byron Area 3,800,000$ 3,800,000$ -$ -$ -$ -$ 11,400,000$
TH 14 West Corridor Western Core Area Grade Separati Interchange B in Byron Area 4,100,000$ 2,050,000$ -$ -$ 2,050,000$ -$ 12,300,000$
CSAH 22 Bandel Road NW Intersection Relocation -$ 3,000,000$ 3,000,000$ -$ -$ -$ -$
CSAH 22 N (55 St NW) TH 52 E Front RTH 52 W Front Rd Interchange Enhancement 1,600,000$ 6,400,000$ -$ -$ -$ -$ -$
I-90 TH 63 Phase 2 Interchange Upgrade 7,700,000$ -$ -$ -$ -$ -$ -$
4.1
Packet Pg. 58

Improvement Costs
Regional Highway Access Managment
Primary Roadway Endpoint 1 Endpoint 2 Project Type MnDOT Olmsted Rochester DMC Funding Small City Private Discretionary Grant
$ 101,700,000 $ 204,100,000 $ 212,200,000 $ 43,900,000 $ 4,200,000 $ 29,300,000 $ 281,600,000
Regional Highway Access Management - Access Management (Overpass / Supporting $ 25,194,150 $ 18,506,150 $ 2,563,000 $ - $ 785,000 $ - $ 5,610,000
TH 52 TH 14 West Interim Interchange Safety Project 1,500,000$ -$ -$ -$ -$ -$ -$
TH 14 W CSAH 22 Interim Interchange Safety Project 750,000$ 750,000$ -$ -$ -$ -$ -$
TH 14 W CR 104 Interim Intersection Safety Project 1,000,000$ 1,000,000$ -$ -$ -$ -$ -$
TH 63 S 60th St S 80th St S Mainline Access Replacement 2,563,000$ -$ 2,563,000$ -$ -$ -$ -$
TH 63 N CSAH 14 E MN 247 Access Mitigation 500,000$ -$ -$ -$ -$ -$ -$
TH 14 West Corridor Suburban Grade Separation Overpass / Interchange Constructio 8,000,000$ 8,000,000$ -$ -$ -$ -$ -$
TH 14 West Corridor 14th ST NW TH 14 Connectivity Improvements 1,250,000$ 1,250,000$ -$ -$ -$ -$ -$
TH 14 West Corridor 7th St / 4th St TH 14 Connectivity Improvements 660,000$ 660,000$ -$ -$ 660,000$ -$ -$
TH 14 West Corridor CSAH 5 / CSAH 15 TH 14 Connectivity Improvements 5,610,000$ 5,610,000$ -$ -$ -$ -$ 5,610,000$
T 14 West Corridor CSAH 3 / County Line Rd Interim Intersection Safety Project 250,000$ 250,000$ -$ -$ -$ -$ -$
TH 14 E 40th Av SE 0.8 mi E of CSAH 19Access Mitigation 2,000,000$ -$ -$ -$ -$ -$ -$
TH 63 N CR 154 CSAH 33 Access Mitigation 861,150$ 861,150$ -$ -$ -$ -$ -$
TH 63 S CSAH 35 High Cost Intersection 250,000$ 125,000$ -$ -$ 125,000$ -$ -$
4.1
Packet Pg. 59

Improvement Costs
Regional Network Development / Improve Mobility & SafetyPrimary Roadway Endpoint 1 Endpoint 2 Project Type MnDOT Olmsted Rochester DMC Funding Small City Private Discretionary Grant
$ 101,700,000 $ 204,100,000 $ 212,200,000 $ 43,900,000 $ 4,200,000 $ 29,300,000 $ 281,600,000
Regional Network Development / Improve Safety & Mobility $ - $ 39,209,413 $ 344,181 $ - $ - $ - $ -
CSAH 44 55 St NW 65 St NW Suburban Safety/Mobility Upgrade -$ 2,745,345$ 305,038$ -$ -$ -$ -$
CR 104 CSAH 34 CR 117 Suburban Safety / Mobility Upgrade -$ 4,406,053$ -$ -$ -$ -$ -$
CSAH 44 65 St NW 75 St NW Suburban Safety/Mobility Upgrade -$ 3,123,508$ -$ -$ -$ -$ -$
CSAH 11 CSAH 36 TH 14 Safety / Shoulder Enhancement -$ 722,915$ -$ -$ -$ -$ -$
CSAH 11 TH 14 CSAH 9 Safety / Shoulder Enhancement -$ 174,899$ -$ -$ -$ -$ -$
CSAH 11 CSAH 9 CSAH 2 Safety / Shoulder Enhancement -$ 764,891$ -$ -$ -$ -$ -$
CSAH 11 CSAH 2 CSAH 14 E Safety / Shoulder Enhancement -$ 699,595$ -$ -$ -$ -$ -$
CR 117 CR 104 CSAH 8 Suburban Safety/Mobility Upgrade -$ 4,162,858$ -$ -$ -$ -$ -$
CSAH 1 CR 101 CR 111 Suburban Safety/Mobility Upgrade -$ 408,097$ -$ -$ -$ -$ -$
CSAH 1 TH 52 CR 101 Suburban Safety/Access Upgrade -$ 743,702$ 39,142$ -$ -$ -$ -$
CSAH 14 E TH 63 N CSAH 11 Suburban Safety/Mobility Upgrade -$ 734,575$ -$ -$ -$ -$ -$
CSAH 14 W TH 52 W Frntge50 Av NW Suburban Safety/Mobility Upgrade -$ 2,127,212$ -$ -$ -$ -$ -$
CSAH 14 W 50 Av NW 60 Av NW Suburban Safety/Mobility Upgrade -$ 2,127,212$ -$ -$ -$ -$ -$
CSAH 8 CR 125 CR 117 Suburban Safety/Mobility Upgrade -$ 5,303,383$ -$ -$ -$ -$ -$
48 St NE CR 124 CSAH 11 Suburban Safety/Mobility Upgrade -$ 10,965,167$ -$ -$ -$ -$ -$
4.1
Packet Pg. 60

Improvement Costs
Urban Major Development / Improve Safety and Mobility
Primary Roadway Endpoint 1 Endpoint 2 Project Type MnDOT Olmsted Rochester DMC Funding Small City Private Discretionary Grant
$ 101,700,000 $ 204,100,000 $ 212,200,000 $ 43,900,000 $ 4,200,000 $ 29,300,000 $ 281,600,000
Urban Major Network Development / Improve Safety & Mobility $ - $ 430,743 $ 41,991,428 $ 20,800,152 $ - $ 4,646,012 $ 29,554,623
North Broadway Av Civic Center Dr 14th St NorthMajor Arterial Multi-Modal / Safety Modernization
-$ -$ 4,738,000$ 4,738,000$ -$ 1,895,200$ 7,580,800$
N Broadway Av 14 St NE Northern Heights DMajor Arterial Multi-Modal / Safety Modernization
-$ -$ 6,487,877$ 1,081,313$ -$ 1,081,313$ 2,162,626$
S Broadway Av 14th St S 28 St S Major Arterial Multi-Modal / Safety Modernization -$ 430,743$ 10,337,827$ -$ -$ 861,486$ 5,599,656$
N Broadway Av Northern Height37 St NE Major Arterial Multi-Modal / Safety Modernization -$ -$ 9,696,168$ -$ -$ 808,014$ 5,656,098$
Civic Center Dr N Broadway Av 16 Av NW Urban Core Capacity Project -$ -$ 6,416,582$ 6,416,582$ -$ -$ 8,555,443$
2nd St SW TH 52 W FrntgeBroadway Transit Mobility Corridor -$ -$ -$ -$ -$ -$ -$
DMC South Gateway 2nd St South 14th St South Transit Mobility Corridor -$ -$ -$ -$ -$ -$ -$
DMC Broadway Ave 2 St South 6 St North Major Arterial Multi-Modal / Safety Modernization -$ -$ 4,314,974$ 8,564,257$ -$ -$ -$
4.1
Packet Pg. 61
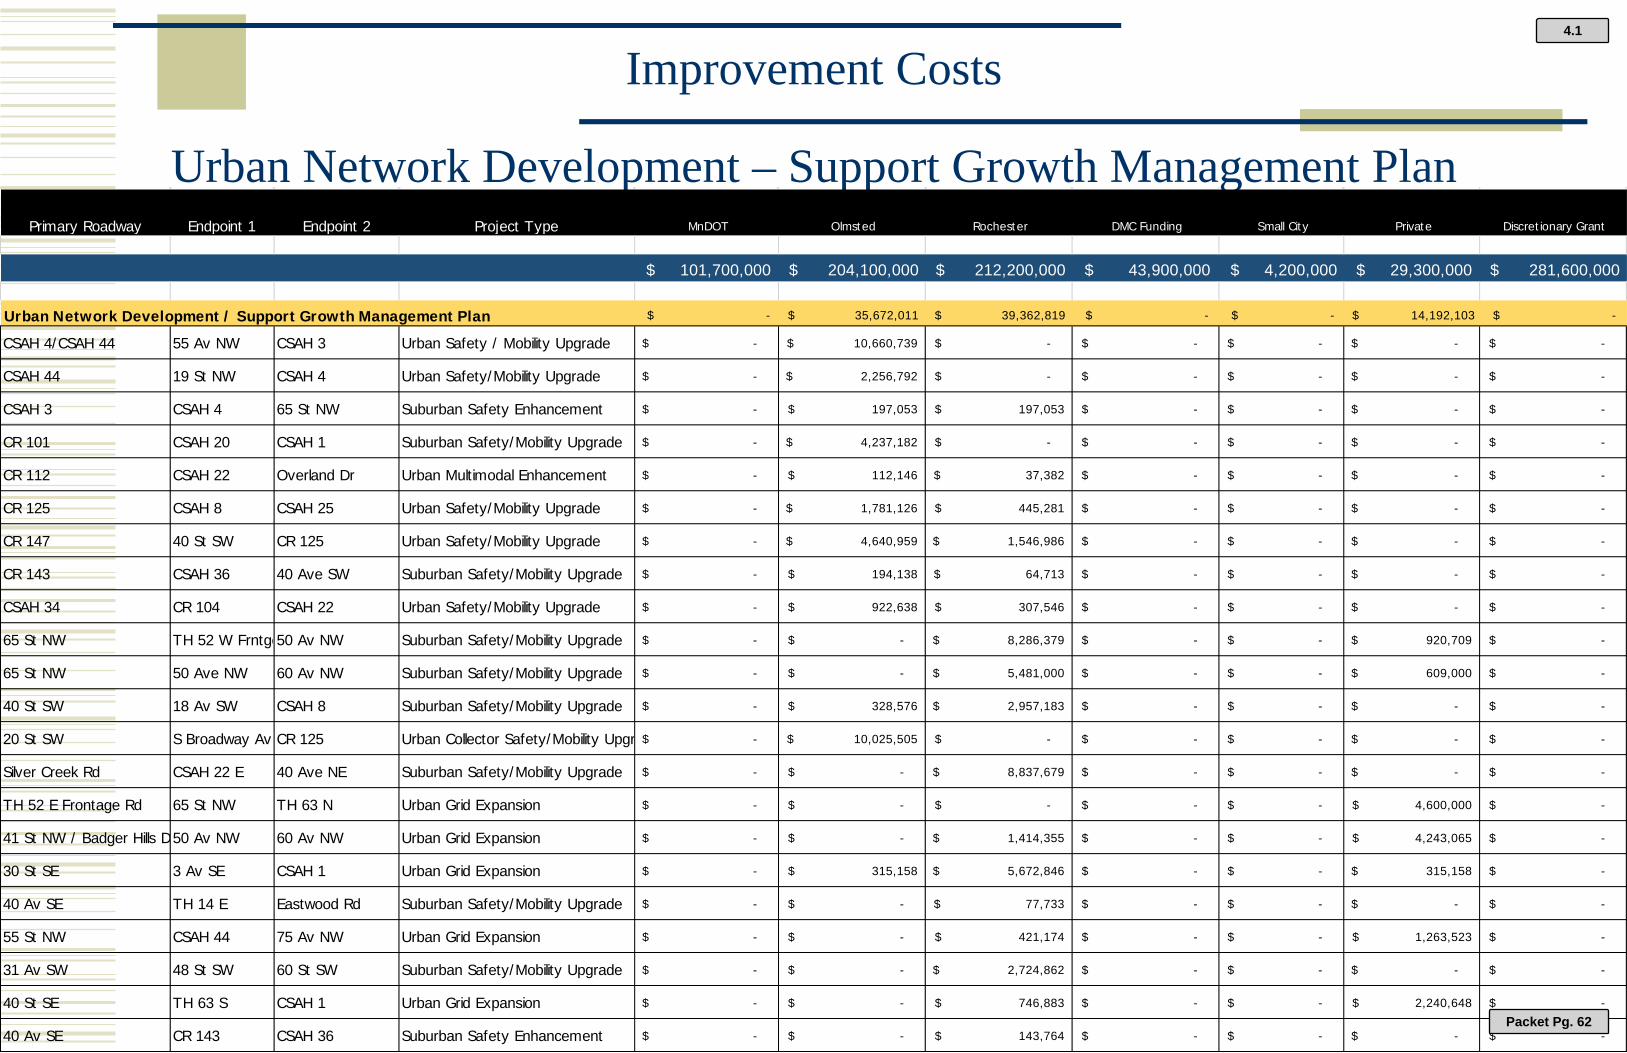
Improvement Costs
Urban Network Development – Support Growth Management PlanPrimary Roadway Endpoint 1 Endpoint 2 Project Type MnDOT Olmsted Rochester DMC Funding Small City Private Discretionary Grant
$ 101,700,000 $ 204,100,000 $ 212,200,000 $ 43,900,000 $ 4,200,000 $ 29,300,000 $ 281,600,000
Urban Network Development / Support Growth Management Plan $ - $ 35,672,011 $ 39,362,819 $ - $ - $ 14,192,103 $ -
CSAH 4/CSAH 44 55 Av NW CSAH 3 Urban Safety / Mobility Upgrade -$ 10,660,739$ -$ -$ -$ -$ -$
CSAH 44 19 St NW CSAH 4 Urban Safety/Mobility Upgrade -$ 2,256,792$ -$ -$ -$ -$ -$
CSAH 3 CSAH 4 65 St NW Suburban Safety Enhancement -$ 197,053$ 197,053$ -$ -$ -$ -$
CR 101 CSAH 20 CSAH 1 Suburban Safety/Mobility Upgrade -$ 4,237,182$ -$ -$ -$ -$ -$
CR 112 CSAH 22 Overland Dr Urban Multimodal Enhancement -$ 112,146$ 37,382$ -$ -$ -$ -$
CR 125 CSAH 8 CSAH 25 Urban Safety/Mobility Upgrade -$ 1,781,126$ 445,281$ -$ -$ -$ -$
CR 147 40 St SW CR 125 Urban Safety/Mobility Upgrade -$ 4,640,959$ 1,546,986$ -$ -$ -$ -$
CR 143 CSAH 36 40 Ave SW Suburban Safety/Mobility Upgrade -$ 194,138$ 64,713$ -$ -$ -$ -$
CSAH 34 CR 104 CSAH 22 Urban Safety/Mobility Upgrade -$ 922,638$ 307,546$ -$ -$ -$ -$
65 St NW TH 52 W Frntge50 Av NW Suburban Safety/Mobility Upgrade -$ -$ 8,286,379$ -$ -$ 920,709$ -$
65 St NW 50 Ave NW 60 Av NW Suburban Safety/Mobility Upgrade -$ -$ 5,481,000$ -$ -$ 609,000$ -$
40 St SW 18 Av SW CSAH 8 Suburban Safety/Mobility Upgrade -$ 328,576$ 2,957,183$ -$ -$ -$ -$
20 St SW S Broadway Av CR 125 Urban Collector Safety/Mobility Upgr -$ 10,025,505$ -$ -$ -$ -$ -$
Silver Creek Rd CSAH 22 E 40 Ave NE Suburban Safety/Mobility Upgrade -$ -$ 8,837,679$ -$ -$ -$ -$
TH 52 E Frontage Rd 65 St NW TH 63 N Urban Grid Expansion -$ -$ -$ -$ -$ 4,600,000$ -$
41 St NW / Badger Hills D50 Av NW 60 Av NW Urban Grid Expansion -$ -$ 1,414,355$ -$ -$ 4,243,065$ -$
30 St SE 3 Av SE CSAH 1 Urban Grid Expansion -$ 315,158$ 5,672,846$ -$ -$ 315,158$ -$
40 Av SE TH 14 E Eastwood Rd Suburban Safety/Mobility Upgrade -$ -$ 77,733$ -$ -$ -$ -$
55 St NW CSAH 44 75 Av NW Urban Grid Expansion -$ -$ 421,174$ -$ -$ 1,263,523$ -$
31 Av SW 48 St SW 60 St SW Suburban Safety/Mobility Upgrade -$ -$ 2,724,862$ -$ -$ -$ -$
40 St SE TH 63 S CSAH 1 Urban Grid Expansion -$ -$ 746,883$ -$ -$ 2,240,648$ -$
40 Av SE CR 143 CSAH 36 Suburban Safety Enhancement -$ -$ 143,764$ -$ -$ -$ -$
4.1
Packet Pg. 62

Improvement Costs
Urban Network Development / Support Economic Development
Primary Roadway Endpoint 1 Endpoint 2 Project Type MnDOT Olmsted Rochester DMC Funding Small City Private Discretionary Grant
$ 101,700,000 $ 204,100,000 $ 212,200,000 $ 43,900,000 $ 4,200,000 $ 29,300,000 $ 281,600,000
Urban Network Development / Support Economic Development $ 253,595 $ - $ 41,441,956 $ 3,615,949 $ - $ 672,471 $ 2,028,757
CSAH 16 / Future MN 30 TH 63 S Braatas Dr Corridor Modernization 253,595$ -$ 253,595$ 253,595$ -$ -$ 2,028,757$
19 St NW Ashland Dr 50 Av NW Suburban Safety/Mobility Upgrade -$ -$ 2,828,710$ -$ -$ -$ -$
19 St NW 50 Av NW CSAH 44 Suburban Safety/Mobility Upgrade -$ -$ 6,070,316$ -$ -$ -$ -$
50 Av NW 19 St NW CSAH 4 Urban Grid Expansion -$ -$ 6,070,316$ -$ -$ -$ -$
East River Rd 44 St NE CSAH 22 N Suburban Safety/Mobility Upgrade -$ -$ 6,765,115$ -$ -$ -$ -$
16 Av NW Civic Center Dr 7 St NW Urban Grid Enhancement -$ -$ 2,270,270$ -$ -$ -$ -$
6 St SE S Broadway Av 3 Av SE Urban Core Grid Enhancement -$ -$ 2,689,883$ 3,362,354$ -$ 672,471$ -$
37 St NW - IBM Campus TH 52 W FrntgeValleyhigh Dr Arterial Grid Expansion -$ -$ 8,404,803$ -$ -$ -$ -$
Commercial Dr 40 St SW 48 St SW Urban Grid Expansion -$ -$ 6,088,948$ -$ -$ -$ -$
4.1
Packet Pg. 63
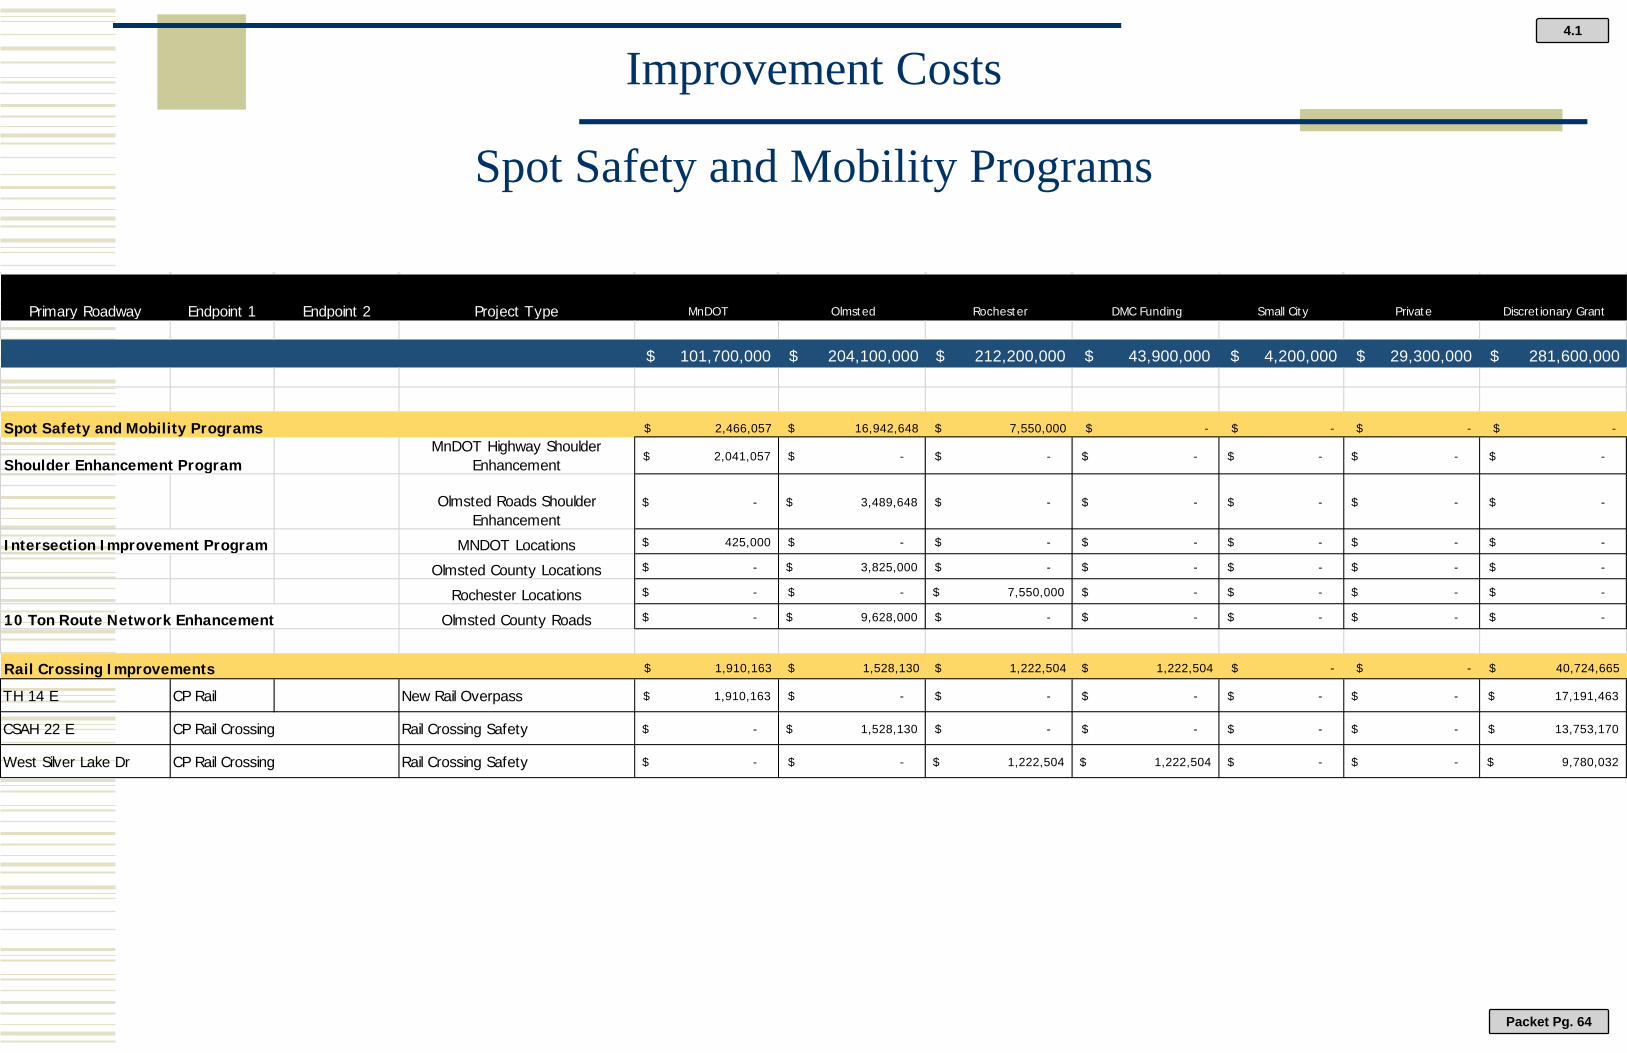
Improvement Costs
Spot Safety and Mobility Programs
Primary Roadway Endpoint 1 Endpoint 2 Project Type MnDOT Olmsted Rochester DMC Funding Small City Private Discretionary Grant
$ 101,700,000 $ 204,100,000 $ 212,200,000 $ 43,900,000 $ 4,200,000 $ 29,300,000 $ 281,600,000
Spot Safety and Mobility Programs $ 2,466,057 $ 16,942,648 $ 7,550,000 $ - $ - $ - $ -
Shoulder Enhancement ProgramMnDOT Highway Shoulder
Enhancement 2,041,057$ -$ -$ -$ -$ -$ -$
Olmsted Roads Shoulder Enhancement
-$ 3,489,648$ -$ -$ -$ -$ -$
Intersection Improvement Program MNDOT Locations 425,000$ -$ -$ -$ -$ -$ -$
Olmsted County Locations -$ 3,825,000$ -$ -$ -$ -$ -$
Rochester Locations -$ -$ 7,550,000$ -$ -$ -$ -$
10 Ton Route Network Enhancement Olmsted County Roads -$ 9,628,000$ -$ -$ -$ -$ -$
Rail Crossing Improvements $ 1,910,163 $ 1,528,130 $ 1,222,504 $ 1,222,504 $ - $ - $ 40,724,665
TH 14 E CP Rail New Rail Overpass 1,910,163$ -$ -$ -$ -$ -$ 17,191,463$
CSAH 22 E CP Rail Crossing Rail Crossing Safety -$ 1,528,130$ -$ -$ -$ -$ 13,753,170$
West Silver Lake Dr CP Rail Crossing Rail Crossing Safety -$ -$ 1,222,504$ 1,222,504$ -$ -$ 9,780,032$
4.1
Packet Pg. 64

4.1
Packet Pg. 65
2045 LRTP Background Review
Review of Financial Assessment Transit / Park and Ride (Chapter 12)
ROCOG Policy Board6/24/2020
4.1
Packet Pg. 66

TOMORROW’S TRANSIT / SYSTEM COMPONENTS
• Basic Service: Neighborhood Fixed Route & Dial A Ride• Direct Express / Significant Expansion to meet Downtown Mode Split
Goals• Downtown Rapid Transit • Park and Ride Expansion / Options at different costs• Primary Transit Network / Long Term Anchor for reimagined Fixed
Route System
4.1
Packet Pg. 67

Baseline Transit Service / Two SystemsFixed Route that has been in Place Expansion of Fixed Route Service
4.1
Packet Pg. 68

Pattern of Operating Costs and Funding for Fixed Route Transit
12% 19% 16% 26% 19% 22% 19%21%
45%
56%
46%62%
46% 44%47% 44%
53% 48% 48% 42%40%
26%
25%
10%
$4,359,471
$6,083,428
$6,613,455
$10,655,000
$-
$2,000,000
$4,000,000
$6,000,000
$8,000,000
$10,000,000
$12,000,000
2008 2009 2010 2011 2012 2013 2014 2015 2016 2017 2018 2019 Budg
Funding of Operating Costs for Rochester Fixed Route Transit
Federal Share State GF State MVST Local Share Total
4.1
Packet Pg. 69
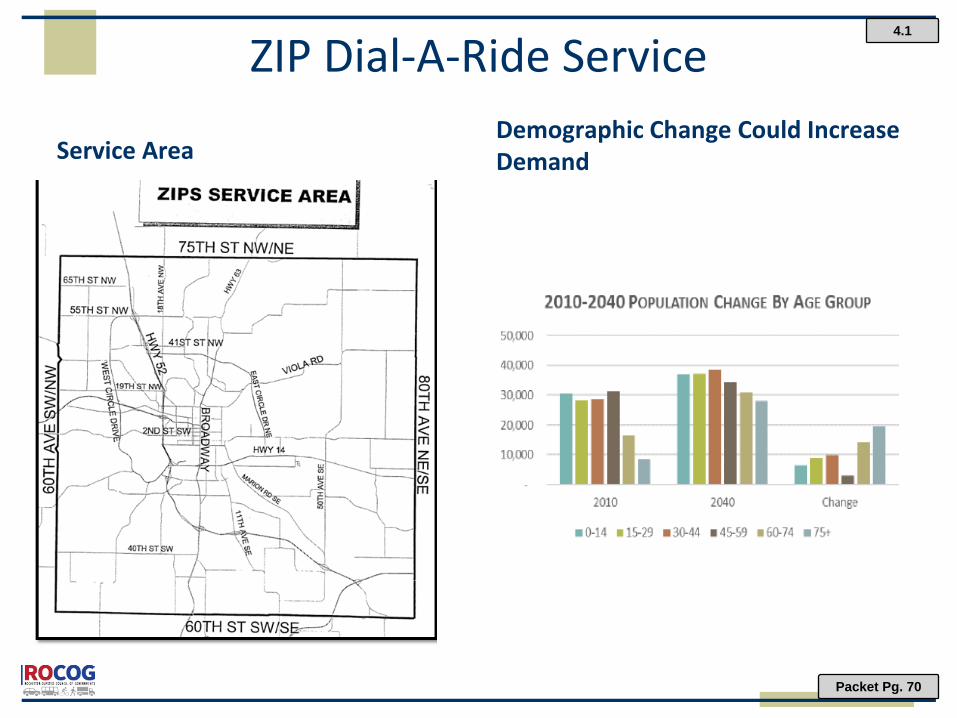
ZIP Dial-A-Ride ServiceDemographic Change Could Increase DemandService Area
4.1
Packet Pg. 70
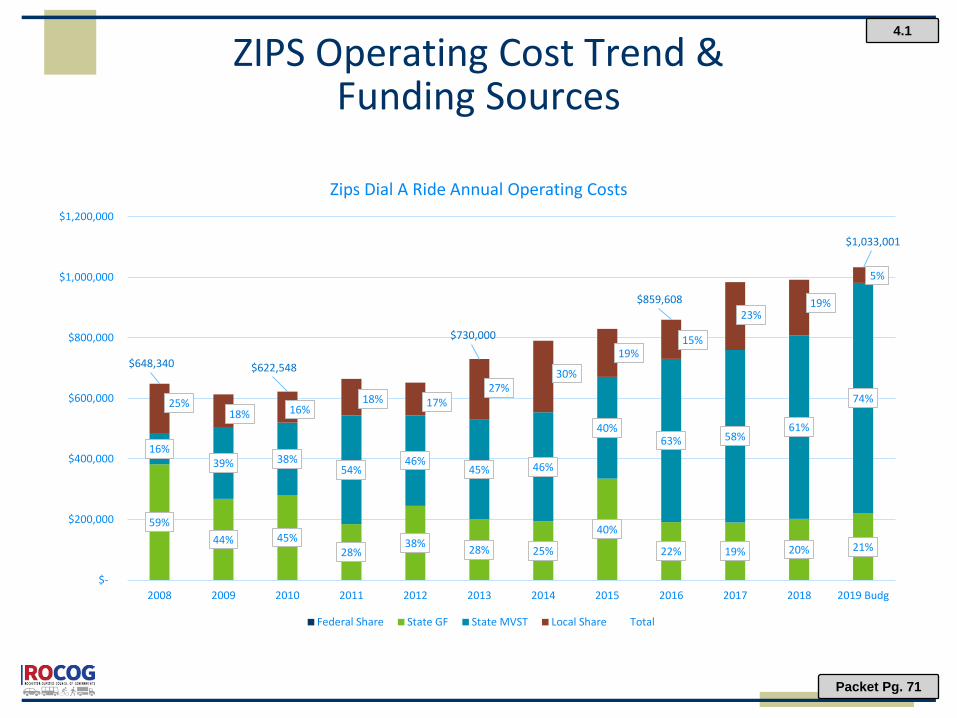
ZIPS Operating Cost Trend &Funding Sources
59%44% 45%
28%38% 28% 25%
40%
22% 19% 20% 21%
16%39% 38%
54%46%
45% 46%
40%63% 58%
61%
74%25%18% 16%
18% 17%27%
30%
19%15%
23%19%
5%
$648,340 $622,548
$730,000
$859,608
$1,033,001
$-
$200,000
$400,000
$600,000
$800,000
$1,000,000
$1,200,000
2008 2009 2010 2011 2012 2013 2014 2015 2016 2017 2018 2019 Budg
Zips Dial A Ride Annual Operating Costs
Federal Share State GF State MVST Local Share Total
4.1
Packet Pg. 71

Estimated 25 Year Cost of Baseline Transit Services
4.1
Packet Pg. 72
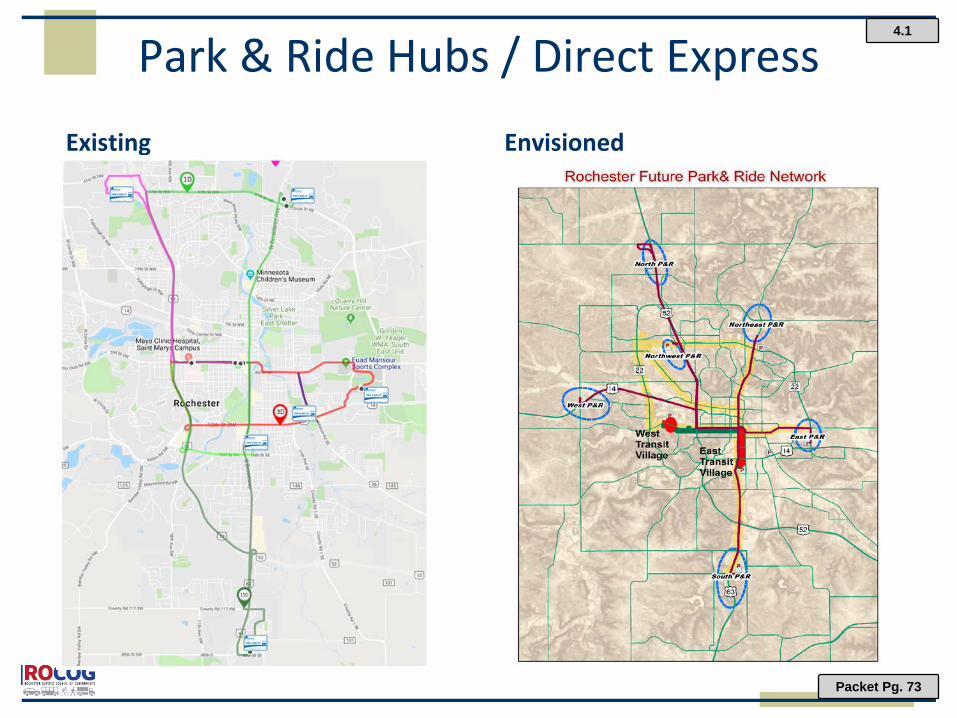
Park & Ride Hubs / Direct ExpressExisting Envisioned
4.1
Packet Pg. 73

Significant Growth in Park & Ride Demand
Mode Today 20 YearsRochester Neighborhood Transit ~1050 ~1650Regional Commuter Bus ~2000 ~3,000Downtown Rapid Transit Commuter Parking 0 ~3500Park and Ride ~1750 ~5600-5700Total 4,800 13,800
4.1
Packet Pg. 74
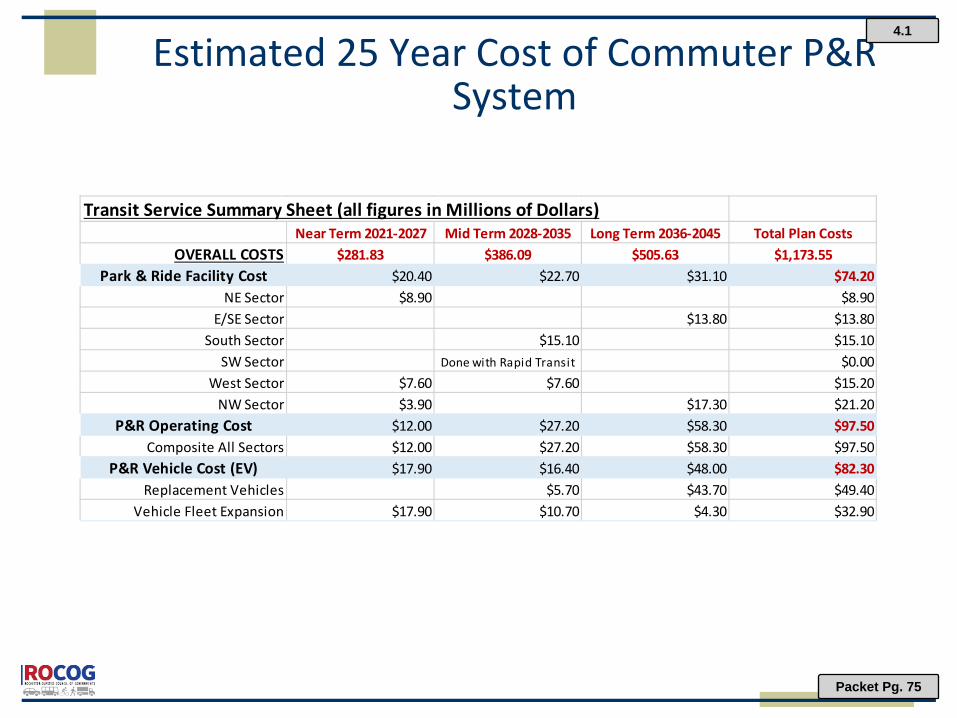
Estimated 25 Year Cost of Commuter P&R System
Transit Service Summary Sheet (all figures in Millions of Dollars)Near Term 2021-2027 Mid Term 2028-2035 Long Term 2036-2045 Total Plan Costs
OVERALL COSTS $281.83 $386.09 $505.63 $1,173.55Park & Ride Facility Cost $20.40 $22.70 $31.10 $74.20
NE Sector $8.90 $8.90E/SE Sector $13.80 $13.80
South Sector $15.10 $15.10SW Sector Done with Rapid Transit $0.00
West Sector $7.60 $7.60 $15.20NW Sector $3.90 $17.30 $21.20
P&R Operating Cost $12.00 $27.20 $58.30 $97.50Composite All Sectors $12.00 $27.20 $58.30 $97.50
P&R Vehicle Cost (EV) $17.90 $16.40 $48.00 $82.30Replacement Vehicles $5.70 $43.70 $49.40
Vehicle Fleet Expansion $17.90 $10.70 $4.30 $32.90
4.1
Packet Pg. 75

Downtown Rapid TransitServing Inner Park & Ride Hubs
Phase 1 of Service
Some Possible Phase 2 Concepts
4.1
Packet Pg. 76
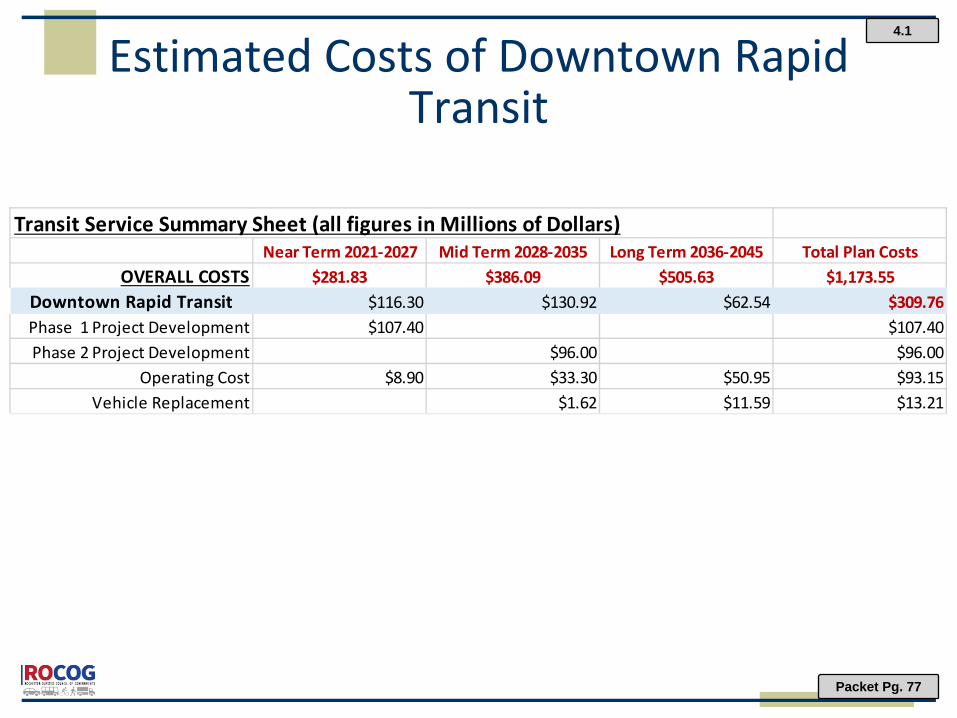
Estimated Costs of Downtown Rapid Transit
Transit Service Summary Sheet (all figures in Millions of Dollars)Near Term 2021-2027 Mid Term 2028-2035 Long Term 2036-2045 Total Plan Costs
OVERALL COSTS $281.83 $386.09 $505.63 $1,173.55Downtown Rapid Transit $116.30 $130.92 $62.54 $309.76Phase 1 Project Development $107.40 $107.40Phase 2 Project Development $96.00 $96.00
Operating Cost $8.90 $33.30 $50.95 $93.15Vehicle Replacement $1.62 $11.59 $13.21
4.1
Packet Pg. 77
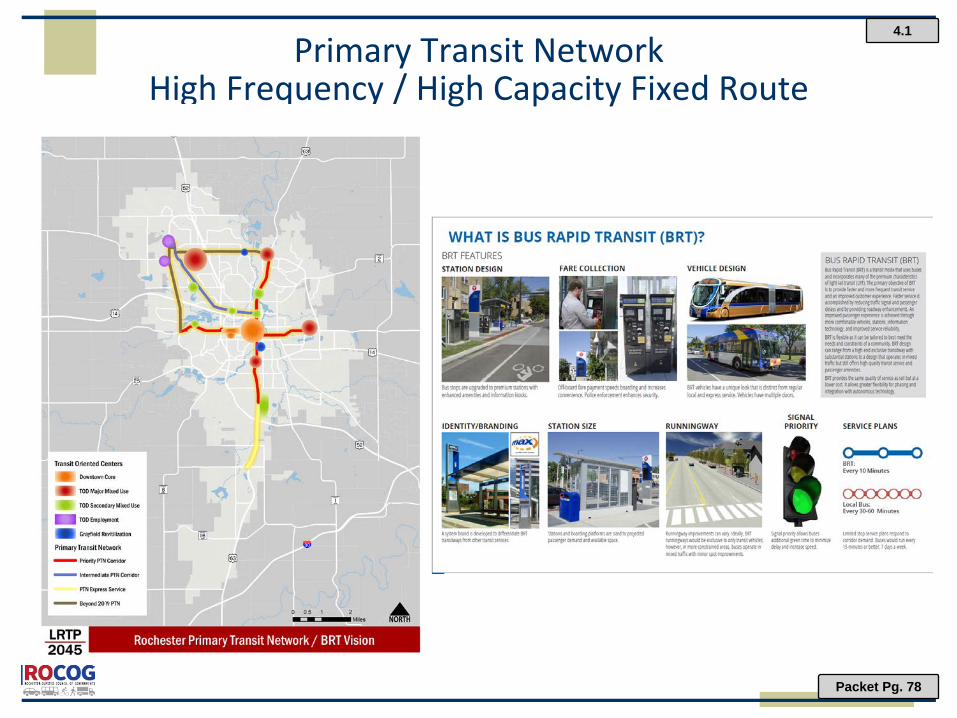
Primary Transit NetworkHigh Frequency / High Capacity Fixed Route
4.1
Packet Pg. 78

Estimated Cost of Primary Transit Network
Transit Service Summary Sheet (all figures in Millions of Dollars)Near Term 2021-2027 Mid Term 2028-2035 Long Term 2036-2045 Total Plan Costs
OVERALL COSTS $281.83 $386.09 $505.63 $1,173.55Primary Transit Network $24.90 $60.30 $127.80 $213.00
Project Development $15.30 $5.00 $12.60 $32.90Vehicle Fleet Expansion (EV) $9.60 $7.00 $9.40 $26.00
Operating Cost (Offset in Fxd Rt) $0.00 $48.30 $105.80 $154.10$0.00
4.1
Packet Pg. 79
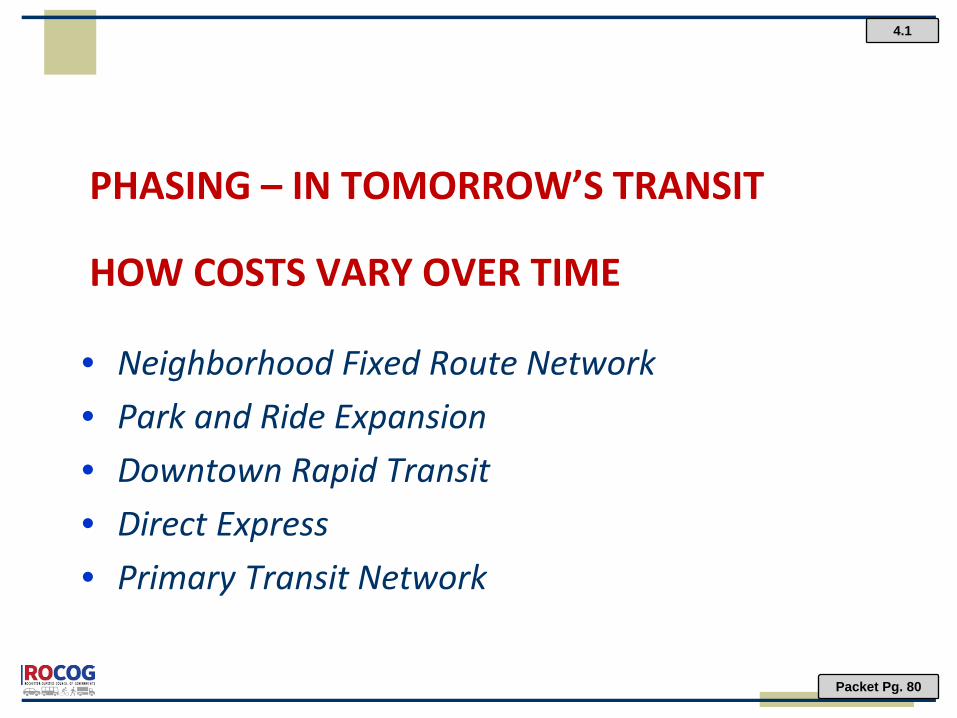
PHASING – IN TOMORROW’S TRANSIT
HOW COSTS VARY OVER TIME
• Neighborhood Fixed Route Network• Park and Ride Expansion• Downtown Rapid Transit • Direct Express• Primary Transit Network
4.1
Packet Pg. 80

25 Year Pattern of Total Transit Operating Costs
$-
$5,000,000
$10,000,000
$15,000,000
$20,000,000
$25,000,000
$30,000,000
$35,000,000
$40,000,000
$45,000,000
$50,000,000
2021 2022 2023 2024 2025 2026 2027 2028 2029 2030 2031 2032 2033 2034 2035 2036 2037 2038 2039 2040 2041 2042 2043 2044 2045
How Total Transit Operating Costs Change ove Time
Projected Neigh Fixed Route Projected ZIPS Operating Cost Park and Ride Express Rapid Transit Primary Transit Network
4.1
Packet Pg. 81
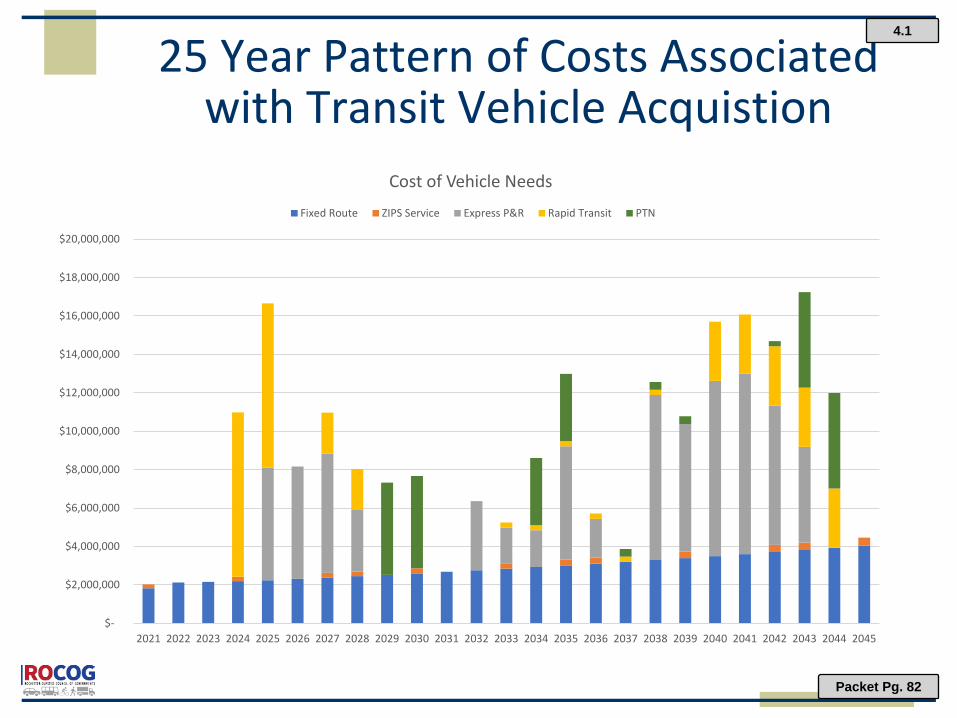
25 Year Pattern of Costs Associated with Transit Vehicle Acquistion
$-
$2,000,000
$4,000,000
$6,000,000
$8,000,000
$10,000,000
$12,000,000
$14,000,000
$16,000,000
$18,000,000
$20,000,000
2021 2022 2023 2024 2025 2026 2027 2028 2029 2030 2031 2032 2033 2034 2035 2036 2037 2038 2039 2040 2041 2042 2043 2044 2045
Cost of Vehicle Needs
Fixed Route ZIPS Service Express P&R Rapid Transit PTN
4.1
Packet Pg. 82

25 Year Pattern of Costs Associated with Transit Infrastructure
$-
$10,000,000
$20,000,000
$30,000,000
$40,000,000
$50,000,000
$60,000,000
$70,000,000
$80,000,000
$90,000,000
2021 2022 2023 2024 2025 2026 2027 2028 2029 2030 2031 2032 2033 2034 2035 2036 2037 2038 2039 2040 2041 2042 2043 2044 2045
Cost of Transit Infrastructure
Fixed Route ZIPS Service Express P&R Rapid Transit PTN
4.1
Packet Pg. 83
Final Slide
4.1
Packet Pg. 84

Today’s Transit / Ridership
(10.0%)
(5.0%)
0.0%
5.0%
10.0%
-
500,000
1,000,000
1,500,000
2,000,000
2,500,000
2008 2009 2010 2011 2012 2013 2014 2015 2016 2017 2018
Fixed Route Ridership
Annual Ridership Annual % Change
Annual Ridership
Annual % Change
2008 1,727,630 0.0%2009 1,584,502 (9.0%)2010 1,520,556 (4.2%)2011 1,645,272 7.6%2012 1,739,071 5.4%2013 1,713,801 (1.5%)2014 1,667,927 (2.8%)2015 1,701,580 2.0%2016 1,708,931 0.4%2017 1,837,990 7.0%2018 2,010,145 8.6%
(10.0%)
(5.0%)
0.0%
5.0%
10.0%
-
20,000
40,000
60,000
2008 2009 2010 2011 2012 2013 2014 2015 2016 2017 2018
ZIPS Dial-a-Ride Annual Ridership
DAR Bus Riders DAR Taxi Riders Annual % Change
DAR Bus Riders
DAR Taxi Riders
Annual % Change
2008 39,905 0.0%2009 39,868 (0.1%)2010 40,717 2.1%2011 40,471 (0.6%)2012 38,503 (5.1%)2013 39,288 2.0%2014 41,897 6.2%2015 45,062 7.0%2016 46,635 3.4%2017 31,993 16,176 3.2%2018 25,944 20,189 (4.4%)
4.1
Packet Pg. 85

Today’s Transit / Operating Costs
(5.0%)
0.0%
5.0%
10.0%
15.0%
$0$2,000,000$4,000,000$6,000,000$8,000,000
$10,000,000
2008 2009 2010 2011 2012 2013 2014 2015 2016 2017 2018
Annual Operating Cost - Fixed Route
Operating Cost Annual % Change
Operating Cost
Annual % Change
2008 $4,511,600 0.0%2009 $4,565,035 1.2%2010 $4,933,635 7.5%2011 $5,150,838 4.2%2012 $5,995,130 14.1%2013 $6,082,813 1.4%2014 $6,339,028 4.0%2015 $6,250,562 (1.4%)2016 $6,579,810 5.0%2017 $7,516,562 12.5%2018 $8,564,584 12.2%
(10.0%) (5.0%)0.0%5.0%10.0%15.0%
$-
$500,000
$1,000,000
$1,500,000
2008 2009 2010 2011 2012 2013 2014 2015 2016 2017 2018
ZIPS Dial-A-Ride Operating Cost
DAR Bus Cost DAR Taxi Cost Annual % Change
DAR Bus Cost
DAR Taxi Cost
Annual % Change
2008 667,254$ 0.0%2009 631,827$ (5.6%)2010 647,773$ 2.5%2011 685,133$ 5.5%2012 672,827$ (1.8%)2013 $ 768,414 12.4%2014 826,482$ 7.0%2015 854,442$ 3.3%2016 909,639$ 6.1%2017 649,028$ 386,377$ 12.1%2018 588,936$ 495,995$ 4.6%
DAR Bus DAR Taxi
2017 $20.29 $23.89
2018 $22.70 $24.57
Cost Per Ride
4.1
Packet Pg. 86