Embed Size (px)
Citation preview
Advanced CFD in Control Valves
Homayoon Feiz on behalf of
Asher Glaun P.E. GE
Classical CFD Analysis in Control Valves
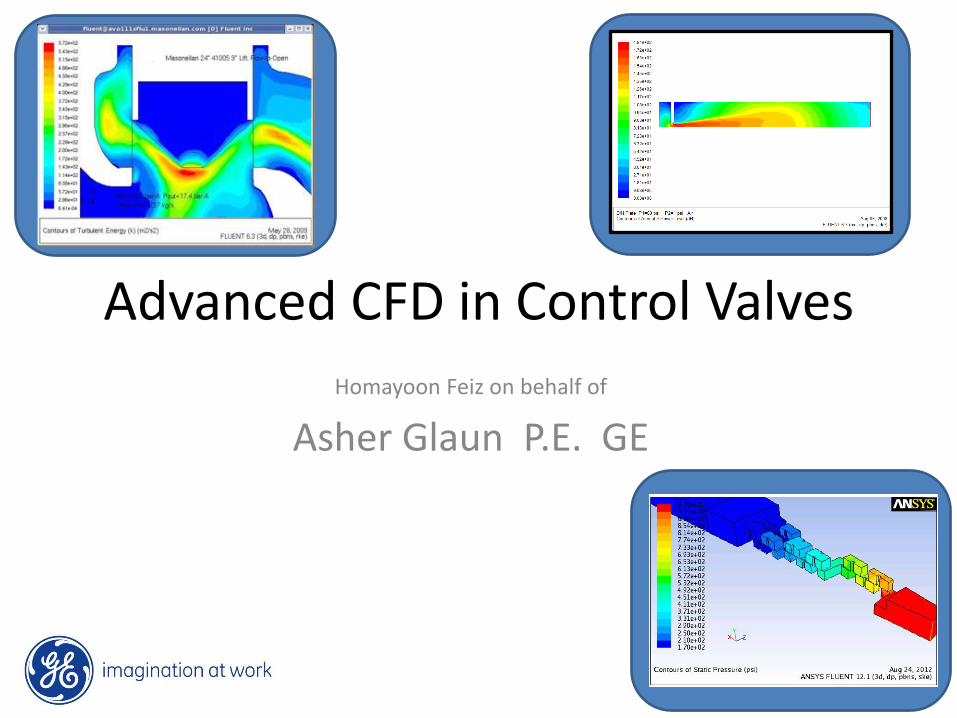
• Around the year 2000, these analysis are adopted by larger valve companies as confidence in the accuracy of commercially available software grows. Incompressible analysis is performed using water as the working fluid. These analyses were limited by the memory capacity of computers at the time… 2D analyses were used if a very fine mesh was required to capture fine geometric detail in the valve. 3D analyses were performed using a relatively coarse mesh but could still be relied upon to give good results (within 5% of tested results) because most the losses occurring in most control valves are due to gross large scale inertial losses. Benefits of these analysis are in the speeding up of new valve designs by predicting capacity before final product testing. Results also show where low pressure zones in the valve are occurring, aiding in design.
Valve capacity analysis ISA 75.02.
Classical CFD Analysis in Control Valves
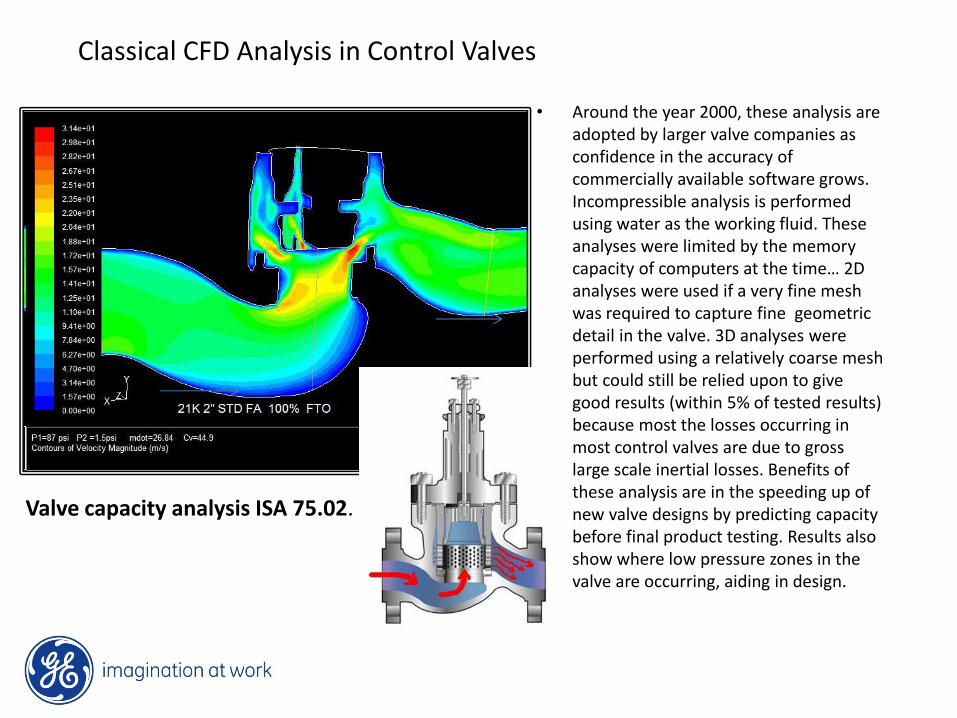
• By the early to mid 2000s, desktop workstations have enough memory to create 3D models with enough mesh density to model the shock in trans-sonic and supersonic flows. These analysis allow the modelling of low noise trim where high Mach number flows are present.
Compressible supersonic flow analysis.
Classical CFD Analysis in Control Valves
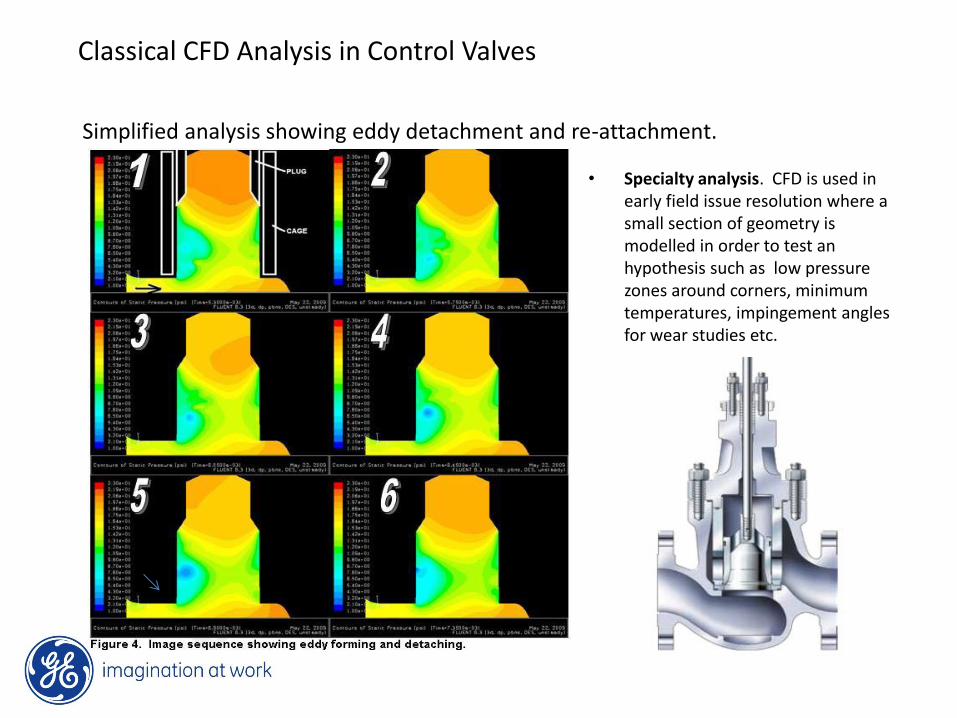
• Specialty analysis. CFD is used in early field issue resolution where a small section of geometry is modelled in order to test an hypothesis such as low pressure zones around corners, minimum temperatures, impingement angles for wear studies etc.
Simplified analysis showing eddy detachment and re-attachment.
Advanced topics. CFD Analysis
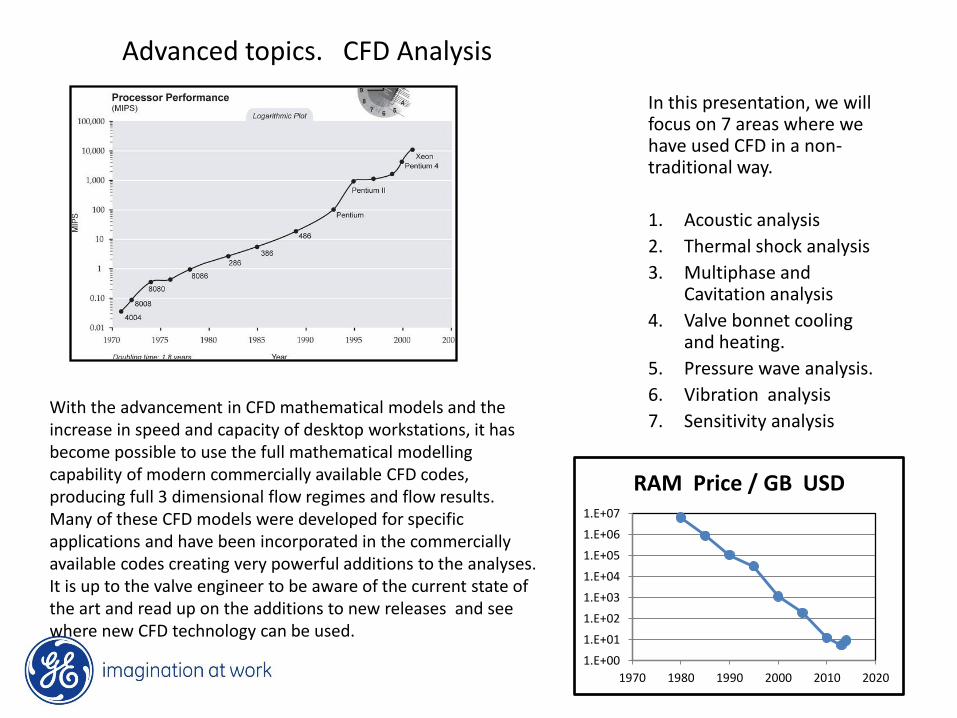
In this presentation, we will focus on 7 areas where we have used CFD in a non-traditional way.
1. Acoustic analysis
2. Thermal shock analysis
3. Multiphase and Cavitation analysis
4. Valve bonnet cooling and heating.
5. Pressure wave analysis.
6. Vibration analysis
7. Sensitivity analysis With the advancement in CFD mathematical models and the increase in speed and capacity of desktop workstations, it has become possible to use the full mathematical modelling capability of modern commercially available CFD codes, producing full 3 dimensional flow regimes and flow results. Many of these CFD models were developed for specific applications and have been incorporated in the commercially available codes creating very powerful additions to the analyses. It is up to the valve engineer to be aware of the current state of the art and read up on the additions to new releases and see where new CFD technology can be used. 1.E+00
1.E+01
1.E+02
1.E+03
1.E+04
1.E+05
1.E+06
1.E+07
1970 1980 1990 2000 2010 2020
RAM Price / GB USD
1. Advanced topics. Acoustic analysis
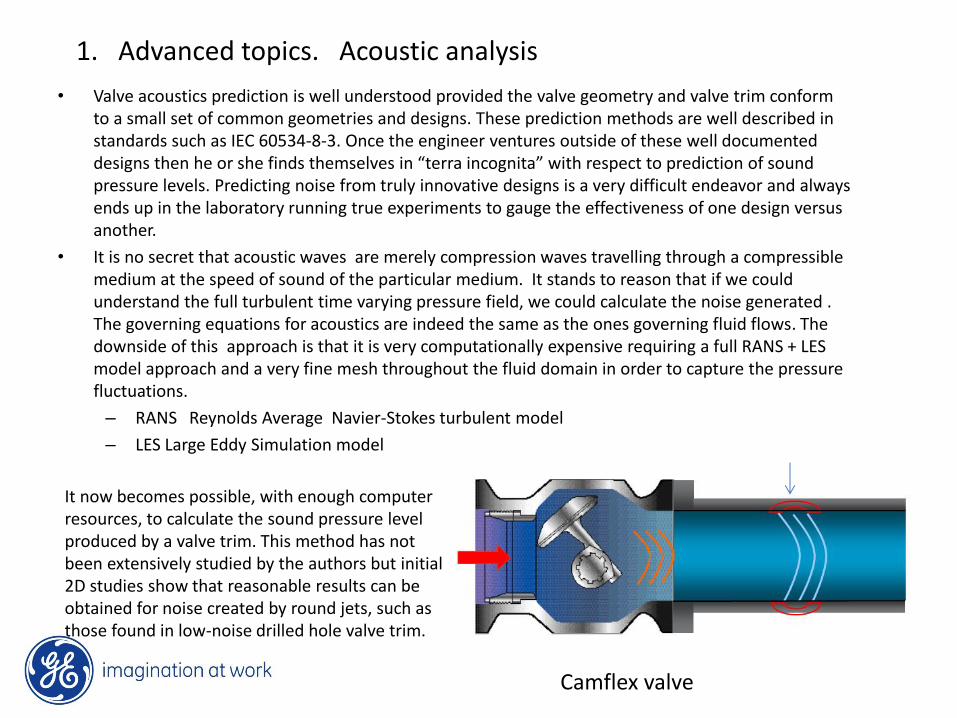
• Valve acoustics prediction is well understood provided the valve geometry and valve trim conform to a small set of common geometries and designs. These prediction methods are well described in standards such as IEC 60534-8-3. Once the engineer ventures outside of these well documented designs then he or she finds themselves in “terra incognita” with respect to prediction of sound pressure levels. Predicting noise from truly innovative designs is a very difficult endeavor and always ends up in the laboratory running true experiments to gauge the effectiveness of one design versus another.
• It is no secret that acoustic waves are merely compression waves travelling through a compressible medium at the speed of sound of the particular medium. It stands to reason that if we could understand the full turbulent time varying pressure field, we could calculate the noise generated . The governing equations for acoustics are indeed the same as the ones governing fluid flows. The downside of this approach is that it is very computationally expensive requiring a full RANS + LES model approach and a very fine mesh throughout the fluid domain in order to capture the pressure fluctuations.
– RANS Reynolds Average Navier-Stokes turbulent model
– LES Large Eddy Simulation model
It now becomes possible, with enough computer resources, to calculate the sound pressure level produced by a valve trim. This method has not been extensively studied by the authors but initial 2D studies show that reasonable results can be obtained for noise created by round jets, such as those found in low-noise drilled hole valve trim.
Camflex valve
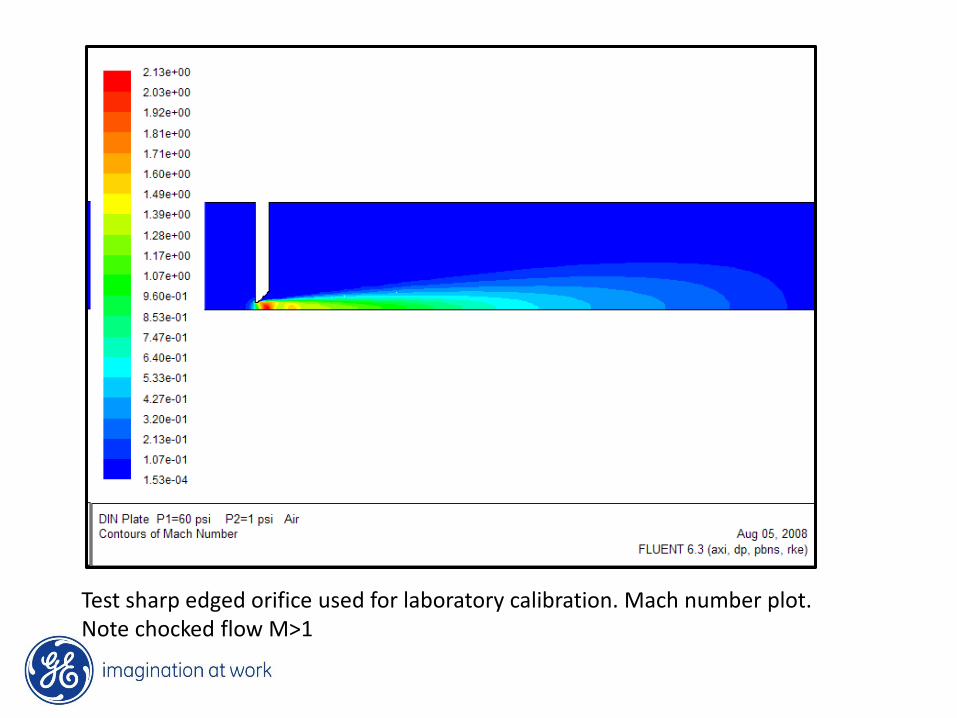
Test sharp edged orifice used for laboratory calibration. Mach number plot. Note chocked flow M>1
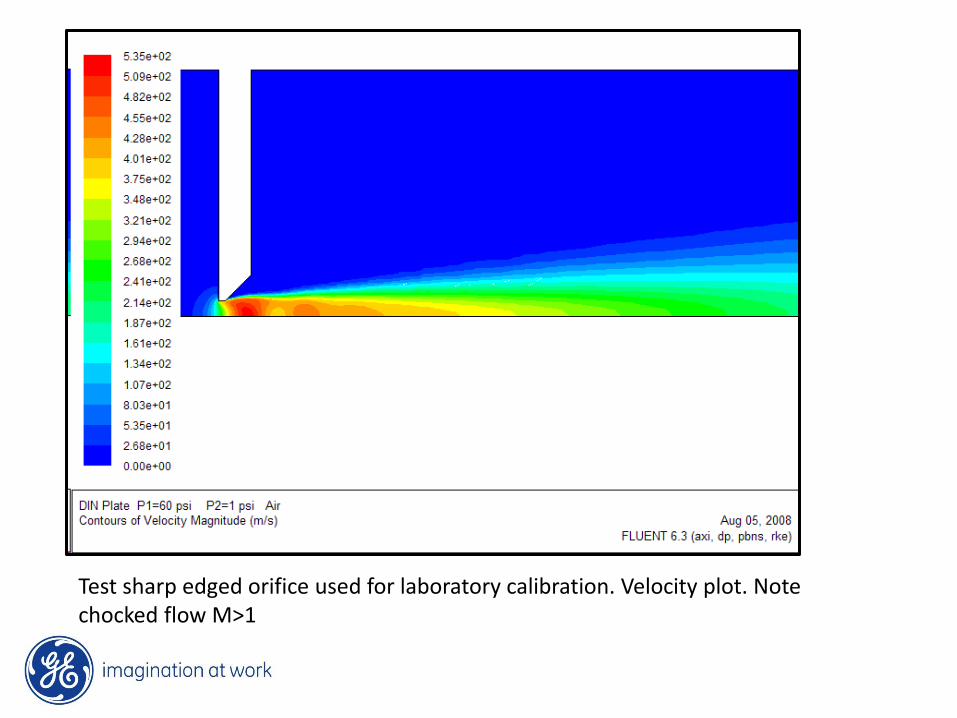
Test sharp edged orifice used for laboratory calibration. Velocity plot. Note chocked flow M>1
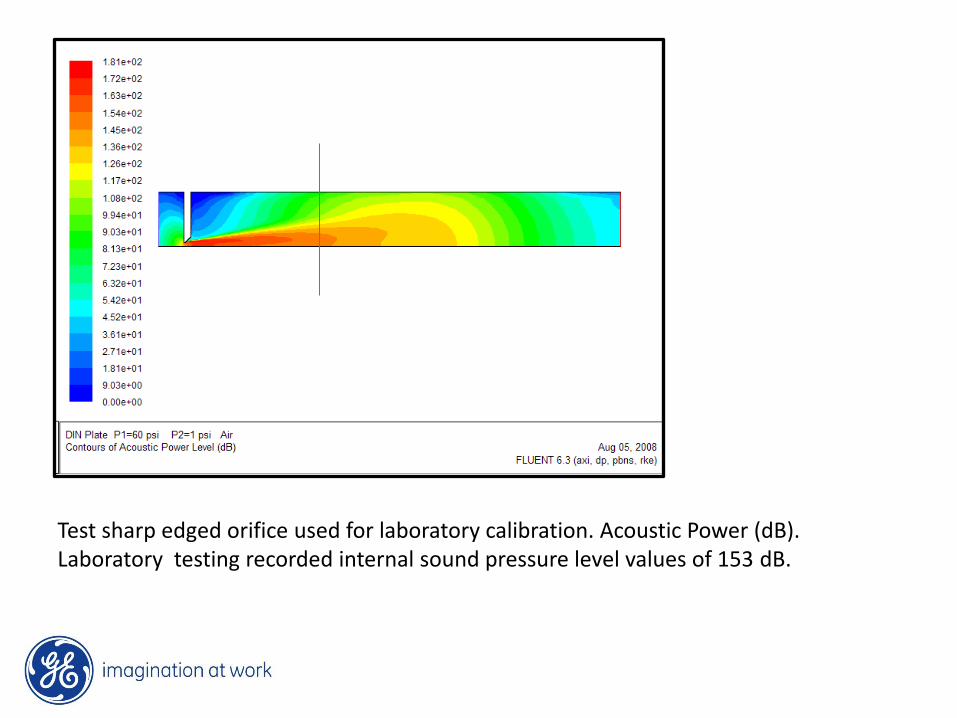
Test sharp edged orifice used for laboratory calibration. Acoustic Power (dB). Laboratory testing recorded internal sound pressure level values of 153 dB.
2. Advanced topics. Thermal Shock Analysis
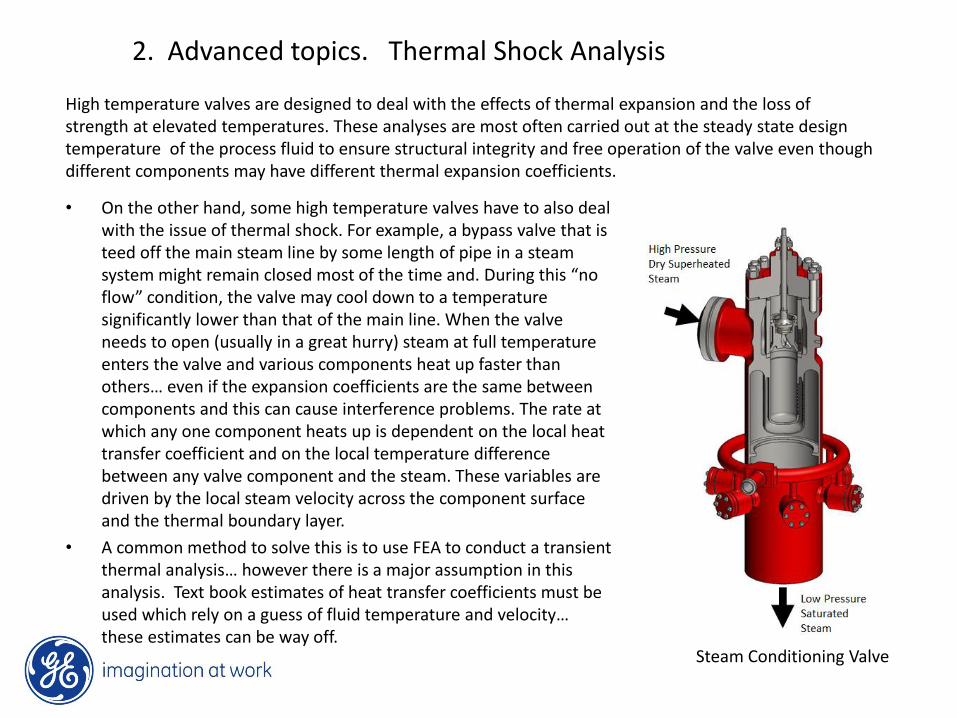
• On the other hand, some high temperature valves have to also deal with the issue of thermal shock. For example, a bypass valve that is teed off the main steam line by some length of pipe in a steam system might remain closed most of the time and. During this “no flow” condition, the valve may cool down to a temperature significantly lower than that of the main line. When the valve needs to open (usually in a great hurry) steam at full temperature enters the valve and various components heat up faster than others… even if the expansion coefficients are the same between components and this can cause interference problems. The rate at which any one component heats up is dependent on the local heat transfer coefficient and on the local temperature difference between any valve component and the steam. These variables are driven by the local steam velocity across the component surface and the thermal boundary layer.
• A common method to solve this is to use FEA to conduct a transient thermal analysis… however there is a major assumption in this analysis. Text book estimates of heat transfer coefficients must be used which rely on a guess of fluid temperature and velocity… these estimates can be way off.
Steam Conditioning Valve
High temperature valves are designed to deal with the effects of thermal expansion and the loss of strength at elevated temperatures. These analyses are most often carried out at the steady state design temperature of the process fluid to ensure structural integrity and free operation of the valve even though different components may have different thermal expansion coefficients.
Advanced topics. Thermal Shock Analysis contd.
• It can be seen that an accurate temperature profile in the valve can only be determined if a full time-varying fluid analysis is performed. Fortunately CFD can calculate the full temperature field inside the valve and can calculate the heat transfer coefficient with time allowing us to accurately determine the temperature of the all the valve components with time. Ansys-Fluent allows us to model the solid components as well as the fluid regime which allows the program to calculate the conduction through the valve components and the thermal energy lost in the fluid and hence, finally, what we are looking for, the time varying temperature of the valve components. These temperature results can be exported into a Finite Element package such as Ansys and the thermal strains computed… allowing us to determine if enough clearance is maintained for good operation of the valve.
• This issue is sometimes dealt with by installing a warming loop where a small secondary bypass line keeps enough steam flowing through the bypass line and valve in order to keep the valve close to the main line steam temperature. This effectively gets around the thermal shock problem but adds complexity, cost and wastes energy. Getting a really clear picture of the actual thermal displacements of the valve components gives us the confidence to create a reliable valve design without resorting to a warming loop.
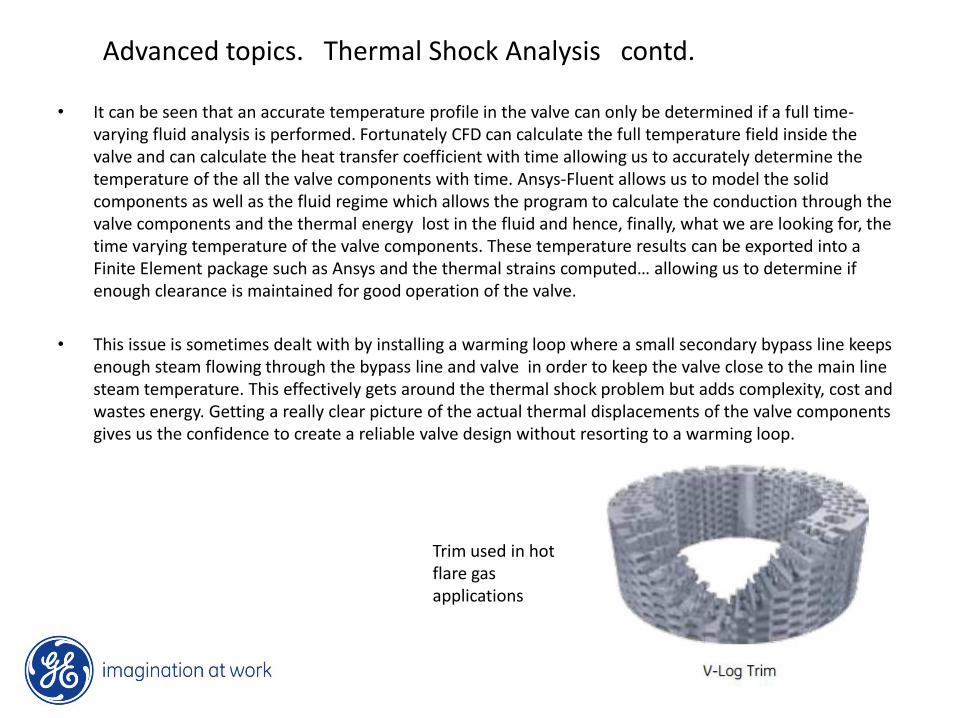
Trim used in hot flare gas applications
Caveats: Steam valves that operate close to saturation such as boiling water reactors will immediately condense the steam as soon as it hits the colder valve components. This phase change from gaseous to liquid state extracts a large amount of energy from the steam (latent heat of vaporization). This manifests itself in heat transfer coefficients of 2 to 3 orders of magnitude greater than those of free convection. The author has not investigated whether CFD models exist which might deal with this phase change. It is the important for the CFD engineer to be aware of situations like these that might cause errors in the results.
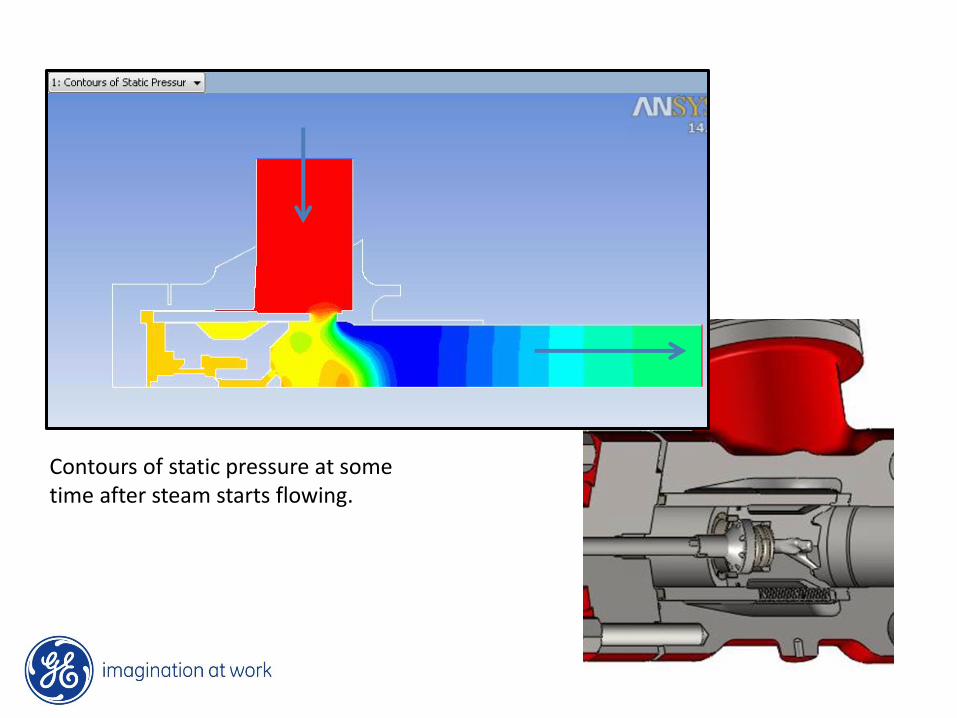
Contours of static pressure at some time after steam starts flowing.
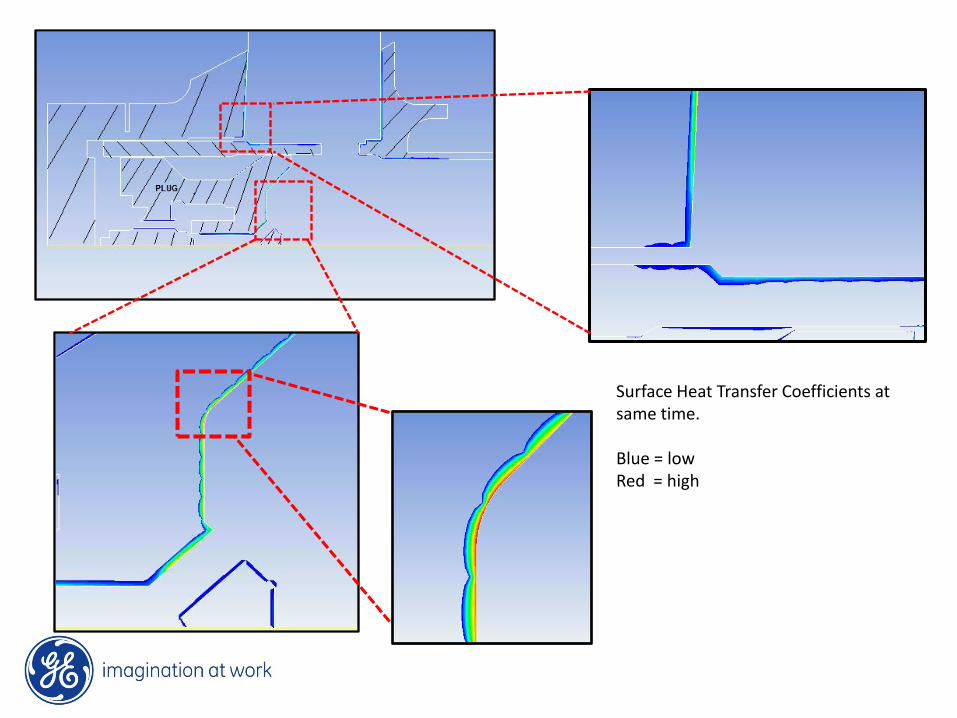
Surface Heat Transfer Coefficients at same time. Blue = low Red = high
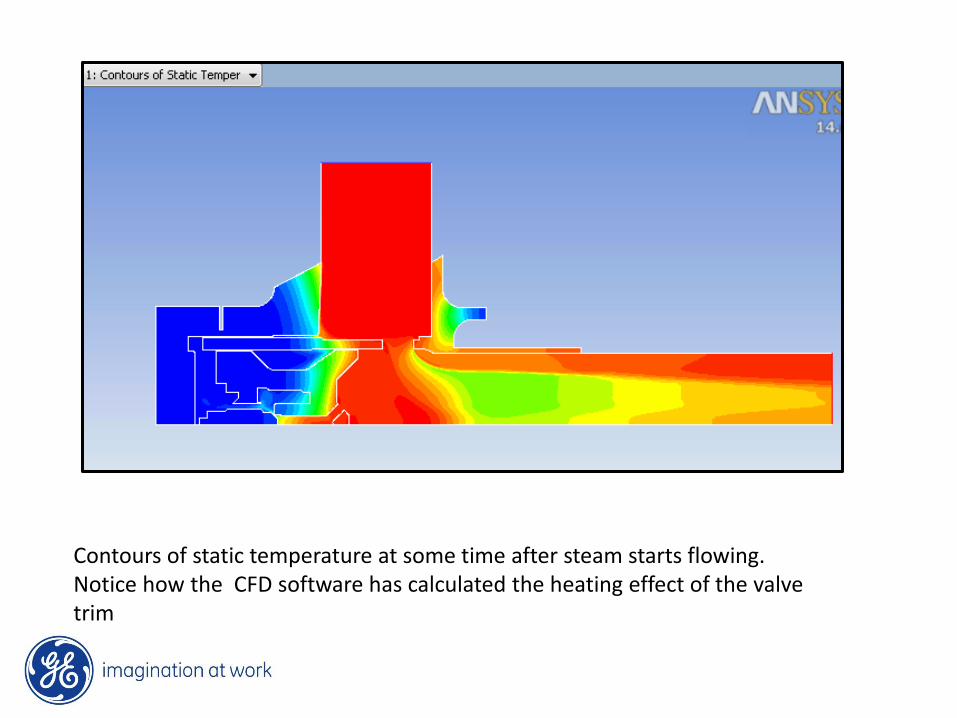
Contours of static temperature at some time after steam starts flowing. Notice how the CFD software has calculated the heating effect of the valve trim
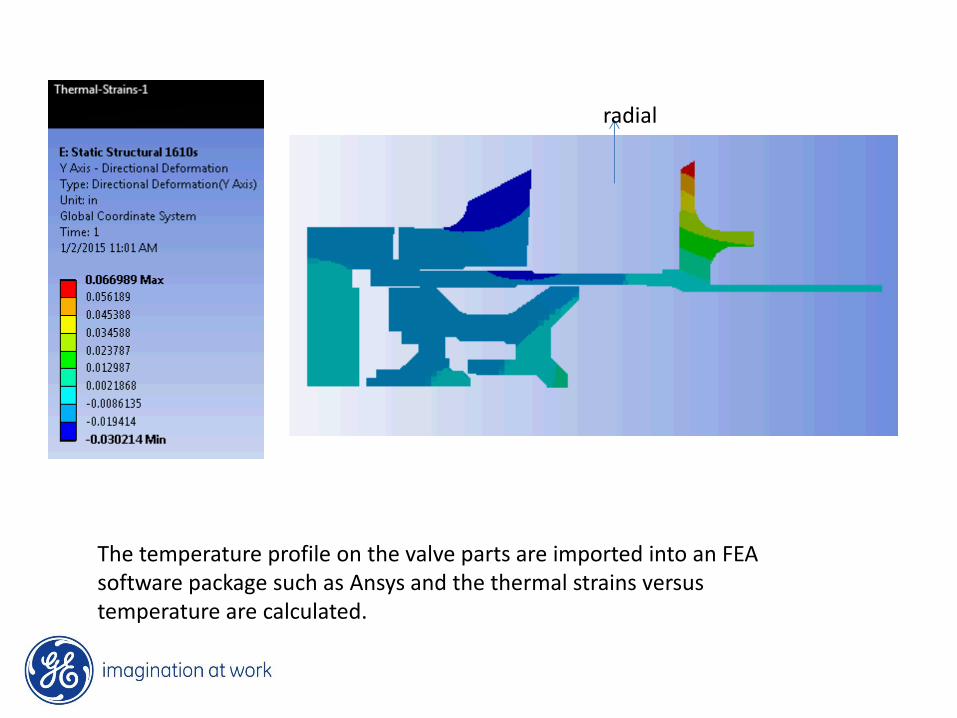
The temperature profile on the valve parts are imported into an FEA software package such as Ansys and the thermal strains versus temperature are calculated.
radial
Pv
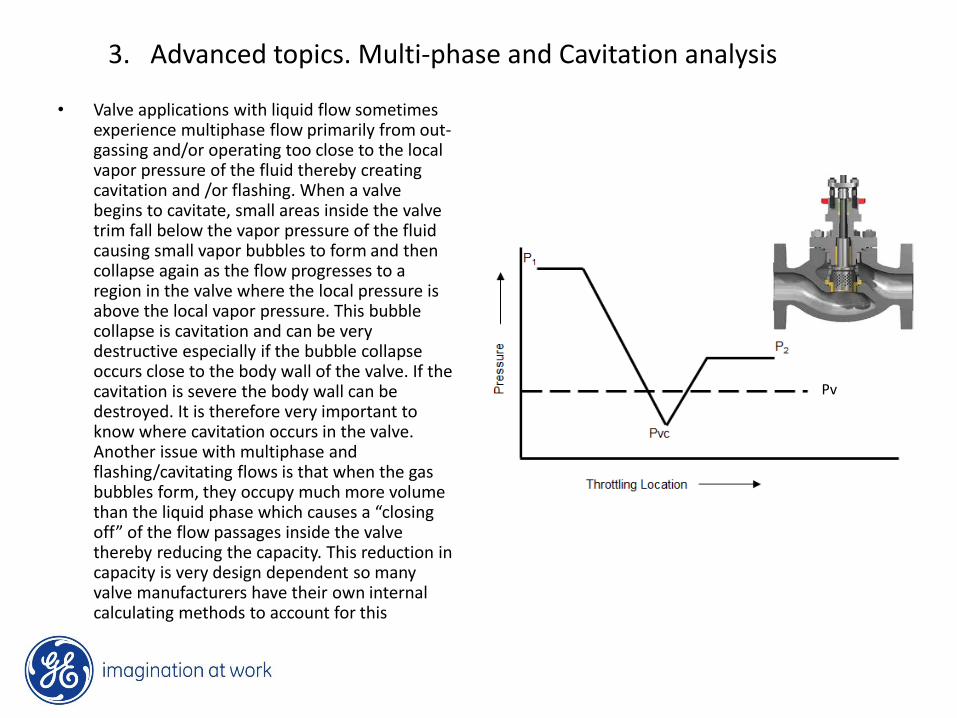
3. Advanced topics. Multi-phase and Cavitation analysis
• Valve applications with liquid flow sometimes experience multiphase flow primarily from out-gassing and/or operating too close to the local vapor pressure of the fluid thereby creating cavitation and /or flashing. When a valve begins to cavitate, small areas inside the valve trim fall below the vapor pressure of the fluid causing small vapor bubbles to form and then collapse again as the flow progresses to a region in the valve where the local pressure is above the local vapor pressure. This bubble collapse is cavitation and can be very destructive especially if the bubble collapse occurs close to the body wall of the valve. If the cavitation is severe the body wall can be destroyed. It is therefore very important to know where cavitation occurs in the valve. Another issue with multiphase and flashing/cavitating flows is that when the gas bubbles form, they occupy much more volume than the liquid phase which causes a “closing off” of the flow passages inside the valve thereby reducing the capacity. This reduction in capacity is very design dependent so many valve manufacturers have their own internal calculating methods to account for this
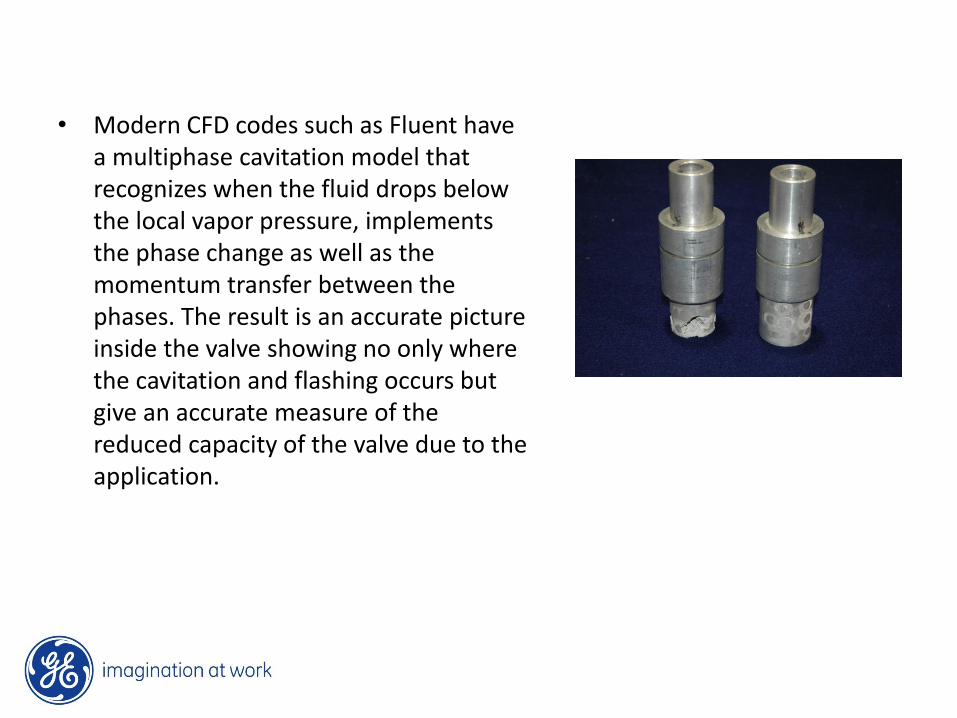
• Modern CFD codes such as Fluent have a multiphase cavitation model that recognizes when the fluid drops below the local vapor pressure, implements the phase change as well as the momentum transfer between the phases. The result is an accurate picture inside the valve showing no only where the cavitation and flashing occurs but give an accurate measure of the reduced capacity of the valve due to the application.
PLUG
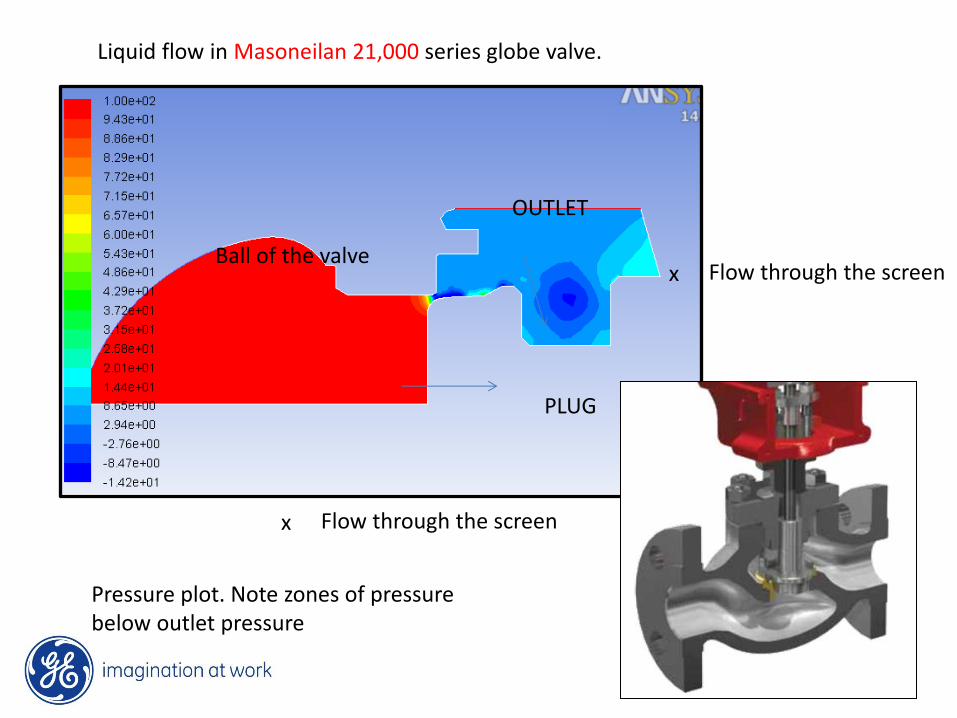
Pressure plot. Note zones of pressure below outlet pressure
Liquid flow in Masoneilan 21,000 series globe valve.
OUTLET
Flow through the screen
Ball of the valve
x
Flow through the screen x
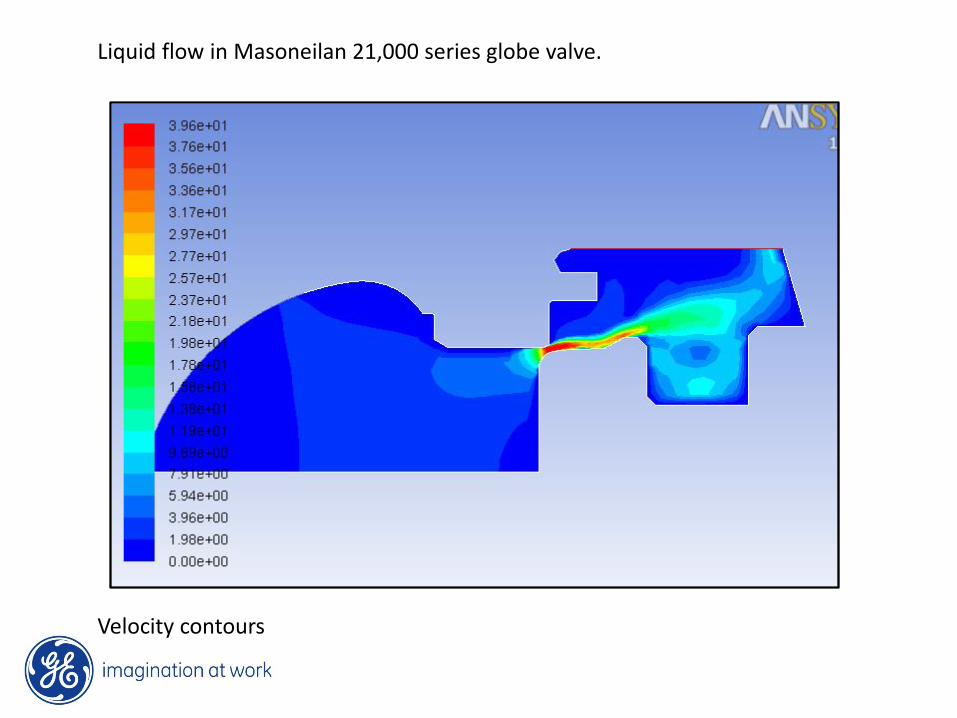
Liquid flow in Masoneilan 21,000 series globe valve.
Velocity contours
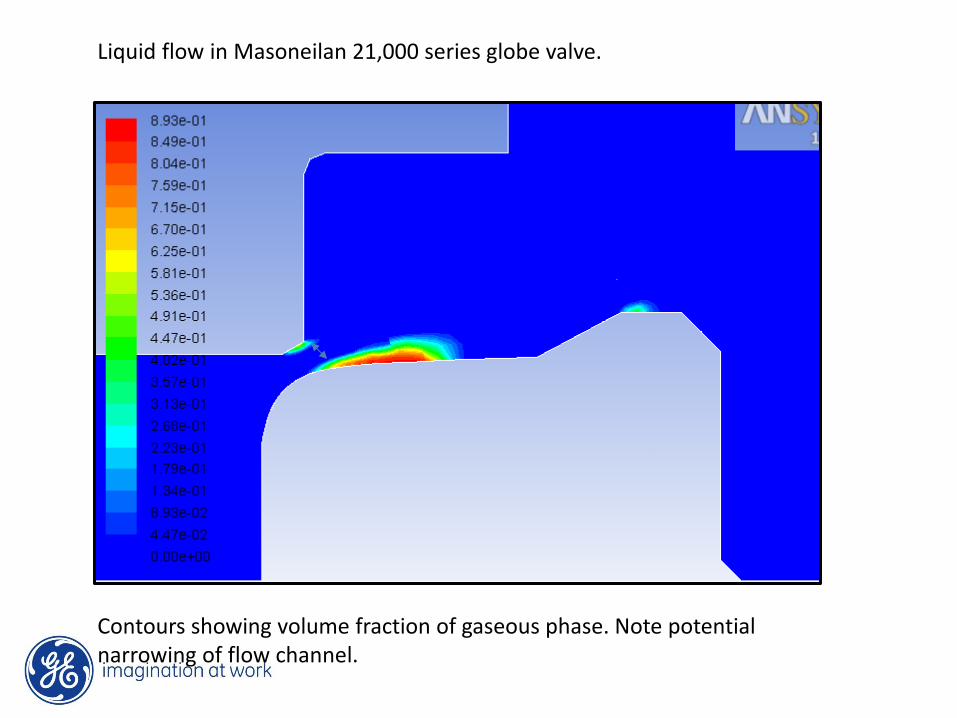
Liquid flow in Masoneilan 21,000 series globe valve.
Contours showing volume fraction of gaseous phase. Note potential narrowing of flow channel.
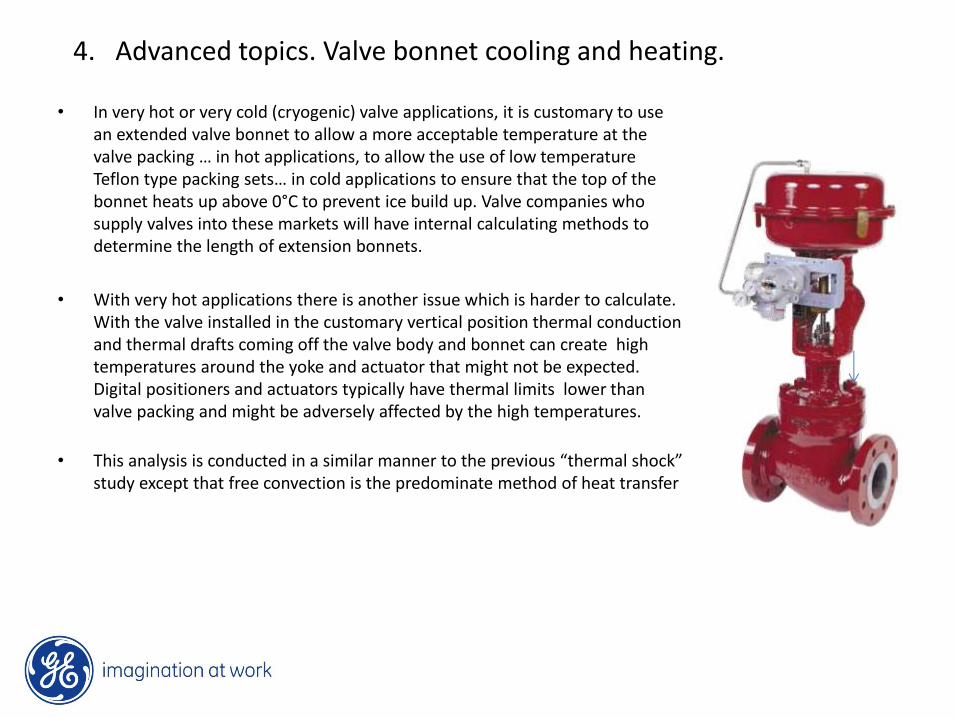
4. Advanced topics. Valve bonnet cooling and heating.
• In very hot or very cold (cryogenic) valve applications, it is customary to use an extended valve bonnet to allow a more acceptable temperature at the valve packing … in hot applications, to allow the use of low temperature Teflon type packing sets… in cold applications to ensure that the top of the bonnet heats up above 0°C to prevent ice build up. Valve companies who supply valves into these markets will have internal calculating methods to determine the length of extension bonnets.
• With very hot applications there is another issue which is harder to calculate. With the valve installed in the customary vertical position thermal conduction and thermal drafts coming off the valve body and bonnet can create high temperatures around the yoke and actuator that might not be expected. Digital positioners and actuators typically have thermal limits lower than valve packing and might be adversely affected by the high temperatures.
• This analysis is conducted in a similar manner to the previous “thermal shock” study except that free convection is the predominate method of heat transfer
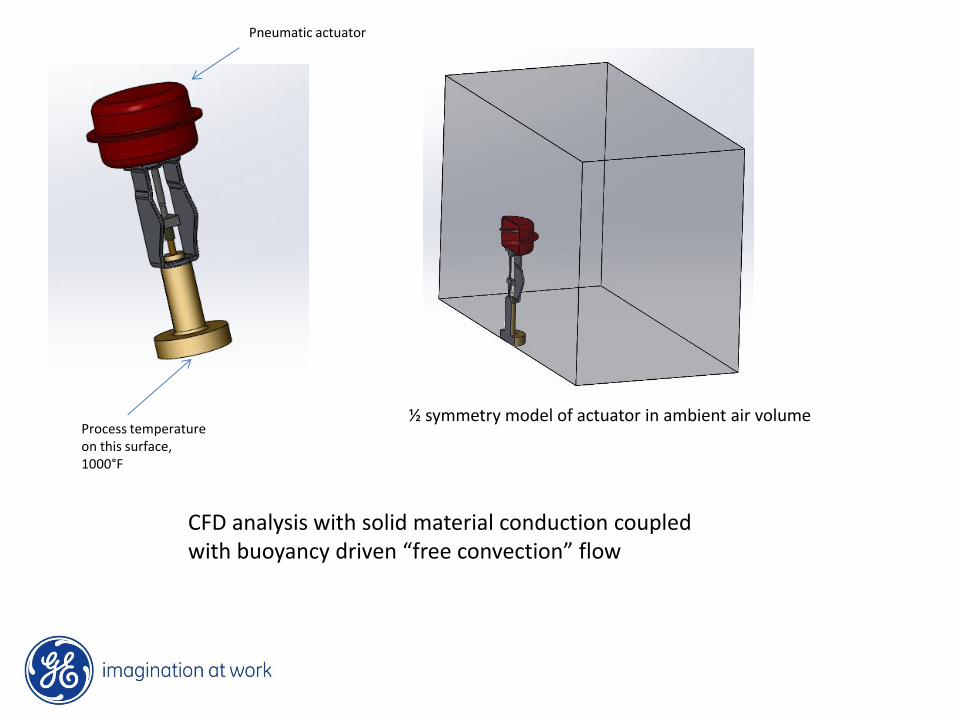
Process temperature on this surface, 1000°F
Pneumatic actuator
½ symmetry model of actuator in ambient air volume
CFD analysis with solid material conduction coupled with buoyancy driven “free convection” flow
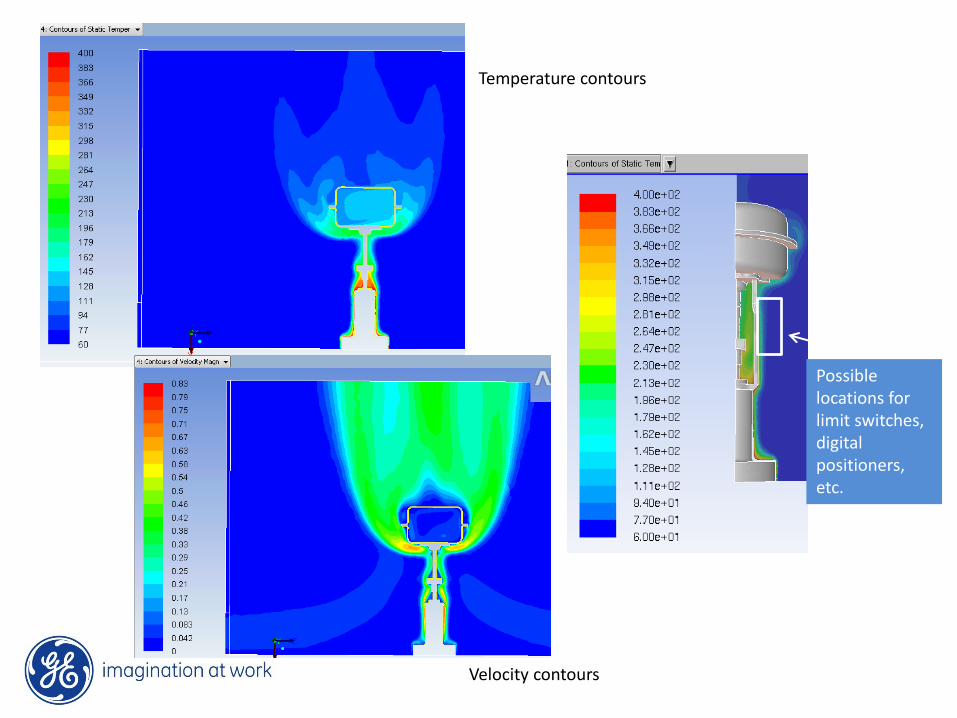
Velocity contours
Temperature contours
Possible locations for limit switches, digital positioners, etc.
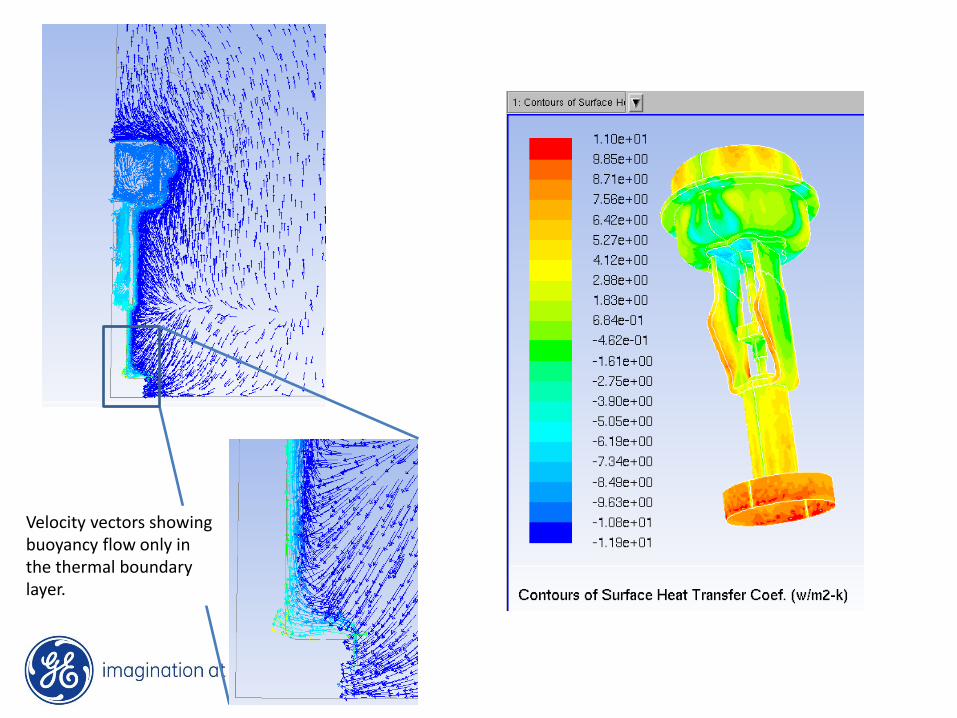
Velocity vectors showing buoyancy flow only in the thermal boundary layer.
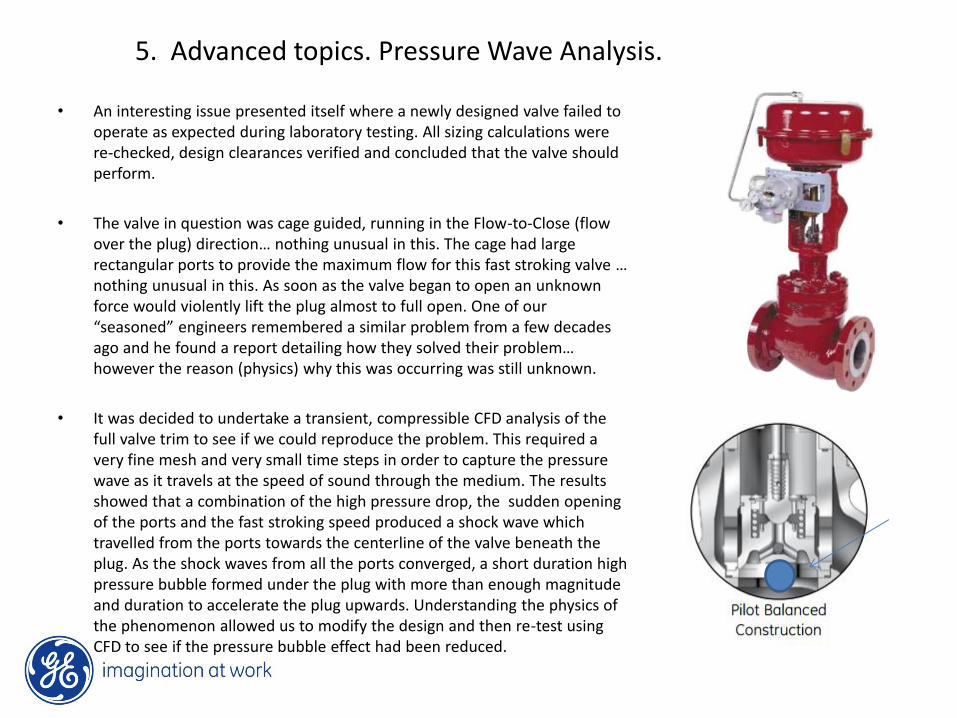
5. Advanced topics. Pressure Wave Analysis.
• An interesting issue presented itself where a newly designed valve failed to operate as expected during laboratory testing. All sizing calculations were re-checked, design clearances verified and concluded that the valve should perform.
• The valve in question was cage guided, running in the Flow-to-Close (flow over the plug) direction… nothing unusual in this. The cage had large rectangular ports to provide the maximum flow for this fast stroking valve … nothing unusual in this. As soon as the valve began to open an unknown force would violently lift the plug almost to full open. One of our “seasoned” engineers remembered a similar problem from a few decades ago and he found a report detailing how they solved their problem… however the reason (physics) why this was occurring was still unknown.
• It was decided to undertake a transient, compressible CFD analysis of the full valve trim to see if we could reproduce the problem. This required a very fine mesh and very small time steps in order to capture the pressure wave as it travels at the speed of sound through the medium. The results showed that a combination of the high pressure drop, the sudden opening of the ports and the fast stroking speed produced a shock wave which travelled from the ports towards the centerline of the valve beneath the plug. As the shock waves from all the ports converged, a short duration high pressure bubble formed under the plug with more than enough magnitude and duration to accelerate the plug upwards. Understanding the physics of the phenomenon allowed us to modify the design and then re-test using CFD to see if the pressure bubble effect had been reduced.
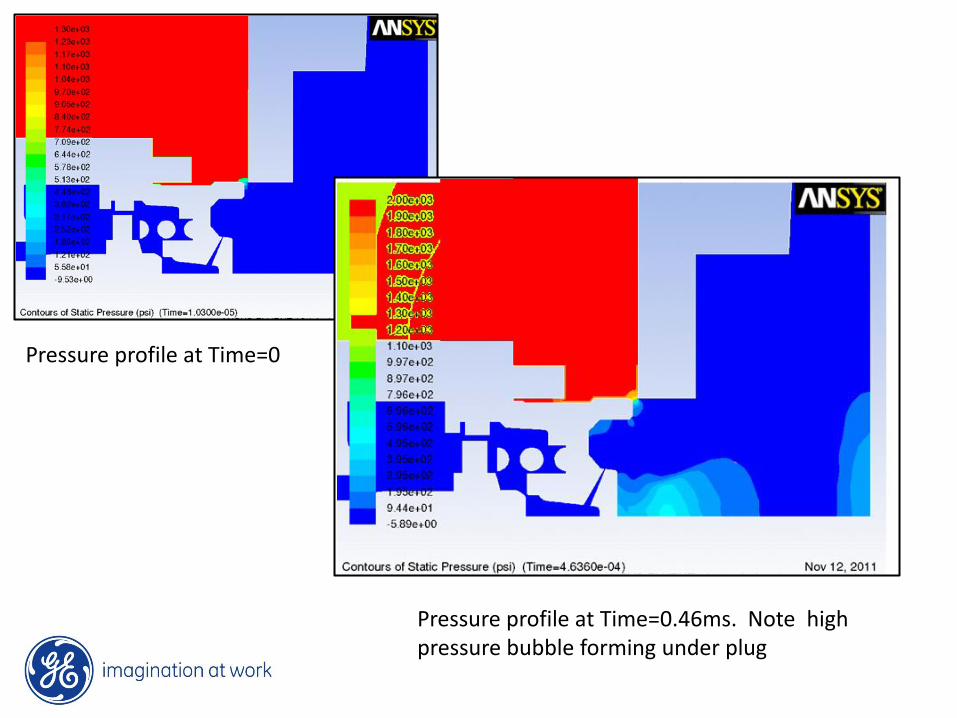
Pressure profile at Time=0
Pressure profile at Time=0.46ms. Note high pressure bubble forming under plug
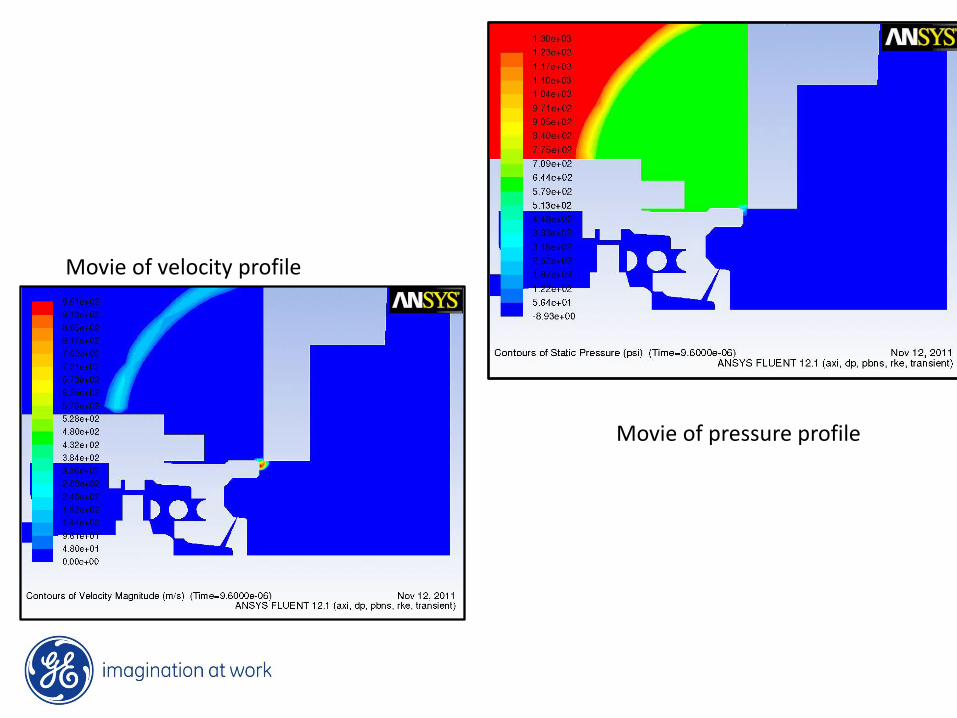
Movie of pressure profile
Movie of velocity profile
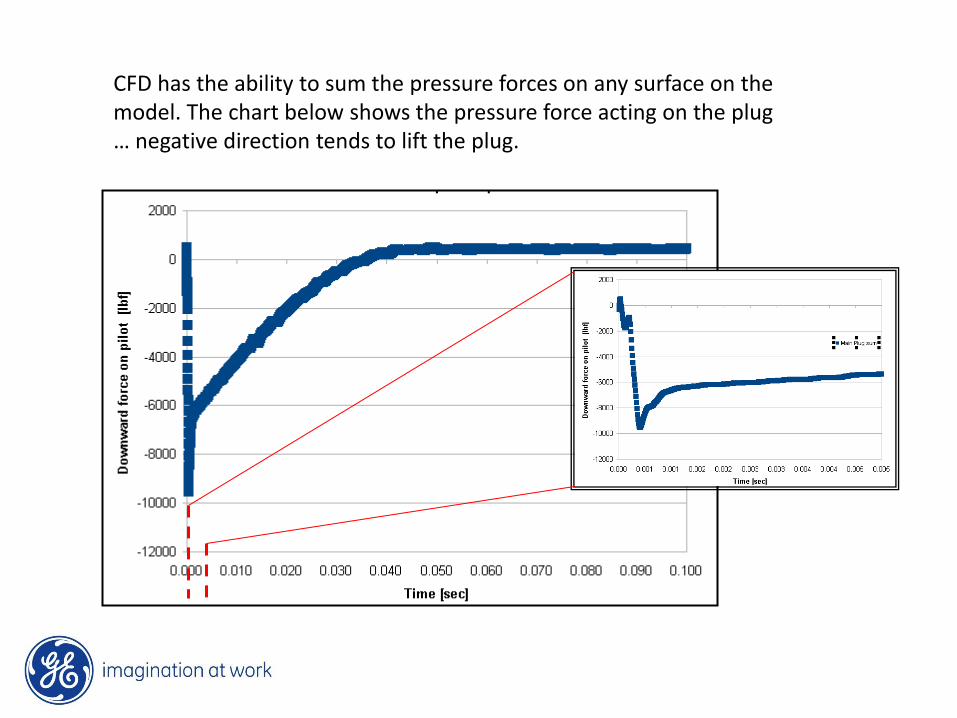
CFD has the ability to sum the pressure forces on any surface on the model. The chart below shows the pressure force acting on the plug … negative direction tends to lift the plug.
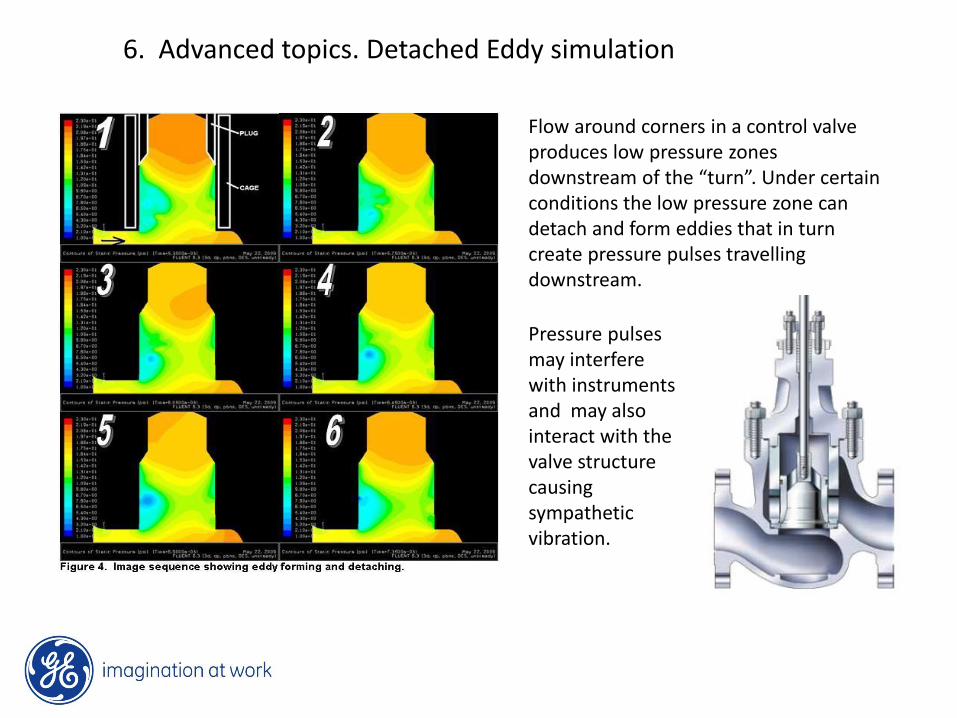
6. Advanced topics. Detached Eddy simulation
Flow around corners in a control valve produces low pressure zones downstream of the “turn”. Under certain conditions the low pressure zone can detach and form eddies that in turn create pressure pulses travelling downstream.
Pressure pulses may interfere with instruments and may also interact with the valve structure causing sympathetic vibration.
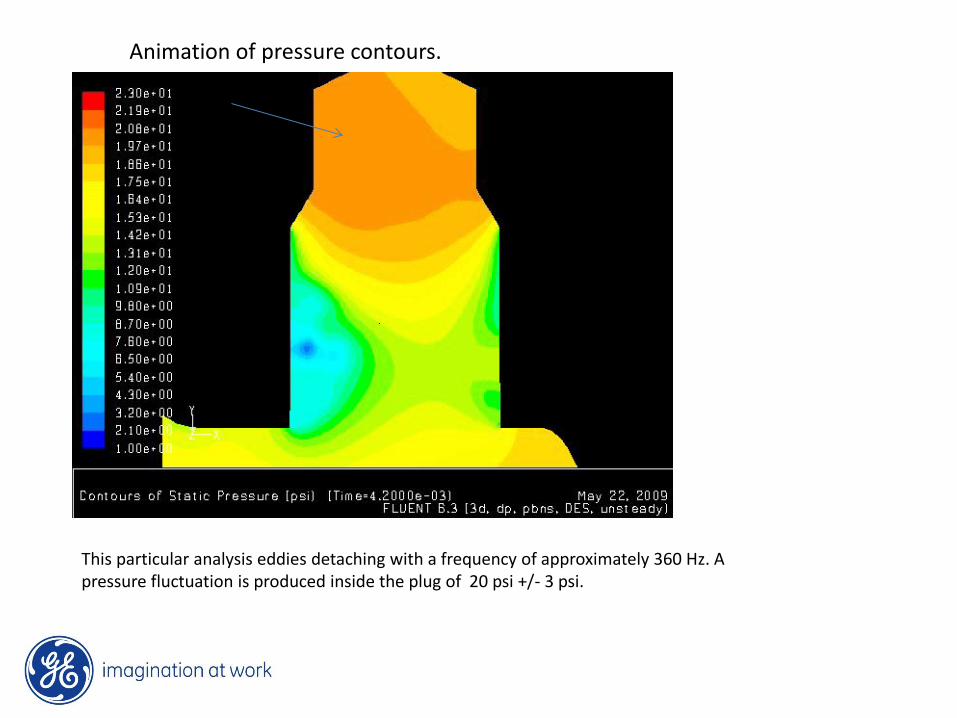
This particular analysis eddies detaching with a frequency of approximately 360 Hz. A pressure fluctuation is produced inside the plug of 20 psi +/- 3 psi.
Animation of pressure contours.
7. Advanced topics. Transient Moving Mesh
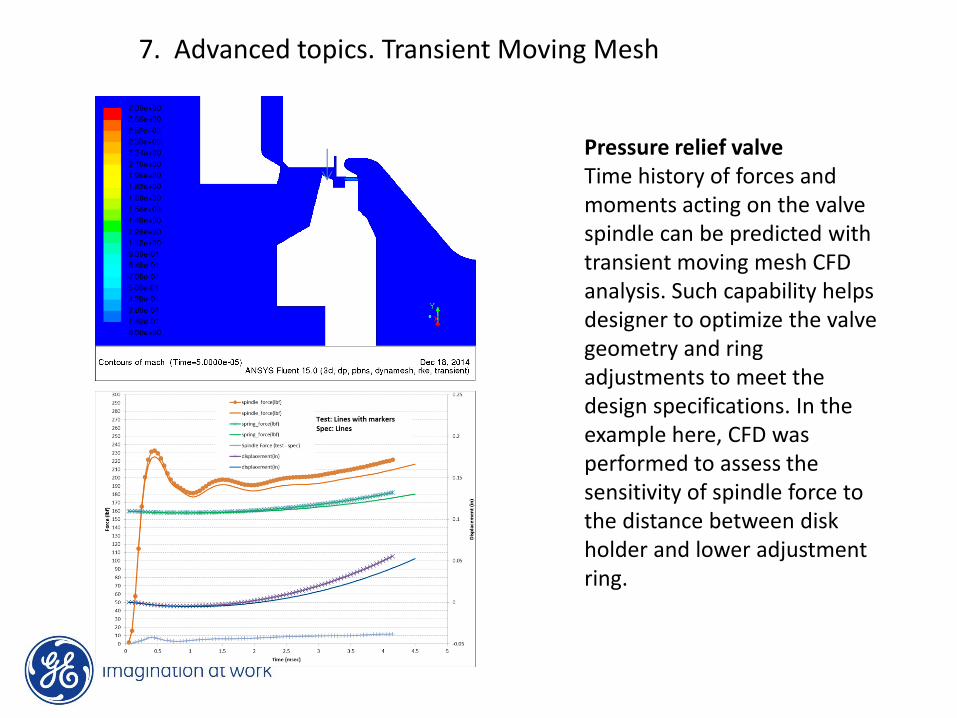
Pressure relief valve Time history of forces and moments acting on the valve spindle can be predicted with transient moving mesh CFD analysis. Such capability helps designer to optimize the valve geometry and ring adjustments to meet the design specifications. In the example here, CFD was performed to assess the sensitivity of spindle force to the distance between disk holder and lower adjustment ring.

THE END
Thank You