Embed Size (px)
Citation preview
Acknowledgements
I would like to sincerely thank my advisor, Prof. John C. MacDonald for giving me the opportunity to work
in his laboratory and for always encouraging me and challenging me to be a better thinker, writer and
scientist. I will always be grateful to him because I have imbibed a tremendous amount of knowledge in not
just X-ray crystallography, surface chemistry but also all of the exciting discussions on current topics in
chemistry and for keeping me focused, motivated and above all for making me into a better person. I would
also like to thank him for his patience and availability in times of difficulty with respect to my research or
coursework. He has always encouraged me to attend conferences and meetings, both national as well as
regional that has helped me primarily to develop my academic career and I would not be in a position that I
am in today without his support and guidance to my success here at WPI.
I would like to sincerely thank my committee, Prof. Connors, Prof. Kaminski, Prof. Burdette for being
on my committee and reading this dissertation. I appreciate it. I would also like to thank my external
examiner, Prof. Tayhas Palmore for taking the time out of her schedule to read my thesis and be at my
Ph.D. defense.
I would like to thank all the current and former members of our lab group for their support, assistance
and encouragement with my research. Particularity, I would like to acknowledge Ms. Lisa Lee, Ms.
Moqing Hu, Mr. Sahag Voskian and Mr. Tom Blaisdell for all of their help. Also many thanks to Dr.
Marta Dabros, Dr. Peter Driscoll, Dr. Eftim Milkani and Mr. Jason Cox for their helpful discussions of
portions of my research, training me on several new techniques within the lab or just a conversation over
lunch. I am honored to be considered one of their friends.
To all the faculty, staff and graduate students within the Department of Chemistry and Biochemistry for
their support, providing me with teaching assistantship and for all the wonderful memories during my
graduate school. I would especially like to thank Prof. Connors, Prof. Dittami and Prof. Wobbe for their
support, guidance, and knowledge throughout my graduate career at WPI. I would also like to thank
Prof. Uma Kumar as well as Ms. Ann Mondor for all their help and lively conversations.
I would like to thank my entire family for always being there for me especially my parents-Sunil and
Shilpa, elder brother Devdatt, sister-in-law Jui and my 17-month old niece Isha for their love, patience,
wishful thinking, and constantly supporting and motivating me and making me into a far better person
than before. I will always be grateful to each one of them for making my graduate life so enjoyable and
as well as for teaching me to always have a positive outlook towards life. They have always supported
all of my endeavors, whether personal or professional, and my success is very much a testament to them.
I would like to particularly thank my lovely niece Isha for her playful nature and joyful laughter, no
matter the time of the day that has helped me to always stay energetic and cheerful.
I would also like to thank two of my closest and dearest friends Marta Dabros and Judy Shum who have
patiently listened to me when I needed a friend to talk at anytime.
TABLE OF CONTENTS
1 INTRODUCTION 1
2 BACKGROUND 10
2.1 Current methods of chiral resolution 10
2.1.1. Chromatographic resolution 10
2.1.2. Formation and separation of diastereomers 11
2.1.3. Enzymatic resolution 13
2.2 Crystallization: Nucleation and growth of molecular crystals 13
2.3 Modification of crystal habit 16
2.4 Crystallization of racemates 27
2.5 Methods to distinguish homochiral and heterochiral crystalline forms 29
2.6 Self-assembled monolayers (SAMs) 40
3 INVESTIGATION OF STABILITY AND STRUCTURE IN THREE HOMOCHIRAL
AND HETEROCHIRAL CRYSTALLINE FORMS OF 3-PHENYLLACTIC ACID 53
3.1 Introduction 53
3.2 Experimental 56
3.3 Results and Discussion 60
3.4 Conclusions 75
4 ENANTIOSELECTIVE CRYSTALLIZATION OF 3-PHENYLLACTIC ACID ON
CHIRAL TEMPLATES 78
4.1 Introduction 78
4.2 Objectives 89
4.3 Experimental 91
4.4 Results and Discussion 98
4.5 Conclusions 127
5 CHIRAL DRUGS AS TEMPLATES FOR ENANTIOSELECTIVE
CRYSTALLIZATION OF 3-PHENYLLACTIC ACID 131
5.1 Introduction 131
5.2 Experimental 133
5.3 Results and Discussion 136
5.4 Conclusions 142
6 RESOLUTION OF N-ACETYLLEUCINE VIA CRYSTALLIZATION ON CHIRAL
MOLECULAR FILMS 145
6.1 Introduction 145
6.2 Objectives 147
6.3 Experimental 148
6.4 Results and Discussion 153
6.5 Conclusions 173
7 FUTURE WORK 175
7.1 Investigation of complete resolution via iterative crystallization on chiral templates. 175
7.2 Investigation of complete resolution of racemic drugs via crystallization on patterned
chiral SAMs. 178
7.3 Further investigation of enantioseparation on self-complementary chiral templates
of pharmaceutical drugs. 183
1
1: Introduction
Chirality is important in the development of pharmaceuticals because more than half of drugs
marketed worldwide are chiral. Enantiomers, or stereoisomers, of chiral drugs often differ considerably
in their pharmacological and toxicological effects. Studies of racemic drugs have shown that one
stereoisomer may produce desired therapeutic activities while the other may produce toxicological
effects.1,2
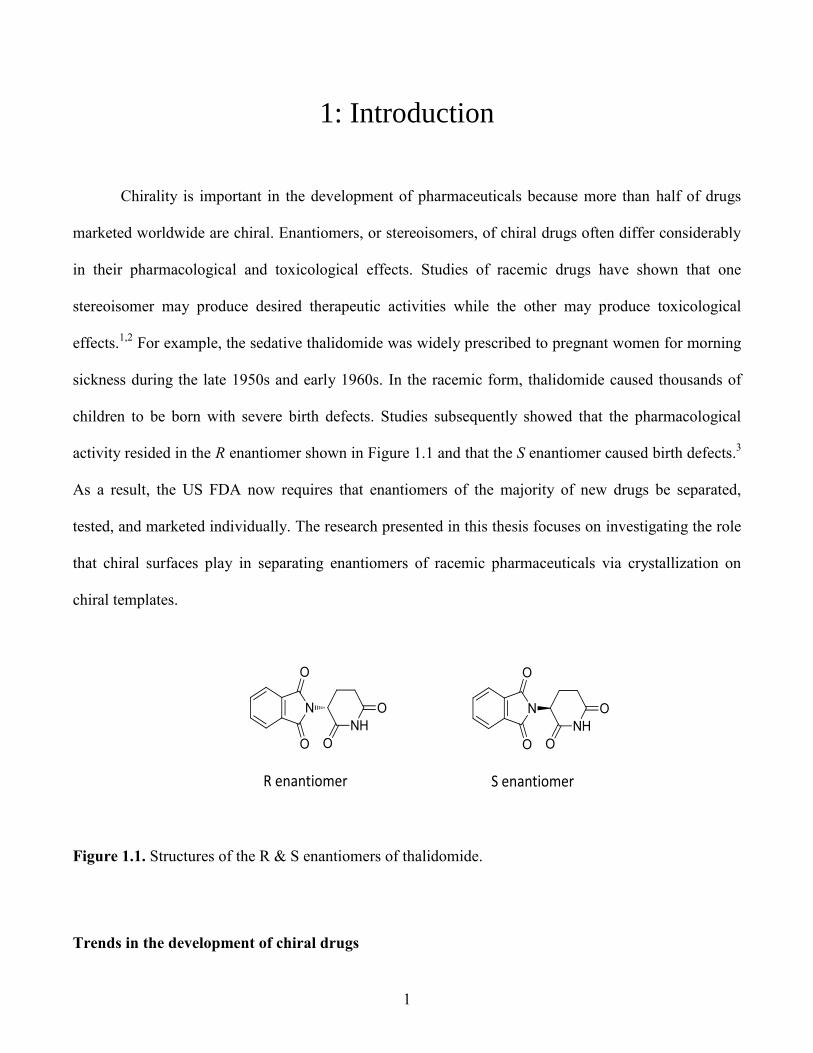
For example, the sedative thalidomide was widely prescribed to pregnant women for morning
sickness during the late 1950s and early 1960s. In the racemic form, thalidomide caused thousands of
children to be born with severe birth defects. Studies subsequently showed that the pharmacological
activity resided in the R enantiomer shown in Figure 1.1 and that the S enantiomer caused birth defects.3
As a result, the US FDA now requires that enantiomers of the majority of new drugs be separated,
tested, and marketed individually. The research presented in this thesis focuses on investigating the role
that chiral surfaces play in separating enantiomers of racemic pharmaceuticals via crystallization on
chiral templates.
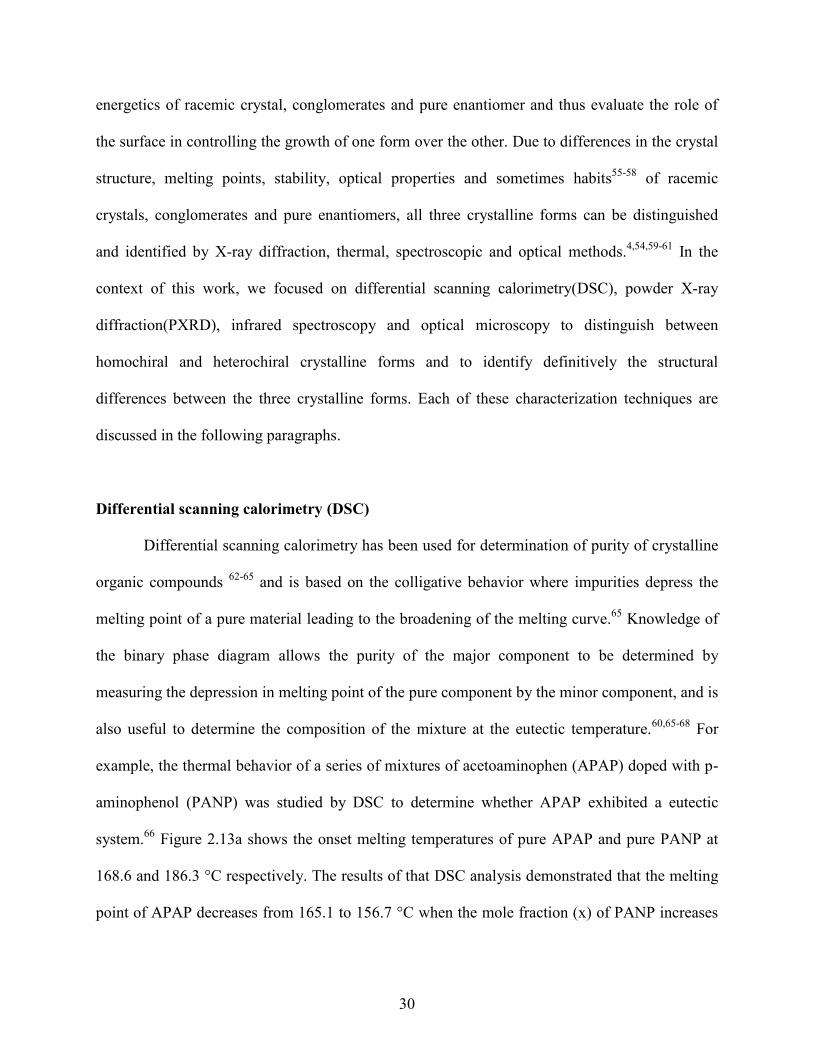
Figure 1.1. Structures of the R & S enantiomers of thalidomide.
Trends in the development of chiral drugs
R enantiomer S enantiomer
2
With the tightening of regulations over the past decade, the single-enantiomer drug segment has
become an integral part of the overall pharmaceutical market. The growth in single-enantiomer
pharmaceuticals amounted to US$ 225 billion in 2005 and the percentage of single-enantiomeric drugs
in the market increased from 10% before the 1990s to 37% in 2005.4,5
More than half the drugs
approved worldwide are chiral, including many of the top-selling drugs in the world.6,7
For example,
among the top 10 best-selling U.S. small-molecule pharmaceutical drugs in 2009, six were single
enantiomers, two were achiral, and only two were sold as racemates as shown in Table 1.1.6,8
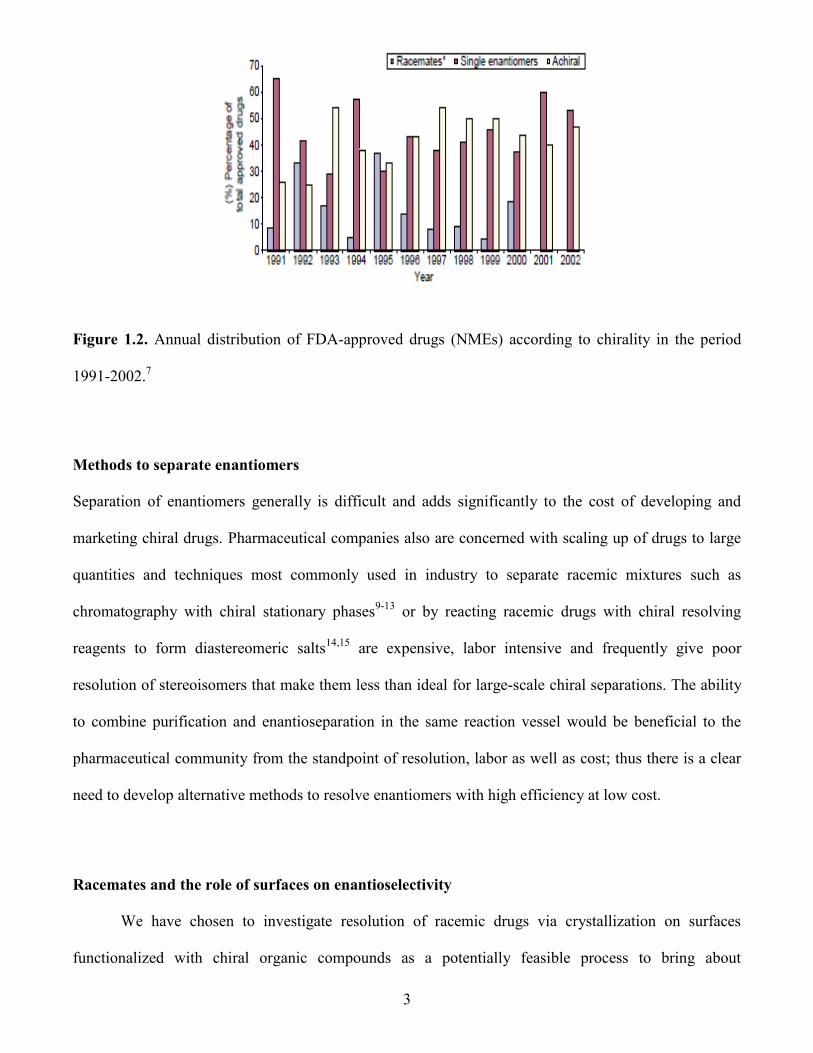
An
analysis of the new molecular entities (NMEs) approved by the U.S. FDA over the period of 1991-2002
is shown in Figure 1.2.7 Overall, there is a clear trend that the sale of racemate drugs decreased from
1992 (21%) to 2008 (5%)8 accompanied by an increase in the sale of chiral drugs from 30-40% in the
1990s to approximately 60% since 2000.7,8
Given that trend, there is a clear and pressing need
worldwide to develop new, cost-effective approaches for separating enantiomers.
Table 1.1. Top 10 best-selling small-molecule therapeutics in the U.S. in 2009.6
Rank* Brand Manufacturer Active ingredient Form of ingredient
1 Lipitor Pfizer Inc. Atorvastatin single enantiomer
2 Nexium AstraZeneca
Pharmaceuticals
Esomeprazole single enantiomer
3 Plavix Bristol-Myers Squibb Clopidogrel single enantiomer
4 Advair Diskus GlaxoSmithKline Fluticasone
salmeterol
single enantiomer, racemate
5 Seroquel AstraZeneca
Pharmaceuticals
Quetiapine achiral
6 Abilify Bristol-Myers Squibb Aripiperazol achiral
7 Singular Merck & Co., Inc. Montelukast single enantiomer
8 OxyContin Purdue Pharma LP Oxycodone single enantiomer
9 Actos Takeda Pharmaceuticals Pioglitazone racemate
10 Prevacid Takeda Pharmaceuticals Lansoprazole racemate
*http://www.drugs.com/top200.html
3
Figure 1.2. Annual distribution of FDA-approved drugs (NMEs) according to chirality in the period
1991-2002.7
Methods to separate enantiomers
Separation of enantiomers generally is difficult and adds significantly to the cost of developing and
marketing chiral drugs. Pharmaceutical companies also are concerned with scaling up of drugs to large
quantities and techniques most commonly used in industry to separate racemic mixtures such as
chromatography with chiral stationary phases9-13
or by reacting racemic drugs with chiral resolving
reagents to form diastereomeric salts14,15
are expensive, labor intensive and frequently give poor
resolution of stereoisomers that make them less than ideal for large-scale chiral separations. The ability
to combine purification and enantioseparation in the same reaction vessel would be beneficial to the
pharmaceutical community from the standpoint of resolution, labor as well as cost; thus there is a clear
need to develop alternative methods to resolve enantiomers with high efficiency at low cost.
Racemates and the role of surfaces on enantioselectivity
We have chosen to investigate resolution of racemic drugs via crystallization on surfaces
functionalized with chiral organic compounds as a potentially feasible process to bring about
4
enantioseparation. Surfaces are known to play a critical role in inducing nucleation of crystals by
favorably lowering the surface energy of crystal nuclei that form in the initial stage of crystallization.16
Although the affects of variables such as solvent,17
temperature,18
pH,19
and concentration20
on the
process of crystallization have been thoroughly investigated, the influence of surfaces (e.g., the walls of
a crystallization vessel) in directing the process of crystallization to control crystalline composition and
form largely has been ignored. Moreover, exploration of the role that chiral surfaces play in biasing
crystallization of enantiomers in a racemic mixture to favor formation homochiral crystals has only just
begun. In the work presented here, we take advantage of chirality and thus diastereomeric interactions
between the surface and enantiomers of racemic drugs in solution to bias crystallization to favor
nucleation and growth of crystals of single enantiomers as an alternative approach to resolve racemates.
During crystallization of a racemic mixture, the two enantiomers can aggregate together on a
surface to form racemic crystals, or the enantiomers can aggregate separately to form a mixture
containing equal amounts of enantiomerically pure crystals called conglomerates that resolve
spontaneously during nucleation. Unfortunately, crystallization favors formation of racemic crystals
over conglomerates both energetically and statistically for approximately 95% of chiral compounds
because racemic crystals generally are more stable due to more efficient packing of racemates that lower
the lattice energy relative to packing of single enantiomers, and also because a greater number of achiral
crystallographic space groups are available for crystal packing relative to chiral space groups.21
The
difference in lattice energy between racemic crystals and conglomerates often is small enough (e.g.,
~1.0-2.0 kcal/mol),21,22
however, that conglomerates can be induced to form by changing parameters
such as temperature or the solvent system used for crystallization. For example, sodium ammonium
tartrate, also known as Pasteur’s salt, spontaneously resolves as conglomerates from water at
temperatures below 28 °C, whereas racemic crystals form at temperatures above 28 °C.1,22
The central
theme of our research is to use chiral surfaces as templates that bias molecular adsorption to favor
homochiral aggregation over heterochiral aggregation in order to overcome the energetic bias for
5
formation of racemic crystals. Consequently, we have examined whether diastereomeric interactions
between a chiral surface and enantiomers of the racemic drug would provide a large enough difference
in energy to promote formation of conglomerates over racemic crystals, and concurrently induce
preferential nucleation of homochiral crystals of one enantiomer over the other. Previous studies on
adsorption of amino acids on inorganic chiral surfaces have shown that quartz selectively adsorbs D-
alanine onto the surface from a racemic solution to the extent of 1.4% over L-alanine.23,24
Although
nucleation of crystals was not examined in that study, those findings demonstrate the ability of a chiral
surface to resolve enantiomers and provide a foundation for designing new strategies for chiral
resolution that utilize chiral surfaces as templates for selective adsorption of one enantiomer. Moreover,
Mastai et al recently investigated self-assembled monolayers (SAMs) of cysteine as chiral surfaces for
the enantioselective crystallization of histidine.25
The study showed that crystallization of a racemic
solution of histidine onto L-cysteine produced bulk samples of crystals enriched with D-histidine in
27% enantiomeric excess (ee), whereas crystallization onto D-cysteine surface resulted in enrichment of
histidine in 31% ee. A similar finding also was observed for crystallization of a racemic solution of
glutamic acid onto the surface of L-cysteine, which resulted in samples of crystals enriched in D-
glutamic acid in 31 % ee.26
That work provides compelling evidence not only that chiral surfaces can
distinguish between enantiomers and promote selective adsorption of racemic amino acids, but that
subsequent aggregation of solute onto the resulting adlayer can lead to preferential nucleation of
homochiral crystals enriched in one enantiomer. Those studies focused solely on amino acids as model
systems. In our research, we wanted to investigate the broader utility of this approach to resolve chiral
pharmaceuticals, particularly those capable of bonding strongly to chiral groups on the surface to
maximize diastereomeric interactions. Accordingly, we have carried out a detailed investigation of
enantioselective crystallization of two racemic drug systems on chiral templates consisting of chiral thin
molecular films derived from self-assembled monolayers of thiols. Two approaches were explored for
preparing chiral surfaces, the first of which involved covalent attachment of aminoacids and derivatives
of aminoacids on gold substrates, such that the template consisted of molecules of chiral amino acid
6
exposed on the surface. The second approach, involved attachment of a drug as a salt on an underlying
basic SAM whereby molecules of the chiral drug were exposed at the surface. We wanted to
demonstrate for first time that crystallization of a racemic drug on a self-complementary chiral template
of the drug itself promotes enantioselective crystallization, providing proof of concept of the utility of
that novel approach as a facile means to create a broad library of chiral templates from drugs for
separating enantiomers. The body of work in this thesis fully explores the process of enantioselective
crystallization on chiral surfaces by exploring the specific molecular interactions occurring at the
interface between chiral solutes and functionality on the surface to better understand the mechanism by
which chiral recognition occurs during the process of molecular aggregation leading to homochiral
nucleation and resolution of racemates via crystallization.
Objectives
Two goals of this work are to determine (1) whether chiral surfaces can act as templates that bias
molecular aggregation at the surface to favor single enantiomers thereby inducing nucleation of
conglomerates over racemic crystals, and (2) whether chiral templating can be used to induce selective
nucleation of one enantiomer leading to high enantiomeric excess. We wanted to fully explore the
crystallization behavior of racemic drugs and the mechanism of chiral recognition. We hypothesize that
chiral surfaces will induce racemic solutions of drugs to crystallize as conglomerates where one
enantiomer crystallizes preferentially before the other. We expect that diastereomeric interactions
between the chiral molecules bonded covalently to the surface and the enantiomers of the drug in
contact with the surface should lead to preferential nucleation of one enantiomer over the other, thereby
allowing enantiomerically pure crystals to be resolved and harvested. Accordingly, work was carried out
to test the above hypothesis for two model systems: 3-phenyllactic acid (3PLA) and N-acetylleucine
(NAL). These compounds were chosen for the following reasons: They both form conglomerates and
the crystal structures are known;27,28
crystallization can be carried out under ambient conditions in the
laboratory and the compounds are soluble in organic solvents and water; the conglomerate and racemic
7
crystals can be distinguished both by optical microscopy and by other characterization techniques; and
the molecular structures have functional groups capable of forming strong hydrogen bonds at the
surface.
Specifically, we wanted to investigate crystallization of racemic solutions of 3PLA and NAL on
a series of achiral and chiral SAMs with variable hydrophobicity/hydrophilicity in order to determine
whether chiral SAMs were enriched with crystals of single enantiomers and whether the
enantioselectivity could be controlled by switching the chirality of the surface, and to quantify the level
of enantiomeric purity by thermal analysis. We sought to probe the effect of chiral impurities present in
solution on chiral resolution to determine if and how soluble chiral species might complete with chiral
recognition at the surface. A major aim of this research was to develop a mechanistic rationale for chiral
discrimination of racemic drugs by carefully examining the orientation of homochiral crystals to
determine the frequency with which specific crystalline faces were in contact with the surface. Through
analysis of the crystal structures of the pure enantiomers, our goal was to identify the specific
intermolecular interactions occurring on the most prevalent faces to elucidate the role that hydrogen
bonding plays in templating and enantioselective discrimination. We also wanted to compare the habits
of homochiral crystals grown under different conditions to determine if changes in the morphology of
crystals occurred in response to the build up one enantiomer in excess in solution.
In addition, we wanted to explore a new approach to form chiral templates that are self-
complementary to the racemic drug to be resolved by attaching a chiral overlayer of the drug to the
SAM, and then testing the selectivity. One of the advantages of SAMs is that their surfaces can be
modified via reaction at exposed surface groups29
to build multilayer films.30-32
For example, Mallouk
and coworkers prepared multilayer metal phosphonate thin films consisting of alternating layers of
metal cations and phosphonate anions joined by ionic interactions between the metal ions and phosphate
groups.31,32
Similarly, multilayer SAMs of carboxylic acids and amides have been prepared by
8
depositing an overlayer of organic amides onto an underlying SAM of carboxylic acids on gold.30
These
studies demonstrate the ability to design stable multicomponent films and allow different types of
functionalities to be introduced at the surface of an existing SAM. We wanted to explore whether chiral
groups could be introduced on the surface of a SAM by depositing one enantiomer of a chiral drug
containing a carboxylic acid onto basic surface of a SAM of cysteamine via salt formation, thus
generating a self-complementary chiral template on which to investigate crystallization of racemic
solutions of the same drug. We hypothesized that pre-organizing one enantiomer of the racemic drug on
the surface might lead to stronger diastereomeric interactions between the resulting chiral drug template
and homochiral crystals of the same drug, thereby leading to greater enantioselectivity. We anticipate
this approach will provide a convenient means to prepare chiral surfaces from any chiral drug
containing a carboxylic acid or other acid group, and thus create a large library of chiral templates that
exhibit a range of surface energies and intermolecular interactions for optimizing resolution of racemate
via crystallization.
This dissertation is divided into six chapters: Chapter 2 provides background information of
chiral resolution, crystallization of achiral molecules and modification of crystal habit, crystallization of
racemates, self-assembled monolayers and the analytical techniques used to characterize crystals and
surfaces in this work. Although 3PLA is known to form a conglomerate from water,27,33
we were able to
obtain a new racemic crystal from 3:1 hexanes/ethyl acetate. Thus the structural, thermal and
spectroscopic analyses of the three crystalline forms of 3PLA are discussed in Chapter 3. Chapters 4-6
provide detailed description of the surface modification, crystallization and mechanism of chiral
recognition of 3PLA as well as NAL on achiral and chiral surfaces. In Chapter 4, facial selectivity,
enantioselective crystallization, morphological changes, and mechanism of chiral discrimination of
3PLA on chiral surfaces is presented. In Chapter 5, a unique strategy for investigating enantioseparation
on chiral surfaces by attachment of an overlayer of chiral drugs such as 3PLA is presented. Chapter 6
9
describes the enantioenhancement of NAL via crystallization on chiral surfaces. Each chapter includes a
brief introduction, experimental details, followed by results and discussion.
REFERENCES
(1) Eliel, E. L.; Wilen, S. H.; Mander, L. N. Stereochemistry of Organic Compounds; John Wiley
and Sons: New York, 1994.
(2) Drayer, D. E. Clin. Pharmacol. Ther. 1987, 40, 125.
(3) Eriksson, T.; Bjorkman, S.; Roth, B.; Fyge, A.; Hoglund, P. Chirality 1995, 7, 44.
(4) Erb, S. Pharmceut. Technol. 2006, 30, 14.
(5) Murakami, H.; Sakai, K.; Hirayama, N.; Tamura, R. Topics in Current Chemistry; Springer:
Heidelberg, 2006; Vol. 269.
(6) Rouhi, A. M. In Chem. Eng. News. 2004; Vol. 82, p 47.
(7) Caner, H.; Groner, E.; Levy, L.; Agranat, I. DDT 2004, 9, 105.
(8) Lin, G.; Zhang, J.; Cheng, J. Chiral Drugs: Chemistry and Biological Action 2011, 3.
(9) Allenmark, S.; Schurig, V. J. Mater. Chem. 1997, 7, 1955.
(10) Chilmonczyk, Z.; Ksycinska, H.; Cybulski, J.; Rydzewski, M.; Les, A. Chirality 1998, 10, 821.
(11) Francotte, E. R. J. Chromatogr., A 2001, 906, 379.
(12) Hyun, M. H.; Kim, J. I.; Cho, Y. J.; Han, S. C. Chromatographia 2004, 60, 275.
(13) Maier, N. M.; Franco, P.; Lindner, W. J. Chromatogr., A 2001, 906, 3.
(14) Fogassy, E.; Acs, M.; Faigl, F.; Simon, K.; Rohonczy, J.; Ecsery, Z. J. Chem. Soc., Perkin
Trans. 2 1986, 1881.
(15) Anandamanoharan, P. R.; Cain, P. W.; Jones, A. G. Tetrahedron Asymm 2006, 17, 1867.
(16) Lee, A. Y.; Ulman, A.; Myerson, A. S. Langmuir 2002, 18, 5886.
(17) Lahav, M.; Leiserowitz, L. Chem. Eng. Sci. 2001, 56, 2245.
(18) Shekunov, B. Y.; Aulton, M. E.; Adama-Acquah, R. W.; Grant, D. J. Chem. Soc., Faraday
Trans 1996, 92, 439.
(19) Judge, R. A.; Jacobs, R. S.; Frazier, T.; Snell, E. H.; Pusey, M. L. Biophys. J. 1999, 77, 1585.
(20) Garnier, S.; Petit, S.; Coquerel, G. J. Cryst. Growth 2002, 234, 207.
(21) Brock, C. P.; Schweizer, W. B.; Dunitz, J. D. J. Am. Chem. Soc. 1991, 113, 9811.
(22) Collet, A.; Brienne, M. J.; Jacques, J. Chem. Rev. 1980, 80, 215.
(23) Bonner, W. A.; Kavasmaneck, P. R.; Martin, F. S.; Flores, J. J. Science 1974, 186, 143.
(24) Bonner, W. A.; Kavasmaneck, P. R.; Martin, F. S.; Flores, J. J. Orig. Life 1975, 6, 367.
(25) Dressler, D. H.; Mastai, Y. J. Colloid Interface Sci. 2007, 310, 653.
(26) Dressler, D. H.; Mastai, Y. Chirality 2007, 19, 358.
(27) Cesario, M.; Guilhem, J. Cryst. Struct. Commun. 1975, 4, 245.
(28) Waskowska, A.; Lukaszewicz, K.; Kuzmina, L. G.; Strutshkov, Y. T. Bull. Pol. Acad. Sci. 1975,
23, 149.
(29) Ulman, A. Chem. Rev. 1996, 96, 1533.
(30) Yan, L.; Marzolin, C.; Terfort, A.; Whitesides, G. M. Langmuir 1997, 13, 6704.
(31) Guang, C.; Hong, H.-G.; Mallouk, T. E. Acc. Chem. Res. 1992, 25, 420.
(32) Lee, H.; Kepley, L. J.; Hong, H.-G.; Akhter, S.; Mallouk, T. E. J. Phys. Chem. 1988, 92, 2597.
(33) Jacques, J., Collet, A.; Wilen, S. H. Enantiomers, Racemates, and Resolutions; John Wiley and
Sons: New York, 1981.
10
2: BACKGROUND
Material provided in this chapter presents a comprehensive description of the established
experimental and theoretical aspects of molecular crystals, nucleation and growth of crystals,
and the analytical methods and nomenclature commonly used to describe crystals and crystalline
structure that are relevant to this work. Section 2.1 summarizes current methods utilized to carry
out chiral resolution of racemic compounds. Section 2.2 provides background information
related to crystal nucleation in solution, while section 2.3 introduces the fundamental concepts of
X-ray crystallography that are necessary to understand in the context of this research. Section 2.4
describes how chiral molecules are known to crystallize from solution, whereas section 2.5
explains the various methods used to differentiate between homochiral and heterochiral crystals.
Section 2.6 provides discussion of self-assembled monolayers and describes techniques of
surface characterization used in this study.
2.1 Current methods of chiral resolution
2.1.1 Chromatographic resolution
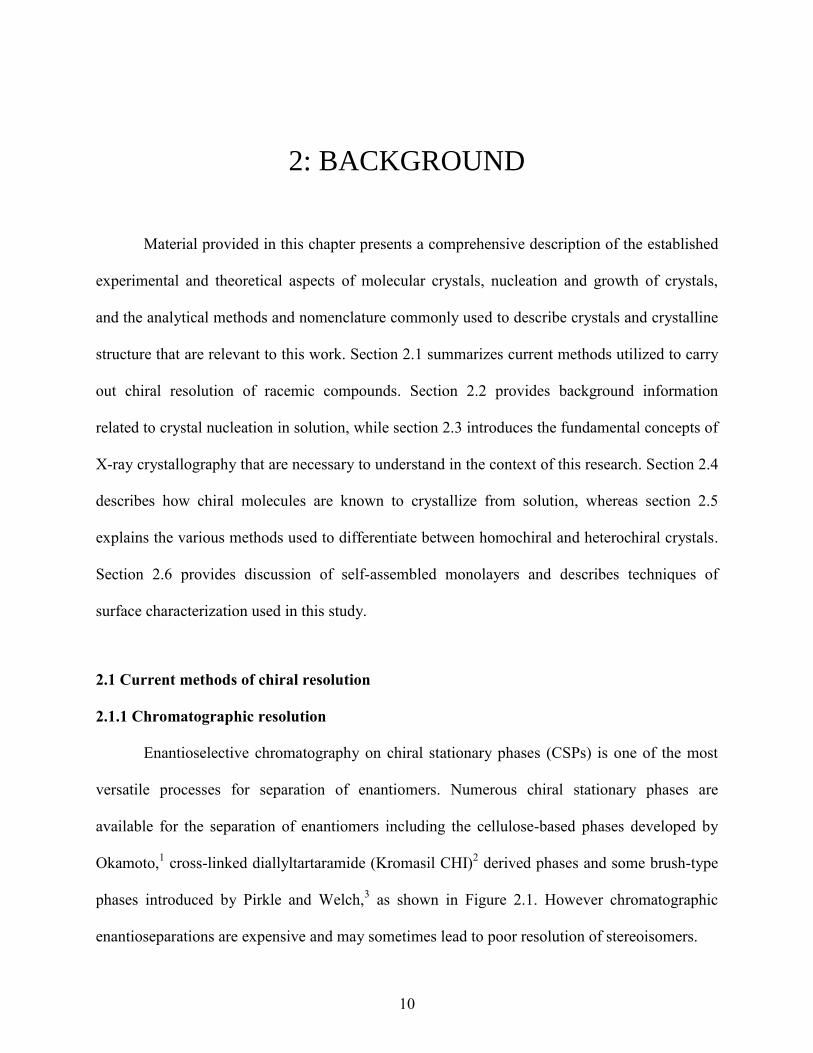
Enantioselective chromatography on chiral stationary phases (CSPs) is one of the most
versatile processes for separation of enantiomers. Numerous chiral stationary phases are
available for the separation of enantiomers including the cellulose-based phases developed by
Okamoto,1 cross-linked diallyltartaramide (Kromasil CHI)
2 derived phases and some brush-type
phases introduced by Pirkle and Welch,3 as shown in Figure 2.1. However chromatographic
enantioseparations are expensive and may sometimes lead to poor resolution of stereoisomers.
11
Figure 2.1. Most commonly used commercially available CSPs for separations include cellulose
tribenzoate (a),1 Kromasil CHI-DMB (b),
2 and Whelk-O 1 (c).
3
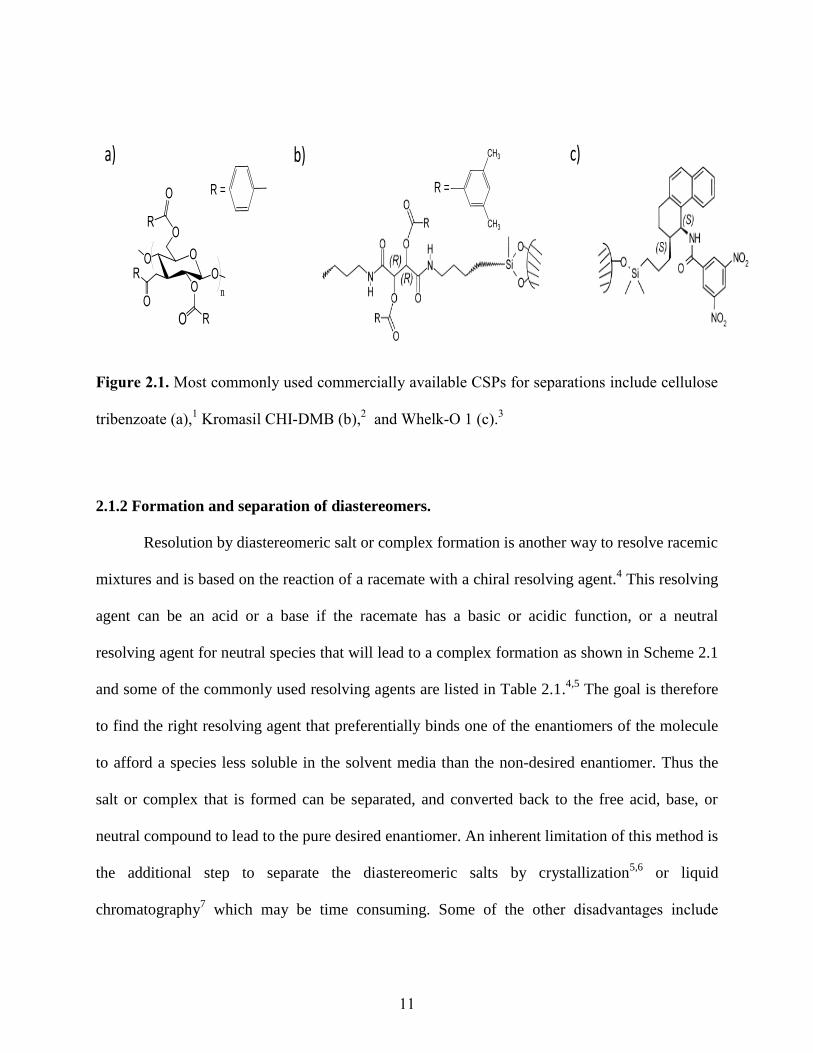
2.1.2 Formation and separation of diastereomers.
Resolution by diastereomeric salt or complex formation is another way to resolve racemic
mixtures and is based on the reaction of a racemate with a chiral resolving agent.4 This resolving
agent can be an acid or a base if the racemate has a basic or acidic function, or a neutral
resolving agent for neutral species that will lead to a complex formation as shown in Scheme 2.1
and some of the commonly used resolving agents are listed in Table 2.1.4,5
The goal is therefore
to find the right resolving agent that preferentially binds one of the enantiomers of the molecule
to afford a species less soluble in the solvent media than the non-desired enantiomer. Thus the
salt or complex that is formed can be separated, and converted back to the free acid, base, or
neutral compound to lead to the pure desired enantiomer. An inherent limitation of this method is
the additional step to separate the diastereomeric salts by crystallization5,6
or liquid
chromatography7 which may be time consuming. Some of the other disadvantages include
R =
a)
R =
b) c)
12
formation of decomposition products,8, as well as the choice and enantiomeric purity of the
chiral resolving agent which can be labor intensive.4,6
Scheme 2.1. Resolution of racemic 2-phenylpropanoic acid via (R)-1-phenylethanamine as a
chiral resolving agent.5
Table 2.1 Commonly used chiral resolving agents.4
Acids Bases
tartaric acid ephedrine
dibenzoyltartaric acid quinine
mandelic acid 1-phenylethanamine
10-camphorsulfonic acid 2-aminobutanol
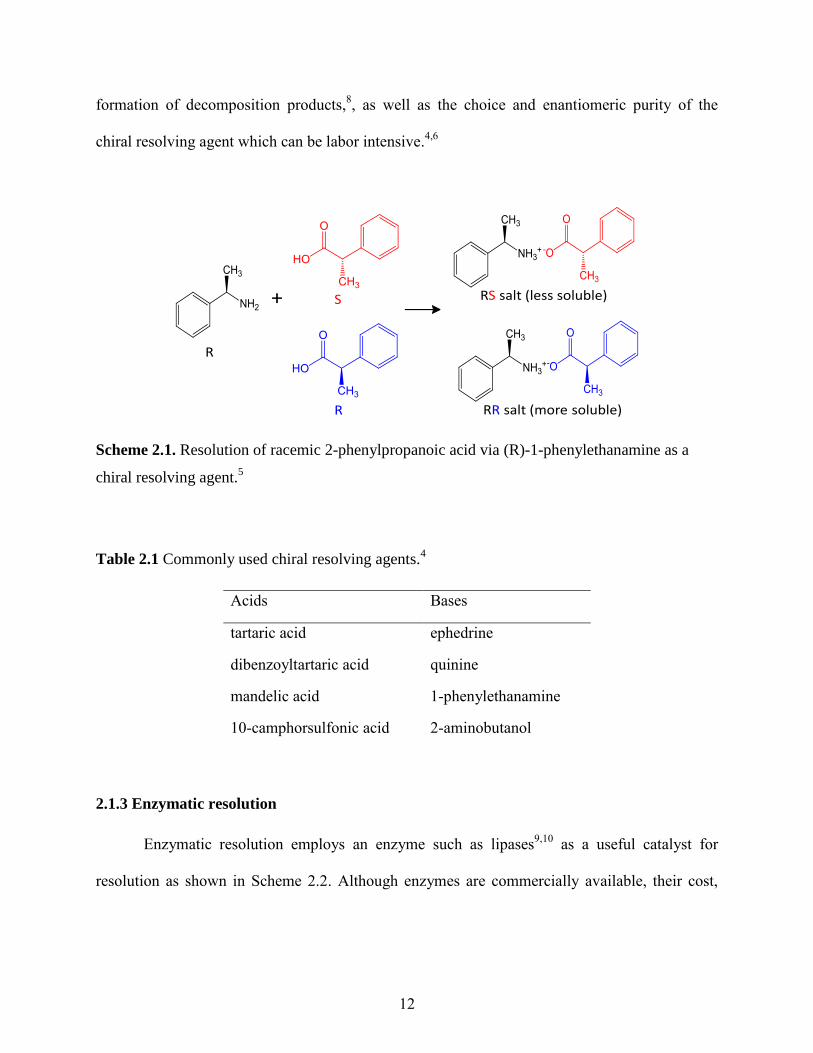
2.1.3 Enzymatic resolution
Enzymatic resolution employs an enzyme such as lipases9,10
as a useful catalyst for
resolution as shown in Scheme 2.2. Although enzymes are commercially available, their cost,
+
R
RS salt (less soluble)
RR salt (more soluble)
S
R
13
stability and selectivity strongly limits their usage for chiral resolution.4,9
Thus, there is a
growing interest in developing alternate technologies to resolve enantiomers.
Scheme 2.2. Enzymatic resolution of racemic diamines rac-4.10
Resolution by crystallization is commonly performed in many laboratories. In order to
get a thorough understanding of the interesting events that occur during nucleation and growth of
molecular crystals, a brief overview of the different steps involved in the process of
crystallization is discussed in the following paragraphs.
2.2 Crystallization: Nucleation and growth of molecular crystals
Crystallization of molecular species from solution as a phenomenon has been
investigated for many years, leading to the development of sophisticated models that are well
understood.11,12
The process of crystallization from solution is distinguished by two stages: (1)
heterogeneous nucleation involving the aggregation of molecules from solution on a high energy
surface leading to formation of a nucleus of critical size; and (2) crystal growth involving
subsequent addition of molecules, or aggregates of molecules, from solution onto the surface of
the nucleus.12,13
Crystal nucleation is associated with a free energy of activation, and is therefore
+ lipase +
rac-4 (1S,2S)-4 (1R,2R)-6
NR1R2 = enantiomeric excess = 94%(ee)
14
rate limiting as shown in Figure 2.2. The molecules of solute must first collide to form small
aggregates on a surface (labeled as “aggregate” in Figure 2.2). Aggregation of molecules is
initiated as the concentration of solute reaches saturation, and is driven further as the solution
becomes supersaturated either by evaporation of solvent or lowering the temperature to decrease
solubility. As aggregates form, their overall free energy increases with size up to a point as the
aggregate grows larger principly because unfavorable free energy at the surface of the particle
dominates over favorable free energy in the interior of the particle. The free energy reaches a
maximum when the aggregate reaches a critical radius, rc, at which point favorable free energy in
the interior of the particle dominates resulting in a stable crystal nucleus. The second step, called
crystal growth, involves addition of molecules to the nucleus once it has formed, leading to a
reduction in the free energy of the system. During the nucleation step, aggregates having a size
smaller than the critical radius tend to fall apart and dissolve back into solution rather than form
stable nuclei, while the particles having a size greater than rc grow into stable nuclei. The number
of aggregates that survive to reach the critical size and become stable nuclei can be increased by
simply increasing the concentration of solute molecules thereby adjusting the level of
supersaturation. Ostwald showed that a stable crystal nucleus necessarily requires formation of a
spherical aggregate made up of a minimum of 1013
molecules.14,15
Homogeneous nucleation—
that is, nucleation in the absence of a surface—is rare and requires high supersaturation
conditions to overcome the free energy of aggregate. Heterogeneous nucleation in the presence
of the surface, on the other hand, lowers the surface energy of the aggregate.16
Thus, the surface
plays a critical role both in fostering initial aggregation of molecules, and by lowering the
surface free energy of a growing aggregate. The aggregates when attached to foreign surface (or
substance) can readily reach the critical size and grow to form macroscopic crystals. The ability
15
of surfaces to promote molecular aggregation via formation of favorable intermolecular contacts
between molecules of solute and functional groups exposed at the surfaces is central to our
approach for chiral discrimination in the research that follows. Surfaces can be decorated with
different organic functional groups thereby creating substrates with a range of surface energies.
In principle, surfaces can also be made enantioselective by attaching homochiral organic
molecules to achiral substrates. Stereogenic centers exposed at the surface can bind differentially
to enantiomers in a racemic solution by forming diastereomeric complexes allowing
enantiospecific nucleation to occur. We take advantage of this feature in our work to investigate
achiral and chiral surfaces with the goal of influencing surface-aggregate interactions as a means
to separate enantiomers.
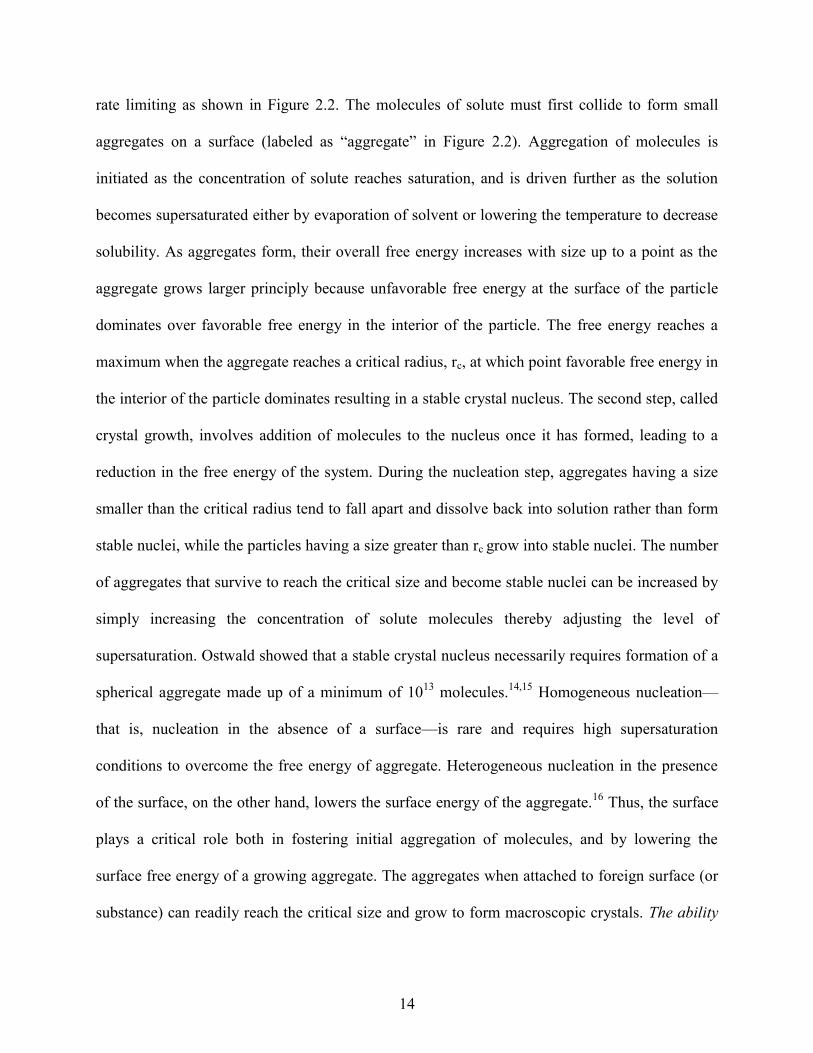
Figure 2.2. Illustration of molecular aggregation and nucleation during formation of crystals. a) Depiction
of the change in free energy, G, as a function of the size of the aggregate given as the radius, r. Molecules
of solute (red circles) collide to form an aggregate; rc is the critical radius such that at r < rc (the maximum
of free energy on the curve), aggregate is unstable and collapses, and at r > rc aggregate develops to form
a stable nucleus indicated by a decrease in the free energy. b) Illustration of heterogeneous nucleation in
which molecules in solution aggregate on a high energy surface and subsequently form a stable nucleus.
molecules in solution
aggregate
nucleus
b)
surface
surface
surface
r > rcr < rc
a)
G
rrc
stableunstable
16
2.3 Modification of crystal habit
One of the more notable features of a growing crystal is the development and
arrangement of its faces (i.e., the smooth flat surfaces of the crystal), vertices and edges that give
it a gem-like quality.17
The habit of a crystal is defined by the relative rates of growth of the
crystal in different directions. The terms ‘habit’, ‘morphology’ or ‘shape’ are synonymous and
are used interchangeably throughout this thesis. Crystals develop a variety of habits, examples of
which are shown in Figure 2.3, depending on internal factors inherent to the crystal structure
such as unit cell, molecular packing arrangement, intermolecular attractive and repulsive forces,
as well as external factors such as the conditions of crystallization. The habit of a crystal
provides information regarding the relative rates of growth in different directions that provide
clues about the intermolecular interactions driving molecular packing.
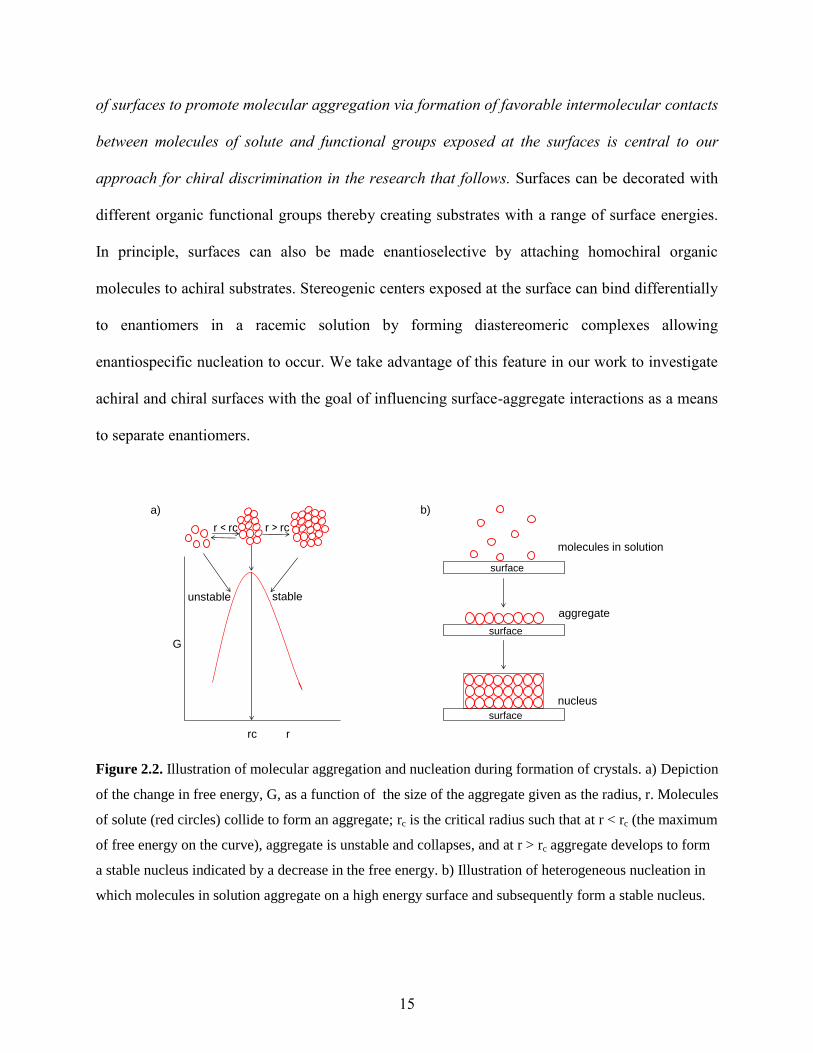
Figure 2.3. Commonly observed crystal habits include hexagonal plates (a), prisms (b), rectangular
plates (c), rods (d), rhombohedra (e), and needles (f).18-22
0.01 mm
d)
1 mm
e) f)
1 mm
0.2 mm
c)b)
1 mm
a)
0.4 mm
17
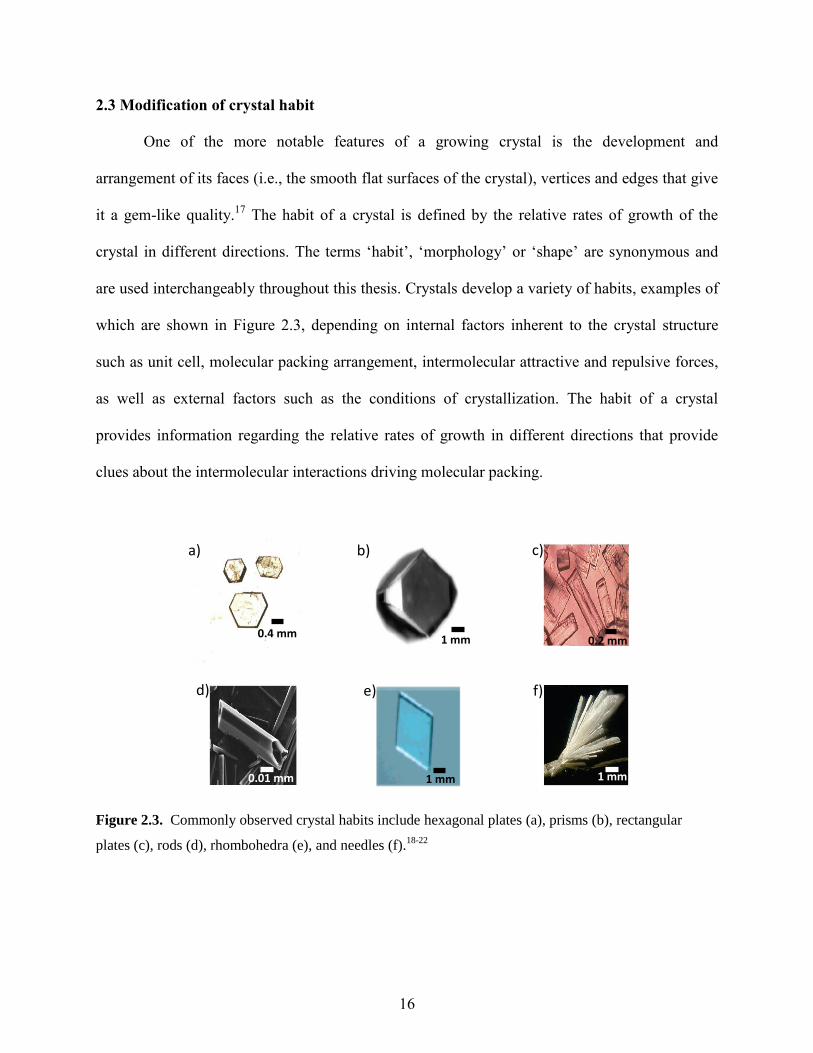
Crystals are bound by faces whose size indicates the relative rates of growth along the
direction perpendicular to the plane of the face, as shown in Figure 2.4.11,23
The slowest
directions of growth connect the faces, whereas the fastest directions of growth connect the
vertices. In general, the faces of a crystal that grow most rapidly are those to which molecules of
solute are most strongly bound.24
Thus, the more rapidly growing faces of crystals are those that
are the smallest and least well developed; whereas the larger faces are those to which molecules
of solute add most slowly.24
Figure 2.4. Depiction of the faces, vertices and edges of a crystal where the relative dimensions
of the crystal are defined by the slowest (blue) and fastest (red) directions of growth.
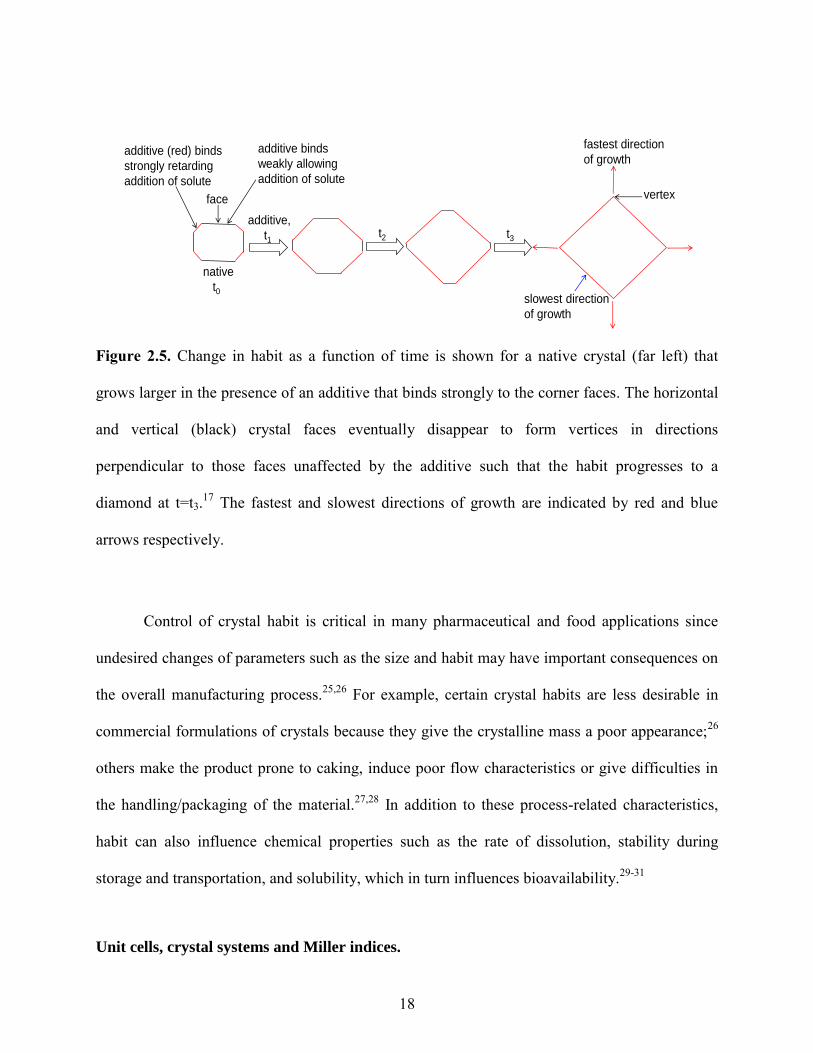
The presence of impurities, or molecular additives, often has a profound influence on
crystal habit that develops and will be discussed later in this section. Adsorption of an additive
onto the crystal may retard growth on certain faces, and these effects will therefore become
prominent in the habit of the crystal. As illustrated in Figure 2.5, an additive that binds strongly
to the small corner faces of a growing crystal can inhibit addition of solute to those faces. As a
result, the solute adds to the other faces at a faster rate, leading to a change in habit in which the
faces unaffected by the additive disappear over time.17
vertex fastest direction
of growth
slowest direction
of growth
face
edge
18
Figure 2.5. Change in habit as a function of time is shown for a native crystal (far left) that
grows larger in the presence of an additive that binds strongly to the corner faces. The horizontal
and vertical (black) crystal faces eventually disappear to form vertices in directions
perpendicular to those faces unaffected by the additive such that the habit progresses to a
diamond at t=t3.17
The fastest and slowest directions of growth are indicated by red and blue
arrows respectively.
Control of crystal habit is critical in many pharmaceutical and food applications since
undesired changes of parameters such as the size and habit may have important consequences on
the overall manufacturing process.25,26
For example, certain crystal habits are less desirable in
commercial formulations of crystals because they give the crystalline mass a poor appearance;26
others make the product prone to caking, induce poor flow characteristics or give difficulties in
the handling/packaging of the material.27,28
In addition to these process-related characteristics,
habit can also influence chemical properties such as the rate of dissolution, stability during
storage and transportation, and solubility, which in turn influences bioavailability.29-31
Unit cells, crystal systems and Miller indices.
additive,
t1 t3t2
native
t0
face
slowest direction
of growth
fastest direction
of growth
vertex
additive binds
weakly allowing
addition of solute
additive (red) binds
strongly retarding
addition of solute
19
One aspect of this research is investigating changes in morphology to determine if
changes in habits occur when crystals form in a chiral environment created by a chiral surface,
and in response to the build-up of one enantiomer in solution during the course of crystallization.
Knowledge of the habits of the racemic and pure enantiomers is essential to evaluate how a
chiral surface influences the habits of crystals of racemic pharmaceuticals. We also wanted to
determine if oriented growth of crystals on SAMs leads to development of characteristic faces
unique to templated growth on the surface. Analysis of the structural correlation between the
habit and crystal structure is useful for understanding why certain faces develop during crystal
growth and provide clues as to the type of interactions that promote templating on surfaces based
on the interactions between molecules exposed at specific faces on the surface of the crystal and
the functional groups exposed at the surface of the SAM. The concept of unit cell is important to
understand the crystal structure that results because molecules can pack in different arrangements
defined by the unit cell during nucleation. This packing is determined by the forces between
atoms, expressed by the sizes, charges, dipoles, and hydrophobicities of the individual molecules
or ions.17
Correlation between the crystal structure and packing arrangements provides
information on the type of forces holding the crystals together such that the molecules may
aggregate by virtue of van der Waals interactions, hydrogen bonding, etc. The relationship
between the unit cell and crystallographic orientation of molecules can be understood by
determining the Miller indices h, k, and l that are used to define each crystalline plane and the
corresponding crystal faces that are crystallographically derived. Assignment of Miller indices to
crystal faces, also known as indexing, is central to this research to determine the functional
groups presented on a specific face of the crystal, and the orientation of those molecules with
respect to the surface. Analysis of the crystal structure and functional groups exposed on the
20
different faces of the crystal aids in elucidating how molecules template on specific faces on
SAMs due to differences in the strengths of intermolecular interactions between the molecules of
the solute and the surface. Thus, by determining the crystal structure and obtaining the
crystallographic information such as the unit cell, Miller indices, packing arrangements and
hydrogen-bonding connectivities, the bulk habit of the crystal can be understood. Fundamental
concepts that are important to study structures of crystalline solids are explained below.
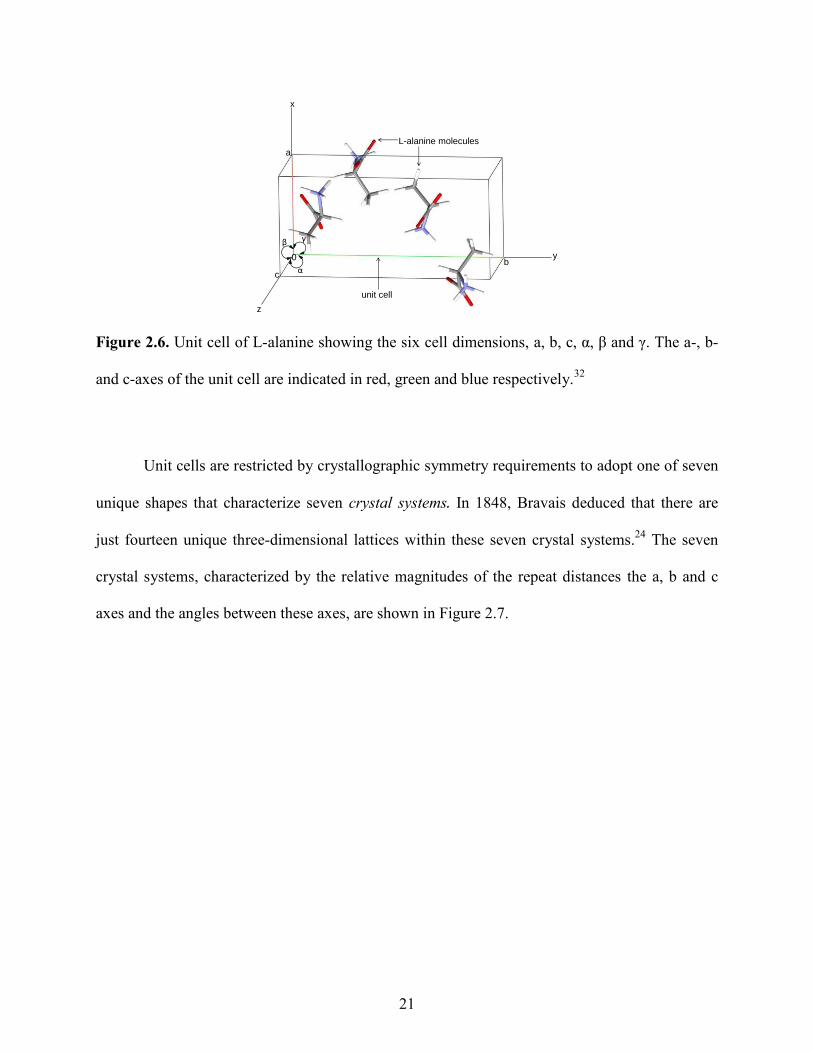
As discussed in section 2.2, a crystal is an ordered aggregation of molecules. The
arrangement of molecules and the symmetry relationships between molecules within a crystal
structure is defined by the unit cell, which is the simplest repeating arrangement of molecules in
a crystal. By convention, a unit cell is characterized by three vectors, a, b and c, and the
interaxial angles between the three edges of the cell are designated α (between b and c), β
(between a and c), and γ (between a and b). These unit cell vectors form the edges of a
parallelepiped where the directions are given in a right-handed axial system. The six unit cell
dimensions, a, b, c, α, β and γ, define the dimensions and shape of the unit cell in a crystal. For
example, the unit cell of L-alanine is shown in Figure 2.6 in which the a, b and c axes have
different lengths, and the α, β and γ angles are 90°.32
21
Figure 2.6. Unit cell of L-alanine showing the six cell dimensions, a, b, c, α, β and γ. The a-, b-
and c-axes of the unit cell are indicated in red, green and blue respectively.32
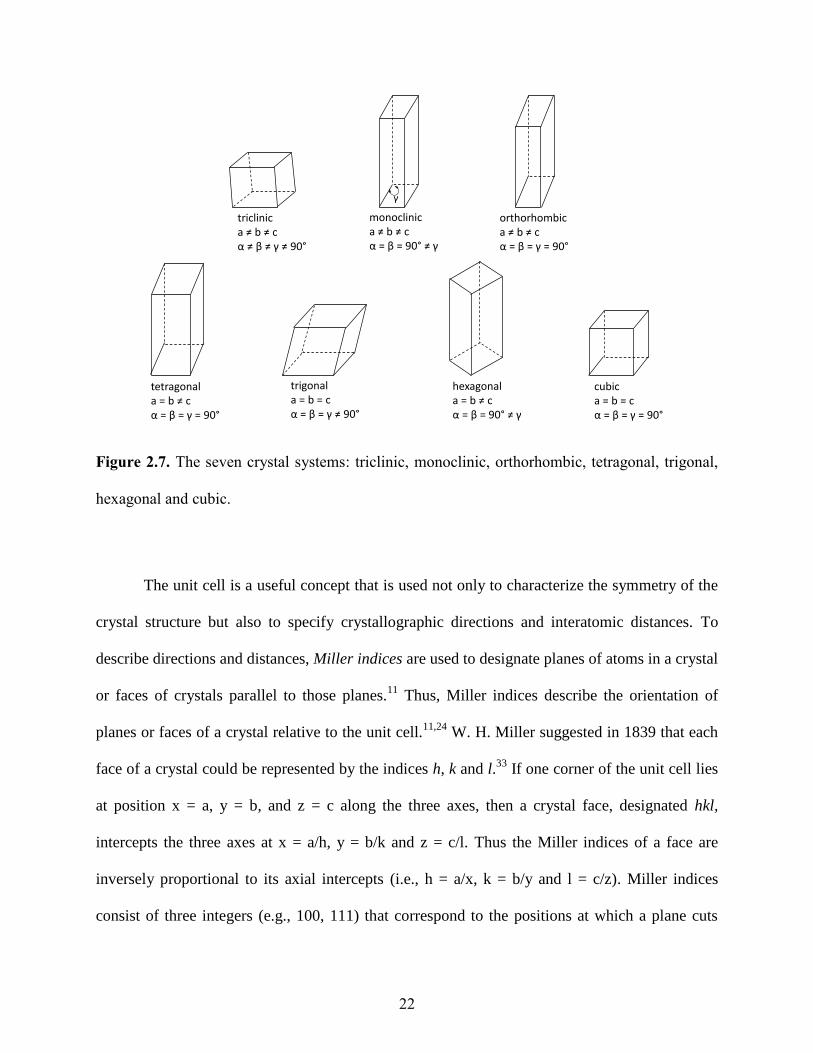
Unit cells are restricted by crystallographic symmetry requirements to adopt one of seven
unique shapes that characterize seven crystal systems. In 1848, Bravais deduced that there are
just fourteen unique three-dimensional lattices within these seven crystal systems.24
The seven
crystal systems, characterized by the relative magnitudes of the repeat distances the a, b and c
axes and the angles between these axes, are shown in Figure 2.7.
by
a
x
z
cα
unit cell
L-alanine molecules
0
β γ
22
Figure 2.7. The seven crystal systems: triclinic, monoclinic, orthorhombic, tetragonal, trigonal,
hexagonal and cubic.
The unit cell is a useful concept that is used not only to characterize the symmetry of the
crystal structure but also to specify crystallographic directions and interatomic distances. To
describe directions and distances, Miller indices are used to designate planes of atoms in a crystal
or faces of crystals parallel to those planes.11
Thus, Miller indices describe the orientation of
planes or faces of a crystal relative to the unit cell.11,24
W. H. Miller suggested in 1839 that each
face of a crystal could be represented by the indices h, k and l.33
If one corner of the unit cell lies
at position x = a, y = b, and z = c along the three axes, then a crystal face, designated hkl,
intercepts the three axes at x = a/h, y = b/k and z = c/l. Thus the Miller indices of a face are
inversely proportional to its axial intercepts (i.e., h = a/x, k = b/y and l = c/z). Miller indices
consist of three integers (e.g., 100, 111) that correspond to the positions at which a plane cuts
orthorhombica ≠ b ≠ cα = β = γ = 90°
trigonala = b = cα = β = γ ≠ 90°
hexagonala = b ≠ cα = β = 90° ≠ γ
tetragonala = b ≠ cα = β = γ = 90°
monoclinica ≠ b ≠ cα = β = 90° ≠ γ
γ
triclinica ≠ b ≠ cα ≠ β ≠ γ ≠ 90°
cubica = b = cα = β = γ = 90°
23
through the a, b, and c axes of the unit cell.11
To determine these indices for a particular family
of planes, a few simple conventions have been established in crystallography.11,24,34
The commas
separating the indices are customarily omitted.24
Thus, (4,4,2) is usually expressed as (442), but
(12,4,2) would remain as such. The convention for a plane in a crystal, or a crystal face, is to
enclose the three numbers in parentheses and is written as (111). The generally accepted notation
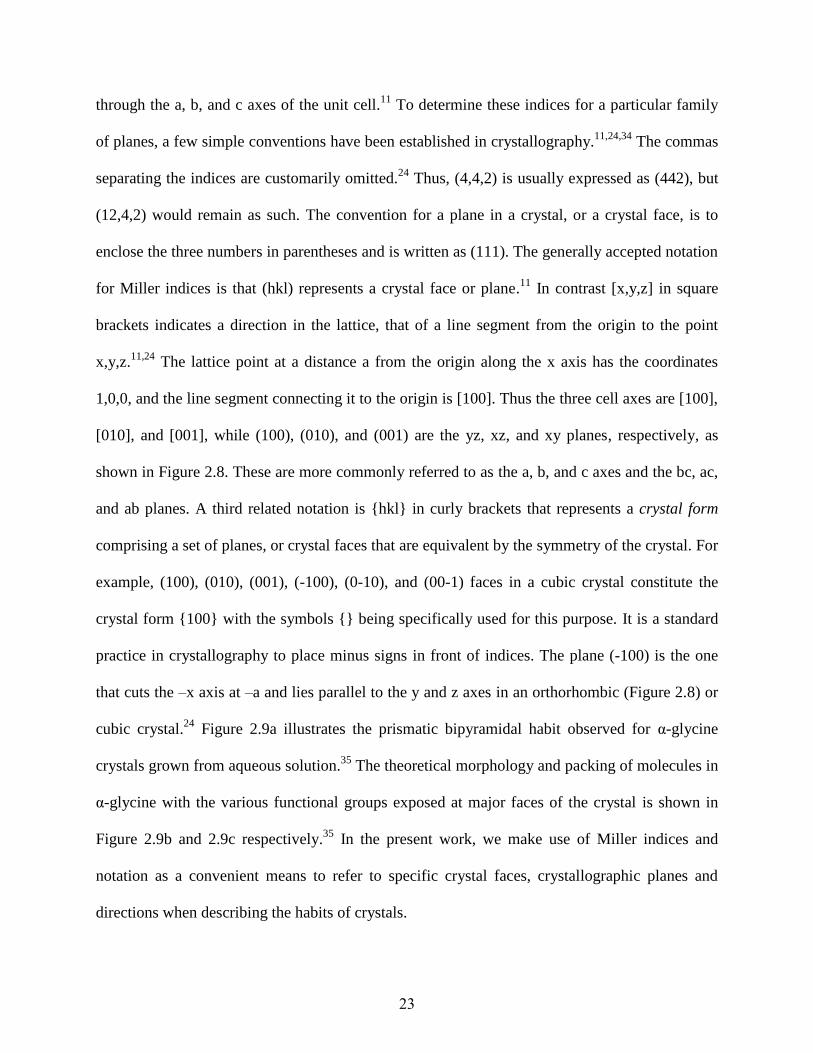
for Miller indices is that (hkl) represents a crystal face or plane.11
In contrast [x,y,z] in square
brackets indicates a direction in the lattice, that of a line segment from the origin to the point
x,y,z.11,24
The lattice point at a distance a from the origin along the x axis has the coordinates
1,0,0, and the line segment connecting it to the origin is [100]. Thus the three cell axes are [100],
[010], and [001], while (100), (010), and (001) are the yz, xz, and xy planes, respectively, as
shown in Figure 2.8. These are more commonly referred to as the a, b, and c axes and the bc, ac,
and ab planes. A third related notation is {hkl} in curly brackets that represents a crystal form
comprising a set of planes, or crystal faces that are equivalent by the symmetry of the crystal. For
example, (100), (010), (001), (-100), (0-10), and (00-1) faces in a cubic crystal constitute the
crystal form {100} with the symbols {} being specifically used for this purpose. It is a standard
practice in crystallography to place minus signs in front of indices. The plane (-100) is the one
that cuts the –x axis at –a and lies parallel to the y and z axes in an orthorhombic (Figure 2.8) or
cubic crystal.24
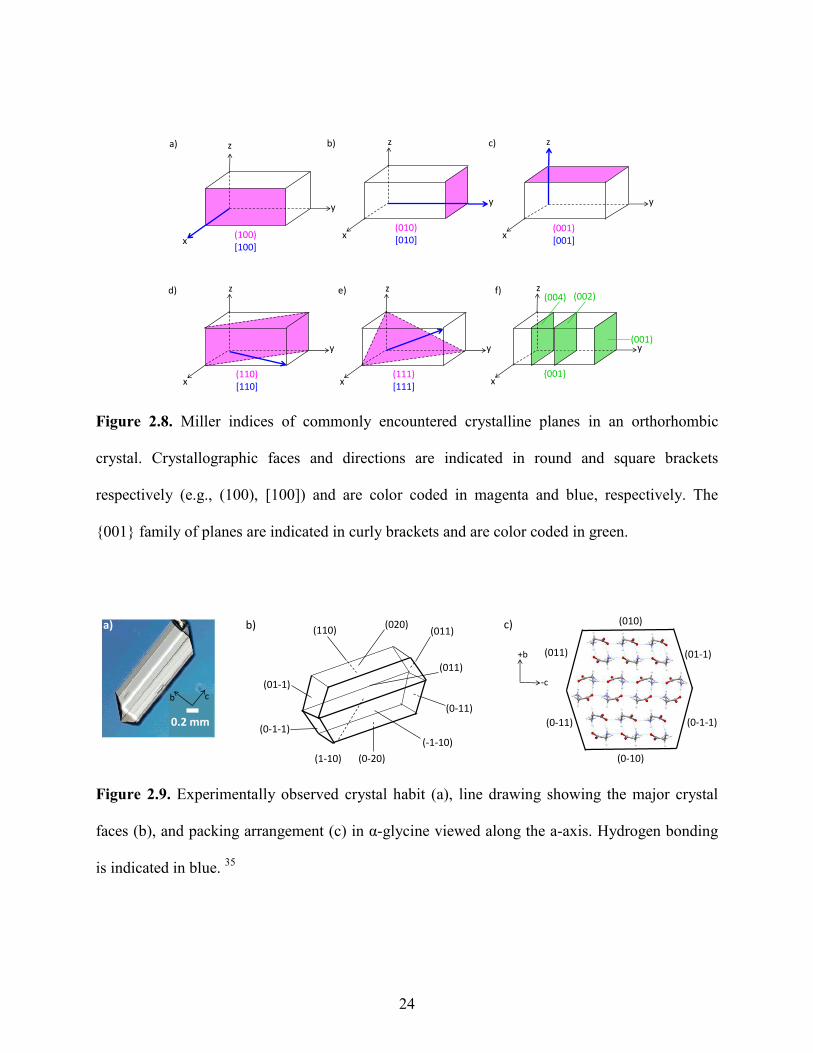
Figure 2.9a illustrates the prismatic bipyramidal habit observed for α-glycine
crystals grown from aqueous solution.35
The theoretical morphology and packing of molecules in
α-glycine with the various functional groups exposed at major faces of the crystal is shown in
Figure 2.9b and 2.9c respectively.35
In the present work, we make use of Miller indices and
notation as a convenient means to refer to specific crystal faces, crystallographic planes and
directions when describing the habits of crystals.
24
Figure 2.8. Miller indices of commonly encountered crystalline planes in an orthorhombic
crystal. Crystallographic faces and directions are indicated in round and square brackets
respectively (e.g., (100), [100]) and are color coded in magenta and blue, respectively. The
{001} family of planes are indicated in curly brackets and are color coded in green.
Figure 2.9. Experimentally observed crystal habit (a), line drawing showing the major crystal
faces (b), and packing arrangement (c) in α-glycine viewed along the a-axis. Hydrogen bonding
is indicated in blue. 35
x
y
z
(100)[100]
a) b)
(010)[010]
y
x
z c)
(001) [001]
y
x
z
d)
(110)[110]
y
x
z e)
(111)[111]
y
x
z f)
{001}
y
x
z
(001)
(002)(004)
b) (020)
(0-20)
(011)
(0-11)
(0-1-1)
(01-1)
(1-10)
(110)
(011)
(-1-10)
c) (010)
(0-10)
(011)
(0-11) (0-1-1)
(01-1)+b
-c
0.2 mm
a)
b c
25
In many industrial crystallizations, procedures for modifying the habit of crystals is
necessary to alter the relative rates of growth in order to control the habits of crystals produced.
The crystal habit influences physicochemical properties of the drug such as solubility,36
dissolution rate,37
bioavailability,38
tablet compressibility,27,39
and stability31
. For example,
ibuprofen generally crystallized industrially from hexanes in the form of elongated needlelike
crystals has been reported to be unfavorable for tableting due to poor powder flow to produce
soft tablets.39
Polyhedral crystals obtained from methanol and ethanol have been reported to
possess better flow properties.39
Modification of habit is often carried out by altering the
conditions used for crystallization such as the rate of cooling or evaporation,28,37
degree of
supersaturation40,41
or temperature,42,43
by choosing a particular solvent,44,45
or by deliberately
adding an impurity that modifies the habit during growth.46,47
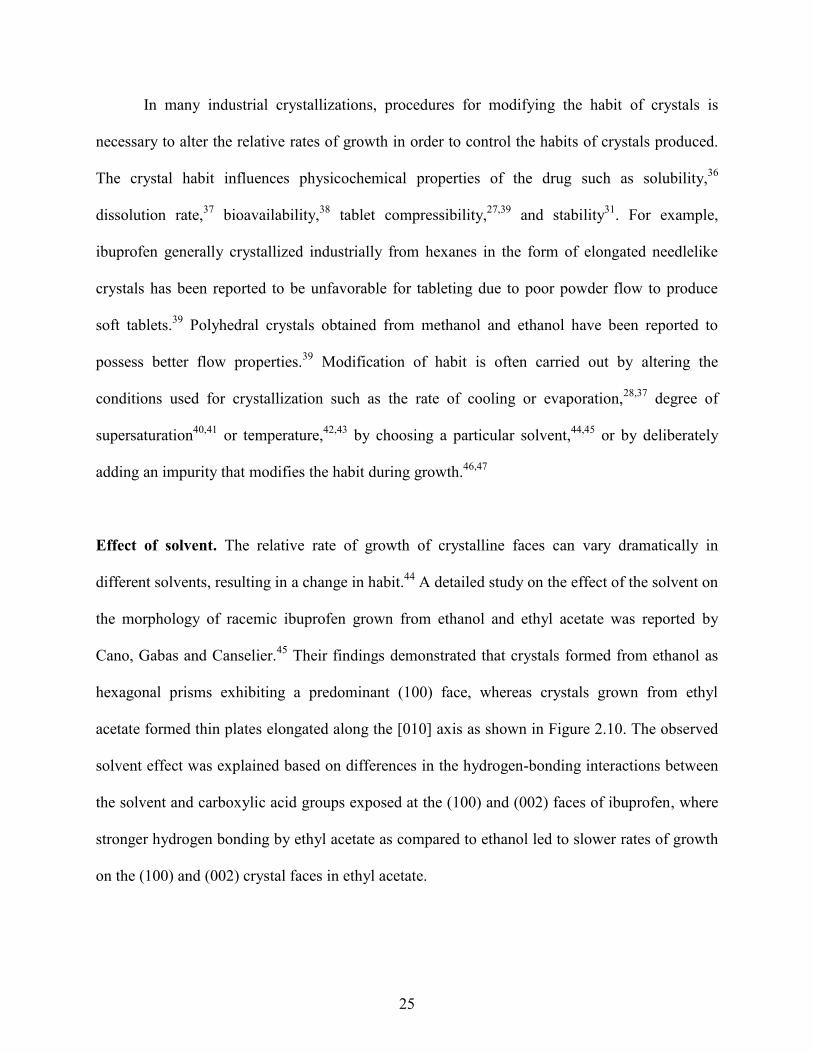
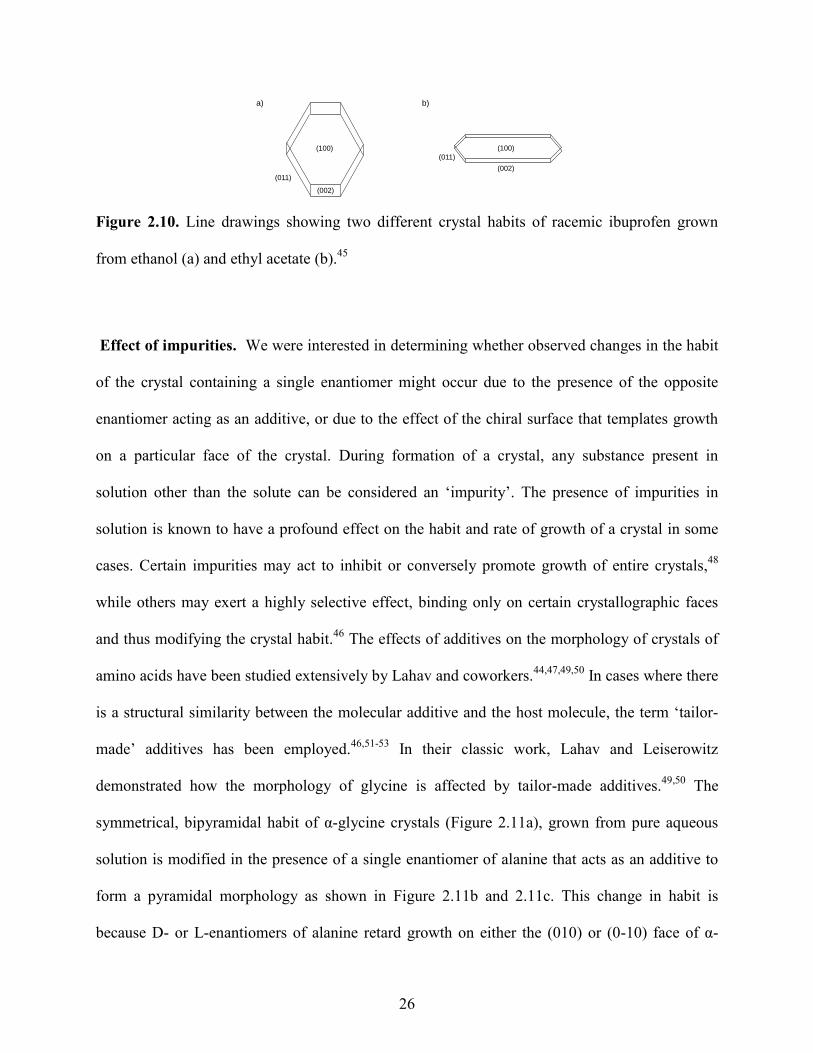
Effect of solvent. The relative rate of growth of crystalline faces can vary dramatically in
different solvents, resulting in a change in habit.44
A detailed study on the effect of the solvent on
the morphology of racemic ibuprofen grown from ethanol and ethyl acetate was reported by
Cano, Gabas and Canselier.45
Their findings demonstrated that crystals formed from ethanol as
hexagonal prisms exhibiting a predominant (100) face, whereas crystals grown from ethyl
acetate formed thin plates elongated along the [010] axis as shown in Figure 2.10. The observed
solvent effect was explained based on differences in the hydrogen-bonding interactions between
the solvent and carboxylic acid groups exposed at the (100) and (002) faces of ibuprofen, where
stronger hydrogen bonding by ethyl acetate as compared to ethanol led to slower rates of growth
on the (100) and (002) crystal faces in ethyl acetate.
26
Figure 2.10. Line drawings showing two different crystal habits of racemic ibuprofen grown
from ethanol (a) and ethyl acetate (b).45
Effect of impurities. We were interested in determining whether observed changes in the habit
of the crystal containing a single enantiomer might occur due to the presence of the opposite
enantiomer acting as an additive, or due to the effect of the chiral surface that templates growth
on a particular face of the crystal. During formation of a crystal, any substance present in
solution other than the solute can be considered an ‘impurity’. The presence of impurities in
solution is known to have a profound effect on the habit and rate of growth of a crystal in some
cases. Certain impurities may act to inhibit or conversely promote growth of entire crystals,48
while others may exert a highly selective effect, binding only on certain crystallographic faces
and thus modifying the crystal habit.46
The effects of additives on the morphology of crystals of
amino acids have been studied extensively by Lahav and coworkers.44,47,49,50
In cases where there
is a structural similarity between the molecular additive and the host molecule, the term ‘tailor-
made’ additives has been employed.46,51-53
In their classic work, Lahav and Leiserowitz
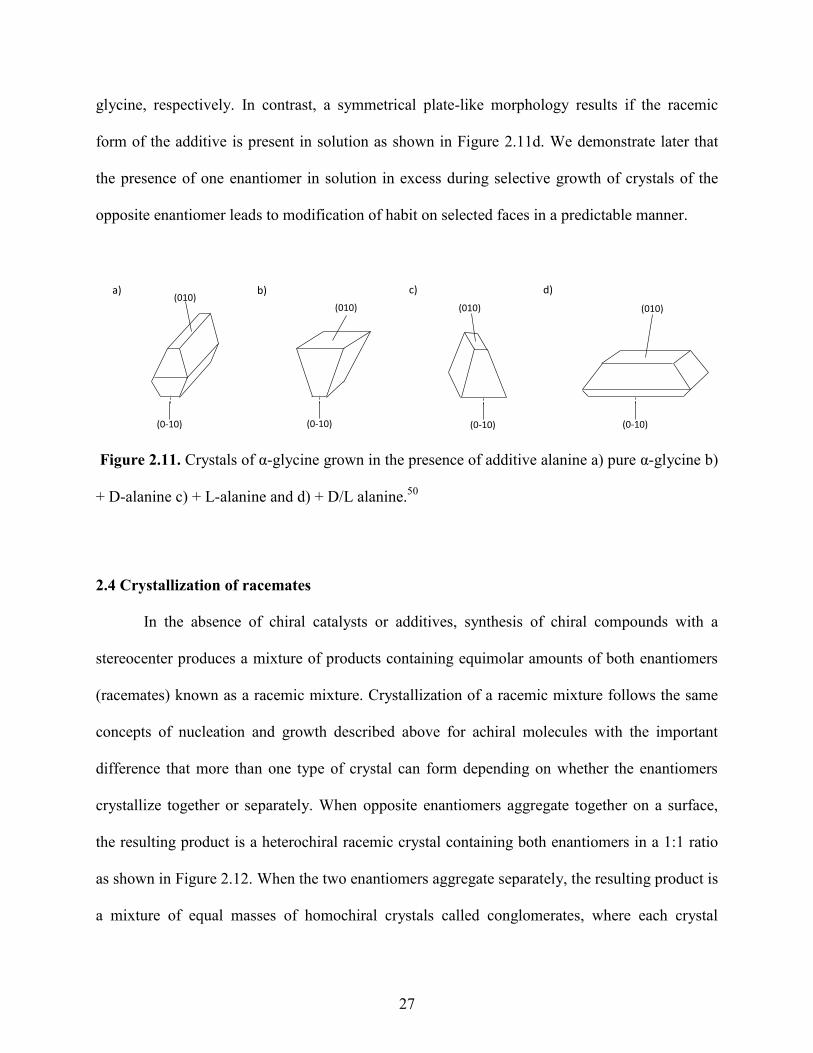
demonstrated how the morphology of glycine is affected by tailor-made additives.49,50
The
symmetrical, bipyramidal habit of α-glycine crystals (Figure 2.11a), grown from pure aqueous
solution is modified in the presence of a single enantiomer of alanine that acts as an additive to
form a pyramidal morphology as shown in Figure 2.11b and 2.11c. This change in habit is
because D- or L-enantiomers of alanine retard growth on either the (010) or (0-10) face of α-
(100)
(002)
(011)
a)
(100)
(002)
(011)
b)
27
glycine, respectively. In contrast, a symmetrical plate-like morphology results if the racemic
form of the additive is present in solution as shown in Figure 2.11d. We demonstrate later that
the presence of one enantiomer in solution in excess during selective growth of crystals of the
opposite enantiomer leads to modification of habit on selected faces in a predictable manner.
Figure 2.11. Crystals of α-glycine grown in the presence of additive alanine a) pure α-glycine b)
+ D-alanine c) + L-alanine and d) + D/L alanine.50
2.4 Crystallization of racemates
In the absence of chiral catalysts or additives, synthesis of chiral compounds with a
stereocenter produces a mixture of products containing equimolar amounts of both enantiomers
(racemates) known as a racemic mixture. Crystallization of a racemic mixture follows the same
concepts of nucleation and growth described above for achiral molecules with the important
difference that more than one type of crystal can form depending on whether the enantiomers
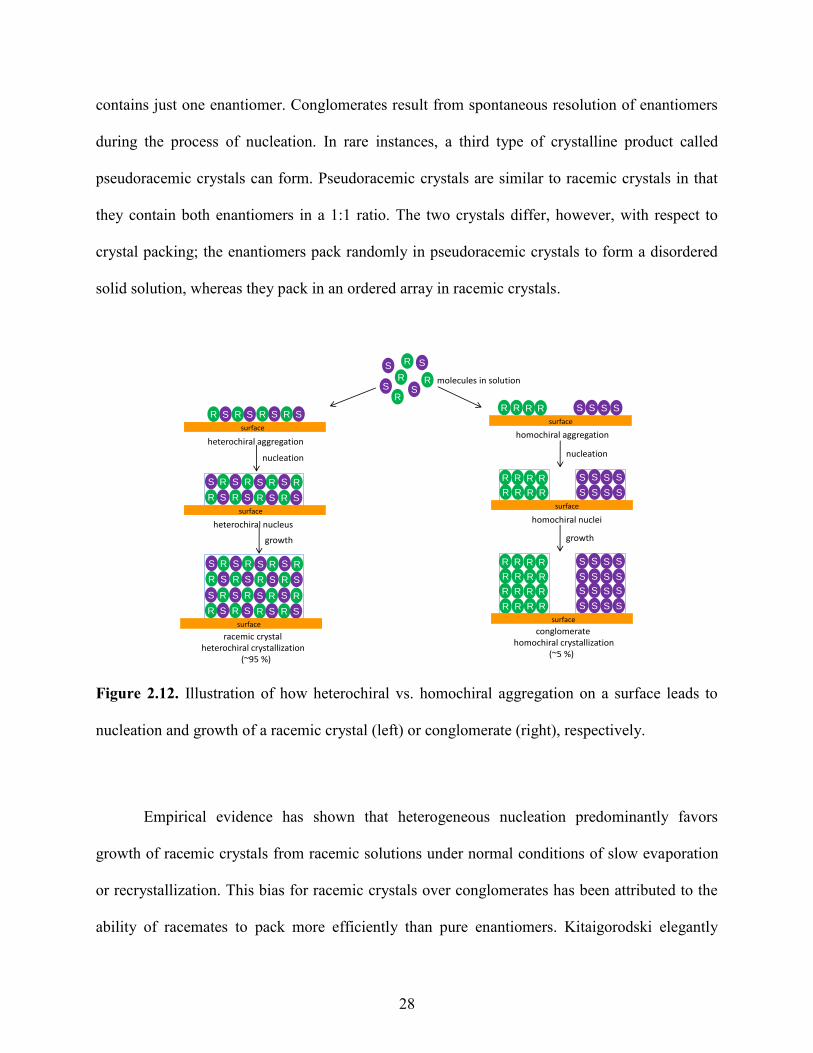
crystallize together or separately. When opposite enantiomers aggregate together on a surface,
the resulting product is a heterochiral racemic crystal containing both enantiomers in a 1:1 ratio
as shown in Figure 2.12. When the two enantiomers aggregate separately, the resulting product is
a mixture of equal masses of homochiral crystals called conglomerates, where each crystal
b)
(010)
(0-10)
c)
(010)
(0-10)
d)
(0-10)
(010)
a)(010)
(0-10)
28
contains just one enantiomer. Conglomerates result from spontaneous resolution of enantiomers
during the process of nucleation. In rare instances, a third type of crystalline product called
pseudoracemic crystals can form. Pseudoracemic crystals are similar to racemic crystals in that
they contain both enantiomers in a 1:1 ratio. The two crystals differ, however, with respect to
crystal packing; the enantiomers pack randomly in pseudoracemic crystals to form a disordered
solid solution, whereas they pack in an ordered array in racemic crystals.
Figure 2.12. Illustration of how heterochiral vs. homochiral aggregation on a surface leads to
nucleation and growth of a racemic crystal (left) or conglomerate (right), respectively.
Empirical evidence has shown that heterogeneous nucleation predominantly favors
growth of racemic crystals from racemic solutions under normal conditions of slow evaporation
or recrystallization. This bias for racemic crystals over conglomerates has been attributed to the
ability of racemates to pack more efficiently than pure enantiomers. Kitaigorodski elegantly
molecules in solutionR
R S
SSR
R
S
nucleation
SS RR SS RR
heterochiral aggregation
surface
racemic crystalheterochiral crystallization
(~95 %)
RRS S
SS RR
RRS S
SS RR
RRS S
SS RR
RRS S
SS RR
surface
RRS S
SS RR
RRS S
SS RR
heterochiral nucleus
growth
surface
nucleation
SSRR
surface
R R SS
homochiral aggregation
S S
SS
S S
SS
R R
RR
R
R
R
R
surface
homochiral nuclei
growth
conglomeratehomochiral crystallization
(~5 %)
S S
SS
S S
SS
R R
RR
R
R
R
R
surface
S S
SS
S S
SS
R R
RR
R
R
R
R
29
demonstrated that molecules that pack mutually oriented by a center or plane of symmetry (e.g.,
inversion or glide symmetry) maximize favorable intermolecular contacts that lead to greater
packing efficiency and thus higher density within the crystal. The consequences of these findings
are far reaching in the context of chiral molecules because racemates are able to pack utilizing a
center or plane of symmetry, while single enantiomers are forbidden by symmetry from doing so.
As a result, the reported incidence of conglomerates is low (~5 %) compared to racemic crystals.
According to Wallach’s rule, racemic crystals tend to be more stable and slightly more dense
than the corresponding homochiral crystals of pure enantiomer.54
This empirical observation
accounts for the greater incidence of racemic crystals over conglomerates. This tendency is not
thermodynamic in origin, however, but rather it reflects either kinetic factors dealing with
nucleation and growth of crystals from racemic solution, or packing arrangements in
crystallographic space groups that favor racemic crystals over those of the pure enantiomers.54
The formation of racemic crystals or conglomerates is a direct result of differences in the
structure and energetics between homochiral and heterochiral molecular packing, which is the
origin of chiral discrimination in the solid state. Therefore, influencing crystal nucleation to
favor formation of conglomerates over racemic crystals presents a significant challenge, while
controlling nucleation to selectively yield crystals of just one enantiomer presents an even
greater challenge. Both of those objectives are central to our work.
2.5 Methods to distinguish homochiral and heterochiral crystalline forms
We wanted to identify which crystal form of the racemic drug appears on achiral and
chiral surfaces, and quantify the enantiomeric composition(if any) of the pure enantiomer on
chiral surfaces that would help us to compare the crystal structures, thermal behavior and
30
energetics of racemic crystal, conglomerates and pure enantiomer and thus evaluate the role of
the surface in controlling the growth of one form over the other. Due to differences in the crystal
structure, melting points, stability, optical properties and sometimes habits55-58
of racemic
crystals, conglomerates and pure enantiomers, all three crystalline forms can be distinguished
and identified by X-ray diffraction, thermal, spectroscopic and optical methods.4,54,59-61
In the
context of this work, we focused on differential scanning calorimetry(DSC), powder X-ray
diffraction(PXRD), infrared spectroscopy and optical microscopy to distinguish between
homochiral and heterochiral crystalline forms and to identify definitively the structural
differences between the three crystalline forms. Each of these characterization techniques are
discussed in the following paragraphs.
Differential scanning calorimetry (DSC)
Differential scanning calorimetry has been used for determination of purity of crystalline
organic compounds 62-65
and is based on the colligative behavior where impurities depress the
melting point of a pure material leading to the broadening of the melting curve.65
Knowledge of
the binary phase diagram allows the purity of the major component to be determined by
measuring the depression in melting point of the pure component by the minor component, and is
also useful to determine the composition of the mixture at the eutectic temperature.60,65-68
For
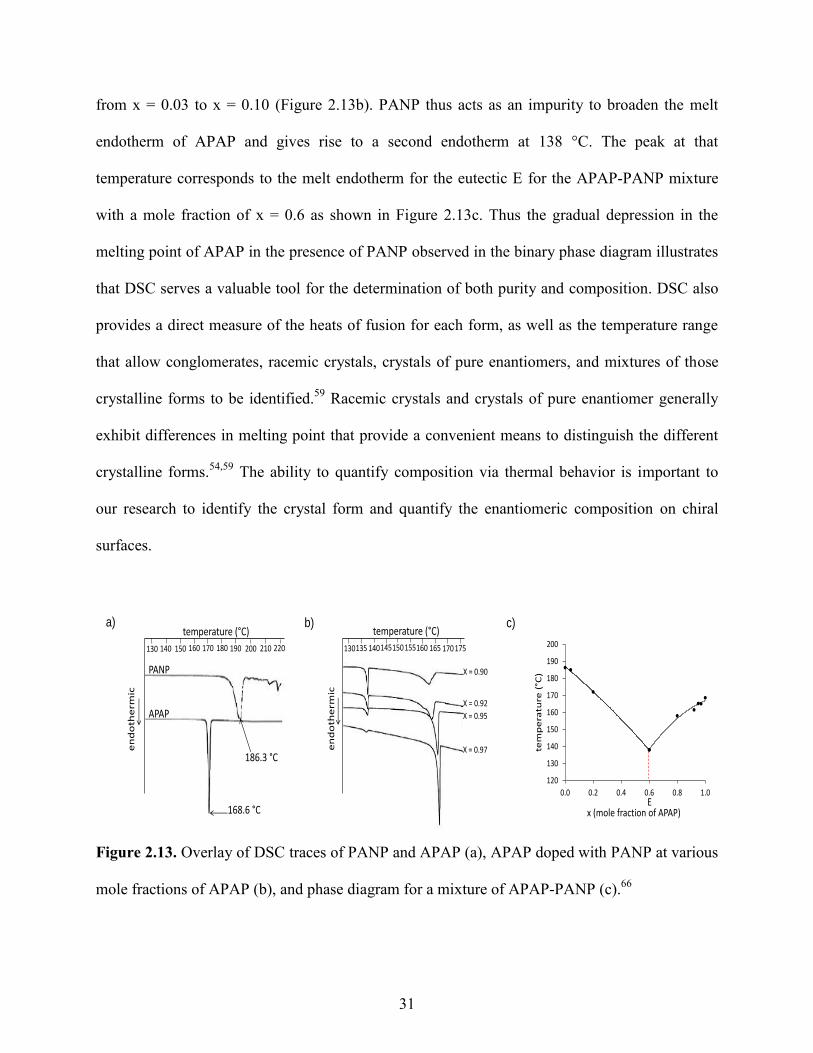
example, the thermal behavior of a series of mixtures of acetoaminophen (APAP) doped with p-
aminophenol (PANP) was studied by DSC to determine whether APAP exhibited a eutectic
system.66
Figure 2.13a shows the onset melting temperatures of pure APAP and pure PANP at
168.6 and 186.3 °C respectively. The results of that DSC analysis demonstrated that the melting
point of APAP decreases from 165.1 to 156.7 °C when the mole fraction (x) of PANP increases
31
from x = 0.03 to x = 0.10 (Figure 2.13b). PANP thus acts as an impurity to broaden the melt
endotherm of APAP and gives rise to a second endotherm at 138 °C. The peak at that
temperature corresponds to the melt endotherm for the eutectic E for the APAP-PANP mixture
with a mole fraction of x = 0.6 as shown in Figure 2.13c. Thus the gradual depression in the
melting point of APAP in the presence of PANP observed in the binary phase diagram illustrates
that DSC serves a valuable tool for the determination of both purity and composition. DSC also
provides a direct measure of the heats of fusion for each form, as well as the temperature range
that allow conglomerates, racemic crystals, crystals of pure enantiomers, and mixtures of those
crystalline forms to be identified.59
Racemic crystals and crystals of pure enantiomer generally
exhibit differences in melting point that provide a convenient means to distinguish the different
crystalline forms.54,59
The ability to quantify composition via thermal behavior is important to
our research to identify the crystal form and quantify the enantiomeric composition on chiral
surfaces.
Figure 2.13. Overlay of DSC traces of PANP and APAP (a), APAP doped with PANP at various
mole fractions of APAP (b), and phase diagram for a mixture of APAP-PANP (c).66
temperature (°C)
165130135 140145150155160 170
en
do
the
rmic
175
X = 0.90
X = 0.92
X = 0.95
X = 0.97
b) c)
120
130
140
150
160
170
180
190
200
0.0 0.2 0.4 0.6 0.8 1.0
tem
pe
ratu
re (
°C)
x (mole fraction of APAP)E
temperature (°C)
200130 140 150 160 170 180 190 210
en
do
the
rmic
220
a)
APAP
PANP
168.6 °C
186.3 °C
32
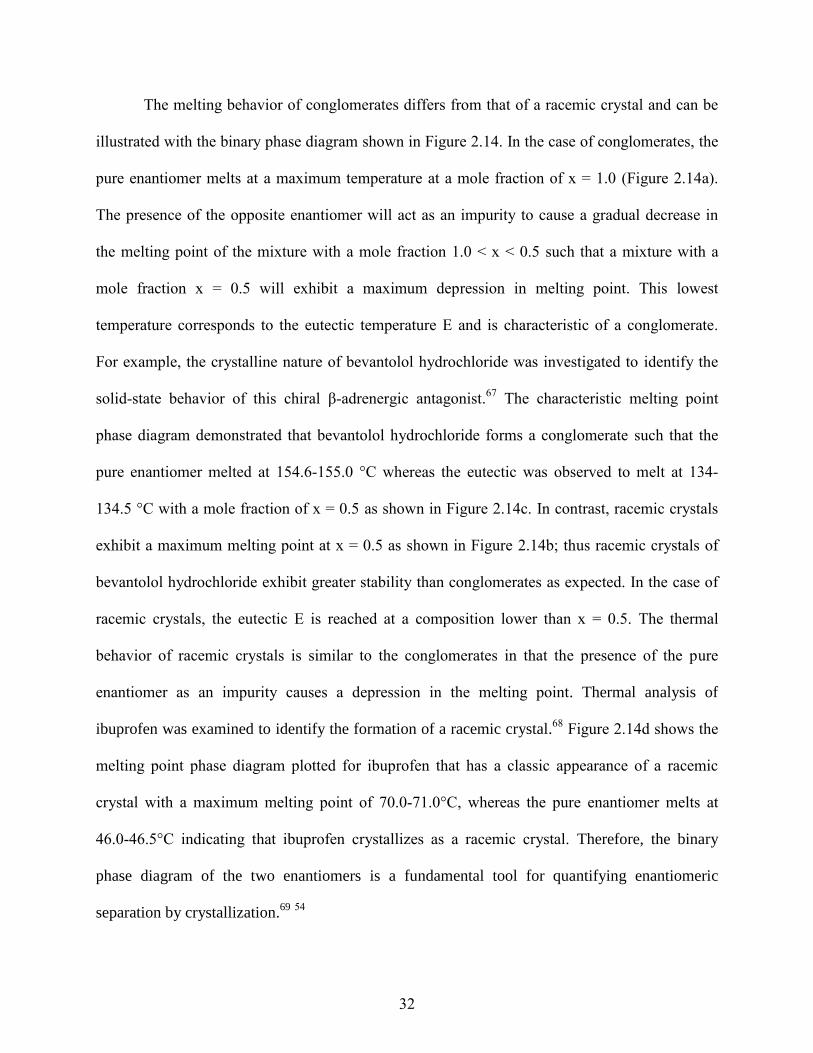
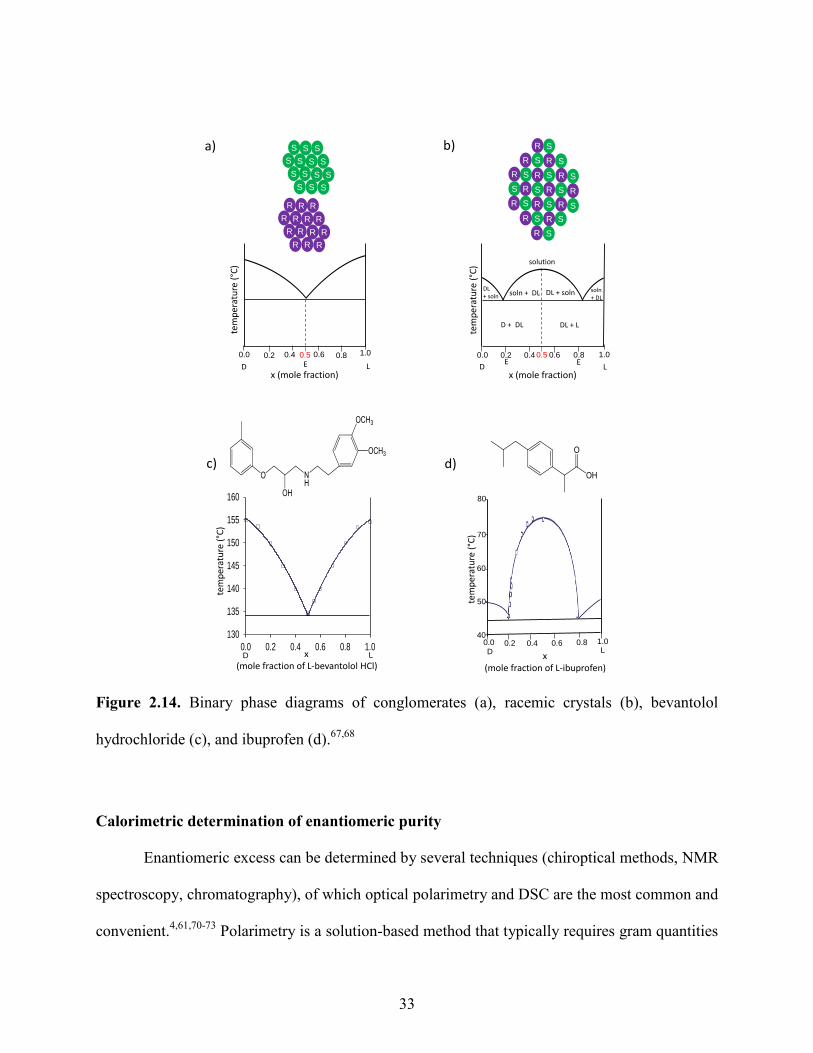
The melting behavior of conglomerates differs from that of a racemic crystal and can be
illustrated with the binary phase diagram shown in Figure 2.14. In the case of conglomerates, the
pure enantiomer melts at a maximum temperature at a mole fraction of x = 1.0 (Figure 2.14a).
The presence of the opposite enantiomer will act as an impurity to cause a gradual decrease in
the melting point of the mixture with a mole fraction 1.0 < x < 0.5 such that a mixture with a
mole fraction x = 0.5 will exhibit a maximum depression in melting point. This lowest
temperature corresponds to the eutectic temperature E and is characteristic of a conglomerate.
For example, the crystalline nature of bevantolol hydrochloride was investigated to identify the
solid-state behavior of this chiral β-adrenergic antagonist.67
The characteristic melting point
phase diagram demonstrated that bevantolol hydrochloride forms a conglomerate such that the
pure enantiomer melted at 154.6-155.0 °C whereas the eutectic was observed to melt at 134-
134.5 °C with a mole fraction of x = 0.5 as shown in Figure 2.14c. In contrast, racemic crystals
exhibit a maximum melting point at x = 0.5 as shown in Figure 2.14b; thus racemic crystals of
bevantolol hydrochloride exhibit greater stability than conglomerates as expected. In the case of
racemic crystals, the eutectic E is reached at a composition lower than x = 0.5. The thermal
behavior of racemic crystals is similar to the conglomerates in that the presence of the pure
enantiomer as an impurity causes a depression in the melting point. Thermal analysis of
ibuprofen was examined to identify the formation of a racemic crystal.68
Figure 2.14d shows the
melting point phase diagram plotted for ibuprofen that has a classic appearance of a racemic
crystal with a maximum melting point of 70.0-71.0°C, whereas the pure enantiomer melts at
46.0-46.5°C indicating that ibuprofen crystallizes as a racemic crystal. Therefore, the binary
phase diagram of the two enantiomers is a fundamental tool for quantifying enantiomeric
separation by crystallization.69
54
33
Figure 2.14. Binary phase diagrams of conglomerates (a), racemic crystals (b), bevantolol
hydrochloride (c), and ibuprofen (d).67,68
Calorimetric determination of enantiomeric purity
Enantiomeric excess can be determined by several techniques (chiroptical methods, NMR
spectroscopy, chromatography), of which optical polarimetry and DSC are the most common and
convenient.4,61,70-73
Polarimetry is a solution-based method that typically requires gram quantities
S SS
SS SS
SS SS
SS S
R RR
RR RR
RR RR
RR R
0.6
tem
per
atu
re (
°C)
1.00.20.0 0.4 0.8
D LE0.5
x (mole fraction)
a)
0.5
x (mole fraction)
R S
S RR S
SS RR R
RR SS
S
S R
RRR S S S
SS RR
R S
E
tem
per
atu
re (
°C)
1.00.20.0 0.4 0.6 0.8
solution
DL + LD + DL
soln + DL DL + soln soln+ DL
DL + soln
D LE
b)
d)
40
50
60
70
80
tem
per
atu
re (
°C)
x(mole fraction of L-ibuprofen)
0.6 1.00.20.0 0.4 0.8D L
c)
130
135
140
145
150
155
160
0.0 0.2 0.4 0.6 0.8 1.0x
(mole fraction of L-bevantolol HCl)
tem
per
atu
re (
°C)
D L
34
of samples for analysis. Considering that DSC requires only 1-5 mg of sample, DSC provides an
alternative method to characterize enantiomeric composition of solids for experiments that
produce milligram quantities of sample. Therefore, we rely on DSC as the principle tool to aid in
the determination of the enantiomeric purity. DSC also provides a quick and simple approach to
quantify the enantiomeric excess in solids and crystalline samples than other methods that
sometimes require the transformation of enantiomers into diastereomers.4,5,74
Analysis of the
enantiomeric composition of solids by DSC is done by constructing binary phase diagrams of
mixtures of two enantiomers. Mixing a smaller amount of one enantiomer (i.e., a minor
component that acts as an impurity) with a larger amount of the opposite enantiomer (i.e., the
major component) causes depression of the melting point of the larger component as described
previously. A plot of melting data from a series of binary mixtures of two enantiomers varying in
mole fraction from x = 1.0 to x = 0.0 gives a classic binary phase diagram with maximum
depression in melting point at a mole fraction of 0.5 corresponding to a racemic mixture as
shown in Figure 2.15a, thus allowing the composition of unknown mixtures to be determined.
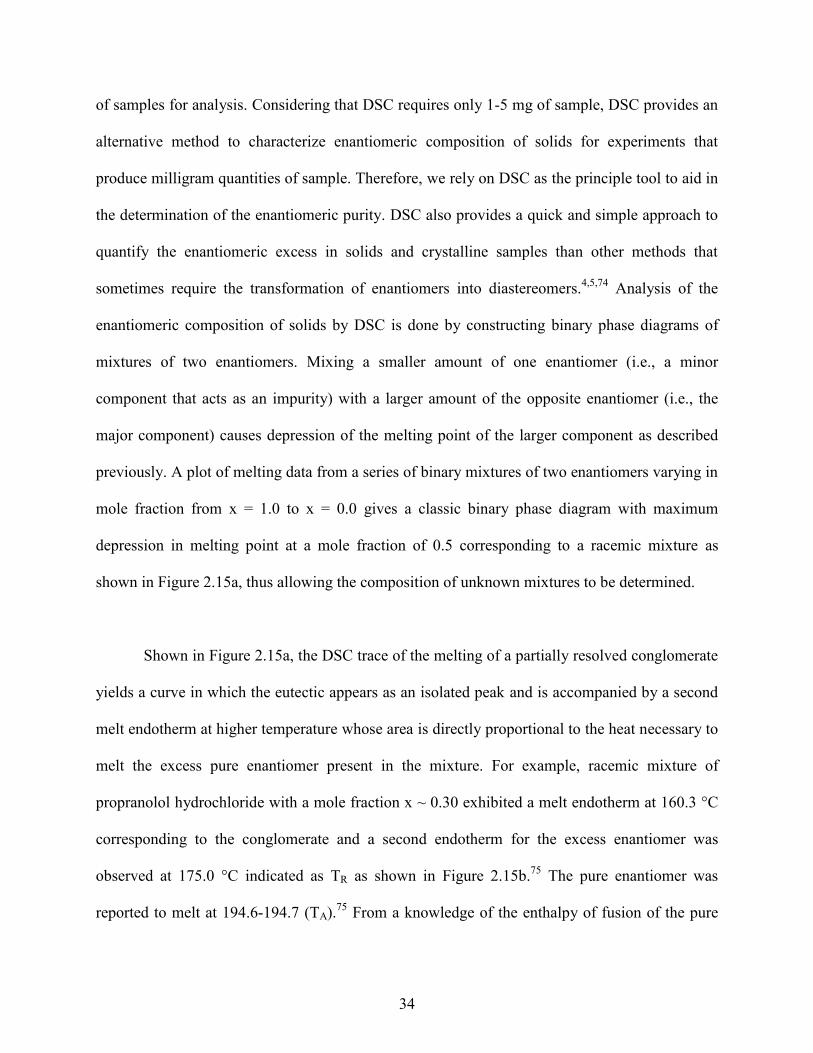
Shown in Figure 2.15a, the DSC trace of the melting of a partially resolved conglomerate
yields a curve in which the eutectic appears as an isolated peak and is accompanied by a second
melt endotherm at higher temperature whose area is directly proportional to the heat necessary to
melt the excess pure enantiomer present in the mixture. For example, racemic mixture of
propranolol hydrochloride with a mole fraction x ~ 0.30 exhibited a melt endotherm at 160.3 °C
corresponding to the conglomerate and a second endotherm for the excess enantiomer was
observed at 175.0 °C indicated as TR as shown in Figure 2.15b.75
The pure enantiomer was
reported to melt at 194.6-194.7 (TA).75
From a knowledge of the enthalpy of fusion of the pure
35
enantiomer (ΔHA), the melting point of the racemate (TR) and the pure enantiomer (TA), one can
easily calculate the mole fraction (x) of the eutectic present using the Schröder-Van Laar
equation (Eqn 2.1).15,59
Figure 2.15. Example of a DSC heating curve for a conglomerate with some enantiomeric
excess in which the area of peak at higher temperature (red) is directly proportional to the
quantity of excess enantiomer present in the sample (a), and DSC trace of racemic propranolol
hydrochloride with mole fraction x ~ 0.30 (b).75
Eqn 2.1
x = mole fraction
ΔHA = enthalpy of fusion of pure enantiomer (kJ/mol)
TA, TR = melting point of pure enantiomer and racemate (conglomerate),
respectively (°C)
TR
enantiomer in excesseutectic/conglomerate
temperature (°C)a) b)
temperature (°C)
end
oth
erm
ic
160 180
160.3 °C
175.0 °C(TR)
36
We have used this type of analysis to determine the binary phase diagram for the D and L
enantiomers of 3-phenyllactic acid and N-acetylleucine, and the results are discussed in chapter 3
and 6 respectively.
Powder X-ray diffraction (PXRD)
Powder X-ray diffraction (PXRD) is perhaps the most widely used technique for
identification of racemic crystals and conglomerates because the PXRD traces for two crystalline
forms that adopt different spacegroups will be different.4,54,59
PXRD patterns provide a
fingerprint of diffraction peaks that differs for each crystalline phase. Polycrystalline solids
diffract when the Bragg equation is satisfied according to equation 2.2.
Eqn 2.2
The different lattice, or d spacings between atoms within a given unit cell give rise to
diffraction peaks plotted as values of 2θ along the x-axis in a PXRD pattern. A match between
the 2θ values of the peaks in the PXRD patterns of the pure enantiomers and those in the racemic
mixture indicates the same crystal structure, suggesting that the racemic species is a
conglomerate. Differences in the relative intensity of the peaks may arise from differences in
crystallinity and/or face selective growth as discussed in chapter 4. In contrast, a racemic crystal
has a PXRD pattern that differs from that of the pure enantiomers. Thus racemic crystals and
conglomerates generate unique PXRD pattern because the dimensions of the unit cells and
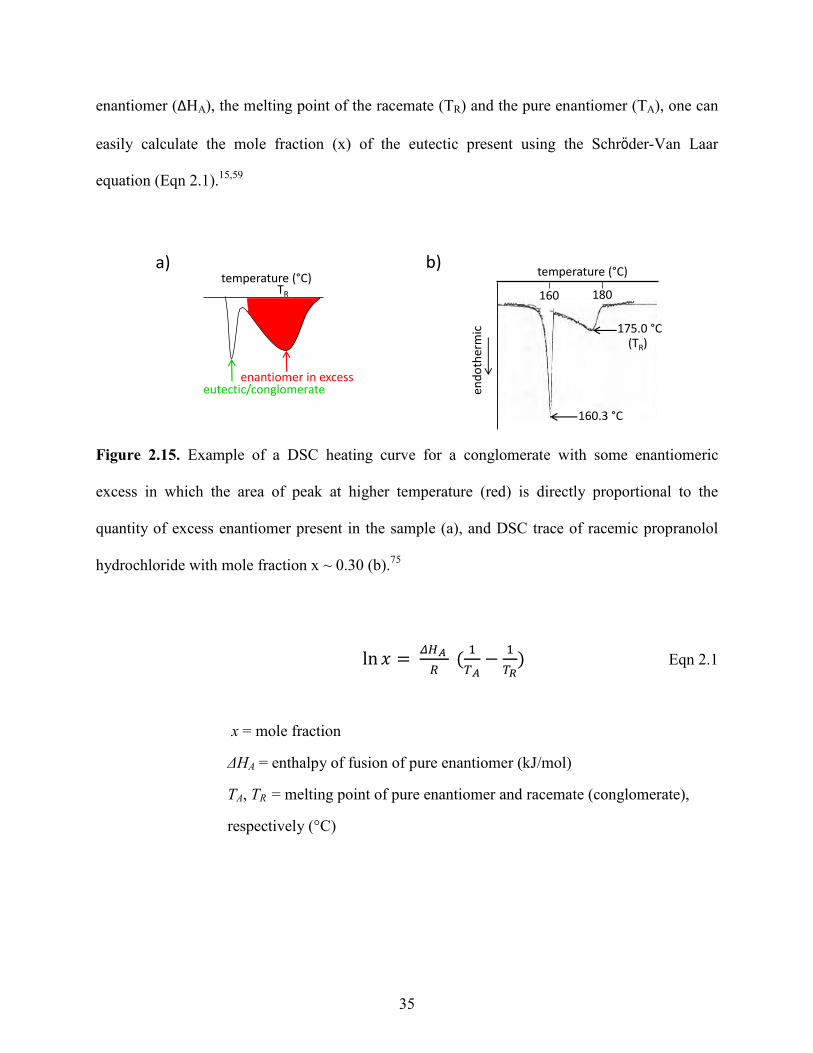
atomic spacings within the cells generally differ considerably. For example, the PXRD pattern of
methylephedrine shown in Figure 2.16a demonstrates a close match between the peak positions
37
of the racemic and pure enantiomer indicating that methylephedrine forms a conglomerate.60
Differences in the relative intensities of the peaks was ascribed to preferred orientation (i.e., non-
random alignment) of the crystals. Figure 2.16b illustrates the PXRD patterns observed for
racemic and enantiomerically pure ibuprofen. 76
Comparison of the PXRD traces for the pure
enantiomer and racemic crystal indicated differences in the peak position and relative intensities
for the homochiral and heterchiral crystal forms of ibuprofen indicating that ibuprofen is a
racemic crystal.
Figure 2.16. Powder X-ray diffraction patterns of methylephedrine (a) and ibuprofen (b).60,76
Infra-red spectroscopy (FT-IR)
Infrared spectroscopy is a useful analytical technique to ascertain whether racemic
crystals or conglomerates have formed in many cases. Solid-state IR spectra of racemic
compounds often differ significantly from those of the corresponding enantiomer particularly
with respect to vibrational bands corresponding to functional groups involved in hydrogen
a)
Rela
tive
inte
nsity
2Theta10 15 20 25 30 35
conglomerate
pure enantiomer
b)
2Theta
Rela
tive
inte
nsity
5 10 15 20 25 30 35
racemic crystal
pure enantiomer
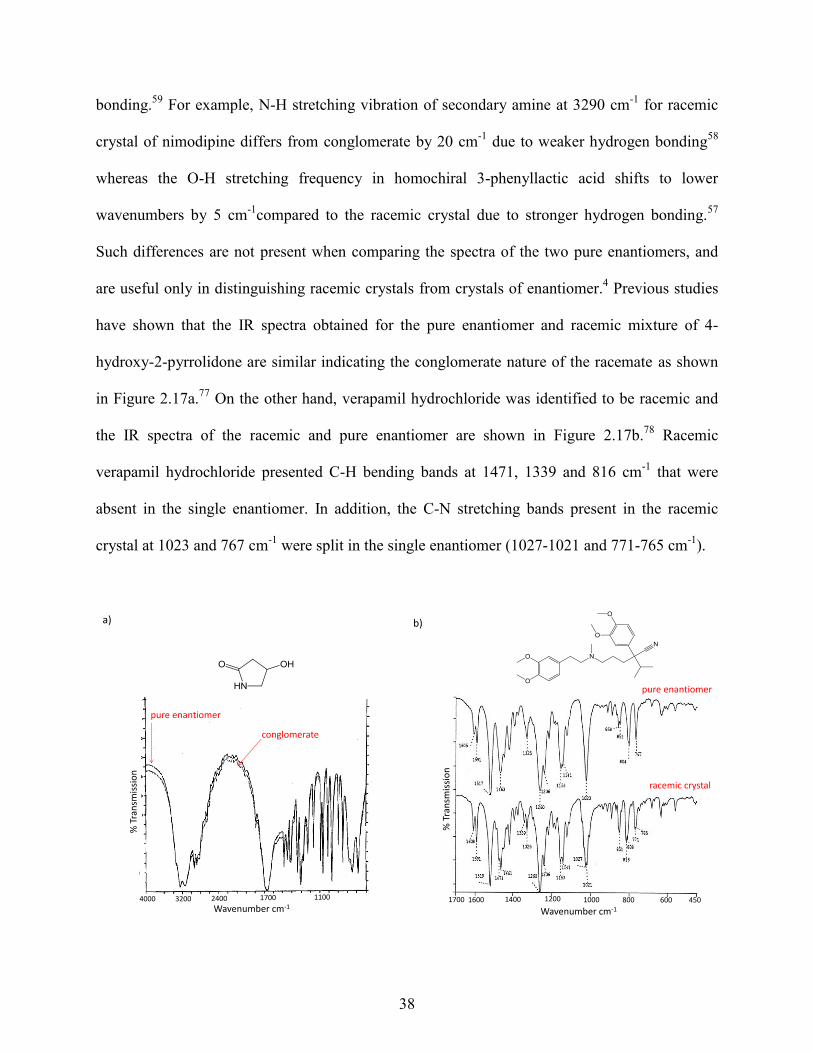
38
bonding.59
For example, N-H stretching vibration of secondary amine at 3290 cm-1
for racemic
crystal of nimodipine differs from conglomerate by 20 cm-1
due to weaker hydrogen bonding58
whereas the O-H stretching frequency in homochiral 3-phenyllactic acid shifts to lower
wavenumbers by 5 cm-1
compared to the racemic crystal due to stronger hydrogen bonding.57
Such differences are not present when comparing the spectra of the two pure enantiomers, and
are useful only in distinguishing racemic crystals from crystals of enantiomer.4 Previous studies
have shown that the IR spectra obtained for the pure enantiomer and racemic mixture of 4-
hydroxy-2-pyrrolidone are similar indicating the conglomerate nature of the racemate as shown
in Figure 2.17a.77
On the other hand, verapamil hydrochloride was identified to be racemic and
the IR spectra of the racemic and pure enantiomer are shown in Figure 2.17b.78
Racemic
verapamil hydrochloride presented C-H bending bands at 1471, 1339 and 816 cm-1
that were
absent in the single enantiomer. In addition, the C-N stretching bands present in the racemic
crystal at 1023 and 767 cm-1
were split in the single enantiomer (1027-1021 and 771-765 cm-1
).
4000
a)
Wavenumber cm-1
% T
ran
smis
sio
n
pure enantiomer
conglomerate
170024003200 1100
b)
Wavenumber cm-1
racemic crystal
pure enantiomer
% T
ran
smis
sio
n
1700 1600 1400 10001200 800 600 450
39
Figure 2.17. IR spectra of the pure enantiomer and conglomerate of 4-hydroxy-2-pyrrolidone (a)
and the pure enantiomer and racemic crystal verapamil hydrochloride (b).77,78
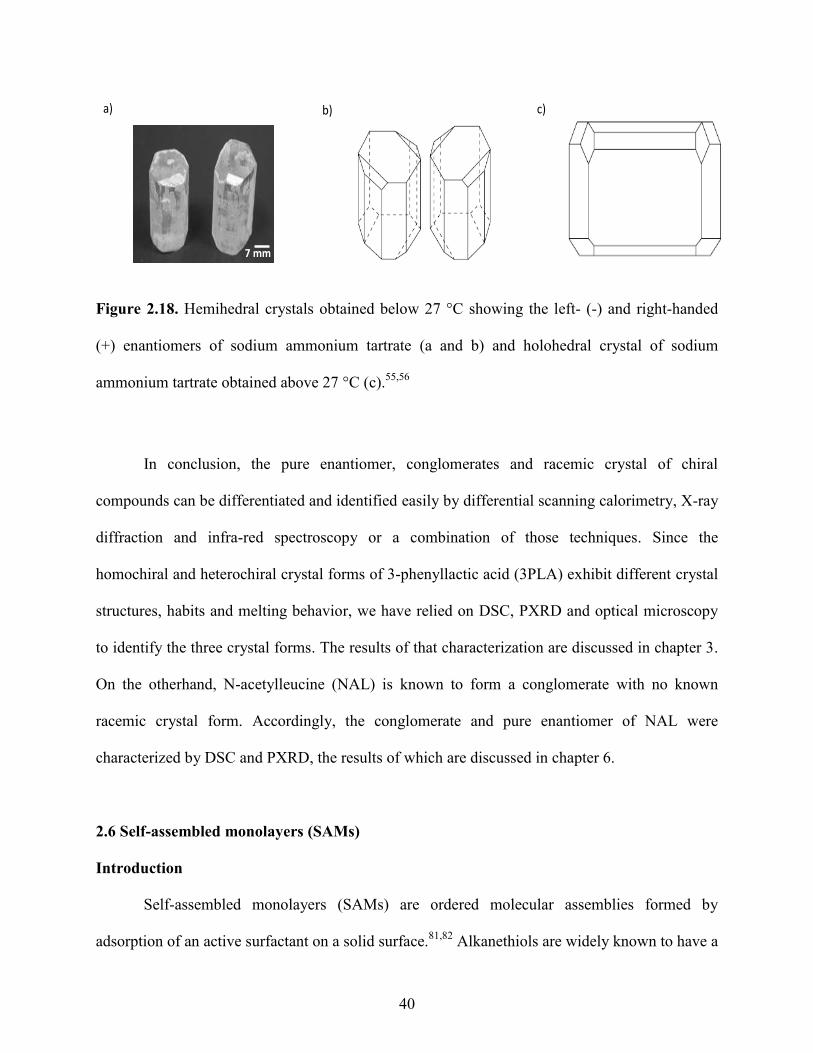
Optical microscopy
Pasteur demonstrated in his well-known work on conglomerates of sodium ammonium
tartrate that crystals of individual enantiomers may be distinguished in certain cases on the basis
of the outward morphology of their crystals.15,56,79,80
Identification of crystals of opposite
enantiomers of a compound is possible when the crystals are hemihedral and possess hemihedral
faces, where the crystals appear as nonsuperimposable mirror images of one another such that
crystals of the two enantiomers can be distinguished by eye. Homochiral crystals derived from
optically active samples maybe holohedral or hemihedral. Holohedral crystals have the highest
symmetry within their crystal class such that each crystalline facet is accompanied by a
corresponding parallel face on the opposite side. In hemihedral crystals, parallel faces are absent
and the crystals possess only one-half the number of faces required by the symmetry of the
crystal system.59
As such, it is possible to distinguish hemihedral crystals by visual inspection,
whereas it is not possible to distinguish holohedral crystals. At a temperature below 27 °C,
Pasteur obtained hemihedral crystals of sodium ammonium tartrate with well-defined
morphology that clearly revealed differences in left- and right-handedness as shown in Figure
2.18a and 2.18b.55,56
In contrast, holohedral crystals formed above 27 °C as shown in Figure
2.18c.55,56
40
Figure 2.18. Hemihedral crystals obtained below 27 °C showing the left- (-) and right-handed
(+) enantiomers of sodium ammonium tartrate (a and b) and holohedral crystal of sodium
ammonium tartrate obtained above 27 °C (c).55,56
In conclusion, the pure enantiomer, conglomerates and racemic crystal of chiral
compounds can be differentiated and identified easily by differential scanning calorimetry, X-ray
diffraction and infra-red spectroscopy or a combination of those techniques. Since the
homochiral and heterochiral crystal forms of 3-phenyllactic acid (3PLA) exhibit different crystal
structures, habits and melting behavior, we have relied on DSC, PXRD and optical microscopy
to identify the three crystal forms. The results of that characterization are discussed in chapter 3.
On the otherhand, N-acetylleucine (NAL) is known to form a conglomerate with no known
racemic crystal form. Accordingly, the conglomerate and pure enantiomer of NAL were
characterized by DSC and PXRD, the results of which are discussed in chapter 6.
2.6 Self-assembled monolayers (SAMs)
Introduction
Self-assembled monolayers (SAMs) are ordered molecular assemblies formed by
adsorption of an active surfactant on a solid surface.81,82
Alkanethiols are widely known to have a
c)
7 mm
a) b)

41
high affinity for gold, and the resulting SAMs of thiols on gold have been extensively studied.83-
86 SAMs have received considerable attention in the development of materials for molecular-
based electronic devices,87
biocompatibility,88
wetting,89
adhesion90
and corrosion prevention.91
In contrast to ultrathin films made by molecular beam epitaxy(MBE) and chemical vapor
deposition (CVD), SAMs are highly ordered and oriented86,92
and can incorporate a wide range
of functional groups both in the alkyl chains and at the chain termina.82
One of the fortuitous
properties of gold as the metal substrate is it is relatively inert and does not form stable oxide
surfaces;93
therefore gold surfaces can be cleaned simply by removing physically and chemically
adsorbed contaminants via chemical or physical methods. Porter demonstrated that long-chain
thiols form densely packed, crystalline films featuring alkyl chains tilted from the surface normal
by 20-30° in which the monolayer becomes increasingly disordered with lower packing density
and coverage as the length of the chains decreases.94
Chemisorption of alkanethiols on gold is a
kinetic phenomenon82,84,95
forming the Au(I) thiolate (RS-) species as shown below.
RS-H + Aun0
RS-Au
+Aun
0 + ½ H2
That reaction may be considered as an oxidative addition of S-H bond to gold surface,
followed by reductive elimination of the hydrogen.82
On the basis of the bond energies of RS-H,
H2 and RS-Au (87 kcal/mol, 104 kcal/mol and 40 kcal/mol, respectively) the enthalpy for
adsorption of alkanethiolates on gold -is about -5 kcal/mol (exothermic), and thus a spontaneous
process.82,96
The bonding of thiolate to gold is very strong with a homolytic bond strength of ~44
kcal/mol82,97
that results in pinning of the thiolate to a specific site on gold through a covalent,
slightly polar Au-S bond.97
Studies have shown that functional groups at the chain termina
exposed at the surface adopt specific orientations but have relatively little effect on the structure
42
of the film in the interior region of hydrocarbon chains.98
These properties provide a basis for
understanding the behavior and reactivity of organic surfaces derived from SAMs of thiols on
gold.
Characterization of SAMs
Contact angle goniometry
The technique of contact angle goniometry provides a convenient means to quantify the
wettability (i.e., surface energy) of surfaces by measuring the wetting angle, or contact angle,
when a 1 μL sessile drop of water (or other liquid) is placed in contact with the surface. The
angle formed between the solid/liquid interface and the liquid/vapor interface and the vertex
where the three interfaces meet is referred to as the contact angle. The angle is measured
between the plane tangent to the surface of the drop of water where it meets the surface and the
plane tangent to the surface of the solid. As shown in Figure 2.19a for a drop of liquid on a
surface, Young’s equation (Eqn 2.3) is used to describe the interactions between the forces of
cohesion and adhesion and to determine the surface free energy.99,100
Eqn 2.3
θ is the contact angle
γsl is the solid/liquid interfacial energy
γsv
is the solid surface free energy
γlv
is the liquid surface free energy
If the interaction between the surface and the water is strong, the measurement gives a
low contact angle that indicates a hydrophilic surface with a high degree of wettability and low
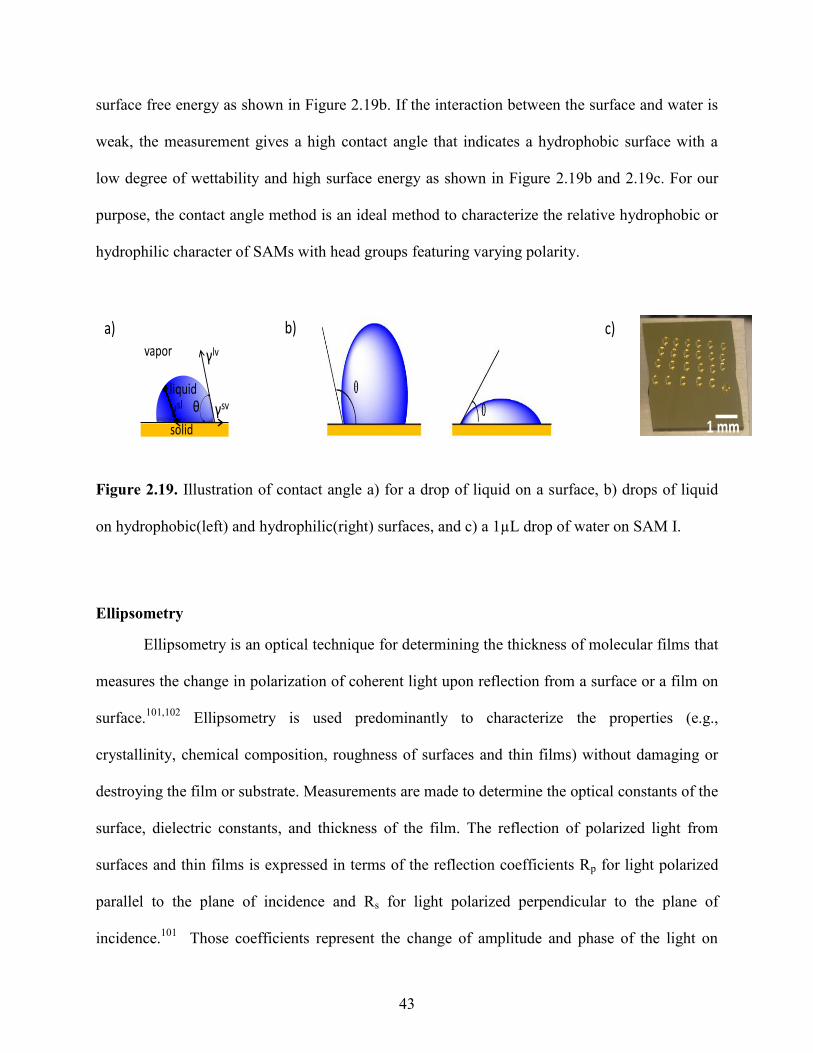
43
surface free energy as shown in Figure 2.19b. If the interaction between the surface and water is
weak, the measurement gives a high contact angle that indicates a hydrophobic surface with a
low degree of wettability and high surface energy as shown in Figure 2.19b and 2.19c. For our
purpose, the contact angle method is an ideal method to characterize the relative hydrophobic or
hydrophilic character of SAMs with head groups featuring varying polarity.
Figure 2.19. Illustration of contact angle a) for a drop of liquid on a surface, b) drops of liquid
on hydrophobic(left) and hydrophilic(right) surfaces, and c) a 1µL drop of water on SAM I.
Ellipsometry
Ellipsometry is an optical technique for determining the thickness of molecular films that
measures the change in polarization of coherent light upon reflection from a surface or a film on
surface.101,102
Ellipsometry is used predominantly to characterize the properties (e.g.,
crystallinity, chemical composition, roughness of surfaces and thin films) without damaging or
destroying the film or substrate. Measurements are made to determine the optical constants of the
surface, dielectric constants, and thickness of the film. The reflection of polarized light from
surfaces and thin films is expressed in terms of the reflection coefficients Rp for light polarized
parallel to the plane of incidence and Rs for light polarized perpendicular to the plane of
incidence.101
Those coefficients represent the change of amplitude and phase of the light on
1 mm
c)b)a)
γlv
γsv
vapor
solid
liquid
γsl θ
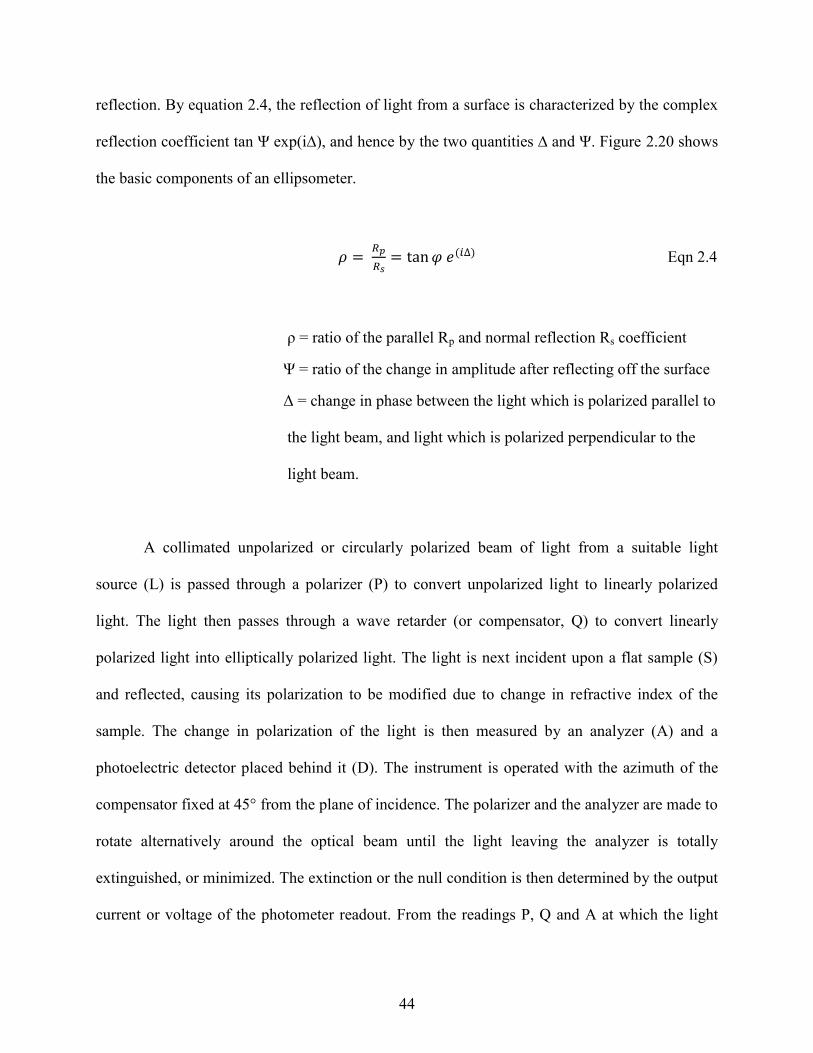
44
reflection. By equation 2.4, the reflection of light from a surface is characterized by the complex
reflection coefficient tan Ψ exp(i∆), and hence by the two quantities ∆ and Ψ. Figure 2.20 shows
the basic components of an ellipsometer.
Eqn 2.4
ρ = ratio of the parallel Rp and normal reflection Rs coefficient
Ψ = ratio of the change in amplitude after reflecting off the surface
Δ = change in phase between the light which is polarized parallel to
the light beam, and light which is polarized perpendicular to the
light beam.
A collimated unpolarized or circularly polarized beam of light from a suitable light
source (L) is passed through a polarizer (P) to convert unpolarized light to linearly polarized
light. The light then passes through a wave retarder (or compensator, Q) to convert linearly
polarized light into elliptically polarized light. The light is next incident upon a flat sample (S)
and reflected, causing its polarization to be modified due to change in refractive index of the
sample. The change in polarization of the light is then measured by an analyzer (A) and a
photoelectric detector placed behind it (D). The instrument is operated with the azimuth of the
compensator fixed at 45° from the plane of incidence. The polarizer and the analyzer are made to
rotate alternatively around the optical beam until the light leaving the analyzer is totally
extinguished, or minimized. The extinction or the null condition is then determined by the output
current or voltage of the photometer readout. From the readings P, Q and A at which the light
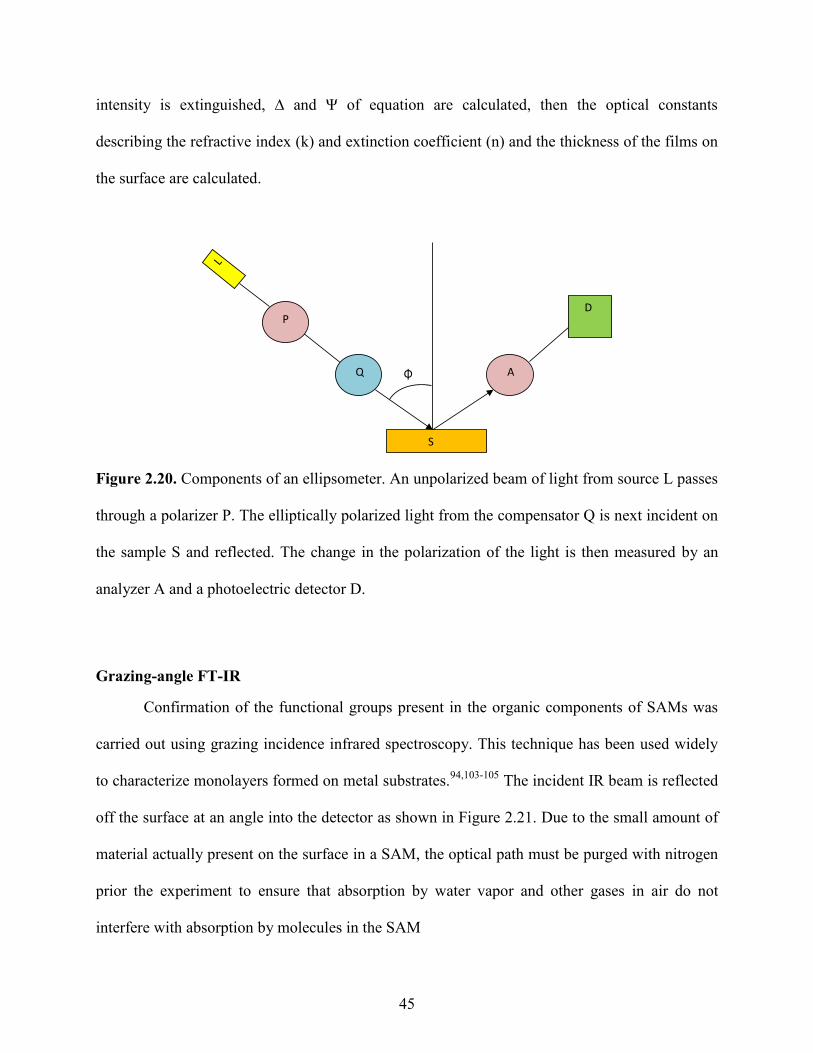
45
intensity is extinguished, ∆ and Ψ of equation are calculated, then the optical constants
describing the refractive index (k) and extinction coefficient (n) and the thickness of the films on
the surface are calculated.
Figure 2.20. Components of an ellipsometer. An unpolarized beam of light from source L passes
through a polarizer P. The elliptically polarized light from the compensator Q is next incident on
the sample S and reflected. The change in the polarization of the light is then measured by an
analyzer A and a photoelectric detector D.
Grazing-angle FT-IR
Confirmation of the functional groups present in the organic components of SAMs was
carried out using grazing incidence infrared spectroscopy. This technique has been used widely
to characterize monolayers formed on metal substrates.94,103-105
The incident IR beam is reflected
off the surface at an angle into the detector as shown in Figure 2.21. Due to the small amount of
material actually present on the surface in a SAM, the optical path must be purged with nitrogen
prior the experiment to ensure that absorption by water vapor and other gases in air do not
interfere with absorption by molecules in the SAM
S
A
D
Q
P
Φ
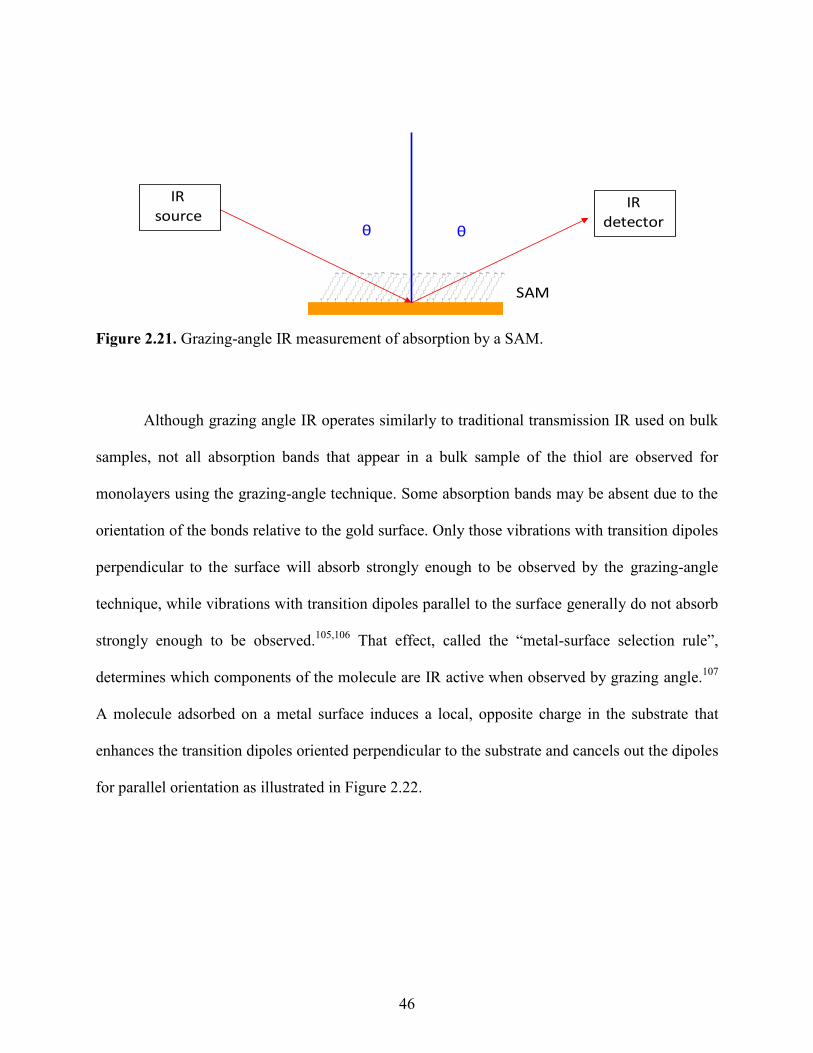
46
Figure 2.21. Grazing-angle IR measurement of absorption by a SAM.
Although grazing angle IR operates similarly to traditional transmission IR used on bulk
samples, not all absorption bands that appear in a bulk sample of the thiol are observed for
monolayers using the grazing-angle technique. Some absorption bands may be absent due to the
orientation of the bonds relative to the gold surface. Only those vibrations with transition dipoles
perpendicular to the surface will absorb strongly enough to be observed by the grazing-angle
technique, while vibrations with transition dipoles parallel to the surface generally do not absorb
strongly enough to be observed.105,106
That effect, called the “metal-surface selection rule”,
determines which components of the molecule are IR active when observed by grazing angle.107
A molecule adsorbed on a metal surface induces a local, opposite charge in the substrate that
enhances the transition dipoles oriented perpendicular to the substrate and cancels out the dipoles
for parallel orientation as illustrated in Figure 2.22.
SAM
IRdetector
θ θ
IRsource
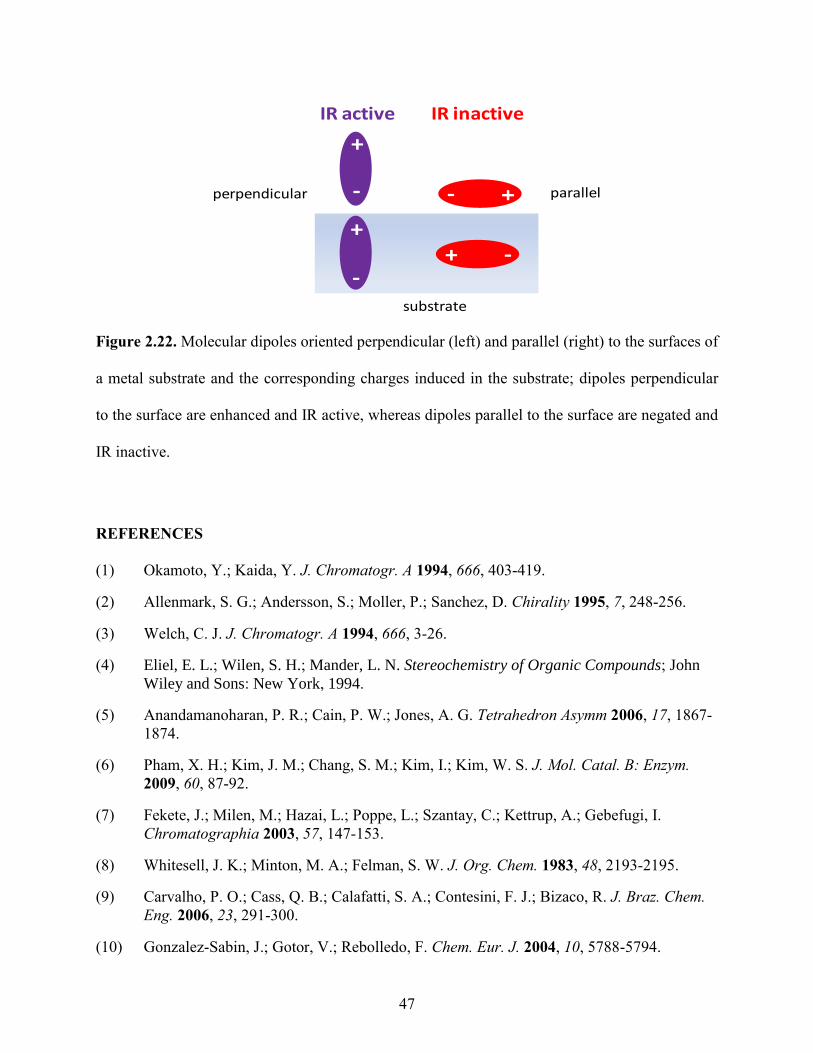
47
Figure 2.22. Molecular dipoles oriented perpendicular (left) and parallel (right) to the surfaces of
a metal substrate and the corresponding charges induced in the substrate; dipoles perpendicular
to the surface are enhanced and IR active, whereas dipoles parallel to the surface are negated and
IR inactive.
REFERENCES
(1) Okamoto, Y.; Kaida, Y. J. Chromatogr. A 1994, 666, 403-419.
(2) Allenmark, S. G.; Andersson, S.; Moller, P.; Sanchez, D. Chirality 1995, 7, 248-256.
(3) Welch, C. J. J. Chromatogr. A 1994, 666, 3-26.
(4) Eliel, E. L.; Wilen, S. H.; Mander, L. N. Stereochemistry of Organic Compounds; John
Wiley and Sons: New York, 1994.
(5) Anandamanoharan, P. R.; Cain, P. W.; Jones, A. G. Tetrahedron Asymm 2006, 17, 1867-
1874.
(6) Pham, X. H.; Kim, J. M.; Chang, S. M.; Kim, I.; Kim, W. S. J. Mol. Catal. B: Enzym.
2009, 60, 87-92.
(7) Fekete, J.; Milen, M.; Hazai, L.; Poppe, L.; Szantay, C.; Kettrup, A.; Gebefugi, I.
Chromatographia 2003, 57, 147-153.
(8) Whitesell, J. K.; Minton, M. A.; Felman, S. W. J. Org. Chem. 1983, 48, 2193-2195.
(9) Carvalho, P. O.; Cass, Q. B.; Calafatti, S. A.; Contesini, F. J.; Bizaco, R. J. Braz. Chem.
Eng. 2006, 23, 291-300.
(10) Gonzalez-Sabin, J.; Gotor, V.; Rebolledo, F. Chem. Eur. J. 2004, 10, 5788-5794.
+
-
-
+
+-
+ -
parallelperpendicular
substrate
IR active IR inactive
48
(11) Mullin, J. W. Crystallization; 4th ed.; Butterworth-Heinemann: Oxford, 2001.
(12) Weissbuch, I.; Addadi, L.; Lahav, M.; Leiserowitz, L. Science 1991, 253, 637-645.
(13) Weissbuch, I.; Lahav, M.; Leiserowitz, L. Cryst. Growth Des. 2003, 3, 125-150.
(14) Ostwald, W. J. Phys. Chem. 1897, 22, 289.
(15) Collet, A.; Brienne, M. J.; Jacques, J. Chem. Rev. 1980, 80, 215-230.
(16) Lee, A. Y.; Ulman, A.; Myerson, A. S. Langmuir 2002, 18, 5886-5898.
(17) Glusker, J. P.; Lewis, M.; Rossi, M. Crystal Structure Analysis for Chemists and
Biologists; VCH: New York, 1994.
(18) Srinivasan, K.; Sherwood, J. N. Cryst. Growth Des. 2005, 5, 1359-1370.
(19) Blagden, N.; Song, M.; Davey, R. J.; Seton, L.; Seaton, C. C. Cryst. Growth Des. 2005, 5,
467-471.
(20) Eddleston, M. D.; Jones, W. Cryst. Growth Des. 2010, 10, 365-370.
(21) Luo, T. J. M.; MacDonald, J. C.; Palmore, G. T. R. Chem. Mater. 2004, 16, 4916-4927.
(22) Rafilovich, M.; Bernstein, J.; Harris, R. K.; Apperley, D. C.; Karamertzanis, P. G.; Price,
S. L. Cryst. Growth Des. 2005, 5, 2197-2209.
(23) Weissbuch, I.; Shimon, L. J. W.; Landau, E. M.; Popovitz-Biro, R.; Berkovitch-Yellin,
Z.; Addadi, L.; Lahav, M.; Leiserowitz, L. Pure Appl. Chem. 1986, 58, 947-954.
(24) Stout, G. H.; Jensen, L. H. X-ray Structure Determination; 2nd ed.; John Wiley & Sons:
New York, 1989.
(25) Lee, J. H.; Akoh, C. C.; Himmelsbach, D. S.; Lee, K. T. J. Agric. Food Chem. 2008, 56,
4039-4046.
(26) Morris, K. R.; Nail, S. L.; Peck, G. E.; Byrn, S. R.; Griesser, U. J.; Stowell, J. G.; Hwang,
S. J.; Park, K. Pharm. Sci. Techn. Tod. 1998, 1, 235-245.
(27) Rasenack, N.; Muller, B. W. Int. J. Pharm. 2002, 244, 45-57.
(28) Tiwary, A. K. Drug Dev. Ind. Pharm. 2001, 27, 699-709.
(29) Shekunov, B. Y.; York, P. J. Cryst. Growth 2000, 211, 122-136.
(30) Meyer, M. C.; Straughn, A. B.; Jarivi, E. J.; Woods, G. C.; Pelsor, F. R.; Shah, V. P.
Pharm. Res. 1992, 9, 1612-1616.
(31) Huang, L.-F.; Tong, W.-Q. Adv. Drug Deliv. Rev. 2004, 56, 321-334.
(32) Destro, R.; Marsh, R. E. J. Phys. Chem. 1988, 92, 966-973.
(33) Miller, W. H. A Treatise on Crystallography; Deighton: Cambridge, 1839.
49
(34) Jenkins, R.; Snyder, R. L. Introduction to X-ray Powder Diffractometry; John Wiley &
Sons: New York, 1996; Vol. 138.
(35) Poornachary, S. K.; Chow, P. S.; Tan, R. B. H.; Davey, R. J. Cryst. Growth Des. 2007, 7,
254-261.
(36) Hammond, R. B.; Pencheva, K.; Roberts, K. J.; Auffret, T. J. Pharm. Sci. 2007, 96, 1967-
1973.
(37) Nokhodchi, A.; Bolourtchian, N.; Dinarvand, R. Int. J. Pharm. 2003, 250, 85-97.
(38) Blagden, N.; Matas, M. d.; Gavan, P. T.; York, P. Adv. Drug. Deliv. Rev. 2007, 59, 617-
630.
(39) Garekani, H. A.; Sadeghi, F.; Badiee, A.; Rajabi-Siahboomi, A. R. Drug. Dev. Ind.
Pharm. 2001, 27, 803-809.
(40) Finnie, S. D.; Ristic, R. I.; Sherwood, J. N.; Zikic, A. M. J. Cryst. Growth 1999, 207,
308-318.
(41) Garnier, S.; Petit, S.; Coquerel, G. J. Cryst. Growth 2002, 234, 207-219.
(42) Sangwal, K.; Zdyb, A.; Chocyk, D.; Brzoska, M. E. Cryst. Res. Technol. 1996, 31, 267-
273.
(43) Shekunov, B. Y.; Aulton, M. E.; Adama-Acquah, R. W.; Grant, D. J. Chem. Soc.,
Faraday Trans 1996, 92, 439-444.
(44) Lahav, M.; Leiserowitz, L. Chem. Eng. Sci. 2001, 56, 2245-2253.
(45) Cano, H.; Gabas, N.; Canselier, J. P. J. Cryst. Growth 2001, 224, 335-341.
(46) Berkovitch-Yellin, Z.; Mil, J.; Addadi, L.; Idelson, M.; Lahav, M.; Leiserowitz, L. J. Am.
Chem. Soc 1985, 107, 3111-3122.
(47) Weissbuch, I.; Popovitz-Biro, R.; Lahav, M.; Leiserowitz, L. Acta Crystallogr. 1995,
B51, 115-148.
(48) Lahav, M.; Leiserowitz, L. J. Phys. D 1993, 26, B22-B31.
(49) Addadi, L.; Berkovitch-Yellin, Z.; Weissbuch, I.; Lahav, M.; Leiserowitz, L.; Weinstein,
S. J. Am. Chem. Soc. 1982, 104, 2075-2077.
(50) Weissbuch, I.; Addadi, L.; Berkovitch-Yellin, Z.; Gati, E.; Weinstein, S.; Lahav, M.;
Leiserowitz, L. J. Am. Chem. Soc 1983, 105, 6615-6621.
(51) Addadi, L.; Gati, E.; Lahav, M. J. Am. Chem. Soc. 1981, 103, 1251-1252.
(52) Shimon, L. J. W.; Lahav, M.; Leiserowitz, L. J. Am. Chem. Soc. 1985, 107, 3375-3377.
(53) Addadi, L.; Mil, J.; Lahav, M. J. Am. Chem. Soc. 1981, 103, 1249-1251.
50
(54) Brock, C. P.; Schweizer, W. B.; Dunitz, J. D. J. Am. Chem. Soc. 1991, 113, 9811-9820.
(55) Manchester, K. Endeavour 2001, 25, 148-152.
(56) Tobe, Y. Mendeleev Communications 2003, 93-94.
(57) Navare, P. S.; MacDonald, J. C. Cryst. Growth Des. 2011, 11, 2422-2428.
(58) Grunenberg, A.; Keil, B.; Henck, J. O. Int. J. Pharm. 1995, 118, 11-21.
(59) Jacques, J., Collet, A.; Wilen, S. H. Enantiomers, Racemates, and Resolutions; John
Wiley and Sons: New York, 1981.
(60) Li, Z. J.; Zell, M. T.; Munson, E. J.; Grant, D. J. W. J. Pharm. Sci. 1999, 88, 337-346.
(61) Engle, A. R.; Lucas, E. A.; Purdie, N. J. Pharm. Sci. 1994, 83, 1310-1314.
(62) Mathkar, S.; Kumar, S.; Bystol, A.; Olawoore, K.; Min, D.; Markovich, R.; Rustum, A. J.
Pharm. Biomed. Anal. 2009, 49, 627-631.
(63) Lvova, M. S.; Garber, N. I.; Kozlov, E. I. J. Therm. Anal. 1988, 33, 1231-1234.
(64) Plato, C.; Glasgow, A. R. J. Anal. Chem. 1969, 41, 330-336.
(65) Giron, D.; Goldbronn, C. J. Therm. Anal. 1995, 44, 217-251.
(66) Faroongsarng, D.; Kadejinda, W.; Sunthornpit, A. AAPS PharmSciTech 2000, 1.
(67) Neau, S. H.; Shinwari, M. K.; Hellmuth, E. W. Int. J. Pharm. 1993, 99, 303-310.
(68) Srisanga, S.; Horst, J. H. Crystal Growth & Design 2010, 10, 1808-1812.
(69) Polenske, D.; Lorenz, H.; Seidel-Morgenstern, A. J. Pharm. Sci. 2010, 99, 1762-1773.
(70) Pitre, D.; Stradi, R. Arch. Pharm. (Weinheim) 1990, 323, 23-25.
(71) Pitre, D.; Nebuloni, M.; Ferri, V. Arch. Pharm. (Weinheim) 1991, 324, 325-328.
(72) Francotte, E. R. J. Chromatogr., A 2001, 906, 379-397.
(73) Hyun, M. H.; Kim, J. I.; Cho, Y. J.; Han, S. C. Chromatographia 2004, 60, 275-280.
(74) Fogassy, E.; Acs, M.; Faigl, F.; Simon, K.; Rohonczy, J.; Ecsery, Z. J. Chem. Soc.,
Perkin Trans. 2 1986, 1881-1886.
(75) Elsabee, M.; Prankerd, R. J. Int. J. Pharm. 1992, 86, 221-230.
(76) Stahly, G. P.; McKenzie, A. T.; Andres, M. C.; Russell, C. A.; Byrn, S. R.; Johnson, P. J.
Pharm. Sci. 1997, 86, 970-971.
(77) Silvestro, G. D.; Palmisano, G.; Pellegata, R. J. Pharm. Sci. 1993, 82, 758-760.
51
(78) Rustichelli, C.; Gamberini, M. C.; Ferioli, V.; Gamberini, G. Int. J. Pharm. 1999, 178,
111-120.
(79) Kauffman, G. B.; Myers, R. D. Journal of Chemical Education 1975, 52, 777-781.
(80) Pasteur, L. Ann. Chim. Phys. 1850, 28, 56.
(81) Bigelow, W. C.; Pickett, D. L.; Zisman, W. A. Journal of Colloid Science 1946, 1, 513-
538.
(82) Ulman, A. Chem. Rev. 1996, 96, 1533-1554.
(83) Bain, C. D.; Troughton, E. B.; Tao, Y. T.; Evall, J.; Whitesides, G. M.; Nuzzo, R. G.
Journal of the American Chemical Society 1989, 111, 321-335.
(84) Bain, C. D.; Whitesides, G. M. Journal of the American Chemical Society 1989, 111,
7164-7175.
(85) Laibinis, P. E.; Whitesides, G. M.; Allara, D. L.; Tao, Y. T.; Parikh, A. N.; Nuzzo, R. G.
Journal of the American Chemical Society 1991, 113, 7152-7167.
(86) Nuzzo, R. G.; Allara, D. L. Journal of the American Chemical Society 1983, 105, 4481-
4483.
(87) Carter, F. L. Molecular Electronic Devices; Marcel Dekker: New York, 1982.
(88) Mrksich, M.; Whitesides, G. M. Annual review of biophysics and biomolecular structure
1996, 25, 55-78.
(89) Whitesides, G. M.; Laibinis, P. E. Langmuir 1990, 6, 87-96.
(90) Lopez, G. P.; Albers, M. W.; Schreiber, S. L.; Carroll, R.; Peralta, E.; Whitesides, G. M.
Journal of the American Chemical Society 1993, 115, 5877-5878.
(91) Abbott, N. L.; Kumar, A.; Whitesides, G. M. Chemistry of Materials 1994, 6, 596-602.
(92) Nuzzo, R. G.; Fusco, F. A.; Allara, D. L. Journal of the American Chemical Society
1987, 109, 2358-2368.
(93) Somorjai, G. A. Chemistry in Two dimensions-Surfaces; Cornell University Press: Ithaca,
NY, 1982.
(94) Porter, M. D.; Bright, T. B.; Allara, D. L.; Chidsey, C. E. D. J. Am. Chem. Soc. 1987,
109, 3559-3568
(95) Biebuyck, H. A.; Bain, C. D.; Whitesides, G. M. Langmuir 1994, 10, 1825-1831.
(96) Schlenoff, J. B.; Li, M.; Ly, H. Journal of the American Chemical Society 1995, 117,
12528-12536.
(97) Sellers, H.; Ulman, A.; Shnidman, Y.; Eilers, J. E. Journal of the American Chemical
Society 1993, 115, 9389-9401.
52
(98) Nuzzo, R. G.; Dubois, L. H.; Allara, D. L. Journal of the American Chemical Society
1990, 112, 558-569.
(99) Murr, L. E. Interfacial Phenomenon in Metals and Alloys; Addison Wesley Publ.
Company: NY, 1974.
(100) Neumann, A. W.; Good, R. J. Surface and Colloid Science; Plenum Press: NY, 1979;
Vol. II
(101) Rudolph Instruments A Basic Program For The Analysis Of Ellipsometer Measurements
Instruction Manual NJ; Vol. 14-0104.
(102) Chechik, V.; Stirling, C. J. M. Gold-thiol self-assembled monolayers; John Wiley &
Sons: New York, 1999.
(103) Allara, D. L.; Nuzzo, R. G. Langmuir 1985, 1, 45-52.
(104) Allara, D. L.; Nuzzo, R. G. Langmuir 1985, 1, 52-66
(105) Troughton, E. B.; Brian, C. D.; Whitesides, G. M.; Nuzzo, R. G.; Allara, D. L.; Porter, M.
D. Langmuir 1988, 4, 365-385.
(106) Allara, D. L.; Swalen, J. D. J. Phys. Chem 1982, 86, 2700-2704.
(107) Sheppard, N.; Erkelens, J. Appl. Spectrosc 1984, 38, 471-485.
53
3: Investigation of Stability and Structure in Three
Homochiral and Heterochiral Crystalline Forms of
3-Phenyllactic Acid
3.1 INTRODUCTION
Investigation of the structures, thermal stabilities and spectroscopic properties of homochiral (1),
heterochiral racemic (2), and conglomerate (3) crystalline forms of 3-phenyllactic acid (3PLA)
are described in this chapter. We demonstrate that crystalline solids comprised of one enantiomer
or conglomerates of 3PLA are unusual in they exhibit slightly greater thermodynamic stability
than the racemic form (Hfus) = 4.0 kJ/mol) despite having considerably lower density (ρcalc
= 3.7 %) and less efficient molecular packing in accordance with Wallach’s Rule.[need a
reference here] Considering that molecules of 3PLA adopt essentially identical conformations in
the homochiral and heterochiral crystals, the higher stability in crystals of pure enantiomer (1
and 3) results from stronger hydrogen-bonding interactions via homochiral packing as compared
to heterochiral packing in racemic crystals (2). 3PLA therefore provides a unique test system to
investigate the influence of surface energetics and solvation in biasing homochiral vs.
heterochiral nucleation in order to develop methods for enantioseparation via crystallization on
chiral surfaces. Toward that goal, we demonstrate later in Chapter 4 that chiral surfaces derived
from cysteine act as chiral templates that promote enantioselective crystallization of one
54
enantiomer of 3PLA in high enantiomeric excess from racemic solutions, that the enantiomer in
excess can be controlled via the chirality of the surface, and that the mechanism for chiral
discrimination can be understood based on face-selective interaction between the surface and
functionality exposed on specific faces of homochiral crystals of 3PLA.
Separation of enantiomers often is difficult and adds significantly to the cost of developing and
marketing chiral drugs. Traditional techniques to separate racemic mixtures such as
chromatography with chiral stationary phases,1-5
or the use of chiral resolving reagents to form
diastereomeric salts that crystallize selectively,6 generally require high cost and labor-intensive
steps that limit their use for large-scale separation of enantiomers. As an alternative approach, we
are investigating resolution of racemic pharmaceuticals via crystallization on chiral surfaces as a
means to carry out enantioseparation. We and others7,8
have shown that thin films of amino acids
act as chiral templates that promote enantioselective nucleation of crystals on the surface during
crystallization from racemic solutions. For example, crystallizing racemic 3-phenyllactic acid
(3PLA) on self-assembled monolayers (SAMs) of L- or D-cysteine on gold substrates yields bulk
samples of homochiral crystals enriched with one enantiomer in excess by as much as 30%. In
contrast, crystallization of racemic 3PLA on achiral surfaces such as glass results in racemic
conglomerates with no enantiomeric enrichment.
Crystallization of racemic mixtures of enantiomers such as 3PLA can lead to three different
crystalline forms that differ in composition depending on which enantiomer and the relative
amounts of each enantiomer that are present in molecular aggregates that develop into stable
crystal nuclei.9-13
When opposite enantiomers aggregate together during formation of a crystal
55
nucleus, heterochiral racemic crystals are produced containing both enantiomers in a 1:1 ratio.
When opposite enantiomers aggregate separately, a mixture of equal masses of homochiral
crystals called conglomerates is produced where individual crystals contain just one enantiomer.
In rare instances, a third type of heterochiral crystalline product called pseudoracemic crystals
can form in which individual crystals consist of a solid solution of both enantiomers disordered
throughout the lattice. Substantial empirical evidence has shown that heterogeneous nucleation
predominantly favors growth of racemic crystals from racemic solutions such that only 5-10% of
racemates crystallize as conglomerates.14
This bias toward racemic crystals has been attributed to
the ability of racemates to pack more efficiently than pure enantiomers. Kitaigorodski elegantly
demonstrated that molecules that pack mutually oriented by a center or plane of symmetry (i.e.,
inversion or glide symmetry) maximize favorable intermolecular contacts that lead to more
efficient molecular packing.15
According to Wallach’s rule, racemic crystals generally are more
stable and slightly more dense than the corresponding homochiral crystals of pure enantiomer,
which accounts for the greater incidence of racemic crystals over conglomerates.16
Brock,
Schweizer and Dunitz showed that this tendency is not necessarily thermodynamic in origin,
however, but rather likely reflects both kinetic factors dealing with molecular interaction leading
to nucleation and growth of crystals from racemic solution, and a greater range of packing
arrangements in achiral crystallographic space groups that might statistically favor racemic
crystals over those of pure enantiomers.16
Thus formation of racemic crystals or conglomerates is
determined largely by differences in the surface energetics during crystal nucleation, and in the
structures and energetics between homochiral and heterochiral molecular packing, which is the
origin of chiral discrimination in the solid state.16
56
Two requirements must be met for enantioselective crystallization to occur: (1) racemates must
crystallize separately as homochiral crystals rather than racemic crystals, and (2) crystals of one
enantiomer must preferentially nucleate and grow while the opposite enantiomer remains in
solution. Accordingly, we are investigating crystallization of racemic 3PLA because it was
reported to form conglomerates from water,14,17
and is more apt to undergo enantioselective
nucleation on the surface of chiral substrates such as SAMs. 3PLA is a naturally occurring
antibiotic agent used commonly as a component in pharmaceuticals.18,19
Our initial studies to
choose a suitable solvent for carrying out crystallization revealed that 3PLA is soluble in a range
of polar and nonpolar solvents such as water, methanol, ethanol, ethyl acetate, acetone,
acetonitrile, hexanes and toluene, as well as mixtures of those solvents. Although racemic 3PLA
has been reported only to form conglomerates when crystallized from water,14,17
we obtained
racemic crystals when 3PLA was crystallized from 3:1 hexanes/ethyl acetate. Herein, we report
for the first time the crystal structure of racemic 3PLA (2), and show that homochiral or
heterochiral crystals of 3PLA can be selected on the basis of the solvent system used for
crystallization on glass substrates. In addition, we demonstrate that crystals of 1 and 3 (stable
forms) exhibit greater thermal stability (i.e., Hfus) = 4.0 kJ/mol) than crystals of 2 (metastable
form), indicating that the tendency of racemic 3PLA to favor homochiral packing and form
conglomerates is thermodynamic in origin in agreement with the findings of Brock et al.16
3.2 EXPERIMENTAL
All reagents and solvents were purchased from Aldrich or Pharmco and were used without
further purification.
57
Growth of crystals. Two solvent systems, deionized water and 3:1 hexanes/ethyl acetate, were
tested to examine how differences in polarity, solubility, rates of evaporation, and the presence
or absence of protic groups would affect the rate of crystallization, the size and morphology of
crystals, and the homogeneity of bulk samples of crystals. Crystals of 1 were prepared by placing
0.3 M solutions of L-3PLA in deionized water into glass vials and then allowing water to
evaporate slowly at RT from the uncapped vials. Clear, colorless needles of 1 appeared in
solution after 5 days and were isolated by filtration prior to complete evaporation of solvent.
Crystals of 2 were prepared by placing 0.09 M solutions of racemic 3PLA in 3:1 hexanes/ethyl
acetate and then allowing the solvent mixture to evaporate slowly at RT from the uncapped vials.
Clear, colorless blocks of 2 appeared in solution after 3 days and were isolated by filtration prior
to complete evaporation of solvent. Crystals of 3 were prepared by dissolving racemic 3PLA in
water at room temperature to form a concentrated aqueous solution (~0.3M) that was allowed to
evaporate slowly at room temperature in glass vials. Clear, colorless needles of 3 formed in
solution after 5-6 days. Crystals of 3 were isolated by filtration prior to complete evaporation of
solvent.
Characterization of crystals. Samples of crystals were characterized using a combination of
optical microscopy, differential scanning calorimetry (DSC), infrared spectroscopy (IR), powder
X-ray diffraction (PXRD), and single-crystal X-ray diffraction (SXRD). Bulk samples of all
crystals were isolated and examined under a low-power optical polarizing stereomicroscope to
determine the homogeneity of samples, to distinguish conglomerates (3) or crystals of pure
enantiomer (1) from racemic crystals (2) of 3PLA based on their distinctive habits (1 and 3 form
needles, 2 forms blocks), and to ensure that single crystals analyzed by SXRD were not twinned
58
or cracked. Infrared spectra were examined for single crystals of 1 and 2 and spectra were
obtained using a Bruker Optics FT-IR spectrometer equipped with a Vertex70 attenuated total
reflection (ATR) accessory by collecting 64 scans over a scan range from 4000 to 400 cm-1
at 4
cm-1
resolution. PXRD data were collected on a Bruker-AXS D8-Advance diffractometer using
Cu-Kα radiation with X-rays generated at 40kV and 40mA. Bulk samples of crystals were placed
in a 20 x 16 cm x 1 mm well in a glass sample holder and scanned at RT from 5-50° (2θ) in 0.05°
steps at a scan rate of 2°/min. Samples of all crystals were analyzed by DSC to identify the
crystal forms present (i.e., 1, 2, or 3). Analysis by DSC was carried out using a DSC 2920
Modulated DSC (TA Instruments). Bulk samples of crystals were ground using a mortar and
pestle, and 3-5 mg of ground sample were placed in sealed aluminum pans and then heated from
RT to 150°C at a rate of 10 °C /min. A second DSC trace was acquired for samples that featured
an endothermic peak corresponding to racemic crystals by heating a fresh sample from RT to
150 °C at a rate of 4 °C/min. A slower rate of heating was required in order to accurately follow
the transformation of metastable racemic crystals into the more stable conglomerates. Melting
ranges for each crystal form were determined by recording the temperatures at the onset and
termination of melting.13,14
A binary phase diagram for the D and L enantiomers of 3PLA was
constructed using DSC data from a series of binary mixtures of the two enantiomers prepared by
grinding the two components together to form homogenous mixtures differing in composition by
mole fractions of 0.1. DSC data was collected on the mixtures using 2 mg samples varying in
composition from 100% D-3PLA to 100% L-3PLA. Samples varying in smaller increments of
mole fraction 0.05 were used for mixtures containing 40-60% of a given enantiomer to more
accurately quantify the region of maximum melting point depression at mole fraction 0.5
corresponding to a racemic mixture (conglomerates).
59
Determination of crystal structures of 1 and 2. Single crystals of 1 and 2 covered in paratone
oil on 100μ MiTeGen polyimide micromounts were mounted on a Bruker-AXS Kappa APEX
CCD diffractometer equipped with an LT-II low temperature device. Diffraction data were
collected at 100(2) K using graphite monochromated Mo-Kα radiation (λ = 0.71073 Ǻ) using the
omega scan technique. Empirical absorption corrections were applied using the SADABS
program.20
The unit cells and space groups were determined using the SAINT+ program.20
The
structures were solved by direct methods and refined by full matrix least-squares using the
SHELXTL program.20
Refinement was based on F2 using all reflections. All non-hydrogen
atoms were refined anisotropically. Hydrogen atoms on carbon atoms were all located in the
difference maps and subsequently placed at idealized positions and given isotropic U values 1.2
times that of the carbon atom to which they were bonded. Hydrogen atoms bonded to oxygen
atoms were located and refined with isotropic thermal parameters. Mercury 1.4.2 software was
used to examine the molecular structures and crystal packing in the solved X-ray crystal
structures.21
The crystallographic data and refinement parameters are shown in Table 3.1.
Table 3.1. Crystallographic data and refinement parameters for 1 and 2.
Crystal form 1 2
Formula C9H10O3 C9H10O3
Formula weight (g/mol) 166.17 166.17
Crystal system orthorhombic monoclinic
Space group P212121 P21/c
Color and habit colorless needle colorless block
a (Ǻ) 5.8389(3) 8.4930(6)
60
b (Ǻ) 8.3195(5) 8.5972(7)
c (Ǻ) 16.9691(10) 11.5290(9)
α (°) 90 90
β (°) 90 109.203(2)
γ (°) 90 90
Volume (Ǻ3) 824.30(8) 794.96(11)
Z 4 4
λ (Ǻ) 0.71073 0.71073
ρcalc (g/cm3) 1.339 1.388
Temperature (K) 100(2) 100(2)
F(000) 352 352
θ range for data collection (°) 2.40-28.32 2.54-28.44
Absorption coefficient (mm-1
) 0.101 0.104
Reflections collected 15638 11288
Independent reflections 2044 [Rint = 0.0204] 1999 [Rint = 0.0225]
Reflections [I > 2σ (I)] 1960 1792
Data/restraints/parameters 2044/0/117 1999/0/117
Goodness of fit on F2 1.064 1.047
R (all data) R1 = 0.0304, wR2 = 0.0729 R1 = 0.0386, wR2 = 0.0915
3.3 RESULTS AND DISCUSSION
Analysis of homochiral and heterochiral crystalline forms. Crystallization of 3PLA produced
crystals with two distinct habits such that the homochiral and heterochiral crystal forms can be
distinguished easily on the basis of their crystalline habits (Figure 3.1), as well as by differences
in their melting behavior as discussed below. Crystals of 1 and 3 formed needles from water
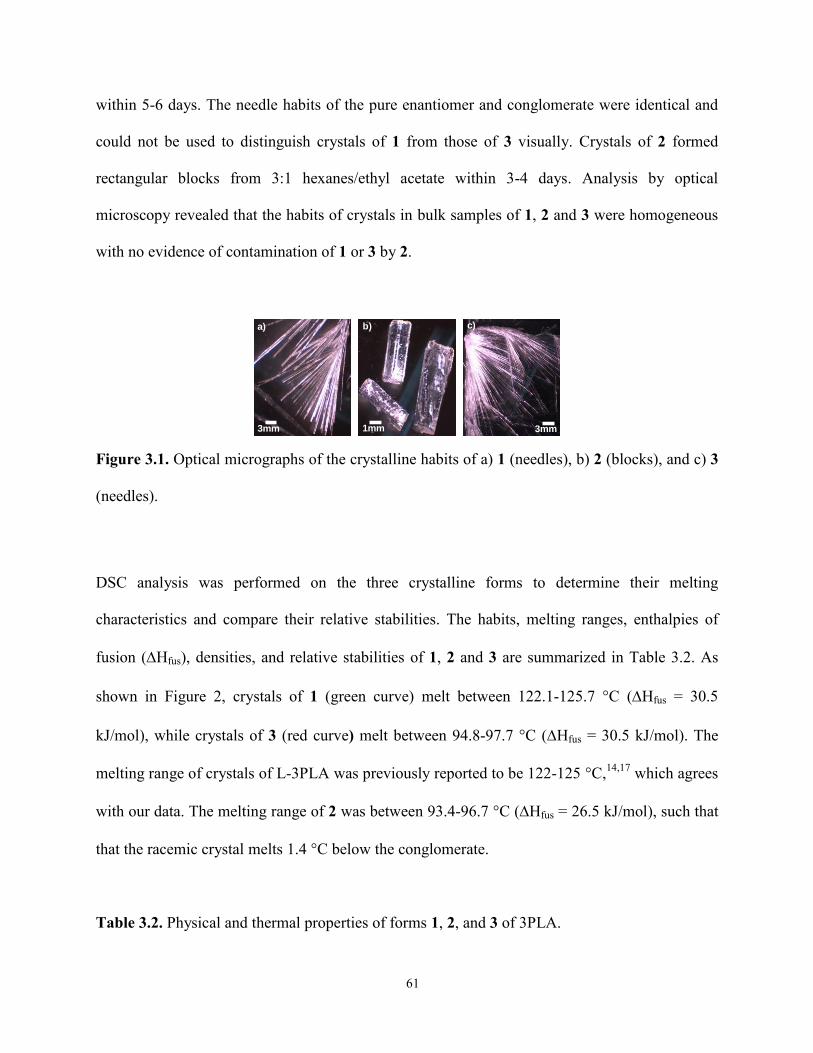
61
within 5-6 days. The needle habits of the pure enantiomer and conglomerate were identical and
could not be used to distinguish crystals of 1 from those of 3 visually. Crystals of 2 formed
rectangular blocks from 3:1 hexanes/ethyl acetate within 3-4 days. Analysis by optical
microscopy revealed that the habits of crystals in bulk samples of 1, 2 and 3 were homogeneous
with no evidence of contamination of 1 or 3 by 2.
b)
1mm
a)
3mm
c)
3mm
Figure 3.1. Optical micrographs of the crystalline habits of a) 1 (needles), b) 2 (blocks), and c) 3
(needles).
DSC analysis was performed on the three crystalline forms to determine their melting
characteristics and compare their relative stabilities. The habits, melting ranges, enthalpies of
fusion (Hfus), densities, and relative stabilities of 1, 2 and 3 are summarized in Table 3.2. As
shown in Figure 2, crystals of 1 (green curve) melt between 122.1-125.7 °C (Hfus = 30.5
kJ/mol), while crystals of 3 (red curve) melt between 94.8-97.7 °C (Hfus = 30.5 kJ/mol). The
melting range of crystals of L-3PLA was previously reported to be 122-125 °C,14,17
which agrees
with our data. The melting range of 2 was between 93.4-96.7 °C (Hfus = 26.5 kJ/mol), such that
that the racemic crystal melts 1.4 °C below the conglomerate.
Table 3.2. Physical and thermal properties of forms 1, 2, and 3 of 3PLA.
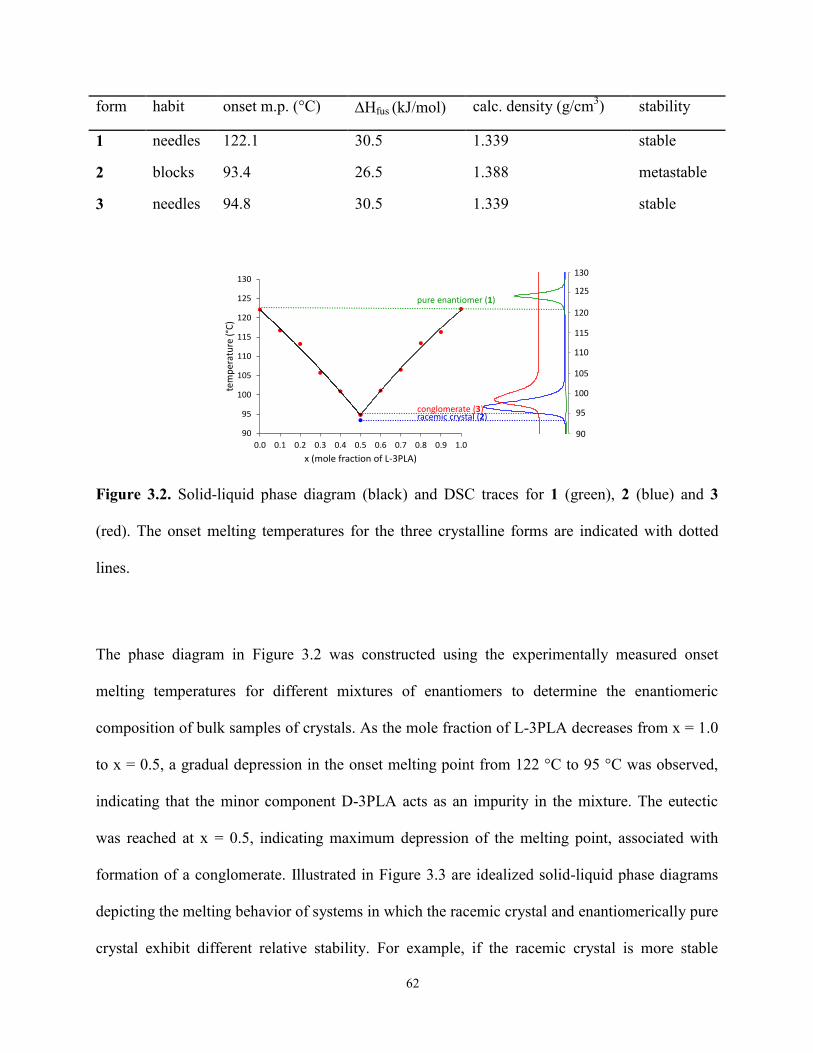
62
form habit onset m.p. (°C) Hfus (kJ/mol) calc. density (g/cm
3) stability
1 needles 122.1 30.5 1.339 stable
2 blocks 93.4 26.5 1.388 metastable
3 needles 94.8 30.5 1.339 stable
90
95
100
105
110
115
120
125
130
0.0 0.1 0.2 0.3 0.4 0.5 0.6 0.7 0.8 0.9 1.0
tem
per
atu
re (
°C)
x (mole fraction of L-3PLA)
racemic crystal (2)conglomerate (3)
pure enantiomer (1)
9095
100105
110115
120125
130
125
120
115
110
105
100
95
90
130
Figure 3.2. Solid-liquid phase diagram (black) and DSC traces for 1 (green), 2 (blue) and 3
(red). The onset melting temperatures for the three crystalline forms are indicated with dotted
lines.
The phase diagram in Figure 3.2 was constructed using the experimentally measured onset
melting temperatures for different mixtures of enantiomers to determine the enantiomeric
composition of bulk samples of crystals. As the mole fraction of L-3PLA decreases from x = 1.0
to x = 0.5, a gradual depression in the onset melting point from 122 °C to 95 °C was observed,
indicating that the minor component D-3PLA acts as an impurity in the mixture. The eutectic
was reached at x = 0.5, indicating maximum depression of the melting point, associated with
formation of a conglomerate. Illustrated in Figure 3.3 are idealized solid-liquid phase diagrams
depicting the melting behavior of systems in which the racemic crystal and enantiomerically pure
crystal exhibit different relative stability. For example, if the racemic crystal is more stable
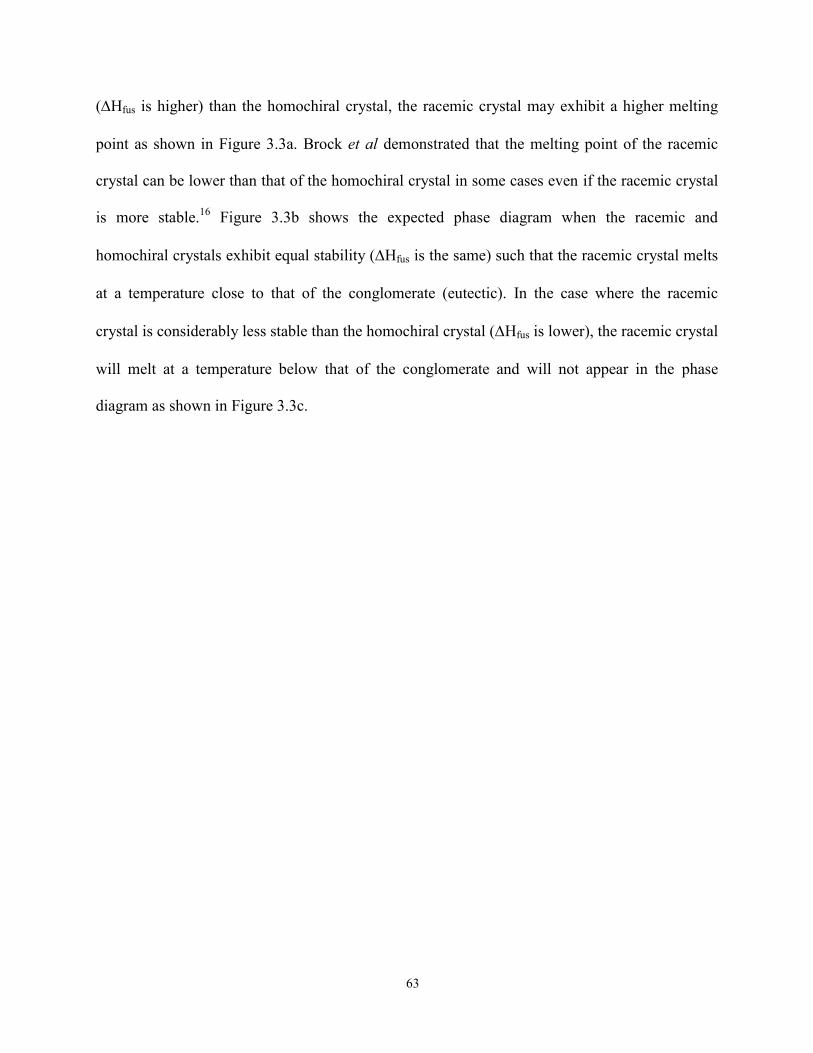
63
(Hfus is higher) than the homochiral crystal, the racemic crystal may exhibit a higher melting
point as shown in Figure 3.3a. Brock et al demonstrated that the melting point of the racemic
crystal can be lower than that of the homochiral crystal in some cases even if the racemic crystal
is more stable.16
Figure 3.3b shows the expected phase diagram when the racemic and
homochiral crystals exhibit equal stability (Hfus is the same) such that the racemic crystal melts
at a temperature close to that of the conglomerate (eutectic). In the case where the racemic
crystal is considerably less stable than the homochiral crystal (Hfus is lower), the racemic crystal
will melt at a temperature below that of the conglomerate and will not appear in the phase
diagram as shown in Figure 3.3c.
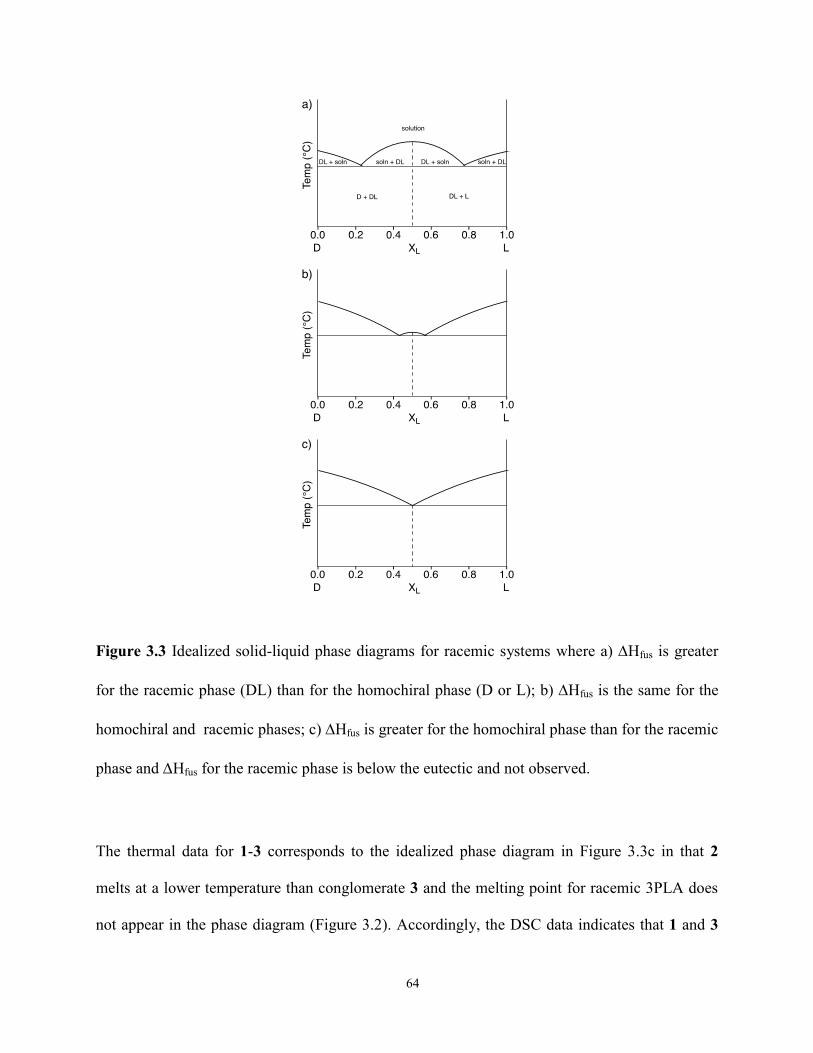
64
Figure 3.3 Idealized solid-liquid phase diagrams for racemic systems where a) Hfus is greater
for the racemic phase (DL) than for the homochiral phase (D or L); b) Hfus is the same for the
homochiral and racemic phases; c) Hfus is greater for the homochiral phase than for the racemic
phase and Hfus for the racemic phase is below the eutectic and not observed.
The thermal data for 1-3 corresponds to the idealized phase diagram in Figure 3.3c in that 2
melts at a lower temperature than conglomerate 3 and the melting point for racemic 3PLA does
not appear in the phase diagram (Figure 3.2). Accordingly, the DSC data indicates that 1 and 3
65
are thermodynamically stable crystal forms, while 2 may be a kinetically controlled form that is
less stable than 1 and 3.14
The observed melting behavior is somewhat unusual and opposes
Wallach’s rule that racemic crystals have lower lattice energy and greater stability due to more
efficient packing.16
Considering the relatively small difference in stability between 2 and 3 as
indicated by the difference in their enthalpies of fusion (Hfus) = 4.0 kJ/mol), it is not
surprising that variation in the conditions used for crystallization strongly influences nucleation
and subsequent growth of homochiral vs. racemic crystals. In this study, all crystallizations of 1-
3 were carried out by slow evaporation at RT in glass vials. Therefore, the enantiomeric
composition of crystals can be determined and controlled based solely on the properties of the
solvent system used for crystallization. In the case of racemic 3PLA, switching from a highly
polar, protic solvent such as water to a considerably less polar, aprotic solvent such as 3:1
hexanes/ethyl acetate allows the less stable racemic crystal to be selected. Crystallization of
racemic 3PLA from methanol, ethanol and acetone by slow evaporation at RT also resulted in
the formation of conglomerates, while slow evaporation from pure ethyl acetate at RT gave
racemic crystals, suggesting that polarity of the solvent plays a substantial role in determining
the formation of conglomerates over racemic crystals.
Molecular structures in 1 and 2. The crystal structure of L-3PLA solved at RT was reported
previously in 1975 by Guilhem.17
We determined the structure of L-3PLA to confirm that
crystals of 1 adopted the same space group and crystallographic parameters. We also wanted to
determine if the molecular structure, packing arrangement, positions of hydrogen atoms and
hydrogen-bonding interactions of L-3PLA could be solved more accurately. In addition, it was
necessary to determine the crystal structures of 1 and 2 at the same temperature (100 K) in order
66
to compare the densities and structures of both crystalline forms accurately. The structure of 2
was refined to a final R1 value of 3.9 %, which was lower than the value of 6.5% reported by
Guilhem.17
Although the two structures are in general agreement, the dimensions of the unit cell
and other crystallographic parameters from our study differ slightly from those of Guilhem.
Those differences likely are due to the data for the two structures having been collected at
different temperatures.
Views of the molecular structures of 3PLA in 1 and 2 are shown in Figure 3.4. 3PLA crystallizes
in the asymmetric orthorhombic space group P212121 in 1, and in the centrosymmetric space
group P21/c in 2. The unit cell contains four molecules in both structures that consist of pure L-
3PLA in 1 and two molecules each of D- and L-3PLA in 2. Although the molecular structure for
1 is that of the L enantiomer, the D enantiomer necessarily adopts a conformation that is the
mirror image due to crystallographic symmetry requirements. 3PLA adopts essentially identical
conformations in both structures. The carbon atoms in the phenyl ring and methylene group are
coplanar with the stereogenic carbon bearing the alcohol and carboxylic acid groups to one side
of the phenyl ring. The carboxylic acid and alcohol groups occupy similar positions with the
carboxylic acid projecting over the phenyl ring and the alcohol group projecting to one side as
shown. The close similarity in conformation between the two suggests that the observed structure
likely represents the lowest energy conformation of 3PLA in the solid state. More importantly,
this finding indicates that energetic consequences associated with changes in conformation likely
are not a significant factor influencing whether 3PLA forms conglomerates or racemic crystals
during crystallization.
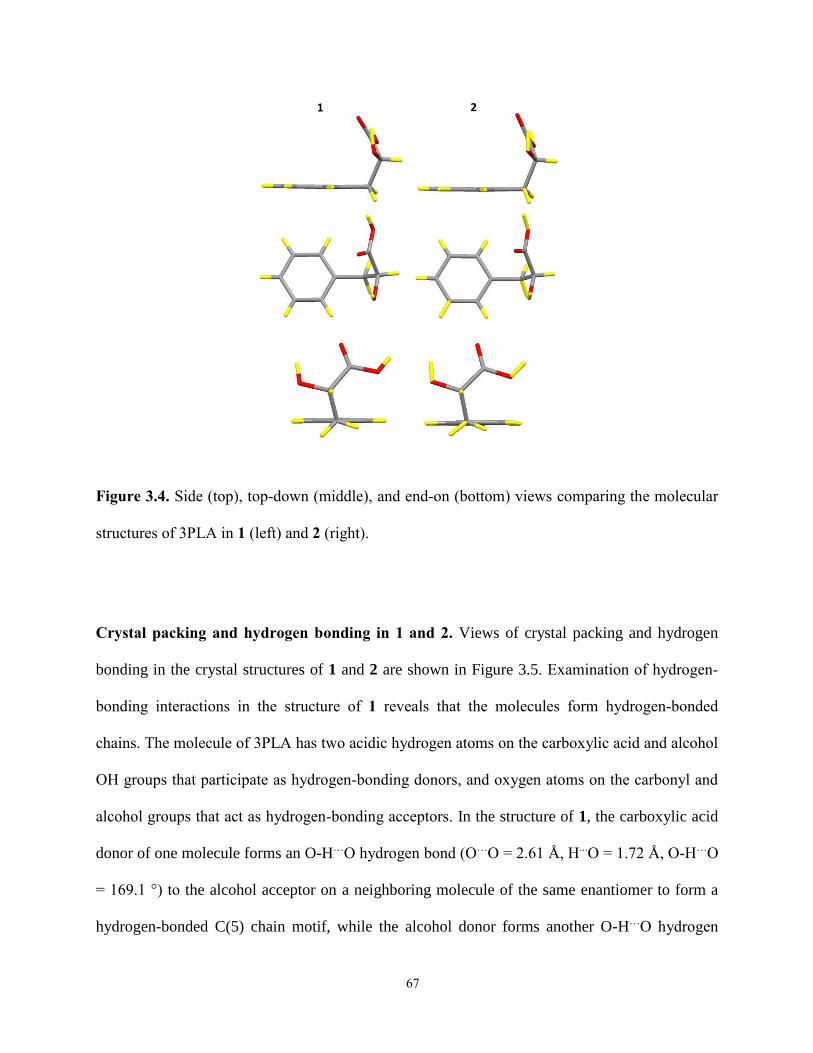
67
1 2
Figure 3.4. Side (top), top-down (middle), and end-on (bottom) views comparing the molecular
structures of 3PLA in 1 (left) and 2 (right).
Crystal packing and hydrogen bonding in 1 and 2. Views of crystal packing and hydrogen
bonding in the crystal structures of 1 and 2 are shown in Figure 3.5. Examination of hydrogen-
bonding interactions in the structure of 1 reveals that the molecules form hydrogen-bonded
chains. The molecule of 3PLA has two acidic hydrogen atoms on the carboxylic acid and alcohol
OH groups that participate as hydrogen-bonding donors, and oxygen atoms on the carbonyl and
alcohol groups that act as hydrogen-bonding acceptors. In the structure of 1, the carboxylic acid
donor of one molecule forms an O-H…
O hydrogen bond (O…
O = 2.61 Å, H...
O = 1.72 Å, O-H…
O
= 169.1 °) to the alcohol acceptor on a neighboring molecule of the same enantiomer to form a
hydrogen-bonded C(5) chain motif, while the alcohol donor forms another O-H…
O hydrogen
68
bond (O…
O = 2.74 Å, H...
O = 1.97 Å, O-H…
O = 145.3 °) to the carbonyl acceptor on a different
molecule that results in a second C(5) chain motif. In combination, the two chains form a
hydrogen-bonded ribbon of molecules whose pattern is described by the first-level graph set
N1=C(5)C(5).22,23
This one-dimensional linear network of hydrogen bonds connects molecules of
the same chirality into chains parallel to the a-axis as shown in Figures 3.5a and Figure 3.5c.
Molecules on opposite sides of the ribbon are related by a two-fold screw axis with a
corresponding translational repeat of 5.8 Å. This hydrogen-bonded connectivity differs
significantly from that in the structure of 2 as shown in Figures 3.5b and 3.5d. In the structure of
2, the alcohol donors and carbonyl acceptors on adjacent molecules form two symmetry
equivalent O-H…
O hydrogen bonds (O…
O = 2.81 Å, H...
O = 2.00 Å, O-H…
O = 153.6 °) that
generate an
R2
2(10) ring motif about a crystallographic inversion center between two molecules
with opposite chirality. The resulting dimers are linked to adjacent dimers by C(5) chains of O-
H…
O hydrogen bonds (O…
O = 2.64 Å, H...
O = 1.78 Å, O-H…
O = 164.6 °) involving carboxylic
acid donors and alcohol acceptors that generate sheets of molecules whose pattern is described
by the first level graph set N1 = C(5)[
R2
2(10)]. In contrast to the one-dimensional ribbons in 1,
where one molecule bonds to another molecule of the same enantiomer, molecules in 2 form
two-dimensional sheets in which molecules of opposite chirality are bonded to one another. The
structure of 1 also features a weak C-H…
O hydrogen bond (C…
O = 3.52 Å, H...
O = 2.68 Å, C-
H…
O = 147.4 °) involving a CH donor at the para position on the phenyl ring and a carbonyl
acceptor in an adjacent ribbon related by two-fold symmetry. C-H…
O hydrogen bonds are absent
in the structure of 2. Although such C-H…
O interactions generally are far weaker than O-H…
O
interactions, the C-H…
O interaction likely provides a small amount of additional stabilization in
the lattice in 1, which is the more stable crystalline form as indicated in the thermal analysis
69
described previously. The presence of additional stabilization in 1 that is absent in 2 is consistent
with the higher thermal stability of 1 (m.p. = 122.1-125.7 °C, Hfus = 30.5 kJ/mol) relative to 2
(m.p. = 93.4-96.7 °C, Hfus = 26.5 kJ/mol), and might help explain why 3PLA is prone to
forming conglomerates.
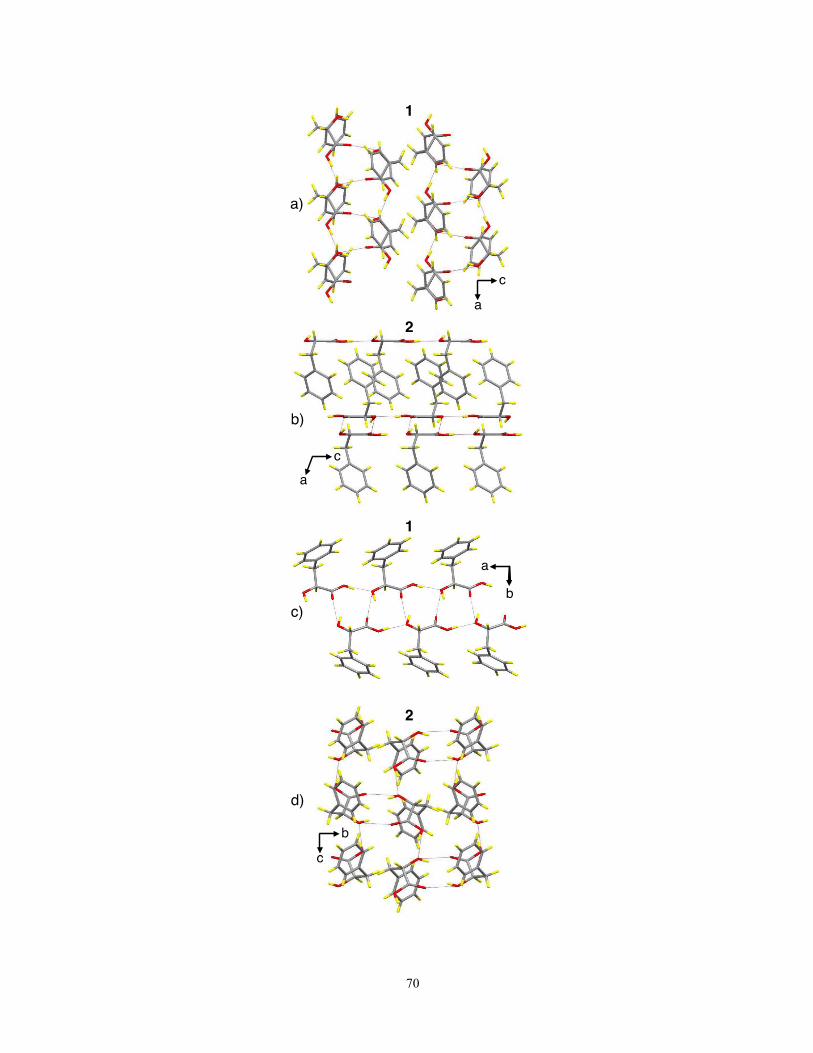
70
71
Figure 3.5. a) Views of crystal packing and hydrogen bonding in 1 (a) and 2 (b). Molecules in 1
and 2 pack as hydrogen-bonded ribbons (c) and sheets (d), respectively. Purple dashed lines
indicate hydrogen bonds.
Infrared analysis of 1 and 2. Crystals of 1 and 2 exhibited distinguishable IR absorptions that
allow the two crystal forms to be identified unambiguously. The FTIR spectra for crystals of 1
and 2 are shown in Figure 3.6. We used the overall pattern as well as several characteristic bands
to distinguish between 1 and 2 and assess the relative strengths of hydrogen-bonding interactions
in solid state. There are two different types of O-H…
O interactions in both structures. In one
type, an alcohol OH group is the donor and the carboxylic acid O=C group is the acceptor (1
O…
O = 2.74 Å, H…
O = 1.97 Å; 2 O…
O = 2.81 Å, H…
O = 2.00 Å). In the second type, a
carboxylic acid OH group is the donor and an alcohol oxygen serves as the acceptor (1 O…
O =
2.61 Å, H…
O = 1.72 Å; 2 O…
O = 2.64 Å, H…
O = 1.78 Å). The O…
O and H…
O distances arising
from both these types of interactions are shorter in 1 as compared to 2 (O…
O] = 0.07 Å and
0.03 Å, H…
O] = 0.03 Å and 0.06 Å, respectively), which corroborates our finding of stronger
O-H…
O hydrogen bonds in 1 observed from the IR data. Crystals of 2 gave a sharp band at 3447
cm-1
characteristic of OH stretching. A similarly sharp OH stretching band also appeared at 3442
cm-1
in the IR spectrum of 1. That absorption band corresponds to the stretching frequency of the
alcohol O-H bond, which can be expected to shift to lower wavenumbers as the strength of an O-
H…
O hydrogen bond increases.24
The shift to lower wavenumbers by 5 cm-1
in the spectrum of 1
compared to that of 2 indicates that 1 exhibits slightly stronger O-H…
O=C hydrogen-bonding
interactions than 2. Extremely broad O-H stretching absorptions arising from CO2H…
OH (acid
donor…
alcohol acceptor) interactions are present in both spectra in the region between 3100-
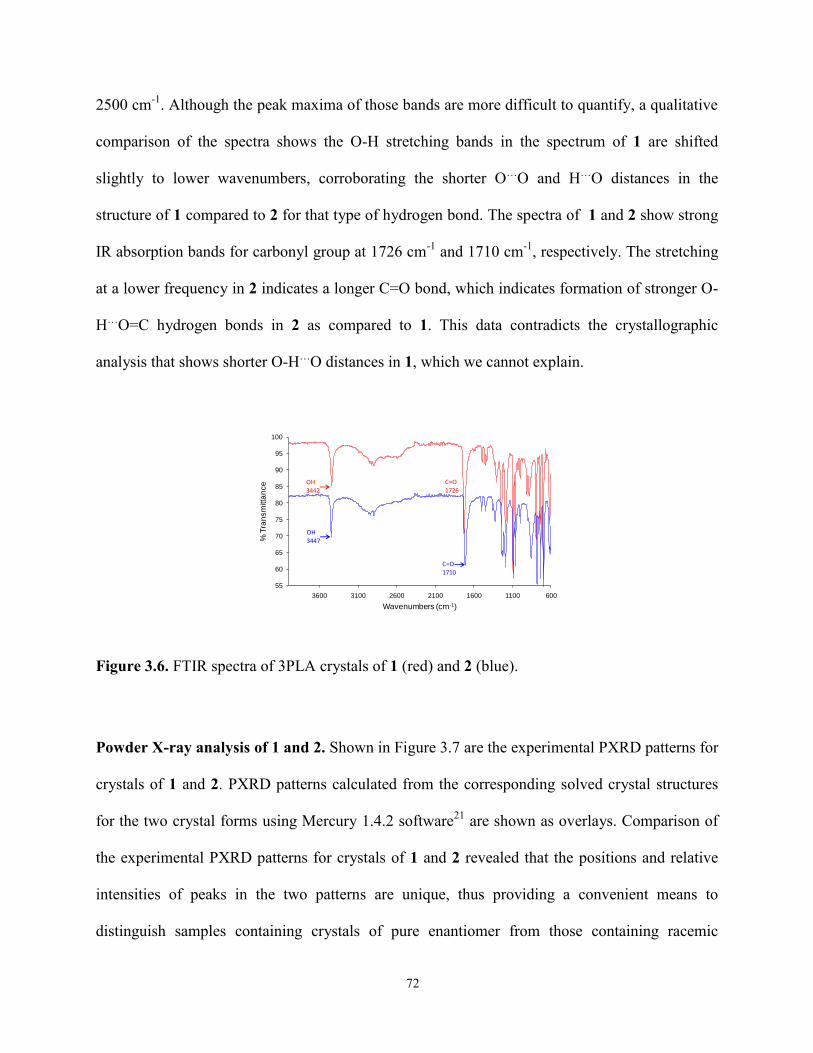
72
2500 cm-1
. Although the peak maxima of those bands are more difficult to quantify, a qualitative
comparison of the spectra shows the O-H stretching bands in the spectrum of 1 are shifted
slightly to lower wavenumbers, corroborating the shorter O…
O and H…
O distances in the
structure of 1 compared to 2 for that type of hydrogen bond. The spectra of 1 and 2 show strong
IR absorption bands for carbonyl group at 1726 cm-1
and 1710 cm-1
, respectively. The stretching
at a lower frequency in 2 indicates a longer C=O bond, which indicates formation of stronger O-
H…
O=C hydrogen bonds in 2 as compared to 1. This data contradicts the crystallographic
analysis that shows shorter O-H…
O distances in 1, which we cannot explain.
55
60
65
70
75
80
85
90
95
100
600110016002100260031003600
% T
ran
sm
itta
nce
Wavenumbers (cm-1)
OH3442
C=O1726
OH3447
C=O
1710
Figure 3.6. FTIR spectra of 3PLA crystals of 1 (red) and 2 (blue).
Powder X-ray analysis of 1 and 2. Shown in Figure 3.7 are the experimental PXRD patterns for
crystals of 1 and 2. PXRD patterns calculated from the corresponding solved crystal structures
for the two crystal forms using Mercury 1.4.2 software21
are shown as overlays. Comparison of
the experimental PXRD patterns for crystals of 1 and 2 revealed that the positions and relative
intensities of peaks in the two patterns are unique, thus providing a convenient means to
distinguish samples containing crystals of pure enantiomer from those containing racemic
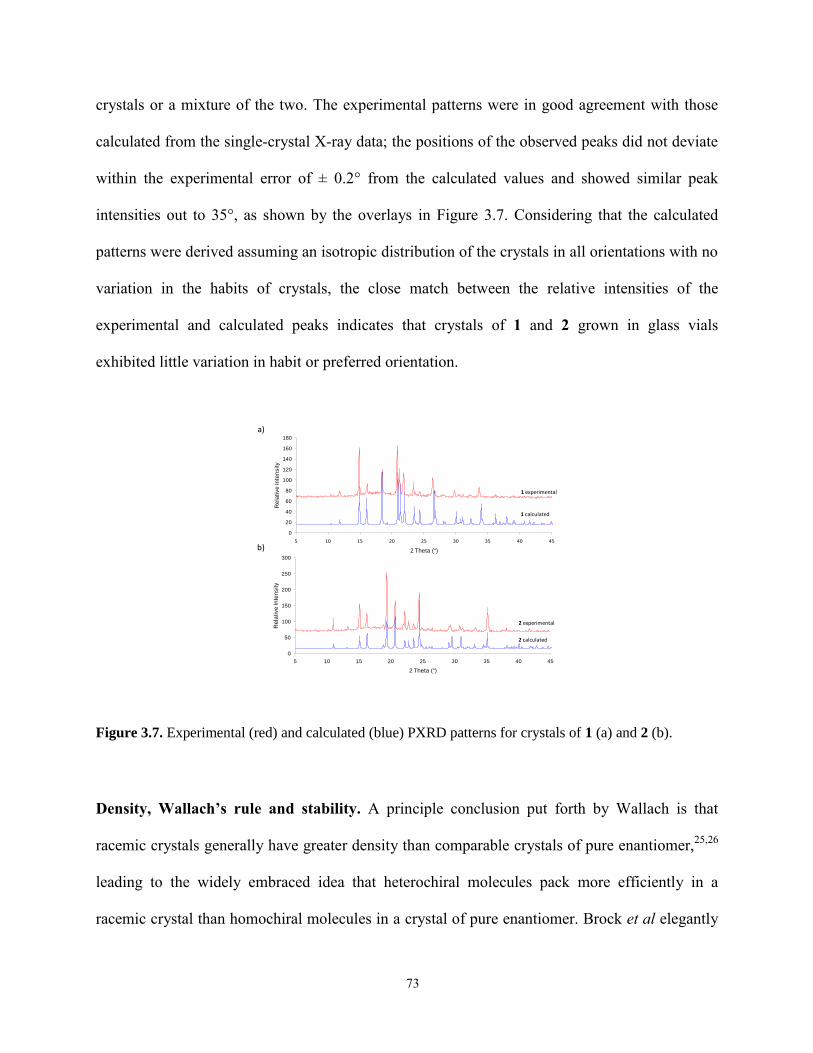
73
crystals or a mixture of the two. The experimental patterns were in good agreement with those
calculated from the single-crystal X-ray data; the positions of the observed peaks did not deviate
within the experimental error of ± 0.2° from the calculated values and showed similar peak
intensities out to 35°, as shown by the overlays in Figure 3.7. Considering that the calculated
patterns were derived assuming an isotropic distribution of the crystals in all orientations with no
variation in the habits of crystals, the close match between the relative intensities of the
experimental and calculated peaks indicates that crystals of 1 and 2 grown in glass vials
exhibited little variation in habit or preferred orientation.
0
20
40
60
80
100
120
140
160
180
5 10 15 20 25 30 35 40 45
Re
lative
In
ten
sity
2 Theta (°)
1 experimental
1 calculated
0
50
100
150
200
250
300
5 10 15 20 25 30 35 40 45
Re
lative
In
ten
sity
2 Theta (°)
2 experimental
2 calculated
a)
b)
Figure 3.7. Experimental (red) and calculated (blue) PXRD patterns for crystals of 1 (a) and 2 (b).
Density, Wallach’s rule and stability. A principle conclusion put forth by Wallach is that
racemic crystals generally have greater density than comparable crystals of pure enantiomer,25,26
leading to the widely embraced idea that heterochiral molecules pack more efficiently in a
racemic crystal than homochiral molecules in a crystal of pure enantiomer. Brock et al elegantly
74
demonstrated that racemic crystals on average are about 1% more tightly packed than the
corresponding chiral crystal, but also showed that the generally greater stability of racemic
crystals can be explained only in those cases where enantiomers are resolvable using
thermodynamic arguments correlating stability with packing efficiency.16
With that in mind, we
examined the density of crystals of 1 and 2 determined from the calculated densities obtained
from the crystal structures. The densities of 1 and 2 were not determined experimentally. The
crystallographically determined densities of 1 and 2 are 1.339 g/cm3 and 1.388 g/cm
3,
respectively, with the racemic crystal exhibiting a density greater by 0.049 g/cm3, or 3.7%,
compared to that of the pure enantiomer and conglomerate. Thus, a crystal of racemic 3PLA
follows Wallach’s rule with regard to density, thereby exhibiting tighter molecular packing than
in crystals of the pure enantiomer. It is worth noting that the difference of 3.7% is significantly
higher than the average value of ~1% reported by Brock et al for racemic crystals, which clearly
indicates heterochiral packing is considerably more efficient than homochiral packing for
enantiomers of 3PLA. We were surprised by this data considering that a crystal of 1 is
thermodynamically more stable than a crystal of 2 (i.e., Hfus) = 4.0 kJ/mol). These results
indicate that although racemic crystals of 3PLA display higher density with more efficient
packing, they are less stable than homochiral crystals of 3PLA in which the molecules form
shorter, stronger hydrogen-bonding interactions. These findings are in opposition to the norm
where stability generally is expected to increase as a function of packing efficiency.
Taking into account that 3PLA adopts essentially identical conformations in both structures, the
greater density in crystals of 2 cannot be caused by variation in packing energetics arising from
differences in molecular conformation. A more likely explanation for this phenomenon is that
75
molecules in the structure of 2 simply pack more tightly because they are linked via hydrogen
bonds in two-dimensions (i.e., sheets), whereas molecules in the structure of 1 are joined by
hydrogen bonds in just one dimension (i.e., ribbons). As a supramolecular entity, ribbons have
linear, rod-like structures that necessarily pack at van der Waals contact distance in two
dimensions, as opposed to sheets, which stack at van der Waals separation in just one dimension.
Although the weaker hydrogen bonding in 2 may lead to slightly looser packing within a sheet
compared to a ribbon, the sheets themselves can pack more efficiently with one another due to
Kitaigorodski’s principles of closest packing; the heterochiral nature of the sheets in 2 provides
additional inversion and mirror/glide symmetry operators for packing that are forbidden by
asymmetry in the homochiral ribbons in 1.
3.4 CONCLUSIONS
A comparison of the thermal stability of homochiral crystals (1), racemic crystals (2) and
conglomerates (3) of 3PLA showed that crystals of the pure enantiomer and conglomerate
exhibit greater stability than the racemic crystals such that the racemic form does not appear in
the phase diagram. While these results are in agreement with previous reports that racemic 3PLA
crystallizes only as conglomerates,14,17
we were able to obtain racemic crystals of 3PLA using an
aprotic, less polar solvent system than that used to grow homochiral crystals. Although the
observed density and corresponding packing efficiency of the racemic crystal are greater than
those of the homochiral crystal in accordance with Wallach’s rule, these results are unusual in
that they are in opposition to the greater stability of the homochiral crystal of 3PLA, and the
widely observed correlation between stability and packing efficiency for racemic systems in
which the enantiomers are resolvable. The fact that the racemic form of 3PLA is readily obtained
76
using a less polar solvent indicates that the difference in stability between the homochiral and
heterochiral forms of 3PLA (Hfus) = 4.0 kJ/mol) is small enough that both forms are
accessible via standard methods of crystallization. Even though we did not observe concomitant
formation of homochiral and heterochiral crystal forms on glass, these findings suggest that
3PLA represents an ideal racemic system to investigate homochiral vs. heterochiral nucleation as
a means to resolve enantiomers. Crystallization on chiral surfaces is a particularly attractive
approach toward enantioseparation because diastereomeric interactions between a homochiral
surface and enantiomers can promote homochiral nucleation, ultimately leading to selective
crystallization of one enantiomer over the other. Preliminary studies in which we crystallized
racemic 3PLA from 3:1 hexanes/ethyl acetate (i.e., the solvent system that yields racemic
crystals on glass substrates) on SAMs consisting of L- or D-cysteine produced mixtures of
racemic and homochiral crystals. Those results suggest that the difference in interaction energy
between the two enantiomers of 3PLA with L- or D-cysteine on the surface is sufficient to
concurrently promote homochiral and heterochiral nucleation. We wanted to investigate the
generality of that phenomenon with racemic 3PLA and other racemic drug systems on chiral
SAMs in an effort to develop surface-based methods for enantioselective separation. The results
of that work are discussed in chapter 4.
Supporting Information Available. Crystallographic CIF files for the structures of 1 and 2 are
available free of charge via the Internet at http://pubs.acs.org, and also at
http://www.ccdc.cam.ac.uk/data request/cif (structures CCDC-806843 and CCDC-806844), by
emailing data [email protected], or by contacting the Cambridge Crystallographic Data
Centre, 12 Union Road, Cambridge CB2 1EZ, UK; fax: +44(0)1223-336033.
77
REFERENCES
(1) Chilmonczyk, Z.; Ksycinska, H.; Cybulski, J.; Rydzewski, M.; Les, A. Chirality 1998,
10, 821.
(2) Hyun, M. H.; Kim, J. I.; Cho, Y. J.; Han, S. C. Chromatographia 2004, 60, 275.
(3) Francotte, E. R. J. Chromatogr., A 2001, 906, 379.
(4) Maier, N. M.; Franco, P.; Lindner, W. J. Chromatogr., A 2001, 906, 3.
(5) Allenmark, S.; Schurig, V. J. Mater. Chem. 1997, 7, 1955.
(6) Fogassy, E.; Acs, M.; Faigl, F.; Simon, K.; Rohonczy, J.; Ecsery, Z. J. Chem. Soc.,
Perkin Trans. 2 1986, 1881.
(7) Dressler, D. H.; Mastai, Y. Chirality 2007, 19, 358.
(8) Dressler, D. H.; Mastai, Y. J. Colloid Interface Sci. 2007, 310, 653.
(9) Li, Z. J.; Zell, M. T.; Munson, E. J.; Grant, D. J. W. J. Pharm. Sci. 1999, 88, 337.
(10) Mitchell, A. G. J. Pharm. Pharm. Sci. 1998, 1, 8.
(11) Weissbuch, I.; Lahav, M.; Leiserowitz, L. Cryst. Growth Des. 2003, 3, 125.
(12) Weissbuch, I.; Zbaida, D.; Addadi, L.; Leiserowitz, L.; Lahav, M. J. Am. Chem. Soc.
1987, 109, 1869.
(13) Collet, A.; Brienne, M. J.; Jacques, J. Chem. Rev. 1980, 80, 215.
(14) Jacques, J., Collet, A.; Wilen, S. H. Enantiomers, Racemates, and Resolutions; John
Wiley and Sons: New York, 1981.
(15) Kitaigorodski, A. I. Molecular Crystals and Molecules; Academic: New York and
London, 1973.
(16) Brock, C. P.; Schweizer, W. B.; Dunitz, J. D. J. Am. Chem. Soc. 1991, 113, 9811.
(17) Cesario, M.; Guilhem, J. Cryst. Struct. Commun. 1975, 4, 245.
(18) Strom, K.; Sjogren, J.; Broberg, A.; Schnurer, J. Appl. Environ. Microbiol. 2002, 68,
4322.
(19) Prema, P.; Smila, D.; Palavesam, A.; Immanuel, G. Food Bioprocess Technol. 2010, 3,
379.
(20) Bruker,(1999), SAINT (Version 6.14), SHELXTL (Version 6.14) for WNT/2003. Bruker
AXS Inc. Madison, Wisconsin, USA
(21) (CCDC), C. C. D. C. Cambridge, UK, 2009.
(22) Bernstein, J.; Davis, R. E.; Shimoni, L.; Chang, N.-L. Angew. Chem., Int. Ed. Engl. 1995,
34, 1555.
(23) Etter, M. C.; MacDonald, J. C.; Bernstein, J. Acta Crystallogr., Sect. B Struct. Sci. 1990,
B46, 256.
(24) Bellamy, L. J. The infra-red spectra of complex molecules; 3rd ed.; Chapman and Hall:
New York, 1975.
(25) Wallach, O. Annalen 1895, 286, 90.
(26) Wallach, O. Annalen 1895, 286, 119.
78
4: Enantioselective crystallization of 3-phenyllactic
acid on chiral templates
4.1 INTRODUCTION
In this chapter we demonstrate that resolution of chiral drugs in high enantiomeric excess
can be achieved when racemates of 3-phenyllactic acid (3PLA) are crystallized on chiral surfaces
that promote enantioselective nucleation. Chiral discrimination at surfaces is a well-recognized
phenomenon used widely in chromatographic applications to separate stereoisomers by passing
racemic mixtures of drugs through chiral stationary phases that consist of silica or alumina gels
containing chiral organic compounds covalently bonded on the surface of the particles.1
Separation of racemates by conventional methods such as chiral resolving reagents to form
diastereomeric salts that crystallize selectively2,3
or chromatography with chiral stationary
phases4-8
often fails or results in partial resolution and is of limited utility in particular for large-
scale separation of enantiomers due to cost and the amount of labor required. Enzymatic
resolution is inherently limited to select substrates for which a suitable enzyme is available that
epimerizes the stereochemistry on just one enantiomer and often still fails due to the lack of
stereoselectivity or stability of the enzyme.9,10
Accordingly, there is a clear need to develop
alternative methods to resolve enantiomers with high efficiency at low cost.
79
Crystallization is an alternative and cheaper approach to facilitate large-scale separation of
enantiomers.9,11,12
Traditionally, studies of crystallization have focused on controlling parameters
such as solvents,13
temperature,14
pH,15
or concentration,16
but largely have ignored the role that
the surface of the crystallization vessel plays in inducing nucleation. Moreover, the ability of
chiral surfaces to promote separation of enantiomers during the process of crystallization largely
has been ignored. We have chosen to investigate resolution of racemic drugs via crystallization
on surfaces functionalized with chiral organic compounds as a potentially feasible process to
bring about enantioseparation. It is clear from current models of heterogeneous crystallization
that ordered surfaces provide an energetic driving force essential to the formation of a crystalline
nucleus that promotes growth of mature crystals.17-19
During crystallization, enantiomers in a racemic solution either crystallize together by
forming racemic crystals or spontaneously resolve, forming equal amounts of enantiomerically
pure crystals, referred to as conglomerates (chapter 2.4). Unfortunately, crystallization generally
favors formation of racemic crystals (approximately 95%) over conglomerates (approximately
5%). Crystallization of racemates together normally is favored because racemic crystals often are
more stable due to more efficient packing of racemates that lower the lattice energy relative to
packing of single enantiomers.20
In cases where racemic compounds are known to form both
racemic crystals and conglomerates, the difference in lattice energy between the two crystalline
forms generally is small enough (e.g., ~ 1.0-2.0 kcal/mol)20,21
that conglomerates can be induced
to form by simply changing the temperature or solvent system used for crystallization. A well-
known example of this phenomenon was reported by Pasteur, who discovered that racemic
sodium ammonium tartrate spontaneously resolves as conglomerates when crystallized from
80
aqueous solutions at temperatures below 28 °C but as racemic crystals at temperatures above 28
°C.9,21
Considering that nucleation of crystals is inherently a heterogeneous process, we expect
that subtle differences in the interaction energy between racemic solutes and chiral surfaces (e.g.,
via diastereomeric interactions) in principle should bias molecular aggregation on chiral surfaces
to favor homochiral nucleation over heterochiral nucleation, which is a central hypothesis to this
research. Crystallization on chiral surfaces is a particularly attractive approach toward
enantioseparation because diastereomeric interactions between a homochiral surface and
enantiomers can promote homochiral nucleation, ultimately leading to selective crystallization of
one enantiomer over the other.
Enantioselective surface chemistry of chiral surfaces is an emerging field of research.22-29
Chiral surfaces prepared from naturally chiral bulk crystalline structures have been demonstrated
to exhibit enantioselective adsorption of amino acids.26-28
One of the most common chiral
surfaces of this type is quartz; Bonner showed in 1974 that D-alanine is enantioselectively
adsorbed onto the surface of D-quartz from racemic solutions, leading to a modest enantiomeric
excess of 1.4%.26,27
These pioneering findings demonstrated conclusively that the difference in
energy between diastereomeric interactions at a chiral surface provide enough of an energetic
bias to slightly favor adsorption of one enantiomer over the other. Chiral surfaces can also be
formed from crystalline materials with achiral bulk structures. Such chiral surfaces are created by
exposing metal surfaces with high Miller indices that possess kink sites with intrinsic left- or
right-handedness.22,29
The kink sites on such surfaces impart chirality, arising from a lack of
symmetry in the local arrangement of metal atoms on the surface. For example, chiral surfaces
on the (643) face of crystalline copper revealed enantiospecific adsorption of (+)-R-3-
81
methylcyclohexanone or (−)-S-3-methylcyclohexanone depending on the chirality of the surface,
thus acting as enantioselective heterogeneous catalysts.22
That work showed a difference in the
desorption energy of just 0.25 kcal/mol between the two enantiomers, establishing that even
small energetic differences in diastereomeric interactions at a surface where molecules are bound
weakly (i.e., van der Waals interactions) leads to enantioselectivity. As discussed later in this
chapter, we deliberately chose to study racemic compounds with organic functional groups that
are known to form strong hydrogen-bonding interactions in order to maximize differences in
diastereomeric interaction energies at the surface that might lead to greater enantioselectivity.
Self-asssembled monolayers (SAMs). Our approach towards chiral discrimination involves
nucleation and growth of molecular crystals of racemic pharmaceuticals on chiral self-assembled
monolayers (SAMs). Recent studies of molecular crystallization have shown that SAMs can act
as templates for crystallization. For example, SAMs have been used to direct the nucleation,
orientation, and face selective growth of crystals, as well as to control polymorphism.19,30
Crystals of numerous molecular materials have been grown on SAMs, including proteins,31
enantiomerically pure amino acids,32
and biominerals such as calcite.17
The SAMs used to
template growth of crystals provide an ordered, two-dimensional plane of exposed organic
groups that, in part, governs nucleation of crystals via intermolecular interaction between the
solute and the surface. Several studies indicate that lattice matching—namely direct or partial
correspondence between the alignment and spacing of functional groups on the surface of the
SAM and molecules present on the face of a crystal in contact with the surface—plays an
influential role in controlling the orientation and packing of molecules as they aggregate on the
surface.19,33
Lattice matching isn’t necessarily a requirement for templating though17,34,35
and
82
Aizenberg et al., have demonstrated that the nucleation of a specific face of calcite crystals on
SAMs functionalized with carboxylic acids is predominantly determined by the orientational
match of the carboxylate end groups with the carbonate ions in the calcite plane.17
SAMs are ideal as substrates to carry out crystallization for the following reasons: (1)
thiols spontaneously form ordered, self-annealing monolayers on gold substrates via formation of
gold-thiol bonds; (2) thiols with a wide variety of achiral and chiral functional groups are
available commercially or can be prepared easily through known synthetic procedures; (3)
preparation of SAMs is trivial, simply requiring exposure of clean gold substrates to solutions of
thiols at low concentration over minutes or hours at room temperature; (4) analytical methods to
characterize the structure and stability of SAMs such as contact angle goniometry, ellipsometry,
grazing-angle infrared spectroscopy, cyclic voltammetry are well-established; (5) SAMs are
stable in the presence of most organic solvents and across a range of temperatures; (6) once
formed, the surface structure and surface energy of SAMS can be covalently modified via
reaction at exposed surface groups; (7) intermolecular interactions (e.g., hydrogen bonding,
hydrophobic interactions, etc.) between drugs and SAMs can be controlled through appropriate
choice of organic functional groups at the termini of thiols; (8) chirality of the SAM can be
controlled both by the type and the position of chiral groups incorporated into thiols; and (9) the
composition and surface properties of SAMs can be varied using mixtures of different thiols.
Accordingly, a variety of ordered surfaces with specific interactions, surface energies, and
surface structure can be produced readily with fine chemical control.18
We have chosen to study
crystallization on SAMs rather than other types of thin films specifically because the molecular
components and head groups on those components are highly oriented and ordered over large
83
length scales. That unique feature of SAMs is important to our approach both for controlling the
orientation and packing of molecules as they aggregate on the surface, and for imparting
selectivity in binding specific stereoisomers that can lead to chiral discrimination.
Choice of achiral SAMs. We chose to investigate two different categories of SAMs (Table 4.1).
The first category includes a small group of SAMs prepared from thiols functionalized with
achiral head groups of varying polarity that would serve as achiral controls. Shown in Figure
4.7a, SAMs I-III feature terminal methyl, carboxylic acid, and hydroxyl head groups that present
surfaces with a range of surface energies. SAM I was chosen to provide a hydrophobic surface
incapable of forming hydrogen bonds with solute molecules. SAMs II and III were chosen to
provide hydrophilic surfaces capable of forming strong hydrogen bonds with complementary
polar functional groups on solute molecules. Although it was unclear whether these achiral
substrates might promote nucleation of racemic crystals or conglomerates, we anticipated that
SAMS I-III would not induce preferential enantioseparation in the absence of chiral head groups.
Table 4.1.Thiols used to prepare SAMs.
SAM achiral thiol used SAM chiral thiol used
I Dodecanethiol IV L-cysteine
II 11-mercaptoundecanol V N-acetyl-L-cysteine
III 11-mercaptoundecanoic acid VI D-cysteine
Choice of chiral SAMs. In order to investigate whether a surface functionalized with a terminal
chiral head group promotes enantioseparation, we selected a second category of SAMs with
chiral head groups consisting of surfaces coated with different stereoisomers of cysteine and
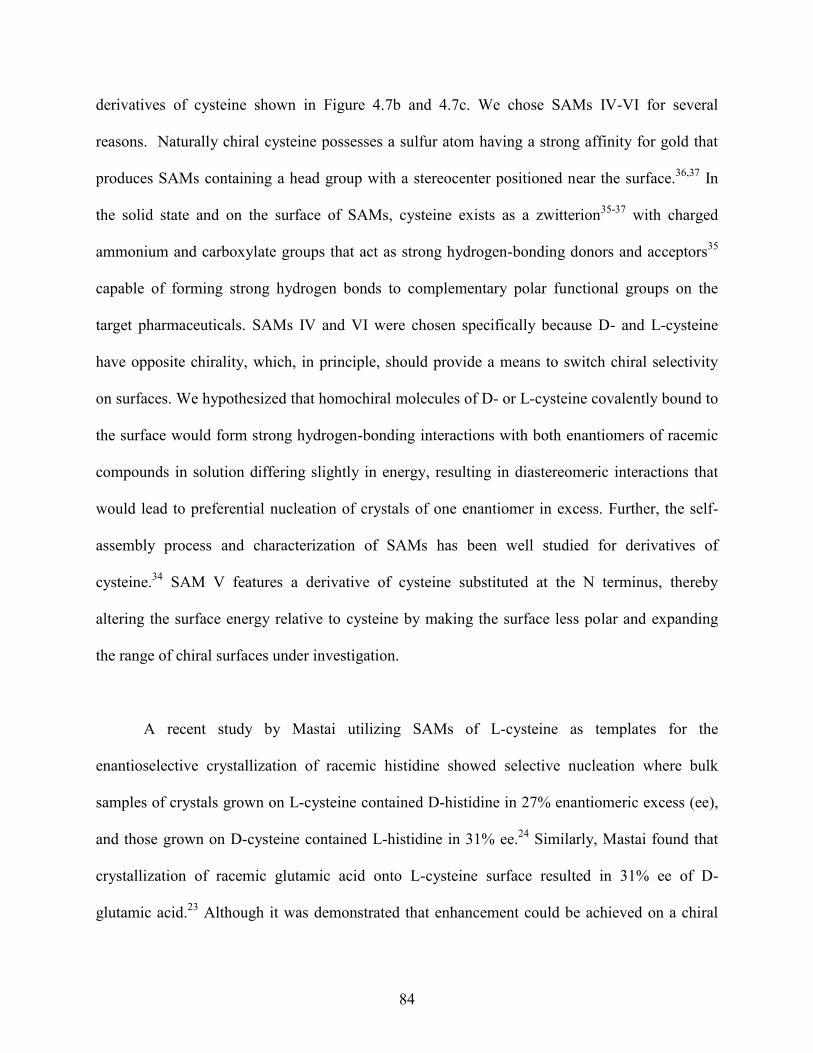
84
derivatives of cysteine shown in Figure 4.7b and 4.7c. We chose SAMs IV-VI for several
reasons. Naturally chiral cysteine possesses a sulfur atom having a strong affinity for gold that
produces SAMs containing a head group with a stereocenter positioned near the surface.36,37
In
the solid state and on the surface of SAMs, cysteine exists as a zwitterion35-37
with charged
ammonium and carboxylate groups that act as strong hydrogen-bonding donors and acceptors35
capable of forming strong hydrogen bonds to complementary polar functional groups on the
target pharmaceuticals. SAMs IV and VI were chosen specifically because D- and L-cysteine
have opposite chirality, which, in principle, should provide a means to switch chiral selectivity
on surfaces. We hypothesized that homochiral molecules of D- or L-cysteine covalently bound to
the surface would form strong hydrogen-bonding interactions with both enantiomers of racemic
compounds in solution differing slightly in energy, resulting in diastereomeric interactions that
would lead to preferential nucleation of crystals of one enantiomer in excess. Further, the self-
assembly process and characterization of SAMs has been well studied for derivatives of
cysteine.34
SAM V features a derivative of cysteine substituted at the N terminus, thereby
altering the surface energy relative to cysteine by making the surface less polar and expanding
the range of chiral surfaces under investigation.
A recent study by Mastai utilizing SAMs of L-cysteine as templates for the
enantioselective crystallization of racemic histidine showed selective nucleation where bulk
samples of crystals grown on L-cysteine contained D-histidine in 27% enantiomeric excess (ee),
and those grown on D-cysteine contained L-histidine in 31% ee.24
Similarly, Mastai found that
crystallization of racemic glutamic acid onto L-cysteine surface resulted in 31% ee of D-
glutamic acid.23
Although it was demonstrated that enhancement could be achieved on a chiral
85
template, limitations of that work include the following: (1) the reported values of 27-31% ee
represent very modest enhancement compared to the demands from the pharmaceutical
industry;38-40
(2) the mechanism of chiral recognition was not elucidated; (3) the two racemic
systems examined were limited to amino acids; and lastly, (4) only those crystals that adhered to
the surface of chiral surfaces oriented vertically in solution were examined. Nonetheless, those
findings represent the first reported example in which SAMs have been shown to act as chiral
templates for enantioselective crystallization, and served as a starting point for this research. As
described later in the objectives, we aimed to investigate crystallization on chiral templates more
thoroughly using racemic pharmaceuticals to develop a more detailed mechanistic understanding
of the solute-surface interactions responsible for enantioselectivity in order to optimize
enhancement, and to develop surface-based approach that can be adopted for large-scale, batch
enantioseparation in the pharmaceutical industry (e.g., single-pot synthesis and separation in a
functionalized reaction vessel).
Selection of a racemic drug system. Two requirements must be met for enantioselective
crystallization to occur: (1) racemates must crystallize separately as homochiral crystals rather
than racemic crystals, and (2) crystals of one enantiomer must preferentially nucleate and grow
while the opposite enantiomer remains in solution. Accordingly, we investigated racemic 3-
phenyllactic acid (3PLA), a naturally occurring antibiotic agent used commonly as a component
in pharmaceuticals.41,42
3PLA was reported to form conglomerates from water,43,44
and is more
apt to undergo enantioselective nucleation on the surface of chiral substrates such as SAMs. We
obtained racemic crystals when 3PLA was crystallized from 3:1 hexanes/ethyl acetate45
indicating that the difference in stability between the homochiral and heterochiral forms of 3PLA
86
(Δ(ΔHfus) = 4.0 kJ/mol) is small enough that both forms are accessible via standard methods of
crystallization. But we chose to work under conditions where 3PLA is known to form
conglomerates in terms of the solvent system. In chapter 3, we discussed the crystallization
behavior, thermal stability, crystal structures, and spectroscopic properties of homochiral crystals
(1), heterochiral racemic crystals (2) and conglomerates (3) of 3PLA. We have established by
thermal methods that the racemic crystals are less stable than the homochiral crystals. Choosing
a racemic test compound that exhibits that behavior was important because we wanted to
investigate the ability of a chiral surface to selectively discriminate the nucleation of one
enantiomer over the other. For example, if the racemic crystals of 3PLA were more stable than
homochiral crystals, there would have been an energetic bias in the formation of racemic
crystals11,46,47
making it difficult to separate the two enantiomers. We know that the homochiral
and racemic crystals exhibit large variations in lattice energies; studies have shown that when the
difference in melting temperatures between crystals of pure enantiomer and conglomerate is ~ 30
°C, conglomerates are likely to be observed and thus favorable to conditions for spontaneous
resolution.11,44,47
Alternatively, if the difference in lattice energies between the racemic crystals
and homochiral crystals exceeds 2 kcal/mol, the energies of interactions may not be enough to
overcome the formation of racemic crystals.11,44,47
3PLA therefore provides a unique test system
to investigate the influence of surface energetics and solvation in biasing homochiral vs
heterochiral nucleation to develop methods for enantioseparation via crystallization. The
structure of 3PLA is shown in Figure 4.1. The crystal structure possesses hydroxyl and
carboxylic acid functional groups capable of forming strong hydrogen bonds in different packing
arrangements45
with the functional groups exposed on the surface of the SAMs. This feature is
important to our research in order to maximize the diastereomeric interactions via hydrogen-
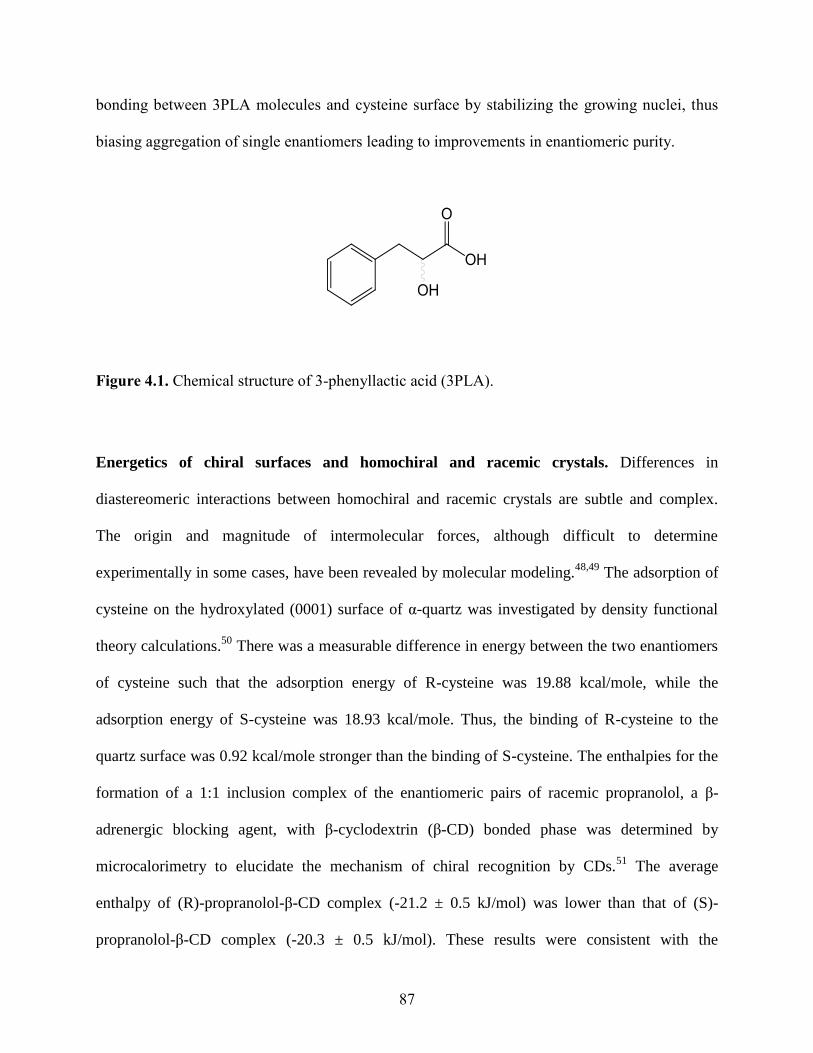
87
bonding between 3PLA molecules and cysteine surface by stabilizing the growing nuclei, thus
biasing aggregation of single enantiomers leading to improvements in enantiomeric purity.
Figure 4.1. Chemical structure of 3-phenyllactic acid (3PLA).
Energetics of chiral surfaces and homochiral and racemic crystals. Differences in
diastereomeric interactions between homochiral and racemic crystals are subtle and complex.
The origin and magnitude of intermolecular forces, although difficult to determine
experimentally in some cases, have been revealed by molecular modeling.48,49
The adsorption of
cysteine on the hydroxylated (0001) surface of α-quartz was investigated by density functional
theory calculations.50
There was a measurable difference in energy between the two enantiomers
of cysteine such that the adsorption energy of R-cysteine was 19.88 kcal/mole, while the
adsorption energy of S-cysteine was 18.93 kcal/mole. Thus, the binding of R-cysteine to the
quartz surface was 0.92 kcal/mole stronger than the binding of S-cysteine. The enthalpies for the
formation of a 1:1 inclusion complex of the enantiomeric pairs of racemic propranolol, a β-
adrenergic blocking agent, with β-cyclodextrin (β-CD) bonded phase was determined by
microcalorimetry to elucidate the mechanism of chiral recognition by CDs.51
The average
enthalpy of (R)-propranolol-β-CD complex (-21.2 ± 0.5 kJ/mol) was lower than that of (S)-
propranolol-β-CD complex (-20.3 ± 0.5 kJ/mol). These results were consistent with the
88
previously reported studies that the R enantiomer was retained longer on the stationary phase
than the S enantiomer.52
Those studies demonstrate that the difference in the interaction energies
of the enantiomers in a chiral environment serves as a driving force for enantioseparation.
Understanding the intermolecular interactions responsible for chiral discrimination as well as the
factors that control the formation of homochiral and racemic crystals may ultimately lead to a
rational design for purification of enantiomers by crystallization.
Under conditions where thermodynamics control crystallization, spontaneous resolution
corresponds to a positive free energy of formation for the racemic crystal, where the racemic
crystal has higher Gibbs free energy (is less stable) than the homochiral crystal. It has been
suggested that formation of conglomerates is penalized by RTln2, or about ~0.5kcal.mol (2
kJ/mol), arising from the required entropically unfavorable separation of the two enantiomers in
a homogeneous racemic liquid into a mechanical mixture of two homochiral crystals.44,47
Previous studies of crystal structure prediction demonstrated that there are hypothetical racemic
crystals close in energy to the known homochiral crystals such that the difference in lattice
energies of homochiral and racemic crystals was less than about 4 kJ/mol.48
Hence, the enthalpic
driving force for spontaneous resolution is so small that entropic and kinetic effects are likely to
strongly influence the crystallization process. Those findings agree with the difference in
stability between the homochiral and heterochiral forms we observed for 3PLA (Δ(ΔHfus) = 4.0
kJ/mol). In the present work, the differences in energies between diastereomeric interactions
between L-cysteine and L- or D-3PLA is expected to be small (~3-5 kJ/mol), which would
explain the feasibility of occurrence of homochiral aggregation of 3PLA on a chiral surface. The
contributions of the individual energy components, namely van der Waals interactions,
89
electrostatic interactions, and hydrogen bonding, to the total lattice energy have been calculated
for a number of organic pharmaceutical crystals, and compared to the experimental data to probe
the underlying intermolecular forces responsible for the formation of homochiral or racemic
crystals.49
For seven pairs of homochiral and racemic crystals, correlation of the differences
between the two crystal forms in the calculated energies and experimental enthalpy of fusion
suggested that the van der Waals interactions play a key role in the chiral discrimination in the
solid state.49
4.2 OBJECTIVES
We are primarily interested in developing a general method for enantioseparation that can
be adopted for large-scale synthesis and purification of single enantiomers of drugs and thus set
out to build a detailed model of chiral recognition at surfaces in this study. We wanted to
thoroughly investigate the enantioseparation of one drug system and determine the role of the
chiral surface on the preferential nucleation of one enantiomer over the other. We also wanted to
determine if there are specific intermolecular interactions between the functional groups exposed
on certain faces of crystals of L-3PLA and the surface of SAMs that are responsible for chiral
discrimination leading to high levels of enantiomeric purity. By determining if those molecular
interactions occur specifically and with high frequency, it should be possible in principle to
identify families of pharmaceuticals with the appropriate functionality that promote stronger
hydrogen-bonding interactions than 3PLA that show greater enantioenhancement. We could then
tailor the class of drug molecules, and examine how broadly our surface-based approach is
applicable to a library of pharmaceuticals. Accordingly, we have investigated enantioseparation
of N-acetylleucine, as another chiral drug that possesses strong hydrogen-bonding donors and
90
acceptors that maximize the hydrogen-bonding interactions and thus promote chiral recognition.
The results of that work are described in chapter 6.
The specific objectives of the research in this chapter were:
1. To prepare and characterize a small library of achiral hydrophobic and hydrophilic SAMs
(SAMs I-III) as control surfaces and chiral SAMs composed of cysteine and derivatives
of cysteine (SAMs IV-VI) on which to crystalize solutions of homochiral and racemic
3PLA. . This work was not focused on the self-assembly process and structures of SAMs
I-VI because their surface chemistry has been characterized and is known.18,34,36,53-57
We
have used a similar self-assembly approach to prepare achiral and chiral SAMs for the
purpose of crystallization.
2. To investigate the crystallization behavior of racemic 3PLA from aqueous solutions on
achiral and chiral SAMs to determine if the chiral surfaces lead to enantioselective
enhancement, and also to determine if the enantiomer in excess could be controlled by
switching the chirality of the surface template.
3. To determine the enantiomeric composition of the crystals grown on achiral and chiral
SAMs and thus quantify the enantiomeric purity by thermal analysis.
4. To investigate the effect of soluble cysteine in solution on the enantiomeric purity of
samples of crystals grown on chiral SAMs to determine if dissolution of cysteine from
the surface into the racemic solution of 3PLA leads to chiral discrimination, and to
confirm that the chiral surface is solely responsible for chiral discrimination.
5. To compare the crystallization behavior of homochiral L-3PLA to racemic 3PLA on
chiral SAMs to confirm the absence of polymorphs of L-3PLA and to develop a good
91
understanding of the mechanism of chiral recognition of 3PLA on chiral surfaces on the
basis of oriented growth of crystals on specific faces.
6. To determine if the build-up of the excess enantiomer in solution affects the growth
behavior (i.e., kinetics of nucleation and growth, morphology of crystals, etc.) of
homochiral L-3PLA in a chiral environment.
4.3 EXPERIMENTAL
Preparation of self-assembled monolayers (SAMs) on gold. Commercially available ω-
substituted alkanethiols were purchased from Aldrich, Alfa Aesar, TCI and MP Biomedicals and
used without further purification. L- and D-cysteine were purchased from Alfa Aesar and
Aldrich respectively and used without further purification. Absolute ethanol was purchased from
Pharmco. Glass slides (25mm x 75mm x 1.5mm) coated with 50 Å of chromium as binder and
1000 Å of gold were purchased from Evaporated Metal Films. Racemic, D-, and L-3phenyllactic
acid (3PLA) were purchased from Aldrich and used without further purification. SAMs on gold
substrates were prepared as follows. The gold slides were cut into 25mm x 25mm squares and
cleaned by plasma oxidation (SPI Supplies Plasma-Prep II) for 1 minute, rinsed with absolute
ethanol and deionized water, and dried under nitrogen. SAMs of ω-substituted alkanethiols were
generated by immersing the slides in 2 mM ethanolic solution of dodecanethiol (SAM I), 11-
mercaptoundecanol (SAM II), or 11-mercaptoundecanoic acid (SAM III) for 24 h at RT. The
resulting SAMs were rinsed with absolute ethanol and dried with nitrogen prior to
characterization and crystallization experiments. Monolayers of chiral SAMs were prepared by
immersing the gold slides in 2mM aqueous solution of L-cysteine (SAM IV), N-acetyl-L-
cysteine (SAM V), D-cysteine (SAM VI) for 24 h at RT.
92
Characterization of SAMs. Achiral and chiral SAMs were characterized by contact angle
goniometry, ellipsometry, grazing-angle FT-IR, and optical microscopy to verify the presence of
SAMs on gold substrates prior to carrying out crystallization experiments. Contact angle
measurements on SAMs and bare gold were determined using a Ramé-Hart Model 100-00
Goniometer (Mountain Lakes, NJ) by depositing 1 µL drops of water on surfaces using a Ramé-
Hart Automated Dispenser. The contact angles were measured using the DROP image
program,58
and the contact angles were determined from the average of 5 drops per SAM
deposited in different locations on three separate SAMs. The contact angles for SAMs I-VI and
bare gold are given in Table 4.3. The thicknesses of SAMs were measured using a Photoelectric
Rudolf 439L633P ellipsometer (Rudolf Instruments, Fairfield, NJ) equipped with a He-Ne laser,
λ = 632.8 nm, angle of incidence 70°. Thickness of films on the surface of gold was determined
at five separate points and averaged using a refractive index of 1.47.59
All values of film
thicknesses were determined using the software package 439PCS11 Ellipsometry Analysis from
Rudolph instruments,60
and are reported in Table 4.3. Infrared spectra on bulk samples of
alkanethiols were obtained using a Bruker Optics FT-IR spectrometer equipped with a Vertex70
attenuated total reflection (ATR) accessory by collecting 64 scans over a scan range from 4000
to 400 cm-1
at 4 cm-1
resolution. Deposition of SAMs on gold was verified by grazing-angle IR
spectroscopy with a BRUKER Optics IR Spectrometer equipped with a VERTEX70 Auto
Seagull grazing-angle accessory and a liquid nitrogen cooled MCTA detector with an incident
beam angle of 85° relative to the surface of gold substrates. The optical path was purged with
nitrogen gas prior collecting data. Sixty-four scans were collected for samples at 4 cm-1
93
resolution scanning from 4000 to 400 cm-1
, and the data was analyzed using the OPUS software
package.61
Background spectra were obtained using a clean gold substrate.
Growth of conglomerates and racemic crystals of 3PLA on glass. Crystals of pure enantiomer
(1), racemic crystals (2), and conglomerates (3) were grown in 3 dram glass vials to identify
which crystal forms appeared in the absence of SAMs and thus determine the habits and melting
behavior of the three crystal forms. Two solvent systems, deionized water and 3:1 hexanes/ethyl
acetate, were tested to examine how differences in polarity, solubility, rates of evaporation, and
the presence or absence of protic functionality would affect the rate of crystallization, the size
and habit of crystals, and the degree to which enantiomers could be resolved on chiral SAMs.
Crystals of 1 were prepared by placing 0.3 M solutions of L-3PLA in deionized water into glass
vials and then allowing water to evaporate slowly at RT from the uncapped vials. Clear, colorless
needles of 1 appeared in solution after 5 days and were isolated by filtration prior to complete
evaporation of solvent. Crystals of 2 were prepared by placing 0.09 M solutions of racemic
3PLA in 3:1 hexanes/ethyl acetate and then allowing the solvent mixture to evaporate slowly at
RT from the uncapped vials. Clear, colorless blocks of 2 appeared in solution after 3 days and
were isolated by filtration prior to complete evaporation of solvent. Crystals of 3 were prepared
by placing 0.3 M solutions of racemic 3PLA in deionized water at RT into glass vials and then
allowing the water to evaporate slowly at RT from uncapped vials. Clear, colorless needles of 3
formed in solution after 5-6 days and were isolated by filtration prior to complete evaporation of
solvent.
94
Growth of conglomerates and racemic crystals of 3PLA on SAMs. Crystallization of
solutions of 3PLA was carried out on achiral and chiral SAMs and also on bare gold and glass
substrates as controls. To verify that enantioseparation did not occur because of soluble cysteine
in solution due to dissolution of cysteine from SAMs, 3PLA was also crystallized from water
containing 10 μM L-cysteine and D-cysteine free in solution. The setup used for all
crystallization experiments is shown in Figure 4.2a. Solutions containing racemic 3PLA were
deposited onto the horizontal surface of slides laying flat in petri dishes as shown in Figure 4.2b.
Volumes of ~0.4 mL (10 drops) were used to maximize coverage on the surface without
allowing the solution to touch the edges of the substrate in order to prevent nucleation of crystals
on exposed bare glass. A lid was then placed over the petri dish to allow solvent to evaporate
slowly at RT from small gaps between the dish and cover until crystals appeared in solution. The
different solution concentrations of 3PLA used are shown in Table 4.2. Concentrations of
racemic 3PLA were optimized to 0.3 M in deionized water and 0.09 M in 3:1 hexanes/ethyl
acetate to produce crystals of 3PLA in solution within 24 hours. Crystals of 3PLA first appeared
in solution in less than 24 hours but were not isolated immediately so as to have a sufficient
amount of sample required for differential scanning calorimetry (DSC). 3-4 mg crystals were
harvested later within 32-48 hours until ~50% solution had crystallized on the surface by
removing the mother liquor with a pipette to prevent further crystallization of 3PLA remaining in
solution. The crystals and substrates were then gently rinsed with a small amount (~2 mL) of
hexanes and dried under a stream of nitrogen gas. Five separate crystallization experiments were
carried out on each of the different SAMs and control surfaces.
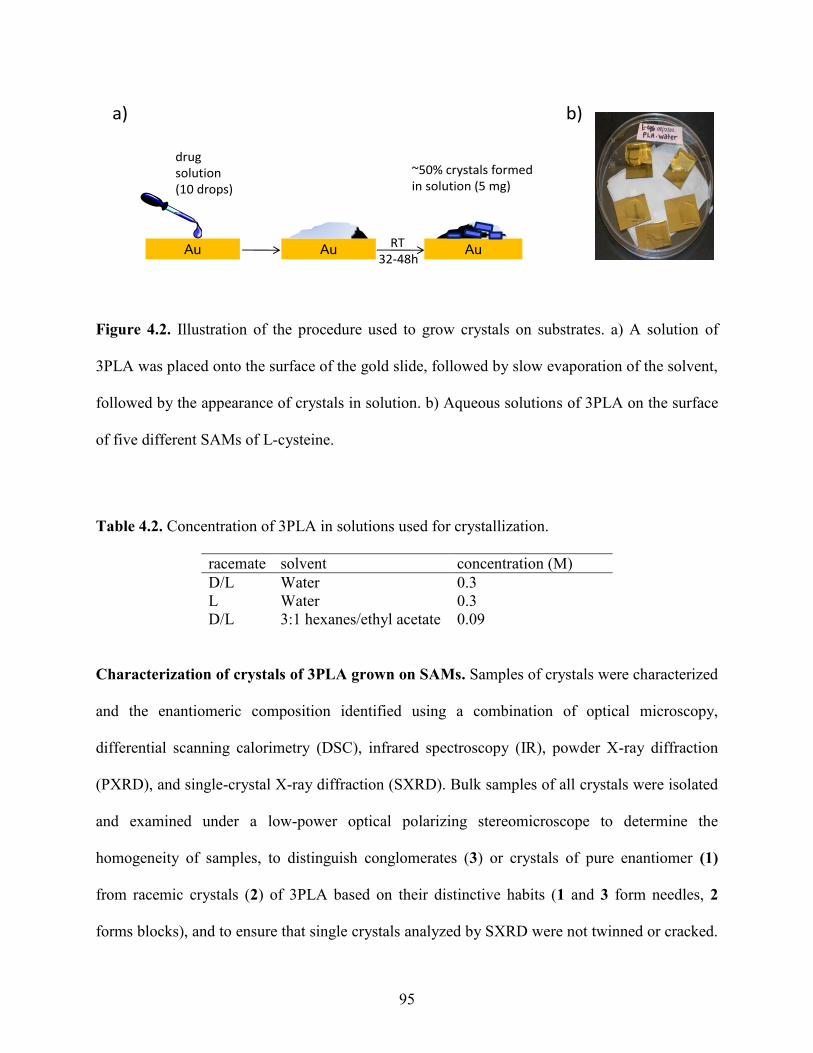
95
Figure 4.2. Illustration of the procedure used to grow crystals on substrates. a) A solution of
3PLA was placed onto the surface of the gold slide, followed by slow evaporation of the solvent,
followed by the appearance of crystals in solution. b) Aqueous solutions of 3PLA on the surface
of five different SAMs of L-cysteine.
Table 4.2. Concentration of 3PLA in solutions used for crystallization.
racemate solvent concentration (M)
D/L Water 0.3
L Water 0.3
D/L 3:1 hexanes/ethyl acetate 0.09
Characterization of crystals of 3PLA grown on SAMs. Samples of crystals were characterized
and the enantiomeric composition identified using a combination of optical microscopy,
differential scanning calorimetry (DSC), infrared spectroscopy (IR), powder X-ray diffraction
(PXRD), and single-crystal X-ray diffraction (SXRD). Bulk samples of all crystals were isolated
and examined under a low-power optical polarizing stereomicroscope to determine the
homogeneity of samples, to distinguish conglomerates (3) or crystals of pure enantiomer (1)
from racemic crystals (2) of 3PLA based on their distinctive habits (1 and 3 form needles, 2
forms blocks), and to ensure that single crystals analyzed by SXRD were not twinned or cracked.
b)
Au
drug solution (10 drops)
Au
~50% crystals formed in solution (5 mg)
AuRT
32-48h
a)
96
PXRD data were collected on a Bruker-AXS D8-Advance diffractometer using Cu-Kα radiation
with X-rays generated at 40kV and 40mA. Bulk samples of crystals were placed in a 20 mm x 16
mm x 1 mm well in a glass sample holder and scanned from 5-50° (2θ) in 0.05° steps at a scan
rate of 2°/min. The orientation of the crystals relative to the interface between the SAM and the
solution were analyzed using the θ-2θ scan mode by scanning samples of crystals still attached to
gold substrates and then comparing the relative intensities of reflections to those obtained from
bulk samples of crystals to determine whether face-selective growth occurred on SAMs. In the θ-
2θ scan mode, only diffracting planes parallel to the plane of the substrate (nucleating planes)
produce significant diffraction intensity.17
The peaks present in the powder patterns represent
therefore, the predominant crystallographic orientations of the crystals.17
Determination of crystal structures of L-3PLA (1) and racemic 3PLA (2) and indexing of
crystalline faces of L-3PLA. The crystal structures of enantiomerically pure L-3PLA (1) and
racemic 3PLA (2) were determined at 100K to elucidate differences in crystal packing, to index
and catalog the major faces of the two crystalline forms, and to identify functional groups
exposed on those faces in contact with the surface of substrates or exposed to solutes in solution
during growth of crystals. We recently reported the details of data collection, solution and
refinement of structures, and crystallographic analysis of the molecular structures, crystal
packing, and intermolecular interactions present in crystals of 1 and 2, as well analysis and
comparison of the thermal stabilities, densities, and spectroscopic properties of 1-3 in a separate
publication.45
Discussion of the crystal structures of 1-3 and figures depicting crystal packing
presented here are derived from that work. Faces present on single crystals of 1 and 2 with habits
representative of bulk samples of those crystalline forms were indexed using the Crystal Faces
97
module in the SHELXTL software62
after determining the unit cells. Video images were then
collected by rotating the crystals through 360° on a micromount oriented perpendicular to the
video camera and X-ray beam, and the miller indices of individual crystal faces identified using
the T- tool in the SHELXTL software.62
Thermal analysis and determination of enantiomeric composition of bulk crystalline
samples of 3PLA. Samples of all crystals were analyzed by DSC to identify the crystal forms
present (i.e., 1, 2 or 3) and determine enantiomeric composition. Analysis by DSC was carried
out using a DSC 2920 Modulated DSC (TA Instruments). Bulk samples of crystals were ground
using a mortar and pestle, and 3-5 mg of ground sample was placed in hermetically sealed
aluminum pans and then heated from RT to 150°C at a rate of 10 °C /min. A second DSC trace
was acquired for samples that featured an endothermic peak corresponding to racemic crystals by
heating a fresh sample from RT to 150 °C at a rate of 4 °C/min. A slower rate of heating was
required in order to accurately follow the transformation of metastable racemic crystals (m.p. =
93.4-96.7 °C) into the more stable conglomerates (m.p. = 94.8-97.7 °C). Melting ranges for each
crystal form were determined by recording the temperatures at the onset and termination of
melting.44,46
Onset temperatures of melt endotherms were used to determine the enantiomeric
composition of samples using the Schröder-Van Laar equation (Eqn 4.1),44,46
Eqn 4.1
where x is the mole fraction of pure enantiomer, ΔHA is the enthalpy of fusion of pure
enantiomer in J/mol, TA is the onset melting point of pure enantiomer in °K, and TR is the onset
98
melting point of the racemate in °K. Enthalpies of fusion were determined by integrating the
areas under the corresponding peaks, and then substituted into Eqn 4.1 to calculate the mole
fraction of enantiomers and determine the enantiomeric excess. A binary phase diagram for the
D and L enantiomers of 3PLA was constructed using DSC data from a series of binary mixtures
of the two enantiomers prepared by grinding the two components together to form homogenous
mixtures differing in composition by mole fractions of 0.1. Samples varying in smaller
increments of mole fraction 0.05 were used for mixtures containing 40-60% of a given
enantiomer to more accurately quantify the region of maximum melting point depression at mole
fraction 0.5 corresponding to a racemic mixture of homochiral crystals (conglomerates). DSC
data was collected using 2 mg samples varying in composition from 100% D-3PLA to 100% L-
3PLA.
4.4 RESULTS AND DISCUSSION
Formation of achiral and chiral SAMs. SAMs were prepared by immersing 25 mm x 25 mm
gold slides in 2 mM ethanolic solutions of the corresponding achiral thiols and 2 mM aqueous
solutions of the chiral thiols at RT for one day to allow sufficient time for SAMs to fully form.
Although we did not investigate the kinetics of growth of SAMs, others have shown that
formation of mature SAMs on gold from achiral thiols dodecanethiol (SAM I), 11-
mercaptodecanol (SAM II), and 11-mercaptoundecanoic acid (SAM III),54,63,64
as well as chiral
thiols L-cysteine (SAM IV), N-acetyl-L-cysteine (SAM V), and D-cysteine (SAM VI) is
complete within 24 h.24,34,36,37,65
Analysis of the grazing-angle IR spectra (Figures 4.3-4.6),
contact angle and ellipsometry data for SAMs I-VI and bare gold shown in Table 4.3 was carried
out to verify the presence of SAMs, and to quantify changes in surface energy resulting from
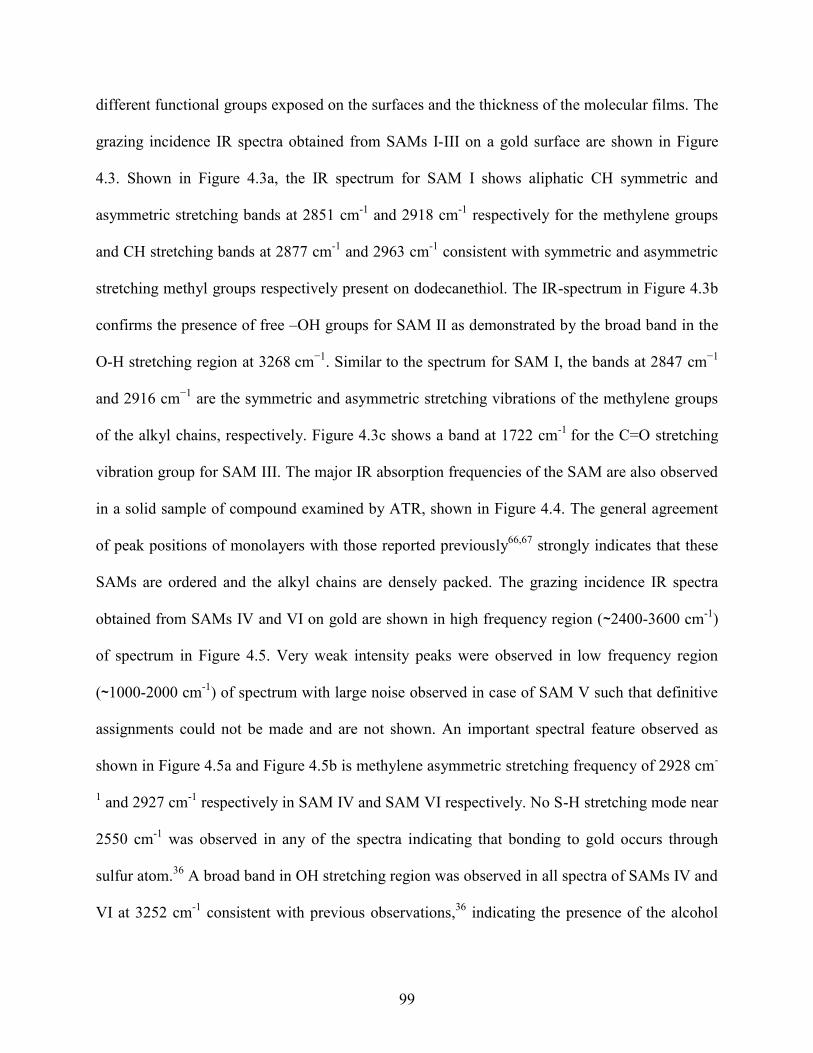
99
different functional groups exposed on the surfaces and the thickness of the molecular films. The
grazing incidence IR spectra obtained from SAMs I-III on a gold surface are shown in Figure
4.3. Shown in Figure 4.3a, the IR spectrum for SAM I shows aliphatic CH symmetric and
asymmetric stretching bands at 2851 cm-1
and 2918 cm-1
respectively for the methylene groups
and CH stretching bands at 2877 cm-1
and 2963 cm-1
consistent with symmetric and asymmetric
stretching methyl groups respectively present on dodecanethiol. The IR-spectrum in Figure 4.3b
confirms the presence of free –OH groups for SAM II as demonstrated by the broad band in the
O-H stretching region at 3268 cm−1
. Similar to the spectrum for SAM I, the bands at 2847 cm−1
and 2916 cm−1
are the symmetric and asymmetric stretching vibrations of the methylene groups
of the alkyl chains, respectively. Figure 4.3c shows a band at 1722 cm-1
for the C=O stretching
vibration group for SAM III. The major IR absorption frequencies of the SAM are also observed
in a solid sample of compound examined by ATR, shown in Figure 4.4. The general agreement
of peak positions of monolayers with those reported previously66,67
strongly indicates that these
SAMs are ordered and the alkyl chains are densely packed. The grazing incidence IR spectra
obtained from SAMs IV and VI on gold are shown in high frequency region (~2400-3600 cm-1
)
of spectrum in Figure 4.5. Very weak intensity peaks were observed in low frequency region
(~1000-2000 cm-1
) of spectrum with large noise observed in case of SAM V such that definitive
assignments could not be made and are not shown. An important spectral feature observed as
shown in Figure 4.5a and Figure 4.5b is methylene asymmetric stretching frequency of 2928 cm-
1 and 2927 cm
-1 respectively in SAM IV and SAM VI respectively. No S-H stretching mode near
2550 cm-1
was observed in any of the spectra indicating that bonding to gold occurs through
sulfur atom.36
A broad band in OH stretching region was observed in all spectra of SAMs IV and
VI at 3252 cm-1
consistent with previous observations,36
indicating the presence of the alcohol
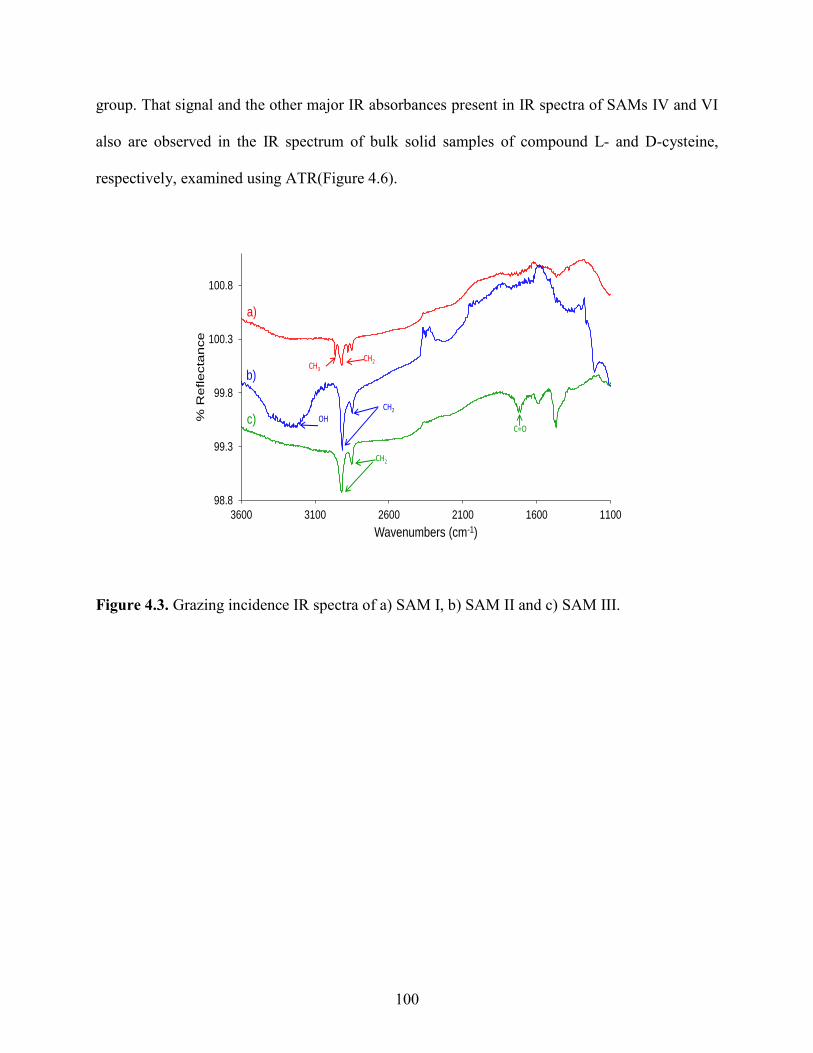
100
group. That signal and the other major IR absorbances present in IR spectra of SAMs IV and VI
also are observed in the IR spectrum of bulk solid samples of compound L- and D-cysteine,
respectively, examined using ATR(Figure 4.6).
Figure 4.3. Grazing incidence IR spectra of a) SAM I, b) SAM II and c) SAM III.
98.8
99.3
99.8
100.3
100.8
110016002100260031003600
% R
efle
cta
nce
Wavenumbers (cm-1)
OH
CH2
C=O
CH2CH3
CH2
a)
b)
c)
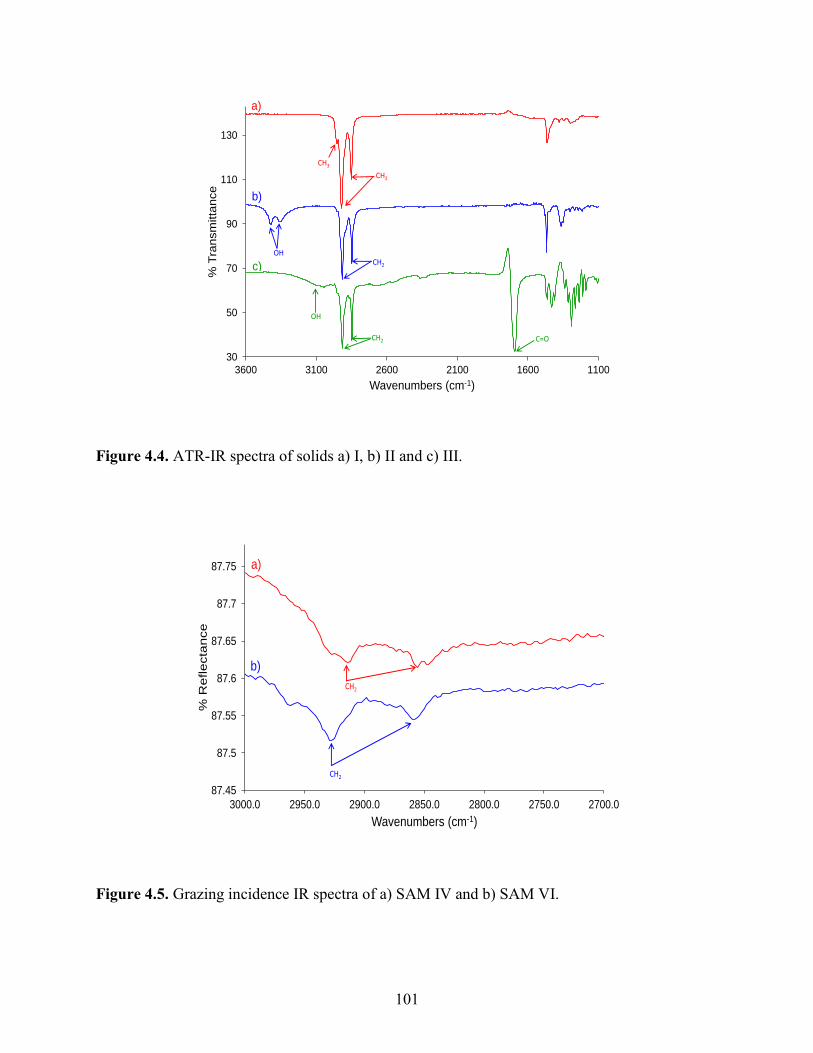
101
Figure 4.4. ATR-IR spectra of solids a) I, b) II and c) III.
Figure 4.5. Grazing incidence IR spectra of a) SAM IV and b) SAM VI.
30
50
70
90
110
130
110016002100260031003600
% T
ransm
itta
nce
Wavenumbers (cm-1)
CH2
CH2
c)
CH3
C=OCH2
OH
OH
a)
b)
87.45
87.5
87.55
87.6
87.65
87.7
87.75
2700.02750.02800.02850.02900.02950.03000.0
% R
eflecta
nce
Wavenumbers (cm-1)
CH2
CH2
a)
b)
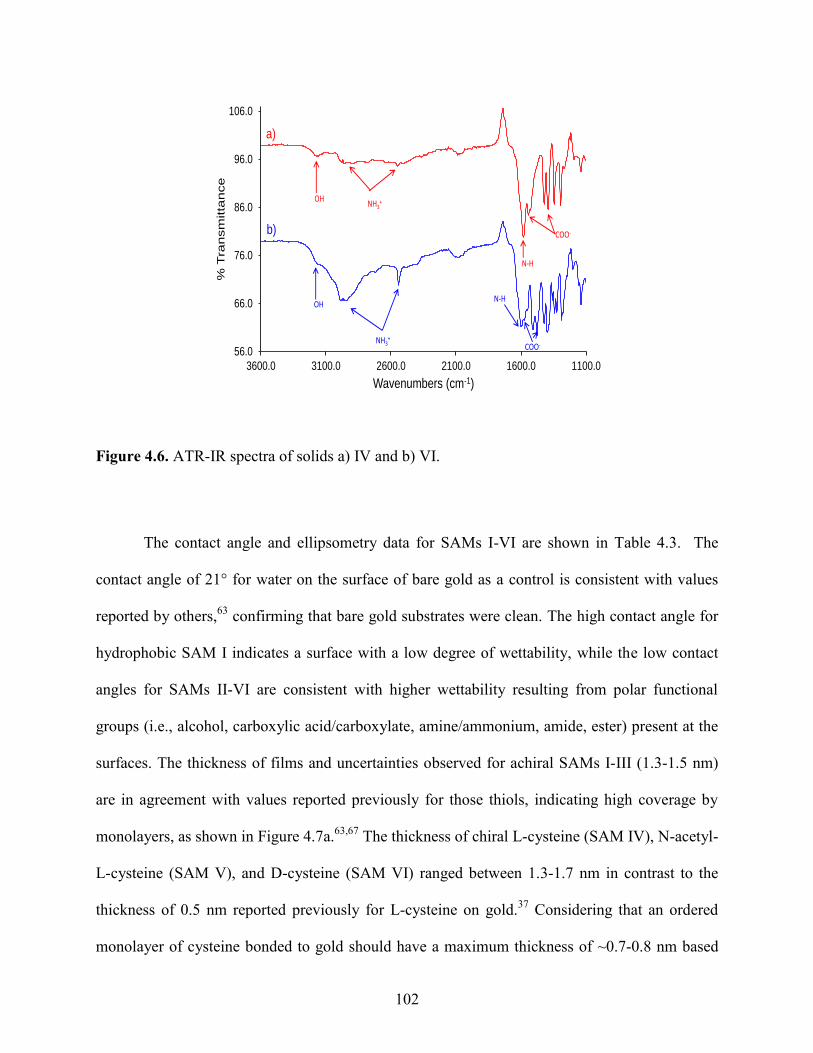
102
Figure 4.6. ATR-IR spectra of solids a) IV and b) VI.
The contact angle and ellipsometry data for SAMs I-VI are shown in Table 4.3. The
contact angle of 21° for water on the surface of bare gold as a control is consistent with values
reported by others,63
confirming that bare gold substrates were clean. The high contact angle for
hydrophobic SAM I indicates a surface with a low degree of wettability, while the low contact
angles for SAMs II-VI are consistent with higher wettability resulting from polar functional
groups (i.e., alcohol, carboxylic acid/carboxylate, amine/ammonium, amide, ester) present at the
surfaces. The thickness of films and uncertainties observed for achiral SAMs I-III (1.3-1.5 nm)
are in agreement with values reported previously for those thiols, indicating high coverage by
monolayers, as shown in Figure 4.7a.63,67
The thickness of chiral L-cysteine (SAM IV), N-acetyl-
L-cysteine (SAM V), and D-cysteine (SAM VI) ranged between 1.3-1.7 nm in contrast to the
thickness of 0.5 nm reported previously for L-cysteine on gold.37
Considering that an ordered
monolayer of cysteine bonded to gold should have a maximum thickness of ~0.7-0.8 nm based
56.0
66.0
76.0
86.0
96.0
106.0
1100.01600.02100.02600.03100.03600.0
% T
ransm
itta
nce
Wavenumbers (cm-1)
NH3+
N-H
COO-
NH3+OH
OH
COO-
N-H
a)
b)
103
on the crystallographic length of cysteine (~0.6 nm),35
the observed values suggest that L- and
D-cysteine and N-acetyl-L-cysteine form bilayers on gold, as illustrated in Figure 4.7b and
Figure 4.7c. Previous analysis of films of L-cysteine adsorbed on gold by Liedberg using X-ray
photoelectron spectroscopy showed formation of 1:1 bilayers consisting of monolayers of
cysteine covalently bonded to gold covered by an overlayer of cysteine in agreement with our
ellipsometric data for SAMs IV and VI.37
Liedberg proposed that hydrogen-bonding interactions
between the charged ammonium and carboxylate groups are responsible for chemisorption of the
second layer, thereby orienting the thiol groups in the overlayer away from the surface.37
Although noncovalent assembly of bilayers via charge-assisted hydrogen bonding is reasonable
for zwitterionic molecules such as cysteine, it is unclear why N-acetyl-L-cysteine (SAM V)
should form hydrogen-bonded bilayers in which the overlayer of cysteine is strongly bound
given the absence of charged ammonium donors and carboxylate acceptors. The increase in
contact angle by 27° and film thickness by 0.2-0.3 nm observed for SAM V compared to SAMs
IV and IV indicates N-acetyl-L-cysteine presents a lower-energy surface that is consistent with a
less-ordered overlayer in which the more hydrophobic acetyl group is exposed at or near the
surface rather than buried at the interface between the two layers. Given that bilayers in which
the overlayer is bonded noncovalently could produce small amounts of soluble thiol that might
lead to homogeneous rather than heterogeneous enantioseparation, we examined crystallization
of racemic 3PLA in the presence of 10µM L-cysteine and also in the presence of 10µM D-
cysteine in the crystallization solution to determine examine what effect, if any, small amounts of
soluble L-cysteine might have on enantioseparation. The results of those experiments are
discussed later in this chapter.
Table 4.3. Contact angle and ellipsometry data for SAMs I-VI.
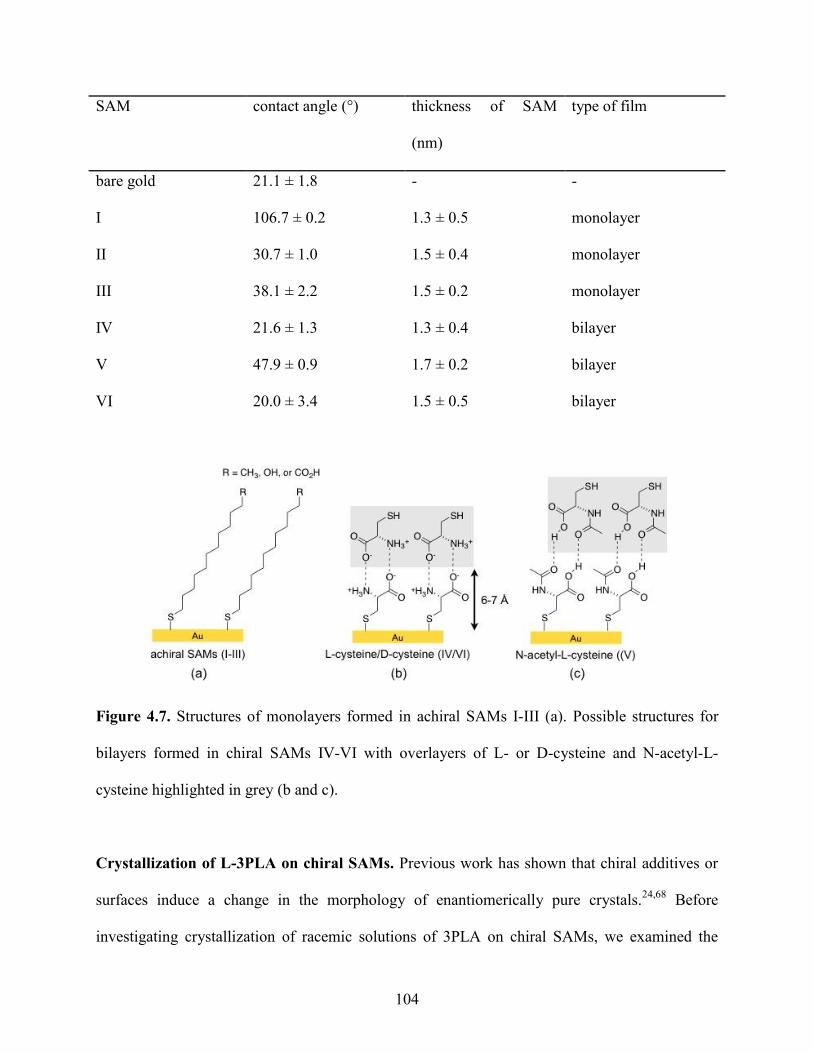
104
SAM contact angle (°) thickness of SAM
(nm)
type of film
bare gold 21.1 ± 1.8 - -
I 106.7 ± 0.2 1.3 ± 0.5 monolayer
II 30.7 ± 1.0 1.5 ± 0.4 monolayer
III 38.1 ± 2.2 1.5 ± 0.2 monolayer
IV 21.6 ± 1.3 1.3 ± 0.4 bilayer
V 47.9 ± 0.9 1.7 ± 0.2 bilayer
VI 20.0 ± 3.4 1.5 ± 0.5 bilayer
Figure 4.7. Structures of monolayers formed in achiral SAMs I-III (a). Possible structures for
bilayers formed in chiral SAMs IV-VI with overlayers of L- or D-cysteine and N-acetyl-L-
cysteine highlighted in grey (b and c).
Crystallization of L-3PLA on chiral SAMs. Previous work has shown that chiral additives or
surfaces induce a change in the morphology of enantiomerically pure crystals.24,68
Before
investigating crystallization of racemic solutions of 3PLA on chiral SAMs, we examined the
105
crystallization behavior of homochiral L-3PLA on L- and D-cysteine in order to determine if
crystallization of L-3PLA grown on chiral SAMs leads to face-selective growth and whether the
crystallographic orientation is different on L- and D-cysteine. The purpose of this study was to
elucidate molecular interactions between L-3PLA and cysteine SAMs that will tell us how
crystals of the pure enantiomers of the same or opposite chirality to that of the SAM nucleate as
opposed to the growth of the racemic crystals. We also wanted to determine if the morphology of
crystals of L-3PLA is altered on chiral SAMs and whether new faces develop as opposed to the
needles usually observed on glass substrates. A systematic study on the morphological changes
of L-3PLA as a function of the stereochemistry of the SAM and identification of the faces may
help us learn structural correlation between morphology of the crystals of the pure enantiomer
and the absolute configuration of the SAM. We also wanted to determine if the rates of growth of
L-3PLA differ on L- and D-cysteine which is important because such differences would indicate
enantiomeric discrimination that are essential in separating the two enantiomers when racemic
solutions are crystallized. Thus, we wanted to compare crystallization behavior of L-3PLA to
that of racemic 3-PLA to see if the behavior is consistent and any differences likely are due to
the opposite enantiomer in solution affecting either the template (leading up to nucleation) or
growth of the crystal after nucleation has occurred. Herein we discuss the results of facial
selectivity and change in the morphology of L-3PLA as observed on chiral SAMs.
Face selective nucleation of L-3PLA on chiral SAMs. Crystals of L-3PLA grown from water
on chiral SAMs were analyzed by PXRD while they were still attached to the gold substrates and
the powder traces were compared to L-3PLA crystallized from water in glass vials. A
comparison between these surfaces was carried out to determine if oriented growth of crystals
106
occurred on specific faces indicating that templating occurred. The crystals grown from water in
glass vials were removed from the vials and were not left in contact with the glass substrate.
Those samples contained an isotropic distribution of crystals in all orientations, and therefore
peaks corresponding to all of the crystalline planes were present in that PXRD trace. Only those
crystal faces and the corresponding crystalline planes within crystals that are parallel to the
surface give rise to peaks in a PXRD trace. Therefore, analysis of bulk samples of crystals still in
contact with SAMs via PXRD provides a convenient means to determine if crystals grow with
certain faces preferentially in contact with the SAM and what the distribution of different faces
in contact with SAMs is. As shown in Figure 4.8, the PXRD trace for crystals of L-3PLA grown
on glass exhibits a number of peaks indicating the crystals were oriented with a variety of
different faces in contact with glass signifying an essentially isotropic distribution of orientations
such that growth is not favored on any particular face. In contrast, the PXRD trace for 1 grown
on SAM IV (red) exhibited a single very intense peak at 2θ = 20.94° corresponding to the (004)
plane, indicating that crystals grew oriented predominately on that face. That result clearly
showed that templated nucleation occurred preferentially on the (004) face to the exclusion of
other faces on SAM IV. Also shown in Figure 4.8 is the PXRD trace (blue) for crystals of L-
3PLA grown on SAM VI, which also shows a similarly intense peak at (004), indicating
templated growth favoring the same face. We demonstrate later that templated growth occurs on
SAMs IV and IV due to maximization of strong hydrogen-bonding interactions between the
surfaces and carboxylic acid and alcohol functional groups exposed on at that face. These
observations were confirmed by repeating the measurements on five different SAMs. All of the
above experiments involved only crystallization of L-3PLA on SAMs IV and VI indicating that
the chiral surface templates the growth of 1 predominantly on the (004) face.17,32,69
Although the
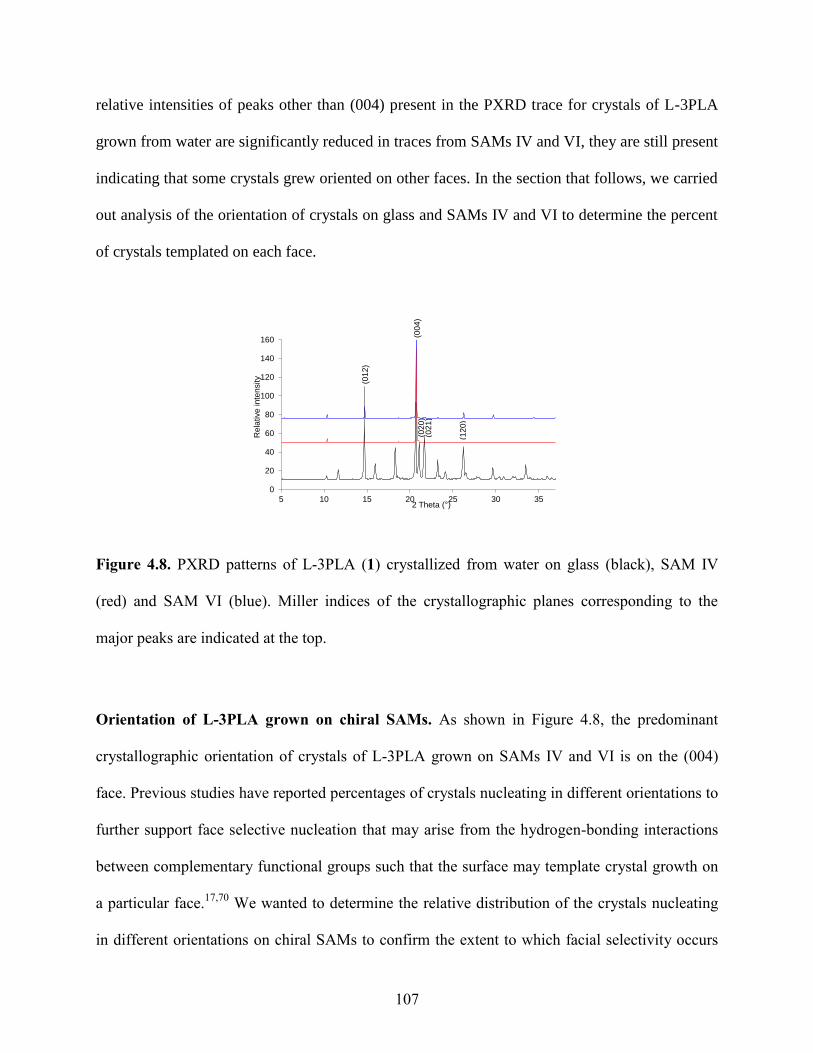
107
relative intensities of peaks other than (004) present in the PXRD trace for crystals of L-3PLA
grown from water are significantly reduced in traces from SAMs IV and VI, they are still present
indicating that some crystals grew oriented on other faces. In the section that follows, we carried
out analysis of the orientation of crystals on glass and SAMs IV and VI to determine the percent
of crystals templated on each face.
Figure 4.8. PXRD patterns of L-3PLA (1) crystallized from water on glass (black), SAM IV
(red) and SAM VI (blue). Miller indices of the crystallographic planes corresponding to the
major peaks are indicated at the top.
Orientation of L-3PLA grown on chiral SAMs. As shown in Figure 4.8, the predominant
crystallographic orientation of crystals of L-3PLA grown on SAMs IV and VI is on the (004)
face. Previous studies have reported percentages of crystals nucleating in different orientations to
further support face selective nucleation that may arise from the hydrogen-bonding interactions
between complementary functional groups such that the surface may template crystal growth on
a particular face.17,70
We wanted to determine the relative distribution of the crystals nucleating
in different orientations on chiral SAMs to confirm the extent to which facial selectivity occurs
0
20
40
60
80
100
120
140
160
5 10 15 20 25 30 35
Rela
tive inte
nsity
2 Theta ( )
(012)
(004)
(02
0)
(021)
(120)
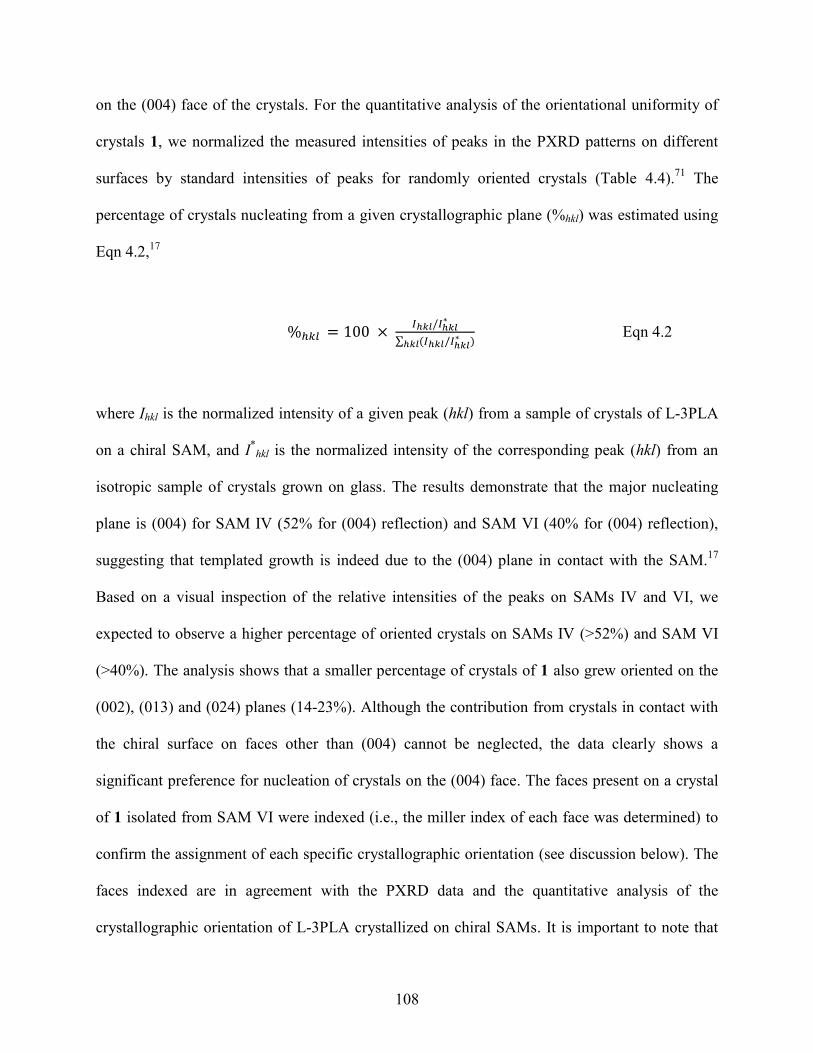
108
on the (004) face of the crystals. For the quantitative analysis of the orientational uniformity of
crystals 1, we normalized the measured intensities of peaks in the PXRD patterns on different
surfaces by standard intensities of peaks for randomly oriented crystals (Table 4.4).71
The
percentage of crystals nucleating from a given crystallographic plane (%hkl) was estimated using
Eqn 4.2,17
∑
Eqn 4.2
where Ihkl is the normalized intensity of a given peak (hkl) from a sample of crystals of L-3PLA
on a chiral SAM, and I*
hkl is the normalized intensity of the corresponding peak (hkl) from an
isotropic sample of crystals grown on glass. The results demonstrate that the major nucleating
plane is (004) for SAM IV (52% for (004) reflection) and SAM VI (40% for (004) reflection),
suggesting that templated growth is indeed due to the (004) plane in contact with the SAM.17
Based on a visual inspection of the relative intensities of the peaks on SAMs IV and VI, we
expected to observe a higher percentage of oriented crystals on SAMs IV (>52%) and SAM VI
(>40%). The analysis shows that a smaller percentage of crystals of 1 also grew oriented on the
(002), (013) and (024) planes (14-23%). Although the contribution from crystals in contact with
the chiral surface on faces other than (004) cannot be neglected, the data clearly shows a
significant preference for nucleation of crystals on the (004) face. The faces present on a crystal
of 1 isolated from SAM VI were indexed (i.e., the miller index of each face was determined) to
confirm the assignment of each specific crystallographic orientation (see discussion below). The
faces indexed are in agreement with the PXRD data and the quantitative analysis of the
crystallographic orientation of L-3PLA crystallized on chiral SAMs. It is important to note that
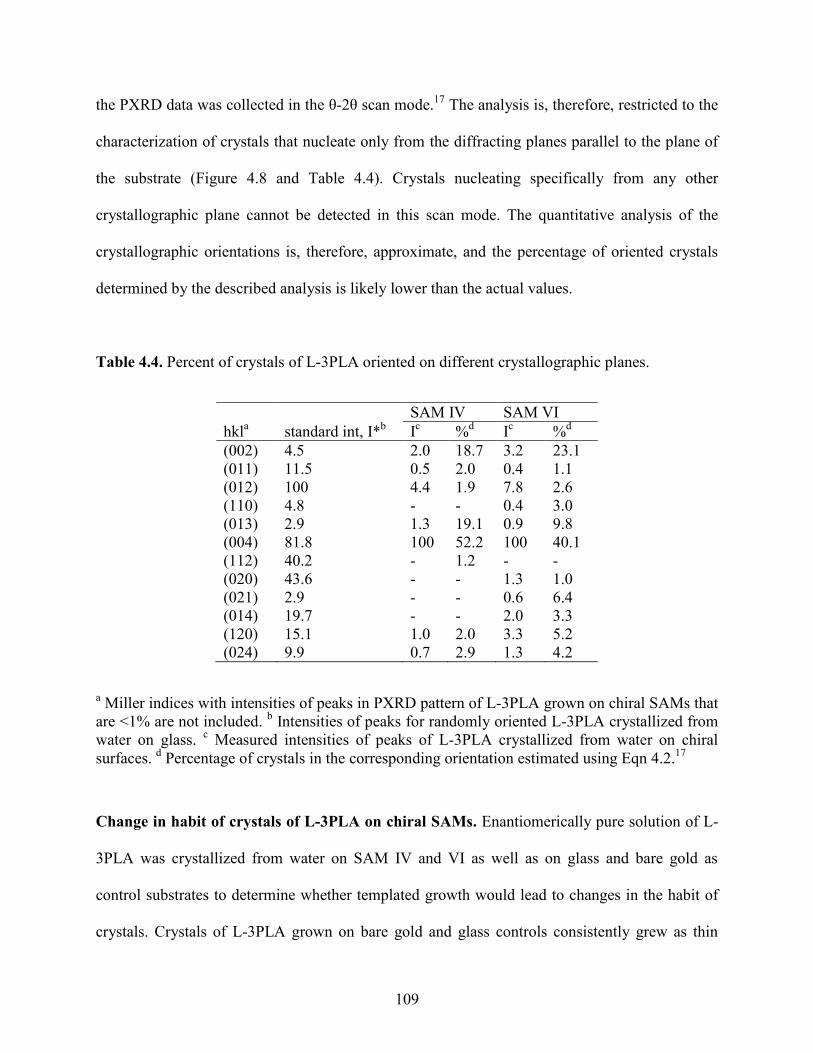
109
the PXRD data was collected in the θ-2θ scan mode.17
The analysis is, therefore, restricted to the
characterization of crystals that nucleate only from the diffracting planes parallel to the plane of
the substrate (Figure 4.8 and Table 4.4). Crystals nucleating specifically from any other
crystallographic plane cannot be detected in this scan mode. The quantitative analysis of the
crystallographic orientations is, therefore, approximate, and the percentage of oriented crystals
determined by the described analysis is likely lower than the actual values.
Table 4.4. Percent of crystals of L-3PLA oriented on different crystallographic planes.
SAM IV SAM VI
hkla standard int, I*
b I
c %
d I
c %
d
(002) 4.5 2.0 18.7 3.2 23.1
(011) 11.5 0.5 2.0 0.4 1.1
(012) 100 4.4 1.9 7.8 2.6
(110) 4.8 - - 0.4 3.0
(013) 2.9 1.3 19.1 0.9 9.8
(004) 81.8 100 52.2 100 40.1
(112) 40.2 - 1.2 - -
(020) 43.6 - - 1.3 1.0
(021) 2.9 - - 0.6 6.4
(014) 19.7 - - 2.0 3.3
(120) 15.1 1.0 2.0 3.3 5.2
(024) 9.9 0.7 2.9 1.3 4.2
a Miller indices with intensities of peaks in PXRD pattern of L-3PLA grown on chiral SAMs that
are <1% are not included. b Intensities of peaks for randomly oriented L-3PLA crystallized from
water on glass. c Measured intensities of peaks of L-3PLA crystallized from water on chiral
surfaces. d Percentage of crystals in the corresponding orientation estimated using Eqn 4.2.
17
Change in habit of crystals of L-3PLA on chiral SAMs. Enantiomerically pure solution of L-
3PLA was crystallized from water on SAM IV and VI as well as on glass and bare gold as
control substrates to determine whether templated growth would lead to changes in the habit of
crystals. Crystals of L-3PLA grown on bare gold and glass controls consistently grew as thin
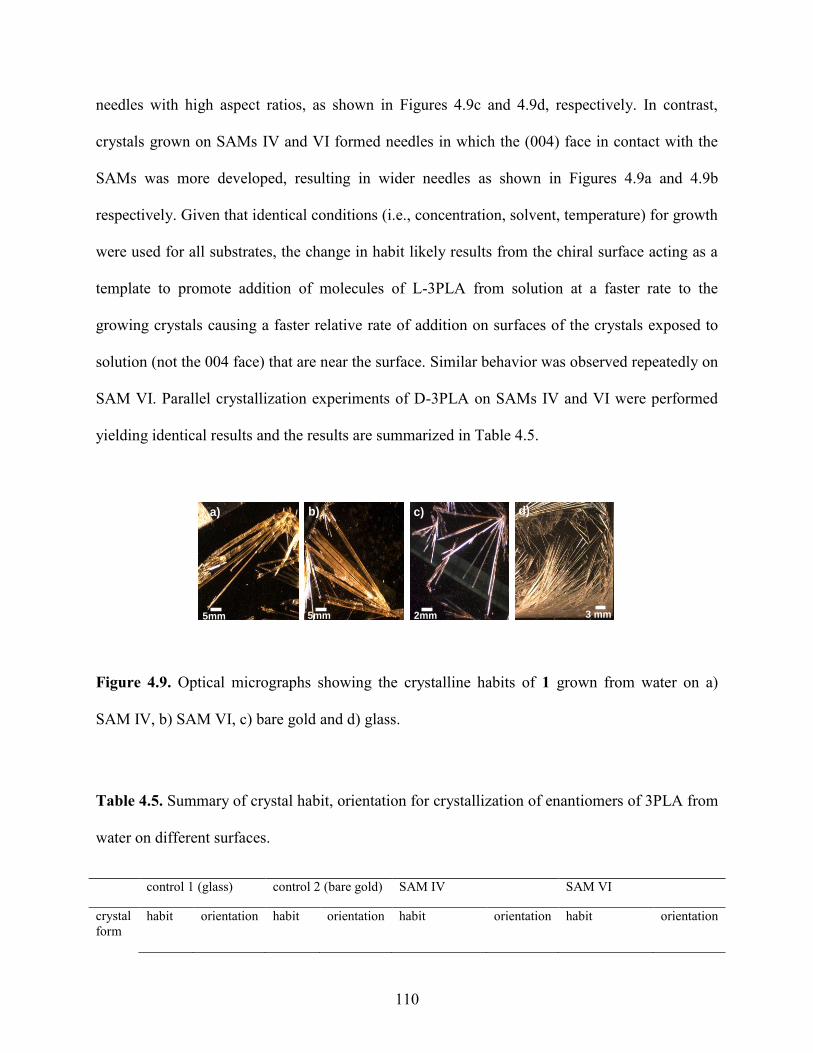
110
needles with high aspect ratios, as shown in Figures 4.9c and 4.9d, respectively. In contrast,
crystals grown on SAMs IV and VI formed needles in which the (004) face in contact with the
SAMs was more developed, resulting in wider needles as shown in Figures 4.9a and 4.9b
respectively. Given that identical conditions (i.e., concentration, solvent, temperature) for growth
were used for all substrates, the change in habit likely results from the chiral surface acting as a
template to promote addition of molecules of L-3PLA from solution at a faster rate to the
growing crystals causing a faster relative rate of addition on surfaces of the crystals exposed to
solution (not the 004 face) that are near the surface. Similar behavior was observed repeatedly on
SAM VI. Parallel crystallization experiments of D-3PLA on SAMs IV and VI were performed
yielding identical results and the results are summarized in Table 4.5.
Figure 4.9. Optical micrographs showing the crystalline habits of 1 grown from water on a)
SAM IV, b) SAM VI, c) bare gold and d) glass.
Table 4.5. Summary of crystal habit, orientation for crystallization of enantiomers of 3PLA from
water on different surfaces.
control 1 (glass) control 2 (bare gold) SAM IV SAM VI
crystal
form
habit orientation habit orientation habit orientation habit orientation
5mm
a)
5mm
b) c)
2mm 3 mm
d)
111
L-
3PLA
needles isotropic needles isotropic thinner, longer
needles
(004) thicker, longer
needles
(004)
D-
3PLA
needles isotropic needles isotropic thicker,
polycrystalline
(004) polycrystalline (004)
Mechanism for templated nucleation and growth based on crystallographic analysis. It is
apparent from PXRD data (Figure 4.8) and the analysis of orientation (Table 4.4) that crystals of
1 nucleate and grow with the (004) face predominantly in contact with the surface of chiral
SAMs IV and SAM VI. That behavior provides compelling evidence that the most favorable
hydrogen bonding occurs between functional groups exposed on the (004) face of crystals and
molecules of L- or D-cysteine on the surface of the SAMs. Therefore, it was necessary to index a
crystal of L-3PLA to identify the crystallographic Miller planes corresponding to the dominant
faces present on a mature crystal, and determine which functional groups are exposed on those
faces by analyzing the corresponding crystallographic planes in the crystal structure of L-3PLA.
The process of indexing involved mounting a crystal of L-3PLA onto an X-ray diffractometer,
determining the relative orientations of the crystal and unit cell by collecting a approximately
100 reflections, and then determining the Miller indices of the observed crystal faces using the
video camera and indexing application in the Bruker SHELXTL software.62
Since both SAMs IV
and SAM VI exhibited oriented growth on the (004) face, we indexed and analyzed the principal
faces of a crystal of 1 isolated from SAM VI (Figure 4.10a). The crystal isolated for indexing
featured a crystalline habit that was representative of the various batches of crystals grown on
SAM VI. Indexing revealed that Miller indices of the faces present on the crystal of 1 were in
agreement with the Miller indices of peaks observed in the powder pattern of SAM VI.
Orthorhombic crystals of 1 grow as colorless needles (Chapter 3) elongated along the
crystallographic c-axis bound by (004) and (012) as the dominant faces with {100} as fastest
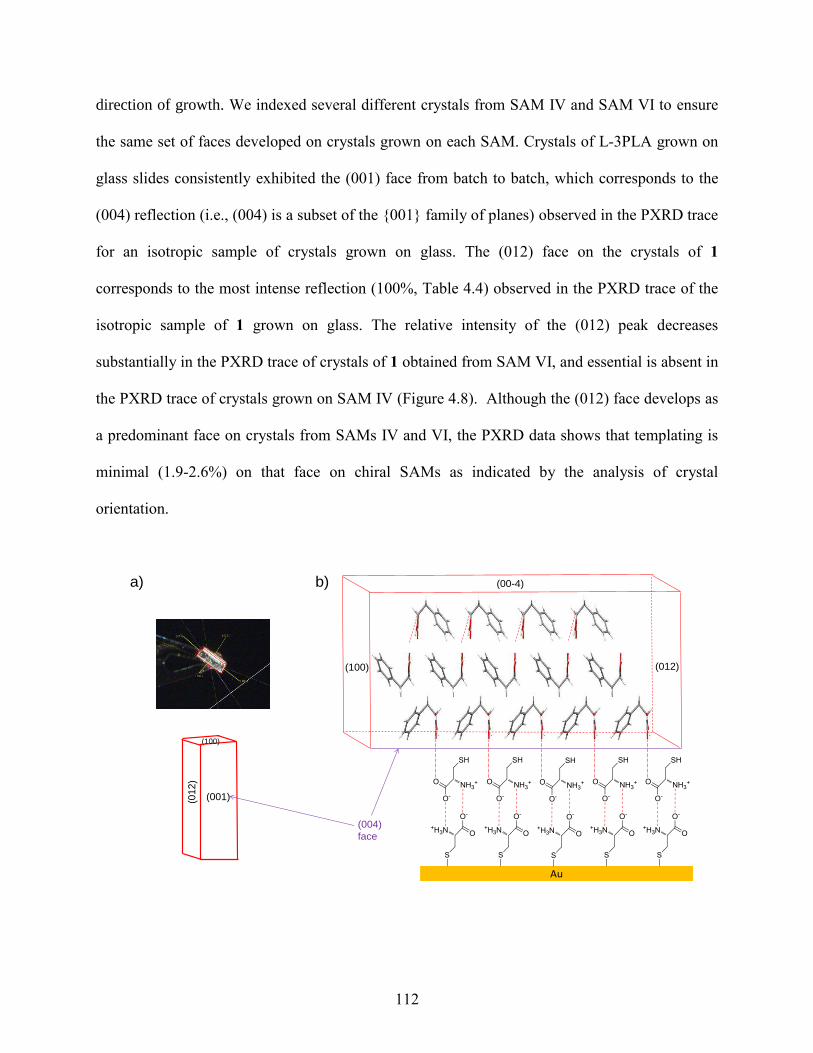
112
direction of growth. We indexed several different crystals from SAM IV and SAM VI to ensure
the same set of faces developed on crystals grown on each SAM. Crystals of L-3PLA grown on
glass slides consistently exhibited the (001) face from batch to batch, which corresponds to the
(004) reflection (i.e., (004) is a subset of the {001} family of planes) observed in the PXRD trace
for an isotropic sample of crystals grown on glass. The (012) face on the crystals of 1
corresponds to the most intense reflection (100%, Table 4.4) observed in the PXRD trace of the
isotropic sample of 1 grown on glass. The relative intensity of the (012) peak decreases
substantially in the PXRD trace of crystals of 1 obtained from SAM VI, and essential is absent in
the PXRD trace of crystals grown on SAM IV (Figure 4.8). Although the (012) face develops as
a predominant face on crystals from SAMs IV and VI, the PXRD data shows that templating is
minimal (1.9-2.6%) on that face on chiral SAMs as indicated by the analysis of crystal
orientation.
a)
(001)(01
2)
(100)
Au
b)
(004)
face
(00-4)
(100) (012)
113
Figure 4.10. a) Crystal of L-3PLA isolated from SAM VI and mounted on SXRD for indexing,
(top) with vector drawing illustrating the principal faces present on crystals of 1 (bottom) and b)
crystal structure of 1 with the (004) face docked in contact with surface of a bilayer of D-
cysteine, illustrating how templated nucleation of a crystal 1 on the (004) face maximizes the
density of hydrogen-bonding interactions between the carboxylic acid and alcohol groups
exposed on that face and molecules of cysteine on the surface. Hydrogen-bonding interactions
are depicted with red dashed lines.
Analysis of molecular packing in the crystal structure of 1 at each Miller plane indicated
by the PXRD data (Table 4.4) from crystals grown on glass was carried out to examine the
functional groups exposed at each Miller plane and the surface roughness. We hypothesized that
prior to nucleation of crystals, maximization of strong hydrogen-bonding interactions between
the neutral thiol and charged ammonium and carboxylate donors and acceptors on cysteine and
the carboxylic acid and alcohol donors and acceptors on L-3PLA would promote initial
aggregation of L-3PLA onto cysteine to form an ordered overlayer, or template. We also
hypothesized that the template would further influence the orientation of molecules of L-3PLA
adsorbed onto the surface, thereby promoting nucleation of crystals on crystallographic faces that
maximize the density of strong hydrogen-bonding interactions. Our analysis revealed that the
density of exposed COOH and OH groups was greatest on the (004) Miller plane when
compared to the other Miller planes in Table 4.4. We observed that each molecule at that plane is
oriented such that every molecule can participate in hydrogen bonding. Analysis of molecular
packing on the (012) and (021) Miller planes showed significant number of molecules oriented
with hydrophobic phenyl and methylene groups exposed, significantly reducing the potential for
114
hydrogen bonding compared to the (004) plane. Moreover, packing of molecules of L-3PLA at
the (004) plane generated a relatively smooth surface. In contrast, molecular packing at other
Miller planes generally produced undulating surfaces that were rough by comparison.
Considering that a smooth crystalline surface in contact with a SAM maximizes the number of
molecular contacts over a given area and that the density of exposed hydrogen-bonding groups
was greatest on the (004) face in crystals of 1, and that PXRD data and analysis of percent
orientation clearly reveal growth on the (004) face is favored on chiral SAMs IV and VI, we can
now explain why nucleation and growth of crystals occurs selectively with the (004) face in
contact with chiral SAMs of cysteine. Figure 4.10b shows a view of the molecular packing in a
crystal of 1 docked with the (004) plane in contact with the surface of a bilayer of L-cysteine
(Table 4.4 and Figure 4.7b). It is important to point out that the structure of the bilayer and the
intermolecular interactions shown in Figure 4.10b are somewhat hypothetical given that the
exact structural features of the bilayer of cysteine such as the packing density, degree of order,
registry between the bonded SAM and overlayer, molecular orientation of molecules of cysteine
in the overlayer, and hydrogen-bonding groups exposed at the surface are not known.
Nevertheless, the proposed model for templating between L-3PLA and cysteine on the surface is
reasonable and supported by our findings—namely that face-selective templating occurs on the
(004) face of crystals of 1 due to maximization of favorable intermolecular contacts on that face.
Our findings suggest that it should be possible, in principle, to determine a priori if face-
selective templating will occur on SAMs of cysteine and at which crystalline planes for other
drug systems where crystal structures that are known. Such prediction would require indexing
the faces of crystals, followed by computational analysis of the surface energies at each Miller
plane, by manual evaluation of the exposed functionality, or a combination of those methods.
115
Results of the crystallization of pure enantiomers of L-3PLA on chiral SAMs IV and VI
demonstrated that chiral surfaces of opposite chirality both templated growth of 1 on the (004)
face accompanied by a change in the habit of the crystal. The fact that growth occurred on the
same face on both surfaces supports the proposed model for templating where facial selectivity is
determined predominantly by maximization of strong hydrogen-bonding contacts. That result
also indicates that any difference in the surface interaction energies arising from diastereomeric
interactions on the two enantiomeric surfaces is small and does not bias growth to occur on other
crystalline faces with a lower density of hydrogen-bonding groups. The difference in
diastereomeric interaction energies, however, did noticeably affect the relative rates at which
crystals first appeared on the two surfaces. For example, crystals of L-3PLA consistently
appeared on SAM VI (D-cysteine) within ~16 hours, but did not appear on SAM IV until after
~72 hours under the same conditions. The exact opposite behavior was observed when D-3PLA
was crystallized on the two SAMs. The difference of ~56 hours between the appearance of
crystals shows that the chiral cysteine template clearly promotes faster nucleation of the
enantiomer of 3PLA with opposite optical rotation (i.e., D-cysteine favors L-3PLA, and vice
versa). That finding demonstrates conclusively that the difference in energy between the
diastereomeric interactions at the (004) face is great enough to be observed experimentally, and
provides compelling evidence that chiral templates of cysteine can distinguish between the two
enantiomers of 3-PLA.
Analysis of homochiral and heterochiral crystalline forms. We have previously discussed the
phase diagram and thermal behavior for 3PLA in chapter 3 and is shown in Figure 4.11a.
Crystals of 1 (green curve) melt between 122.1 and 125.7 °C (ΔHfus = 30.5 kJ/mol), which
116
agrees with the melting temperature reported in the literature. Crystals of 3 (red curve) melt
between 94.8 and 97.7 °C (ΔHfus = 30.5 kJ/mol) while the racemic crystal 2 melts 1.4 °C below
the conglomerate with a melting range between 93.4 and 96.7 °C (ΔHfus = 26.5 kJ/mol). The
phase diagram constructed using the experimentally measured onset melting temperatures for
different mixtures of enantiomers indicates that as the mole fraction of L-3PLA decreases from x
= 1.0 to x = 0.5, a gradual depression in the onset melting point from 122 to 95 °C was observed
indicating that the minor component D-3PLA acts as an impurity in the mixture giving rise to
two endotherms, one of which corresponds to the formation of a conglomerate with a maximum
depression of the melting point and a higher melting endotherm is attributed to the mixture with
an excess enantiomer as shown in Figure 4.11b. For mixtures with composition in the range of x
= 0.6 to x = 0.4, this second endotherm for the enantiomer in excess disappears from the DSC
trace such that the two endotherms merge to form a single peak and thus the onset temperatures
for the different mixtures could not be determined accurately. Therefore we have used the peak
max temperatures in this work to determine the enantiomeric composition of bulk samples of
crystals of 3PLA grown on different surfaces.
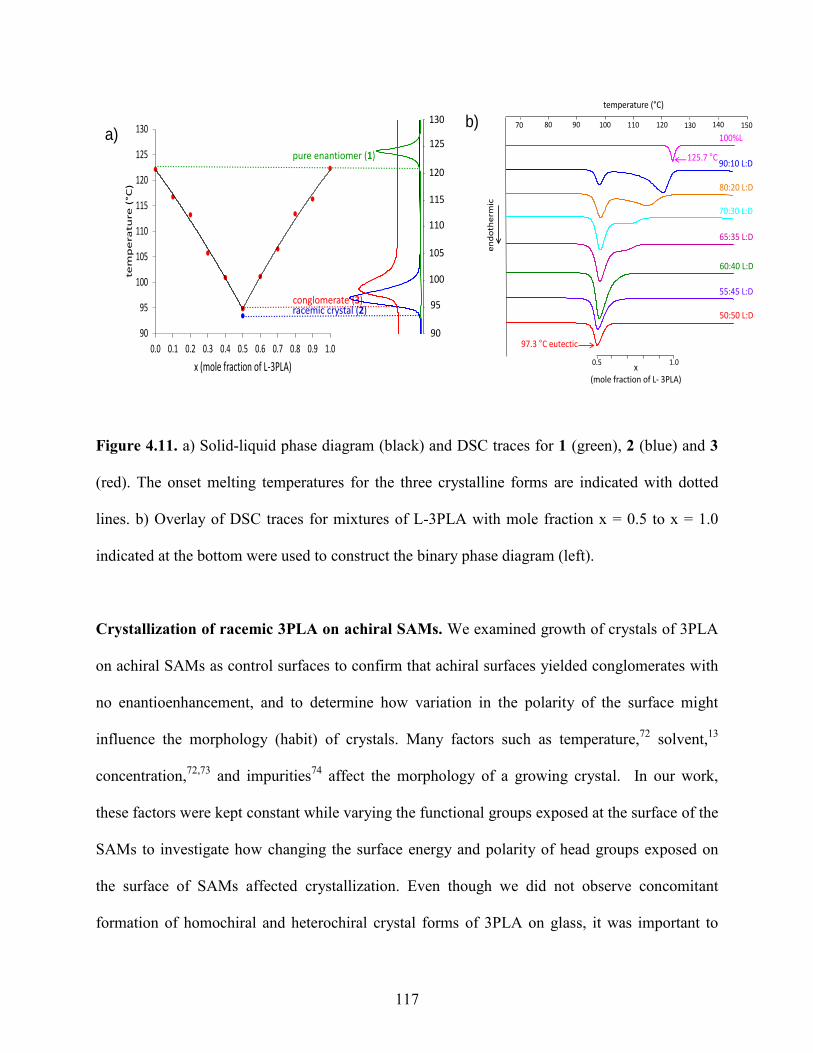
117
Figure 4.11. a) Solid-liquid phase diagram (black) and DSC traces for 1 (green), 2 (blue) and 3
(red). The onset melting temperatures for the three crystalline forms are indicated with dotted
lines. b) Overlay of DSC traces for mixtures of L-3PLA with mole fraction x = 0.5 to x = 1.0
indicated at the bottom were used to construct the binary phase diagram (left).
Crystallization of racemic 3PLA on achiral SAMs. We examined growth of crystals of 3PLA
on achiral SAMs as control surfaces to confirm that achiral surfaces yielded conglomerates with
no enantioenhancement, and to determine how variation in the polarity of the surface might
influence the morphology (habit) of crystals. Many factors such as temperature,72
solvent,13
concentration,72,73
and impurities74
affect the morphology of a growing crystal. In our work,
these factors were kept constant while varying the functional groups exposed at the surface of the
SAMs to investigate how changing the surface energy and polarity of head groups exposed on
the surface of SAMs affected crystallization. Even though we did not observe concomitant
formation of homochiral and heterochiral crystal forms of 3PLA on glass, it was important to
temperature (°C)
x(mole fraction of L- 3PLA)
0.5 1.0
en
do
the
rmic
14070 80 90 100 110 120 130 150
90:10 L:D
80:20 L:D
70:30 L:D
55:45 L:D
50:50 L:D
65:35 L:D
60:40 L:D
97.3 C eutectic
125.7 C
100%L
b)
90
95
100
105
110
115
120
125
130
0.0 0.1 0.2 0.3 0.4 0.5 0.6 0.7 0.8 0.9 1.0
tem
pe
ratu
re (
°C
)
x (mole fraction of L-3PLA)
racemic crystal (2)conglomerate (3)
pure enantiomer (1)
90
95
10
01
05
11
01
15
12
01
25
13
0
125
120
115
110
105
100
95
90
130
a)
118
examine the crystallization behavior of 3PLA from water on achiral SAMs to rule out the
possibility that achiral surfaces might produce mixtures of conglomerates and racemic crystals.
SAM I (Figure 4.7) was chosen to provide a hydrophobic surface incapable of forming hydrogen
bonds with solute molecules of 3PLA. SAMs II and III were chosen to provide hydrophilic
surfaces that would interact by forming strong hydrogen bonds with complementary polar
functional groups on 3PLA.We anticipated that SAMS I-III would favor formation of
conglomerates as observed on glass, but would not induce preferential enantioseparation in the
absence of chiral head groups. In addition, we hypothesized crystallization of racemic 3PLA on
polar SAMs II and III might exhibit some face-selective growth on faces of crystals at which
hydrogen-bonding groups are exposed.
Achiral SAMs promoted the formation of conglomerates. Growth of distinct single crystals
did not occur reliably on SAM I, as shown in Figure 4.12; instead, crystallization generally
resulted in polycrystalline films. Those few single crystals that did appear did not adhere to
surface of SAM I and were washed away when the crystallization solution was removed from the
surface and the substrate dried under nitrogen. Crystals grown on SAMs II, III and bare gold
formed needles similar in appearance to those grown on glass. Slight differences in morphology
are evident on SAM III (Figure 4.12c), where the needles appeared thinner and longer with a
higher aspect ratio when compared to those grown on glass. Thermal analysis of crystals isolated
from SAM II, SAM III and bare gold in five separate runs revealed that the crystals melted
between 94.8-97.9 °C, 96.7-97.1 °C and 94.7-97.6 °C, respectively as shown in Figure 4.13. No
endotherm indicative of racemic crystals was observed between 93.0-96.0 °C for any of the
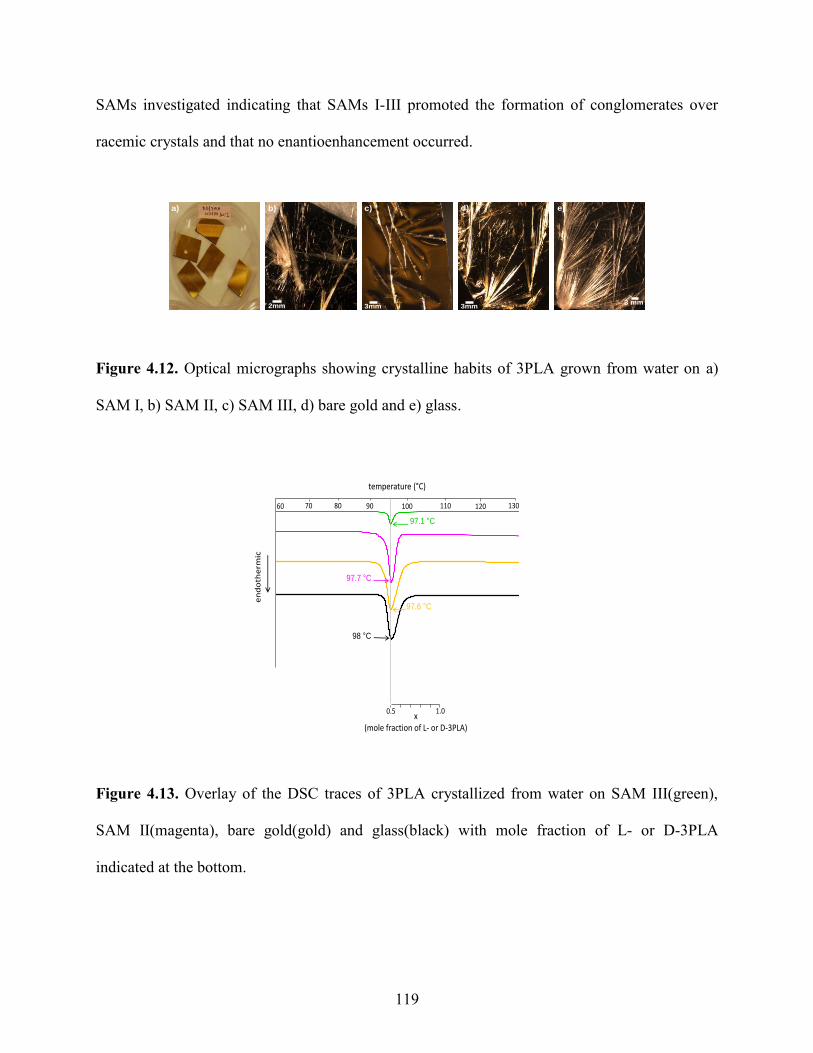
119
SAMs investigated indicating that SAMs I-III promoted the formation of conglomerates over
racemic crystals and that no enantioenhancement occurred.
Figure 4.12. Optical micrographs showing crystalline habits of 3PLA grown from water on a)
SAM I, b) SAM II, c) SAM III, d) bare gold and e) glass.
Figure 4.13. Overlay of the DSC traces of 3PLA crystallized from water on SAM III(green),
SAM II(magenta), bare gold(gold) and glass(black) with mole fraction of L- or D-3PLA
indicated at the bottom.
a)
2mm
b)
3mm
c) d)
3mm
e)
3 mm
97.1 C
98 C
97.7 C
97.6 C
en
do
the
rmic
temperature (°C)
13060 70 80 90 100 110 120
x(mole fraction of L- or D-3PLA)
0.5 1.0
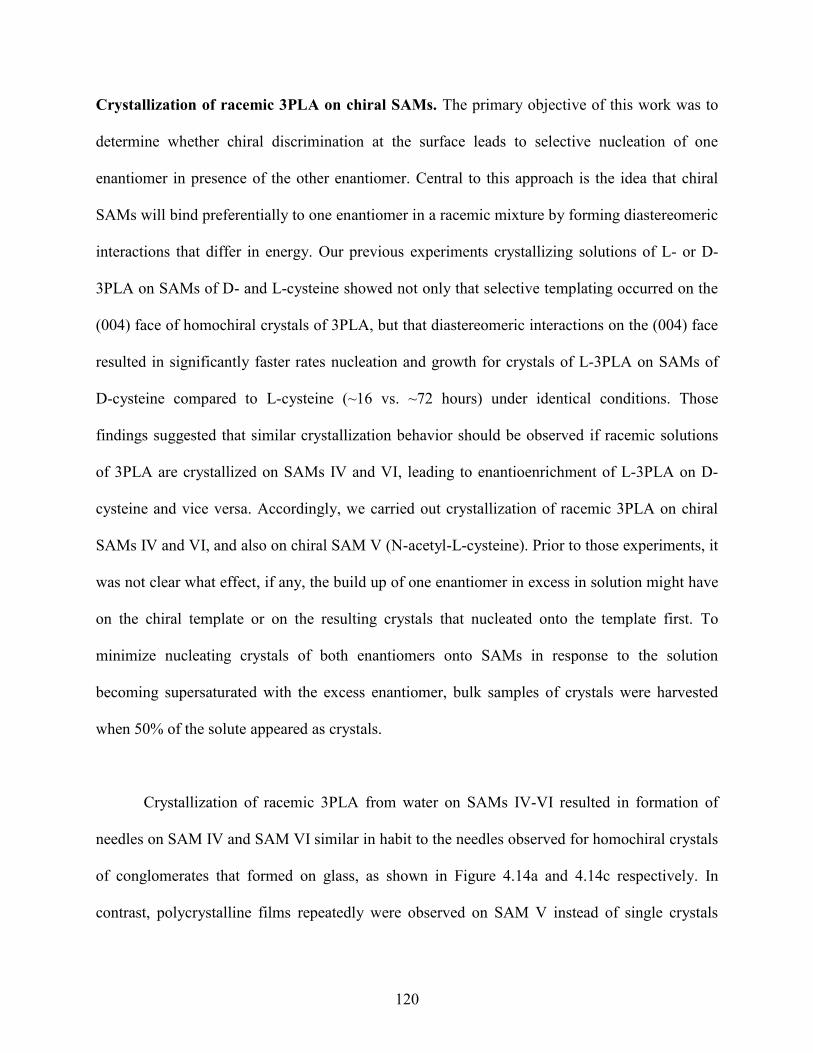
120
Crystallization of racemic 3PLA on chiral SAMs. The primary objective of this work was to
determine whether chiral discrimination at the surface leads to selective nucleation of one
enantiomer in presence of the other enantiomer. Central to this approach is the idea that chiral
SAMs will bind preferentially to one enantiomer in a racemic mixture by forming diastereomeric
interactions that differ in energy. Our previous experiments crystallizing solutions of L- or D-
3PLA on SAMs of D- and L-cysteine showed not only that selective templating occurred on the
(004) face of homochiral crystals of 3PLA, but that diastereomeric interactions on the (004) face
resulted in significantly faster rates nucleation and growth for crystals of L-3PLA on SAMs of
D-cysteine compared to L-cysteine (~16 vs. ~72 hours) under identical conditions. Those
findings suggested that similar crystallization behavior should be observed if racemic solutions
of 3PLA are crystallized on SAMs IV and VI, leading to enantioenrichment of L-3PLA on D-
cysteine and vice versa. Accordingly, we carried out crystallization of racemic 3PLA on chiral
SAMs IV and VI, and also on chiral SAM V (N-acetyl-L-cysteine). Prior to those experiments, it
was not clear what effect, if any, the build up of one enantiomer in excess in solution might have
on the chiral template or on the resulting crystals that nucleated onto the template first. To
minimize nucleating crystals of both enantiomers onto SAMs in response to the solution
becoming supersaturated with the excess enantiomer, bulk samples of crystals were harvested
when 50% of the solute appeared as crystals.
Crystallization of racemic 3PLA from water on SAMs IV-VI resulted in formation of
needles on SAM IV and SAM VI similar in habit to the needles observed for homochiral crystals
of conglomerates that formed on glass, as shown in Figure 4.14a and 4.14c respectively. In
contrast, polycrystalline films repeatedly were observed on SAM V instead of single crystals
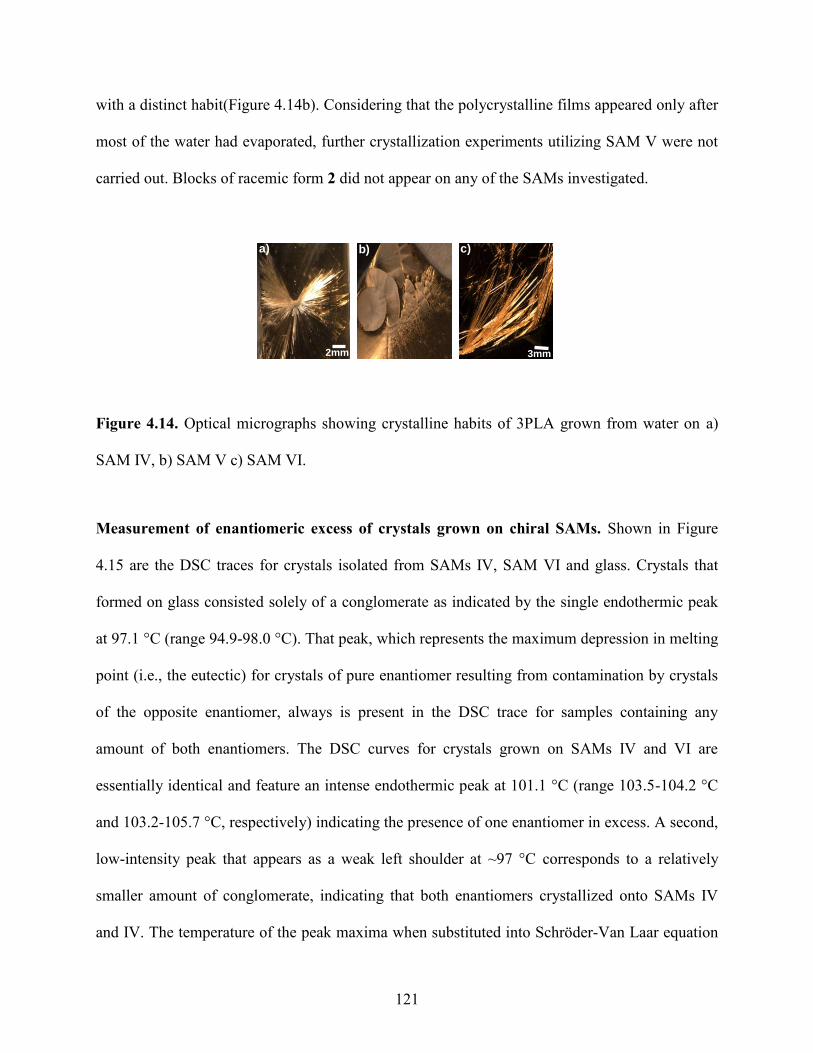
121
with a distinct habit(Figure 4.14b). Considering that the polycrystalline films appeared only after
most of the water had evaporated, further crystallization experiments utilizing SAM V were not
carried out. Blocks of racemic form 2 did not appear on any of the SAMs investigated.
Figure 4.14. Optical micrographs showing crystalline habits of 3PLA grown from water on a)
SAM IV, b) SAM V c) SAM VI.
Measurement of enantiomeric excess of crystals grown on chiral SAMs. Shown in Figure
4.15 are the DSC traces for crystals isolated from SAMs IV, SAM VI and glass. Crystals that
formed on glass consisted solely of a conglomerate as indicated by the single endothermic peak
at 97.1 °C (range 94.9-98.0 °C). That peak, which represents the maximum depression in melting
point (i.e., the eutectic) for crystals of pure enantiomer resulting from contamination by crystals
of the opposite enantiomer, always is present in the DSC trace for samples containing any
amount of both enantiomers. The DSC curves for crystals grown on SAMs IV and VI are
essentially identical and feature an intense endothermic peak at 101.1 °C (range 103.5-104.2 °C
and 103.2-105.7 °C, respectively) indicating the presence of one enantiomer in excess. A second,
low-intensity peak that appears as a weak left shoulder at ~97 °C corresponds to a relatively
smaller amount of conglomerate, indicating that both enantiomers crystallized onto SAMs IV
and IV. The temperature of the peak maxima when substituted into Schröder-Van Laar equation
2mm
a) b) c)
3mm
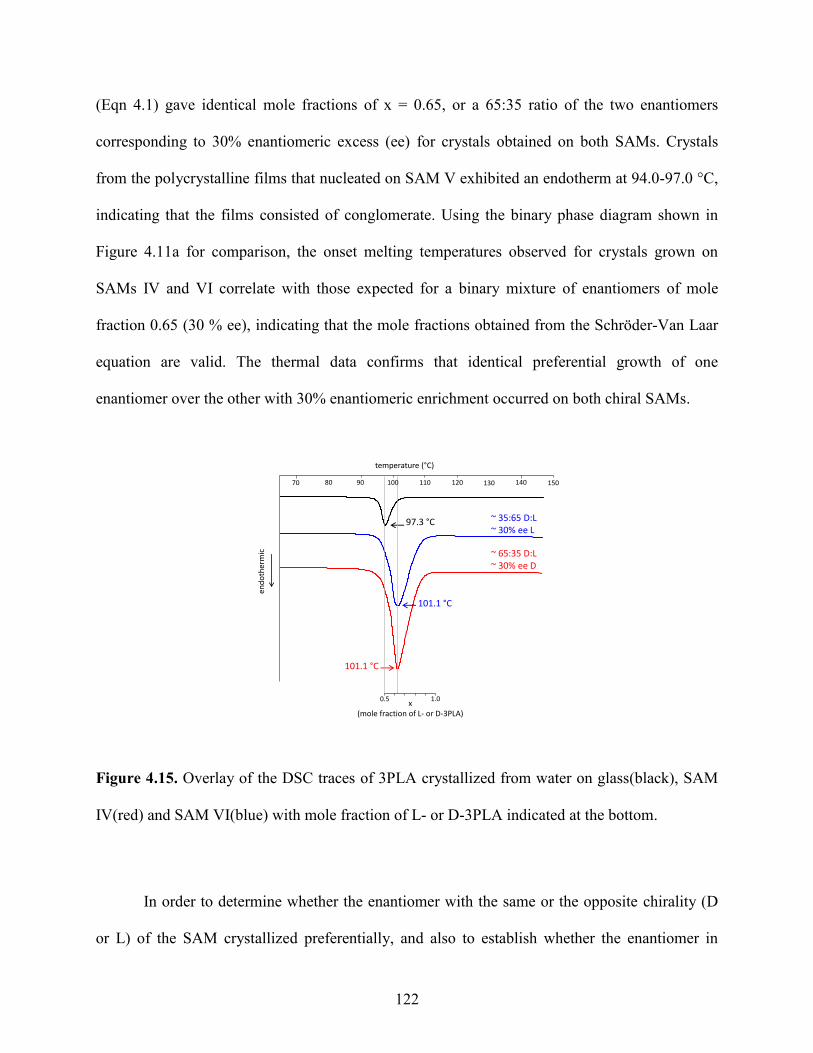
122
(Eqn 4.1) gave identical mole fractions of x = 0.65, or a 65:35 ratio of the two enantiomers
corresponding to 30% enantiomeric excess (ee) for crystals obtained on both SAMs. Crystals
from the polycrystalline films that nucleated on SAM V exhibited an endotherm at 94.0-97.0 °C,
indicating that the films consisted of conglomerate. Using the binary phase diagram shown in
Figure 4.11a for comparison, the onset melting temperatures observed for crystals grown on
SAMs IV and VI correlate with those expected for a binary mixture of enantiomers of mole
fraction 0.65 (30 % ee), indicating that the mole fractions obtained from the Schröder-Van Laar
equation are valid. The thermal data confirms that identical preferential growth of one
enantiomer over the other with 30% enantiomeric enrichment occurred on both chiral SAMs.
Figure 4.15. Overlay of the DSC traces of 3PLA crystallized from water on glass(black), SAM
IV(red) and SAM VI(blue) with mole fraction of L- or D-3PLA indicated at the bottom.
In order to determine whether the enantiomer with the same or the opposite chirality (D
or L) of the SAM crystallized preferentially, and also to establish whether the enantiomer in
101.1 °C
101.1 °C
97.3 °C ~ 35:65 D:L~ 30% ee L
~ 65:35 D:L~ 30% ee D
temperature (°C)
14070 80 90 100 110 120 130 150
x(mole fraction of L- or D-3PLA)
0.5 1.0
end
oth
erm
ic
123
excess switched consistently on L- and D-cysteine, 5 mg of crystals harvested from SAM IV and
SAM VI were ground with an equal mass of crystals of pure L- and D-3PLA, respectively, and
the difference in melting behavior of the two mixtures was compared by DSC. DSC data for
crystals harvested from SAM IV and ground with L-3PLA showed a decrease in the melting
point from 96.1-98.8 °C, indicating the formation of more of the conglomerate. The depression
of the melting point in the presence of L-3PLA confirmed that the D-3PLA crystallized
preferentially on SAM IV. A similar finding was observed when crystals grown on SAM VI
were ground with D-3PLA. These findings demonstrate conclusively that diastereomeric
interactions between the racemic solute and L- or D-cysteine differ enough in energy to
distinguish between L- and D-3PLA on the surface and drive nucleation of one enantiomer
selectively in the presence of the other. In addition, they show that the enantiomer with the
opposite chirality of the SAM consistently crystallizes before (≤ 24 hours) the enantiomer with
the same chirality (≥ 24 hours). Thus the enantiomer that grows in excess on a chiral surface can
be controlled based on the chirality of the surface.
Influence of soluble chiral impurities. Previous studies have shown that even very low
concentrations of chiral impurities present in solution can influence crystallization of chiral
compounds.68,75,76
For example, crystallization of conglomerate threonine from water in presence
of 5-10% of S-glutamic acid as an additive results in stereoselective adsorption of the impurity
(in amounts of 1-2%) at the surface of the crystal of S-threonine, thereby decreasing its rate of
growth to preferentially nucleate the R-threonine in ~94% excess.75
Although it has been shown
previously that SAMs of cysteine are stable in water,23,24
we wanted to determine what effect, if
any, the presence of soluble L- and D-cysteine might have on the crystallization behavior of
124
racemic 3PLA in the event that desorption of cysteine occurred from the surface of SAMs.
Accordingly, racemic 3PLA was crystallized on glass from aqueous solutions containing 10 μM
of L-cysteine and D-cysteine by the same method used to obtain crystals on chiral SAMs. The
composition of the resulting crystals was then determined by DSC. Crystals isolated from glass
substrates containing L-cysteine as an additive melted at 95.6-96.7 °C, indicating that formation
of a conglomerate with no enantiomeric enhacement. The crystals formed needles similar in
gross appearance to those grown previously on glass in the absence of a chiral impurity. A slight
difference in habit was observed in presence of 10 μM D-cysteine where the needles appeared
thinner as compared to those grown on glass. Thermal analysis revealed the crystals melted at
95.5-97.6 °C, and thus were conglomerates. We conclude from these results that the presence of
low relative concentrations of L- or D-cysteine in solution during crystallization of racemic
3PLA does not lead to any detectable enantiomeric enhancement, and therefore is not an issue of
concern.
Influence of chiral surfaces and solutes on the morphology of crystals of L-3PLA. We
previously determined that SAMs of L- and D-cysteine both templated growth of crystals of L-
3PLA preferentially on the (004) face such that the {001} family of faces were more prominent
compared to crystals grown on achiral surfaces. We recognized that in addition to enriching
crystalline samples with one enantiomer, enantioselective crystallization necessary enriches the
solution with the opposite enantiomers. Therefore, it was important to investigate how the excess
enantiomer in solution might affect both the facial selectivity of crystal growth and the
morphology of crystals. L-3PLA was crystallized in glass vials from aqueous solutions
containing 5 mole % of D-3PLA as an additive. Crystals of L-3PLA (1) were isolated from
solution after 5 days the crystalline morphology compared to crystals of 1 obtained on glass in
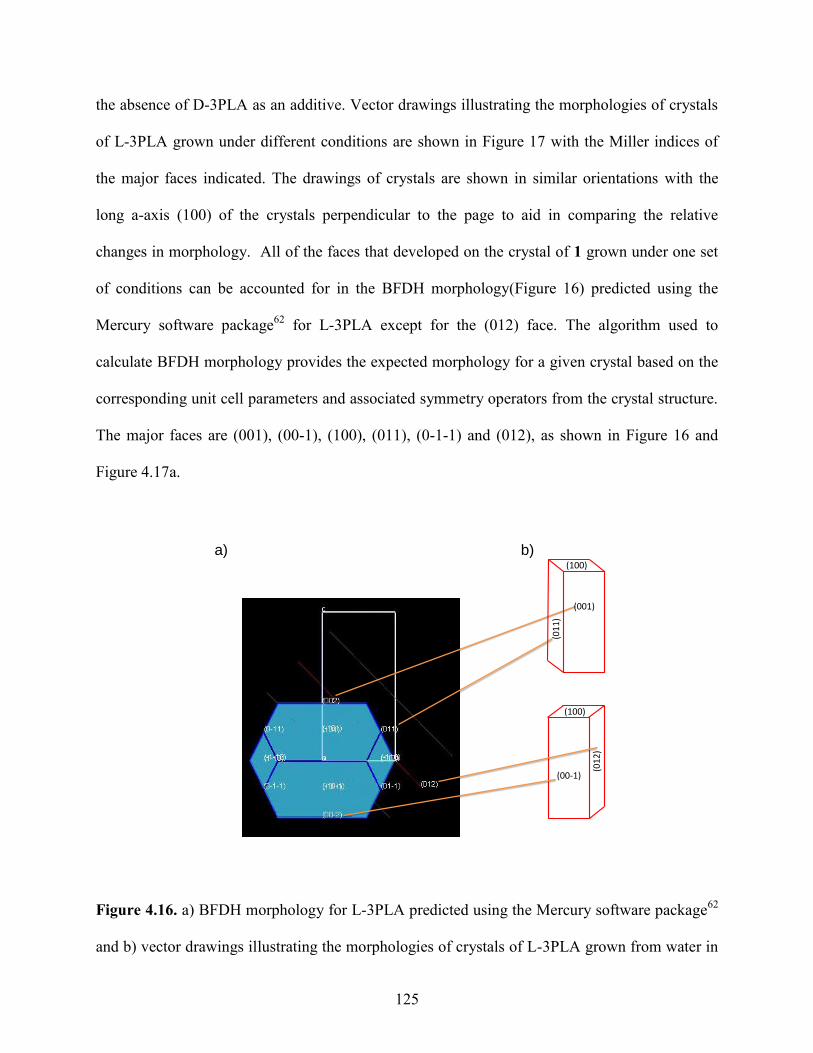
125
the absence of D-3PLA as an additive. Vector drawings illustrating the morphologies of crystals
of L-3PLA grown under different conditions are shown in Figure 17 with the Miller indices of
the major faces indicated. The drawings of crystals are shown in similar orientations with the
long a-axis (100) of the crystals perpendicular to the page to aid in comparing the relative
changes in morphology. All of the faces that developed on the crystal of 1 grown under one set
of conditions can be accounted for in the BFDH morphology(Figure 16) predicted using the
Mercury software package62
for L-3PLA except for the (012) face. The algorithm used to
calculate BFDH morphology provides the expected morphology for a given crystal based on the
corresponding unit cell parameters and associated symmetry operators from the crystal structure.
The major faces are (001), (00-1), (100), (011), (0-1-1) and (012), as shown in Figure 16 and
Figure 4.17a.
Figure 4.16. a) BFDH morphology for L-3PLA predicted using the Mercury software package62
and b) vector drawings illustrating the morphologies of crystals of L-3PLA grown from water in
(00-1)
(01
2)
(100)
(001)
(01
1)
(100)
b)a)
126
glass vials. The crystal develops the major faces (001), (011), (100)(top) and (00-1), (012),
(100)(bottom).
Crystals of L-3PLA grown in the presence of D-3PLA are much thinner and longer than
1 (Figure 4.17b). The dominant (004) face that is templated on chiral SAMs is missing in the
vector crystal when 5% D-3PLA is present in the solution. Instead the (021) face develops
consistently from batch to batch as shown in Figure 4.17b, but crystal growth is not templated on
chiral SAMs as indicated by the PXRD and orientation analysis. The fact that the (021) face is
not manifested in the crystal of pure L-3PLA, but is present when 5% D-3PLA is added,
demonstrates that the opposite enantiomer present in solution at a concentration of just 5% acts
as an additive and thus changes the habit of L-3PLA. In order to confirm if the change in the
morphology of L-3PLA is due to the presence of the opposite enantiomer or chiral template,
racemic 3PLA was crystallized from aqueous solution on SAM VI. These crystals were
previously analyzed by DSC to preferential nucleate crystals of L-3PLA with an excess of 20%.
The (021) as well as the (100) family of planes were preserved in the indexed crystals as shown
in Figure 4.17c, thus confirming the role of the opposite enantiomer acting as an additive.
Although the (001) face does not develop in crystal of L-3PLA grown in presence of 5% D-
3PLA, this face was certainly present in the crystal of L-3PLA when racemic 3PLA was
crystallized on SAM VI. The presence of this (004) face was confirmed by the dominant (004)
peak in the PXRD trace such that the resultant effect in the change in the habit becomes more
pronounced indicating that the surface acts as a template to promote growth on the (001) face. In
addition the crystal shown in Figure 4.17c appeared 50% similar to crystal of L-3PLA grown in
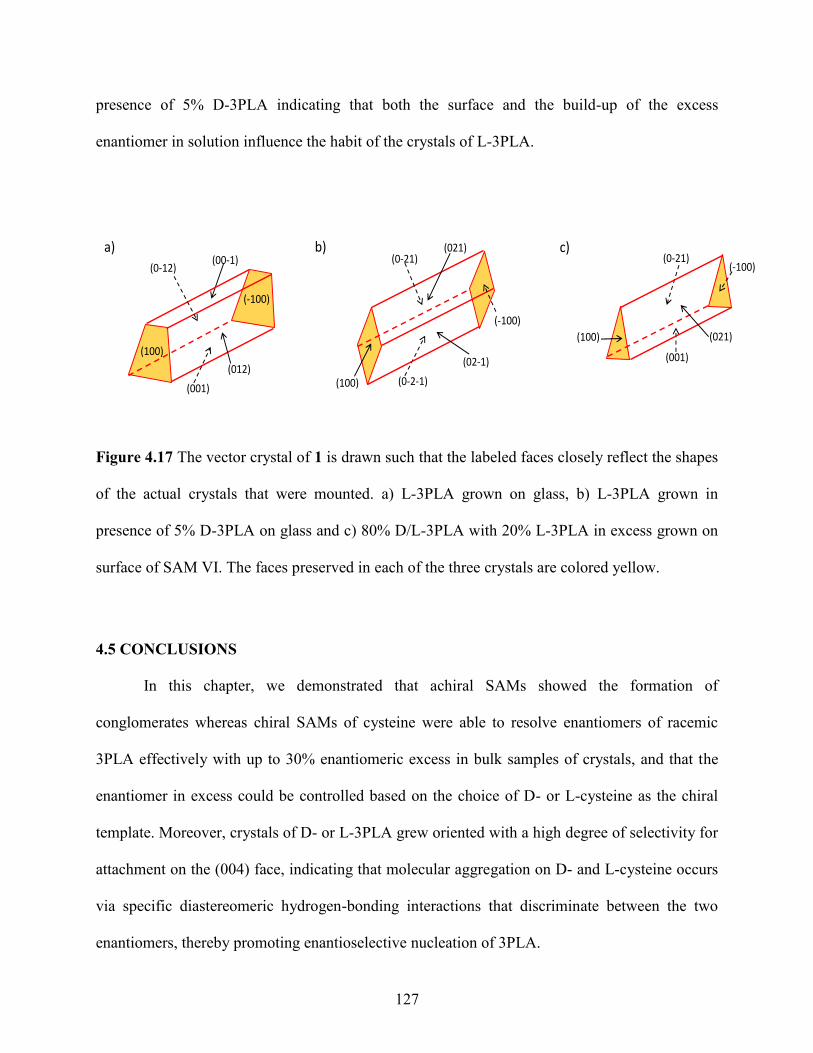
127
presence of 5% D-3PLA indicating that both the surface and the build-up of the excess
enantiomer in solution influence the habit of the crystals of L-3PLA.
Figure 4.17 The vector crystal of 1 is drawn such that the labeled faces closely reflect the shapes
of the actual crystals that were mounted. a) L-3PLA grown on glass, b) L-3PLA grown in
presence of 5% D-3PLA on glass and c) 80% D/L-3PLA with 20% L-3PLA in excess grown on
surface of SAM VI. The faces preserved in each of the three crystals are colored yellow.
4.5 CONCLUSIONS
In this chapter, we demonstrated that achiral SAMs showed the formation of
conglomerates whereas chiral SAMs of cysteine were able to resolve enantiomers of racemic
3PLA effectively with up to 30% enantiomeric excess in bulk samples of crystals, and that the
enantiomer in excess could be controlled based on the choice of D- or L-cysteine as the chiral
template. Moreover, crystals of D- or L-3PLA grew oriented with a high degree of selectivity for
attachment on the (004) face, indicating that molecular aggregation on D- and L-cysteine occurs
via specific diastereomeric hydrogen-bonding interactions that discriminate between the two
enantiomers, thereby promoting enantioselective nucleation of 3PLA.
(100)
(012)
(001)
(00-1)(0-12)
(-100)
a)
(100)
(-100)
(0-21)
(02-1)
(021)
(0-2-1)
b)
(100)
(-100)
(001)
(0-21)
(021)
c)
128
Since these molecular interactions occur specifically on the (004) face of L-3PLA, these
interactions could be enhanced by choosing model systems with even stronger hydrogen-bonding
interactions than 3PLA such as amino acids. We have investigated enantioseparation of N-
acetylleucine as another chiral drug that possesses strong hydrogen-bonding donors and
acceptors that could potentially maximize the hydrogen-bonding interactions and thus promote
chiral recognition. The results of that work are described in chapter 6. We could then tailor the
class of drug molecules by picking drugs with multiple carboxylic acid functional groups, and
examine how broadly our surface-based approach is applicable to a library of pharmaceuticals.
REFERENCES
(1) Allenmark, S.; Schurig, V. Journal of Materials Chemistry 1997, 7, 1955.
(2) Fogassy, E.; Acs, M.; Faigl, F.; Simon, K.; Rohonczy, J.; Ecsery, Z. J. Chem. Soc.,
Perkin Trans. 2 1986, 1881.
(3) Anandmanoharan, P. R.; Cains, P. W.; Jones, A. G. Tetrahedron: Asymmetry 2006, 17,
1867.
(4) Allenmark, S.; Schurig, V. J. Mater. Chem. 1997, 7, 1955.
(5) Chilmonczyk, Z.; Ksycinska, H.; Cybulski, J.; Rydzewski, M.; Les, A. Chirality 1998,
10, 821.
(6) Francotte, E. R. J. Chromatogr., A 2001, 906, 379.
(7) Hyun, M. H.; Kim, J. I.; Cho, Y. J.; Han, S. C. Chromatographia 2004, 60, 275.
(8) Maier, N. M.; Franco, P.; Lindner, W. J. Chromatogr., A 2001, 906, 3.
(9) Eliel, E. L.; Wilen, S. H.; Mander, L. N. Stereochemistry of Organic Compounds; John
Wiley and Sons: New York, 1994.
(10) Carvalho, P. O.; Cass, Q. B.; Calafatti, S. A.; Contesini, F. J.; Bizaco, R. J. Braz. Chem.
Eng. 2006, 23, 291.
(11) Brock, C. P.; Schweizer, W. B.; Dunitz, J. D. J. Am. Chem. Soc. 1991, 113, 9811.
(12) Lorenz, H.; Perlberg, A.; Sapoundjiev, D.; Elsner, M. P.; Seidel-Morgenstern, A. Chem.
Eng. Proc. 2006, 45, 863.
(13) Lahav, M.; Leiserowitz, L. Chem. Eng. Sci. 2001, 56, 2245.
(14) Shekunov, B. Y.; Aulton, M. E.; Adama-Acquah, R. W.; Grant, D. J. Chem. Soc.,
Faraday Trans 1996, 92, 439.
(15) Judge, R. A.; Jacobs, R. S.; Frazier, T.; Snell, E. H.; Pusey, M. L. Biophys. J. 1999, 77,
1585.
(16) Garnier, S.; Petit, S.; Coquerel, G. J. Cryst. Growth 2002, 234, 207.
129
(17) Aizenberg, J.; Black, A. J.; Whitesides, G. H. J. Am. Chem. Soc. 1999, 121, 4500.
(18) Frostman, L. M.; Bader, M. M.; Ward, M. D. Langmuir 1994, 10, 576.
(19) Hiremath, R.; Varney, S. W.; Swift, J. A. Chem. Mater. 2004, 16, 4948.
(20) Brock, C. P.; Schweizer, W. B.; Dunitz, J. D. J. Am. Chem. Soc. 1991, 113, 9811.
(21) Collet, A.; Brienne, M. J.; Jacques, J. Chem. Rev. 1980, 80, 215.
(22) Horvath, J. D.; Gellman, J. A. Top. Catal. 2003, 25, 9.
(23) Dressler, D. H.; Mastai, Y. Chirality 2007, 19, 358.
(24) Dressler, D. H.; Mastai, Y. J. Colloid Interface Sci. 2007, 310, 653.
(25) Sholl, D. S.; Asthagiri, A.; Power, T. D. J. Phys. Chem. B. 2001, 105, 4771.
(26) Bonner, W. A.; Kavasmaneck, P. R.; Martin, F. S.; Flores, J. J. Science 1974, 186, 143.
(27) Bonner, W. A.; Kavasmaneck, P. R.; Martin, F. S.; Flores, J. J. Orig. Life 1975, 6, 367.
(28) Hazen, R. M.; Filley, T. R.; Goodfriend, G. A. Proc. Natl. Acad. Sci. 2001, 98, 5487.
(29) McFadden, C. F.; Cremer, P. S.; Gellman, A. J. Langmuir 1996, 12, 2483.
(30) Hiremath, R.; Basile, J. A.; Varney, S. W.; Swift, J. A. J. Am. Chem. Soc. 2005, 127,
18321.
(31) Ji, D.; Arnold, C. M.; Graupe, M.; Beadle, E.; Dunn, R. V.; Phan, M. N.; Villazana, R. J.;
Benson, R.; Colorado, R.; Lee, T. R. J. Cryst. Growth 2000, 218, 390.
(32) Lee, A. Y.; Ulman, A.; Myerson, A. S. Langmuir 2002, 18, 5886.
(33) Carter, P. W.; Ward, M. D. J. Am. Chem. Soc. 1994, 116, 769.
(34) Bieri, M.; Burgi, T. J. Phys. Chem. B 2005, 109, 22476.
(35) Kerr, K. A.; Ashmore, J. P. Acta Crystallogr. 1973, B29, 2124.
(36) Ihs, A.; Liedberg, B. J. Colloid Interface Sci. 1991, 144, 282.
(37) Uvdal, K.; Bodo, P.; Liedberg, B. J. Colloid Interface Sci. 1992, 149, 162.
(38) Caner, H.; Groner, E.; Levy, L.; Agranat, I. DDT 2004, 9, 105.
(39) Thayer, A. M. In Chem .Eng. News. 2007; Vol. 85, p 11.
(40) Stinson, S. C. In Chem. Eng. News. 2000; Vol. 78, p 55.
(41) Prema, P.; Smila, D.; Palavesam, A.; Immanuel, G. Food Bioprocess Technol. 2010, 3,
379.
(42) Strom, K.; Sjogren, J.; Broberg, A.; Schnurer, J. Appl. Environ. Microbiol. 2002, 68,
4322.
(43) Cesario, M.; Guilhem, J. Cryst. Struct. Commun. 1975, 4, 245.
(44) Jacques, J., Collet, A.; Wilen, S. H. Enantiomers, Racemates, and Resolutions; John
Wiley and Sons: New York, 1981.
(45) Navare, P. S.; MacDonald, J. C. Cryst. Growth Des. 2011, 11, 2422.
(46) Collet, A.; Brienne, M. J.; Jacques, J. Chem. Rev. 1980, 80, 215.
(47) Li, Z. J.; Zell, M. T.; Munson, E. J.; Grant, D. J. W. J. Pharm. Sci. 1999, 88, 337.
(48) D'Oria, E.; Karamertzanis, P. G.; Price, S. L. Cryst. Growth Des. 2010, 10, 1749.
(49) Li, Z. J.; Ojala, W. H.; Grant, D. J. W. J. Pharm. Sci. 2001, 90, 1523.
(50) Woo Han, J.; Sholl, D. S. Langmuir 2009, 25, 10737.
(51) Rekharsky, M.; Inoue, Y. J. Am. Chem. Soc. 2000, 122, 4418.
(52) Pham-Huy, C.; Radenen, B.; Sahui-Gnassi, A.; R., C. J. J. Chromatogr. B. 1995, 665,
125.
(53) Uvdal, K.; Bodoe, P.; Liedberg, B. J. Colloid Interface Sci. 1992, 149, 162.
(54) Ulman, A. Chem. Rev. 1996, 96, 1533.
(55) Bain, C. D.; Troughton, E. B.; Tao, Y. T.; Evall, J.; Whitesides, G. M.; Nuzzo, R. G.
Journal of the American Chemical Society 1989, 111, 321.
130
(56) Laibinis, P. E.; Whitesides, G. M.; Allara, D. L.; Tao, Y. T.; Parikh, A. N.; Nuzzo, R. G.
Journal of the American Chemical Society 1991, 113, 7152.
(57) Porter, M. D.; Bright, T. B.; Allara, D. L.; Chidsey, C. E. D. J. Am. Chem. Soc. 1987,
109, 3559.
(58) Rame-hart Upgrade Imaging Kit for Model 100-00 Goniometer with DROP image
Standard Setup and Software User Guide NJ; Vol. 706127.
(59) Allara, D. L.; Nuzzo, R. G. Langmuir 1985, 1, 52.
(60) Rudolph Instruments A Basic Program For The Analysis Of Ellipsometer Measurements
Instruction Manual NJ; Vol. 14-0104.
(61) Bruker Vertex 70 User Manual Ettlingen, 2007.
(62) Bruker,(1999), SAINT (Version 6.14), SHELXTL (Version 6.14) for WNT/2003. Bruker
AXS Inc. Madison, Wisconsin, USA
(63) Bain, C. D.; Troughton, E. B.; Tao, Y. T.; Evall, J.; Whitesides, G. M.; Nuzzo, R. G. J.
Am. Chem. Soc. 1989, 111, 321.
(64) Biebuyck, H. A.; Bain, C. D.; Whitesides, G. M. Langmuir 1994, 10, 1825.
(65) Dodero, G.; Michieli, L. D.; Cavalleri, O.; Rolandi, R.; Oliveri, L.; Dacca, A.; Parodi, R.
Colloids Surf. A 2000, 175, 121.
(66) Nuzzo, R. G.; Dubois, L. H.; Allara, D. L. J. Am. Chem. Soc. 1990, 112, 558.
(67) Porter, M. D.; Bright, T. B.; Allara, D. L.; Chidsey, C. E. D. J. Am. Chem. Soc. 1987,
109, 3559.
(68) Addadi, L.; Gati, E.; Lahav, M. J. Am. Chem. Soc. 1981, 103, 1251.
(69) Dabros, M.; Thalladi, V. R. Chem. Commun. 2007, 2476.
(70) Diao, Y.; Myerson, A. S.; Hatton, T. A.; Trout, B. L. Langmuir 2011, 27, 5324.
(71) Joint Committee on Powder Diffraction Standards-International Center for Diffraction
Data Swarthmore, U.K., 1986.
(72) Sangwal, K.; Zdyb, A.; Chocyk, D.; Brzoska, M. E. Cryst. Res. Technol. 1996, 31, 267.
(73) Finnie, S. D.; Ristic, R. I.; Sherwood, J. N.; Zikic, A. M. J. Cryst. Growth 1999, 207,
308.
(74) Weissbuch, I.; Addadi, L.; Lahav, M.; Leiserowitz, L. Science 1991, 253, 637.
(75) Addadi, L. W., S.; Gati, E.; Weissbuch, I.; Lahav, M. J. Am. Chem. Soc. 1982, 104, 4610.
(76) Addadi, L.; van Mil, J.; Lahav, M. J. Am. Chem. Soc. 1981, 103, 1249.
131
5: Chiral drugs as templates for enantioselective
crystallization of 3-phenyllactic acid
5.1 INTRODUCTION
This chapter presents a novel approach to separate racemic mixtures by using single
enantiomers of chiral drugs as templates. In chapter 4, we demonstrated that chiral surfaces
consisting of L- and D-cysteine preferentially nucleated one enantiomer of racemic 3PLA in as
much as 30% enantiomeric excess. Given the relatively modest enrichment on a chiral amino
acid such as cysteine, we hypothesized that decorating the surface with a chiral template similar
in structure to 3PLA might enhance intermolecular interaction at the surface both through
hydrogen bonding and other weaker interactions. In addition, we reasoned that a pre-organized
monolayer of one enantiomer of 3PLA attached on the surface likely would mimic homochiral
3PLA adsorbed onto a chiral surface (e.g., cysteine), thereby promoting more selective
adsorption of the same enantiomer from a racemic solution. Therefore, we wanted to investigate
enantioseparation of racemic 3PLA on chiral surfaces of L- and D-3PLA to test whether self-
complementary interactions would lead to greater selectivity compared to heterochiral
interactions on amino acids. In addition, we felt it was important to provide proof of concept that
this method would work because of the tremendous potential of this approach as a convenient
means to create large libraries of drug-based chiral templates that can be used to resolve
racemates via crystallization.
132
One of the advantages of SAMs is that the surface properties and exposed functionality
on the surface can be modified. Modifying the surface of a SAM on gold commonly is carried
out either by synthesizing a thiol with the desired structure and then preparing a new SAM, or
by first preparing a SAM with chemically reactive head groups such as acid anhydrides1 and then
exposing the SAM to compounds that become covalently attached when they react with those
groups. Both of those methods necessarily require synthetic steps to create covalent linkages that
might be incompatible with functionality present on chiral drugs that require additional
protection-deprotection steps. We wanted to explore and develop a more facile means to
introduce chiral drugs on the surface of SAMs that does not require covalent synthesis or
modification and that is compatible with potentially reactive functionality present on chiral
drugs. Mallouk reported the design of multilayer thin films of alternating layers of zirconium
metal cations and phosphonate anions joined by ionic interactions between the metal ions and
phosphate groups.2,3
We wanted to follow a similar non-covalent approach that avoided the use
of metal ions. Accordingly, we chose to investigate attaching L-3PLA onto achiral SAMs
containing amine head groups that are basic enough to deprotonate the carboxylic acid and form
a salt. This approach was attractive because a number of simple thiols containing amines are
available commercially, SAMs with amine groups exposed at the surface are known to form
ammonium carboxylate salts rapidly when exposed to solutions containing carboxylic acids, and
the acid-base equilibrium heavily favors the salt over the neutral acid and amine such that the
carboxylic acid does not come off the surface to any appreciable extent. We expected that
attaching molecules of 3PLA onto the surface as the corresponding carboxylate necessarily
would cause molecules in the overlayer to become oriented and ordered such that the resulting
template might promote ordered aggregation of 3PLA solute on the surface during subsequent
133
crystallization. We also anticipated that forming a salt would change the hydrogen-bonding
behavior of the carboxylic acid from that of a hydrogen-bonding donor (OH) and acceptor (C=O)
to an acceptor only (CO2-). Given that hydrogen bonding between neutral carboxylic acids and
carboxylate groups result in some of the strongest known hydrogen bonds, it is likely that
attachment of the drug as a salt on the surface would promote strong hydrogen bonding with
3PLA solute that might enhance diastereomeric interaction leading to improved resolution.
Choice of SAMs. In the present work, we chose to anchor 3PLA onto a SAM of cysteamine
(SAM VII) (SHCH2CH2NH2), a small ω-functionalized thiol that is widely used as a linker for
adsorption of biomolecules4 and is known to form a stable SAM terminated by a basic amino
group.5,6
SAMs of cysteamine are known to form on gold or silver.5,7
The sulfur atom of
cysteamine reacts with gold or silver forming a stable metal-sulfur bond. Due to the presence of
the reactive terminal amino group, carboxylic acids can be introduced into the SAM via
formation of an amide between the amino and carboxylic acid groups in the presence of a
dehydrating reagent (e.g., DCC).5,6,8
For example, Liu et al demonstrated step-by-step surface
modification of cysteamine monolayer on gold by anchoring an azobenzene group followed by
exchange with pentanethiol and the increase in surface hydrophobicity was confirmed by contact
angle goniometry.5 We used a complementary approach via salt formation to functionalize SAM
of cysteamine with homochiral 3PLA in order to form a chiral surface of L-3PLA/cysteamine
(SAM VIII), and subsequently examined the crystallization behavior of racemic 3PLA on SAM
VIII. The results of those experiments are described and compared to those for crystallization of
racemic 3PLA on cysteine in the sections that follow.
5.2 EXPERIMENTAL
134
Preparation of self-assembled monolayers (SAMs) on gold. Commercially available
cysteamine was purchased from Aldrich and used without further purification. Absolute ethanol
was purchased from Pharmco. Glass slides (1 x 3 x 0.04 in.) coated with 50 Å of chromium and
1000 Å of gold were purchased from Evaporated Metal Films. Racemic and enantiomerically
pure 3PLA were purchased from Aldrich and used without further purification. SAMs on gold
substrates were prepared as follows. The gold slides were cut into 1 x 1 in. squares and cleaned
by plasma oxidation (SPI Supplies Plasma-Prep II) for 1 minute, rinsed with absolute ethanol
and deionized water, and dried under nitrogen. Monolayers of cysteamine (SAM VII) were
prepared by immersing the slides in 10 mM ethanolic solution of cysteamine for 24 h at RT.
SAMs of cysteamine functionalized with L-3PLA (SAM VIII) were generated by immersing the
slides in 10 mM ethanolic solutions of cysteamine and L-3PLA for 24 h at RT. The resulting
SAMs were rinsed with absolute ethanol and dried with nitrogen prior to characterization and
crystallization experiments. We used a high concentration of cysteamine and L-3PLA because
cysteamine is a small chain molecule, and we wanted to ensure more coverage of L-3PLA on the
gold surface.
Characterization of SAMs. SAMs VII and VIII were characterized by contact angle
goniometry, ellipsometry and grazing-angle FT-IR by following the same procedure described
earlier in chapter 4. The IR spectra for SAMs VII and VIII and bulk material are shown in Figure
5.1 and Figure 5.2 respectively, whereas the contact angles and thicknesses for SAMs VII, VIII
and bare gold are presented in Table 5.1.
135
Growth of conglomerates (3) on glass. Crystals of 3 were prepared by dissolving racemic
3PLA in water at room temperature to form a concentrated aqueous solution (~0.3M) that was
allowed to evaporate slowly at room temperature in glass vials. Clear, colorless needles of 3
formed in solution after 5-6 days. Crystals of 3 were isolated by filtration prior to complete
evaporation of solvent.
Growth of crystals on SAMs. Crystallization of racemic 3PLA was carried out by slow
evaporation from water on SAMs VII and VIII and also on bare gold and glass substrates as
controls, characterized by optical microscopy and differential scanning calorimetry (DSC)
following the same procedure as described in chapter 4. Five separate crystallization experiments
were carried out on each of the different SAMs and control surfaces. Onset temperatures of melt
endotherms were used to determine the enantiomeric composition of samples using the Schröder-
Van Laar equation (Eqn 5.1),9,10
as described in the Results and Discussion.
Eqn 5.1
where x is the mole fraction, ΔHA is the enthalpy of fusion of pure enantiomer (kJ/mol) and TA is
the onset melting point of pure enantiomer in K, and TR is the onset melting point of the
racemate in K. Enthalpies of fusion were determined by integrating the areas under the
corresponding peaks, and then substituted into Schröder-Van Laar equation (Eqn 5.1) to calculate
the mole fraction of enantiomers and the enantiomeric excess. A binary phase diagram for the D
and L enantiomers of 3PLA was constructed using DSC data from a series of binary mixtures of
the two enantiomers prepared by grinding the two components together to form homogenous
136
mixtures differing in composition by mole fractions of 0.1. Samples varying in smaller
increments of mole fraction 0.05 were used for mixtures containing 40-60% of a given
enantiomer to more accurately quantify the region of maximum melting point depression at mole
fraction 0.5 corresponding to a racemic mixture of homochiral crystals (conglomerates). DSC
data was collected using 2 mg samples varying in composition from 100% D-3PLA to 100% L-
3PLA.
5.3 RESULTS AND DISCUSSION
Formation of SAMs of cysteamine (SAM VII) and L-3PLA/cysteamine (SAM VIII). SAMs
were prepared by immersing 25 mm x 25 mm gold slides in 10 mM ethanolic solutions of L-
3PLA and cysteamine and 10 mM ethanolic solution of cysteamine at RT for one day to allow
sufficient time for SAMs to fully form. The resulting SAMs were characterized by grazing
incidence IR spectroscopy, contact angle goniometry and ellipsometry, in order to verify the
presence of the functional groups deposited on the SAMs, and to determine the behavior of
wettability and the films thicknesses in order to verify the presence of the SAMs (Table 5.1). The
high frequency region (~2200-3600 cm-1
) of the grazing-incidence IR spectra obtained from
SAMs VII and VIII on gold are shown in Figure 5.1. No prominent peaks were observed in the
low frequency region (~1000-2000 cm-1
) of spectrum in spectrum for either SAM. The IR
spectrum for SAM VII shows aliphatic CH symmetric and asymmetric stretching bands at 2859
cm-1
and 2929 cm-1
respectively for the methylene groups as indicated in Figure 5.1a. A broad
band in the alcohol OH stretching region (3600-3400 cm-1
) was observed in the spectrum of
SAM VII due to the overlap of peaks corresponding N-H stretching of the 1° amine and O-H
stretching of water presumably adsorbed to the amine groups. The IR spectrum of SAM VIII
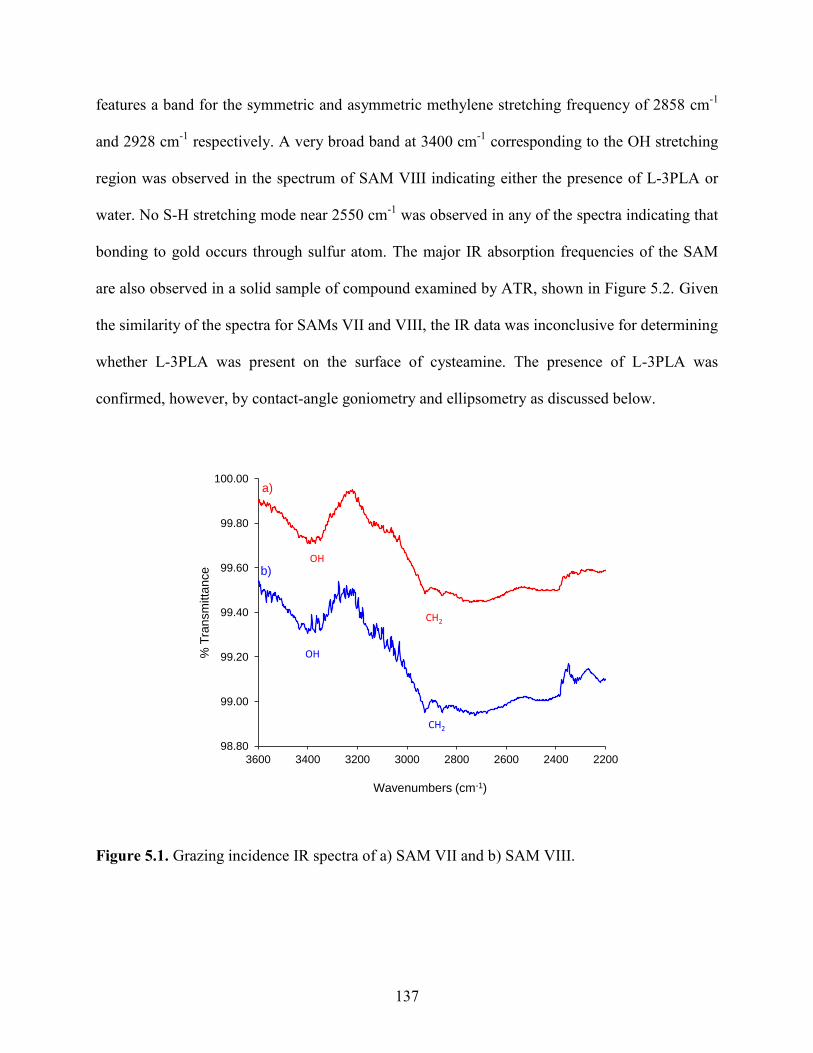
137
features a band for the symmetric and asymmetric methylene stretching frequency of 2858 cm-1
and 2928 cm-1
respectively. A very broad band at 3400 cm-1
corresponding to the OH stretching
region was observed in the spectrum of SAM VIII indicating either the presence of L-3PLA or
water. No S-H stretching mode near 2550 cm-1
was observed in any of the spectra indicating that
bonding to gold occurs through sulfur atom. The major IR absorption frequencies of the SAM
are also observed in a solid sample of compound examined by ATR, shown in Figure 5.2. Given
the similarity of the spectra for SAMs VII and VIII, the IR data was inconclusive for determining
whether L-3PLA was present on the surface of cysteamine. The presence of L-3PLA was
confirmed, however, by contact-angle goniometry and ellipsometry as discussed below.
Figure 5.1. Grazing incidence IR spectra of a) SAM VII and b) SAM VIII.
98.80
99.00
99.20
99.40
99.60
99.80
100.00
22002400260028003000320034003600
% T
ran
sm
itta
nce
Wavenumbers (cm-1)
a)
OH
OHb)
CH2
CH2
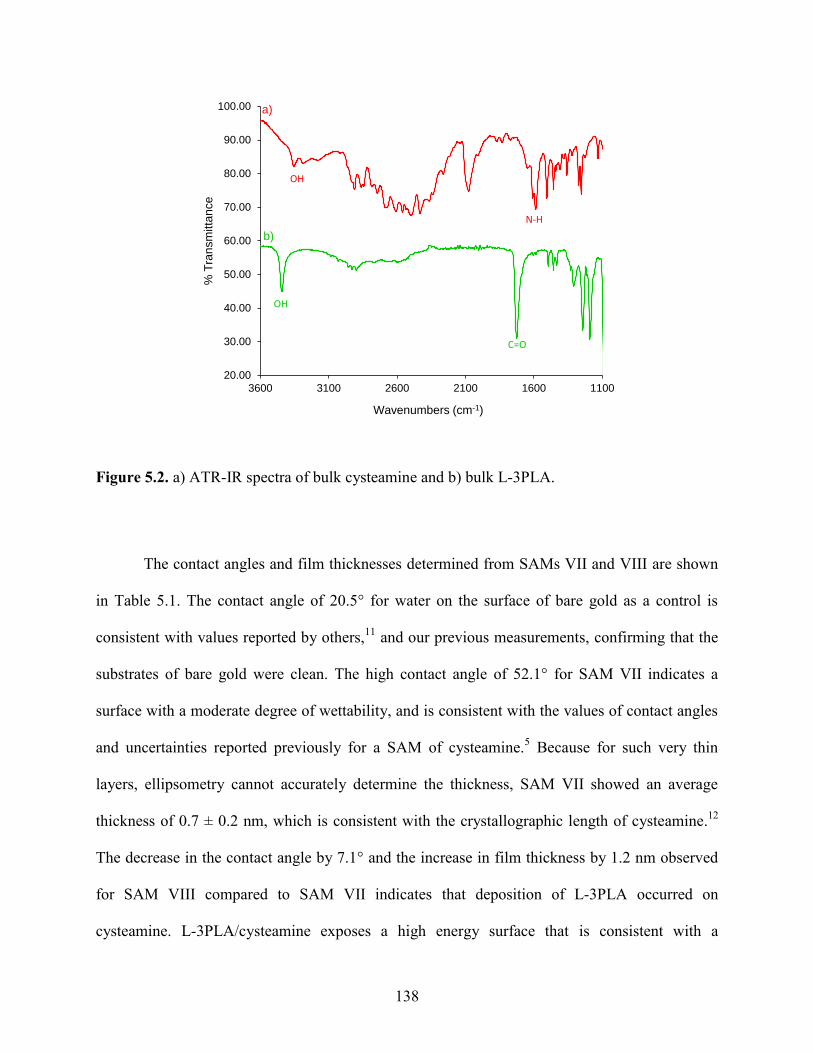
138
Figure 5.2. a) ATR-IR spectra of bulk cysteamine and b) bulk L-3PLA.
The contact angles and film thicknesses determined from SAMs VII and VIII are shown
in Table 5.1. The contact angle of 20.5° for water on the surface of bare gold as a control is
consistent with values reported by others,11
and our previous measurements, confirming that the
substrates of bare gold were clean. The high contact angle of 52.1° for SAM VII indicates a
surface with a moderate degree of wettability, and is consistent with the values of contact angles
and uncertainties reported previously for a SAM of cysteamine.5 Because for such very thin
layers, ellipsometry cannot accurately determine the thickness, SAM VII showed an average
thickness of 0.7 ± 0.2 nm, which is consistent with the crystallographic length of cysteamine.12
The decrease in the contact angle by 7.1° and the increase in film thickness by 1.2 nm observed
for SAM VIII compared to SAM VII indicates that deposition of L-3PLA occurred on
cysteamine. L-3PLA/cysteamine exposes a high energy surface that is consistent with a
20.00
30.00
40.00
50.00
60.00
70.00
80.00
90.00
100.00
110016002100260031003600
% T
ran
sm
itta
nce
Wavenumbers (cm-1)
b)
a)
C=O
OH
N-H
OH
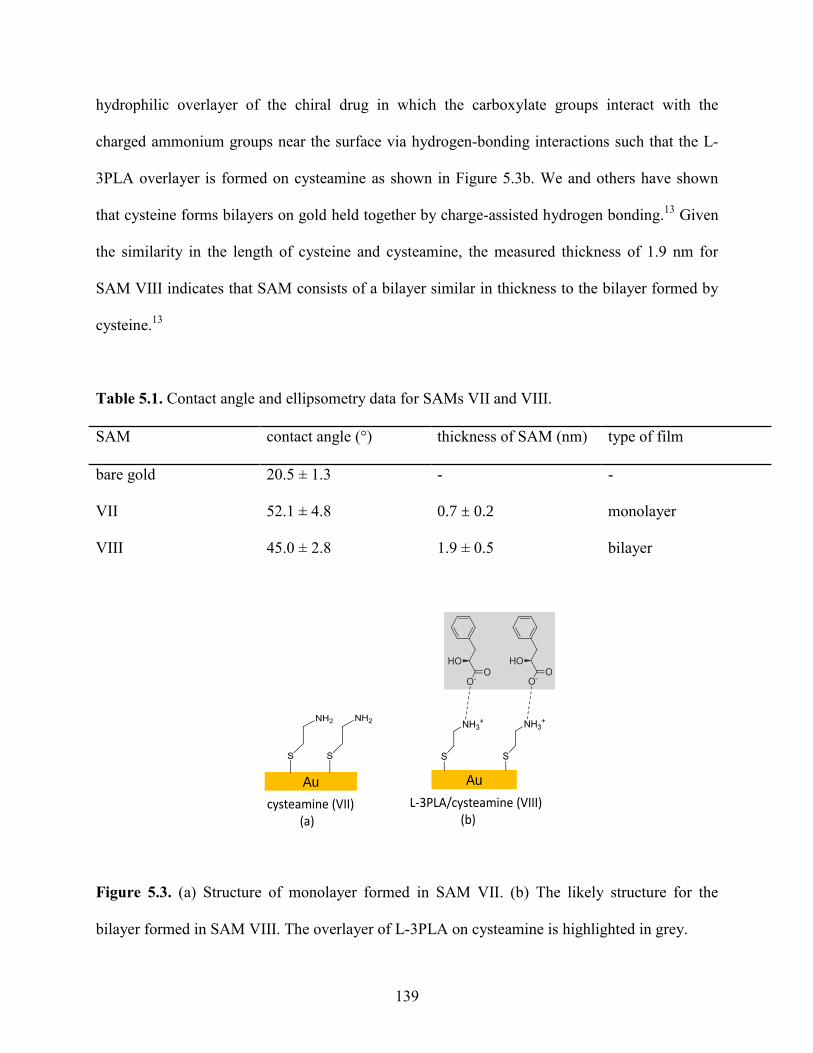
139
hydrophilic overlayer of the chiral drug in which the carboxylate groups interact with the
charged ammonium groups near the surface via hydrogen-bonding interactions such that the L-
3PLA overlayer is formed on cysteamine as shown in Figure 5.3b. We and others have shown
that cysteine forms bilayers on gold held together by charge-assisted hydrogen bonding.13
Given
the similarity in the length of cysteine and cysteamine, the measured thickness of 1.9 nm for
SAM VIII indicates that SAM consists of a bilayer similar in thickness to the bilayer formed by
cysteine.13
Table 5.1. Contact angle and ellipsometry data for SAMs VII and VIII.
SAM contact angle (°) thickness of SAM (nm) type of film
bare gold 20.5 ± 1.3 - -
VII 52.1 ± 4.8 0.7 ± 0.2 monolayer
VIII 45.0 ± 2.8 1.9 ± 0.5 bilayer
Figure 5.3. (a) Structure of monolayer formed in SAM VII. (b) The likely structure for the
bilayer formed in SAM VIII. The overlayer of L-3PLA on cysteamine is highlighted in grey.
Au
L-3PLA/cysteamine (VIII)(b)
cysteamine (VII)(a)
Au
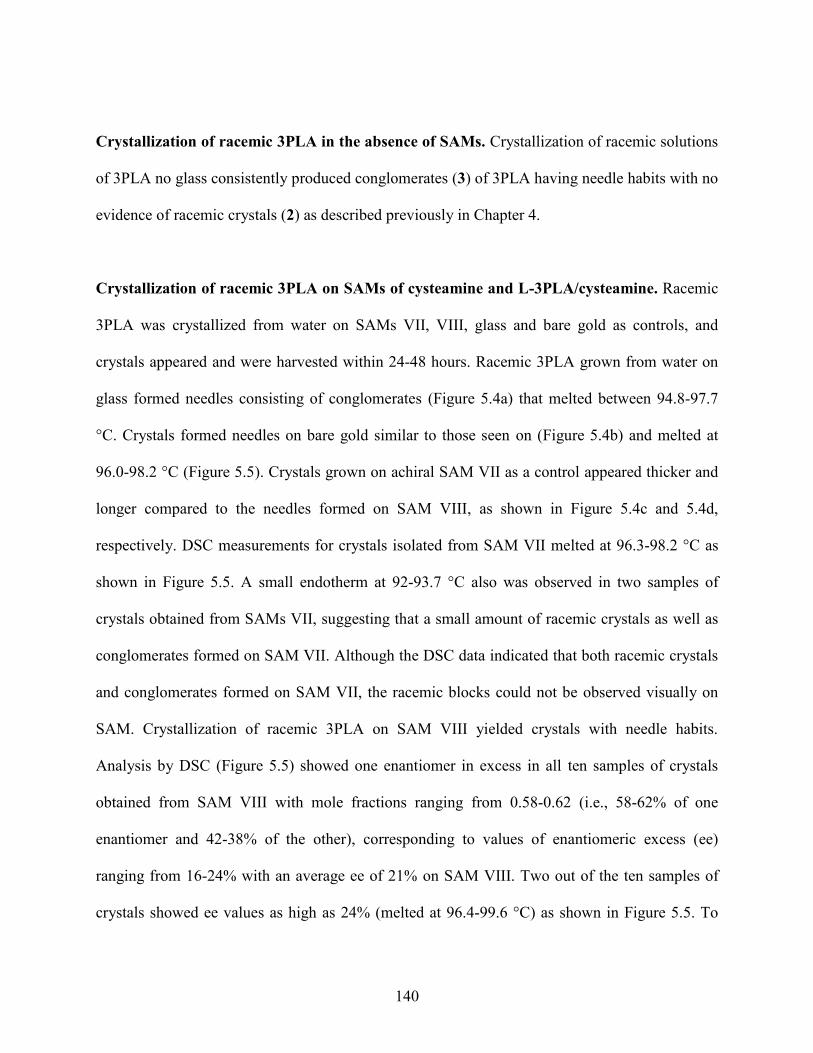
140
Crystallization of racemic 3PLA in the absence of SAMs. Crystallization of racemic solutions
of 3PLA no glass consistently produced conglomerates (3) of 3PLA having needle habits with no
evidence of racemic crystals (2) as described previously in Chapter 4.
Crystallization of racemic 3PLA on SAMs of cysteamine and L-3PLA/cysteamine. Racemic
3PLA was crystallized from water on SAMs VII, VIII, glass and bare gold as controls, and
crystals appeared and were harvested within 24-48 hours. Racemic 3PLA grown from water on
glass formed needles consisting of conglomerates (Figure 5.4a) that melted between 94.8-97.7
°C. Crystals formed needles on bare gold similar to those seen on (Figure 5.4b) and melted at
96.0-98.2 °C (Figure 5.5). Crystals grown on achiral SAM VII as a control appeared thicker and
longer compared to the needles formed on SAM VIII, as shown in Figure 5.4c and 5.4d,
respectively. DSC measurements for crystals isolated from SAM VII melted at 96.3-98.2 °C as
shown in Figure 5.5. A small endotherm at 92-93.7 °C also was observed in two samples of
crystals obtained from SAMs VII, suggesting that a small amount of racemic crystals as well as
conglomerates formed on SAM VII. Although the DSC data indicated that both racemic crystals
and conglomerates formed on SAM VII, the racemic blocks could not be observed visually on
SAM. Crystallization of racemic 3PLA on SAM VIII yielded crystals with needle habits.
Analysis by DSC (Figure 5.5) showed one enantiomer in excess in all ten samples of crystals
obtained from SAM VIII with mole fractions ranging from 0.58-0.62 (i.e., 58-62% of one
enantiomer and 42-38% of the other), corresponding to values of enantiomeric excess (ee)
ranging from 16-24% with an average ee of 21% on SAM VIII. Two out of the ten samples of
crystals showed ee values as high as 24% (melted at 96.4-99.6 °C) as shown in Figure 5.5. To
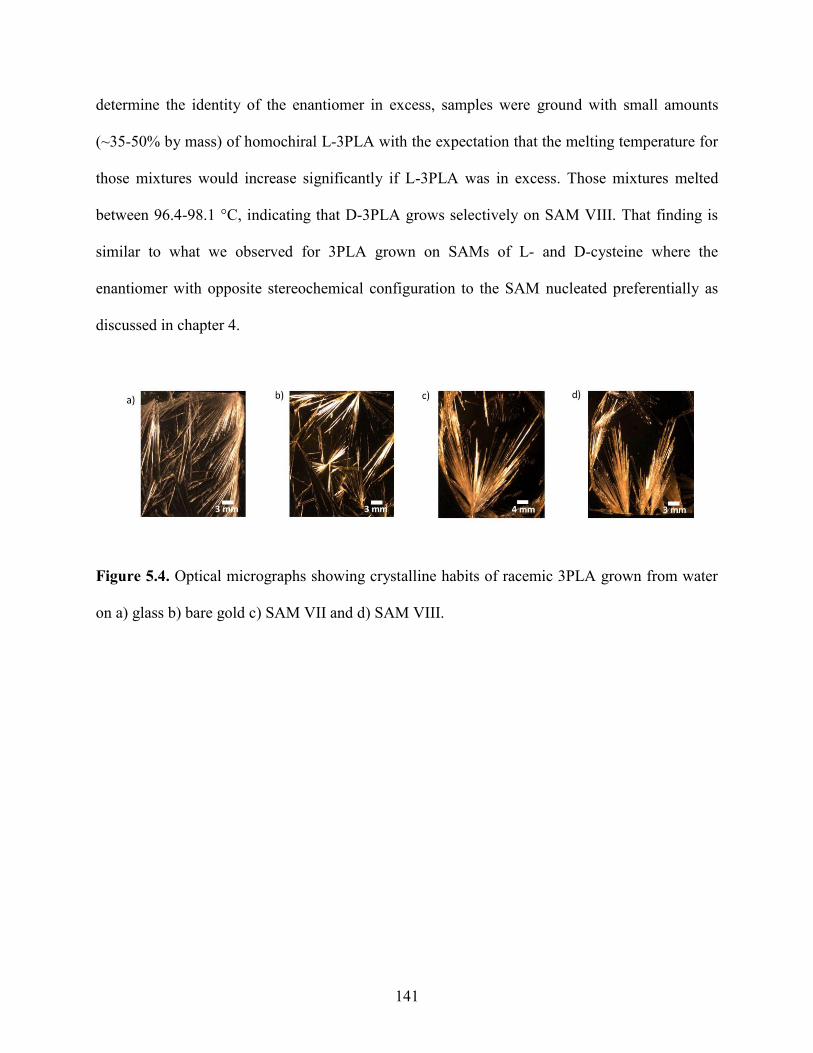
141
determine the identity of the enantiomer in excess, samples were ground with small amounts
(~35-50% by mass) of homochiral L-3PLA with the expectation that the melting temperature for
those mixtures would increase significantly if L-3PLA was in excess. Those mixtures melted
between 96.4-98.1 °C, indicating that D-3PLA grows selectively on SAM VIII. That finding is
similar to what we observed for 3PLA grown on SAMs of L- and D-cysteine where the
enantiomer with opposite stereochemical configuration to the SAM nucleated preferentially as
discussed in chapter 4.
Figure 5.4. Optical micrographs showing crystalline habits of racemic 3PLA grown from water
on a) glass b) bare gold c) SAM VII and d) SAM VIII.
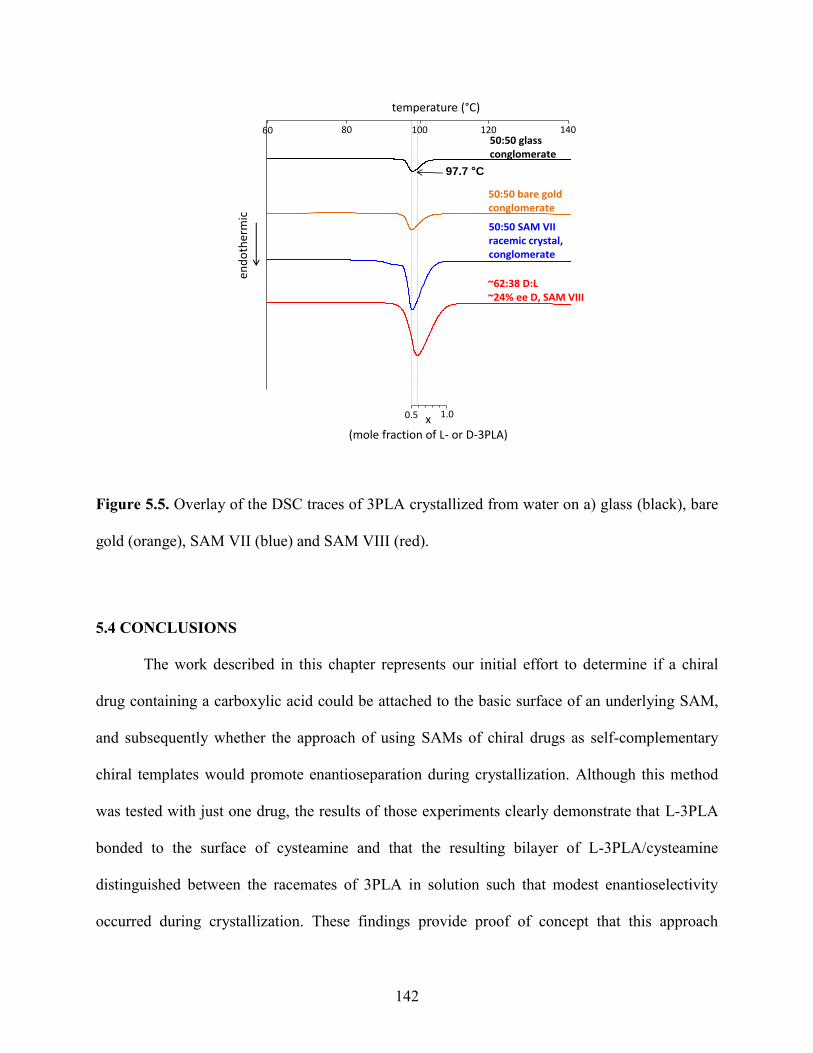
142
Figure 5.5. Overlay of the DSC traces of 3PLA crystallized from water on a) glass (black), bare
gold (orange), SAM VII (blue) and SAM VIII (red).
5.4 CONCLUSIONS
The work described in this chapter represents our initial effort to determine if a chiral
drug containing a carboxylic acid could be attached to the basic surface of an underlying SAM,
and subsequently whether the approach of using SAMs of chiral drugs as self-complementary
chiral templates would promote enantioseparation during crystallization. Although this method
was tested with just one drug, the results of those experiments clearly demonstrate that L-3PLA
bonded to the surface of cysteamine and that the resulting bilayer of L-3PLA/cysteamine
distinguished between the racemates of 3PLA in solution such that modest enantioselectivity
occurred during crystallization. These findings provide proof of concept that this approach
x(mole fraction of L- or D-3PLA)
0.5 1.0
end
oth
erm
ic
97.7 C
50:50 glassconglomerate
50:50 SAM VIIracemic crystal, conglomerate
~62:38 D:L~24% ee D, SAM VIII
50:50 bare goldconglomerate
temperature (°C)
120100 14060 80
143
should work in principle for any chiral drug that contains a carboxylic acid or other acidic group
that forms a salt with the amine groups of cysteamine or other aminothiol.
The fact that relatively low enantioenhancement (20-24%) of D-3PLA was observed on
SAM VIII does not support our original hypothesis—namely, that 3PLA solute might form
stronger intermolecular interactions with L-3PLA bound on the surface leading to higher
selectivity compared to L-cysteine. A plausible explanation can be inferred from the data on
contact angle and film thickness. The higher contact angle for water on L-PLA/cysteamine
(SAM VIII) versus L-cysteine (SAM IV) indicates SAM VIII has a lower surface energy, while
the thickness of SAM VIII (1.9 nm) suggests that molecules of 3PLA on the surface are oriented
close to perpendicular rather than laying flat on the surface. Accordingly, it is likely that the
phenyl substituents are exposed at the surface, and the carboxylate groups in the overlayer are
buried at the interface with cysteamine, both of which should significantly reduce the potential
for hydrogen-bonding interactions with molecules of solute during crystallization. In addition, if
the stereogenic centers of the molecules are buried within the overlayer, it is possible that the
chirality of the molecule is effectively reduced at the surface. Until SAMs of other chiral drugs
are examined, the broader utility of this approach for resolving racemates cannot be verified.
REFERENCES
(1) Yan, L.; Marzolin, C.; Terfort, A.; Whitesides, G. M. Langmuir 1997, 13, 6704.
(2) Guang, C.; Hong, H.-G.; Mallouk, T. E. Acc. Chem. Res. 1992, 25, 420.
(3) Lee, H.; Kepley, L. J.; Hong, H.-G.; Akhter, S.; Mallouk, T. E. J. Phys. Chem. 1988, 92,
2597.
(4) Spadavecchia, J.; Moreau, J.; Hottin, J.; Canva, M. Sens. Actuators B 2009, 143, 139.
(5) Yu, H. Z.; Zhao, J. W.; Wang, Y. Q.; Cai, S. M.; Liu, Z. F. J. Electroanal. Chem. 1997,
438, 221.
(6) Caldwell, W. B.; Chen, K.; Mirkin, C. A.; Babinec, S. J. Langmuir 1993, 9, 1945.
(7) Michota, A.; Kudelski, A.; Bukowska, J. Surf. Sci. 2002, 502-5-3, 214.
(8) Shervedani, R. K.; Farahbakhsh, A.; Bagherzadeh, M. Anal. Chim. Acta 2007, 587, 254.
144
(9) Jacques, J., Collet, A.; Wilen, S. H. Enantiomers, Racemates, and Resolutions; John
Wiley and Sons: New York, 1981.
(10) Collet, A.; Brienne, M. J.; Jacques, J. Chem. Rev. 1980, 80, 215.
(11) Bain, C. D.; Troughton, E. B.; Tao, Y. T.; Evall, J.; Whitesides, G. M.; Nuzzo, R. G.
Journal of the American Chemical Society 1989, 111, 321.
(12) Fleischer, H.; Dienes, Y.; Mathiasch, B.; Schmitt, V.; Schollmeyer, D. Inorg. Chem.
2005, 44, 8087.
(13) Ihs, A.; Liedberg, B. Journal of Colloid and Interface Science 1991, 144, 282.
145
6: Resolution of N-acetylleucine via crystallization
on chiral molecular films
6.1 INTRODUCTION
In this chapter we describe work focusing on N-acetylleucine (NAL), which is an acetyl
derivative of the natural amino acid leucine that promotes growth and repair of muscle tissue
(e.g. bones, skin and muscles).1 The objective of this work was to broaden our investigation
evaluating chiral SAMs as templates for carrying out enantioselective crystallization. We
demonstrated earlier in chapter 4 that crystallization of racemic 3-phenyllactic acid (3PLA) on
chiral SAMs results in preferential growth of one enantiomer over the other with up to 30%
enantiomeric enrichment. In addition, oriented growth of crystals of D- or L-3PLA was face
selective on the (004) face, indicating that molecular aggregation on D- and L-cysteine occurs
via specific diastereomeric hydrogen-bonding interactions that leads to chiral discrimination. We
wanted to investigate a different chiral drug to determine if our surface-based approach for
resolving enantiomers would work with other racemic systems to establish the utility of this
method for a wider range of chiral pharmaceuticals capable of hydrogen bonding. We also
wanted to assess whether the combination of amide and carboxylic acid functional groups on
NAL would lead to greater enantioselectivity compared to 3PLA, and to determine if oriented
growth of crystals of NAL occurred as further evidence in support of our proposed mechanism
that chiral discrimination takes place predominantly on crystalline faces that maximize
diastereomeric hydrogen-bonding interactions. We chose to investigate crystallization of racemic
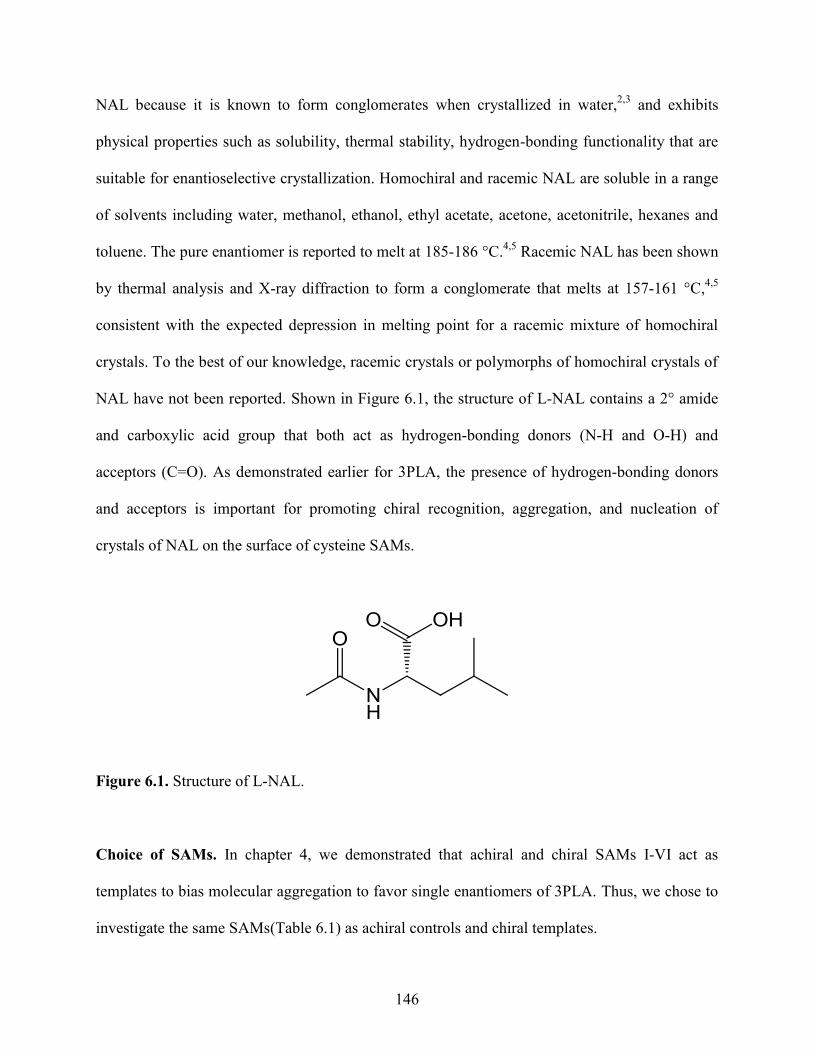
146
NAL because it is known to form conglomerates when crystallized in water,2,3
and exhibits
physical properties such as solubility, thermal stability, hydrogen-bonding functionality that are
suitable for enantioselective crystallization. Homochiral and racemic NAL are soluble in a range
of solvents including water, methanol, ethanol, ethyl acetate, acetone, acetonitrile, hexanes and
toluene. The pure enantiomer is reported to melt at 185-186 °C.4,5
Racemic NAL has been shown
by thermal analysis and X-ray diffraction to form a conglomerate that melts at 157-161 °C,4,5
consistent with the expected depression in melting point for a racemic mixture of homochiral
crystals. To the best of our knowledge, racemic crystals or polymorphs of homochiral crystals of
NAL have not been reported. Shown in Figure 6.1, the structure of L-NAL contains a 2° amide
and carboxylic acid group that both act as hydrogen-bonding donors (N-H and O-H) and
acceptors (C=O). As demonstrated earlier for 3PLA, the presence of hydrogen-bonding donors
and acceptors is important for promoting chiral recognition, aggregation, and nucleation of
crystals of NAL on the surface of cysteine SAMs.
Figure 6.1. Structure of L-NAL.
Choice of SAMs. In chapter 4, we demonstrated that achiral and chiral SAMs I-VI act as
templates to bias molecular aggregation to favor single enantiomers of 3PLA. Thus, we chose to
investigate the same SAMs(Table 6.1) as achiral controls and chiral templates.
147
Table 6.1. Thiols used to prepare achiral and chiral SAMs on gold.
SAM achiral thiol used SAM chiral thiol used
I dodecanethiol IV L-cysteine
II 11-mercaptoundecanol V N-acetyl-L-cysteine
III 11-mercaptoundecanoic acid VI D-cysteine
6.2 OBJECTIVES
It is important to distinguish the work done on NAL from the previous work with 3PLA. In
both of these racemic model systems, we are interested in influencing the process of
enantioseparation by controlling the chirality and diastereomeric interactions at the surface. We
have shown that chiral surfaces are enriched with ~30% 3PLA with the major enantiomer of the
opposite chirality to that of the SAM. Our work with NAL primarily focused on increasing the
amount of enantiomeric purity by comparing the crystallization behavior of NAL on chiral
SAMs to 3PLA.
1. We wanted to examine growth of crystals of NAL on chiral and achiral SAMs as control
surfaces to determine if NAL forms conglomerates similar to those grown on glass
substrates and thus determine the amount of enantiomeric enrichment on chiral SAMs in
order to expand our surface-based approach to other libraries of racemic drugs.
2. We also wanted to elucidate the mechanism of chiral discrimination by determining the
specific planes templated on chiral surfaces. We know that (004) face is the major
nucleating plane for 3PLA grown on chiral SAMs. We wanted to determine if the
selectivity for a particular face is preserved or switched when NAL is grown on chiral
SAMs. Thus, we wanted to determine if the molecules of L-NAL are oriented in a
specific orientation that maximizes the hydrogen-bonding interactions on chiral surfaces
148
like 3-PLA such that certain faces grow in contact with the SAM and thus quantify the
relative distribution of crystallographic orientation on different faces of these crystals.
6.3 EXPERIMENTAL
All reagents and solvents were purchased from Aldrich or Pharmco and were used
without further purification.
Preparation of self-assembled monolayers (SAMs) on gold. Commercially available ω-
substituted alkanethiols were purchased from Aldrich, Alfa Aesar, TCI and MP Biomedicals and
used without further purification. Absolute ethanol was purchased from Pharmco. Glass slides (1
x 3 x 0.04 in.) coated with 50 Å of chromium and 1000 Å of gold were purchased from
Evaporated Metal Films. NAL was purchased from TCI and used without further purification.
SAMs on gold substrates were prepared as follows. The gold slides were cut into 1 x 1 in.
squares and cleaned by plasma oxidation (SPI Supplies Plasma-Prep II) for 1 minute, rinsed with
absolute ethanol and deionized water, and dried under nitrogen. SAMs of ω-substituted
alkanethiols were generated by immersing the slides in 2 mM solutions of dodecanethiol (SAM
I), 11-mercaptoundecanol (SAM II), or 11-mercaptoundecanoic acid (SAM III) for 24 h at RT.
The resulting SAMs were rinsed with absolute ethanol and dried with nitrogen prior to
characterization and crystallization experiments. Chiral SAMs of cysteine were prepared by
immersing the slides in 2mM aqueous solution of L-cysteine (SAM IV), N-acetyl-L-cysteine
(SAM V), and D-cysteine (SAM VI), for 24 h at RT.
Characterization of SAMs. Achiral and chiral SAMs were characterized by contact angle
goniometry, ellipsometry, grazing-angle FT-IR, and optical microscopy. Contact angle
149
measurements on SAMs and bare gold were determined using a Ramé-Hart Model 100-00
Goniometer (Mountain Lakes, NJ) by depositing 1 µL drops of water on surfaces using a Ramé-
Hart Automated Dispenser. The contact angles were measured using the DROP image program,6
and the contact angles were determined from the average of 5 drops per SAM deposited in
different locations on three separate SAMs. The thicknesses of SAMs were measured using a
Photoelectric Rudolf 439L633P ellipsometer (Rudolf Instruments, Fairfield, NJ) equipped with a
He-Ne laser, λ = 632.8 nm, angle of incidence 70°. Thickness of films on the surface of gold was
determined at five separate points and averaged using a refractive index of 1.47.7 All values of
film thicknesses were determined using the software package 439PCS11 Ellipsometry Analysis
from Rudolph instruments.8 Deposition of SAMs on gold was verified by grazing-angle IR
spectroscopy with a BRUKER Optics IR Spectrometer equipped with a VERTEX70 Auto
Seagull grazing-angle accessory and a liquid nitrogen cooled MCTA detector with an incident
beam angle of 85° relative to the surface of gold substrates. The optical path was purged with
nitrogen gas prior collecting data. Sixty-four scans were collected for samples at 4 cm-1
resolution scanning from 4000 to 400 cm-1
, and the data was analyzed using the OPUS software
package.9 Background spectra were obtained using a clean gold substrate. The contact angles,
film thicknesses and IR spectra for SAMs I-VII and bare gold are discussed in chapter 4.
Growth of homochiral crystals and conglomerates of NAL on glass. Crystals of 1 were
prepared by dissolving N-acetyl-L-leucine in water at room temperature to form a solution (~ 0.1
M) that was allowed to evaporate slowly at room temperature in a glass vial. Clear, colorless
blocks of homochiral crystals (1) formed in solution after 1-2 days. Crystals of 1 were isolated
by filtration. Crystals of the conglomerate (2) were prepared by dissolving racemic N-
150
acetylleucine in water at room temperature to form a concentrated aqueous solution (~0.2 M) that
was allowed to cool and evaporate slowly at room temperature in a glass vial. Clear, colorless
blocks of 2 formed in solution after 3-4 days. Crystals of 2 were isolated by filtration.
Growth of conglomerates of NAL on SAMs. Crystallization experiments were carried out on
achiral and chiral SAMs and also on glass and bare gold as controls for NAL. Ten drops of 0.2
M and 0.1 M solutions of racemic and L-NAL, respectively, were added to the surface of SAMs
without allowing the solution to touch the edges of the substrate in order to prevent nucleation of
crystals on bare glass. The slides were placed in petri dishes that were then covered with a lid to
allow the solvent to evaporate slowly over days from small gaps between the petri dish and
cover. After ~50% of NAL crystallized from solution onto the surface, the crystals were isolated
by removing the mother liquor with a pipette to prevent further crystallization of NAL remaining
in solution. The crystals and substrates were then gently rinsed with a small amount (~2 mL) of
hexanes and dried under a stream of nitrogen gas. Five separate crystallization experiments were
carried out on each of the different SAMs and control surfaces.
Characterization of the structure and composition of crystals. Samples of crystals were
characterized and the enantiomeric composition identified using a combination of optical
microscopy, differential scanning calorimetry (DSC), IR spectroscopy, powder X-ray diffraction
(PXRD), and single-crystal X-ray diffraction (SXRD). Bulk samples of all crystals were isolated
and examined under a low-power optical polarizing stereomicroscope to determine the
homogeneity of samples, and to ensure that single crystals analyzed by SXRD were not twinned
or cracked. PXRD data were collected on a Bruker-AXS D8-Advance diffractometer using Cu-
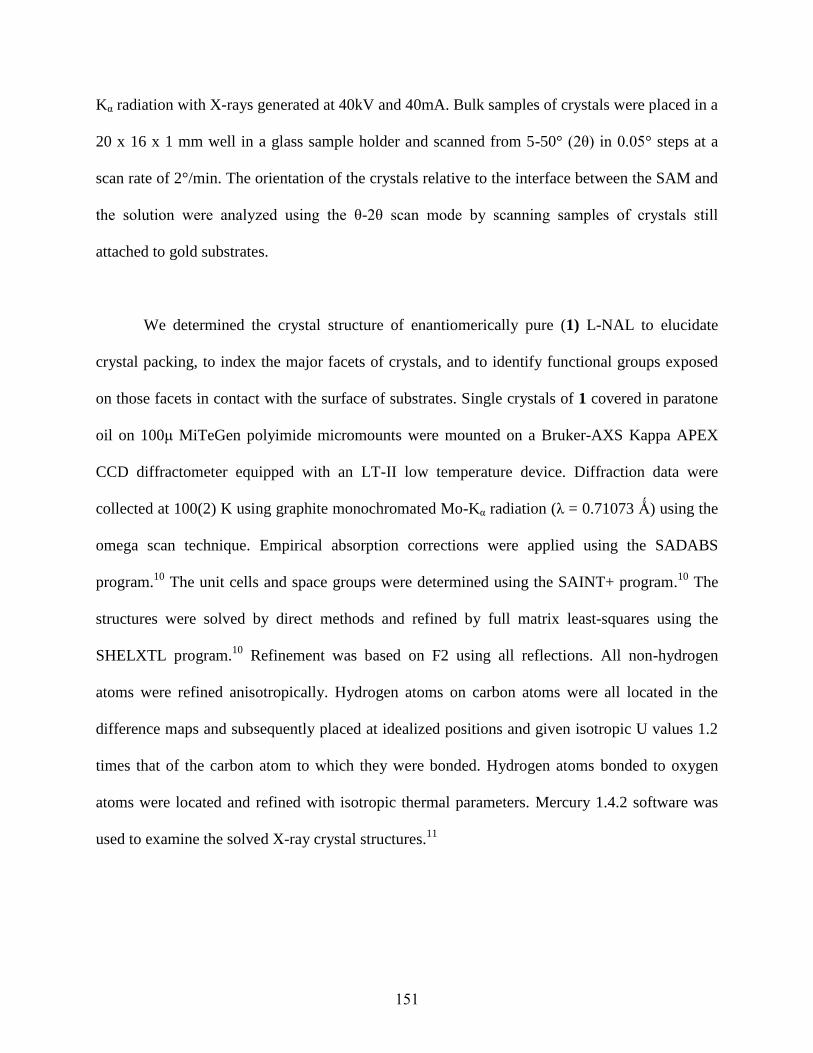
151
Kα radiation with X-rays generated at 40kV and 40mA. Bulk samples of crystals were placed in a
20 x 16 x 1 mm well in a glass sample holder and scanned from 5-50° (2θ) in 0.05° steps at a
scan rate of 2°/min. The orientation of the crystals relative to the interface between the SAM and
the solution were analyzed using the θ-2θ scan mode by scanning samples of crystals still
attached to gold substrates.
We determined the crystal structure of enantiomerically pure (1) L-NAL to elucidate
crystal packing, to index the major facets of crystals, and to identify functional groups exposed
on those facets in contact with the surface of substrates. Single crystals of 1 covered in paratone
oil on 100μ MiTeGen polyimide micromounts were mounted on a Bruker-AXS Kappa APEX
CCD diffractometer equipped with an LT-II low temperature device. Diffraction data were
collected at 100(2) K using graphite monochromated Mo-Kα radiation (λ = 0.71073 Ǻ) using the
omega scan technique. Empirical absorption corrections were applied using the SADABS
program.10
The unit cells and space groups were determined using the SAINT+ program.10
The
structures were solved by direct methods and refined by full matrix least-squares using the
SHELXTL program.10
Refinement was based on F2 using all reflections. All non-hydrogen
atoms were refined anisotropically. Hydrogen atoms on carbon atoms were all located in the
difference maps and subsequently placed at idealized positions and given isotropic U values 1.2
times that of the carbon atom to which they were bonded. Hydrogen atoms bonded to oxygen
atoms were located and refined with isotropic thermal parameters. Mercury 1.4.2 software was
used to examine the solved X-ray crystal structures.11
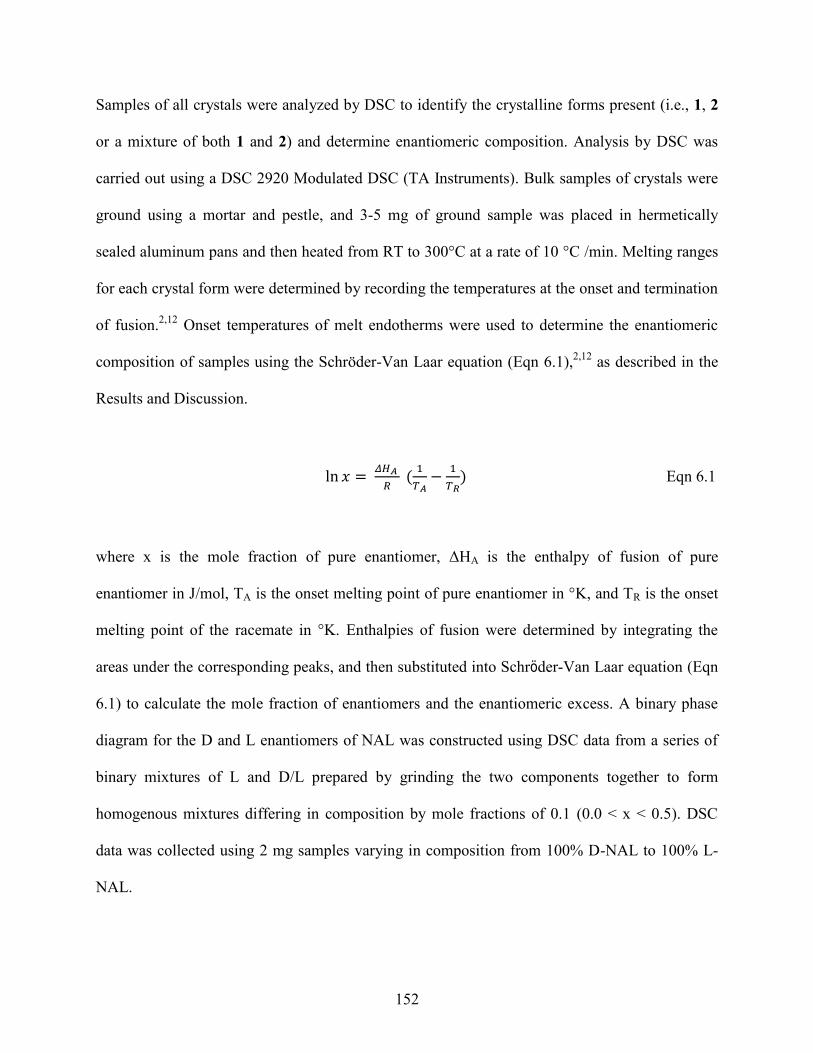
152
Samples of all crystals were analyzed by DSC to identify the crystalline forms present (i.e., 1, 2
or a mixture of both 1 and 2) and determine enantiomeric composition. Analysis by DSC was
carried out using a DSC 2920 Modulated DSC (TA Instruments). Bulk samples of crystals were
ground using a mortar and pestle, and 3-5 mg of ground sample was placed in hermetically
sealed aluminum pans and then heated from RT to 300°C at a rate of 10 °C /min. Melting ranges
for each crystal form were determined by recording the temperatures at the onset and termination
of fusion.2,12
Onset temperatures of melt endotherms were used to determine the enantiomeric
composition of samples using the Schröder-Van Laar equation (Eqn 6.1),2,12
as described in the
Results and Discussion.
Eqn 6.1
where x is the mole fraction of pure enantiomer, ΔHA is the enthalpy of fusion of pure
enantiomer in J/mol, TA is the onset melting point of pure enantiomer in °K, and TR is the onset
melting point of the racemate in °K. Enthalpies of fusion were determined by integrating the
areas under the corresponding peaks, and then substituted into Schröder-Van Laar equation (Eqn
6.1) to calculate the mole fraction of enantiomers and the enantiomeric excess. A binary phase
diagram for the D and L enantiomers of NAL was constructed using DSC data from a series of
binary mixtures of L and D/L prepared by grinding the two components together to form
homogenous mixtures differing in composition by mole fractions of 0.1 (0.0 < x < 0.5). DSC
data was collected using 2 mg samples varying in composition from 100% D-NAL to 100% L-
NAL.
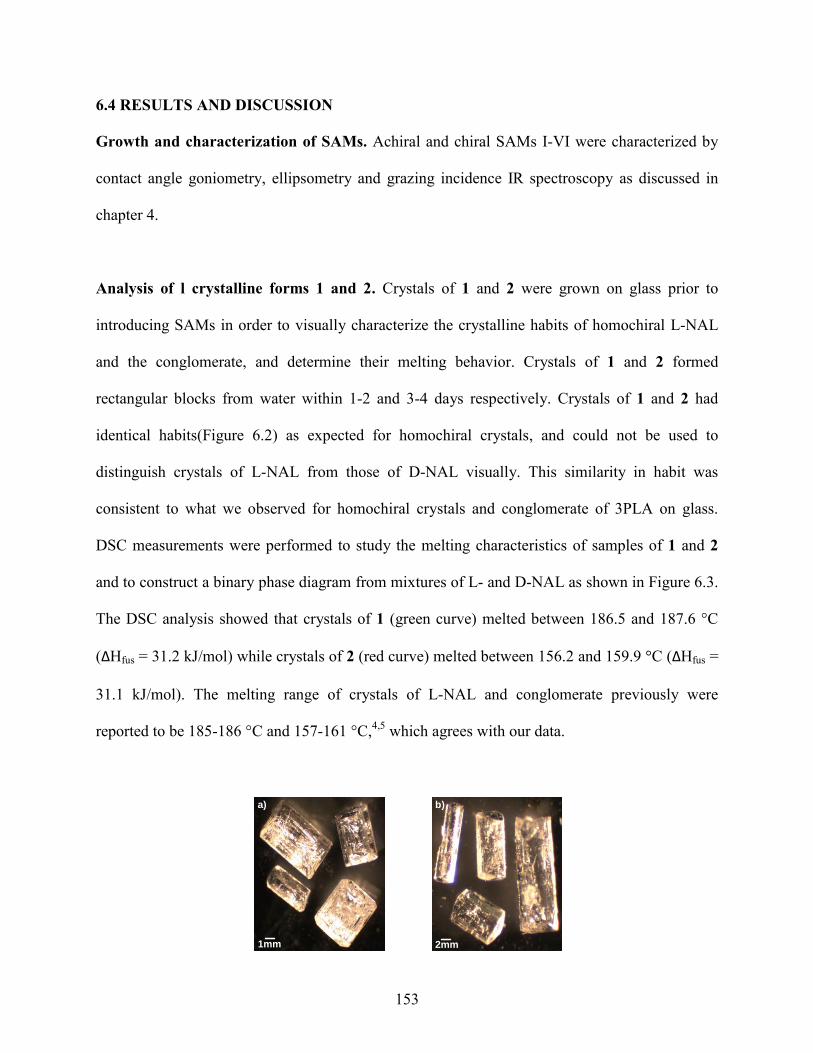
153
6.4 RESULTS AND DISCUSSION
Growth and characterization of SAMs. Achiral and chiral SAMs I-VI were characterized by
contact angle goniometry, ellipsometry and grazing incidence IR spectroscopy as discussed in
chapter 4.
Analysis of l crystalline forms 1 and 2. Crystals of 1 and 2 were grown on glass prior to
introducing SAMs in order to visually characterize the crystalline habits of homochiral L-NAL
and the conglomerate, and determine their melting behavior. Crystals of 1 and 2 formed
rectangular blocks from water within 1-2 and 3-4 days respectively. Crystals of 1 and 2 had
identical habits(Figure 6.2) as expected for homochiral crystals, and could not be used to
distinguish crystals of L-NAL from those of D-NAL visually. This similarity in habit was
consistent to what we observed for homochiral crystals and conglomerate of 3PLA on glass.
DSC measurements were performed to study the melting characteristics of samples of 1 and 2
and to construct a binary phase diagram from mixtures of L- and D-NAL as shown in Figure 6.3.
The DSC analysis showed that crystals of 1 (green curve) melted between 186.5 and 187.6 °C
(ΔHfus = 31.2 kJ/mol) while crystals of 2 (red curve) melted between 156.2 and 159.9 °C (ΔHfus =
31.1 kJ/mol). The melting range of crystals of L-NAL and conglomerate previously were
reported to be 185-186 °C and 157-161 °C,4,5
which agrees with our data.
1mm
a)
2mm
b)
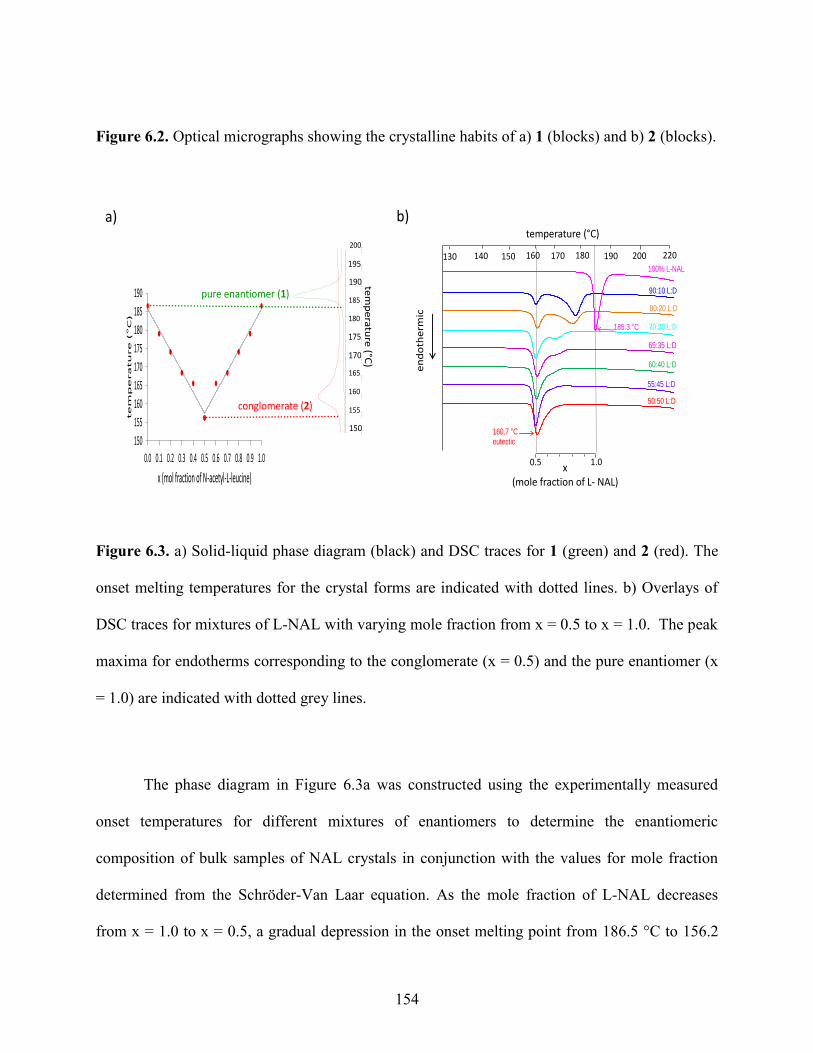
154
Figure 6.2. Optical micrographs showing the crystalline habits of a) 1 (blocks) and b) 2 (blocks).
Figure 6.3. a) Solid-liquid phase diagram (black) and DSC traces for 1 (green) and 2 (red). The
onset melting temperatures for the crystal forms are indicated with dotted lines. b) Overlays of
DSC traces for mixtures of L-NAL with varying mole fraction from x = 0.5 to x = 1.0. The peak
maxima for endotherms corresponding to the conglomerate (x = 0.5) and the pure enantiomer (x
= 1.0) are indicated with dotted grey lines.
The phase diagram in Figure 6.3a was constructed using the experimentally measured
onset temperatures for different mixtures of enantiomers to determine the enantiomeric
composition of bulk samples of NAL crystals in conjunction with the values for mole fraction
determined from the Schröder-Van Laar equation. As the mole fraction of L-NAL decreases
from x = 1.0 to x = 0.5, a gradual depression in the onset melting point from 186.5 °C to 156.2
tem
pe
ratu
re ( C
)150
155
160
165
170
175
180
185
190
0.0 0.1 0.2 0.3 0.4 0.5 0.6 0.7 0.8 0.9 1.0
te
mp
era
tu
re
( C
)
x (mol fraction of N-acetyl-L-leucine)
conglomerate (2)
pure enantiomer (1)
150
155
160
165
170
175
180
185
190
195
200
150
155
165
160
175
170
180
190
185
195
200
a) b)
en
do
the
rmic
x(mole fraction of L- NAL)
0.5 1.0
100% L-NAL
90:10 L:D
80:20 L:D
70:30 L:D
60:40 L:D
50:50 L:D
160.7 Ceutectic
185.3 C
65:35 L:D
55:45 L:D
temperature (°C)
140 150 160 170 180 190 220200130
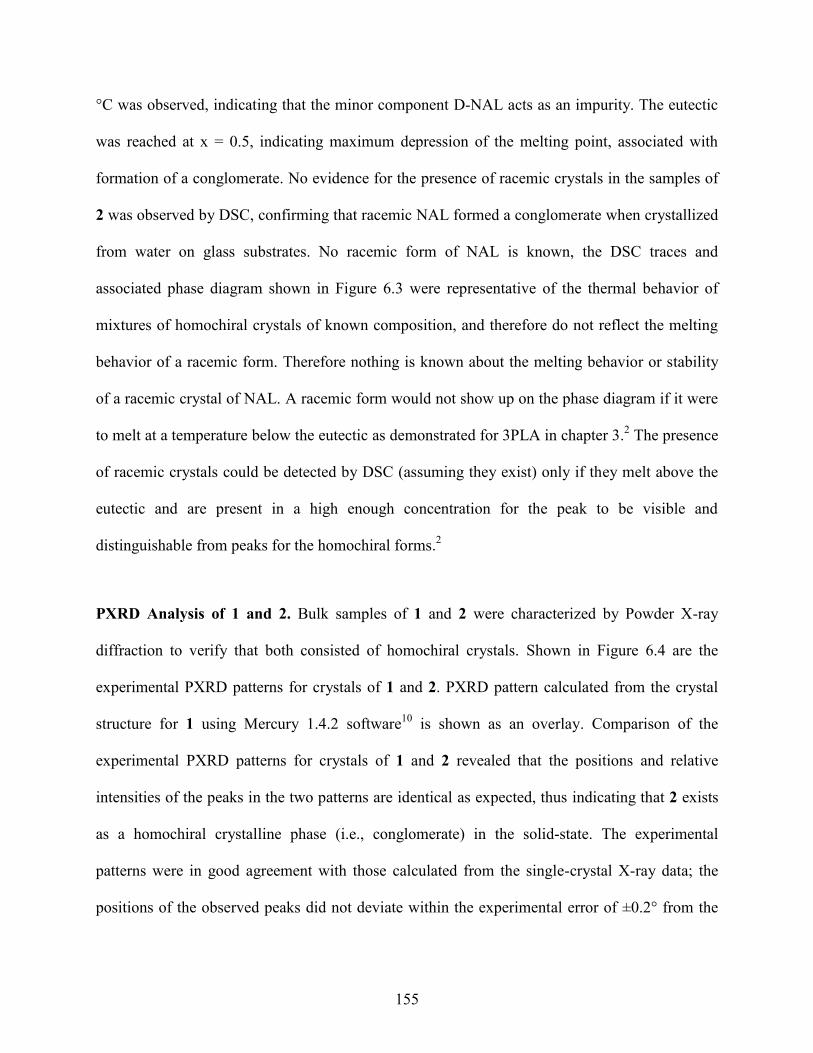
155
°C was observed, indicating that the minor component D-NAL acts as an impurity. The eutectic
was reached at x = 0.5, indicating maximum depression of the melting point, associated with
formation of a conglomerate. No evidence for the presence of racemic crystals in the samples of
2 was observed by DSC, confirming that racemic NAL formed a conglomerate when crystallized
from water on glass substrates. No racemic form of NAL is known, the DSC traces and
associated phase diagram shown in Figure 6.3 were representative of the thermal behavior of
mixtures of homochiral crystals of known composition, and therefore do not reflect the melting
behavior of a racemic form. Therefore nothing is known about the melting behavior or stability
of a racemic crystal of NAL. A racemic form would not show up on the phase diagram if it were
to melt at a temperature below the eutectic as demonstrated for 3PLA in chapter 3.2 The presence
of racemic crystals could be detected by DSC (assuming they exist) only if they melt above the
eutectic and are present in a high enough concentration for the peak to be visible and
distinguishable from peaks for the homochiral forms.2
PXRD Analysis of 1 and 2. Bulk samples of 1 and 2 were characterized by Powder X-ray
diffraction to verify that both consisted of homochiral crystals. Shown in Figure 6.4 are the
experimental PXRD patterns for crystals of 1 and 2. PXRD pattern calculated from the crystal
structure for 1 using Mercury 1.4.2 software10
is shown as an overlay. Comparison of the
experimental PXRD patterns for crystals of 1 and 2 revealed that the positions and relative
intensities of the peaks in the two patterns are identical as expected, thus indicating that 2 exists
as a homochiral crystalline phase (i.e., conglomerate) in the solid-state. The experimental
patterns were in good agreement with those calculated from the single-crystal X-ray data; the
positions of the observed peaks did not deviate within the experimental error of ±0.2° from the
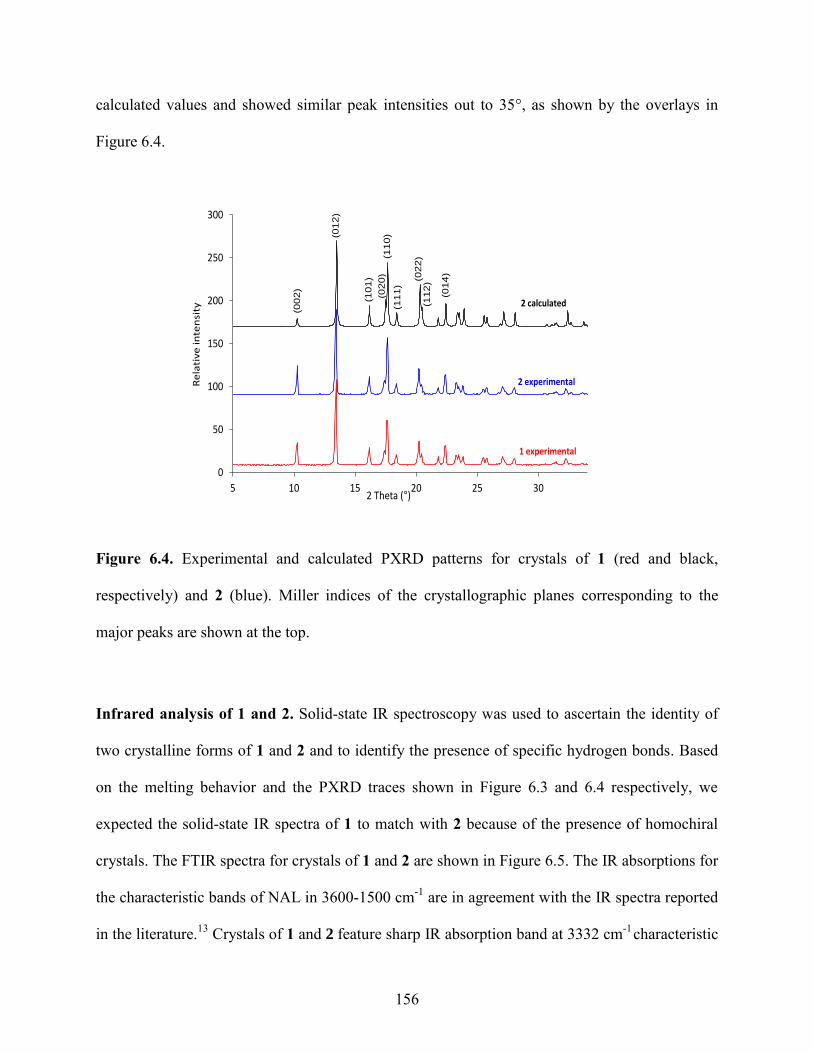
156
calculated values and showed similar peak intensities out to 35°, as shown by the overlays in
Figure 6.4.
Figure 6.4. Experimental and calculated PXRD patterns for crystals of 1 (red and black,
respectively) and 2 (blue). Miller indices of the crystallographic planes corresponding to the
major peaks are shown at the top.
Infrared analysis of 1 and 2. Solid-state IR spectroscopy was used to ascertain the identity of
two crystalline forms of 1 and 2 and to identify the presence of specific hydrogen bonds. Based
on the melting behavior and the PXRD traces shown in Figure 6.3 and 6.4 respectively, we
expected the solid-state IR spectra of 1 to match with 2 because of the presence of homochiral
crystals. The FTIR spectra for crystals of 1 and 2 are shown in Figure 6.5. The IR absorptions for
the characteristic bands of NAL in 3600-1500 cm-1
are in agreement with the IR spectra reported
in the literature.13
Crystals of 1 and 2 feature sharp IR absorption band at 3332 cm-1
characteristic
0
50
100
150
200
250
300
5 10 15 20 25 30
Re
lati
ve
in
ten
sity
2 Theta (°)
2 experimental
2 calculated(0
02
)
(01
2)
(11
0)
(02
2)
(01
4)
(10
1)
(020)
(11
1)
(11
2)
1 experimental
157
of NH stretching and an amide II band at 1559 cm-1
due to NH deformation. Both spectra show
strong amide I bands for carbonyl group at 1699 cm-1
. A very broad band from 3600-2400 cm-1
corresponding to acid O-H stretching was also observed in the spectra of 1 and 2 and a reduction
in acid C=O stretching frequency by 65 cm-1
indicates that the amide and carboxylic acid groups
participate in hydrogen bonding14
which correlates with the hydrogen-bonding interactions
present in the crystal structure of 1 that shows two different types of acid-amide interactions. In
one type, an amide N-H group is the donor and carboxylic acid O=C group is the acceptor (N…
O
= 2.94 Å, H…
O = 2.09 Å). In the second type, a carboxylic acid O-H group is the donor and an
amide O=C group is the acceptor (O…
O = 2.56 Å, O…
H = 1.77 Å). The IR spectra for the two
forms are identical with no spurious peaks, supporting our findings from the PXRD analysis that
forms 1 and 2 consist of the same homochiral crystalline phase. Moreover, racemic crystals if
present would exhibit a unique PXRD trace different from the PXRD traces of homochiral
crystals due to different crystal structures of homochiral and heterochiral racemic crystals15
confirming the absence of racemic crystal of NAL in the samples.
158
Figure 6.5. FTIR spectra of NAL crystals of 1 (red) and 2 (blue).
Crystallization of L-NAL on chiral SAMs. As described previously for crystals of L-3PLA, we
wanted to determine if crystals of L-NAL grew preferentially oriented on faces that maximize
hydrogen-bonding interactions between molecules of L-NAL and cysteine on the surface of
SAMs. Toward that end, we compared crystallization of L-NAL to that of racemic NAL on
chiral SAMs, and also compared the habits of crystals to those grown on control surfaces, and
determined the positions and relative intensities of peaks in the PXRD traces.
Face selective nucleation of L-NAL on chiral SAMs. Crystals of L-NAL grown from water on
chiral SAMs were analyzed by PXRD while they were still attached to the gold substrates and
75.00
80.00
85.00
90.00
95.00
100.00
105.00
110.00
600110016002100260031003600
%Tra
nsm
itta
nce
Wavenumbers (cm-1)
NHs
3332
NHd
1559
60.00
70.00
80.00
90.00
100.00
110.00
600110016002100260031003600
%Tra
nsm
itta
nce
Wavenumbers (cm-1)
NHs
3332
C=O1699
NHd
1559
C=O1699
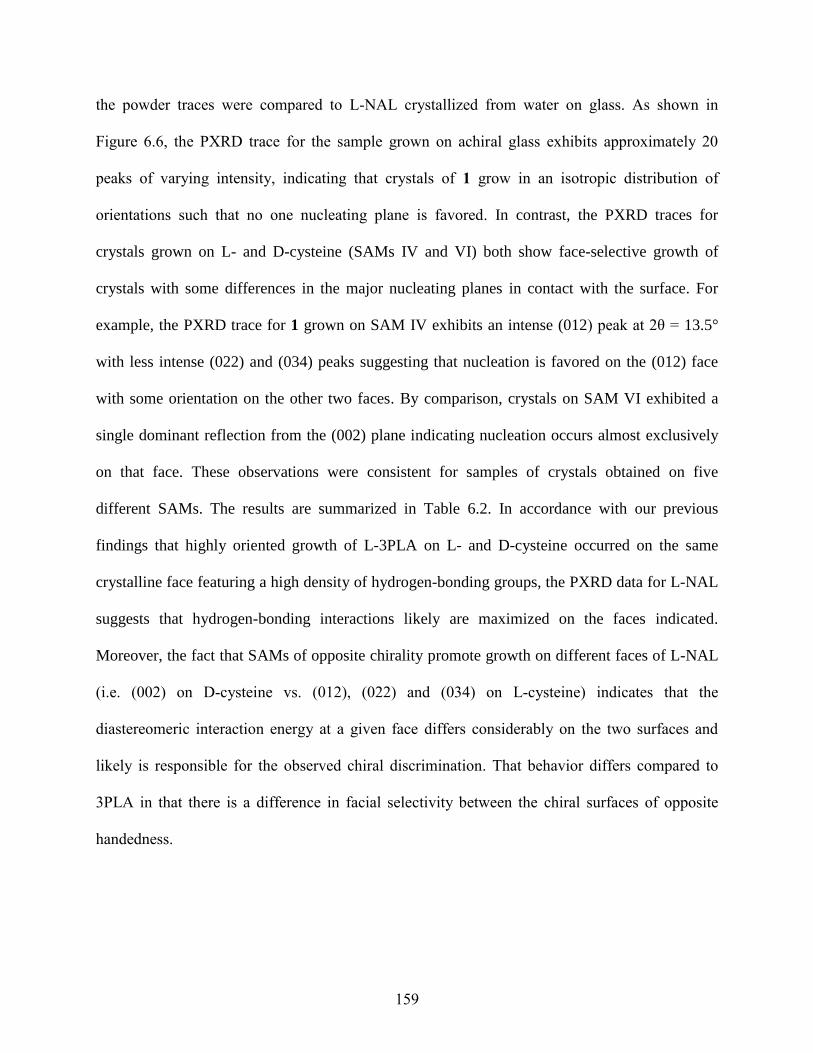
159
the powder traces were compared to L-NAL crystallized from water on glass. As shown in
Figure 6.6, the PXRD trace for the sample grown on achiral glass exhibits approximately 20
peaks of varying intensity, indicating that crystals of 1 grow in an isotropic distribution of
orientations such that no one nucleating plane is favored. In contrast, the PXRD traces for
crystals grown on L- and D-cysteine (SAMs IV and VI) both show face-selective growth of
crystals with some differences in the major nucleating planes in contact with the surface. For
example, the PXRD trace for 1 grown on SAM IV exhibits an intense (012) peak at 2θ = 13.5°
with less intense (022) and (034) peaks suggesting that nucleation is favored on the (012) face
with some orientation on the other two faces. By comparison, crystals on SAM VI exhibited a
single dominant reflection from the (002) plane indicating nucleation occurs almost exclusively
on that face. These observations were consistent for samples of crystals obtained on five
different SAMs. The results are summarized in Table 6.2. In accordance with our previous
findings that highly oriented growth of L-3PLA on L- and D-cysteine occurred on the same
crystalline face featuring a high density of hydrogen-bonding groups, the PXRD data for L-NAL
suggests that hydrogen-bonding interactions likely are maximized on the faces indicated.
Moreover, the fact that SAMs of opposite chirality promote growth on different faces of L-NAL
(i.e. (002) on D-cysteine vs. (012), (022) and (034) on L-cysteine) indicates that the
diastereomeric interaction energy at a given face differs considerably on the two surfaces and
likely is responsible for the observed chiral discrimination. That behavior differs compared to
3PLA in that there is a difference in facial selectivity between the chiral surfaces of opposite
handedness.
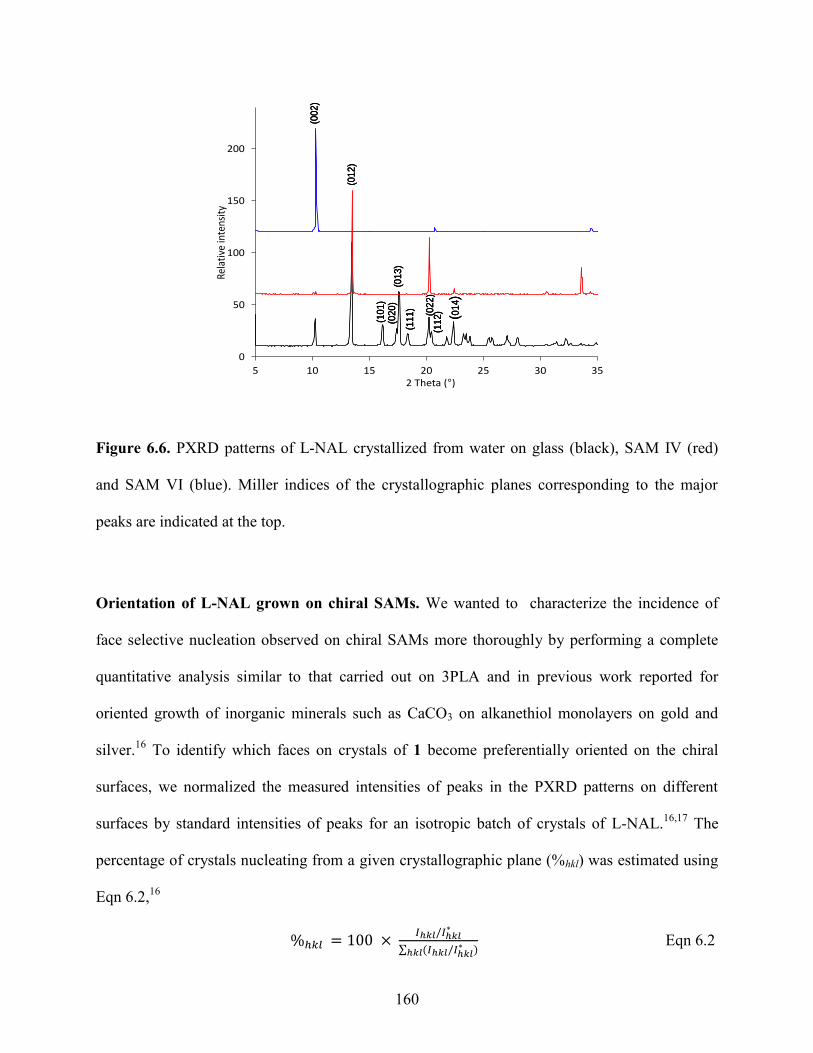
160
Figure 6.6. PXRD patterns of L-NAL crystallized from water on glass (black), SAM IV (red)
and SAM VI (blue). Miller indices of the crystallographic planes corresponding to the major
peaks are indicated at the top.
Orientation of L-NAL grown on chiral SAMs. We wanted to characterize the incidence of
face selective nucleation observed on chiral SAMs more thoroughly by performing a complete
quantitative analysis similar to that carried out on 3PLA and in previous work reported for
oriented growth of inorganic minerals such as CaCO3 on alkanethiol monolayers on gold and
silver.16
To identify which faces on crystals of 1 become preferentially oriented on the chiral
surfaces, we normalized the measured intensities of peaks in the PXRD patterns on different
surfaces by standard intensities of peaks for an isotropic batch of crystals of L-NAL.16,17
The
percentage of crystals nucleating from a given crystallographic plane (%hkl) was estimated using
Eqn 6.2,16
∑
Eqn 6.2
0
50
100
150
200
5 10 15 20 25 30 35
Rela
tive
inte
nsit
y
2 Theta (°)
(002)
(012)
(013)
(01
4)
(101)
(020
)
(111) (022
)(1
12)
(002)
(012)
(013)
(01
4)
(101)
(020
)
(111) (022
)(1
12)
(002)
(012)
(013)
(01
4)
(101)
(020
)
(111) (022
)(1
12)
161
where Ihkl is the normalized intensity of a given peak (hkl) from a sample of crystals of L-NAL
on a chiral SAM, and I*hkl is the normalized intensity of the corresponding peak (hkl) from an
isotropic sample of crystals grown on glass. The results are summarized in Table 6.2 for those
crystalline planes that become >1% more highly oriented on chiral SAMs. It is important to note
that the PXRD data was collected in the θ-2θ scan mode.16
The analysis is, therefore, restricted to
the characterization of crystals that nucleate only from the diffracting planes parallel to the plane
of the substrate (Figure 6.6 and Table 6.2). Crystals nucleating specifically from any other
crystallographic plane cannot be detected in this scan mode. The (012) peak at 2θ = 13.5° is the
most intense peak for crystals expressed both on achiral glass and chiral SAM IV (Figure 6.6)
with just a modest 3% increase in preferred orientation on that already dominant face on
switching the surface from glass to L-cysteine. That result is not surprising considering that
carboxylic acid and amide groups exposed at the (012) plane in the crystal structure of 1 can
form strong hydrogen bonds with glass as well as L-cysteine, and therefore should favor
nucleation to some extent on both surfaces. The greatest change in crystallographic orientation
on SAM IV was observed for the peaks (022) at 2θ = 20.5° and (034) at 2θ = 34.0° with
increases of ~16% and ~64% of crystals oriented on those faces. Analysis of crystal packing in
the structure of 1 suggests that carboxylic acid and amide groups at those three crystallographic
planes likely contribute significantly in promoting nucleation via hydrogen bonding at those
faces on the surface of SAM IV. In contrast, the PXRD data shows that crystallization of 1 on
SAM VI resulted in almost exclusive orientation on the (002) face of crystals. Analysis of
orientation shows a 47% increase in the incidence of nucleation at that crystallographic plane on
switching from glass to D-cysteine (SAM VI). Although analysis also shows increases in
162
orientation of 17% and 36% on the (004) and (133) nucleating planes, the relative intensities of
those peaks are negligible compared to (002) do not contribute significantly. The high degree of
orientation and greater facial selectivity observed for crystals of L-NAL on D-cysteine (vs. L-
cysteine) implies that chiral recognition and discrimination are more pronounced for solute-
surface interactions between molecules with opposite stereochemical configuration (i.e. (S)-NAL
and (R)-cysteine). We later demonstrate similar behavior when racemic NAL is crystallized on
SAMs of L- and D-cysteine such that the enantiomer in excess can be selected based on the
chirality of the SAM.
Table 6.2. Crystallographic orientation of L-NAL grown from water on chiral SAMs.
SAM IV SAM VI
hkla standard int, I*
b I
c %
d I
c %
d
(002) 26.6 3.2 0 100 46.6
(012) 100 100 3.4 - -
(022) 11.8 54.8 15.7 - -
(004) 3.1 - - 4.3 17.2
(014) 12.0 5.8 1.6 - -
(130) 1.6 2.5 5.3 - -
(034) 1.4 26.5 63.8 - -
(133) 1.3 3.8 9.9 3.8 36.2
a Miller indices with intensities of peaks in PXRD pattern of L-NAL grown on chiral SAMs that
are <1% are not included. bIntensities of peaks for randomly oriented L-NAL crystallized from
water on glass. cMeasured intensities of peaks of L-NAL crystallized from water on chiral
surfaces. dPercentage of crystals in the corresponding orientation estimated using Eqn 6.2.
16
Change in habit of L-NAL on chiral SAMs. Enantiomerically pure crystals of L-NAL were
grown from water on SAMs IV, VI, bare gold and glass as controls to determine if templated
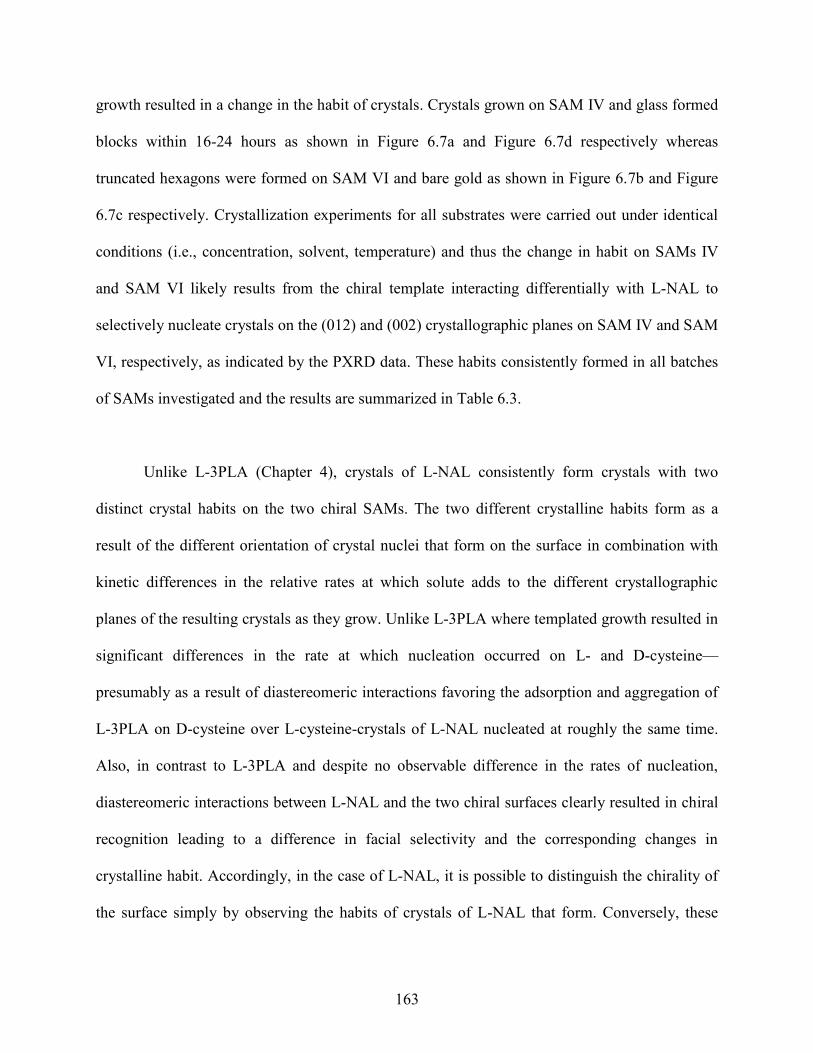
163
growth resulted in a change in the habit of crystals. Crystals grown on SAM IV and glass formed
blocks within 16-24 hours as shown in Figure 6.7a and Figure 6.7d respectively whereas
truncated hexagons were formed on SAM VI and bare gold as shown in Figure 6.7b and Figure
6.7c respectively. Crystallization experiments for all substrates were carried out under identical
conditions (i.e., concentration, solvent, temperature) and thus the change in habit on SAMs IV
and SAM VI likely results from the chiral template interacting differentially with L-NAL to
selectively nucleate crystals on the (012) and (002) crystallographic planes on SAM IV and SAM
VI, respectively, as indicated by the PXRD data. These habits consistently formed in all batches
of SAMs investigated and the results are summarized in Table 6.3.
Unlike L-3PLA (Chapter 4), crystals of L-NAL consistently form crystals with two
distinct crystal habits on the two chiral SAMs. The two different crystalline habits form as a
result of the different orientation of crystal nuclei that form on the surface in combination with
kinetic differences in the relative rates at which solute adds to the different crystallographic
planes of the resulting crystals as they grow. Unlike L-3PLA where templated growth resulted in
significant differences in the rate at which nucleation occurred on L- and D-cysteine—
presumably as a result of diastereomeric interactions favoring the adsorption and aggregation of
L-3PLA on D-cysteine over L-cysteine-crystals of L-NAL nucleated at roughly the same time.
Also, in contrast to L-3PLA and despite no observable difference in the rates of nucleation,
diastereomeric interactions between L-NAL and the two chiral surfaces clearly resulted in chiral
recognition leading to a difference in facial selectivity and the corresponding changes in
crystalline habit. Accordingly, in the case of L-NAL, it is possible to distinguish the chirality of
the surface simply by observing the habits of crystals of L-NAL that form. Conversely, these
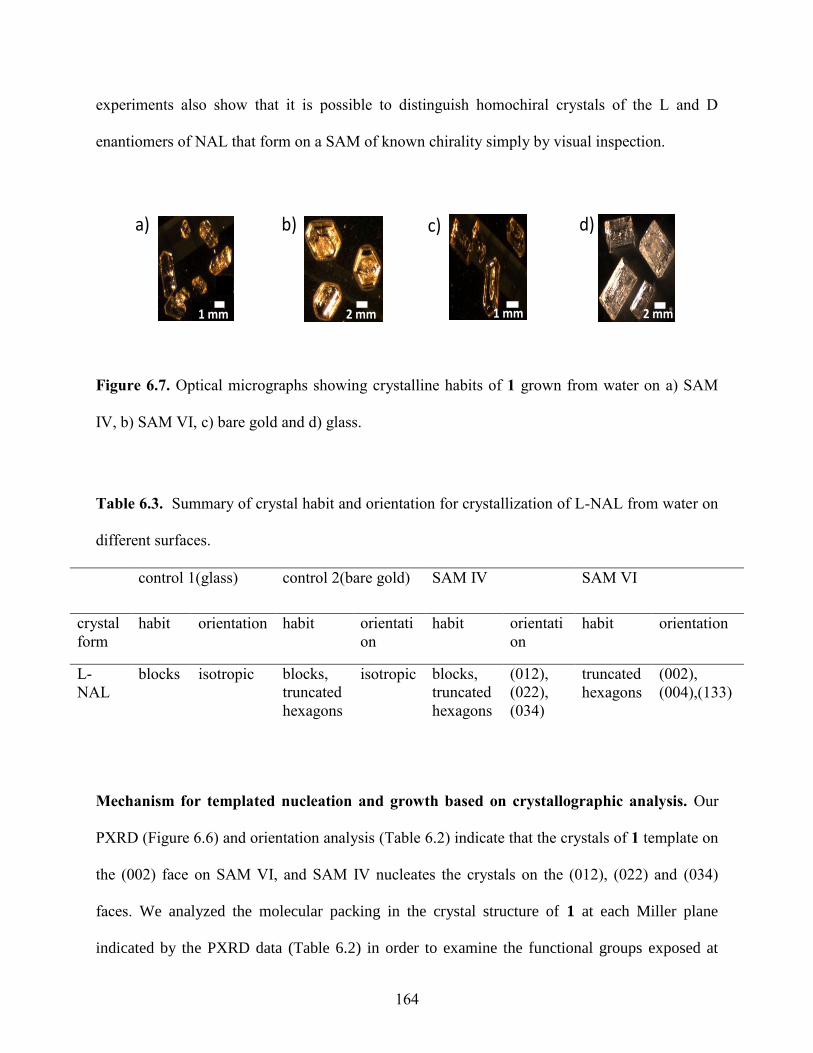
164
experiments also show that it is possible to distinguish homochiral crystals of the L and D
enantiomers of NAL that form on a SAM of known chirality simply by visual inspection.
Figure 6.7. Optical micrographs showing crystalline habits of 1 grown from water on a) SAM
IV, b) SAM VI, c) bare gold and d) glass.
Table 6.3. Summary of crystal habit and orientation for crystallization of L-NAL from water on
different surfaces.
control 1(glass) control 2(bare gold) SAM IV SAM VI
crystal
form
habit orientation habit orientati
on
habit orientati
on
habit orientation
L-
NAL
blocks isotropic blocks,
truncated
hexagons
isotropic blocks,
truncated
hexagons
(012),
(022),
(034)
truncated
hexagons
(002),
(004),(133)
Mechanism for templated nucleation and growth based on crystallographic analysis. Our
PXRD (Figure 6.6) and orientation analysis (Table 6.2) indicate that the crystals of 1 template on
the (002) face on SAM VI, and SAM IV nucleates the crystals on the (012), (022) and (034)
faces. We analyzed the molecular packing in the crystal structure of 1 at each Miller plane
indicated by the PXRD data (Table 6.2) in order to examine the functional groups exposed at
2 mm
b) c)
1 mm
a)
1 mm
d)
2 mm
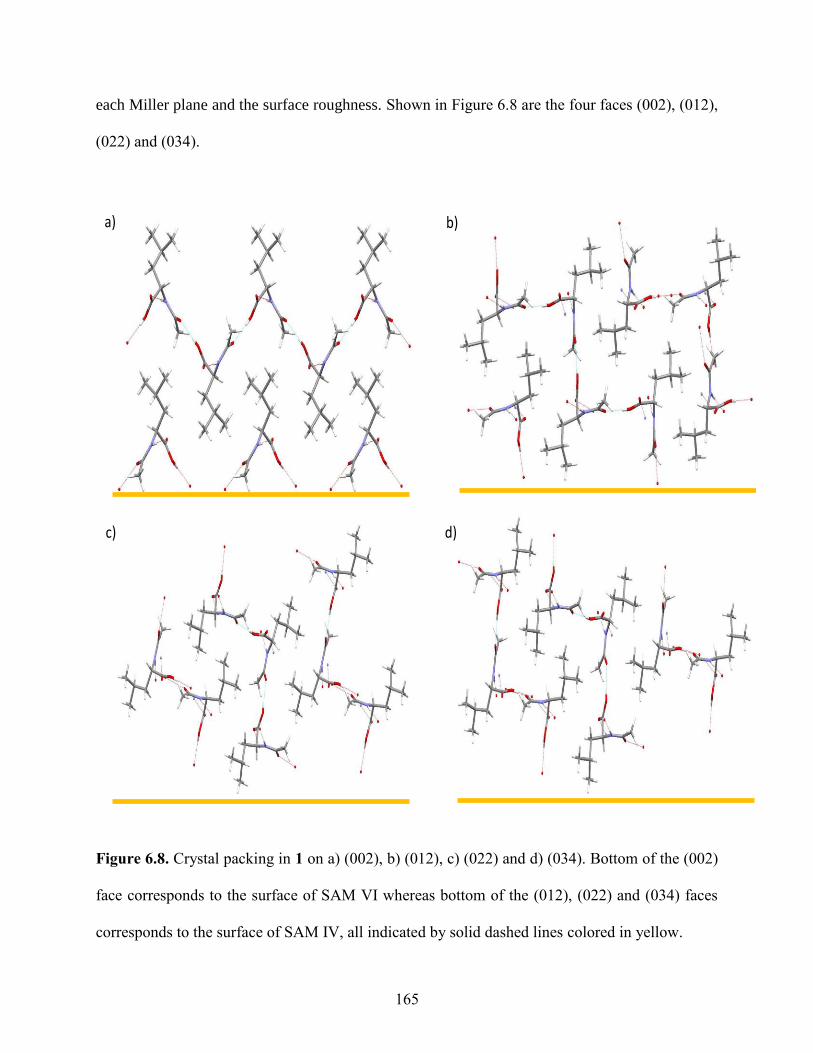
165
each Miller plane and the surface roughness. Shown in Figure 6.8 are the four faces (002), (012),
(022) and (034).
Figure 6.8. Crystal packing in 1 on a) (002), b) (012), c) (022) and d) (034). Bottom of the (002)
face corresponds to the surface of SAM VI whereas bottom of the (012), (022) and (034) faces
corresponds to the surface of SAM IV, all indicated by solid dashed lines colored in yellow.
a) b)
c) d)
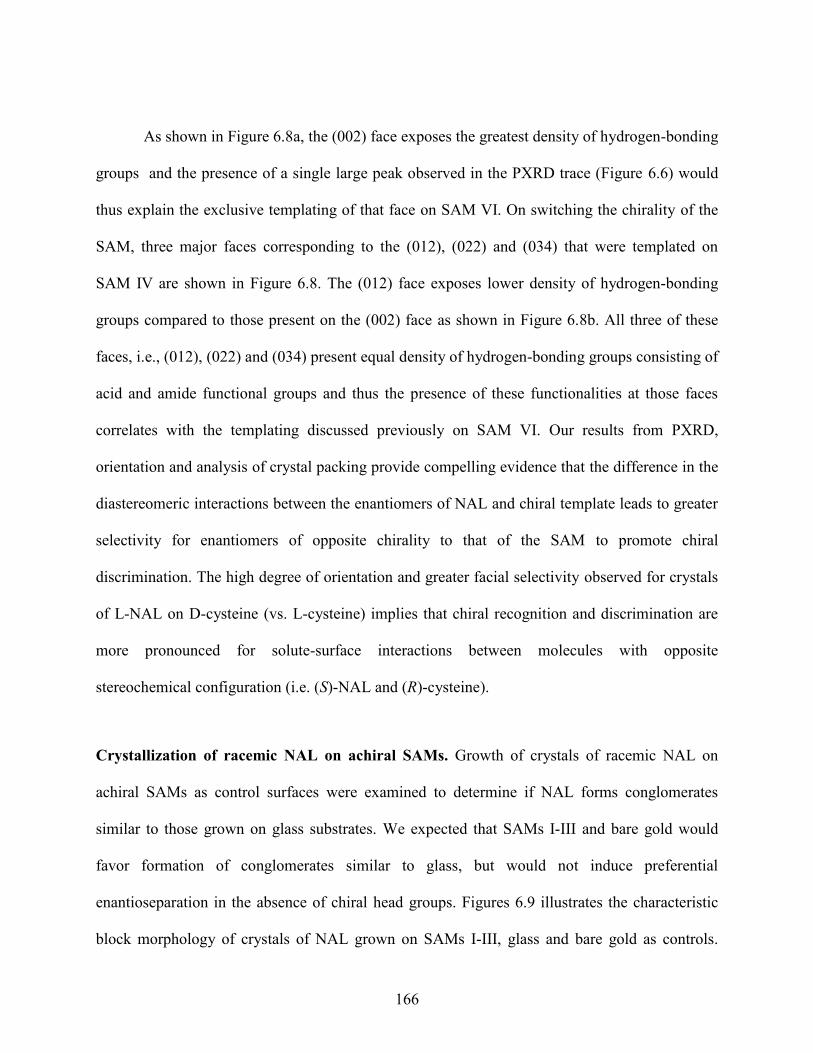
166
As shown in Figure 6.8a, the (002) face exposes the greatest density of hydrogen-bonding
groups and the presence of a single large peak observed in the PXRD trace (Figure 6.6) would
thus explain the exclusive templating of that face on SAM VI. On switching the chirality of the
SAM, three major faces corresponding to the (012), (022) and (034) that were templated on
SAM IV are shown in Figure 6.8. The (012) face exposes lower density of hydrogen-bonding
groups compared to those present on the (002) face as shown in Figure 6.8b. All three of these
faces, i.e., (012), (022) and (034) present equal density of hydrogen-bonding groups consisting of
acid and amide functional groups and thus the presence of these functionalities at those faces
correlates with the templating discussed previously on SAM VI. Our results from PXRD,
orientation and analysis of crystal packing provide compelling evidence that the difference in the
diastereomeric interactions between the enantiomers of NAL and chiral template leads to greater
selectivity for enantiomers of opposite chirality to that of the SAM to promote chiral
discrimination. The high degree of orientation and greater facial selectivity observed for crystals
of L-NAL on D-cysteine (vs. L-cysteine) implies that chiral recognition and discrimination are
more pronounced for solute-surface interactions between molecules with opposite
stereochemical configuration (i.e. (S)-NAL and (R)-cysteine).
Crystallization of racemic NAL on achiral SAMs. Growth of crystals of racemic NAL on
achiral SAMs as control surfaces were examined to determine if NAL forms conglomerates
similar to those grown on glass substrates. We expected that SAMs I-III and bare gold would
favor formation of conglomerates similar to glass, but would not induce preferential
enantioseparation in the absence of chiral head groups. Figures 6.9 illustrates the characteristic
block morphology of crystals of NAL grown on SAMs I-III, glass and bare gold as controls.
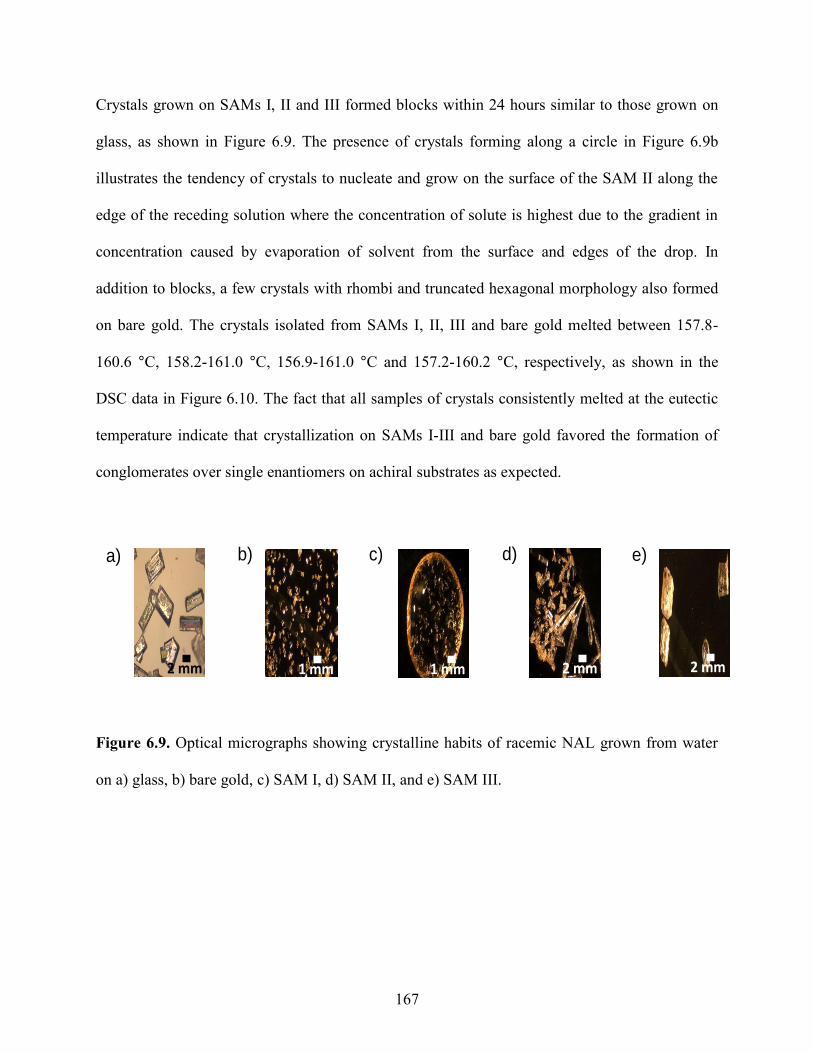
167
Crystals grown on SAMs I, II and III formed blocks within 24 hours similar to those grown on
glass, as shown in Figure 6.9. The presence of crystals forming along a circle in Figure 6.9b
illustrates the tendency of crystals to nucleate and grow on the surface of the SAM II along the
edge of the receding solution where the concentration of solute is highest due to the gradient in
concentration caused by evaporation of solvent from the surface and edges of the drop. In
addition to blocks, a few crystals with rhombi and truncated hexagonal morphology also formed
on bare gold. The crystals isolated from SAMs I, II, III and bare gold melted between 157.8-
160.6 °C, 158.2-161.0 °C, 156.9-161.0 °C and 157.2-160.2 °C, respectively, as shown in the
DSC data in Figure 6.10. The fact that all samples of crystals consistently melted at the eutectic
temperature indicate that crystallization on SAMs I-III and bare gold favored the formation of
conglomerates over single enantiomers on achiral substrates as expected.
Figure 6.9. Optical micrographs showing crystalline habits of racemic NAL grown from water
on a) glass, b) bare gold, c) SAM I, d) SAM II, and e) SAM III.
1 mm
b)
1 mm
c)
2 mm
d)
2 mm
e)a)
2 mm
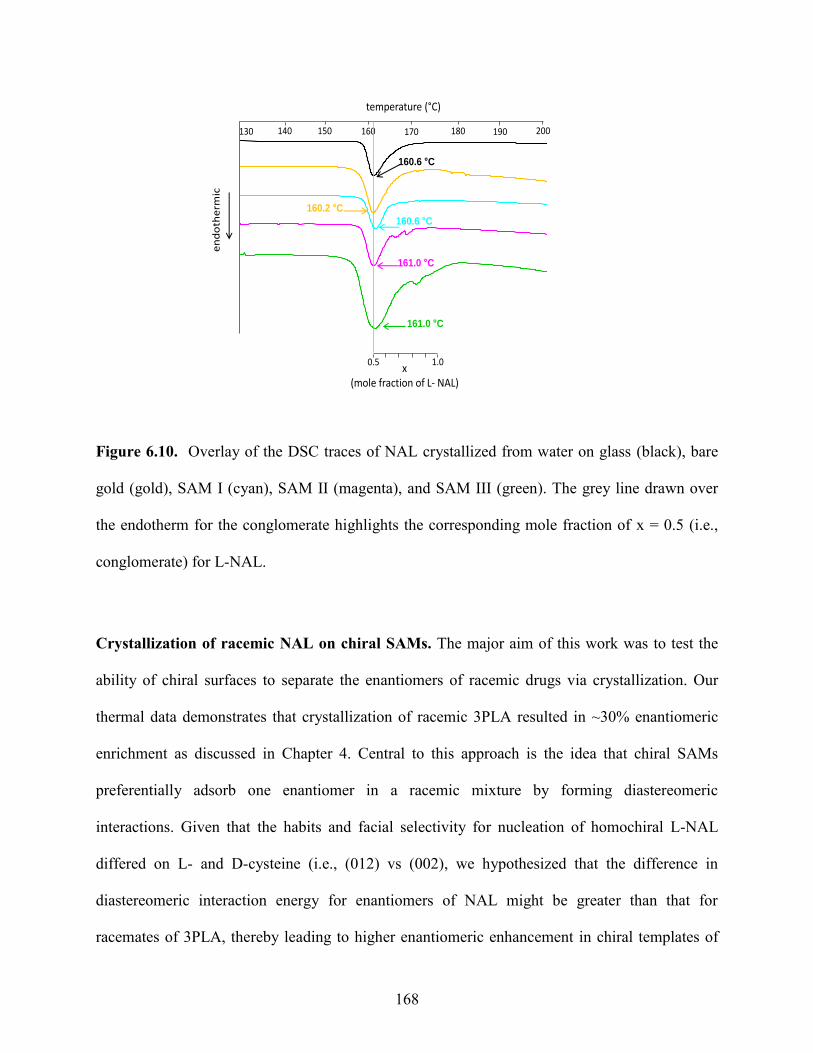
168
Figure 6.10. Overlay of the DSC traces of NAL crystallized from water on glass (black), bare
gold (gold), SAM I (cyan), SAM II (magenta), and SAM III (green). The grey line drawn over
the endotherm for the conglomerate highlights the corresponding mole fraction of x = 0.5 (i.e.,
conglomerate) for L-NAL.
Crystallization of racemic NAL on chiral SAMs. The major aim of this work was to test the
ability of chiral surfaces to separate the enantiomers of racemic drugs via crystallization. Our
thermal data demonstrates that crystallization of racemic 3PLA resulted in ~30% enantiomeric
enrichment as discussed in Chapter 4. Central to this approach is the idea that chiral SAMs
preferentially adsorb one enantiomer in a racemic mixture by forming diastereomeric
interactions. Given that the habits and facial selectivity for nucleation of homochiral L-NAL
differed on L- and D-cysteine (i.e., (012) vs (002), we hypothesized that the difference in
diastereomeric interaction energy for enantiomers of NAL might be greater than that for
racemates of 3PLA, thereby leading to higher enantiomeric enhancement in chiral templates of
160.6 C
161.0 C
161.0 C
160.2 C
160.6 C
en
do
the
rmic
temperature (°C)
200130 140 150 160 170 180 190
x(mole fraction of L- NAL)
0.5 1.0
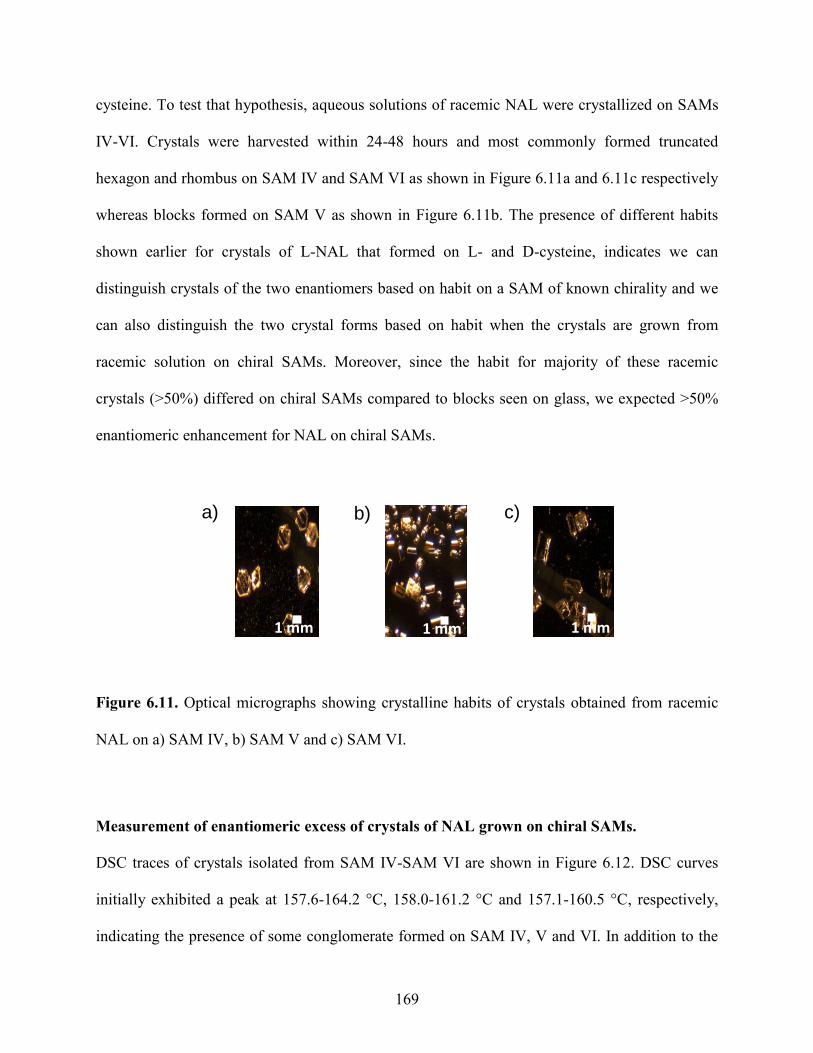
169
cysteine. To test that hypothesis, aqueous solutions of racemic NAL were crystallized on SAMs
IV-VI. Crystals were harvested within 24-48 hours and most commonly formed truncated
hexagon and rhombus on SAM IV and SAM VI as shown in Figure 6.11a and 6.11c respectively
whereas blocks formed on SAM V as shown in Figure 6.11b. The presence of different habits
shown earlier for crystals of L-NAL that formed on L- and D-cysteine, indicates we can
distinguish crystals of the two enantiomers based on habit on a SAM of known chirality and we
can also distinguish the two crystal forms based on habit when the crystals are grown from
racemic solution on chiral SAMs. Moreover, since the habit for majority of these racemic
crystals (>50%) differed on chiral SAMs compared to blocks seen on glass, we expected >50%
enantiomeric enhancement for NAL on chiral SAMs.
Figure 6.11. Optical micrographs showing crystalline habits of crystals obtained from racemic
NAL on a) SAM IV, b) SAM V and c) SAM VI.
Measurement of enantiomeric excess of crystals of NAL grown on chiral SAMs.
DSC traces of crystals isolated from SAM IV-SAM VI are shown in Figure 6.12. DSC curves
initially exhibited a peak at 157.6-164.2 °C, 158.0-161.2 °C and 157.1-160.5 °C, respectively,
indicating the presence of some conglomerate formed on SAM IV, V and VI. In addition to the
1 mm
a)
1 mm
b)
1 mm
c)
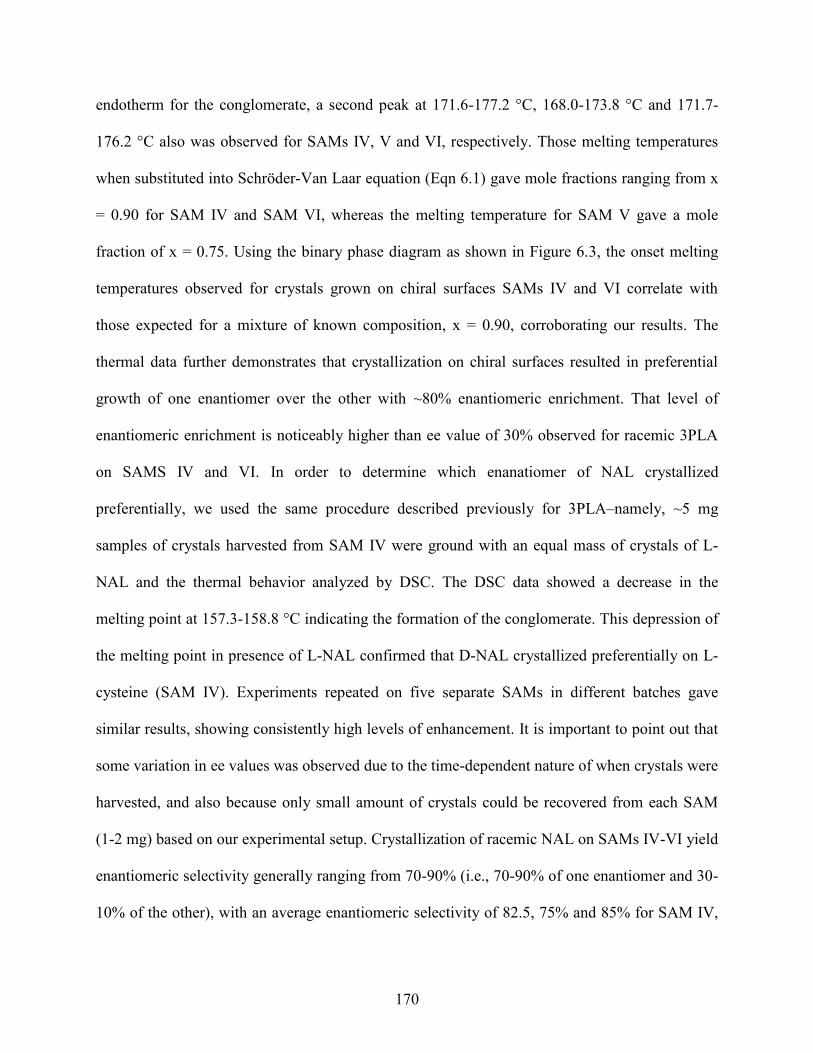
170
endotherm for the conglomerate, a second peak at 171.6-177.2 °C, 168.0-173.8 °C and 171.7-
176.2 °C also was observed for SAMs IV, V and VI, respectively. Those melting temperatures
when substituted into Schröder-Van Laar equation (Eqn 6.1) gave mole fractions ranging from x
= 0.90 for SAM IV and SAM VI, whereas the melting temperature for SAM V gave a mole
fraction of x = 0.75. Using the binary phase diagram as shown in Figure 6.3, the onset melting
temperatures observed for crystals grown on chiral surfaces SAMs IV and VI correlate with
those expected for a mixture of known composition, x = 0.90, corroborating our results. The
thermal data further demonstrates that crystallization on chiral surfaces resulted in preferential
growth of one enantiomer over the other with ~80% enantiomeric enrichment. That level of
enantiomeric enrichment is noticeably higher than ee value of 30% observed for racemic 3PLA
on SAMS IV and VI. In order to determine which enanatiomer of NAL crystallized
preferentially, we used the same procedure described previously for 3PLA–namely, ~5 mg
samples of crystals harvested from SAM IV were ground with an equal mass of crystals of L-
NAL and the thermal behavior analyzed by DSC. The DSC data showed a decrease in the
melting point at 157.3-158.8 °C indicating the formation of the conglomerate. This depression of
the melting point in presence of L-NAL confirmed that D-NAL crystallized preferentially on L-
cysteine (SAM IV). Experiments repeated on five separate SAMs in different batches gave
similar results, showing consistently high levels of enhancement. It is important to point out that
some variation in ee values was observed due to the time-dependent nature of when crystals were
harvested, and also because only small amount of crystals could be recovered from each SAM
(1-2 mg) based on our experimental setup. Crystallization of racemic NAL on SAMs IV-VI yield
enantiomeric selectivity generally ranging from 70-90% (i.e., 70-90% of one enantiomer and 30-
10% of the other), with an average enantiomeric selectivity of 82.5, 75% and 85% for SAM IV,
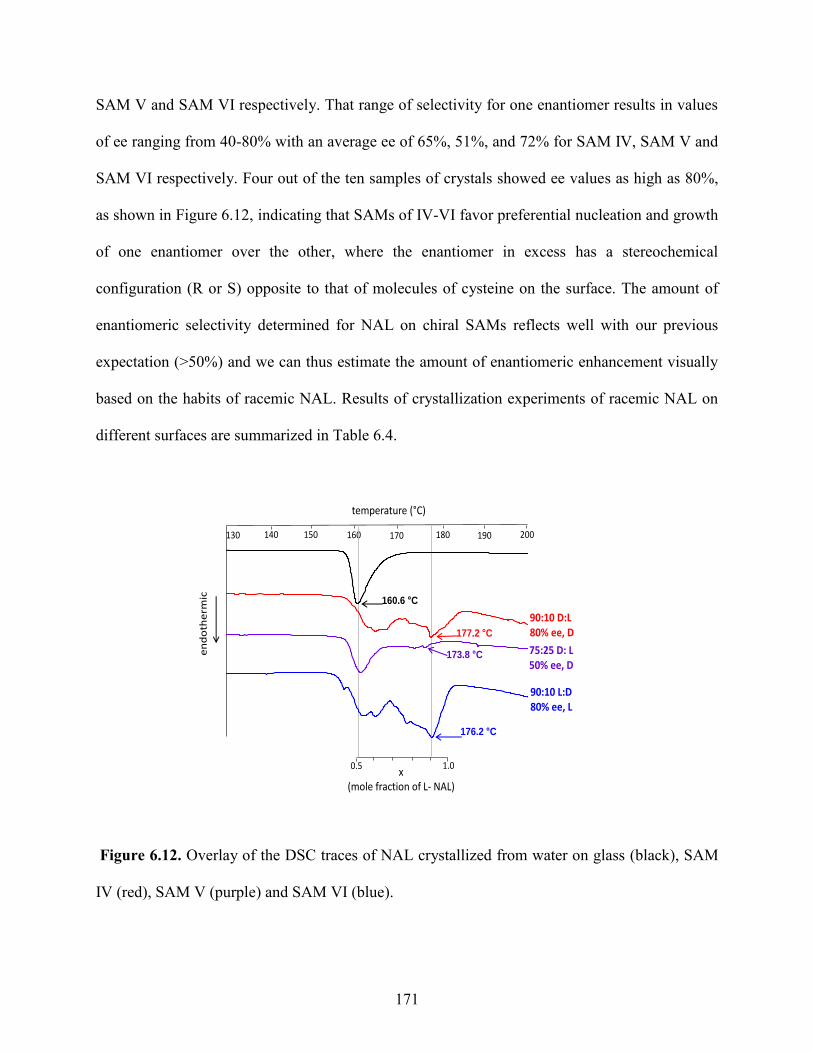
171
SAM V and SAM VI respectively. That range of selectivity for one enantiomer results in values
of ee ranging from 40-80% with an average ee of 65%, 51%, and 72% for SAM IV, SAM V and
SAM VI respectively. Four out of the ten samples of crystals showed ee values as high as 80%,
as shown in Figure 6.12, indicating that SAMs of IV-VI favor preferential nucleation and growth
of one enantiomer over the other, where the enantiomer in excess has a stereochemical
configuration (R or S) opposite to that of molecules of cysteine on the surface. The amount of
enantiomeric selectivity determined for NAL on chiral SAMs reflects well with our previous
expectation (>50%) and we can thus estimate the amount of enantiomeric enhancement visually
based on the habits of racemic NAL. Results of crystallization experiments of racemic NAL on
different surfaces are summarized in Table 6.4.
Figure 6.12. Overlay of the DSC traces of NAL crystallized from water on glass (black), SAM
IV (red), SAM V (purple) and SAM VI (blue).
en
do
the
rmic
temperature (°C)
200130 140 150 160 170 180 190
x(mole fraction of L- NAL)
0.5 1.0
160.6 C
176.2 C
173.8 C 75:25 D: L50% ee, D
177.2 C
90:10 D:L80% ee, D
90:10 L:D80% ee, L
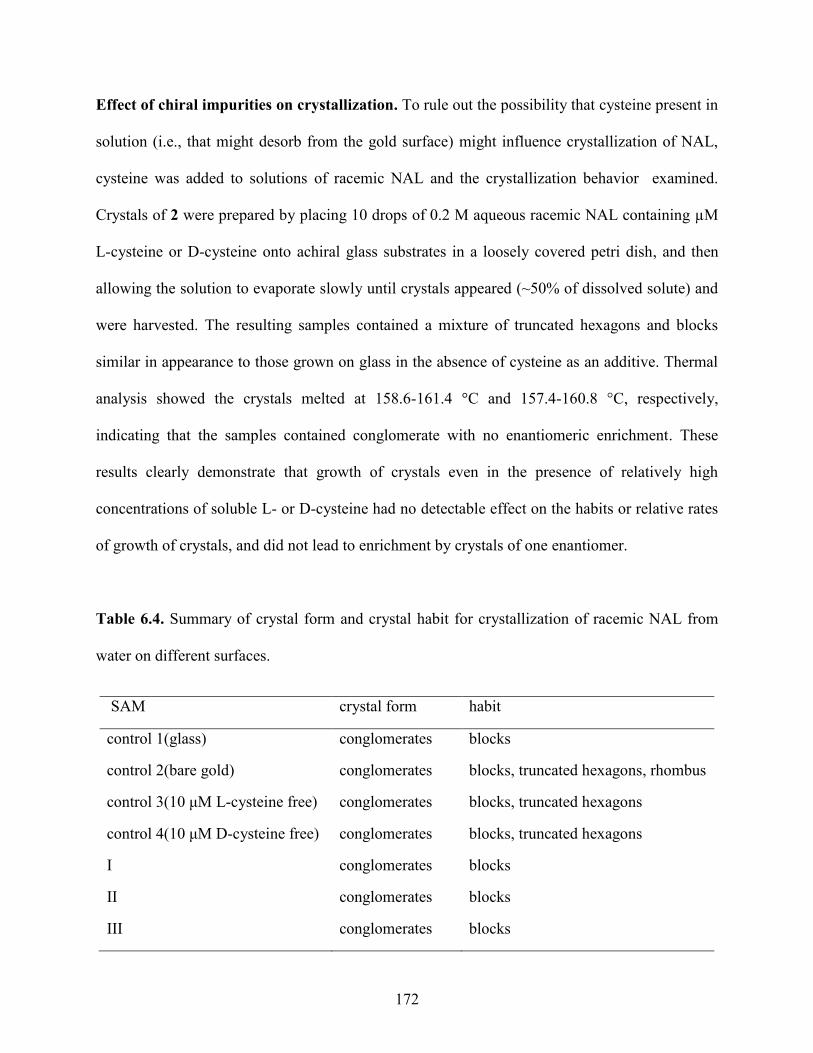
172
Effect of chiral impurities on crystallization. To rule out the possibility that cysteine present in
solution (i.e., that might desorb from the gold surface) might influence crystallization of NAL,
cysteine was added to solutions of racemic NAL and the crystallization behavior examined.
Crystals of 2 were prepared by placing 10 drops of 0.2 M aqueous racemic NAL containing µM
L-cysteine or D-cysteine onto achiral glass substrates in a loosely covered petri dish, and then
allowing the solution to evaporate slowly until crystals appeared (~50% of dissolved solute) and
were harvested. The resulting samples contained a mixture of truncated hexagons and blocks
similar in appearance to those grown on glass in the absence of cysteine as an additive. Thermal
analysis showed the crystals melted at 158.6-161.4 °C and 157.4-160.8 °C, respectively,
indicating that the samples contained conglomerate with no enantiomeric enrichment. These
results clearly demonstrate that growth of crystals even in the presence of relatively high
concentrations of soluble L- or D-cysteine had no detectable effect on the habits or relative rates
of growth of crystals, and did not lead to enrichment by crystals of one enantiomer.
Table 6.4. Summary of crystal form and crystal habit for crystallization of racemic NAL from
water on different surfaces.
SAM crystal form habit
control 1(glass) conglomerates blocks
control 2(bare gold) conglomerates blocks, truncated hexagons, rhombus
control 3(10 μM L-cysteine free) conglomerates blocks, truncated hexagons
control 4(10 μM D-cysteine free) conglomerates blocks, truncated hexagons
I conglomerates blocks
II conglomerates blocks
III conglomerates blocks
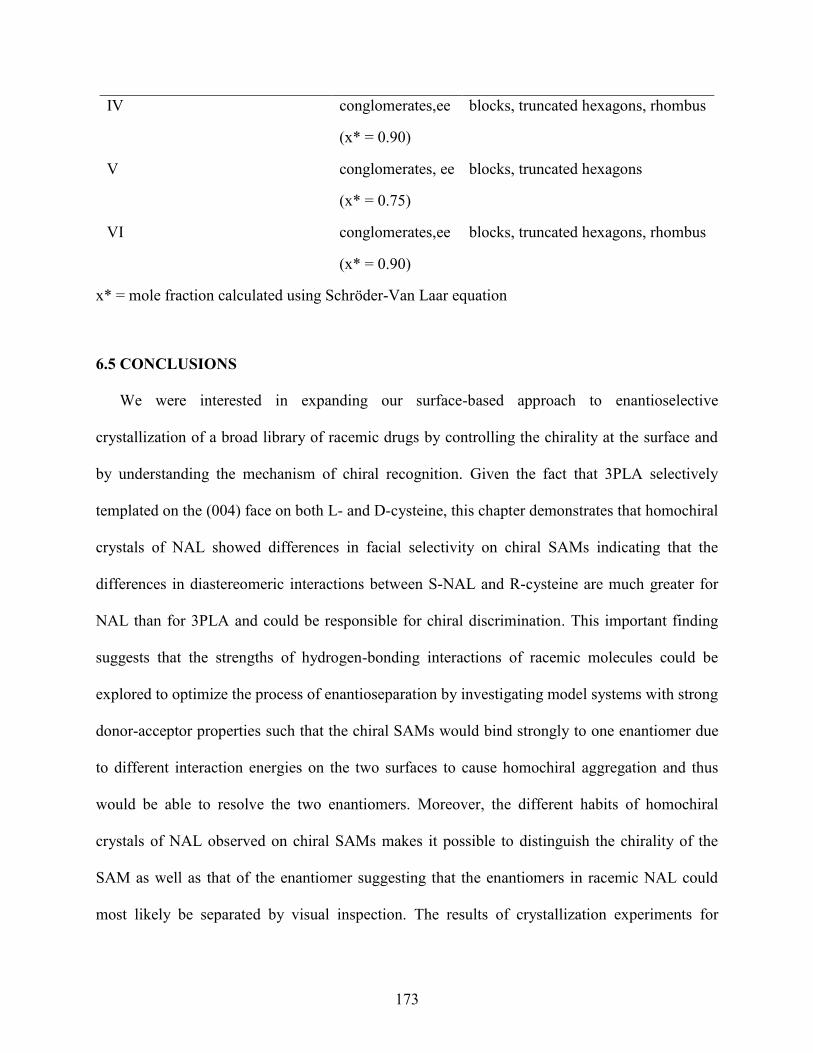
173
IV conglomerates,ee
(x* = 0.90)
blocks, truncated hexagons, rhombus
V conglomerates, ee
(x* = 0.75)
blocks, truncated hexagons
VI conglomerates,ee
(x* = 0.90)
blocks, truncated hexagons, rhombus
x* = mole fraction calculated using Schröder-Van Laar equation
6.5 CONCLUSIONS
We were interested in expanding our surface-based approach to enantioselective
crystallization of a broad library of racemic drugs by controlling the chirality at the surface and
by understanding the mechanism of chiral recognition. Given the fact that 3PLA selectively
templated on the (004) face on both L- and D-cysteine, this chapter demonstrates that homochiral
crystals of NAL showed differences in facial selectivity on chiral SAMs indicating that the
differences in diastereomeric interactions between S-NAL and R-cysteine are much greater for
NAL than for 3PLA and could be responsible for chiral discrimination. This important finding
suggests that the strengths of hydrogen-bonding interactions of racemic molecules could be
explored to optimize the process of enantioseparation by investigating model systems with strong
donor-acceptor properties such that the chiral SAMs would bind strongly to one enantiomer due
to different interaction energies on the two surfaces to cause homochiral aggregation and thus
would be able to resolve the two enantiomers. Moreover, the different habits of homochiral
crystals of NAL observed on chiral SAMs makes it possible to distinguish the chirality of the
SAM as well as that of the enantiomer suggesting that the enantiomers in racemic NAL could
most likely be separated by visual inspection. The results of crystallization experiments for
174
racemic NAL demonstrate conclusively not only that chiral templating of racemic NAL results in
sufficiently high enough levels of enrichment for application in pharmaceutical separations, but
that the enantiomer of interest can be selected via the chirality of the surface. To date, values of
70-90% ee via templated crystallization represent the highest level of enrichment by far that have
been reported.
REFERENCES
(1) Combaret, L.; Dardevet, D.; Rieu, I.; Pouch, M.-N.; Bechet, D.; Taillandier, D.; Grizard,
J.; Attaix, D. Journal of Physiology (Oxford, United Kingdom) 2005, 569, 489.
(2) Jacques, J., Collet, A.; Wilen, S. H. Enantiomers, Racemates, and Resolutions; John
Wiley and Sons: New York, 1981.
(3) Waskowska, A.; Lukaszewicz, K.; Kuzmina, L. G.; Strutshkov, Y. T. Bull. Pol. Acad.
Sci. 1975, 23, 149.
(4) Dewitt, H. D.; Ingersoll, A. W. J. Am. Chem. Soc. 1951, 73, 3359.
(5) Hooper Huffman, W. A.; Ingersoll, A. W. J. Am. Chem. Soc. 1951, 73, 3366.
(6) Rame-hart Upgrade Imaging Kit for Model 100-00 Goniometer with DROP image
Standard Setup and Software User Guide NJ; Vol. 706127.
(7) Allara, D. L.; Nuzzo, R. G. Langmuir 1985, 1, 52.
(8) Rudolph Instruments A Basic Program For The Analysis Of Ellipsometer Measurements
Instruction Manual NJ; Vol. 14-0104.
(9) Bruker Vertex 70 User Manual Ettlingen, 2007.
(10) Murakami, H.; Sakai, K.; Hirayama, N.; Tamura, R. Topics in Current Chemistry;
Springer: Heidelberg, 2006; Vol. 269.
(11) (CCDC), C. C. D. C. Cambridge, UK, 2009.
(12) Collet, A.; Brienne, M. J.; Jacques, J. Chemical Reviews (Washington, DC, United States)
1980, 80, 215.
(13) Yamaji T; Saito, T.; Hayamizu, K.; Yanagisawa, M.; Yamamoto, O.; Wasada, N.;
Someno, K.; Kinugasa, S.; Tanabe, K.; Tamura, T.; Tanabe, K.; Hiraishi, J.
(14) Bellamy, L. J. The infra-red spectra of complex molecules; 3rd ed.; Chapman and Hall:
New York, 1975.
(15) Li, Z. J.; Zell, M. T.; Munson, E. J.; Grant, D. J. W. J. Pharm. Sci. 1999, 88, 337.
(16) Aizenberg, J.; Black, A. J.; Whitesides, G. H. J. Am. Chem. Soc. 1999, 121, 4500.
(17) Joint Committee on Powder Diffraction Standards-International Center for Diffraction
Data Swarthmore, U.K., 1986.
175
7: Future work
In the present work, we have demonstrated that racemic drugs can be enriched with one
enantiomer using a surface-based approach via crystallization on self-assembled monolayers
(SAMs) of chiral amino acids or chiral drugs as templates. One of the important findings of our
research is that chiral SAMs preferentially nucleate one enantiomer in excess and that the
chirality of the major enantiomer can be controlled based on the chirality of the SAM. Although
this work has resulted in the highest enrichment via templated crystallization reported to date
(e.g., NAL in up to 80% ee), we have yet to demonstrate our ultimate goal of 100% enrichment
where enantiomers are completely separated and isolated simultaneously. To achieve that goal
will require modification of the experimental protocols described in the previous chapters as well
as development of more sophisticated chiral templates to overcome the limitations of solubility
inherent in the current methods. Accordingly, we will investigate both complementary as well as
alternative strategies to improve enantiomeric enhancement by this novel approach. Directions
that will be explored are described below.
7.1 Investigation of complete resolution via iterative crystallization on chiral templates.
We recognize that complete resolution of enantiomers is not possible in a single
crystallization experiment using the described method because of the inherent limitation imposed
by the solubility of enantiomers. Our method necessarily relies on evaporation of solvent from
unsaturated racemic solutions to achieve saturation and subsequently supersaturation of solute to
initiate nucleation and drive crystallization on the chiral surface. Given that the enantiomers
exhibit identical solubility (i.e., half that of racemic solute),1 the solution necessarily becomes
176
saturated with the enantiomer that does not crystallize preferentially on the chiral template,
eventually leading to nucleation and formation of some conglomerate. Consequently, the
enantiomeric composition of crystalline products obtained by that method is both time and
concentration dependent such that the relative amount of conglomerate formed increases (i.e., the
enantiomeric enhancement decreases) over time once nucleation of the second enantiomer
occurs. In addition, full recovery of either enantiomer is not possible by that method because
some amount of both enantiomers remains dissolved as long as solution is present on the surface.
Therefore, complete resolution cannot be achieved in a single crystallization experiment on a
chiral surface.
We expect that the issue of solubility can be overcome such that the level of enantiomeric
purity approaches 100% by carrying out iterative cycles of crystallization on chiral SAMs. The
potential utility of iterative crystallization can be illustrated by considering our previous results
from experiments with racemic NAL. For example, initial crystallization of a racemic solution
of NAL on SAMs of D-cysteine produced crystalline samples containing L-NAL in 80% ee, or a
90:10 mixture of crystals of L-NAL and D-NAL, respectively. Subjecting that product to a
second round of crystallization by the same procedure will result in a solution containing a 9-fold
molar excess of L-NAL compared to D-NAL. As evaporation of solvent increases the
concentration of both enantiomers, the solution will become saturated with L-NAL far in
advance of D-NAL, leading to exclusive nucleation of crystals of L-NAL. Under those
conditions, crystals of D-NAL cannot begin to nucleate on the surface until evaporation reduces
the volume of solution to just 10% of the original volume at saturation with L-NAL. In principle,
crystals harvested prior to that point should consist entirely of L-NAL. Moreover, upon reaching
10% of the original volume, the solution will then contain racemic NAL such that further
177
reduction in the volume to 5% of the original volume will produce a 90:10 mixture of L- and D-
NAL, respectively, as we demonstrated previously. Thus, crystals obtained after 95% of the
solution has evaporated in the second round of iterative crystallization should be enriched with
L-NAL in close to than 95% ee, as illustrated in Figure 7.1. In cases such as racemic 3PLA
where initial crystallization on a chiral template results in lower values of enhancement (i.e.,
30% ee, or a 65:35 mixture), it may be necessary to carry out additional cycles of iterative
crystallization to achieve enhancement exceeding 90% ee for a given enantiomer.
We plan to assess the utility of iterative crystallization for improving the level of
enantiomeric purity of 3PLA and NAL on each of the chiral templates examined previously.
Multiple cycles of iterative crystallization of racemic solutions of those drug systems will be
carried out using the same conditions described previously in Chapters 4, 5 and 6 to determine if
that approach works, and to assess the number of cycles required to achieve >99% ee. The
enantiomeric purity of samples obtained after each cycle will be determined by DSC and
compared to values predicted for the major enantiomer based on the known solubility behavior
of those drugs in water.
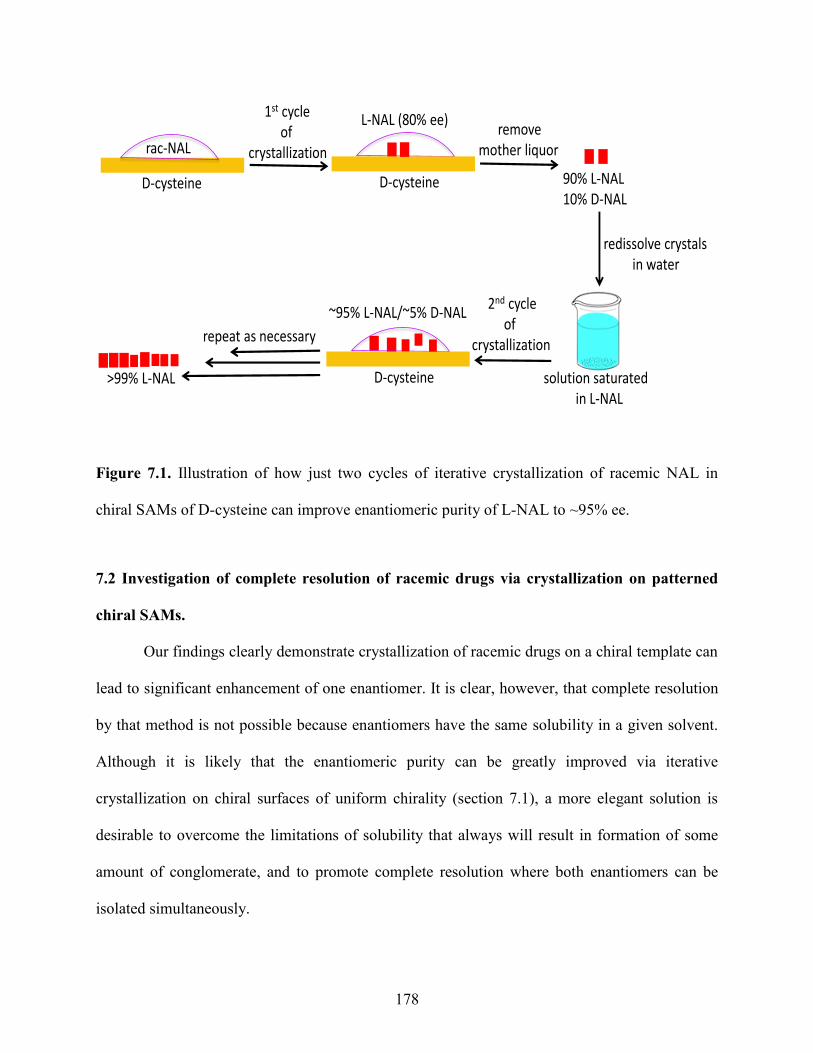
178
Figure 7.1. Illustration of how just two cycles of iterative crystallization of racemic NAL in
chiral SAMs of D-cysteine can improve enantiomeric purity of L-NAL to ~95% ee.
7.2 Investigation of complete resolution of racemic drugs via crystallization on patterned
chiral SAMs.
Our findings clearly demonstrate crystallization of racemic drugs on a chiral template can
lead to significant enhancement of one enantiomer. It is clear, however, that complete resolution
by that method is not possible because enantiomers have the same solubility in a given solvent.
Although it is likely that the enantiomeric purity can be greatly improved via iterative
crystallization on chiral surfaces of uniform chirality (section 7.1), a more elegant solution is
desirable to overcome the limitations of solubility that always will result in formation of some
amount of conglomerate, and to promote complete resolution where both enantiomers can be
isolated simultaneously.
rac-NAL
D-cysteine
L-NAL (80% ee)
D-cysteine
remove mother liquor
90% L-NAL10% D-NAL
~95% L-NAL/~5% D-NAL
D-cysteine solution saturated in L-NAL
1st cycleof
crystallization
redissolve crystalsin water
2nd cycleof
crystallization repeat as necessary
>99% L-NAL
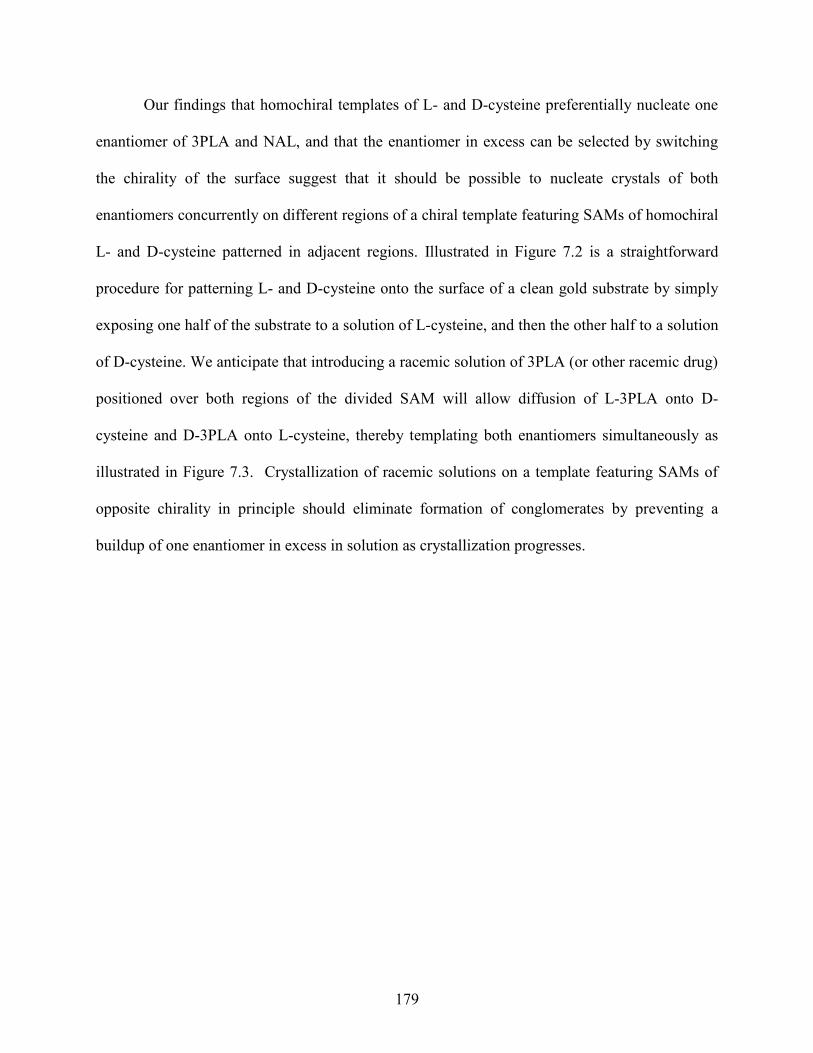
179
Our findings that homochiral templates of L- and D-cysteine preferentially nucleate one
enantiomer of 3PLA and NAL, and that the enantiomer in excess can be selected by switching
the chirality of the surface suggest that it should be possible to nucleate crystals of both
enantiomers concurrently on different regions of a chiral template featuring SAMs of homochiral
L- and D-cysteine patterned in adjacent regions. Illustrated in Figure 7.2 is a straightforward
procedure for patterning L- and D-cysteine onto the surface of a clean gold substrate by simply
exposing one half of the substrate to a solution of L-cysteine, and then the other half to a solution
of D-cysteine. We anticipate that introducing a racemic solution of 3PLA (or other racemic drug)
positioned over both regions of the divided SAM will allow diffusion of L-3PLA onto D-
cysteine and D-3PLA onto L-cysteine, thereby templating both enantiomers simultaneously as
illustrated in Figure 7.3. Crystallization of racemic solutions on a template featuring SAMs of
opposite chirality in principle should eliminate formation of conglomerates by preventing a
buildup of one enantiomer in excess in solution as crystallization progresses.
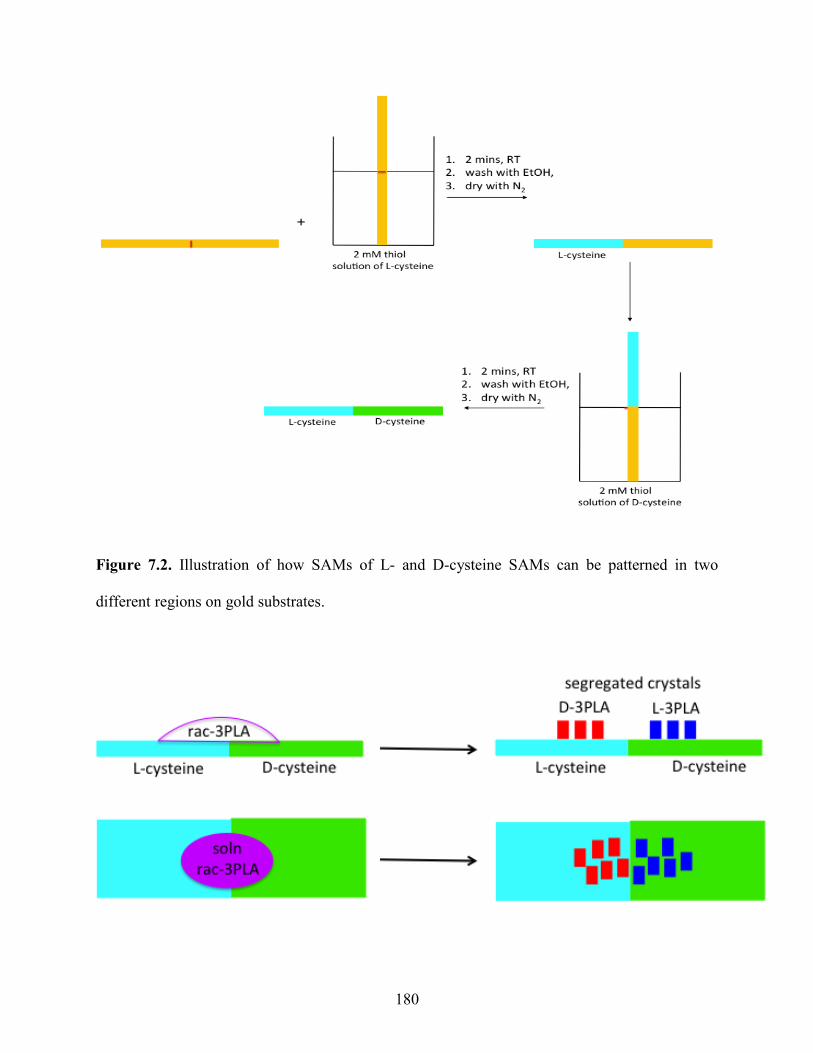
180
Figure 7.2. Illustration of how SAMs of L- and D-cysteine SAMs can be patterned in two
different regions on gold substrates.
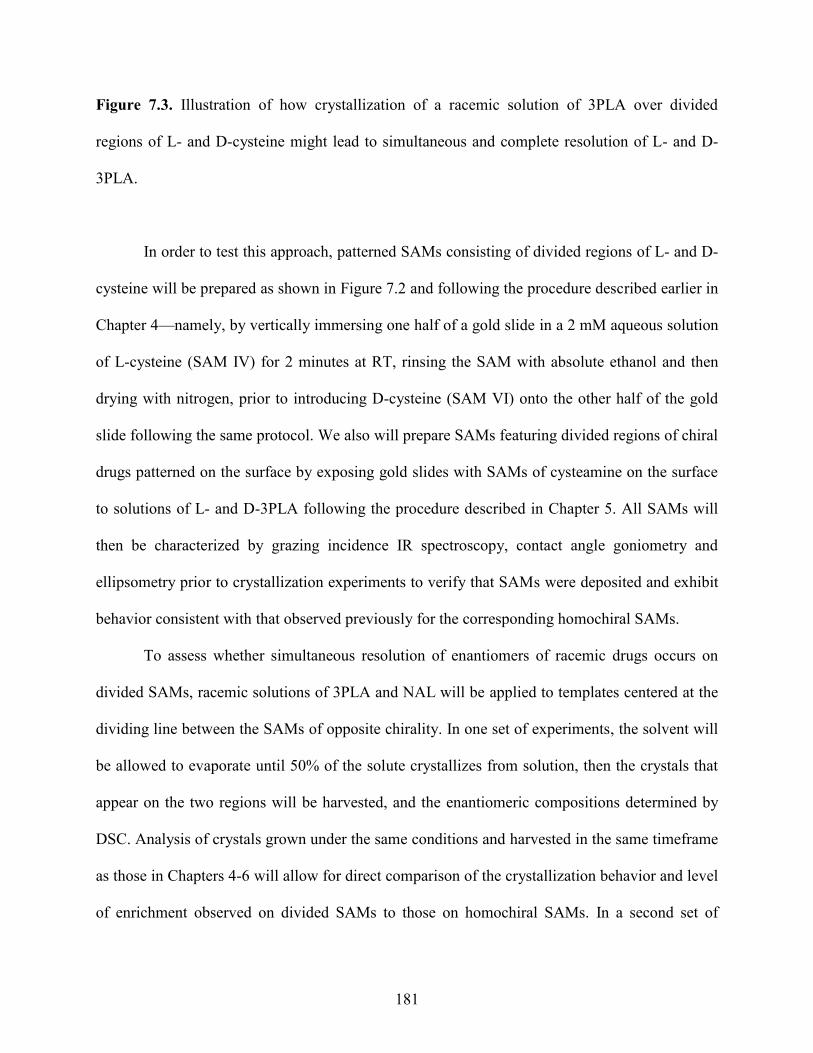
181
Figure 7.3. Illustration of how crystallization of a racemic solution of 3PLA over divided
regions of L- and D-cysteine might lead to simultaneous and complete resolution of L- and D-
3PLA.
In order to test this approach, patterned SAMs consisting of divided regions of L- and D-
cysteine will be prepared as shown in Figure 7.2 and following the procedure described earlier in
Chapter 4—namely, by vertically immersing one half of a gold slide in a 2 mM aqueous solution
of L-cysteine (SAM IV) for 2 minutes at RT, rinsing the SAM with absolute ethanol and then
drying with nitrogen, prior to introducing D-cysteine (SAM VI) onto the other half of the gold
slide following the same protocol. We also will prepare SAMs featuring divided regions of chiral
drugs patterned on the surface by exposing gold slides with SAMs of cysteamine on the surface
to solutions of L- and D-3PLA following the procedure described in Chapter 5. All SAMs will
then be characterized by grazing incidence IR spectroscopy, contact angle goniometry and
ellipsometry prior to crystallization experiments to verify that SAMs were deposited and exhibit
behavior consistent with that observed previously for the corresponding homochiral SAMs.
To assess whether simultaneous resolution of enantiomers of racemic drugs occurs on
divided SAMs, racemic solutions of 3PLA and NAL will be applied to templates centered at the
dividing line between the SAMs of opposite chirality. In one set of experiments, the solvent will
be allowed to evaporate until 50% of the solute crystallizes from solution, then the crystals that
appear on the two regions will be harvested, and the enantiomeric compositions determined by
DSC. Analysis of crystals grown under the same conditions and harvested in the same timeframe
as those in Chapters 4-6 will allow for direct comparison of the crystallization behavior and level
of enrichment observed on divided SAMs to those on homochiral SAMs. In a second set of
182
experiments, the solvent will be allowed to evaporate to dryness before harvesting the crystals
from the two regions and determining the compositions. We hypothesize that the level of
enrichment from both sets of experiments should approach 100% on the regions of SAM of
opposite chirality and to see selectivity for a given enantiomer consistent with that observed on
homochiral SAMs. In addition, the results from experiments in which the solvent evaporates
completely will enable us to determine if the composition and selectivity of crystals grown by
that method match those from samples isolated from solution, and more importantly, to
determine if enantiomerically pure samples of the drugs can be recovered in 100% yield.
If we can demonstrate complete or high levels of enantioenrichment (i.e., >95% ee) on
templates patterned with SAMs of opposite chirality, particularly where the SAMs are derived
from chiral drugs (e.g., 3PLA), we believe this approach will be particularly well suited for
developing a high-throughput method to screen enantioseparation simultaneously for a large
library of racemic drugs. One implementation of this concept is illustrated in Figure 7.4, where
the alternating blue and green regions represent patterned SAMs of opposite chirality, and the
circles represent solutions of racemic drugs R1, R2, R3 positioned over the two SAMs. In that
example, concurrent enantioselective crystallization of three different racemic drugs on opposite
enantiomers of the same SAM yields homochiral crystals. Analysis of the enantiomeric
composition for each different drug would allow the enantioselectivity and “resolving
efficiency” for opposite enantiomers of a given SAM to be assessed for a wide range of chiral
drug systems with varying functionality. This concept can also be implemented in a different
way by patterning chiral pairs of multiple different SAMs and then crystallizing solutions of the
same racemic drug on each different pair. By screening the enantioselectivity and “resolving
efficiency” of different chiral templates, it should be possible to rapidly screen for SAMs that
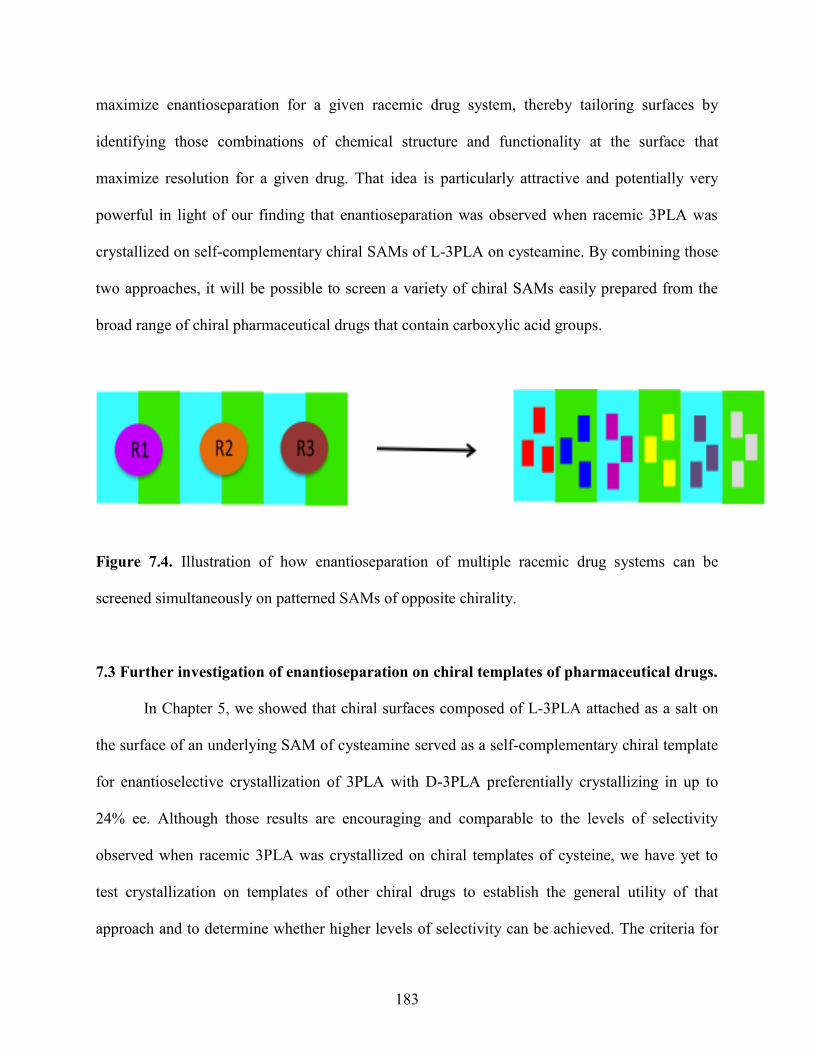
183
maximize enantioseparation for a given racemic drug system, thereby tailoring surfaces by
identifying those combinations of chemical structure and functionality at the surface that
maximize resolution for a given drug. That idea is particularly attractive and potentially very
powerful in light of our finding that enantioseparation was observed when racemic 3PLA was
crystallized on self-complementary chiral SAMs of L-3PLA on cysteamine. By combining those
two approaches, it will be possible to screen a variety of chiral SAMs easily prepared from the
broad range of chiral pharmaceutical drugs that contain carboxylic acid groups.
Figure 7.4. Illustration of how enantioseparation of multiple racemic drug systems can be
screened simultaneously on patterned SAMs of opposite chirality.
7.3 Further investigation of enantioseparation on chiral templates of pharmaceutical drugs.
In Chapter 5, we showed that chiral surfaces composed of L-3PLA attached as a salt on
the surface of an underlying SAM of cysteamine served as a self-complementary chiral template
for enantioselective crystallization of 3PLA with D-3PLA preferentially crystallizing in up to
24% ee. Although those results are encouraging and comparable to the levels of selectivity
observed when racemic 3PLA was crystallized on chiral templates of cysteine, we have yet to
test crystallization on templates of other chiral drugs to establish the general utility of that
approach and to determine whether higher levels of selectivity can be achieved. The criteria for
184
selecting the chiral drugs to crystallize on chiral drug templates will be similar to those described
previously in Chapter 4. The criteria include that the chiral drugs are known to form
conglomerates, where the difference in melting temperatures between the homochiral crystals
and conglomerates is < 30 C to avoid the energetic bias favoring formation of racemic crystals,
thus favoring conditions of spontaneous resolution. In addition, drug systems will be selected
that are capable of forming strong hydrogen bonds to maximize the diastereomeric interactions
between the drug and molecules in the chiral template. We will carry out two types of
experiments: (1) crystallization of racemic drugs on self-complementary templates
functionalized with the same drug to determine if preorganization of that drug on the surface
promotes greater selectivity, and (2) crystallization of racemic drugs on drug templates that are
not self-complementary. The latter experiments will allow us to probe whether SAMs of chiral
drugs having a range of high surface energies will promote greater selectivity.
Crystallization of racemic drugs on self-complementary templates. We have shown that a
self-complementary template containing L-3PLA attached to cysteamine SAM is able to
discriminate between the molecules of L- and D-3PLA present in solution due to diastereomeric
interactions between molecules of similar components. We want to explore this approach further
by tailoring the cysteamine SAM with a range of chiral drugs to determine whether other self-
complementary drug templates consistently lead to enantioenhancement and to compare the
levels of enhancement to those we obtained with chiral amino acids. Chiral drugs will be selected
that possess functional groups with varying degrees of hydrophobicity/hydrophilicity in order to
demonstrate the potential of varying the hydrogen-bonding interactions between molecules of the
racemic drug and chiral template on chiral discrimination. We have demonstrated that chiral
185
discrimination occurs on certain faces of crystals of both 3PLA and NAL, and that those
diastereomeric interactions are maximized due to strong hydrogen-bonding interactions. Thus we
want to investigate whether hydrogen bonding plays a similar role in promoting face-selective
growth of chiral drugs on self-complementary templates. We will investigate the crystallization
behavior of the small library of chiral molecules that possess hydrogen-bonding functionality
that includes carboxylic acid, amide, amine, alcohol and imidazole groups—all known to form
strong hydrogen bonds—to systematically examine the selectivity and better understand
structure-function relationships that govern enantioselectivity.
Crystallization of racemic drugs on drug templates that are not self-complementary. The
second approach will involve carrying out crystallization of racemic drugs on templates of chiral
drugs that are not self-complementary—that is, templates that feature an overlayer of drug
molecules differing from the racemic drug crystallized. We want to examine crystallization on
such surfaces because it has been shown that interaction between different functional groups
(e.g., acid-imidazole, acid-amide, etc.) where the two groups possess strong donors and acceptors
generally result in the strongest hydrogen-bonding interactions.2 Therefore, we want to compare
the crystallization behavior of racemic drugs on templates that are not self-complementary to
those that are self-complementary to determine whether greater selectivity results. For example,
the structure of NAL contains carboxylic acid and 2 amide groups that both can act as donors
(N-H and O-H) and acceptors (C=O), allowing the formation of a chiral template of L-
NAL/cysteamine by attachment of L-NAL to cysteamine via salt formation. We will investigate
the enantioselective crystallization of racemic 3PLA, and NAL on this and other non-
complementary chiral templates.
186
REFERENCES
(1) Collet, A.; Brienne, M. J.; Jacques, J. Chem. Rev. 1980, 80, 215.
(2) Etter, M. C. Journal of Physical Chemistry 1991, 95, 4601.