Embed Size (px)
Citation preview
COORDINATING RESEARCH COUNCIL, INC. 5755 NORTH POINT PARKWAY ● SUITE 265 ● ALPHARETTA, GA 30022
CRC Report No. E-119
ON-ROAD REMOTE SENSING OF AUTOMOBILE EMISSIONS IN THE ROLLING MEADOWS AREA: FALL
2016
January 2018

The Coordinating Research Council, Inc. (CRC) is a non-profit corporation supported by the petroleum and automotive equipment industries. CRC operates through the committees made up of technical experts from industry and government who voluntarily participate. The four main areas of research within CRC are: air pollution (atmospheric and engineering studies); aviation fuels, lubricants, and equipment performance; heavy-duty vehicle fuels, lubricants, and equipment performance (e.g., diesel trucks); and light-duty vehicle fuels, lubricants, and equipment performance (e.g., passenger cars). CRC’s function is to provide the mechanism for joint research conducted by the two industries that will help in determining the optimum combination of petroleum products and automotive equipment. CRC’s work is limited to research that is mutually beneficial to the two industries involved. The final results of the research conducted by, or under the auspices of, CRC are available to the public. CRC makes no warranty expressed or implied on the application of information contained in this report. In formulating and approving reports, the appropriate committee of the Coordinating Research Council, Inc. has not investigated or considered patents which may apply to the subject matter. Prospective users of the report are responsible for protecting themselves against liability for infringement of patents.
On-Road Remote Sensing in Rolling Meadows, Illinois Area: Fall 2016
1
Remote Sensing of
Automobiles Emissions inRolling
Meadows: Fall 2016
Dr. J. Stewart Hager
Hager Environment & Atmospheric Technologies 539 Milwaukee Way Knoxville, TN 37932
January 2018
Preparedfor:
Coordinating Research Council, Inc. 5755 North Point Parkway, Suite 265 Alpharetta, Georgia 30022 Contract No. E-119

ACKNOWLEDGEMENTS Hager Environmental & Atmospheric Technologies (HEAT) would like to sincerely thank the Coordinating Research Council (CRC) for including us in the 2016 Rolling Meadows Study. We would like to specifically thank Brent Bailey Executive Director, Dr. Christopher J. Tennant Deputy Director with CRC and Dominic DiCicco with Ford Motor Company for facilitating this study and for allowing us to contribute. We would also like to thank the Illinois Secretary of State, Freedom of Information Act Office, and Illinois EPA for providing us with the vehicle data after the survey was completed from the license plates collected while on road in Rolling Meadows, Illinois.

On-Road Remote Sensing in Rolling Meadows, Illinois Area: Fall 2016
1
Table of Contents LISTOFFIGURES.......................................................................................................................3
LISTOFTABLES.........................................................................................................................4
LISTOFACRONYMSANDABBREVIATIONS...............................................................................5
EXECUTIVESUMMARY.............................................................................................................6
1. BACKGROUND.................................................................................................................8
1.1. COMPANYPROFILE................................................................................................................8
1.2. EQUIPMENTDESCRIPTION......................................................................................................9
1.3. DETECTORACCURACY..........................................................................................................13
1.4. SOURCESOFDATAANDDATACOLLECTED...............................................................................13
1.5. INFORMATIONCOLLECTED....................................................................................................13
1.6. DATACOLLECTIONSTATISTICS...............................................................................................14
1.7. VEHICLEREGISTRATIONDATA...............................................................................................14
2. METHODS......................................................................................................................15
2.1. THESETUP.........................................................................................................................15
2.2. SCREENINGOFEXHAUSTPLUMES...........................................................................................17
2.3. MONITOREDREMOTELY.......................................................................................................19
3. RESULTSANDDISCUSSIONS...........................................................................................20
3.1. ROLLINGMEADOWSAVERAGEEMISSIONSBYMODELYEAR.......................................................22
3.2. NOISEANALYSIS..................................................................................................................26
3.3. MEASUREMENTSOFMULTI-READVEHICLES............................................................................30
3.4. ABSOLUTEAMOUNTS..........................................................................................................32

On-Road Remote Sensing in Rolling Meadows, Illinois Area: Fall 2016
2
4. CONCLUSIONS................................................................................................................36
5. LISTOFREFERENCES......................................................................................................37
6. APPENDIX......................................................................................................................38
6.1. APPENDIXA.EDARIMAGESSHOWINGINTERFERINGPLUMESOFCARSONROAD...........................38

On-Road Remote Sensing in Rolling Meadows, Illinois Area: Fall 2016
3
LIST OF FIGURES
Figure1.ExampleofEDARRoadsideImplementation.................................................................10
Figure2.ExampleEDARReport....................................................................................................12
Figure3.EDARLocationonEntranceRampfromW.AlgonquinRd.andI-290............................16
Figure4.ImageofEDARattheRampinRollingMeadowsShowingTrailerSetup.......................17
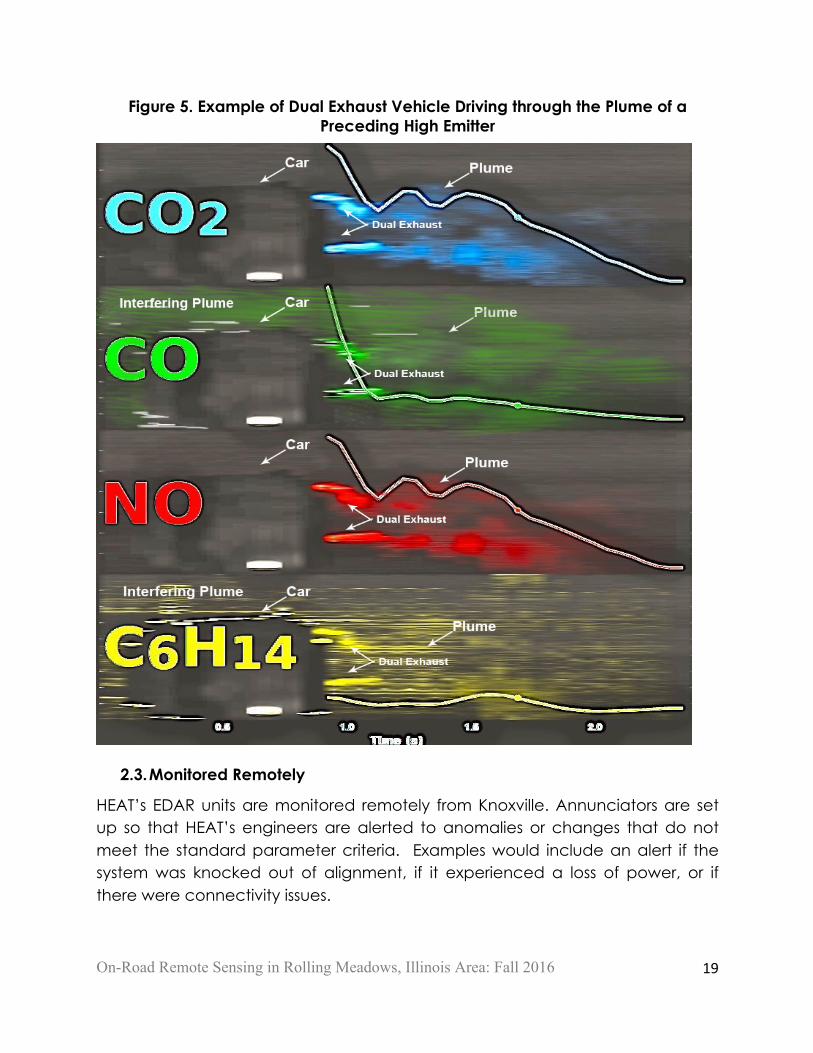
Figure5.ExampleofDualExhaustVehicleDrivingthroughthePlumeofaPrecedingHigh
Emitter..................................................................................................................................19
Figure6.RollingMeadowsAverageCOEmissions.......................................................................22
Figure7.RollingMeadowsAverageNOEmissions.......................................................................23
Figure8.RollingMeadowsAverageHCEmissions......................................................................24
Figure9.RollingMeadowsVehicleDistributionforPassengerCarsandTrucks...........................25
Figure10.NoiseStudy:NOMeasurement...................................................................................27
Figure11.NoiseStudy:HCMeasurement....................................................................................28
Figure12.NoiseStudy:COMeasurements..................................................................................29
Figure13.SortedMulti-ReadVehicles:CO...................................................................................30
Figure14.SortedMulti-ReadVehicles:NO..................................................................................31
Figure15.SortedMulti-ReadVehicles:HC...................................................................................31
Figure16.AbsoluteAmountsCO2................................................................................................33
Figure17.AbsoluteAmountsCO.................................................................................................34
Figure18.AbsoluteAmountsNO................................................................................................34
Figure19.AbsoluteAmountsHC..................................................................................................35

On-Road Remote Sensing in Rolling Meadows, Illinois Area: Fall 2016
4
LIST OF TABLES
Table1-ValiditySummary...........................................................................................................20
Table2-NumberofMeasurementsofRepeatVehicles..............................................................21
Table3-TemperatureandHumidity............................................................................................21
Table4-DailyMeasurements......................................................................................................21
On-Road Remote Sensing in Rolling Meadows, Illinois Area: Fall 2016
5
LIST OF ACRONYMS AND ABBREVIATIONS
BAR – California Bureau of Automotive Repair CO – Carbon Monoxide CO2 – Carbon Dioxide CRC – Coordinating Research Council DIAL – Differential Absorption LiDAR EDAR – Emissions Detection And Reporting FEAT – Fuel Efficiency Automobile Test Device HC – Hydrocarbons HEAT – Hager Environmental & Atmospheric Technologies NO – Nitric Oxide OREMS – On-road Emissions Measurement Standards PDF - Probability Density Function 2D – Two Dimensional VIN – Vehicle Identification Number s - second

On-Road Remote Sensing in Rolling Meadows, Illinois Area: Fall 2016
6
EXECUTIVE SUMMARY
Hager Environmental & Atmospheric Technologies (HEAT) conducted a remote sensing study using its proprietary Emissions Detecting and Reporting (EDAR) on-road remote sensing system in the Rolling Meadows area during the fall of 2016. For the past decade, the University of Denver has completed this specific remote sensing study at this location. This was HEAT’s first time deploying alongside the University of Denver for this study.
This study involved setting up EDAR on September 19 - 21, 2016, at the on-ramp from Algonquin Rd. to eastbound I-290 in northwest Chicago in the suburb of Rolling Meadows, IL. The EDAR device measured CO, CO2, NO, and HC from vehicles driving under the laser-based exhaust gas sensor as they gained speed to merge on to the highly traveled I-290. In addition to the gas data, the EDAR system collected the following information: license plate, speed, acceleration, wind speed, temperature, humidity, a scene image, and a 2D infrared image of the vehicle as it drove underneath EDAR. A total of 16,852 measurements were attempted and of those 13,985 Illinois license plates were submitted to the Secretary of State of Illinois. All the records submitted had valid measurements for all the detected gases. Out of the attempted measures of 16,852, there were 15,255 valid measurements, which accounted for a 91% valid hit rate. The data reduction process is summarized in Table 1.
This document also includes error analysis with a report of standard errors. The captured valid CO2 measurements, show the fleet as a whole mean (and standard errors of the mean) tailpipe emissions for CO, NO and HC, to be 759 ± 0.28 ppm, 85 ± 0.11 ppm and 42 ± 0.13 ppm respectively.
Furthermore, this study provides an average of absolute emissions for each gas in moles/m, which can be converted to instantaneous mg/mile depending on the molecular mass of the molecule. This does not represent regulatory testing. Due to the fact EDAR can see the entire plume, these values represent the actual amount the vehicle left behind while under EDAR and exhibit a decreasing general trend for vehicles of newer model years.

On-Road Remote Sensing in Rolling Meadows, Illinois Area: Fall 2016
7
Introduction
Maintaining the National Ambient Air Quality Standards established by the Environmental Protection Agency (EPA) has been challenging for many of the heavily populated U.S. cities. Motor vehicles are thought to be one of the largest sources of many air pollutants in urban areas.1 Real-world emissions measurements are needed to characterize these pollutants. It is of paramount importance to precisely measure vehicle exhaust emissions in general so government bodies can make sound policy decisions. In addition, interest in the remote sensing of vehicle exhaust emissions as an alternative and/or supplement to traditional dynamometer-based measurements has increased due to the desire to monitor real world impacts.
Hager Environmental & Atmospheric Technologies (HEAT) has developed the remote sensing Emissions Detection and Reporting device called EDAR. HEAT conducted the Rolling Meadows remote sensing study at the on-ramp from Algonquin Road to I-290, using its EDAR device. This site was first chosen in 1997 for a 5-year study by the University of Denver. Subsequent studies were performed by University of Denver in 2004, 2006, 2014 and 2016. HEAT was contracted by the Coordinating Research Council (CRC) to measure on-road emissions over a three-day period. The chosen dates were September 19-21 with hours starting in the early mornings and ending in the late evening in order to cover rush hours for both morning and evening. To perform this study, HEAT obtained the proper permits and Letter of Authority from the City of Rolling Meadows for the deployment of EDAR on-road. The purpose of this study is to examine the effectiveness of remote sensing.
In addition, the calculation of absolute emission rates (grams/mi) are possible with the EDAR system because of the geometry of the remote sensing set up (See section 1.2 for a more detailed equipment description). EDAR scatters laser light off of a reflector placed on the road surface; therefore, it is always looking down onto the plume. This allows EDAR to remotely detect the entire plume at one time. One can use the total optical mass of each measurement across the plume to calculate absolute values, the mole or gram per distance emission rates are calculated directly.
1 http://www.dec.ny.gov/chemical/8577.html

On-Road Remote Sensing in Rolling Meadows, Illinois Area: Fall 2016
8
1. BACKGROUND
1.1. Company Profile
Hager Environmental & Atmospheric Technologies, LLC (HEAT), is a Woman-Owned, NASA spin off2 business founded in 2009 with headquarters in Knoxville, Tennessee. HEAT’s founder, Dr. Stewart Hager, developed the Emissions Detection and Reporting (EDAR) device which is an eye-safe, laser-based technology capable of remotely detecting and measuring the infrared absorption of environmentally critical gases (such as CO, CO2, NO, NO2, HC and PM2.5) coming out of a moving vehicle.
EDAR was successfully introduced to the North American emissions measurement industry at the I/M Solutions Conference in Salt Lake City, Utah, in April 2014. EDAR is operational and has been successfully deployed commercially in Connecticut, Arizona, Tennessee and the United Kingdom. Since that time, HEAT has been rehired by Connecticut and Arizona for testing in 2016 as well as contracted with Scotland for a large-scale pilot. In addition, HEAT recently won their first large-scale clean screen program in Nashville, TN.
EDAR is a laser-based technology with one footprint for both heavy and light duty vehicles. The basic geometry of EDAR allows for the detection of the plume no matter where the tailpipe is located. Another unique characteristic EDAR possesses is the application of the DiAL (Differential Absorption LiDAR) method to detect and quantify gases such as but not limited to CO, CO2 HC, NO, NO2 and PM2.5. This laser based system does not require calibration therefore it is unmanned. The EDAR device is an emissions camera that is capable of reading emissions from vehicles on multilane highways and can measure the exhaust temperature from vehicles as well as create a 2-D image of the plume in real time.
2 https://spinoff.nasa.gov/Spinoff2017/t_4.html

On-Road Remote Sensing in Rolling Meadows, Illinois Area: Fall 2016
9
1.2. Equipment Description
The Rolling Meadows study was performed using HEATs EDAR (Emission Detection And Reporting) system, which is an unmanned, automated vehicle emissions measurement system. The entire system is comprised of an eye-safe, laser-based infrared gas sensor, a vehicular speed/acceleration sensor, and a license plate reader.
EDAR measures the infrared absorption of environmental critical gases (such as CO, CO2, NO, NO2, HC and PM2.5) coming out of virtually any moving vehicle: specifically, pollutants emitted by in-use vehicles. It also measures the entire exhaust plume as the vehicle passes allowing for the determination of the mass emission rates of the vehicle. Infrared laser light is scattered off a reflector placed on the road surface and then the back-scattered light is collected by EDAR.
The all-in-one EDAR system is fully weatherproofed to protect it from environmental elements (heat, rain, snow, wind, etc.). In addition, EDAR occupies a relatively small footprint, sitting on a single pole that is deployable roadside in either a temporary or permanent application. See Figure 1.

On-Road Remote Sensing in Rolling Meadows, Illinois Area: Fall 2016
10
Figure 1. Example of EDAR Roadside Implementation
The gas sensor emits a sheet of invisible laser light from above that can unambiguously measure specified molecules emitted from any vehicle that breaks the beam. The lasers are configured for the pollutants CO2, CO, NO, and HC. Due to the fact that the gas sensor looks down from above and can “see” a whole lane of traffic, EDAR can detect an entire exhaust plume as it exits the vehicle as well as any indication of interfering plumes (see section 2.2 for further explanation on interfering plumes.) Seeing the whole plume is advantageous since it allows for consistently high signal to noise ratio (SNR) and measurements such as absolute amounts which allows for determination of emissions rates in mass per unit travelled (grams/mile), which can be used to calculate the quantity of emissions produced. Furthermore, in the case of strong crosswinds, where absolute amounts are not possible directly, HEAT will use the stoichiometric calculation because EDAR’s geometry allows for the measurement of the thickest optical mass of the plume. In other words, EDAR always measures the thickest part of the plume so its results are consistent from

On-Road Remote Sensing in Rolling Meadows, Illinois Area: Fall 2016
11
vehicle to vehicle. In addition, EDAR is able to take infrared images of the vehicles passing below the sensor, allowing the vehicle’s shape to be determined whether it is a heavy truck, car, motorcycle or a vehicle pulling a trailer. The position of the tailpipe can also be determined by the CO2 plume’s position with respect to the image of the vehicle. This allows for the identification of any pollution hot spots such as evaporative HC emissions leaks on the vehicle. Furthermore, vehicle speed and acceleration rates during the measurement that could negatively impact the measurements are detected, thus facilitating a precise and controlled data collection. It is also important to note EDAR uses DiAL (Differential Absorption LiDAR). The DiAL method continuously subtracts the background which includes fog, dust, dirt, ambient light, instrument variations and humidity. In addition, the principle that underlies the DiAL method is the reason the EDAR system does not require calibration. EDAR also calculates the temperature of the exhaust using spectroscopic techniques and by using temperature insensitive absorption features. Therefore, EDAR’s measurements are not affected by temperature, fog, dust, dirt, ambient light, instrument variations or humidity. Remote sensing technologies in general cannot operate in rain or snowy conditions.
The EDAR system also gathers vehicle characteristic data necessary for analysis of the emissions results. These include:
• A laser-based rangefinder system for vehicle detection as well as speed and acceleration measurements. The rangefinder detects the vehicles from above in the same manner as the gas sensor.
• A system to measure current weather conditions, including ambient temperature, barometric pressure, relative humidity, and wind speed and direction.
• A license plate reader that identifies the plate of each vehicle when its emissions are measured along with a picture of each license plate. The reader automatically transcribes the license plate number for further analysis.
Furthermore, for each vehicle, EDAR finds the exhaust plume at the location where it exits the tailpipe of the vehicle at the moment the plume becomes visible. This gives a reasonable measure of the temperature of the exiting exhaust gases. The temperature of the exhaust gases relative to the ambient

On-Road Remote Sensing in Rolling Meadows, Illinois Area: Fall 2016
12
temperature is an indication of if the vehicle is in a warmed-up condition, that is, not in cold start. If the vehicle was in cold start, it may have high emissions appearing to indicate the vehicle has an emissions problem. However, by providing a measure of the ratio of exhaust gas temperature relative to ambient temperature, the EDAR unit can be used to identify these vehicles so they are not identified as false positive high emitters as opposed to the screen out vehicles in cold start condition from the true high emitters.
Figure 2 demonstrates an example of the report that is produced by EDAR for every vehicle detected and evaluated. As displayed in Figure 2, EDAR captures a 2D image of the vehicle and plume for the four gases as well as the license plate, date, time, speed, acceleration, temperature, barometric pressure, humidity, wind speed, a pass or fail indication, and an actual image of the vehicle itself. The curve represents the amount in each scan.
Figure 2. Example EDAR Report
Fron
t Rear

On-Road Remote Sensing in Rolling Meadows, Illinois Area: Fall 2016
13
1.3. Detector Accuracy
EDAR measurements are well within the range of the certified gas sample accuracy and the detector accuracy standards of the California Bureau of Automotive Repair (BAR) On-Road Emissions Measurement Standards (OREMS).
Minimum accuracies per California BAR are:
• The carbon monoxide (CO%) reading will be within ± 10% of the Certified Gas Sample, or an absolute value of ± 0.25% CO (whichever is greater), for a gas range less than or equal to 3.00% CO. The CO% reading will be within ± 15% of the Certified Gas Sample for a gas range greater than 3.00% CO.
• The hydrocarbon reading (recorded in ppm propane) will be within ± 15% of the Certified Gas Sample, or an absolute value of ± 250 ppm propane, (whichever is greater).
• The nitric oxide reading (ppm) will be within ± 15% of the Certified Gas Sample, or an absolute value of ± 250 ppm NO, (whichever is greater).
1.4. Sources of Data and Data Collected
The EDAR unit pollutant measurements (HC, CO, CO2 and NO) and license plate captures were the two main sources of data used for this report. The information below demonstrates the format of the data collected in this report.
1.5. Information Collected
o HEAT units operated: EDAR 7 o Date o Time o License plate image o HC, CO, CO2, and NO measurements o Speed o Acceleration o Temperature of the vehicle

On-Road Remote Sensing in Rolling Meadows, Illinois Area: Fall 2016
14
1.6. Data Collection Statistics
o Unit o Site o Date o Start time o End o Hourly temperature o Hourly humidity
1.7. Vehicle Registration Data
The license plate data collected by the HEAT license plate recognition camera system was submitted to the Illinois Secretary of State so that vehicle VIN and other vehicle data could be provided for analysis. The information provided includes:
o License plate o Vehicle Identification Number (VIN) o Model year o Make o Body style o EPA vehicle type

On-Road Remote Sensing in Rolling Meadows, Illinois Area: Fall 2016
15
2. METHODS
The purpose of this study was to evaluate the EDAR system’s ability to measure on-road emissions over a three-day period at the on-ramp from Algonquin Rd to I-290 in Rolling Meadows, IL, a suburb of Chicago. The on-ramp set up can be seen in Figure 3. Approximately 15,255 valid data points were collected over the 3-day time frame; September 19-21, 2016. During this 3-day period EDAR collected on-road emissions data from vehicles in their natural operating environment detecting CO2, CO, HC, and NO. The data collected was correlated with license plate data.
EDAR has a simple unmanned set up that does not require any calibration once deployed. EDAR uses the same principles as satellite Differential Absorption LiDAR or DiAL and once the device is setup does not need to be calibrated. During the initial deployment process, traffic was temporarily diverted from the lane that has been designated for testing to mount the system, its components, and to adhere the retroreflective tape to the pavement. Due to EDAR’s specially designed deployment trailer, this set up and alignment process is simple and easily set up daily then EDAR is left to run unattended.
Once all of the components were mounted and in place, EDAR is powered on by a pack of batteries that are incorporated as a part of the EDAR trailer. EDAR is then powered on and connected to an Internet connection to allow HEAT’s engineers to monitor EDAR remotely.
EDAR was mounted and taken down daily for the three consecutive days, collecting the appropriate data to achieve the goal of collecting 15,000 valid data points all while being monitored remotely.
2.1. The Setup
EDAR has a specially designed portable system for temporary setups that can be towed by any light duty truck to the deployment site. The trailer was positioned off the shoulder of the road for minimum interference to traffic flow and to maximize safety as shown in Figure 4. The trailer has been over engineered for safety and reliability and was secured using scissor screw jacks for extra stability once the trailer was positioned into the desired location. There is an automated system in which the mast and arm are controlled by hydraulics, so both can be raised or stowed by the push of a button. In addition to the

On-Road Remote Sensing in Rolling Meadows, Illinois Area: Fall 2016
16
automated mounting arm system, EDAR can position itself through a tip tilt device for easy alignment. Once EDAR is in place, the retroreflective tape was adhered to the roadway and is protected by small ½ inch high ramps. A license plate camera is positioned at the rear of the trailer and is triggered by the blocking of the laser beams as the vehicle travels underneath EDAR. A weather sensor gives wind speed and direction in addition to temperature, pressure and relative humidity.
Figure 3. EDAR Location on Entrance Ramp from W. Algonquin Rd. and I-290

On-Road Remote Sensing in Rolling Meadows, Illinois Area: Fall 2016
17
Figure 4. Image of EDAR at the Ramp in Rolling Meadows Showing Trailer Setup
2.2. Screening of Exhaust Plumes
Since EDAR measures the exhaust plume with a sheet of laser light scanning the roadway, EDAR is capable of imaging two-dimensional images of passing vehicles and their respective emission plumes. One axis of the image depicts the length across the road, while the other axis depicts the passage of time. The image shows the shape of the vehicle, its lane position and the position of its tailpipe. In addition, EDAR forms an active image of a vehicle’s emission plume showing the quantity of pollutant detected per unit area or optical mass in moles/m2.

On-Road Remote Sensing in Rolling Meadows, Illinois Area: Fall 2016
18
The active image, as described above and shown in Figure 5, shows the position of the plume for each pollutant as well as the dispersion rate of the plume. The gas record is considered valid if there is one scan where the average measurement of CO2 in the scan exceeds 0.004 moles/m2. Furthermore, the linear correlation coefficient or Pearson’s correlation criteria (r) is applied between the CO2 measurements and the CO, NO and HC measurements. If the correlation factor is relatively high along with elevated amounts of pollutants, the measurement is considered valid. This signifies that there are no interfering plumes. Interfering plumes usually have different ratios of pollutant to CO2 (See Appendix. A), therefore the linear correlation coefficient drops in value. The highest linear correlation coefficient is 1.0, whereas values near zero indicate no correlation and negative 1.0 indicates complete negative correlation. When gas readings are near zero for CO, NO and HC, then correlation values are ignored, because of the lack of presence of those gases. EDAR’s algorithm identifies the distinct presence of an interfering plume thus removing it from the valid data set.
In addition, the visual 2D representation of the exhaust plumes shows interfering plumes from either neighboring lanes or previous vehicles. When a prior in-lane vehicle is a high emitter, it is common for the subsequent vehicle to be “engulfed” by the large plume. On the other hand, when a plume enters from a neighboring lane, it is common for it to be distinct from the plume exiting the tailpipe of the target vehicle, which makes it easy to discern neighboring plumes, as shown in Figure 5. Each plume image is rescaled according to the highest readings. The vehicle in Figure 5 CO2 plume is much larger than the residual CO2 in the interfering plume and therefore the interfering plume’s CO2 is not visible in the picture. This is not the case for CO whose residual plume is on the same scale as the current vehicles CO plume.
On-Road Remote Sensing in Rolling Meadows, Illinois Area: Fall 2016
19
Figure 5. Example of Dual Exhaust Vehicle Driving through the Plume of a Preceding High Emitter
2.3. Monitored Remotely
HEAT’s EDAR units are monitored remotely from Knoxville. Annunciators are set up so that HEAT’s engineers are alerted to anomalies or changes that do not meet the standard parameter criteria. Examples would include an alert if the system was knocked out of alignment, if it experienced a loss of power, or if there were connectivity issues.
On-Road Remote Sensing in Rolling Meadows, Illinois Area: Fall 2016
20
3. RESULTS AND DISCUSSIONS
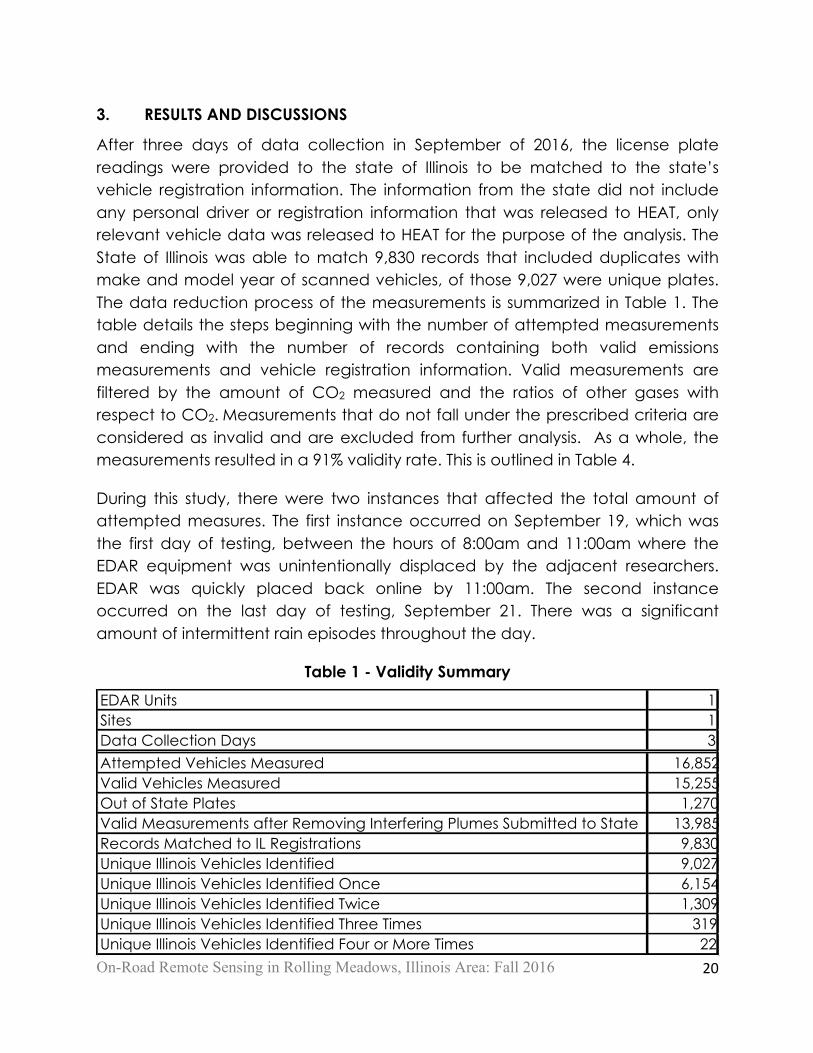
After three days of data collection in September of 2016, the license plate readings were provided to the state of Illinois to be matched to the state’s vehicle registration information. The information from the state did not include any personal driver or registration information that was released to HEAT, only relevant vehicle data was released to HEAT for the purpose of the analysis. The State of Illinois was able to match 9,830 records that included duplicates with make and model year of scanned vehicles, of those 9,027 were unique plates. The data reduction process of the measurements is summarized in Table 1. The table details the steps beginning with the number of attempted measurements and ending with the number of records containing both valid emissions measurements and vehicle registration information. Valid measurements are filtered by the amount of CO2 measured and the ratios of other gases with respect to CO2. Measurements that do not fall under the prescribed criteria are considered as invalid and are excluded from further analysis. As a whole, the measurements resulted in a 91% validity rate. This is outlined in Table 4.
During this study, there were two instances that affected the total amount of attempted measures. The first instance occurred on September 19, which was the first day of testing, between the hours of 8:00am and 11:00am where the EDAR equipment was unintentionally displaced by the adjacent researchers. EDAR was quickly placed back online by 11:00am. The second instance occurred on the last day of testing, September 21. There was a significant amount of intermittent rain episodes throughout the day.
Table 1 - Validity Summary
EDAR Units 1Sites 1Data Collection Days 3Attempted Vehicles Measured 16,852Valid Vehicles Measured 15,255Out of State Plates 1,270Valid Measurements after Removing Interfering Plumes Submitted to State 13,985Records Matched to IL Registrations 9,830Unique Illinois Vehicles Identified 9,027Unique Illinois Vehicles Identified Once 6,154Unique Illinois Vehicles Identified Twice 1,309Unique Illinois Vehicles Identified Three Times 319Unique Illinois Vehicles Identified Four or More Times 22

On-Road Remote Sensing in Rolling Meadows, Illinois Area: Fall 2016
21
Table 2 - Number of Measurements of Repeat Vehicles
Table 3 - Temperature and Humidity
Table 4 - Daily Measurements
Number of Times Measured Number of Vehicles1 6,1542 1,3093 319≥4 22
RH RH RH(%) (%) (%)
700 63.8 60.5 66.9 85.0 66.9 77.1800 70.0 62.0 72.0 84.0 66.0 78.7900 75.9 60.0 75.9 81.0 66.9 70.51000 80.1 61.0 78.1 80.0 70.0 68.01100 82.0 57.8 80.1 76.4 72.5 71.01200 84.9 43.2 81.1 64.0 73.4 78.01300 86.1 41.0 82.2 52.0 72.9 86.01400 87.2 38.0 81.0 48.0 71.1 89.01500 87.3 35.0 81.0 37.0 68.0 73.01600 84.0 28.0 80.1 32.0 73.0 76.01700 82.5 27.5 79.0 31.0 72.0 72.01800 82.0 27.0 75.0 27.3 72.0 74.0
Time(CDT)
201619-Sep 20-Sep 21-Sep
T (°F) T (°F) T (°F)
EDAR Date Location City County AttemptedMeasures
ValidEmissionsRead
Valid%
7 9/19/16 RollingMeadows Cook 6,427 6,041 94%7 9/20/16 RollingMeadows Cook 6,193 5,501 89%7 9/21/16 RollingMeadows Cook 4,232 3,713 88%
16,852 15,255 91%
OnrampfromAlgonquinRoadtoI-290
Totals

On-Road Remote Sensing in Rolling Meadows, Illinois Area: Fall 2016
22
3.1. Rolling Meadows Average Emissions by Model Year
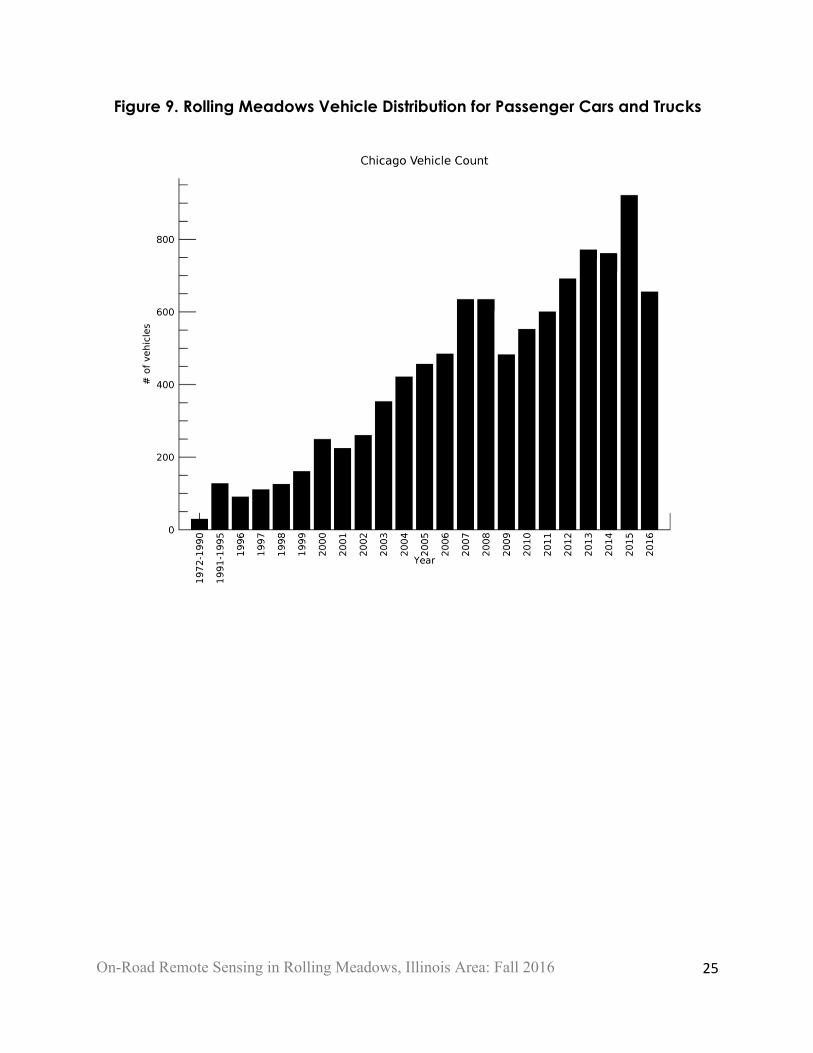
The sampled fleet population distribution and average emissions concentrations by model year for Rolling Meadows, IL, a suburb of Chicago, are shown in Figures 6 to 8. The older the model year, the more likely there will be higher emissions and greater variation in those emissions in general due to older vehicles being subject to different, less stringent standards when manufactured. HEAT’s data confirms this by showing considerable variation in the older model year averages.
The model years 2011 thru 2016, which constitute 45% of the vehicles measured in the graphs below, show average emissions that are fairly consistent. Furthermore, large variation of model years older than 15 years could be due to lack of samples. The number of samples for each year is shown in Figure 9.
Figure 6. Rolling Meadows Average CO Emissions

On-Road Remote Sensing in Rolling Meadows, Illinois Area: Fall 2016
23
Figure 7. Rolling Meadows Average NO Emissions

On-Road Remote Sensing in Rolling Meadows, Illinois Area: Fall 2016
24
Figure 8. Rolling Meadows Average HC Emissions
On-Road Remote Sensing in Rolling Meadows, Illinois Area: Fall 2016
25
Figure 9. Rolling Meadows Vehicle Distribution for Passenger Cars and Trucks

On-Road Remote Sensing in Rolling Meadows, Illinois Area: Fall 2016
26
3.2. Noise Analysis
The accuracy measurements of the EDAR system are well within the range of the certified gas sample accuracy and the detector accuracy standards of the California Bureau of Automotive Repair (BAR) On-Road Emissions Measurement Standards (OREMS).
In past remote sensing studies, the negative values are also considered an indication of the accuracy or noise in the instrument.3,4 Despite the heavy traffic on the ramp and ample evidence of interfering plumes, (see Appendix 6.1) a noise analysis is performed on the negative data.
Exponential distribution is adequate to describe the distribution of the negative values in all gases. A Laplace Probability Density Function (PDF) is the simplest PDF for an exponential distribution with only 2 parameters. Since the mean is considered to be zero only one parameter is actually needed.
The Laplace distribution PDF is "#$𝑒𝑥𝑝(− |+,-|
$), where µ is the location parameter
and b is scaling parameter. Our locations are zero, so if we take the ln of the negative side of the distribution and then fit to a straight line we can retrieve the scaling parameter b from the slope of the fit.
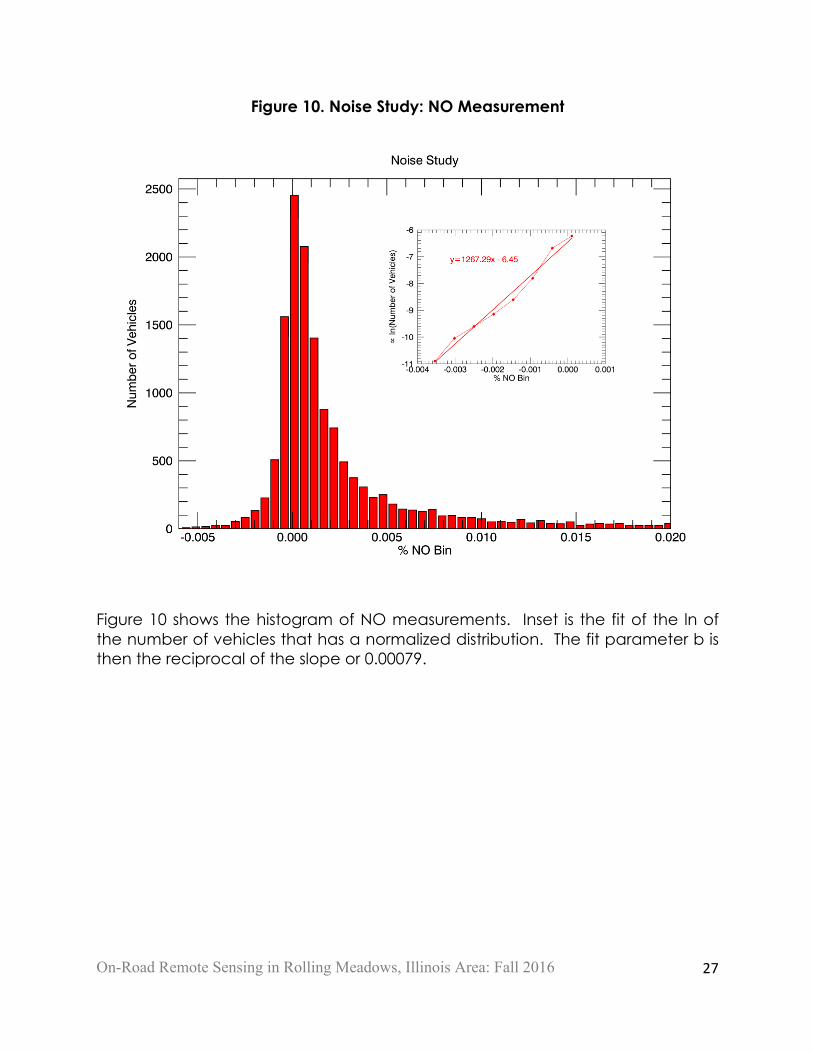
Figures 10 to 12 show the straight-line fits for NO, CO, and HC. The straight-line fit inset of the ln of the number of vehicles have been normalized. For NO, HC and CO the fit parameter b is then the reciprocal of the slope or 0.00079, 0.000907 and 0.00201 respectively. The variance of a Laplace PDF is 2𝑏# and therefore the standard deviation 2𝑏. The standard deviation for NO, HC and CO are therefore 0.0011% or 11ppm, 0.0013% or 13ppm, and 0.0028% or 28ppm, respectively.
The average measured emissions for CO, NO and HC were 759 ppm, 85 ppm and 42 ppm. As expected, CO exhibits larger range of values. For CO, the positive side of the slope is much shallower than the negative part. On the other hand, NO and HC exhibit larger slopes with respect to their mean values.
3 Jimenez, J.L.; Koplow, M.D.; Nelson, D.D.; Zahniser, M.S.; Schmidt, S.E.; J. Air & Waste Manage. Assoc. 1999, 49, 463. 4 Pokharel, S. S.; Bishop, G. A.; Stedman, D. H., On-road remote sensing of automobile emissions in the Phoenix area: Year 2; Coordinating Research Council, Inc: Alpharetta, 2000.
On-Road Remote Sensing in Rolling Meadows, Illinois Area: Fall 2016
27
Figure 10. Noise Study: NO Measurement
Figure 10 shows the histogram of NO measurements. Inset is the fit of the ln of the number of vehicles that has a normalized distribution. The fit parameter b is then the reciprocal of the slope or 0.00079.

On-Road Remote Sensing in Rolling Meadows, Illinois Area: Fall 2016
28
Figure 11. Noise Study: HC Measurement
Figure 11 shows the histogram of HC measurements. Inset is the fit of the ln of the number of vehicles that has a normalized distribution. The fit parameter b is then the reciprocal of the slope or 0.000907.

On-Road Remote Sensing in Rolling Meadows, Illinois Area: Fall 2016
29
Figure 12. Noise Study: CO Measurements
Figure 12 shows the histogram of CO measurements. Inset is the fit of the ln of the number of vehicles that has a normalized distribution. The fit parameter b is then the reciprocal of the slope or 0.00201.

On-Road Remote Sensing in Rolling Meadows, Illinois Area: Fall 2016
30
3.3. Measurements of Multi-Read Vehicles
MultiplemeasurementsofthesamevehicleareanalyzedinFigures13-15.Theplotsshowthemeanemissionandstandarderrorofthemeanforvehiclesmeasuredatleastthreetimes.Thevehiclesaresortedwithrespecttothemeanemissions.Mostvehiclesarelowemittingvehiclesshowinglittlevariability.Thisconfirmsthepracticalityofusingremotesensingforcleanscreening.Ingeneral,theobservedvariabilityincreasesasthemeanemissionsincrease.
Figure 13. Sorted Multi-Read Vehicles: CO

On-Road Remote Sensing in Rolling Meadows, Illinois Area: Fall 2016
31
Figure 14. Sorted Multi-Read Vehicles: NO
Figure 15. Sorted Multi-Read Vehicles: HC

On-Road Remote Sensing in Rolling Meadows, Illinois Area: Fall 2016
32
3.4. Absolute Amounts
The calculation of absolute emission amounts is possible with the EDAR system because of the unique geometry of the remote sensing set up as mentioned in section 1. EDAR scatters laser light off of the road surface; therefore, it is always looking down onto the plume. This allows EDAR to remotely detect the entire plume at one time. One can use the optical mass or optical density of each measurement across the plume to calculate absolute values, mole or gram per meter, kilometer or mile.
The stoichiometric equation is not used in the reporting of absolute amounts. The stoichiometric equation uses ratios of pollutant to CO2 in order to calculate tailpipe percentages. When using the stoichiometric equation, only three ratios are measured (CO/CO2, NO/CO2 and NMHC/CO2) and therefore one of the species percentages must be meaningless. CO2 is chosen because it is the only non-pollutant and the pollutants are the main goal. The percent CO2 is derived from the other three gases and has no meaning except as a denominator.5 EDAR measures each gas independently therefore EDAR’s CO2 measurement is meaningful and can be reported as CO2 gram/mile.
In Figures 16-19 the average instantaneous absolute amount of CO2, CO, NO and NMHC is shown against model year. The direct measurement of CO2 can be used for greenhouse gas computations. In fact, Europe manufacturer’s ratings for CO2 g/km can be used to scale the pollutants coming from the
vehicles by calculating, 1234526547879:;<# =>?@3:5235238A4:;<#B/DE
∗ 𝐼𝑛𝑠𝑡𝑎𝑛𝑡𝑒𝑜𝑢𝑠𝑝𝑜𝑙𝑙𝑢𝑡𝑎𝑛𝑡𝑔/𝑘𝑚 .
In this study, the absolute amounts demonstrate that CO2 averages are fairly consistent throughout the model years. The instantaneous values are higher than typical averages over accepted drive cycle testing due to the vehicles being under load. The average gram/mile for new personal vehicles is 359 g/mi according to the EPA website.6
In addition, the relative values of absolute amounts are similar to the stoichiometric average tailpipe concentration plots, because the stoichiometric
5 D. A. Burgard, G. A. Bishop, R.S. Stadtmull, T. R. Dalton, and D. H. Stedman, Spectroscopy Applied to On-Road Mobile Source Emissions, Applied Spectroscopy, 60, 5, 2006, pp 135-148 6 https://www.epa.gov/fuel-economy-trends/highlights-co2-and-fuel-economy-trends

On-Road Remote Sensing in Rolling Meadows, Illinois Area: Fall 2016
33
equation uses ratios and the CO2 is fairly constant. The results show that CO, NO, and HC absolute amounts decrease as the fleet gets younger and newer models are introduced. This is the classical profile similar to the tailpipe percentages shown in this report.
Figure 16. Absolute Amounts CO2

On-Road Remote Sensing in Rolling Meadows, Illinois Area: Fall 2016
34
Figure 17. Absolute Amounts CO
Figure 18. Absolute Amounts NO

On-Road Remote Sensing in Rolling Meadows, Illinois Area: Fall 2016
35
Figure 19. Absolute Amounts HC
On-Road Remote Sensing in Rolling Meadows, Illinois Area: Fall 2016
36
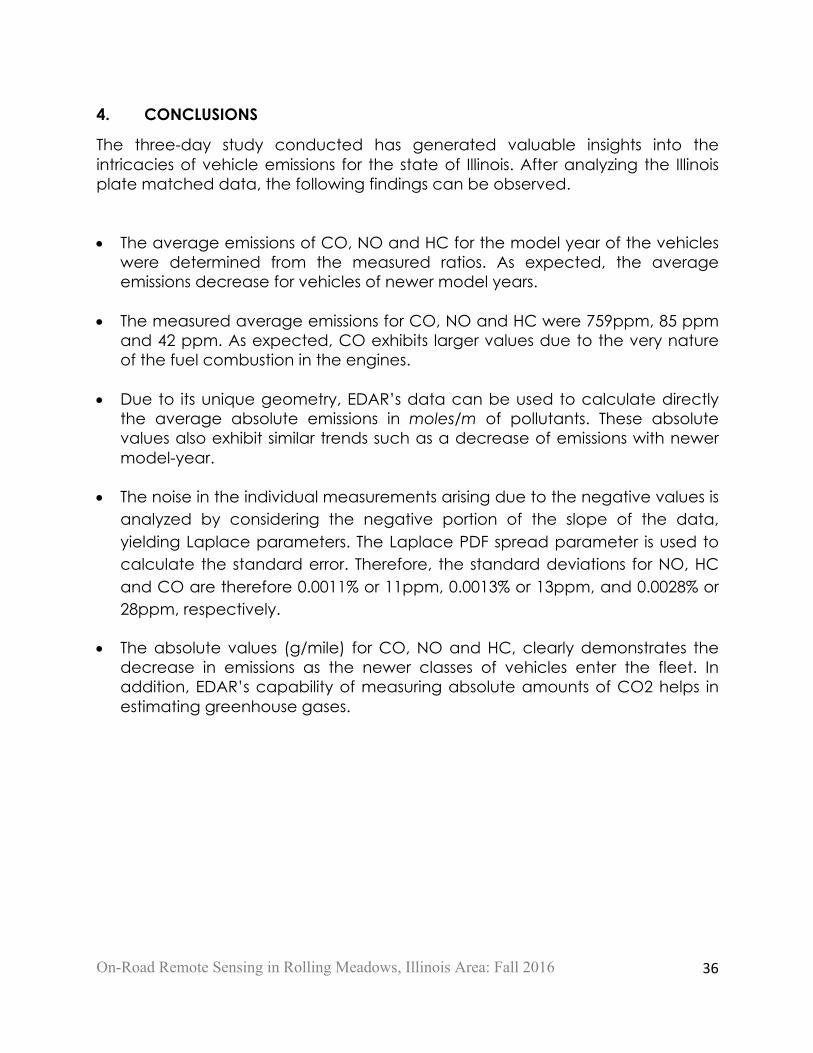
4. CONCLUSIONS
The three-day study conducted has generated valuable insights into the intricacies of vehicle emissions for the state of Illinois. After analyzing the Illinois plate matched data, the following findings can be observed.
• The average emissions of CO, NO and HC for the model year of the vehicles
were determined from the measured ratios. As expected, the average emissions decrease for vehicles of newer model years.
• The measured average emissions for CO, NO and HC were 759ppm, 85 ppm
and 42 ppm. As expected, CO exhibits larger values due to the very nature of the fuel combustion in the engines.
• Due to its unique geometry, EDAR’s data can be used to calculate directly
the average absolute emissions in moles/m of pollutants. These absolute values also exhibit similar trends such as a decrease of emissions with newer model-year.
• The noise in the individual measurements arising due to the negative values is
analyzed by considering the negative portion of the slope of the data, yielding Laplace parameters. The Laplace PDF spread parameter is used to calculate the standard error. Therefore, the standard deviations for NO, HC and CO are therefore 0.0011% or 11ppm, 0.0013% or 13ppm, and 0.0028% or 28ppm, respectively.
• The absolute values (g/mile) for CO, NO and HC, clearly demonstrates the decrease in emissions as the newer classes of vehicles enter the fleet. In addition, EDAR’s capability of measuring absolute amounts of CO2 helps in estimating greenhouse gases.

On-Road Remote Sensing in Rolling Meadows, Illinois Area: Fall 2016
37
5. LIST OF REFERENCES
• CRC Report No. E-106 Chicago 2014 On-Road Remote Sensing of Automobile Emissions in The Chicago Area: Fall 2014.
• http://www.dec.ny.gov/chemical/8577.html
• http://www.bbc.com/news/business-34324772
• Clean Air Act Text. U. S. Environmental Protection Agency.
• http://www.epa.gov/air/caa/text.html.
• National Ambient Air Quality Standards. U. S. Environmental Protection Agency. http://www.epa.gov/air/criteria.html.
• Jimenez, J.L.; Koplow, M.D.; Nelson, D.D.; Zahniser, M.S.; Schmidt, S.E.; J. Air & Waste Manage. Assoc. 1999 , 49, 463.
• Pokharel, S. S.; Bishop, G. A.; Stedman, D. H., On-road remote sensing of automobile emissions in the Phoenix area: Year 2; Coordinating Research Council, Inc: Alpharetta, 2000.
• G.A.Bishop and D.H.Stedman., Measuring the emissions of passing cars: Acc. Chem. Res. 29, 489-495, 1996.

On-Road Remote Sensing in Rolling Meadows, Illinois Area: Fall 2016
38
6. APPENDIX
6.1. Appendix A. EDAR images showing interfering plumes of cars on road
Interfering plumes can pose problems in remote sensing of exhaust emissions. In the present Rolling Meadows, Illinois study, interference due to neighboring lanes is not the case since EDAR was mounted on a one lane ramp. The main cause of interfering plumes in this study was due to high polluting vehicles.
The presence of interfering plumes can be readily seen from the EDAR images shown below. The black and white infrared image of the vehicle is shown with the exhaust plumes in color. Depending on the temperature of the outside of the vehicle the black and white image may show a hot hood and tires which would be white. A cold roof would be dark unless the sun’s infrared radiation scatters off the vehicle. When the sun is at certain angles more details can be seen in the car along with a shadow like the second pane on page 39.
Each vertical block of images is the depiction of one specific vehicle. There are five different vehicle examples below showing the instance of interfering plumes.
Figure A.1: EDAR Images Showing the Effects of Interfering Plumes

On-Road Remote Sensing in Rolling Meadows, Illinois Area: Fall 2016
39
Shadow