Embed Size (px)
Citation preview
95
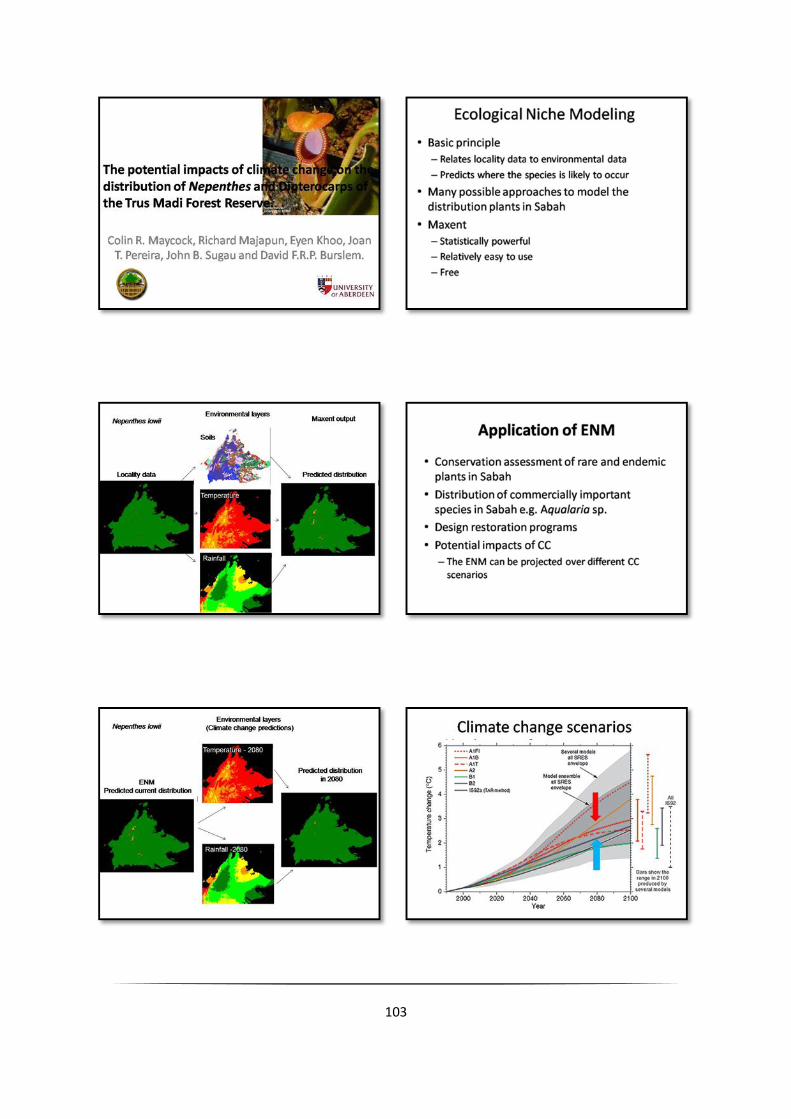
THE POTENTIAL IMPACTS OF CLIMATE CHANGE ON THE DISTRIBUTION
OFNEPENTHESAND DIPTEROCARPS OF THE TRUS MADI FOREST RESERVE
Colin R. Maycock1
, Richard Majapun2
, Eyen Khoo2
, Joan T. Pereira2
, John B. Sugau2
&David F.R.P. Burslem1
1
Institute of Biological and Environmental Sciences, University of Aberdeen, Cruickshank Building,
St Machar Drive, Aberdeen, AB24 3UU, Scotland, UK 2
Forest Research Centre, Sabah Forestry Department, Sepilok, Sandakan, Sabah, Malaysia
ABSTRACT
We used past collection records and data collected during the Scientific Biodiversity Expedition to the
Trus Madi Forest Reserve to generate EcologicalNiche Models (ENMs) for two Nepenthes species (N. macrophylla and N. lowii) and two dipterocarp species (Hopea montana and Shorea monticola). The
ENMs were developed using soil and current climatic data. The ENMs were then projected over down
scaled climate predictions from the CCCMA’sGeneral Circulation Model for the years 2050 and 2080
to model the potential impacts of climate change, under the A2a and B2a emission scenarios, on these
species. The predicted impacts of climate change on these four species varied under the different
emission scenarios and time frames. Nepenthes macrophylla is predicted to be the most severely
affected species, with its preferred climate envelope predicted to disappear from Trus Madi by the year
2050. This loss of preferred climate envelope may increase the likelihood of this species becoming
extinct.
_____________________________________________________________________________
INTRODUCTION
Climate change represents the greatest unknown when it comes to managing natural resources,
protected areas or endangered species within the tropics. This is because we are unsure as to how much
the climate is likely to change or how organism will respond to this change. Our understanding on the
potential impacts of climate change is based on predictions from Global Circulation Models (GCMs),
and the predictions obtained from these models vary between the different models and among the
various emission scenarios (Figure 1).
Furthermore these GCM predictions are at a resolution of hundreds of kilometres which is too coarse
for ecological application (Beaumont et al. 2008). For ecological or impact studies we need to know
what is likely to happen within area of interest, so some form of downscaling of the prediction is
required (Wilby et al. 2004). There a variety of methods available to downscale GCMs prediction,
however, all methods have their limitations and can contribute to the uncertainty in the climate change
predictions (Schmidli et al.2007). Further details on downscaling techniques and a discussion of their
limitations can be found in Beaumont et al. (2008).

96
How a species responds to climate change is dependent on many factors, it can either shift its
distribution to follow the changing environment, adapt in situ to the changing conditions, survive in
refugia i.e. areas of unchanged environment or to become extinct (Wiens et al. 2009). With the limited
ecological and physiological data available for most tropical species it is difficult to assess the likelihood
of the later three; however, it is possible using ecological niche models (ENMs) to project how a species
distribution may change under different climate change scenarios. Ecological niche modeling involves
developing a model that explains the species distribution under current climatic and edaphic conditions,
the model is then projected over the future climate change predictions to determine how the species
distribution is likely to change. In this study we generate ENMs for two Nepenthes (N. lowii and N. macrophylla) and twoDipterocarp (Hopea montana and Shorea monticola) within the Trus Madi Forest
Reserve, and project these ENMs on downscaled climate change prediction obtained from the
Canadian Centre for Climate Modeling and Analysis (CCCMA) to examine the potential impacts of
climate change on the distribution of these four species within the Trus Madi Forest Reserve.
Figure 1: Globally averaged (left) surface air temperature change (°C) and (right) precipitation change
(%) from the various global circulation models for the scenarios A2 (top), A1B (middle) and B1
(bottom) reproduced from Working Group I Report "The Physical Science Basis", Chapter 10 Global
Climate Projections by Meehl et al. (2007)
97
METHODS
Species selection
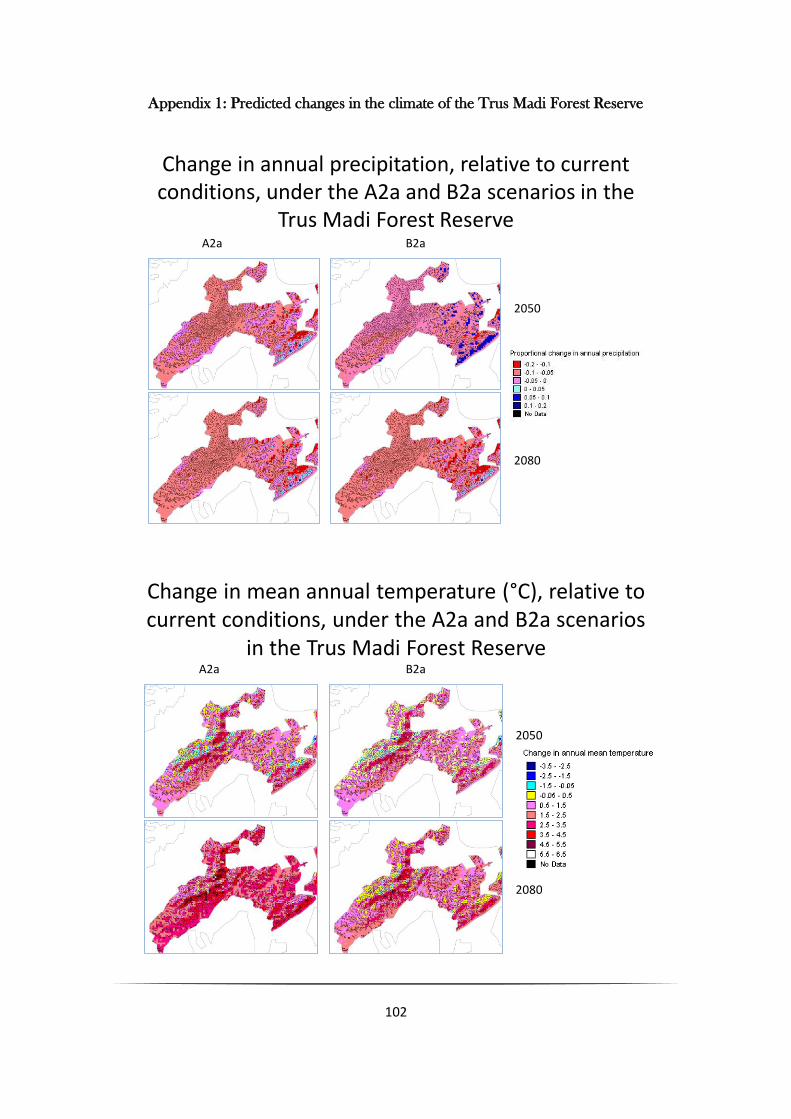
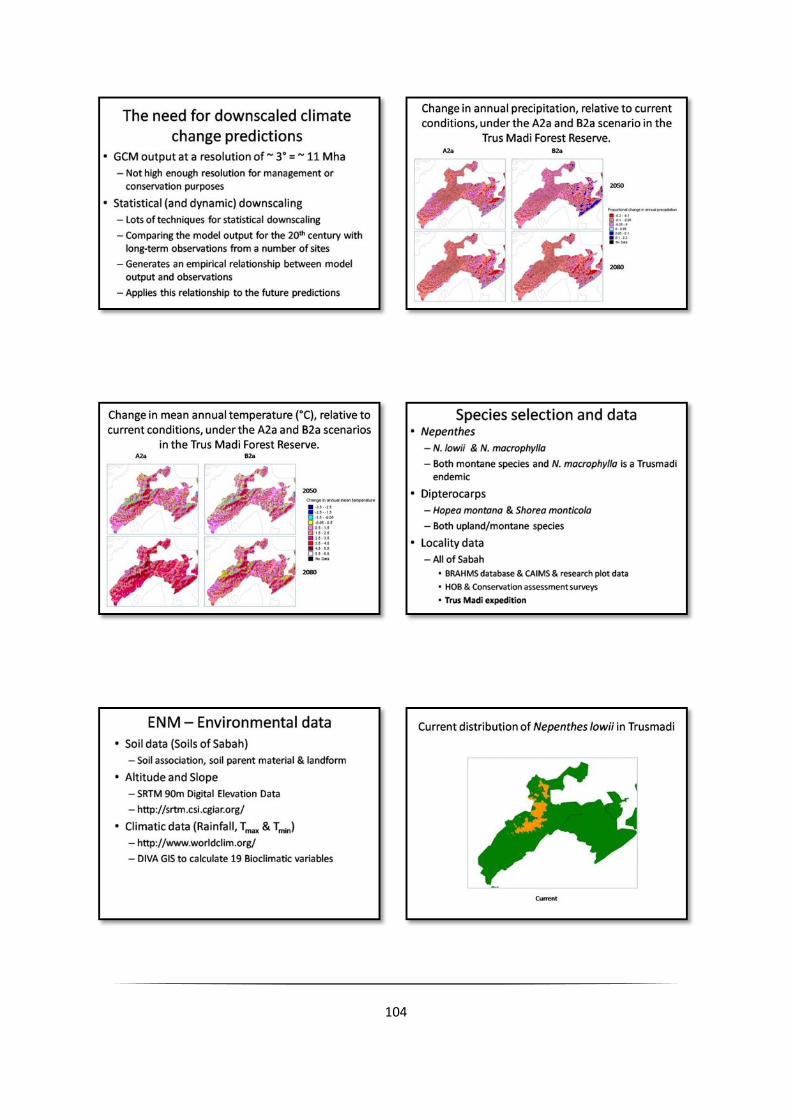
We restricted this initial analysis to montane species as preliminary examination of the downscaled
climate change predictions for Trus Madi, suggested that the montane areas are going to experience
greater changes than low-lying areas (Appendix 1). To demonstrate how plant distributions might be
affected by climate change, we selected two Nepenthes species (Nepenthes lowii and N. macrophylla)
and two upland/montane dipterocarp species (Hopea montana and Shorea monticola).The two
Nepenthes species are endemic to north Borneo, with Nepenthes macrophylla only known from the
summit of Mt Trus Madi above 2500 m (Phillipps et al. 2008). Nepenthes lowii has a wider distribution
and altitudinal range (1650 to 2600 m) being found in montane regions of central and northern Sarawak
and throughout the montane regions of Sabah (Clark et al. 2000a, Phillipps et al. 2008). Nepenthes lowii and Nepenthesmacrophylla are currently listed as vulnerable and critically endangered,
respectively, on the IUCN redlist (Clark et al. 2000a, 2000b).
The two dipterocarp species occupy alower altitudinal range with Hopea montana and Shorea monticola being found between 900 to 1200 m and 600 to 1500 m altitude, respectively. Hopea montana is found throughout the upland regions of Sumatra, Peninsular Malaysia and Borneo, and is
listed as critically endangered (Ashton 1998). The conservation status of the Borneo endemic Shorea monticola has yet to be assessed.
Ecological Niche Modeling
An ecological niche models was generated for each species using Maxent 3.3.1. The ENMs were
derived using locality data and a range of climatic and edaphic variables. Locality data for each species
was obtained from the herbarium specimens at FRC, from the CAIMS database and research plots, as
well as from recent survey conducted as part of the Heart of Borneo project and the Trus Madi
expedition.All herbarium specimen locality records without geographical coordinates were
georeferenced via consultation of 1:250000 soil maps and 1:50000 forest stratum maps. Samples that
could not be confidently placed were excluded from the study to avoid the use of imprecise
distributional information. Where multiple samples had been collected from one locality only one
sample was included in the analysis to reduce sampling bias. GIS shapefiles of soil association,
landform, soil suitability and soil parent material were obtained from the Sabah Forestry Department.
These were converted from Timbalai Borneo RSO projection to WGS84 using ArcView Projection
Utility and the shapefile converted to ESRI ASCII grid format at 6 arc-second resolution using ArcView
Spatial Analyst. Altitudinal data at 3 arc-seconds resolution from the NASA Shuttle Radar Topographic
Mission was obtained from the CGIAR-CSI (http://srtm.csi.cgiar.org)and the data aggregated to 6 arc-
seconds resolution using DIVA GIS.Average monthly rainfall, and maximum and minimum
temperature data for the period 1950-2000 was obtained from WorldClim (http://www.worldclim.org).
The data was in grid file format at 30 arc-seconds(~1 km2
) resolution, these monthly averages were
converted to Bioclimatic variables and disaggregated to 6 arc-seconds resolution using DIVA GIS.
Downscaled future climate predictions, for the years 2050 and 2080, from the Canadian centre for
Climate Modeling and Analysis for the IPPC’s A2a and B2a emission scenarios was obtained from
WorldClim. The A2a and B2a emission scenarios correspond to an ~ 3° and ~ 2° rise in average global
temperature by 2100, respectively. Further information on how this data was downscaled can be found
at http://www.worldclim.org/downscaling.
We ran 100 replicated runs of Maxent on the full set of locality data with 10000 background point
randomly selected per run. The importance of each of the environmental variables for each of the 100
replicated runs was measured using a jackknife approach (Philips & Dudik 2008). The models were the
projected over the climate change prediction under the A2a and B2a emission scenarios for the years
98
2050 and 2080. From the ENMs, we determined a predicted area of occupancy within the TMFR
under current and future climate conditions using the area function in DIVA GIS.
RESULTS
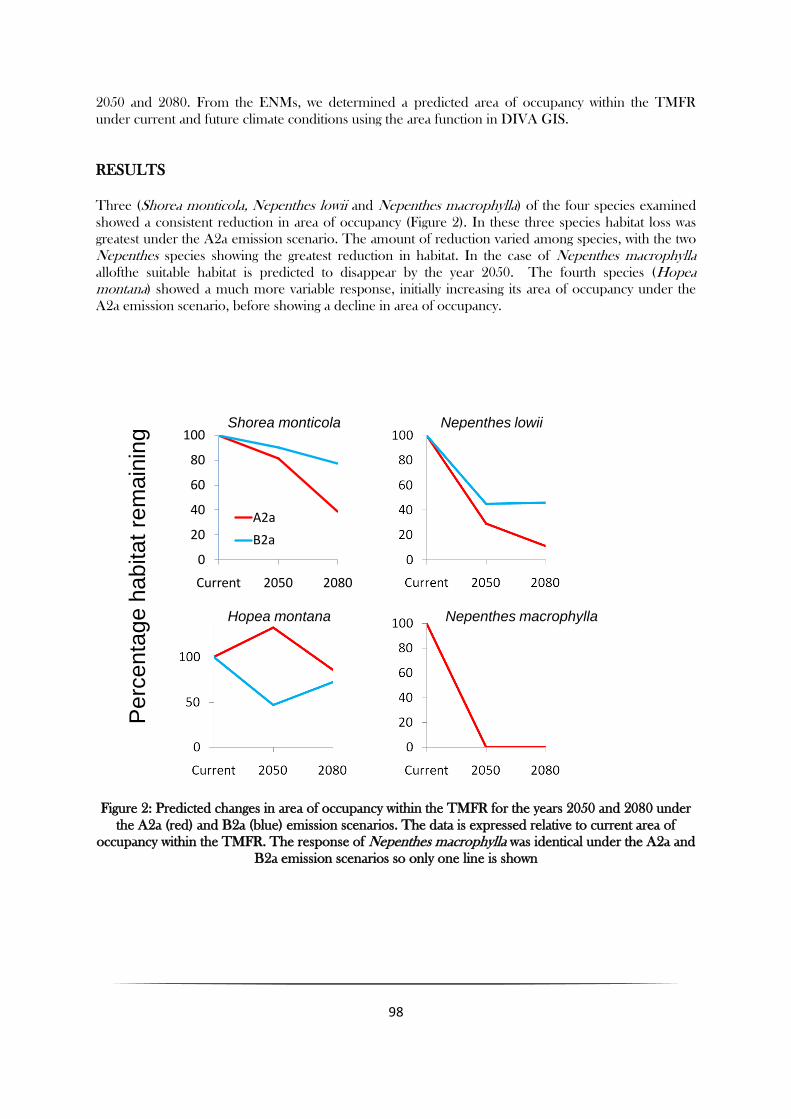
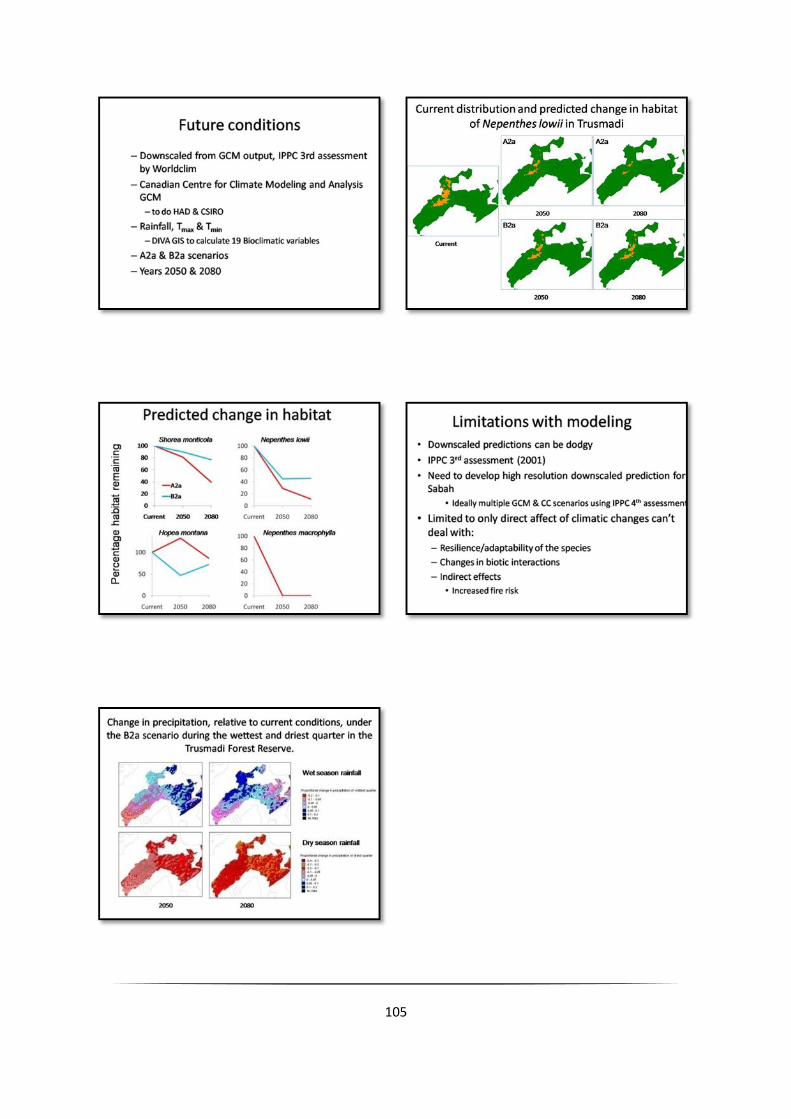
Three (Shorea monticola, Nepenthes lowii and Nepenthes macrophylla) of the four species examined
showed a consistent reduction in area of occupancy (Figure 2). In these three species habitat loss was
greatest under the A2a emission scenario. The amount of reduction varied among species, with the two
Nepenthes species showing the greatest reduction in habitat. In the case of Nepenthes macrophylla
allofthe suitable habitat is predicted to disappear by the year 2050. The fourth species (Hopea montana) showed a much more variable response, initially increasing its area of occupancy under the
A2a emission scenario, before showing a decline in area of occupancy.
0
20
40
60
80
100
Current 2050 2080
A2a
B2a
Perc
enta
ge h
abitat
rem
ain
ing
Shorea monticola
Hopea montana
Nepenthes lowii
Nepenthes macrophylla
Figure 2: Predicted changes in area of occupancy within the TMFR for the years 2050 and 2080 under
the A2a (red) and B2a (blue) emission scenarios. The data is expressed relative to current area of
occupancy within the TMFR. The response of Nepenthes macrophylla was identical under the A2a and
B2a emission scenarios so only one line is shown
99
DISCUSSION
This initial analysis of the potential impacts of climate change on four species within the TMFR suggests
that different species will show different levels of susceptibility to climate change. The species listed in
order of decreasing susceptibility to climate change were as follows;
Nepenthes macrophylla → Nepenthes lowii →Shorea monticola →Hopea montana
The two Nepenthes species showed a greater susceptibility to climate change than the two dipterocarp
species. These differences may reflect the different habitat requirements of the species. The two
Nepenthes species occupy higher altitudinal niches, than the two dipterocarp species, and these high
altitudinal areas in Trus Madi are predicted to show a greater rise in average temperatures than the
lower areas (Appendix 1). In the case of Nepenthes macrophylla the restriction of this species to the
summit makes this species particularly susceptible to the impacts of climate change. Whether the rest of
the summit shrub is as susceptible to the impacts of climate change remains to be determined, however,
as this vegetation association is one of the key conservation targets of CAMP (2009) we recommend
further investigation.
Using ecological niche models to make projection on a species future distributions is an educated guess
(Weins et al. 2009), and a clear understanding on the underlying assumptions and limitations of these
models is required. The ENMs at this stage cannot predict whether a species will be able to adapt to the
changed environment nor are the models of high enough spatial resolution to predict whether or not
refugia will remain. So while our prediction suggests that Nepenthes macrophylla faces an uncertain
future, we can’t conclude that it is certain to go extinct.
Another limitation of our study is that it was conducted using the prediction from a single GCM using
only 2 of the 38 different IPPC emission scenarios. As can be seen in Figure 1, there is substantial
variation among the different the GCMs and emission scenarios. At this stage we don’t know which
emission scenario will be realized or which GCMs gives the best predictions. So the recommended best
practices for modeling how climate change will affect an organism’s distribution involves using the
predictions from multiple GCMs over a range of emission scenarios and then either averaging the
results to arrive at a consensus (Weins et al. 2009), or to use the predictions from different models and
emission scenarios to make probability distribution functions of the species response (Beaumont et al. 2008). A second limitation of our predictions is that the downscaled predictions used in this study where
derived from the GCMs used in the IPCC Third Assessment Report (TAR). Comparisons of models
used in the TAR and the more recent Fourth Assessment Report (AR4) show that the more recent
models are better able to simulate seasonal patterns in precipitation and surface air temperatures than
was possible at the time of the TAR (Randall et al.2007). Further refinement and improvement of the
prediction of our ecological niche models is recommended.
While it is possible to improve our ENMs projection using the most recent predictions from multiple
GCMs and emission scenarios, ecological modeling techniques are unable to take into account
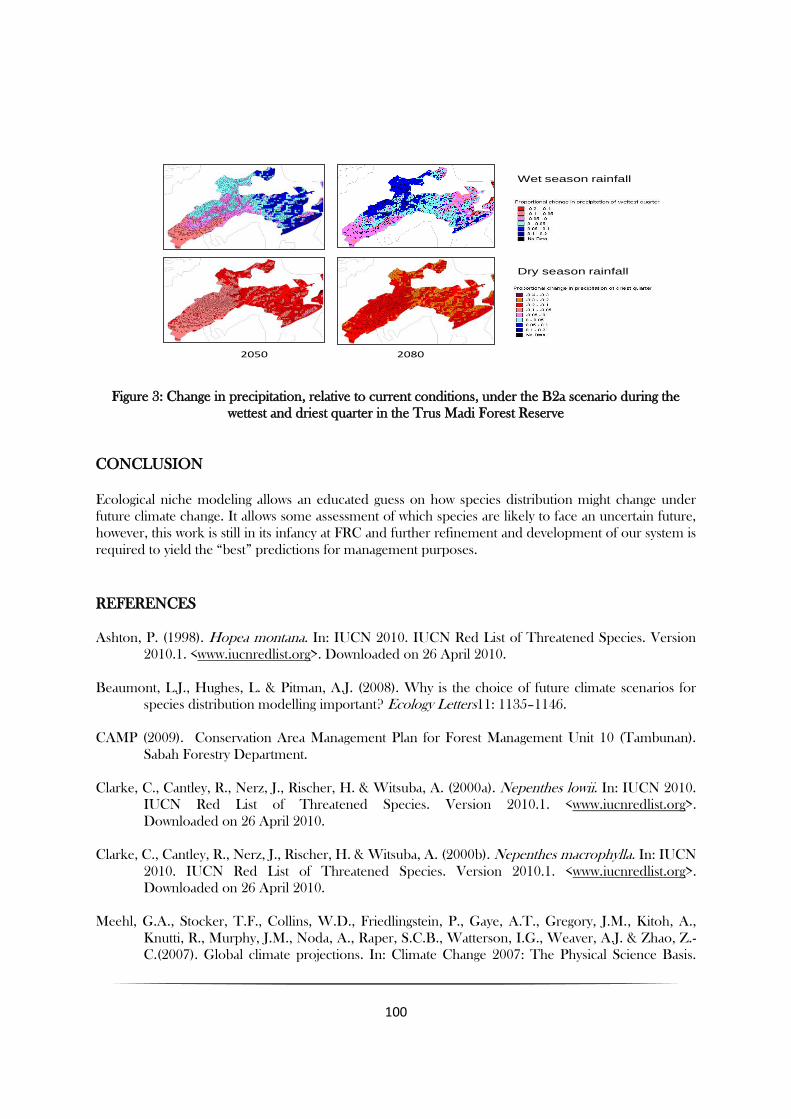
secondary impacts of climate change. In the case of the Trus Madi Forest Reserve, one of the
potentially most important predicted changes in climate may be the increased seasonality of rainfall
(Figure 3). The Trus Madi Forest Reserve is predicted to have dry seasons that are up to 20% drier than
current, this coupled with increased temperature has the potential to increase the fire risk within the
reserve. Without adequate fire management both within and outside Trus Madi Forest Reserve this
increased fire risk has the potential to cause greater habitat loss than the direct effects of climate change.
100
20802050
Dry season rainfall
Wet season rainfall
Figure 3: Change in precipitation, relative to current conditions, under the B2a scenario during the
wettest and driest quarter in the Trus Madi Forest Reserve
CONCLUSION
Ecological niche modeling allows an educated guess on how species distribution might change under
future climate change. It allows some assessment of which species are likely to face an uncertain future,
however, this work is still in its infancy at FRC and further refinement and development of our system is
required to yield the “best” predictions for management purposes.
REFERENCES
Ashton, P. (1998). Hopea montana. In: IUCN 2010. IUCN Red List of Threatened Species. Version
2010.1. <www.iucnredlist.org>. Downloaded on 26 April 2010.
Beaumont, L.J., Hughes, L. & Pitman, A.J. (2008). Why is the choice of future climate scenarios for
species distribution modelling important? Ecology Letters11: 1135–1146.
CAMP (2009). Conservation Area Management Plan for Forest Management Unit 10 (Tambunan).
Sabah Forestry Department.
Clarke, C., Cantley, R., Nerz, J., Rischer, H. & Witsuba, A. (2000a). Nepenthes lowii. In: IUCN 2010.
IUCN Red List of Threatened Species. Version 2010.1. <www.iucnredlist.org>.
Downloaded on 26 April 2010.
Clarke, C., Cantley, R., Nerz, J., Rischer, H. & Witsuba, A. (2000b). Nepenthes macrophylla. In: IUCN
2010. IUCN Red List of Threatened Species. Version 2010.1. <www.iucnredlist.org>.
Downloaded on 26 April 2010.
Meehl, G.A., Stocker, T.F., Collins, W.D., Friedlingstein, P., Gaye, A.T., Gregory, J.M., Kitoh, A.,
Knutti, R., Murphy, J.M., Noda, A., Raper, S.C.B., Watterson, I.G., Weaver, A.J. & Zhao, Z.-
C.(2007). Global climate projections. In: Climate Change 2007: The Physical Science Basis.
101
Contribution of Working Group I to the Fourth Assessment Report of the Intergovernmental
Panel on Climate Change (eds Solomon, S., Qin, D., Manning, M., Chen, Z., Marquis, M.,
Averyt, K.B., Tignor, M. & Miller, H.L.). Cambridge University Press, Cambridge, United
Kingdom and New York, NY, USA.
Philips, S.J. & Dudik, M. (2008) Modeling of species distributions with Maxent: new extensions and a
comprehensive evaluation. Ecography 31: 161-175.
Phillipps, A., Lamb, A. & Lee, C.C. (2008) Pitcher Plants of Borneo. Natural History Publications,
Kota Kinabalu.
Randall, D.A., Wood, R.A., Bony, S., Colman, R., Fichefet, T., Fyfe, J., Kattsov, V., Pitman, A.,
Shukla, J., Srinivasan, J., Stouffer, R.J., Sumi, A. & Taylor, K.E. (2007). Climate models and
their evaluation. In: Climate Change 2007: The Physical Science Basis. Contribution of
Working Group I to the Fourth Assessment Report of the Intergovernmental Panel on Climate
Change (eds Solomon, S., Qin, D., Manning, M., Chen, Z., Marquis, M., Averyt, K.B., Tignor,
M. & Miller, H.L.). Cambridge University Press, Cambridge, United Kingdom and New York,
NY, USA, pp. 589–662.
Schmidli, J., Goodess, C., Frei, C., Haylock, M., Hundecha, Y., Ribalaygua, J. &Schmith, T. (2007).
Statistical and dynamical downscaling of precipitation: an evaluation and comparison of
scenarios for the European Alps. Journal of Geophysical Research 112: D04105.1–D04105.20.
Wiens, J. A., Stralberg, D., Jongsomjit, D., Howell, C.A. & Snyder,,
M.A. (2009) Niches, models, and
climate change: Assessing the assumptions and uncertainties. PNAS106: S2 19729-19736.
Wilby, R., Charles, S., Zorita, E., Timbal, B., Whetton, P. & Mearns, L. (2004). Guidelines for use of
climate scenarios developed from statistical downscaling methods. In: Intergovernmental Panel
on Climate Change. http://www.ipcc-data.org/guidelines/dgm_no2_v1_09_2004.pdf, p. 27.
102
Appendix 1: Predicted changes in the climate of the Trus Madi Forest Reserve
Change in annual precipitation, relative to current conditions, under the A2a and B2a scenarios in the
Trus Madi Forest Reserve A2a B2a
2050
2080
Change in mean annual temperature (°C), relative to current conditions, under the A2a and B2a scenarios
in the Trus Madi Forest ReserveA2a B2a
2050
2080
103
104
105