Embed Size (px)
Citation preview

PUBLIC HEALTH RESEARCHVOLUME 6 ISSUE 13 NOVEMBER 2018
ISSN 2050-4381
DOI 10.3310/phr06130
Child food insecurity in the UK: a rapid review
Magaly Aceves-Martins, Moira Cruickshank, Cynthia Fraser and Miriam Brazzelli


Child food insecurity in the UK:a rapid review
Magaly Aceves-Martins, Moira Cruickshank,Cynthia Fraser and Miriam Brazzelli*
Health Services Research Unit, University of Aberdeen, Aberdeen, UK
*Corresponding author
Declared competing interests of authors: none
Published November 2018DOI: 10.3310/phr06130
This report should be referenced as follows:
Aceves-Martins M, Cruickshank M, Fraser C, Brazzelli M. Child food insecurity in the UK: a rapid
review. Public Health Res 2018;6(13).

Public Health Research
ISSN 2050-4381 (Print)
ISSN 2050-439X (Online)
This journal is a member of and subscribes to the principles of the Committee on Publication Ethics (COPE) (www.publicationethics.org/).
Editorial contact: [email protected]
The full PHR archive is freely available to view online at www.journalslibrary.nihr.ac.uk/phr. Print-on-demand copies can be purchased from thereport pages of the NIHR Journals Library website: www.journalslibrary.nihr.ac.uk
Criteria for inclusion in the Public Health Research journalReports are published in Public Health Research (PHR) if (1) they have resulted from work for the PHR programme, and (2) they are of asufficiently high scientific quality as assessed by the reviewers and editors.
Reviews in Public Health Research are termed ‘systematic’ when the account of the search, appraisal and synthesis methods(to minimise biases and random errors) would, in theory, permit the replication of the review by others.
PHR programmeThe Public Health Research (PHR) programme, part of the National Institute for Health Research (NIHR), evaluates public health interventions,providing new knowledge on the benefits, costs, acceptability and wider impacts of non-NHS interventions intended to improve the healthof the public and reduce inequalities in health. The scope of the programme is multi-disciplinary and broad, covering a range of interventionsthat improve public health. The Public Health Research programme also complements the NIHR Health Technology Assessment programmewhich has a growing portfolio evaluating NHS public health interventions.
For more information about the PHR programme please visit the website: http://www.nets.nihr.ac.uk/programmes/phr
This reportThe research reported in this issue of the journal was funded by the PHR programme as project number 17/48/02. The contractual start datewas in December 2017. The final report began editorial review in June 2018 and was accepted for publication in October 2018. The authorshave been wholly responsible for all data collection, analysis and interpretation, and for writing up their work. The PHR editors and productionhouse have tried to ensure the accuracy of the authors’ report and would like to thank the reviewers for their constructive comments on thefinal report document. However, they do not accept liability for damages or losses arising from material published in this report.
This report presents independent research funded by the National Institute for Health Research (NIHR). The views and opinions expressed byauthors in this publication are those of the authors and do not necessarily reflect those of the NHS, the NIHR, NETSCC, the PHR programme orthe Department of Health and Social Care. If there are verbatim quotations included in this publication the views and opinions expressed bythe interviewees are those of the interviewees and do not necessarily reflect those of the authors, those of the NHS, the NIHR, NETSCC, thePHR programme or the Department of Health and Social Care.
© Queen’s Printer and Controller of HMSO 2018. This work was produced by Aceves-Martins et al. under the terms of acommissioning contract issued by the Secretary of State for Health and Social Care. This issue may be freely reproduced for thepurposes of private research and study and extracts (or indeed, the full report) may be included in professional journals providedthat suitable acknowledgement is made and the reproduction is not associated with any form of advertising. Applications forcommercial reproduction should be addressed to: NIHR Journals Library, National Institute for Health Research, Evaluation, Trialsand Studies Coordinating Centre, Alpha House, University of Southampton Science Park, Southampton SO16 7NS, UK.
Published by the NIHR Journals Library (www.journalslibrary.nihr.ac.uk), produced by Prepress Projects Ltd, Perth, Scotland(www.prepress-projects.co.uk).

NIHR Journals Library Editor-in-Chief
Professor Ken Stein Chair of HTA and EME Editorial Board and Professor of Public Health, University of Exeter Medical School, UK
NIHR Journals Library Editors
Professor Ken Stein Chair of HTA and EME Editorial Board and Professor of Public Health, University of Exeter Medical School, UK
Professor Andrée Le May Chair of NIHR Journals Library Editorial Group (HS&DR, PGfAR, PHR journals)
Professor Matthias Beck Professor of Management, Cork University Business School, Department of Management and Marketing, University College Cork, Ireland
Dr Tessa Crilly Director, Crystal Blue Consulting Ltd, UK
Dr Eugenia Cronin Senior Scientific Advisor, Wessex Institute, UK
Dr Peter Davidson Consultant Advisor, Wessex Institute, University of Southampton, UK
Ms Tara Lamont Scientific Advisor, NETSCC, UK
Dr Catriona McDaid Senior Research Fellow, York Trials Unit, Department of Health Sciences, University of York, UK
Professor William McGuire Professor of Child Health, Hull York Medical School, University of York, UK
Professor Geoffrey Meads Professor of Wellbeing Research, University of Winchester, UK
Professor John Norrie Chair in Medical Statistics, University of Edinburgh, UK
Professor John Powell Consultant Clinical Adviser, National Institute for Health and Care Excellence (NICE), UK
Professor James Raftery Professor of Health Technology Assessment, Wessex Institute, Faculty of Medicine, University of Southampton, UK
Dr Rob Riemsma Reviews Manager, Kleijnen Systematic Reviews Ltd, UK
Professor Helen Roberts Professor of Child Health Research, UCL Great Ormond Street Institute of Child Health, UK
Professor Jonathan Ross Professor of Sexual Health and HIV, University Hospital Birmingham, UK
Professor Helen Snooks Professor of Health Services Research, Institute of Life Science, College of Medicine, Swansea University, UK
Professor Jim Thornton Professor of Obstetrics and Gynaecology, Faculty of Medicine and Health Sciences, University of Nottingham, UK
Professor Martin Underwood Warwick Clinical Trials Unit, Warwick Medical School, University of Warwick, UK
Please visit the website for a list of editors: www.journalslibrary.nihr.ac.uk/about/editors
Editorial contact: [email protected]
NIHR Journals Library www.journalslibrary.nihr.ac.uk

Abstract
Child food insecurity in the UK: a rapid review
Magaly Aceves-Martins, Moira Cruickshank, Cynthia Fraserand Miriam Brazzelli*
Health Services Research Unit, University of Aberdeen, Aberdeen, UK
*Corresponding author [email protected]
Background: Food insecurity (FI) is a multifaceted, socioeconomic problem involving difficulties accessingsufficient, safe and nutritious food to meet people’s dietary requirements and preferences for a healthylife. For children experiencing FI, there are some potentially negative developmental consequences andit is, therefore, important to understand the links between FI and children’s health and well-being as wellas any strategies undertaken to address FI. The overall objective of this assessment was to determine thenature, extent and consequences of FI affecting children (aged ≤ 18 years) in the UK.
Objective: To determine the nature, extent and consequences of FI affecting children (aged ≤ 18 years)in the UK.
Data sources: The databases searched on 4 December 2017 included MEDLINE (including In-Process & OtherNon-Indexed Citations and E-pub ahead of print files), EMBASE, the Cumulative Index to Nursing and AlliedHealth Literature (CINAHL), the Commonwealth Agricultural Bureaux (CAB) abstracts, The Cochrane Library,Education Resources Information Centre (ERIC), PsycINFO, the Social Science Citation Index and the AppliedSocial Sciences Index and Abstracts (ASSIA).
Methods: A rapid review of the current published and unpublished literature was conducted, including allstudy designs from specified high-income countries in children aged ≤ 18 years. Searches were conductedof major health-care, nutrition, education and social science databases from 1995 onwards, and websitesof relevant UK and international organisations. Final searches were undertaken in December 2017.
Results: In total, 109 studies were selected. Only five studies were conducted in the UK, four of whichprovided qualitative data. Possible factors associated with child FI were identified, for example socioeconomicstatus, material deprivation, living in public housing and having unemployed or poorly educated parents.Children’s health, well-being and academic outcomes were all negatively affected by FI. The mediatingeffects of family stressors and parenting practices in the relationship between FI and children’s health andwell-being outcomes were not clear. Food assistance programmes were generally effective in mitigating FIand improving nutritional outcomes (including hunger) in the short term, but did not eradicate FI, eliminateits effects on children’s health or have an impact on academic outcomes. No reports assessing the prevalenceof child FI in the UK or the cost-effectiveness and sustainability of interventions to tackle FI were identified.
Limitations: There was a lack of consistency in how FI was defined and measured across studies. Most ofthe studies used indirect measurements of child FI through parental reports. The majority of studies wereconducted in North America. Only five studies were conducted in the UK. Thirty potentially relevantstudies were not included in the review as a result of time and resource constraints. Most studies wereobservational and caution is advised in interpreting their results.
DOI: 10.3310/phr06130 PUBLIC HEALTH RESEARCH 2018 VOL. 6 NO. 13
© Queen’s Printer and Controller of HMSO 2018. This work was produced by Aceves-Martins et al. under the terms of a commissioning contract issued by the Secretary of Statefor Health and Social Care. This issue may be freely reproduced for the purposes of private research and study and extracts (or indeed, the full report) may be included inprofessional journals provided that suitable acknowledgement is made and the reproduction is not associated with any form of advertising. Applications for commercialreproduction should be addressed to: NIHR Journals Library, National Institute for Health Research, Evaluation, Trials and Studies Coordinating Centre, Alpha House, University ofSouthampton Science Park, Southampton SO16 7NS, UK.
v

Conclusions: A number of factors that were related to child FI were identified, as were negativeassociations between child FI and physical, mental and social outcomes. However, these findings should beinterpreted with caution because of the correlational nature of the analyses and the fact that it is difficultto determine if some factors are predictors or consequences of FI.
Future research: There is an urgent requirement for the development of a reliable instrument to measureand monitor child FI in the UK and for well-designed interventions or programmes to tackle child FI.
Study registration: This study is registered as PROSPERO CRD42017084818.
Funding: The National Institute for Health Research Public Health Research programme. The Health ServicesResearch Unit is core-funded by the Chief Scientist Office of the Scottish Government Health and SocialCare Directorates.
ABSTRACT
NIHR Journals Library www.journalslibrary.nihr.ac.uk
vi

Contents
List of tables ix
List of figures xi
List of abbreviations xiii
Plain English summary xv
Scientific summary xvii
Chapter 1 Background 1General objective 2
Specific objectives 2
Chapter 2 Methods 3Inclusion criteria 3
Type of studies 3Type of participants 3Type of setting 3
Exclusion criteria 3Search strategy 4Other methods of identifying relevant information sources 4Data screening, selection and synthesis 4Data synthesis 5
Chapter 3 Results 7Overall characteristics and results of the included studies 7Child food insecurity measurements 9Research question 1: what is the nature and what are the determinants of child foodinsecurity in high-income countries? 10
Results from quantitative data 10Findings from qualitative studies 13
Research question 2: what are the incidence, prevalence and costs of child foodinsecurity in the UK (including recent trends)? 20
Poverty in the UK 20Research question 3: what is the impact of food insecurity on children’s health andsocial well-being in high-income countries? 21
General health outcomes 21Weight status 27Mental health outcomes 27Social well-being outcomes 38Academic outcomes 38
Research question 4: what interventions exist to reduce, eliminate or mitigate the effectsof child food insecurity in high-income countries? 38
Other findings (qualitative data) 46Research question 5: what is the cost-effectiveness of existing interventions that aimto reduce, eliminate or mitigate the effects of child food insecurity in high-incomecountries? 53
DOI: 10.3310/phr06130 PUBLIC HEALTH RESEARCH 2018 VOL. 6 NO. 13
© Queen’s Printer and Controller of HMSO 2018. This work was produced by Aceves-Martins et al. under the terms of a commissioning contract issued by the Secretary of Statefor Health and Social Care. This issue may be freely reproduced for the purposes of private research and study and extracts (or indeed, the full report) may be included inprofessional journals provided that suitable acknowledgement is made and the reproduction is not associated with any form of advertising. Applications for commercialreproduction should be addressed to: NIHR Journals Library, National Institute for Health Research, Evaluation, Trials and Studies Coordinating Centre, Alpha House, University ofSouthampton Science Park, Southampton SO16 7NS, UK.
vii

Chapter 4 Summary of the grey literature 55Breakfast clubs 55Holiday hunger 57Food banks 58Necessity of measuring household food insecurity 58Obesity and food insecurity in children 58
Chapter 5 Overall results 61
Chapter 6 Discussion 63Limitations 65Research needs and future challenges 65
Chapter 7 Conclusions 67
Acknowledgements 69
References 71
Appendix 1 Food insecurity search strategies 85
Appendix 2 General characteristics of included studies 93
Appendix 3 Measurement of food insecurity 107
Appendix 4 Results of studies investigating factors related to child foodinsecurity (adjusted findings) 113
Appendix 5 Results of studies investigating factors relating to child foodinsecurity (unadjusted findings) 129
Appendix 6 Results of studies that assessed health, social well-being andacademic outcomes and did not adjust their analyses for explanatory orconfounding variables 139
Appendix 7 Descriptions of studies that investigated the association betweenchild food insecurity and health outcomes and adjusted their analyses forexplanatory or confounding variables 143
Appendix 8 Descriptions of studies that assessed food assistance programmes 157
CONTENTS
NIHR Journals Library www.journalslibrary.nihr.ac.uk
viii

List of tables
TABLE 1 Summary of factors related to child FI, reported by more than onestudy (adjusted analyses) 11
TABLE 2 Summary of the characteristics of the studies that reported relevantqualitative information 14
TABLE 3 Summary of the six qualitative studies that focused on children’s andadolescents’ FI experiences 15
TABLE 4 Proportion of children aged < 15 years living with a food-insecurerespondent 21
TABLE 5 Results of 21 studies that assessed the relationship between child FIand general health outcomes and adjusted their analyses for explanatory orconfounding variables 22
TABLE 6 Results of the 28 studies that investigated the relationship betweenchild FI and weight status and adjusted their analyses for explanatory orconfounding variables 28
TABLE 7 Results of the 14 studies that investigated the association between childFI and mental health outcomes and adjusted their analyses for explanatory orconfounding variables 34
TABLE 8 Results of the 14 studies that investigated the association between FIand children’s social well-being and adjusted their analyses for explanatory orconfounding variables 39
TABLE 9 Results of the 11 studies that investigated the association betweenchild FI and academic outcomes and adjusted their analyses for explanatory orconfounding variables 43
TABLE 10 Results of the 15 studies that assessed the effects of food aidprogrammes for food-insecure children 47
TABLE 11 Summary of learning from the Department for Education’sliterature review 56
TABLE 12 General characteristics of included studies (n= 109) 94
TABLE 13 Summary of measurement of FI from included studies 107
TABLE 14 Results of studies investigating the factors related to child FI(adjusted findings) 114
TABLE 15 Results of studies investigating the factors related to child FI(unadjusted findings) 129
DOI: 10.3310/phr06130 PUBLIC HEALTH RESEARCH 2018 VOL. 6 NO. 13
© Queen’s Printer and Controller of HMSO 2018. This work was produced by Aceves-Martins et al. under the terms of a commissioning contract issued by the Secretary of Statefor Health and Social Care. This issue may be freely reproduced for the purposes of private research and study and extracts (or indeed, the full report) may be included inprofessional journals provided that suitable acknowledgement is made and the reproduction is not associated with any form of advertising. Applications for commercialreproduction should be addressed to: NIHR Journals Library, National Institute for Health Research, Evaluation, Trials and Studies Coordinating Centre, Alpha House, University ofSouthampton Science Park, Southampton SO16 7NS, UK.
ix

TABLE 16 Results of studies that investigated the associations between child FIand general health outcomes (unadjusted findings) 139
TABLE 17 Results of studies that investigated the associations between child FIand weight status (unadjusted findings) 140
TABLE 18 Results of studies that investigated the associations between child FIand mental health, social well-being and academic outcomes (unadjustedfindings) 141
LIST OF TABLES
NIHR Journals Library www.journalslibrary.nihr.ac.uk
x

List of figures
FIGURE 1 The PRISMA flow chart 7
FIGURE 2 Overview of included studies 8
DOI: 10.3310/phr06130 PUBLIC HEALTH RESEARCH 2018 VOL. 6 NO. 13
© Queen’s Printer and Controller of HMSO 2018. This work was produced by Aceves-Martins et al. under the terms of a commissioning contract issued by the Secretary of Statefor Health and Social Care. This issue may be freely reproduced for the purposes of private research and study and extracts (or indeed, the full report) may be included inprofessional journals provided that suitable acknowledgement is made and the reproduction is not associated with any form of advertising. Applications for commercialreproduction should be addressed to: NIHR Journals Library, National Institute for Health Research, Evaluation, Trials and Studies Coordinating Centre, Alpha House, University ofSouthampton Science Park, Southampton SO16 7NS, UK.
xi


List of abbreviations
ASSIA Applied Social Sciences Indexand Abstracts
BMI body mass index
CAB CommonwealthAgricultural Bureaux
CACFP Child and Adult Care FoodProgram
CCHIP Community Childhood HungerIdentification Project
CDC Centers for Disease Controland Prevention
CI confidence interval
CINAHL Cumulative Index to Nursing andAllied Health Literature
ECLS Early Childhood Longitudinal Study
ECLS-B Early Childhood LongitudinalSurvey – Birth cohort
ECLS-K Early Childhood LongitudinalStudy – Kindergarten cohort
ERIC Education Resources InformationCentre
FI food insecurity
FIES Food Insecurity Experience Scale
FS food security
HbA1c glycated haemoglobin
HBSC Health Behaviour in School-AgedChildren
HDL high-density lipoprotein
HDL-C high-density lipoprotein cholesterol
HR hazard ratio
IQ intelligence quotient
NCHS National Center for Health Statistics
NHANES National Health and NutritionExamination Survey
NSLP National School Lunch Program
NUT National Union of Teachers
OR odds ratio
PRISMA Preferred Reporting Items forSystematic Reviews andMeta-Analyses
QoL quality of life
RCT randomised controlled trial
RQ research question
SD standard deviation
SE standard error
SEBTC Summer Electronic Benefit Transferfor Children
SES socioeconomic status
SFSP Summer Food Service Program
SNAP Supplemental Nutrition AssistanceProgram
TANF Temporary Assistance to NeedyFamilies
UFSB universal free school breakfast
UNICEF United Nations InternationalChildren’s Emergency Fund
USDA United States Departmentof Agriculture
WHO World Health Organization
WIC Special Supplemental NutritionProgramme for Women, Infantsand Children
DOI: 10.3310/phr06130 PUBLIC HEALTH RESEARCH 2018 VOL. 6 NO. 13
© Queen’s Printer and Controller of HMSO 2018. This work was produced by Aceves-Martins et al. under the terms of a commissioning contract issued by the Secretary of Statefor Health and Social Care. This issue may be freely reproduced for the purposes of private research and study and extracts (or indeed, the full report) may be included inprofessional journals provided that suitable acknowledgement is made and the reproduction is not associated with any form of advertising. Applications for commercialreproduction should be addressed to: NIHR Journals Library, National Institute for Health Research, Evaluation, Trials and Studies Coordinating Centre, Alpha House, University ofSouthampton Science Park, Southampton SO16 7NS, UK.
xiii


Plain English summary
Food insecurity (FI) involves difficulties accessing enough safe and nutritious food to meet people’s dietaryneeds and preferences for a healthy life. The consequences of FI can be particularly harmful for children. It
is important to understand how FI may affect children’s health and social well-being, and what can be doneto tackle it successfully. To understand the nature and consequences of the problem in the UK, we conducteda rapid review to identify studies that assess FI in children. As we knew that there were not many studies fromthe UK, we reviewed the literature from other high-income countries (Canada, the USA, and Australia, NewZealand, and other European countries). We found 109 studies that measured FI in children up to 18 yearsold and reported its relationship with children’s health and social well-being. Most of the studies were fromNorth America and only five were from the UK. The results were not consistent across studies. Nevertheless,we identified some factors that may be linked to child FI, such as low family income, being deprived, living inpublic housing or low parental education level. In children, FI may affect general health, social well-being,mental and emotional health, and school performance. Food assistance programmes were generally found tomitigate FI and reduce hunger in the short term, but did not eliminate FI or improve academic performance.We also identified some limitations in the way this topic was addressed by researchers. Studies differed interms of their characteristics and methods, and care should be taken when considering their findings. Inparticular, the measurement of child FI varied across studies. Hence, there is a need to develop a reliablemethod to measure it. Information on the extent of child FI in the UK or on the costs of interventions forreducing or eliminating FI was not available, and this is needed.
DOI: 10.3310/phr06130 PUBLIC HEALTH RESEARCH 2018 VOL. 6 NO. 13
© Queen’s Printer and Controller of HMSO 2018. This work was produced by Aceves-Martins et al. under the terms of a commissioning contract issued by the Secretary of Statefor Health and Social Care. This issue may be freely reproduced for the purposes of private research and study and extracts (or indeed, the full report) may be included inprofessional journals provided that suitable acknowledgement is made and the reproduction is not associated with any form of advertising. Applications for commercialreproduction should be addressed to: NIHR Journals Library, National Institute for Health Research, Evaluation, Trials and Studies Coordinating Centre, Alpha House, University ofSouthampton Science Park, Southampton SO16 7NS, UK.
xv


Scientific summary
Background
Food insecurity (FI) is a multifaceted, social and economic problem involving difficulties accessing sufficientsafe and nutritious food to meet dietary requirements and preferences for a healthy life. For childrenexperiencing FI, there are a number of negative developmental consequences, for example poor health,high consumption of energy-dense foods, behavioural problems and poor school performance. It is,therefore, important to improve understanding of the links between child FI, health and developmentalconsequences, as well as any strategies undertaken to address child FI.
Objective
To determine the nature, extent and consequences of FI affecting children (aged ≤ 18 years) in the UK.
Methods
A rapid review of the current published and unpublished literature was conducted, to current methodologicalstandards. Searches were conducted of major health-care, nutrition, education and social science electronicdatabases from 1995 onwards. Final searches were undertaken in December 2017. The databases searchedon 4 December 2017 were MEDLINE (including In-Process & Other Non-Indexed Citations and E-pub ahead ofprint files), EMBASE, the Cumulative Index to Nursing and Allied Health Literature (CINAHL), the CommonwealthAgricultural Bureaux (CAB) abstracts, The Cochrane Library, the Education Resources Information Centre(ERIC), PsycINFO, the Social Science Citation Index and the Applied Social Sciences Index and Abstracts(ASSIA). Websites of relevant UK and international organisations were also searched. To understand thenature and consequences of child FI in the UK, we drew on the literature from other high-income countriesincluding Ireland, France, Germany, Italy, Sweden, Norway, Denmark, Finland, Iceland, Canada, the USA,Japan, Australia and New Zealand. All study designs from these prespecified high-income countries, reportingrelevant outcomes in children aged ≤ 18 years and published in the English language, were included.
There were five research questions (RQs):
1. What is the nature and what are the determinants of child FI in high-income countries?2. What are the incidence, prevalence and costs of child FI in the UK (including recent trends)?3. What is the impact of FI on children’s health and social well-being in high-income countries?4. What interventions exist to reduce, eliminate or mitigate the effects of child FI in high-income countries?5. What is the cost-effectiveness of existing interventions that aim to reduce, eliminate or mitigate the
effects of child FI in high-income countries?
Results
A total of 109 studies were included in the review, of which five were from the UK, 101 were fromNorth America and one each was from Ireland, Australia and New Zealand. Three of the UK studies werequalitative studies, one was an observational study and one used mixed methods. The majority of studiesutilised the 18-item United States Department of Agriculture Household Food Security Module to assess FI,
DOI: 10.3310/phr06130 PUBLIC HEALTH RESEARCH 2018 VOL. 6 NO. 13
© Queen’s Printer and Controller of HMSO 2018. This work was produced by Aceves-Martins et al. under the terms of a commissioning contract issued by the Secretary of Statefor Health and Social Care. This issue may be freely reproduced for the purposes of private research and study and extracts (or indeed, the full report) may be included inprofessional journals provided that suitable acknowledgement is made and the reproduction is not associated with any form of advertising. Applications for commercialreproduction should be addressed to: NIHR Journals Library, National Institute for Health Research, Evaluation, Trials and Studies Coordinating Centre, Alpha House, University ofSouthampton Science Park, Southampton SO16 7NS, UK.
xvii

and around two-thirds were reported by a parent/caregiver. The main findings of the included studies weretabulated and summarised narratively. A quantitative synthesis proved unfeasible as studies varied in terms ofthe characteristics of the child population, outcome measures, definition and measurement of FI, and setting.
The RQs addressed by this rapid review were answered as follows.
RQ 1: 57 studies were identified in the literature and the majority were conducted in North America.Four studies that provided qualitative data were conducted in the UK. A number of factors related to childFI were identified, for example socioeconomic status (SES), material or social deprivation, minority ethnicgroup status, parents with lower education levels, unemployed parents and greater number of siblings inthe household. Children described cognitive, physical, emotional, social and behavioural responses to FI.Qualitative data provided insights from children themselves: some children were aware of the lack of foodin their household, some described experiences of hunger, some described strategies for coping with FI,some described how they felt in relation to FI (e.g. sadness, embarrassment), and some felt responsiblefor managing household food resources. Takeaways and junk food were described as being common forsome children, and food banks were common for others. In addition, some school staff reported that theywere able to identify children from food-insecure households, or at risk of FI, and other school staffreported awareness of families experiencing increased FI during weekends and school holidays. Schoolbreakfasts were generally perceived by stakeholders as effective in alleviating hunger and improvingchildren’s health and nutrition temporarily.
RQ 2: no studies assessing the prevalence or incidence of child FI in the UK were identified in thepublished literature. A 2017 United Nations International Children’s Emergency Fund (UNICEF) publicationshowed that 19.5% of children aged < 15 years in the UK were living with a respondent who hadmoderate or severe FI and 10.4% were living with a respondent who had severe FI [Pereira AL, Handa S,Holmqvist G. Prevalence and Correlates of food Insecurity Among Children Across the Globe. InnocentiWorking Paper WP-2017-09. Florence: UNICEF Office of Research; 2017. URL: www.unicef-irc.org/publications/900-prevalence-and-correlates-of-food-insecurityamong-children-across-the-globe.html(accessed May 2018)]. Similarly, the UK House of Commons Poverty in the UK Statistics 2018 reportshowed that, in 2015/16, 4.0 million children were estimated to live in relative poverty (relative low income)and 3.7 million were estimated to live in in absolute poverty (absolute low income) [McGuiness F. Povertyin the UK: Statistics. Briefing Paper 7096. London: UK Parliament; 2018. URL: http://researchbriefings.files.parliament.uk/documents/SN07096/SN07096.pdf (accessed May 2018)].
RQ 3: 74 studies assessed the effects of FI on children’s health and social well-being. The majority of thesewere conducted in North America and only one in the UK. FI was reported to have an impact on physicalhealth status (e.g., general health, chronic conditions), social well-being (e.g. housing issues, drug/alcoholuse, fighting), mental and emotional health (e.g. externalising and internalising behaviours, aggression,hyperactivity, impaired social skills) and academic outcomes (e.g. lower reading and maths scores, moredays absent from school). The effects of FI on weight status was less clear.
RQ 4: 15 studies (14 conducted in the USA and one in New Zealand) reported food assistanceprogrammes/interventions to reduce or mitigate FI. The characteristics of the interventions and theirfindings were not consistent across studies. In general, interventions were effective in improving FI andnutritional outcomes, such as hunger, as well as promoting healthier eating patterns in the short term,but not in eradicating FI, eliminating its effects on children’s health or improving academic performance.
RQ 5: no evidence on the cost-effectiveness of interventions designed to tackle FI in the UK or in the otherprespecified high-income countries was identified in the literature.
SCIENTIFIC SUMMARY
NIHR Journals Library www.journalslibrary.nihr.ac.uk
xviii

Scrutiny of the grey literature provided further information on the following general themes.
l Breakfast clubs: many teachers reported children arriving hungry at school in the morning. Around85% of schools in the UK provide breakfast clubs, but most secondary schools think that theirbreakfast club will have to close, mainly because of funding issues. Teachers believe that breakfastclubs make a substantial difference to pupils’ attendance, concentration in class and examinationresults, but results are mixed and there may also be negative outcomes.
l Holiday hunger: up to 3 million children have been reported to be at risk of hunger during theschool holidays, when free school meals received during school term time are not forthcoming{UK 2017 All-Party Parliamentary Group on Hunger Report [Forsey A. Hungry Holidays: A Report onHunger Amongst Children During School Holidays. All-Party Parliamentary Group on Hunger; 2017.URL: https://feedingbritain.files.wordpress.com/2015/02/hungry-holidays.pdf (accessed May 2018)]}.The summer break may have a negative effect on the mathematics and spelling performance oflower-income children, and teachers report being worried about the negative effects of hunger in theholidays on children’s social well-being and physical health. There has been an upsurge in schools andother organisations providing year-round nutrition for children.
l Food banks: the Trussell Trust reports that 484,026 food parcels went to children between April 2017and March 2018 [The Trussell Trust. Half of Children Helped by Foodbanks Over Summer HolidayMonths are Primary School Children [News Item]. The Trussell Trust; 2017. URL: www.trusselltrust.org/2017/07/25/half-children-helped-foodbanks-summer-holiday-months-primary-school-students/ (accessedMay 2018)].
l Obesity and FI in children: findings were mixed, with some sources showing a relationship betweenobesity and child FI, and others not.
Key points
l One hundred and nine studies assessing FI in children in high-income countries were included in thisrapid review.
l The majority (92.6%) of studies were conducted in North America (USA and Canada). Only five wereconducted in the UK.
l The FI measurement was inconsistent across studies. Most studies used indirect measurements of childFI through parental reports.
l Socioeconomic characteristics, cultural characteristics and parental characteristics were frequently linkedwith child FI.
l In some cases, it was difficult to determine whether FI was a risk factor for children or an indicator ofother types of problem (e.g. deprivation).
l The mediating effects of family stressors and parenting practices in the relationship between FI andchildren’s health and well-being outcomes were not clear.
l Qualitative data showed that children exhibited cognitive, physical and emotional awareness of FI aswell as social and behavioural reactions to FI.
l Being from a low-income background or SES, experiencing material or social deprivation, living inpublic, rented or assisted housing, being from a minority ethnic group, having unemployed parents,having parents with lower level of education or having a greater number of siblings in the householdwere some of the factors associated with an increased risk of FI.
l Most of the food assistance programmes attenuated, but did not eliminate, FI or any outcome relatedto it.
l None of the studies identified in the literature provide up-to-date information on the incidence,prevalence or recent trends of child FI in the UK or on the cost-effectiveness and sustainability of foodassistance programmes.
DOI: 10.3310/phr06130 PUBLIC HEALTH RESEARCH 2018 VOL. 6 NO. 13
© Queen’s Printer and Controller of HMSO 2018. This work was produced by Aceves-Martins et al. under the terms of a commissioning contract issued by the Secretary of Statefor Health and Social Care. This issue may be freely reproduced for the purposes of private research and study and extracts (or indeed, the full report) may be included inprofessional journals provided that suitable acknowledgement is made and the reproduction is not associated with any form of advertising. Applications for commercialreproduction should be addressed to: NIHR Journals Library, National Institute for Health Research, Evaluation, Trials and Studies Coordinating Centre, Alpha House, University ofSouthampton Science Park, Southampton SO16 7NS, UK.
xix

Discussion and conclusion
The lack of consistency in the way child FI was measured and variation in the outcomes assessedcontributed to a diverse picture of child FI in high-income countries. A number of factors related to child FIwere identified, as were negative associations between child FI and physical, mental and social outcomes.However, these findings should be interpreted with caution because of the correlational nature of theanalyses and the fact that it is difficult to determine if some factors are predictors or consequences of FI.Owing to time and resource restraints characteristic of a rapid review, quality assessment of includedstudies was not performed and 30 potentially relevant studies identified during a rescreening of the searchresults were not included in this review. Future research should focus on developing a reliable and validmethod of assessing child FI directly from children themselves (for children aged ≥ 7 years) to allowmonitoring and reporting of its prevalence, incidence and severity. Future research in the UK should alsofocus on the evaluation of well-designed interventions/programmes to reduce, mitigate or eliminate childFI, including their costs. In particular, there is a clear need to identify the mechanisms through which theseinterventions/programmes may work, produce benefits, and be sustainable.
Study registration
This study is registered as PROSPERO CRD42017084818.
Funding
Funding for this study was provided by the Public Health Research programme of the National Institute forHealth Research. The Health Services Research Unit is core-funded by the Chief Scientist Office of theScottish Government Health and Social Care Directorates.
SCIENTIFIC SUMMARY
NIHR Journals Library www.journalslibrary.nihr.ac.uk
xx
Chapter 1 Background
Food insecurity (FI) is a social and economic problem that involves difficulties in accessing sufficient,safe and nutritious food that is necessary to meet individuals’ dietary requirements and preferences for
a healthy life.1 FI is a multifaceted phenomenon, with each stage typified by conditions and experiencesof food insufficiency and behavioural responses.2 FI may be experienced when there is uncertainty aboutfuture food availability and access, insufficiency in the amount and kind of food required for an optimaland healthy nutrition status or the need to use socially unacceptable ways to acquire food.3
Food insecurity can be defined as the inadequate or unreliable availability of safe, nutritionally adequatefood, or inadequate or uncertain capability of acquiring adequate foods in socially conventional andsafe ways.4 However, the UK governmental authorities have cautioned against attempting to capture allaspects of FI in one definition: ‘The factors that impact on household food security are complex. There aremultiple indicators, such as quality, variety and desirability of diet as well as total intake, not all of whichare measured consistently. It is therefore, very difficult and potentially misleading to attempt to developa single classification of food insecurity’ (contains Parliamentary information licensed under the OpenParliament Licence v3.0).5
Food has a vital role in the functioning and welfare of the family unit, which places further stress onfood-insecure children. FI in children is contingent not only on food but also on related areas of children’sdaily lives, such as school, their personal welfare and their responsibilities to other family members.Children’s experiences of FI are evident in three areas of their self: cognitive (the child is aware that foodis scarce and that coping strategies are used by the family), emotional (the child experiences feelingsassociated with FI, such as worry, sadness or anger) and physical (the child experiences feelings suchas hunger, pain, tiredness or weakness). In addition, children may take responsibility for their FI byparticipating in pertinent adults’ strategies to manage their limited resources, initiating their ownstrategies or generating their own resources to obtain food or money for food.6,7
There are a number of potential negative developmental consequences for children experiencing FI, forexample poor health, poor dietary intake, high consumption of energy-dense foods, inadequate intake ofmicronutrients, behavioural problems, poor school performance, absenteeism from school, lower levels ofphysical activity, delayed language development and atypical social interactions.7–11
A report published in 2017 by the Food and Agriculture Organization of the United Nations and otherinternational organisations such as United Nations International Children’s Emergency Fund (UNICEF) andthe World Health Organization (WHO)12 shows that, after a prolonged decline, world FI appears to be onthe rise again. The estimated worldwide number of undernourished people increased from 777 million in2015 to 815 million in 2016. The report further states that it is unclear whether the recent increase in hungerand FI indicates the beginning of an upwards trend or reflects a more transient situation. Nevertheless,the recent increase has caused a growing concern among national and international organisations andgovernmental authorities around the globe. Food security (FS) is one of the determinants of nutritionaloutcomes, especially for children.12
It is therefore important to improve current understanding of the extent and consequences of FI inchildren, as well as to consider any strategy or programme undertaken to address it. It is worth pointingout that the Food Foundation (a non-governmental organisation – http://foodfoundation.org.uk/) iscurrently conducting an independent inquiry into FI affecting children in the UK, in association with theOffice of the Children’s Commissioner, England, Wales, Northern Ireland and Scotland. This rapid reviewwas undertaken as part of this national inquiry.
DOI: 10.3310/phr06130 PUBLIC HEALTH RESEARCH 2018 VOL. 6 NO. 13
© Queen’s Printer and Controller of HMSO 2018. This work was produced by Aceves-Martins et al. under the terms of a commissioning contract issued by the Secretary of Statefor Health and Social Care. This issue may be freely reproduced for the purposes of private research and study and extracts (or indeed, the full report) may be included inprofessional journals provided that suitable acknowledgement is made and the reproduction is not associated with any form of advertising. Applications for commercialreproduction should be addressed to: NIHR Journals Library, National Institute for Health Research, Evaluation, Trials and Studies Coordinating Centre, Alpha House, University ofSouthampton Science Park, Southampton SO16 7NS, UK.
1

General objective
To determine the nature, extent and consequences of FI affecting children (aged ≤ 18 years) in the UK.
Specific objectivesThis rapid review will focus on five research questions (RQs):
1. What is the nature and what are the determinants of child FI in high-income countries?2. What are the incidence, prevalence and costs of child FI in the UK (including recent trends)?3. What is the impact of FI on children’s health and social well-being in high-income countries?4. What interventions exist to reduce, eliminate or mitigate the effects of child FI in high-income countries?5. What is the cost-effectiveness of existing interventions that aim to reduce, eliminate or mitigate the
effects of child FI in high-income countries?
BACKGROUND
NIHR Journals Library www.journalslibrary.nihr.ac.uk
2

Chapter 2 Methods
Inclusion criteria
Type of studiesAll study designs were considered in this review. Quantitative or qualitative assessments of FI either fromyoung people themselves (if available) or from any parent, relative, caregiver or professionals who engagewith them were included.
Type of participantsChildren from birth to 18 years old (at the start of the study or evaluation) of any ethnicity or sex living inspecified high-income countries were included. If samples included people aged > 18 years but the meanage was ≤ 18 years, the study was included.
According to a UNICEF report published in 2015,9 children as young as 7 years can respond accuratelyto questionnaire items sensitive to FI. However, as not all studies in the literature were likely to provideexperiences of FI from children, for children aged > 7 years we included both direct (from children) andindirect (from parent/caregiver) experiences or assessments of FI. Furthermore, with the intention ofevaluating child FI in depth, we included studies that focused solely on child FI, as well as studies thatmeasured or addressed child FI alongside household FI, as long as they provided outcomes measured inchildren (using tools that included any question about or measure of FI in children living in the household).
Type of settingTo gain a broad understanding of the nature and consequences of child FI, as well as of the interventionsdesigned to address it, the literature from countries with developed economies, according to theOrganisation for Economic Co-operation and Development categorisation,13 were included. However, inrecent years, an economic recession has been experienced by several countries in Europe, resulting indiverse responses in the affected countries, for example public budget cuts and health and welfare sectorausterity measures.14,15 There is growing evidence to suggest that the different governmental responses tothis economic crisis and its consequences (e.g. unemployment, inflation of food prices, reduction in salariesand growing costs of fuel and housing) may have an impact on a broad set of social, economic and healthdomains and contribute to the increased prevalence of FI.14,15 Nevertheless, not all European countriesfacing such hardship have experienced these problems, and statistics of FI differ among countries.16 For thepurpose of this rapid review, we focused only on those European countries (the UK, France, Germany andItaly) that are part of the G7 (major developed economies worldwide). We also included Ireland because ofits regional proximity and similarity to the UK in terms of social and political context, as well as the Nordiccountries, which are among the most affluent countries worldwide and where FI has been successfullytackled by well-established social security schemes.17 Thus, studies or reports from the followingindustrialised countries were deemed suitable for inclusion: the UK, Ireland, France, Germany, Italy,Sweden, Norway, Denmark, Finland, Iceland, Canada, the USA, Japan, Australia and New Zealand.
Exclusion criteria
Reports were excluded if they were published before 1995, focused solely on household FI, measuringoutcomes on adults (with the exception of longitudinal studies where children were followed intoadulthood, with suitable measurements of FI), or related to the agricultural or farming aspects of FI.Studies that considered the target population as food insecure for participating in a programme,without a measurement of FI in participants, were also excluded.
DOI: 10.3310/phr06130 PUBLIC HEALTH RESEARCH 2018 VOL. 6 NO. 13
© Queen’s Printer and Controller of HMSO 2018. This work was produced by Aceves-Martins et al. under the terms of a commissioning contract issued by the Secretary of Statefor Health and Social Care. This issue may be freely reproduced for the purposes of private research and study and extracts (or indeed, the full report) may be included inprofessional journals provided that suitable acknowledgement is made and the reproduction is not associated with any form of advertising. Applications for commercialreproduction should be addressed to: NIHR Journals Library, National Institute for Health Research, Evaluation, Trials and Studies Coordinating Centre, Alpha House, University ofSouthampton Science Park, Southampton SO16 7NS, UK.
3

Search strategy
Reports from 1995 onwards were included in this rapid review to focus on information conducted undercontemporary epidemiological and environmental circumstances of children’s FI, focusing on high-incomecountries (listed above). All searches were restricted to English-language publications.
Published literature was sought from health-care, nutrition, education and social science databases.The literature searches were designed to address RQs 3–5, but any information identified in the search resultsthat was relevant to RQs 1 and 2 above was also retrieved. The databases searched on 4 December 2017were MEDLINE (including In-Process & Other Non-Indexed Citations and E-pub ahead of print files), EMBASE,the Cumulative Index to Nursing and Allied Health Literature (CINAHL), the Commonwealth AgriculturalBureaux (CAB) abstracts, The Cochrane Library, the Education Resources Information Centre (ERIC), PsycINFO,the Social Science Citation Index and the Applied Social Sciences Index and Abstracts (ASSIA). No study designrestriction was applied. Appendix 1 provides full details of search strategies.
Other methods of identifying relevant information sources
Reference lists of identified studies were scrutinised for additional publications, and experts in the fieldwere contacted for additional relevant reports. References of included studies were screened. Anyreferences not identified in our search and meeting the inclusion criteria were retrieved and data wereextracted. Furthermore, the websites of UK government, public and private institutions, charities andinternational organisations concerned with child health and poverty were consulted for relevant documentsand information (the complete list of relevant websites searched is presented in Appendix 1, Sources ofgrey literature: websites consulted). From the results of scoping searches, it was anticipated that thesesources would provide the majority of the evidence for the overviews to address RQs 1 and 2.
Data screening, selection and synthesis
The review process for the selection and synthesis of the current relevant evidence was based on thefollowing stages.
l Title/abstract screening (by one reviewer, with 10% checked by a second reviewer).l Full-text screening (by one reviewer, with 10% checked by a second reviewer).l Categorisation of texts screened according to the RQ of interest.l Data extraction (by one reviewer and double checked by a second reviewer).
¢ Information recorded included authors, title of the publication, journal or source, publication year,study design, aim of the study, study period, geographical location, inclusion criteria, exclusioncriteria, number of participants, age of participants (children or adolescents), tool or survey usedto measure child FI, person who provided information on child FI (children themselves, parents,other), main findings (e.g. factors related to FI, young people’s experience of FI, prevalence of FI,nutritional and non-nutritional consequences of FI, results of interventions to reduce or mitigate FI),source of funding, and whether the analysed sample was part of any project/study or evaluationprogramme.
METHODS
NIHR Journals Library www.journalslibrary.nihr.ac.uk
4

Data synthesis
For all RQs, the information extracted was tabulated and described narratively. If results were available forchildren, adults or households, only those reported for children or households with children were considered.Alongside the description of the results, we recorded how FI was measured in children. Measurement of FIwas categorised as direct (when information on FI was directly retrieved from children) or indirect (wheninformation of FI was retrieved from a parent/caregiver or another person). Furthermore, the health impactwas categorised as direct (health and nutritional outcomes measured in children) or indirect (measures offood access including stability in food access, household income or household food production).
DOI: 10.3310/phr06130 PUBLIC HEALTH RESEARCH 2018 VOL. 6 NO. 13
© Queen’s Printer and Controller of HMSO 2018. This work was produced by Aceves-Martins et al. under the terms of a commissioning contract issued by the Secretary of Statefor Health and Social Care. This issue may be freely reproduced for the purposes of private research and study and extracts (or indeed, the full report) may be included inprofessional journals provided that suitable acknowledgement is made and the reproduction is not associated with any form of advertising. Applications for commercialreproduction should be addressed to: NIHR Journals Library, National Institute for Health Research, Evaluation, Trials and Studies Coordinating Centre, Alpha House, University ofSouthampton Science Park, Southampton SO16 7NS, UK.
5


Chapter 3 Results
Overall characteristics and results of the included studies
From 4660 initially retrieved references published in the current literature, 757 potentially relevant abstractswere assessed for eligibility. As this was a large number of references for full-text screening in the contextof a rapid review, it was decided to select only those abstracts that explicitly mentioned child FI.
Therefore, 221 articles were selected for full-text screening, of which 79 were included for screening.The main reasons for exclusion were the lack of relevant outcomes, household FI measurements (withoutchild-specific measurements), lack of assessment of FI and ineligible participants or countries. During dataextraction of the 79 included articles, the references were screened and a further 30 studies were identified aspotentially relevant, assessed for eligibility and incorporated. This totalled 109 published references includedin this rapid review. It was noticed that a number of the 30 articles included at the reference screening stagehad appeared on the original list of 4660 abstracts. For completeness, this list was rescreened and a further30 potentially relevant articles were identified. However, because of the time and resource constraints that aretypical of rapid reviews, we were not able to include these studies. It is worth pointing out that the 30 studiesdid not mention child FI in their abstracts and had not appeared on the reference lists of any studies includedin this rapid review; therefore, it was considered unlikely that any important information would be missed.Figure 1 presents the Preferred Reporting Items for Systematic Reviews and Meta-Analyses (PRISMA) flowchart of study selection.
Abstracts/titles identifiedthrough database searches
(n = 4660)
Potentially relevant full-textarticles assessed for eligibility
(n = 757)
Full-text articles selectedas priority for screening
(n = 221)
Full-text articles included fromthe priority for screening
(n = 79)
Unclear whether or not relevant outcomes were
reported/no abstract(n = 536)
Full-text articles excluded(n = 142)
References retrieved fromthe full-text screening
(n = 30)
Full-text articles included(n = 109)
• No relevant outcomes, n = 52• Household FI only, n = 35• FI not assessed/unclear, n = 36• Ineligible participants, n = 9• Ineligible country, n = 8• Duplications, n = 2
FIGURE 1 The PRISMA flow chart.
DOI: 10.3310/phr06130 PUBLIC HEALTH RESEARCH 2018 VOL. 6 NO. 13
© Queen’s Printer and Controller of HMSO 2018. This work was produced by Aceves-Martins et al. under the terms of a commissioning contract issued by the Secretary of Statefor Health and Social Care. This issue may be freely reproduced for the purposes of private research and study and extracts (or indeed, the full report) may be included inprofessional journals provided that suitable acknowledgement is made and the reproduction is not associated with any form of advertising. Applications for commercialreproduction should be addressed to: NIHR Journals Library, National Institute for Health Research, Evaluation, Trials and Studies Coordinating Centre, Alpha House, University ofSouthampton Science Park, Southampton SO16 7NS, UK.
7

The grey literature that had been identified by the initial scoping searches was scrutinised systematically byone reviewer but the process was not documented owing to its more ad hoc nature.
Overall, of the 109 included studies, 57 addressed RQ 1 (nature and determinants of child FI),6,18–73
73 addressed RQ 3 (impact of FI on children’s health and social well-being),9,12,19–21,24,26–29,36,39,41,42,44,45,47,51–54,56–58,60,61,63,66,67,69,72–114 15 addressed RQ 4 (interventions to tackle child FI),26,50,71,74,78,83,98,115–122 and noneaddressed RQ 2 (incidence, prevalence and costs of child FI in the UK) or RQ 5 (cost-effectiveness ofinterventions). Thirty-six studies addressed more than one RQ.19–21,24,26–29,36,39,41,42,44,45,47,50–54,56–58,60,61,63,66,67,69,71–74,78,83,98 Figure 2 shows the studies identified for each RQ.
Most of the studies identified were from North America (91 from the USA and 10 from Canada),21,23,27,42,43,45,46,68,75,76 five were from the UK,19,30–32,59 one was from Ireland,106 one was from Australia54 and one wasfrom New Zealand.122
Of the 109 studies included in the review, 100 were quantitative studies,9,12,18–24,26–29,33,35–54,56–58,60,61,63–82,84–123
six were qualitative studies6,25,30–32,55 and three were mixed-methods studies.59,62,64 Of the 100 quantitativestudies, 73 were cohort or cross-sectional observational studies,9,21,22,24,26–29,33,36–38,41,43–54,57,58,60,61,63–71,73–79,81,82,84–88,97–116 20 were longitudinal cohort studies,12,18–20,23,35,39,40,42,56,72,80,89–96 two were randomised controlledtrials (RCTs)122,123 and five were non-randomised comparative studies.117–121
The age of the target population varied across studies. Twenty-four studies included children aged < 5 years,22 studies included adolescents (aged > 10 years), 62 studies included both children and adolescents ofvarious ages, one study interviewed parents 48 hours after giving birth and again at 12, 36 and 60 months
109 included studies(73 studies provided information for one RQ, 35 studies for two RQs and 1 study for three RQs)
RQ 2: 0 studies RQ 5: 0 studiesRQ 1: 57 studies48 quantitative
studies data3 mixed-methods
studies data (1 UK study)
6 qualitative studiesdata (3 UK studies)
Of the studies thatprovided quantitative
data, 24 adjusted their analyses and
27 did not
RQ 3: 74 studies(Note: some studies
reported more than onehealth outcome)
a. General health outcomes: 23 (21 adjusted and 2 unadjusted)b. Weight status: 38 (28 adjusted and 10 unadjusted)c. Mental health: 17 (14 adjusted and 3 unadjusted) (1 UK study)d. Social well-being: 15 (14 adjusted and 1 unadjusted)e. Academic: 13 (11 adjusted and 2 unadjusted)
RQ 4: 15 studies9 observational
5 non-randomisedcomparative
1 randomisedcontrolled trial
FIGURE 2 Overview of included studies.
RESULTS
NIHR Journals Library www.journalslibrary.nihr.ac.uk
8

after giving birth,37 and one study included stakeholders engaging with school-aged children.31 Thecharacteristics of participants are further detailed in Appendix 2.
Child food insecurity measurements
Studies that focused solely on child FI and those that included measures of child FI alongside household FIwere considered suitable for inclusion, as long as they reported outcomes measured in children. From eachincluded study, childhood FI measurements were identified and tabulated (see Appendix 3).
Overall, the most commonly used tool to measure FI in children (or their households) was the 18-itemUnited States Department of Agriculture Household FS Module (referred to hereafter as the 18-itemUSDA module). Overall, 51 studies used the 18-item USDA module as the main tool for measuringFI,9,12,18,20,21,24,26,28–30,34,35,39–41,43,44,49,51,53,56–58,66,67,71,72,80–83,85,86,88–96,100,103,104,110,113,115,116,120,123 eight used a modifiedversion of it,27,45,46,64,75,97,109,121 six used only the eight child-specific items of the tool,37,38,48,50,63,74 and six usedindividual items of it (rather than those identified as child-specific items).47,65,78,102,105,108 The 18-item USDAmodule was developed in 1995 as a result of a co-operative effort among US federal government agenciesand private sector experts, through the Food and Nutrition Service and Economic Research Service of theUS Department of Agriculture (USDA) and the Centers for Disease Control and Prevention (CDC), NationalCenter for Health Statistics (NCHS) of the US Department of Health and Human Services.2 The original toolhas been slightly modified over the years and uses a continuous, linear scale, which measures the degreeof severity of FI/hunger experienced by a household in terms of a single numerical value. The tool comprises10 items that evaluate FI in adults in the household, and eight items that evaluate FI in children of thehousehold.124 The unit of measure used for the scale is a matter of convention; the USDA guide suggestsa classification of households with one or more children based on the following four main categories.
1. Raw score 0: high FS or food secure – household members have no, or minimal, presence of FI.2. Raw score 1–2: marginal FS or food insecure without hunger – household members report FI, with
concerns on the adequacy of the household food supply and in modifications to household foodmanagement.
3. Raw score 3–7: low FS or food insecure with hunger (moderate) – adult household members report areduction in food intake to an extent that indicates that adults have repeatedly experienced a physicalsensation of hunger. In food-insecure households with children, such reductions are not yet observedin children.
4. Raw score 8–18: very low FS or food insecure with hunger (severe) – adult household members havereduced the children’s food intake, indicating that the children have experienced hunger.
Apart from the 18-item USDA module, the USDA has provided additional tools that have been used in theliterature, for example the 6-item USDA module,22 7-item USDA module19 and 16-item USDA module.54
The USDA also adopted a tool developed by researchers at the University of Southern Mississippi125 as ‘TheChild Food Security Survey Module’, which assesses FI in children aged ≥ 12 years by means of a 9-item module.This module (or some of its items) was used by nine studies included in this rapid review.50,52,60,62,68,77,98,107,112
With regard to other tools used to measure FI, four studies used the Radimer/Cornell Measures of Hungerand FI: two out of the four studies used the 12-item version36,61 and two studies used the 10-itemversion.33,59 One further study used three questions adapted from the Radimer/Cornell tool.23 Four studiesused the Community Childhood Hunger Identification Project (CCHIP) survey.69,73,99,117
To assess FI, some studies used questionnaires or graphic tools generated or adapted by the investigators,or semistructured interviews. For example, some studies, which reported results from the Health Behaviourin School-Aged Children (HBSC) study, asked participants (adolescents) the following question: ‘Someyoung people go to school or to bed hungry because there is not enough food at home. How often doesthis happen to you?’76,84,106 Another study asked participants the following single question: ‘Has [the child]
DOI: 10.3310/phr06130 PUBLIC HEALTH RESEARCH 2018 VOL. 6 NO. 13
© Queen’s Printer and Controller of HMSO 2018. This work was produced by Aceves-Martins et al. under the terms of a commissioning contract issued by the Secretary of Statefor Health and Social Care. This issue may be freely reproduced for the purposes of private research and study and extracts (or indeed, the full report) may be included inprofessional journals provided that suitable acknowledgement is made and the reproduction is not associated with any form of advertising. Applications for commercialreproduction should be addressed to: NIHR Journals Library, National Institute for Health Research, Evaluation, Trials and Studies Coordinating Centre, Alpha House, University ofSouthampton Science Park, Southampton SO16 7NS, UK.
9
ever expressed being hungry because the family has run out of food or money to buy food?’42 One studyassessed FI and hunger through a graphic survey (cartoons) for children118 and another assessed this byusing an analogue scale that consisted of a cardboard cut-out doll with an adjustable stomach, whichallowed children to dynamically assess hunger and satiety.122 Seven studies measured FI through interviews(in-depth face to face or semistructured) with children or with parents and stakeholders involved withfood-insecure children.6,25,30–32,55,97
Twenty-one studies measured FI directly from children or adolescents,6,25,52,55,60,62,64,68,70,76,77,79,84,98,106,107,111,112,114,118,122 eight included measurements from both the parent/caregiver and the child/adolescent,22,30,32,47,50,69,73,101 one included measurements from parent(s)/caregiver(s), the child/adolescent and school staff,117
72 included only the parents’/caregivers’ evaluation of child FI or household FI,12,18–21,23,24,26–29,33–41,43–46,48,49,51,53,54,56–59,61,63,65–67,71,72,74,75,78,82,83,85,86,88–96,99,100,102–105,108–110,113,116,119–121,123,126 five reported that measurement of FIwas provided by a primary caregiver (adult or older sibling living in the household, not specifically theparents)9,42,80,81,97 and in one study FI was reported by a caseworker in child protection services.87
Research question 1: what is the nature and what are the determinantsof child food insecurity in high-income countries?
Fifty-seven studies investigated the relationship between child FI and various individual, familial,socioeconomic, demographic or cultural factors.6,18–73 Of these 57 studies, six were qualitativestudies6,25,30–32,55 and three were mixed-methods studies.59,62,64 With regard to the qualitative and mixed-methods studies, one reported the experiences of stakeholders31 whereas the remaining studies reportedthe experiences of children, adolescents or parents. Owing to the multifactorial nature of FI, there aredifferent variables that could relate (positively or negatively) with FI. From the included studies, 24considered factors related to child FI and adjusted their analyses for potentially explanatory or confoundingvariables.18,20–24,26,27,35,37,38,40,42,48–51,53,54,61,65,70–72 The characteristics most frequently assessed were children’sdemographic characteristics (e.g. age, sex or ethnicity), parental factors [e.g. socioeconomic status (SES),employment, immigration status, marital status] and household characteristics (e.g. neighbourhood SES,number of people living in the household, adults in the household). Eight studies reported both adjustedand unadjusted analyses.26,37,40,48,50,51,53,71 The findings of the main studies that assessed factors related tochild FI and adjusted their analyses for potential explanatory or confounding variables are presented inAppendix 4, and the main findings of the studies that assessed factors relating to child FI but did notadjust their analyses for potential explanatory or confounding variables are presented in Appendix 5.
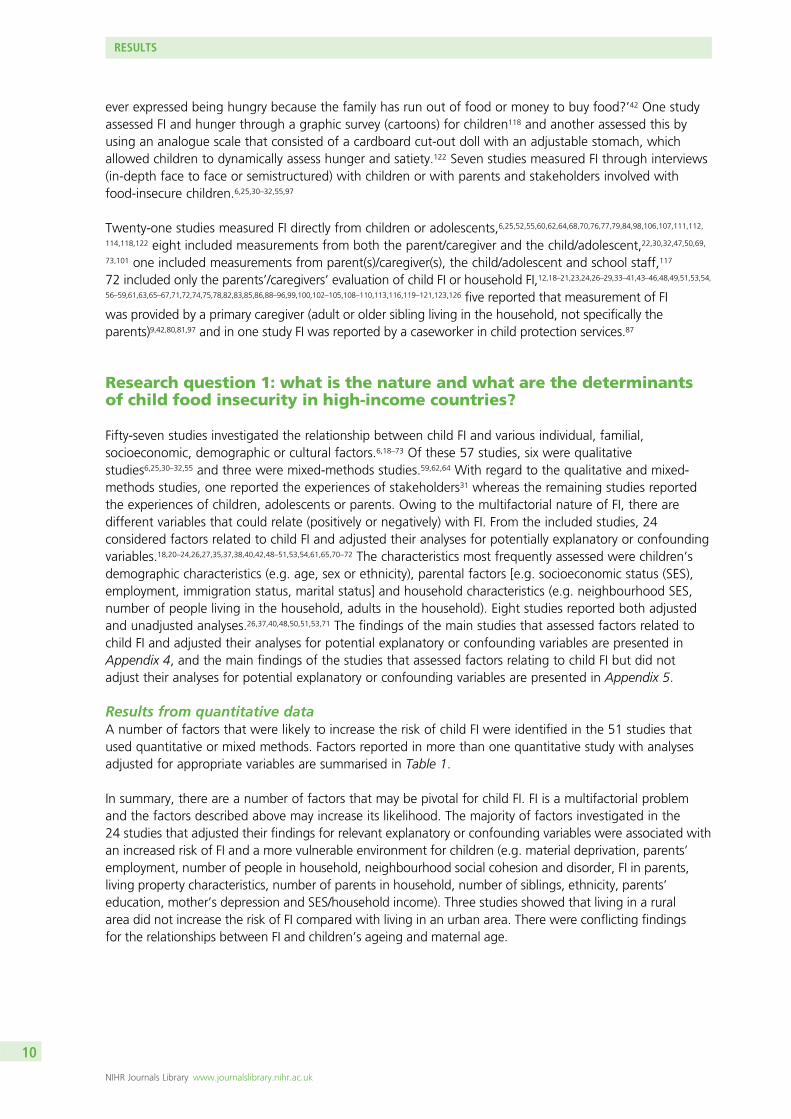
Results from quantitative dataA number of factors that were likely to increase the risk of child FI were identified in the 51 studies thatused quantitative or mixed methods. Factors reported in more than one quantitative study with analysesadjusted for appropriate variables are summarised in Table 1.
In summary, there are a number of factors that may be pivotal for child FI. FI is a multifactorial problemand the factors described above may increase its likelihood. The majority of factors investigated in the24 studies that adjusted their findings for relevant explanatory or confounding variables were associated withan increased risk of FI and a more vulnerable environment for children (e.g. material deprivation, parents’employment, number of people in household, neighbourhood social cohesion and disorder, FI in parents,living property characteristics, number of parents in household, number of siblings, ethnicity, parents’education, mother’s depression and SES/household income). Three studies showed that living in a ruralarea did not increase the risk of FI compared with living in an urban area. There were conflicting findingsfor the relationships between FI and children’s ageing and maternal age.
RESULTS
NIHR Journals Library www.journalslibrary.nihr.ac.uk
10
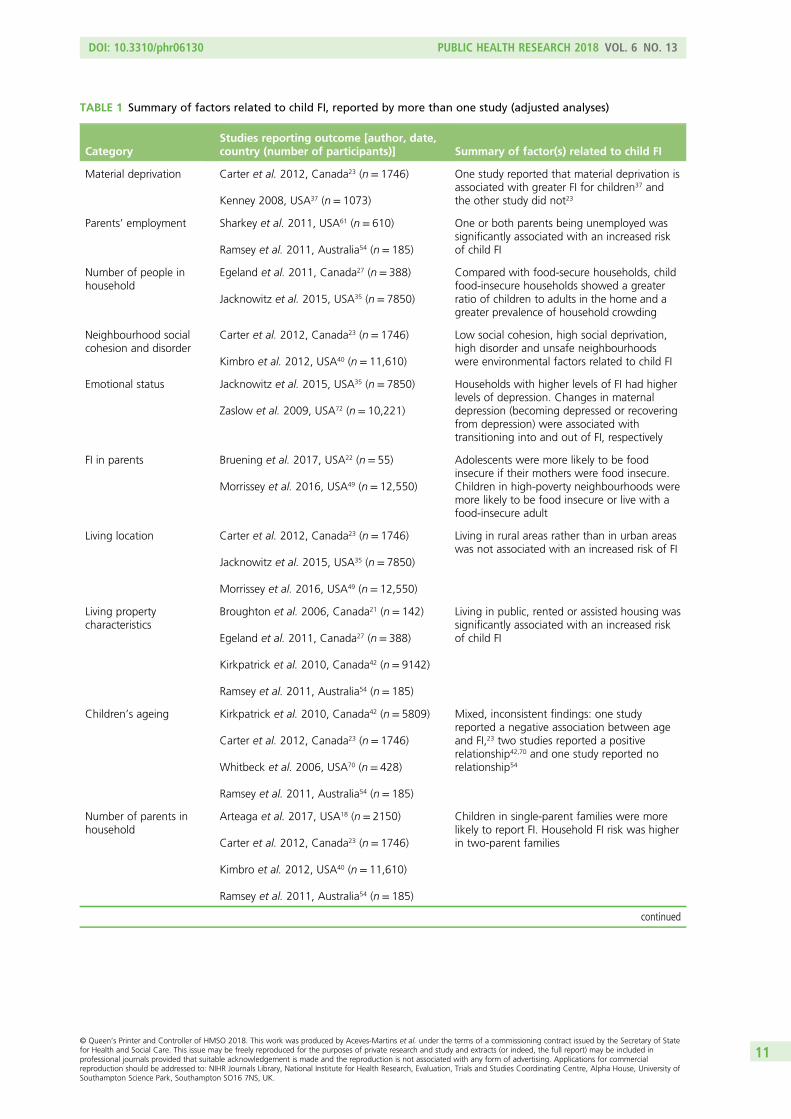
TABLE 1 Summary of factors related to child FI, reported by more than one study (adjusted analyses)
CategoryStudies reporting outcome [author, date,country (number of participants)] Summary of factor(s) related to child FI
Material deprivation Carter et al. 2012, Canada23 (n = 1746)
Kenney 2008, USA37 (n= 1073)
One study reported that material deprivation isassociated with greater FI for children37 andthe other study did not23
Parents’ employment Sharkey et al. 2011, USA61 (n = 610)
Ramsey et al. 2011, Australia54 (n= 185)
One or both parents being unemployed wassignificantly associated with an increased riskof child FI
Number of people inhousehold
Egeland et al. 2011, Canada27 (n= 388)
Jacknowitz et al. 2015, USA35 (n = 7850)
Compared with food-secure households, childfood-insecure households showed a greaterratio of children to adults in the home and agreater prevalence of household crowding
Neighbourhood socialcohesion and disorder
Carter et al. 2012, Canada23 (n = 1746)
Kimbro et al. 2012, USA40 (n = 11,610)
Low social cohesion, high social deprivation,high disorder and unsafe neighbourhoodswere environmental factors related to child FI
Emotional status Jacknowitz et al. 2015, USA35 (n = 7850)
Zaslow et al. 2009, USA72 (n = 10,221)
Households with higher levels of FI had higherlevels of depression. Changes in maternaldepression (becoming depressed or recoveringfrom depression) were associated withtransitioning into and out of FI, respectively
FI in parents Bruening et al. 2017, USA22 (n= 55)
Morrissey et al. 2016, USA49 (n= 12,550)
Adolescents were more likely to be foodinsecure if their mothers were food insecure.Children in high-poverty neighbourhoods weremore likely to be food insecure or live with afood-insecure adult
Living location Carter et al. 2012, Canada23 (n = 1746)
Jacknowitz et al. 2015, USA35 (n = 7850)
Morrissey et al. 2016, USA49 (n= 12,550)
Living in rural areas rather than in urban areaswas not associated with an increased risk of FI
Living propertycharacteristics
Broughton et al. 2006, Canada21 (n = 142)
Egeland et al. 2011, Canada27 (n= 388)
Kirkpatrick et al. 2010, Canada42 (n= 9142)
Ramsey et al. 2011, Australia54 (n= 185)
Living in public, rented or assisted housing wassignificantly associated with an increased riskof child FI
Children’s ageing Kirkpatrick et al. 2010, Canada42 (n= 5809)
Carter et al. 2012, Canada23 (n = 1746)
Whitbeck et al. 2006, USA70 (n = 428)
Ramsey et al. 2011, Australia54 (n= 185)
Mixed, inconsistent findings: one studyreported a negative association between ageand FI,23 two studies reported a positiverelationship42,70 and one study reported norelationship54
Number of parents inhousehold
Arteaga et al. 2017, USA18 (n= 2150)
Carter et al. 2012, Canada23 (n = 1746)
Kimbro et al. 2012, USA40 (n = 11,610)
Ramsey et al. 2011, Australia54 (n= 185)
Children in single-parent families were morelikely to report FI. Household FI risk was higherin two-parent families
continued
DOI: 10.3310/phr06130 PUBLIC HEALTH RESEARCH 2018 VOL. 6 NO. 13
© Queen’s Printer and Controller of HMSO 2018. This work was produced by Aceves-Martins et al. under the terms of a commissioning contract issued by the Secretary of Statefor Health and Social Care. This issue may be freely reproduced for the purposes of private research and study and extracts (or indeed, the full report) may be included inprofessional journals provided that suitable acknowledgement is made and the reproduction is not associated with any form of advertising. Applications for commercialreproduction should be addressed to: NIHR Journals Library, National Institute for Health Research, Evaluation, Trials and Studies Coordinating Centre, Alpha House, University ofSouthampton Science Park, Southampton SO16 7NS, UK.
11

TABLE 1 Summary of factors related to child FI, reported by more than one study (adjusted analyses) (continued )
CategoryStudies reporting outcome [author, date,country (number of participants)] Summary of factor(s) related to child FI
Maternal age Arteaga et al. 2017, USA18 (n= 2150)
Carter et al. 2012, Canada23 (n = 1746)
Kersey et al. 2007, USA38 (n= 4278)
Kimbro et al. 2012, USA40 (n = 11,610)
Mixed, inconsistent findings: two studiesreported a positive association betweenmaternal age and FI,18,40 one study reported anegative association between maternal age of< 21 years and FI38 and one study reported noassociation23
Ethnicity Bhargava et al. 2008, USA20 (n= 7635)
Jacknowitz et al. 2015, USA35 (n= 7850)
Kimbro et al. 2012, USA40 (n = 11,610)
Morrissey et al. 2016, USA49 (n= 12,550)
Nalty et al. 2013, USA50 (n = 48)
Hispanic children reported significantly higherFI levels than children of other ethnicities.Children from African American neighbourhoodswere more likely to experience FI than thosefrom white neighbourhoods
Number of siblings Kirkpatrick et al. 2010, Canada42 (n= 9142)
Egeland et al. 2011, Canada27
Bhargava et al. 2008, USA20 (n= 7635)
Kimbro et al. 2012, USA40 (n = 11,610)
Sharkey et al. 2011, USA61 (n = 610)
Ramsey et al. 2011, Australia54 (n= 185)
Overall, there was a significant associationbetween child FI and the number of siblings/children in the household. One study reportedno association54
Parents’ education Bhargava et al. 2008, USA20 (n= 7635)
Kersey et al. 2007, USA38 (n= 4278)
Kimbro et al. 2012, USA40 (n = 11,610)
Morrissey et al. 2016, USA49 (n= 12,550)
Yu et al. 2010, USA71 (n= 3799)
Ramsey et al. 2011, Australia54 (n= 185)
Higher levels of education reported by parents(or mothers) were associated with lower levelsof child FI. One study reported no association54
Parental nativity Arteaga et al. 2017, USA18 (n= 2150)
Carter et al. 2012, Canada23 (n = 1746)
Chilton et al. 2009, USA24 (n= 7216)
Kersey et al. 2007, USA38 (n= 4278)
Miller 2016, USA48 (n= 36,302)
Sharkey et al. 2011, USA61 (n = 610)
Ramsey et al. 2011, Australia54 (n= 185)
In general, children in immigrant families inthe USA were more likely to experience FI thanthose in non-immigrant families. Conversely,an Australian study showed that children witha parent born outside Australia were less likelyto be food insecure than those with Australian-born parents
RESULTS
NIHR Journals Library www.journalslibrary.nihr.ac.uk
12

Most of the reviewed studies were observational and not designed to rigorously assess relevant factorsassociated with FI. Some studies were small and may have been underpowered. Tools to measure FI variedacross studies. Twenty-six studies provided only a crude association between FI and potential factors relatedto FI without adjusting analyses for explanatory or confounding variables. Jacknowitz et al.35 pointed outthat ascertaining whether some potential triggers of FI are actually predictors or are actually consequencesof FI can be quite challenging. Furthermore, some factors may be much more critical than others, especiallyin children. For instance, Carter et al.23 observed that the effect sizes for household-level factors (e.g. SES orsingle-parent family status) were higher than those for other related factors. Despite these limitations, therewere consistent patterns across most of the studies reviewed.
Findings from qualitative studiesSix out of the 57 studies that addressed RQ 1 used qualitative methods6,25,30–32,55 and three used mixedmethods.59,62,64 Four studies6,25,30,55 evaluated children’s and adolescents’ experiences of FI, one studyevaluated the experiences of stakeholders engaging with food-insecure children31 and two studiesevaluated both children’s and stakeholders’ experiences.32,62 One study64 that was linked to one of thequalitative studies included55 evaluated the perception of FI in a sample of homeless youth living in twoshelters. One study conducted in the UK interviewed parents of at-risk food-insecure children and used amixed methodology;59 however, the findings of the interviews with parents were not clearly reported inthe manuscript. The general characteristics of the children and stakeholders populations included in theseven studies that reported qualitative data are presented in Table 2.
Children’s and adolescents’ experiences of food insecuritySix studies6,25,30,32,55,62 provided information on children and adolescents’ experiences of FI. Five of thesestudies used qualitative methods6,25,30,32,55 and one used mixed methods (both qualitative and quantitative).62
Sample sizes ranged from 12 to 56 participants and the age of participants ranged from 5 to 16 years.
It is worth noting that two studies55,64 were conducted by the same authors in the same homeless sheltersin the USA but assessed children of different age groups. The study by Smith and Richards64 assessed theperceptions of FI and coping mechanisms to avoid hunger in a sample of homeless young people (aged9–18 years), and that of Richards and Smith55 assessed the perceptions of FI among younger children
TABLE 1 Summary of factors related to child FI, reported by more than one study (adjusted analyses) (continued )
CategoryStudies reporting outcome [author, date,country (number of participants)] Summary of factor(s) related to child FI
SES/household income Kirkpatrick et al. 2010, Canada42 (n= 3333)
Broughton et al. 2006, USA21 (n= 142)
Carter et al. 2012, Canada23 (n = 1746)
Dunifon and Kowaleski-Jones 2003, USA26
(n= 1600)
Jacknowitz et al. 2015, USA35 (n = 7850)
Morrissey et al. 2016, USA49 (n= 12,550)
Papas et al. 2016, USA51 (n= 74)
Sharkey et al. 2011, USA61 (n = 610)
Yu et al. 2010, USA71 (n= 3799)
Ramsey et al. 2011, Australia54 (n= 185)
Low family income or low SES was associatedwith an increased risk of child FI
DOI: 10.3310/phr06130 PUBLIC HEALTH RESEARCH 2018 VOL. 6 NO. 13
© Queen’s Printer and Controller of HMSO 2018. This work was produced by Aceves-Martins et al. under the terms of a commissioning contract issued by the Secretary of Statefor Health and Social Care. This issue may be freely reproduced for the purposes of private research and study and extracts (or indeed, the full report) may be included inprofessional journals provided that suitable acknowledgement is made and the reproduction is not associated with any form of advertising. Applications for commercialreproduction should be addressed to: NIHR Journals Library, National Institute for Health Research, Evaluation, Trials and Studies Coordinating Centre, Alpha House, University ofSouthampton Science Park, Southampton SO16 7NS, UK.
13
(aged 6–13 years).55 It is unclear whether or not there was a degree of overlap between the two studies interms of participants. Furthermore, Smith and Richards64 modified the adult USDA FI assessment tool inorder to adapt it for use with adolescents.
Overall, findings of the qualitative studies indicated that children did not normally talk to each other aboutlack of food at home. However, they could describe or acknowledge when a peer or another family wasrunning out of food. Most were unaware that FI was prevalent in their community.25,62
Qualitative studies reported children’s perceptions or experiences of FI in terms of cognitive (e.g. childrentalked about scarcity of food),6,25,30,32,55,62 physical (e.g. hunger, pain and weakness related to lack ofsufficient food)6,30 and emotional awareness (e.g. negative feelings associated with FI).6,25,30,62 They alsoconsidered the social interactions and behavioural reactions (e.g. coping strategies) of food-insecure children.Table 3 presents a summary of the relevant qualitative studies according to the main identified themes.
Stakeholders’ experiences of dealing with children food insecurityTwo of the identified qualitative studies assessed the perspective of senior stakeholders with regard tochild FI.31,62 One of the studies interviewed parents, but no quotations or qualitative information from suchinterviews were provided in the manuscript.59
Harvey-Golding et al.31 explored the perspectives of senior stakeholders using one-on-one semistructuredinterviews regarding the provision of a school breakfast programme around the UK. The sample comprised19 participants (eight from local authorities and 11 employed in senior roles within mainstream primaryschools or special schools where pupils experienced multiple levels of deprivation) who were involved inthe free school breakfast programme.
TABLE 2 Summary of the characteristics of the studies that reported relevant qualitative information
Study authors and year of publication Country Population
Harvey 201630 UK 19 children aged 5–11 years recruited from Kids Company(London, UK) (a UK charity providing support for deprivedinner-city children)
Harvey-Golding et al. 201532 UK 15 children, mainly white British (mean age 9 years). Parents/caregivers of participating children were also invited to participate(n = 16, mean age= 41.1 years) as were school staff (n= 16,mean age= 41 years) from three participating free-breakfastschools
Harvey-Golding et al. 201631 UK 19 stakeholders of schools located in communities within thebottom half of neighbourhoods ranked on indicators of deprivation
Connell et al. 200525 USA 32 children aged 11–16 years from two after-school programmesfor low-income children in a mid-sized city and from a rural middleschool with a high rate of eligibility for free and reduced-priceschool meals
Fram et al. 20116 USA 26 children aged 9–16 years from families recruited from foodpantries, soup kitchens, social services agencies and communitycentres
Richards and Smith 200755 USA 56 children (6–13 years) living in homeless shelters
Smith and Richards 200864 USA 202 youths (6–18 years) living in homeless shelters
Shtasel-Gottlieb et al. 201562 USA 12 children between sixth and twelfth grade from low-incomefamilies in a predominantly minority urban community andstakeholders
RESULTS
NIHR Journals Library www.journalslibrary.nihr.ac.uk
14

TABLE 3 Summary of the six qualitative studies that focused on children’s and adolescents’ FI experiences
Themes identified Subthemes identifiedStudy authors, year of publication andcountry Quotation
Lack of food andcauses of FI
Lack of food or money to buy food inthe household
Harvey 2016, UK30 Yeah, ’cos when my mum doesn’t have a lot of money, well,that’s when we don’t have enough [food]
Female, 9 years old
Connell et al. 2005, USA25 [. . .] it was the bills. They had so many bills that they had to payand had to cut back on some stuff
Age not reported
Harvey 2016, UK30 Researcher: And so, is that when you come here [Kids Company,UK children’s charity] and have your dinner?
Participant: I just don’t eatMale, 10 years old
Harvey 2016, UK;30 Fram et al. 2011, USA;6
Connell et al. 2005, USA25
In some studies children reported that their parents or caregiverstalked to them openly about the lack of money or food and usedexpressions such as ‘unaffordable’, ‘wait until I get paid’ or ‘go toplay’ when they were asking for something to eat
Hunger Harvey 2016, UK30 Researcher: Do you ever go to bed with an empty tummy . . .a hungry tummy?
Participant: [nods to indicate agreement]Male, 5 years old
My tummy’s achingFemale, 7 years old
Your belly hurts, and sometimes you’ll feel like you’ll vomitFemale, 10 years old
Fram et al. 2011, USA6 Angry, mad, go to sleep basically, [. . .] you feel like you’ve got abunch of cramps in your stomach and you’ll be light-headed
Age not reported
continued
DOI:10.3310/phr06130
PUBLIC
HEA
LTHRESEA
RCH2018
VOL.6
NO.13
©Queen
’sPrinter
andController
ofHMSO
2018.This
work
was
producedby
Aceves-M
artinset
al.under
theterm
sof
acom
missioning
contractissued
bythe
Secretaryof
Statefor
Health
andSocialC
are.This
issuemay
befreely
reproducedfor
thepurposes
ofprivate
researchand
studyand
extracts(or
indeed,the
fullreport)may
beincluded
inprofessionaljournals
providedthat
suitableacknow
ledgement
ismade
andthe
reproductionisnot
associatedwith
anyform
ofadvertising.
Applications
forcom
mercial
reproductionshould
beaddressed
to:NIHRJournals
Library,NationalInstitute
forHealth
Research,Evaluation,
Trialsand
StudiesCoordinating
Centre,
Alpha
House,
University
ofSoutham
ptonScience
Park,Southam
ptonSO
167N
S,UK.
15

TABLE 3 Summary of the six qualitative studies that focused on children’s and adolescents’ FI experiences (continued )
Themes identified Subthemes identifiedStudy authors, year of publication andcountry Quotation
Coping and eatingstrategies
Need to eat less or distribute foodamong siblings
Fram et al. 2011, USA6 I normally don’t eat it that much.Age not reported
Harvey 2016, UK30 [. . .] my two baby sisters, because they need food, they sharewith me. They get one each and I get the rest because I’m thelittlest that goes to school
Female, 7 years old
Eating really fast Connell et al. 2005, USA25 Yeah, ’cause when they get food they try to eat it all up so that itwill take a long time before they get hungry again
Age not reported
Sleeping to alleviate hunger Harvey 2016, UK30 I feel hungry. I just want to sleep ’cos when you sleep [. . .] whenI [go] to bed hungry and sleep, I’m not hungry
Female, 9 years old
Social strategies Social confidence Fram et al. 2011, USA6 [. . .] we had to keep going over to my friend’s house back andforth asking if she had butter and milk and eggs [. . .] I reallydidn’t feel good about it because I’m not comfortable askingpeople that
Age not reported
Connell et al. 2005, USA25 They send you to borrow some flour. Our neighbour do that allthe time. She borrow flour and eggs all the time so that she canfinish cooking. We borrow flour all the time. We always run out
Age not reported
Feeling responsible for managing/stretching food resources
Fram et al. 2011, USA6 [My sister] would sometimes ask me to ask for a fruit snack or abanana and I would say, no, we’re running low, we could usethose for tomorrow for lunch
Age not reported
Connell et al. 2005, USA25 . . . I go in my house and I do everything that I can for my littlebrother, my little sister, and my friends so I just bring themsomething to eat
Age not reported
Finding ways of generating resources forfood or money to buy food
Fram et al. 2011, USA6 [. . .] we’ll like get together and we’ll find a way to get moneyup, not, we ain’t got to sell no drugs though, [. . .] We’ll findsome way [. . .]
Age not reported
RESULTS
NIHRJournals
Librarywww.journalslibrary.nihr.ac.uk
16

Themes identified Subthemes identifiedStudy authors, year of publication andcountry Quotation
Householdcharacteristics
Noticing barriers to accessing food Harvey 2016, UK30 [. . .] She was going to take me to the cinema but because shedidn’t have enough money she was going to save it on food
Female, 9 years old
Connell et al. 2005, USA25 His daddy died and his mama didn’t have a jobAge not reported
[. . .] the parents might eat once a day and the kids eat regularlike they do every day
Age not reported
Connell et al. 2005, USA25 One of the included studies reported that 7 out of 32 interviewedchildren admitted that their parents or caregivers preferred tosmoke, drink alcohol, or buy drugs or clothes rather than buyingfood. No quotations provided
Limited cooking and storage space orlack of appliances
Richards and Smith 2007, USA55 We have a small fridge, so nothin’ won’t hardly fit in thereAge not reported
Harvey 2016, UK30 [. . .] sometimes ’cos of the slow cooker we have to have leftoversand it might just be bread or noodles . . . I don’t want that
Female, 9 years old
Poor access to shops in theneighbourhood and lack of transport
Richards and Smith 2007, USA55 We gotta walk here, ’cause my mom don’t have a car no more.So we got to walk basically we walk a lot, except for, like wedon’t walk two days of the week
Age not reported
. . . Like we have to walk from here all the way to the [foodstamp office] – that’s a long way
Age not reported
continued
DOI:10.3310/phr06130
PUBLIC
HEA
LTHRESEA
RCH2018
VOL.6
NO.13
©Queen
’sPrinter
andController
ofHMSO
2018.This
work
was
producedby
Aceves-M
artinset
al.under
theterm
sof
acom
missioning
contractissued
bythe
Secretaryof
Statefor
Health
andSocialC
are.This
issuemay
befreely
reproducedfor
thepurposes
ofprivate
researchand
studyand
extracts(or
indeed,the
fullreport)may
beincluded
inprofessionaljournals
providedthat
suitableacknow
ledgement
ismade
andthe
reproductionisnot
associatedwith
anyform
ofadvertising.
Applications
forcom
mercial
reproductionshould
beaddressed
to:NIHRJournals
Library,NationalInstitute
forHealth
Research,Evaluation,
Trialsand
StudiesCoordinating
Centre,
Alpha
House,
University
ofSoutham
ptonScience
Park,Southam
ptonSO
167N
S,UK.
17

TABLE 3 Summary of the six qualitative studies that focused on children’s and adolescents’ FI experiences (continued )
Themes identified Subthemes identifiedStudy authors, year of publication andcountry Quotation
Sources of food Frequent takeaway meals or junk food oreating less desirable, unhealthy foodbecause there was no other choice
Harvey 2016, UK30 If there’s not enough to eat at home, we buy some chicken andchips
Researcher: OK. So, from the takeaway?
Participant: YeahMale, 10 years old
Well every Friday we have chicken and chips but my mum saidit’s not healthy
Female, 8 years old
Connell et al. 2005, USA25 [. . .] Change to lower class meals like eating a whole lot ofcanned food instead of fixing up some proper meals
Age not reported
School lunches Connell et al. 2005, USA25 . . . eat a lot at school and then when you come home you won’tbe hungry for another hour or 4 hours
Age not reported
Food banks Harvey 2016, UK30 If there’s not school, like sometimes we don’t do lunches. [. . .]On Sundays we do shopping [food banks], so we have to leave ituntil we do shopping on Sundays
Female, 10 years old
RESULTS
NIHRJournals
Librarywww.journalslibrary.nihr.ac.uk
18
School staff reported being able to identify children from food-insecure households or those at risk of FI,for example they could identify children who were not going to have quality breakfast at home andobserved that were the working parents and those who did not claim benefits who were struggling themost. Concerns were also raised about those in low-paid jobs or multiple jobs and those who were livingin private rented and/or multiple occupation accommodation: ‘Lower paid jobs and they’re on thebreadline, they’re in rented accommodation and multiple occupation. ‘Cause some do two jobs’.31
Some school staff reported that they were aware of families experiencing increased FI during weekendsand school holidays and expressed concern that some children might not be fed during the holidays. Insome cases, school staff took the initiative of organising food provision to families during school holidaysvia a local food bank and stressed the need for breakfast provision during school holidays: ‘I think forsome children, some families there is a definite, definite need, you know we’ve had to give food parcelsout and things’ and ‘Individual teachers, individual welfare assistants and learning support assistants,actually paying for some kind of food out of their own money’.31
Overall, among stakeholders, the school breakfast programme was considered a positive way to alleviatehunger, improve children’s health and nutritional status and start the school day. However, stakeholdersnoticed that some students may eat breakfast twice (once at home and once at school), raising concernsabout the risk of increased calorie intake.31
With regard to families, the programme was thought to alleviate the rushed morning routines for certainfamilies and was considered particularly beneficial for low-income families, families with multiple childrenand families with disabilities: ‘I think it’s an amazing scheme if you have got one, two or three kids inparticular’.31 However, some stakeholders raised concerns about the fact that the programme couldpotentially remove parental responsibility and promote poor parenting practices: ‘They know that they aregoing to get their breakfast, they get their dinners. Where the parents are not feeding them they knowthat they are going to be fed’.31
It was considered that the impact of the programme varied across the different local communities. In moredeprived communities, the programme was considered extremely beneficial to families experiencing FI andfood poverty. In general, stakeholders felt that the programme alleviated FI in the community, improvedhealth and nutrition and had the potential to reduce stigma and inequality: ‘It doesn’t make anybody feeldifferent. Everybody is the same. It has got a very positive ethos in school’.31 However, there were concernsthat the programme may contribute to increased overweight and obesity levels, as in less deprived areas,children may eat breakfast twice.31
Shtasel-Gottlieb et al.62 conducted a two-phase, mixed-methods study. In the first phase, 2350 studentsfrom sixth to twelfth grade completed an anonymous survey that included the youth self-report form of the9-item USDA module and demographic questions. In the second phase, 20 adult key informant interviewsand four semistructured student focus groups were performed to explain the findings from phase 1.The adult key informants were members of school staff, parents, government officials, church officials,community organisers and local health providers. Most stakeholders recognised FI as a community concernand were not surprised by the prevalence of FI in the community: ‘I would think it would be higher’.62
Some stakeholders noted that very low FS motivated youths to reach out to the community, which had thepotential to offer a supportive environment for young food-insecure people: ‘Because they don’t have theirparents [to support them] maybe they turn to their community and each other more’. Stakeholders felt thatcommunity-level initiatives (e.g. food pantries, school breakfast/lunch programmes, and summer food
DOI: 10.3310/phr06130 PUBLIC HEALTH RESEARCH 2018 VOL. 6 NO. 13
© Queen’s Printer and Controller of HMSO 2018. This work was produced by Aceves-Martins et al. under the terms of a commissioning contract issued by the Secretary of Statefor Health and Social Care. This issue may be freely reproduced for the purposes of private research and study and extracts (or indeed, the full report) may be included inprofessional journals provided that suitable acknowledgement is made and the reproduction is not associated with any form of advertising. Applications for commercialreproduction should be addressed to: NIHR Journals Library, National Institute for Health Research, Evaluation, Trials and Studies Coordinating Centre, Alpha House, University ofSouthampton Science Park, Southampton SO16 7NS, UK.
19

programmes) were useful to address the needs of food-insecure youths: ‘School programs for some familiesare the foundation of their food [and] their capacity to provide food’. However, they were aware of potentialbarriers to accessing community resources: ‘For some families it might be a pride issue for them not to go. Ithink people feel like they’re failing their families if they can’t provide them the basic needs’. Some studentspointed out that the stigma and embarrassment surrounding FI and food poverty might prevent young peoplefrom reaching out to their peers: ‘People could start talking to each other and . . . people who are too scaredto even say that they don’t have food’.62
Other stakeholders suggested that some families may encounter difficulties in accessing community resourcesdue to language and cultural differences (‘There are a ton of resources out there, but they aren’t in one centralplace’; ‘there are a lot of immigrant families and [certain ethnic groups] are really isolated a lot of times too’)or to high instability at home (‘domestic violence, drug and alcohol abuse, [or] absentee parents’).62
Research question 2: what are the incidence, prevalence and costs ofchild food insecurity in the UK (including recent trends)?
Information on the prevalence of child FI in the UK was sparse. No information regarding the incidenceand costs of child FI in the UK, or recent trends, was identified.
The 2017 UNICEF report indicates that 19.5% of children aged < 15 years in the UK live with a respondentwho is moderately or severely food insecure and 10.4% live with a respondent who is severely foodinsecure.127 FI was assessed using the Food Insecurity Experience Scale (FIES), which was introduced to theGallup World Poll (an annual large-scale, population-based household survey, covering the majority of theworld’s countries) in 2014. The FIES is based on three existing tools used to assess FI in household-basedsurveys: the US Household FS Scale, the Household FI Access Scale, and the Latin American and Caribbean FSScale. It is an experience-based metric, which assesses direct responses to questions about access to adequatefood. The FIES is considered to complement existing measures of other dimensions of FI.128
For the high-income countries considered in this rapid review, Table 4 reports the proportion of childrenaged < 15 years who live with a respondent who is food insecure.
Table 4 shows that the UK figure for moderate or severe FI is the highest (19.5%) among Europeancountries and only marginally smaller than the US figure (19.6%). Likewise, the UK figure for severe FI isnotably higher (10.4%) than that of all other high-income countries, including the USA. The country withthe most similar FIES profile to the UK is Ireland, which is not surprising given its regional proximity andcomparable social and political environment.
Poverty in the UKRecently published statistics on poverty in the UK (House of Commons Briefing Paper 2018) show thatin 2015/16 in the UK, there were 3.7 million children in absolute low income or absolute poverty and4.0 million children in relative low income or relative poverty.129 The proportion of children living in relativepoverty (in households with an income < 60% of median household income in that year) is expected toincrease sharply from 30% in 2015/16 to 37% in 2021/22 based on incomes after housing costs arededucted, and from 20% to 27% based on incomes before housing costs are deducted. The proportion ofchildren living in absolute poverty (in households with an income < 60% of the 2010/11 median, upratedfor inflation) is also expected to rise, from 27% in 2015/16 to 31% in 2021/22 based on incomes afterhousing costs, and from 17% to 22% based on incomes before housing costs.129
RESULTS
NIHR Journals Library www.journalslibrary.nihr.ac.uk
20

Research question 3: what is the impact of food insecurity on children’shealth and social well-being in high-income countries?
From the results of the search strategies, 74 studies that investigated the relationship between FI statusand children’s health and well-being outcomes were identified. The results of these studies are presented,for clarity, according to five main categories: general health outcomes, weight status, mental healthoutcomes, social well-being outcomes and academic outcomes. The results of the studies that adjustedtheir analyses for explanatory or confounding variables are summarised below. The results of the studiesthat did not adjust their analyses for explanatory or confounding variables are reported in Appendix 6.A quantitative synthesis of findings was deemed unfeasible because of the lack of consistency in the definitionand measurement of FI across studies, as well as the variation in terms of children’s characteristics, settingsand type of outcomes between studies. Further details of the main studies that adjusted their analyses forexplanatory or confounding variables are presented in Appendix 7.
General health outcomesTable 5 summarises the results of the 21 studies (adjusted analyses)21,24,26–29,39,42,44,45,54,60,63,66,69,76,82,83,88,95,106
that assessed the relationship between FI and children’s general health status or health problems(e.g. psychosomatic symptoms, anaemia, asthma, number of hospitalisations). Three studies used self-reportedhealth data from the children or adolescents involved.60,76,106 Nine studies reported the caregivers’ assessmentof the children’s general health.21,26,39,44,45,54,69,83,95 Nine studies used data from national health surveys or bloodsamples.24,27–29,42,63,66,82,88 The results of two studies73,99 that did not adjust their analyses for explanatory orconfounding variables are reported in Appendix 6.
TABLE 4 Proportion of children aged < 15 years living with a food-insecure respondent
Country n FIES-M+, mean % (95% CI) FIES-S, mean % (95% CI)
UK 1992 19.5 (15.8 to 23.1) 10.4 (7.5 to 13.3)
Ireland 601 17.9 (15.2 to 20.7) 7.3 (5.6 to 9.0)
France 486 6.0 (4.3 to 7.7) 1.3 (0.5 to 2.2)
Germany 418 4.9 (3.2 to 6.7) 1.2 (0.4 to 2.0)
Italy 450 8.8 (6.5 to 11.1) 1.1 (0.4 to 1.9)
Sweden 1985 4.1 (2.6 to 5.5) 0.6 (0.1 to 1.0)
Norway 480 5.2 (3.4 to 6.9) 1.7 (0.8 to 2.6)
Denmark 551 8.5 (6.5 to 10.5) 1.2 (0.6 to 1.8)
Finland 274 7.8 (5.4 to 10.1) 0.9 (0.2 to 1.6)
Iceland 225 8.4 (5.0 to 11.8) 3.5 (1.5 to 5.4)
Canada 513 11.9 (9.3 to 14.5) 3.3 (2.1 to 4.4)
USA 508 19.6 (16.4 to 22.8) 6.9 (5.0 to 8.4)
Japan 403 1.4 (0.5 to 2.3) 0.3 (–0.1 to 0.7)
Australia 421 16.0 (12.8 to 19.1) 4.9 (3.2 to 6.6)
New Zealand 484 10.9 (8.6 to 13.3) 3.2 (1.8 to 4.5)
CI, confidence interval; FIES-M+, Food Insecurity Experience Scale – moderate or severe FI; FIES-S, Food InsecurityExperience Scale – severe.Reproduced with permission from Pereira et al.127
DOI: 10.3310/phr06130 PUBLIC HEALTH RESEARCH 2018 VOL. 6 NO. 13
© Queen’s Printer and Controller of HMSO 2018. This work was produced by Aceves-Martins et al. under the terms of a commissioning contract issued by the Secretary of Statefor Health and Social Care. This issue may be freely reproduced for the purposes of private research and study and extracts (or indeed, the full report) may be included inprofessional journals provided that suitable acknowledgement is made and the reproduction is not associated with any form of advertising. Applications for commercialreproduction should be addressed to: NIHR Journals Library, National Institute for Health Research, Evaluation, Trials and Studies Coordinating Centre, Alpha House, University ofSouthampton Science Park, Southampton SO16 7NS, UK.
21

TABLE 5 Results of 21 studies that assessed the relationship between child FI and general health outcomes and adjusted their analyses for explanatory or confounding variables
Study authors,year of publicationand country Health outcome(s) measured Measurement tools
Number ofparticipants Summary of results
Main explanatory orconfounding variablesconsidered
Molcho et al. 2007,Ireland106
Psychosomatic symptoms(e.g. headaches, stomachaches, backaches, feeling dizzy)
Self-reported data throughthe HBSC Survey130
3596 children Children living in food poverty reportedphysical symptoms more often thanthose not living in food poverty(p < 0.05)
Age and social class(according to the father’soccupation)
Broughton et al.2006, Canada21
Iron depletion Caregiver’s report of child’soverall health status;haematological tests
142 householdswith children
Less than 7% in either the FS or the FIgroup had indications of iron depletion(p-values not presented)
Household income
Egeland et al. 2011,Canada27
Health status and anaemia Caregiver’s report of child’soverall health status,haematological samples andthe Nunavut Inuit HealthSurvey131
388 children No significant difference in theproportion of children with anaemiabetween food-secure and food-insecurehomes. There was no significanttraditional food by FS interaction termnoted for iron deficiency (p= 0.84).Children from severely food-insecurehomes were significantly less likely tohave their health rated as ‘excellent/verygood’ by their parents (39%, 34/88) thanchildren (54%, 86/159) from food-securehomes (RR 0.7, 95% CI 0.5 to 1)
Household characteristics
Kirkpatrick et al.2010, Canada42
(longitudinal study)
Health status, asthmaprevalence
Caregiver reported throughthe Canadian NationalLongitudinal Survey OfChildren And Youth132
5809 childrenaged 10–15 years;3333 youths aged16–21 years
Higher odds of poor health wereobserved in children (but not in youths)who had experienced hunger than inthose who were never hungry (OR 2.5,95% CI 1.3 to 4.6). Children and youthswho ever experienced hunger were2.4 times more likely to have asthma(OR 2.4, 95% CI 1.1 to 4.9). Youths(but not children) were more likely tohave asthma (OR 6.1, 95% CI 1.4 to 25.9)if their caregiver reported two or morehunger episodes over time
Child and householdsociodemographic variablesassociated with poverty
RESULTS
NIHRJournals
Librarywww.journalslibrary.nihr.ac.uk
22

Study authors,year of publicationand country Health outcome(s) measured Measurement tools
Number ofparticipants Summary of results
Main explanatory orconfounding variablesconsidered
Pickett et al. 2015,Canada76
Psychosomatic symptoms(e.g. headaches, stomachaches, backaches, feeling dizzy)
Self-reported data throughthe HBSC Survey
25,912 adolescents Children who reported experiencinghunger ‘sometimes’ or ‘often or always’were 1.9 and 4.4 times more likely toreport psychosomatic symptoms (OR 1.9,95% CI 1.8 to 2.0; OR 4.4, 95% CI3.7 to 5.2, respectively)
Family’s SES characteristicsand practices, school foodand nutrition programmes
Marjerrison et al.2011, Canada45
Hospitalisations The caregiver completed atelephone-administeredquestionnaire
183 children withtype 1 or 2diabetes
Children from food-insecure householdswere 3.7 times more likely to have beenadmitted to hospital previously thanchildren from food-secure families(OR 3.7, 95% CI 1.5 to 8.7)
FS status; child, parent andhousehold characteristics
Chi et al. 2014,USA82
Dental caries NHANES data 2206 children Children from low- or very low-FShouseholds had significantly higheruntreated caries (prevalence ratio 2.0,95% CI 1.1 to 3.6; p= 0.03; prevalenceratio 1.7, 95% CI 1.0 to 2.9; p= 0.05,respectively) than children with full FS.There was no difference in untreatedcaries between children from fully andmarginally food-secure households(p = 0.17)
Age; SES
Chilton et al. 2009,USA24
Health status NHANES data 19,275 mothers Children of immigrants to the USA livingin food-insecure households were 1.7times more likely than food-securehouseholds to have their health reported as‘fair’ or ‘poor’ (OR 1.7; p< 0.001)
Immigrant status and otherrelevant covariates
Cook et al. 2004,USA83
Health status, hospitalisation Caregiver’s report of child’soverall health status andnumber of hospitalisations
11,539 caregiversof children fromthe C-SNAP
Children enrolled in the C-SNAP whowere living in food-insecure householdshad significantly greater odds of ‘fair/poor’ health than those in food-securehouseholds (OR 1.9, 95% CI 1.7 to 2.2;p< 0.05). Children in food-insecurehouseholds were 1.3 times more likelyto have been hospitalised since birth(OR 1.3, 95% CI 1.2 to 1.5)
Child and maternalcharacteristics, healthinsurance and day carestatus, participation in foodassistance programmes
continued
DOI:10.3310/phr06130
PUBLIC
HEA
LTHRESEA
RCH2018
VOL.6
NO.13
©Queen
’sPrinter
andController
ofHMSO
2018.This
work
was
producedby
Aceves-M
artinset
al.under
theterm
sof
acom
missioning
contractissued
bythe
Secretaryof
Statefor
Health
andSocialC
are.This
issuemay
befreely
reproducedfor
thepurposes
ofprivate
researchand
studyand
extracts(or
indeed,the
fullreport)may
beincluded
inprofessionaljournals
providedthat
suitableacknow
ledgement
ismade
andthe
reproductionisnot
associatedwith
anyform
ofadvertising.
Applications
forcom
mercial
reproductionshould
beaddressed
to:NIHRJournals
Library,NationalInstitute
forHealth
Research,Evaluation,
Trialsand
StudiesCoordinating
Centre,
Alpha
House,
University
ofSoutham
ptonScience
Park,Southam
ptonSO
167N
S,UK.
23
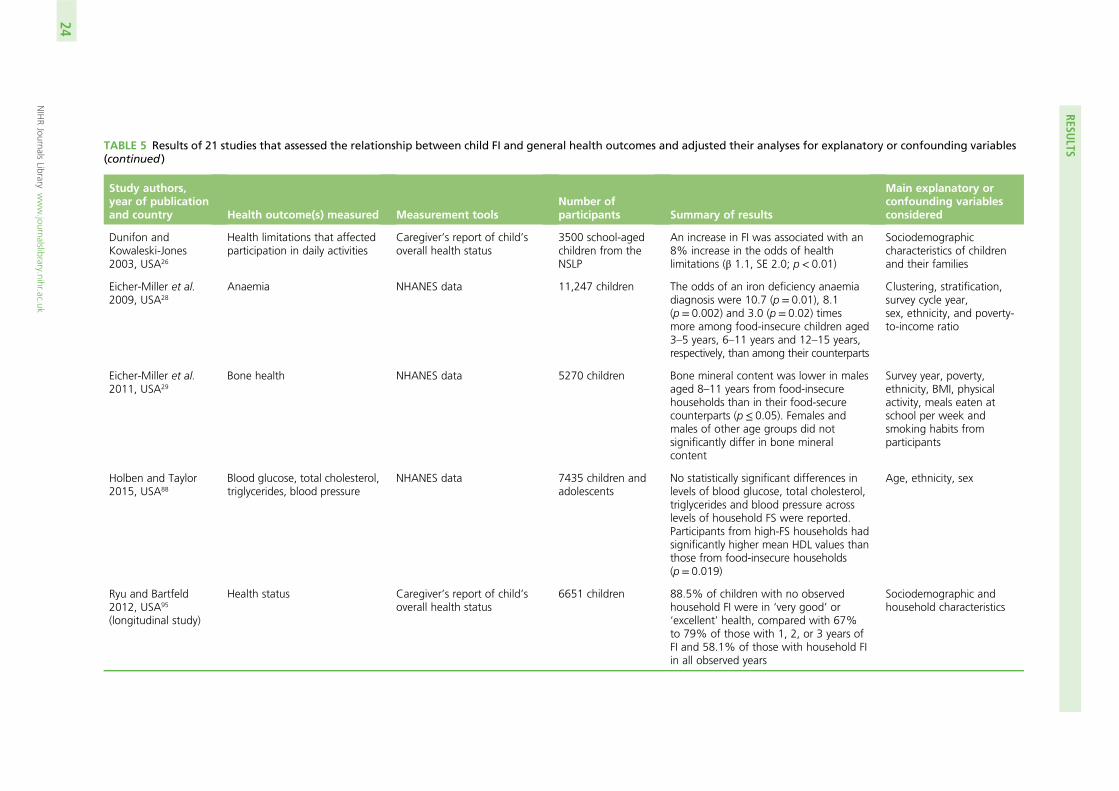
TABLE 5 Results of 21 studies that assessed the relationship between child FI and general health outcomes and adjusted their analyses for explanatory or confounding variables(continued )
Study authors,year of publicationand country Health outcome(s) measured Measurement tools
Number ofparticipants Summary of results
Main explanatory orconfounding variablesconsidered
Dunifon andKowaleski-Jones2003, USA26
Health limitations that affectedparticipation in daily activities
Caregiver’s report of child’soverall health status
3500 school-agedchildren from theNSLP
An increase in FI was associated with an8% increase in the odds of healthlimitations (β 1.1, SE 2.0; p< 0.01)
Sociodemographiccharacteristics of childrenand their families
Eicher-Miller et al.2009, USA28
Anaemia NHANES data 11,247 children The odds of an iron deficiency anaemiadiagnosis were 10.7 (p = 0.01), 8.1(p = 0.002) and 3.0 (p = 0.02) timesmore among food-insecure children aged3–5 years, 6–11 years and 12–15 years,respectively, than among their counterparts
Clustering, stratification,survey cycle year,sex, ethnicity, and poverty-to-income ratio
Eicher-Miller et al.2011, USA29
Bone health NHANES data 5270 children Bone mineral content was lower in malesaged 8–11 years from food-insecurehouseholds than in their food-securecounterparts (p≤ 0.05). Females andmales of other age groups did notsignificantly differ in bone mineralcontent
Survey year, poverty,ethnicity, BMI, physicalactivity, meals eaten atschool per week andsmoking habits fromparticipants
Holben and Taylor2015, USA88
Blood glucose, total cholesterol,triglycerides, blood pressure
NHANES data 7435 children andadolescents
No statistically significant differences inlevels of blood glucose, total cholesterol,triglycerides and blood pressure acrosslevels of household FS were reported.Participants from high-FS households hadsignificantly higher mean HDL values thanthose from food-insecure households(p= 0.019)
Age, ethnicity, sex
Ryu and Bartfeld2012, USA95
(longitudinal study)
Health status Caregiver’s report of child’soverall health status
6651 children 88.5% of children with no observedhousehold FI were in ‘very good’ or‘excellent’ health, compared with 67%to 79% of those with 1, 2, or 3 years ofFI and 58.1% of those with household FIin all observed years
Sociodemographic andhousehold characteristics
RESULTS
NIHRJournals
Librarywww.journalslibrary.nihr.ac.uk
24

Study authors,year of publicationand country Health outcome(s) measured Measurement tools
Number ofparticipants Summary of results
Main explanatory orconfounding variablesconsidered
Kimbro et al. 2015,USA39 (longitudinalstudy)
Health status Caregiver’s report of child’soverall health status
6300 children Child health status was significantly poorerif the child experienced a transition into FIor was food insecure at both measurementperiods, than if the child remained foodsecure over time (p-values not reported)
Child, parent andneighbourhoodsociodemographiccharacteristics
Mangini et al.2015, USA44
Asthma Caregiver’s report through theECLS-K survey133
11,099 children Food-insecure household was associatedwith a higher incidence of asthma (OR1.0, 95% CI 1.0 to 1.1). Marginal FI wasassociated with 34% higher odds ofasthma (95% CI 1.3 to 1.4). Whenmarginally food-insecure householdswere grouped with food-insecurehouseholds, the OR for asthma was1.36 (95% CI 1.3 to 1.4)
Child, parents andhousehold characteristics
Shanafelt et al.2016, USA60
Health status Self-reported health 904 students Food-insecure adolescents weresignificantly less likely than food-secureadolescents to report ‘excellent’ or ‘verygood’ health (OR 0.4, 95% CI 0.3 to 0.6;p< 0.01)
Grade level, sex, free andreduced-price lunch status,ethnicity, weight
Skalicky et al. 2006,USA63
Anaemia Haematological data from theC-SNAP
626 children Food-insecure children had 2.4 greaterodds of having iron deficiency withanaemia than food-secure children(OR 2.4, 95% CI 1.1 to 5.2; p= 0.02).The proportion of children havinganaemia and iron deficient-no anaemiadid not differ significantly between food-insecure and food-secure households
Caregiver and householdcharacteristics, whether ornot the child was everbreastfed
Tester et al. 2016,USA66
Lipid profiles NHANES data 1072 adolescents Those reporting marginal FS were almosttwice as likely to have elevated TG(≥ 90mg/dl) (OR 1.9, 95% CI 1.1 to 3.0),elevated TG-to-HDL-C ratio (OR 1.7,95% CI 1.1 to 2.8) and Apo B level of≥ 90mg/dl (OR 2.0, 95% CI 1.2 to 3.4)as high-FS adolescents
Sociodemographiccharacteristics
continued
DOI:10.3310/phr06130
PUBLIC
HEA
LTHRESEA
RCH2018
VOL.6
NO.13
©Queen
’sPrinter
andController
ofHMSO
2018.This
work
was
producedby
Aceves-M
artinset
al.under
theterm
sof
acom
missioning
contractissued
bythe
Secretaryof
Statefor
Health
andSocialC
are.This
issuemay
befreely
reproducedfor
thepurposes
ofprivate
researchand
studyand
extracts(or
indeed,the
fullreport)may
beincluded
inprofessionaljournals
providedthat
suitableacknow
ledgement
ismade
andthe
reproductionisnot
associatedwith
anyform
ofadvertising.
Applications
forcom
mercial
reproductionshould
beaddressed
to:NIHRJournals
Library,NationalInstitute
forHealth
Research,Evaluation,
Trialsand
StudiesCoordinating
Centre,
Alpha
House,
University
ofSoutham
ptonScience
Park,Southam
ptonSO
167N
S,UK.
25

TABLE 5 Results of 21 studies that assessed the relationship between child FI and general health outcomes and adjusted their analyses for explanatory or confounding variables(continued )
Study authors,year of publicationand country Health outcome(s) measured Measurement tools
Number ofparticipants Summary of results
Main explanatory orconfounding variablesconsidered
Weinreb et al.2002, USA69
Health status Caregivers responses toquestions adapted from theNational Health InterviewSurvey134
180 preschoolchildren, 228school children
For preschool-aged children, moderatehunger was a significant predictor ofhealth conditions (p = 0.03). In school-aged children, severe hunger was asignificant predictor of chronic conditions(p = 0.05)
Housing status, mother’sdistress, low birthweight,and child life events
Ramsey et al. 2011,Australia54
Health status Caregiver reports of child’soverall health status
185 children aged3–17 years
Health status was not associated withchild FI (p> 0.05)
Household income
Apo B, apolipoprotein B; BMI, body mass index; CI, confidence interval; C-SNAP, Children’s Sentinel Nutrition Assessment Programme; ECLS-K, Early Childhood Longitudinal Study –Kindergarten cohort; HDL, high-density lipoprotein; HDL-C, high-density lipoprotein cholesterol; NHANES, National Health and Nutrition Examination Survey; NSLP, National School LunchProgram; OR, odds ratio; RR, risk ratio; SE, standard error; SNAP, Supplemental Nutrition Assistance Program (USA); TG, triglyceride.
RESULTS
NIHRJournals
Librarywww.journalslibrary.nihr.ac.uk
26

In summary, food-insecure children were more likely to report poorer health status, poorer healthindicators or more symptoms than food-secure children. Findings were largely consistent across studies.Only one study did not find an association between FI and poor health54 and another study found a higherrisk of poor health in children (10–15 years), but not in youths (16–21 years). With regard to specific healthproblems, some, for example asthma or dental caries, were reported more frequently in food-insecurechildren than in their food-secure counterparts.42,44,82 For others, such as anaemia or iron depletion, theevidence was mixed and not clear-cut.63 Compared with food-secure children, food-insecure children werealso more likely to report more hospitalisations (as a proxy of health status).45,83
Weight statusThirty-eight studies investigated the relationship between weight status and child FI.12,20,21,27,28,36,45,51,52,54,56,57,60,61,63,67,74–76,78–81,85,86,88,97,98,100,102–105,109,111–113,123 Twenty-eight of these studies adjusted their analyses forexplanatory or confounding variables (Table 6)12,20,21,28,36,51,54,56,67,74–76,78–81,85,86,88,97,100,102–105,109,112,113 and10 did not (see Appendix 6).27,45,52,57,60,61,63,98,111,123 The majority of studies involved assessment of weightand height by a trained health professional. In some studies, the data were reported by the caregiver54
or self-reported by children or adolescents.76,79,112 All studies that adjusted their analyses for explanatoryor confounding variables used weight measurements to calculate body mass index (BMI) as weight(kg)/height (m2). Most studies (adjusted and unadjusted analyses) used the CDC growth charts, and afew36,54,76 used WHO or International Obesity Task Force (now known as World Obesity/Policy & Prevention)growth charts, or the US NCHS78 growth reference or other categorisation systems. Only one study did notreport the tool used for the categorisation of weight status.79
In summary, the evidence was mixed. Six studies that adjusted their analyses for explanatory or confoundingvariables found that food-insecure children were more likely to be categorised as overweight/obese,21,76,78,79,88
but seven other studies (adjusted analyses) did not find an association between child food insecure andweight status.20,36,54,67,85,103,104 Some studies found the association between child FI and weight status todepend on sex,74,75,80,100,105,109 age,28 psychosocial or parental characteristics51,86,102,112 and the tool used formeasuring FI.97 One longitudinal cohort study found that persistently food-insecure children had a greaterweight gain over time than persistently food-secure children.12 However, other longitudinal studies thatassessed the same children cohort [Early Childhood Longitudinal Study (ECLS)] did not report a weight gainin food-insecure children over time.56,113 Most of the studies that did not adjust their analyses for explanatoryor confounding variables found that weight status or BMI was unrelated to food-secure status (seeAppendix 6).27,45,52,57,60,61,63,98 Only one study111 showed that youths who reported no hunger were least likelyto have a BMI greater than or equal to the 95th percentile. However, caution is advised when interpretingthese results as they could be explained by potential relevant factors that were not accounted for. Thestudies that used data from National Health and Nutrition Examination Survey (NHANES) or ECLS cohortsconducted secondary analyses of existing data sets and assessed different explanatory or confoundingvariables (see Table 6). Results were almost equally split between studies that showed a significantassociation between FI and weight status and those that did not.
Mental health outcomesIn total, 17 studies19,26,39,41,47,53,54,69,73,76,89,92,93,96,99,106,108 investigated the association between FI and children’smental health outcomes. Fourteen studies adjusted their analyses for explanatory or confounding variables(Table 7)19,26,39,47,53,54,69,76,89,92,93,96,106,108 and three did not (see Appendix 6).41,73,99 The ‘adjusted’ studies used scalesor scores to evaluate mental health outcomes such as externalising or internalising behaviours,19,26,39,69,76,89,92
behavioural problems or difficulties54,93,96,108 and mental health disorders.47,53,106
In summary, 7 out of the 14 studies that adjusted their analyses for explanatory or confounding variablesfound an association between FI and children’s emotional or behavioural problems,19,26,54,69,76,92,108 one foundan association between FI and children’s mental health symptoms,106 and two reported an association betweenFI and children’s mental health disorders.47,53 In addition, three longitudinal studies showed a detrimentaleffect of FI on mental health markers, such as social skills, internalising and externalising behaviours andhyperactivity.39,89,96 By contrast, another longitudinal study did not find an association between FI and the
DOI: 10.3310/phr06130 PUBLIC HEALTH RESEARCH 2018 VOL. 6 NO. 13
© Queen’s Printer and Controller of HMSO 2018. This work was produced by Aceves-Martins et al. under the terms of a commissioning contract issued by the Secretary of Statefor Health and Social Care. This issue may be freely reproduced for the purposes of private research and study and extracts (or indeed, the full report) may be included inprofessional journals provided that suitable acknowledgement is made and the reproduction is not associated with any form of advertising. Applications for commercialreproduction should be addressed to: NIHR Journals Library, National Institute for Health Research, Evaluation, Trials and Studies Coordinating Centre, Alpha House, University ofSouthampton Science Park, Southampton SO16 7NS, UK.
27
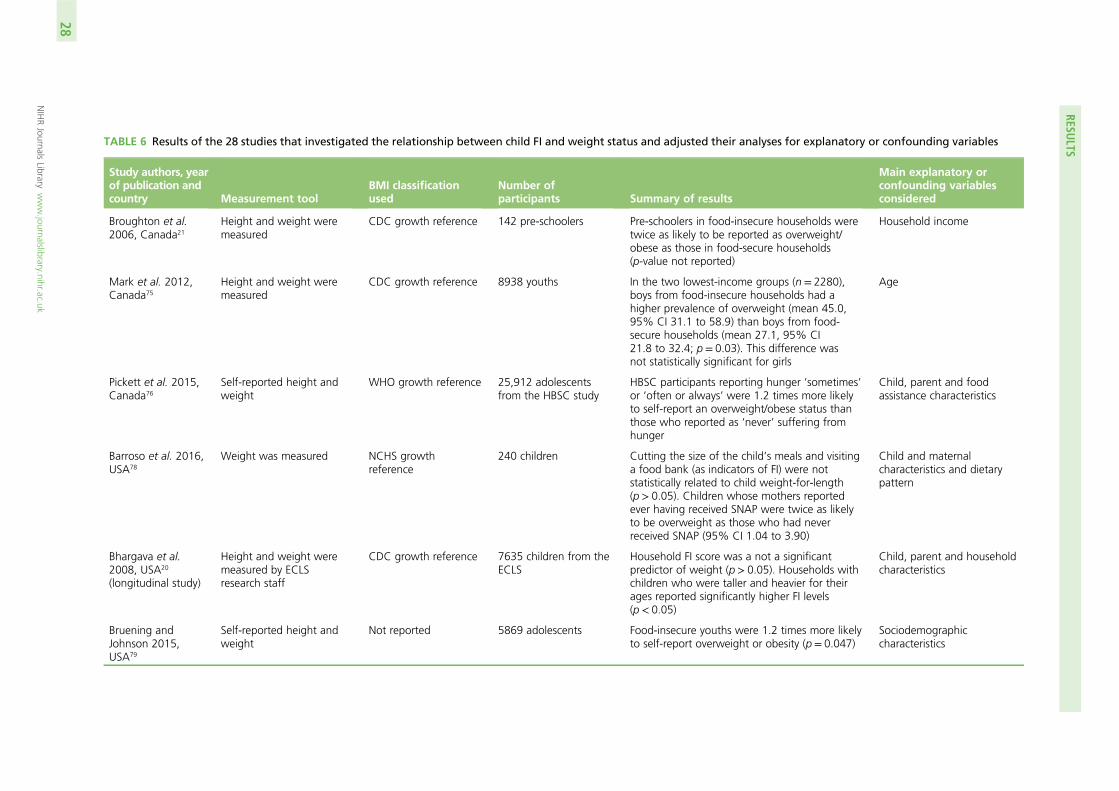
TABLE 6 Results of the 28 studies that investigated the relationship between child FI and weight status and adjusted their analyses for explanatory or confounding variables
Study authors, yearof publication andcountry Measurement tool
BMI classificationused
Number ofparticipants Summary of results
Main explanatory orconfounding variablesconsidered
Broughton et al.2006, Canada21
Height and weight weremeasured
CDC growth reference 142 pre-schoolers Pre-schoolers in food-insecure households weretwice as likely to be reported as overweight/obese as those in food-secure households(p-value not reported)
Household income
Mark et al. 2012,Canada75
Height and weight weremeasured
CDC growth reference 8938 youths In the two lowest-income groups (n= 2280),boys from food-insecure households had ahigher prevalence of overweight (mean 45.0,95% CI 31.1 to 58.9) than boys from food-secure households (mean 27.1, 95% CI21.8 to 32.4; p = 0.03). This difference wasnot statistically significant for girls
Age
Pickett et al. 2015,Canada76
Self-reported height andweight
WHO growth reference 25,912 adolescentsfrom the HBSC study
HBSC participants reporting hunger ‘sometimes’or ‘often or always’ were 1.2 times more likelyto self-report an overweight/obese status thanthose who reported as ‘never’ suffering fromhunger
Child, parent and foodassistance characteristics
Barroso et al. 2016,USA78
Weight was measured NCHS growthreference
240 children Cutting the size of the child’s meals and visitinga food bank (as indicators of FI) were notstatistically related to child weight-for-length(p > 0.05). Children whose mothers reportedever having received SNAP were twice as likelyto be overweight as those who had neverreceived SNAP (95% CI 1.04 to 3.90)
Child and maternalcharacteristics and dietarypattern
Bhargava et al.2008, USA20
(longitudinal study)
Height and weight weremeasured by ECLSresearch staff
CDC growth reference 7635 children from theECLS
Household FI score was a not a significantpredictor of weight (p> 0.05). Households withchildren who were taller and heavier for theirages reported significantly higher FI levels(p < 0.05)
Child, parent and householdcharacteristics
Bruening andJohnson 2015,USA79
Self-reported height andweight
Not reported 5869 adolescents Food-insecure youths were 1.2 times more likelyto self-report overweight or obesity (p= 0.047)
Sociodemographiccharacteristics
RESULTS
NIHRJournals
Librarywww.journalslibrary.nihr.ac.uk
28

Study authors, yearof publication andcountry Measurement tool
BMI classificationused
Number ofparticipants Summary of results
Main explanatory orconfounding variablesconsidered
Burke et al. 2016,USA80 (longitudinalstudy)
Height and weight weremeasured by ECLSresearch staff
CDC growth reference 15,827 children fromthe ECLS
No significant differences in BMI growthbetween food-insecure and food-securechildren. Significant differences in BMI growthin females based on household FS. Betweenkindergarten and eighth grade, females in food-insecure households increased BMI growth by2.87% (95% CI 1.27 to 4.49) compared withfemales in food-secure households (p< 0.05).This result was not significant in males
Child characteristics, time-invariant and time-variantvariables
Casey et al. 2006,USA81
Height and weight weremeasured by a NHANEShealth technician
CDC growth reference 6995 children from theNHANES
The risk of obesity was 1.3 times (95% CI 1.0to 1.7) greater in food-insecure children than infood-secure children (p= 0.03)
Child, parent and householdcharacteristics
Eicher-Miller et al.2009, USA28
Height and weight weremeasured by a NHANEShealth technician
CDC growth reference 11,247 children andadolescents from theNHANES
Differences of BMI status across food-insecureand food-secure groups were significantdepending on age group [e.g. the differencein the 6–11 years group was not significant(p = 0.0806), but was significant in the12–15 years group (p= 0.0021)], with fewerfood-insecure adolescents classified as obeseor overweight
NHANES clustering andstratification
Gundersen et al.2008, USA86
Height and weight weremeasured by a NHANEShealth technician
CDC growth reference 841 children andadolescents from theNHANES
Increases in maternal stressors (e.g. familystructure, financial, mental and physical healthproblems) increased the probability of beingoverweight or obese for children in food-securehouseholds but decreased these odds forchildren in food-insecure households (p> 0.05).An increase in maternal stressors amplified theprobability of being overweight or obese infood-secure 3- to 10-year-olds (p< 0.05)
Child and mothercharacteristics
Gundersen et al.2009, USA85
Height and weight weremeasured by a NHANEShealth technician
CDC growth reference 2516 children andadolescents from theNHANES
The association between FI and obesity wasnot significant. This non-significance persistedwhen the analysis was performed by ethnicitysubgroups (non-Hispanic white, non-HispanicAfrican American, and Hispanic) and sex
Demographic characteristics
continued
DOI:10.3310/phr06130
PUBLIC
HEA
LTHRESEA
RCH2018
VOL.6
NO.13
©Queen
’sPrinter
andController
ofHMSO
2018.This
work
was
producedby
Aceves-M
artinset
al.under
theterm
sof
acom
missioning
contractissued
bythe
Secretaryof
Statefor
Health
andSocialC
are.This
issuemay
befreely
reproducedfor
thepurposes
ofprivate
researchand
studyand
extracts(or
indeed,the
fullreport)may
beincluded
inprofessionaljournals
providedthat
suitableacknow
ledgement
ismade
andthe
reproductionisnot
associatedwith
anyform
ofadvertising.
Applications
forcom
mercial
reproductionshould
beaddressed
to:NIHRJournals
Library,NationalInstitute
forHealth
Research,Evaluation,
Trialsand
StudiesCoordinating
Centre,
Alpha
House,
University
ofSoutham
ptonScience
Park,Southam
ptonSO
167N
S,UK.
29

TABLE 6 Results of the 28 studies that investigated the relationship between child FI and weight status and adjusted their analyses for explanatory or confounding variables(continued )
Study authors, yearof publication andcountry Measurement tool
BMI classificationused
Number ofparticipants Summary of results
Main explanatory orconfounding variablesconsidered
Holben and Taylor2015, USA88
Height and weight weremeasured by a NHANEShealth technician
CDC growth reference 7435 adolescents fromthe NHANES
Children living in low- and very low-FS householdswere 1.2 and 1.4 times, respectively, morelikely to have obesity (p= 0.036), and 1.4 and1.5 times, respectively, more likely to havecentral obesity as measured by waistcircumference (p= 0.002)
Age, ethnicity and sex
Jyoti et al. 2005,USA11 (longitudinalstudy)
Height and weight weremeasured by ECLSresearch staff
CDC growth reference Approximately 21,000children from the ECLS
Children from persistently food-insecurehouseholds had a 0.35 kg/m2 greater gain in BMI(p< 0.028) and a 0.65 kg greater gain in weight(p< 0.026) than children from persistently food-secure households. The association betweenkindergarten FI, higher BMI and weight wasamong girls only (p= 0.015). Becoming foodinsecure was associated significantly with greaterweight and BMI gains among boys (p= 0.019)but not among girls (p= 0.10)
Child, parent, householdand neighbourhood time-varying and time-invariantcharacteristics
Kaiser et al. 2002,USA36
Height and weight weremeasured by research staff
WHO/NCHS growthreference
211 families No significant differences (p> 0.05) were foundbetween children weight-for-height z-score orheight-for-age z-score and levels of FI
Mother’s acculturation score
Kaur et al. 2015,USA97
Height and weight weremeasured by a NHANEShealth technician
CDC growth reference 9701 children from theNHANES
Significant differences in obesity prevalencebetween food-insecure and food-secure childrenat both the child and the household level.However, child-level food insecure was notassociated with obesity. On the other hand, at ahousehold level, food insecure was associatedto obesity only in 6- to 11-year-old children(OR 1.8, 95% CI 1.3 to 2.5), but not in 2- to5-year-old children (OR 0.9, 95% CI 0.5 to 1.5)
Child and householdcharacteristics
RESULTS
NIHRJournals
Librarywww.journalslibrary.nihr.ac.uk
30

Study authors, yearof publication andcountry Measurement tool
BMI classificationused
Number ofparticipants Summary of results
Main explanatory orconfounding variablesconsidered
Kohn et al. 2014,USA74
Height and weight weremeasured by a NHANEShealth technician
CDC growth reference 1321 children andadolescents from theNHANES
In low-income food-insecure youths, foodassistance participation was not associatedwith BMI z-score, high waist circumference orcategorical weight status for any specification offood assistance (p> 0.05). Food-secure youth,but not food-insecure youth, participating infood assistance programmes had increasedbody weight measurements
Child, parent and householdcharacteristics
Kuku et al. 2012,USA100
Height and weight weremeasured by research staff
CDC growth reference 959 children from aUS data set (ChildDevelopmentSupplement of thePanel Study Dynamics)
No significant association between foodinsecure and obesity was found. However,results showed that among boys who were atlower levels of FS, an increase in the number ofaffirmative FI responses was associated with ahigher probability of obesity. This associationwas not observed among girls
Child characteristics
Lohman et al. 2009,USA102
Height and weight weremeasured by research staff
CDC and IOTF growthreferences
1011 adolescents FI was not related to weight status. However,there was a significant interaction betweenmaternal stressors (i.e. unemployment,disabilities, low self-esteem, psychologicaldistress, low support network) and FI.Adolescents classified as food insecure whosemothers reported the presence of maternalstressors were 1.7 times more likely to reportobesity (p < 0.05). As maternal stressorsincreased in child food-insecure households,an adolescent’s probability of being overweightor obese increased from approximately 35% to70%, depending on the stressors experienced
FI, stressor indices(unemployment, disabilities,low self-esteem,psychological distress, lowsupport network), and theinteraction of these indiceswith FI
Martin and Ferris2007, USA103
Height and weight weremeasured by research staff
CDC growth reference 212 children Children in households with low incomes(< 100% of poverty levels) were half as likelyto be overweight as those in households withhigher incomes (OR 0.4, 95% CI 0.2 to 0.9;p= 0.03). However, food insecure did notincrease the odds of childhood overweight(p = 0.37)
Child, parent and householdcharacteristics
continued
DOI:10.3310/phr06130
PUBLIC
HEA
LTHRESEA
RCH2018
VOL.6
NO.13
©Queen
’sPrinter
andController
ofHMSO
2018.This
work
was
producedby
Aceves-M
artinset
al.under
theterm
sof
acom
missioning
contractissued
bythe
Secretaryof
Statefor
Health
andSocialC
are.This
issuemay
befreely
reproducedfor
thepurposes
ofprivate
researchand
studyand
extracts(or
indeed,the
fullreport)may
beincluded
inprofessionaljournals
providedthat
suitableacknow
ledgement
ismade
andthe
reproductionisnot
associatedwith
anyform
ofadvertising.
Applications
forcom
mercial
reproductionshould
beaddressed
to:NIHRJournals
Library,NationalInstitute
forHealth
Research,Evaluation,
Trialsand
StudiesCoordinating
Centre,
Alpha
House,
University
ofSoutham
ptonScience
Park,Southam
ptonSO
167N
S,UK.
31

TABLE 6 Results of the 28 studies that investigated the relationship between child FI and weight status and adjusted their analyses for explanatory or confounding variables(continued )
Study authors, yearof publication andcountry Measurement tool
BMI classificationused
Number ofparticipants Summary of results
Main explanatory orconfounding variablesconsidered
Matheson et al.2002, USA104
Height and weight weremeasured by research staff
CDC growth reference 124 children Children from food secure households weighedmore than those from food-insecure households(p = 0.04). The food-insecure children’s bodyweights were within the normal range
Age and sex
Metallinos-Katsaraset al. 2009, USA105
Height and weight weremeasured
CDC growth reference 8493 children Girls < 2 years old from food-insecure householdswere 40% less likely to be overweight (OR 0.6,95% CI 0.5 to 0.9) than their food-securecounterparts. Girls from 2 to 5 years of age livingin food-insecure households with hunger were1.5 times more likely to report overweight(OR 1.5, 95% CI 1.0 to 2.1)
Maternal education andethnicity
Papas et al. 2016,USA51
Height and weight weremeasured by research staff
CDC growth reference 74 mother–child dyads Food-insecure children were 10.2 times(OR 10.2, 95% CI 1.2 to 85.5) more likely tobe obese than food-secure children. However,maternal overweight/obesity moderated thisassociation. Those living in a low-FS householdwith an obese mother were 9.5 times (OR 9.5,95% CI 1.2 to 81) more likely to be obese, andthose with very low FS and an obese motherwere 32 times (OR 32, 95% CI 2.6 to 391)more likely to report obesity
Parent and householdcharacteristics
Rose and Bodor2006, USA56
(longitudinal study)
Height and weight weremeasured by ECLSresearch staff
CDC growth reference 16,889 children fromthe ECLS
Children from food-insecure households were20% less likely to be overweight (p= 0.027).There was a significant interaction betweenhousehold food-secure status and maternaleducation (p < 0.05). food insecure wasnegatively associated with weight gain overtime (OR 0.7, 95% CI 0.6 to 0.9)
Child, parent, householdand neighbourhoodcharacteristics
RESULTS
NIHRJournals
Librarywww.journalslibrary.nihr.ac.uk
32

Study authors, yearof publication andcountry Measurement tool
BMI classificationused
Number ofparticipants Summary of results
Main explanatory orconfounding variablesconsidered
Speirs et al. 2016,USA109
Height and weight weremeasured by research staff
CDC growth reference 438 pre-school children Household food insecure and child foodinsecure were not associated with eitheroverweight/obesity or BMI-for-age z-score(p > 0.05). However, girls from food-insecurehouseholds were more likely than girls fromfood-secure households to have a higher BMIz-score (p< 0.05)
Child, parent and householdcharacteristics
Trapp et al. 2015,USA67
Height and weight weremeasured by research staff
CDC growth reference 222 caregivers withyoung children
No direct association between household FSstatus and child overweight/obesity. Findingsshowed an increase in child BMI percentile withincreasing age among households reportinghigh FS (p< 0.02). This effect was not observedin households reporting any degree of FI
Household food-securestatus, maternal,demographic andpsychosocial characteristics
Willis and Fitzpatrick2016, USA112
Self-reported height andweight
CDC growth reference 324 adolescents Significant direct association between FI andweight status among early adolescents(p < 0.001). The association was no longersignificant after adjustment for psychosocialfactors (e.g. depression)
Adolescent characteristics
Winicki and Jemison2003, USA113
Height and weight weremeasured by ECLSresearch staff
CDC growth reference 21,260 children fromthe ECLS
Overweight rates increased with more severe FIcategory; however, the difference was notsignificant (p < 0.05)
Household characteristics
Ramsey et al. 2011,Australia54
Parent-reported height andweight
WHO growth reference 185 households withchildren
There was no association between FI andoverweight/obesity in children (p> 0.05)
Household income
BMI, body mass index; CI, confidence interval; ECLS, Early Childhood Longitudinal Study; IOTF, International Obesity Task Force; NHANES, National Health and Nutrition Examination Survey;NSLP, National School Lunch Program; OR, odds ratio; RR, risk ratio; SNAP, Supplemental Nutrition Assistance Program (USA).
DOI:10.3310/phr06130
PUBLIC
HEA
LTHRESEA
RCH2018
VOL.6
NO.13
©Queen
’sPrinter
andController
ofHMSO
2018.This
work
was
producedby
Aceves-M
artinset
al.under
theterm
sof
acom
missioning
contractissued
bythe
Secretaryof
Statefor
Health
andSocialC
are.This
issuemay
befreely
reproducedfor
thepurposes
ofprivate
researchand
studyand
extracts(or
indeed,the
fullreport)may
beincluded
inprofessionaljournals
providedthat
suitableacknow
ledgement
ismade
andthe
reproductionisnot
associatedwith
anyform
ofadvertising.
Applications
forcom
mercial
reproductionshould
beaddressed
to:NIHRJournals
Library,NationalInstitute
forHealth
Research,Evaluation,
Trialsand
StudiesCoordinating
Centre,
Alpha
House,
University
ofSoutham
ptonScience
Park,Southam
ptonSO
167N
S,UK.
33

TABLE 7 Results of the 14 studies that investigated the association between child FI and mental health outcomes and adjusted their analyses for explanatory orconfounding variables
Study authors,year of publicationand country
Mental healthoutcome(s) measured Measurement tools
Number ofparticipants Summary of results
Main explanatory orconfounding variablesconsidered
Belsky et al. 2010,UK19
Children’s cognitive,behavioural, and emotionaldevelopment
Children’s andteachers’ reports onexternalising scale
2125 school-agedchildren
Association between FI and children’s emotionalproblems was significant in adjusted analyses(β 0.2, SE 0.1; p< 0.05)
Income level, maternalpersonality, and householdsensitivity to children’s needs
Molcho et al. 2007,Ireland106
Mental symptoms(i.e. feeling irritable, badtempered or more nervousor having difficultiessleeping)
Self-reported datathrough the HBSCSurvey
8424 school-agedchildren
Boys who reported experiencing food povertywere more likely to feel low (OR 2.6, 95% CI2.3 to 2.8), afraid (OR 2.2, 95% CI 1.8 to 2.5)or dizzy (OR 2.4, 95% CI 2.1 to 2.7) than thosewho did not report food poverty. Girls whoreported experiencing food poverty were morelikely to feel dizzy (OR 2.0, 95% CI 1.7 to 2.2),afraid (OR 2.2, 95% CI 2.0 to 2.5) or tired andexhausted (OR 2.0, 95% CI 1.8 to 2.2) thanthose who did not report food poverty
Age and social class(according to the father’soccupation)
Pickett et al. 2015,Canada76
Behaviour problems(i.e. internalising/externalising behaviours)
Self-reported datathrough the HBSCSurvey
25,912 school-agedchildren
Children who experienced hunger ‘sometimes’or ‘often or always’ were more likely to reportinternalising negative emotional problems thanthose who ‘never’ experienced hunger (OR 2.1,95% CI 2.0 to 2.2, and OR 3.8, 95% CI 3.2 to4.4, respectively). They were also more likelyto report externalising negative behaviouralproblems than those ‘never’ experiencinghunger (OR 1.2, 95% CI 1.1 to 1.3 and OR 2.0,95% CI 1.7 to 2.4, respectively)
Child and parentsociodemographiccharacteristics
Dunifon andKowaleski-Jones2003, USA26
Behavioural problems(i.e. internalising/externalising behaviours)
Reported by motherthrough BehaviourProblems Index
3500 school-agedchildren
Increased FI was associated with decreasedlevels of positive behaviours (β –0.17, SE 0.06;p< 0.001)
Child and parentsociodemographiccharacteristics
Howard 2011,USA89 (longitudinalstudy)
Interpersonal relationships,self-control, externalisingbehaviour
Children’s andteachers’ reports fromthe ECLS-K study
4710 children Children experiencing FI at any time had lowersocial skills than those who were food secure.FI was also found to negatively affect children’snon-cognitive skill development. Children whoexperienced an early transition from FI in firstgrade to FS in third grade showed a largeimpairment that persisted through to fifth grade(p < 0.05)
Child, parent and householdsociodemographiccharacteristics
RESULTS
NIHRJournals
Librarywww.journalslibrary.nihr.ac.uk
34

Study authors,year of publicationand country
Mental healthoutcome(s) measured Measurement tools
Number ofparticipants Summary of results
Main explanatory orconfounding variablesconsidered
Huang et al. 2010,USA92 (longitudinalstudy)
Children behaviouralproblems (externalising/internalising behaviours)
Caregiver’s reportthrough the BehaviourProblem Index
416 children FI was positively associated with bothexternalising and internalising behaviouralproblems. In particular, FI indirectly affectedexternalising (p= 0.05) and internalisingproblems (p= 0.061) through parenting stress
Child and household headcharacteristics, householdcharacteristics
Huang and Vaughn2016, USA93
(longitudinal study)
Children’s behaviouralproblems (externalising/internalising behaviours)
Children’s andteachers’ reports in theECLS-K study
7348 children Overall, FI was not associated with change inchildren’s behaviour problems (externalising orinternalising behaviours). The authors indicatedthat the impact of FI on children’s behaviourproblems could be episodic or interact withspecific developmental stages. However, resultsmight differ depending on the sex and thepersistency of FI
Child, parent and householdsociodemographiccharacteristics
Johnson andMarkowitz 2017,USA96 (longitudinalstudy)
Children’s behaviour interms of hyperactivity,conduct problems
Children’s and teachers’reports in the ECLS-Kstudy
3700 children As the level of FI increased across earlychildhood, the negative associations withbehavioural outcomes increased accordingly.Specifically, any one episode of FI in earlychildhood was associated with increasedhyperactivity (β 0.3, SE 0.1; p= 0.02) andconduct problems (β 0.3, SE 0.1; p = 0.05)
Demographic and householdeconomic variablestheoretically or empiricallylinked to FI
Kimbro et al. 2015,USA39 (longitudinalstudy)
Behavioural problems(i.e. interpersonal skills,self-control, internalisingand externalisingbehaviours)
Children and children’steachers reports in theECLS-K study
6300 children Teachers reported poorer scores forinterpersonal skills, self-control, andinternalising and externalising behaviours forchildren who experienced FI (no p-valuespresented). Children who transitioned into FIhad significantly inferior ratings on interpersonalskills, self-control and externalising behaviours,compared with children who were food secure
Child, parent andneighbourhoodsociodemographiccharacteristics
continued
DOI:10.3310/phr06130
PUBLIC
HEA
LTHRESEA
RCH2018
VOL.6
NO.13
©Queen
’sPrinter
andController
ofHMSO
2018.This
work
was
producedby
Aceves-M
artinset
al.under
theterm
sof
acom
missioning
contractissued
bythe
Secretaryof
Statefor
Health
andSocialC
are.This
issuemay
befreely
reproducedfor
thepurposes
ofprivate
researchand
studyand
extracts(or
indeed,the
fullreport)may
beincluded
inprofessionaljournals
providedthat
suitableacknow
ledgement
ismade
andthe
reproductionisnot
associatedwith
anyform
ofadvertising.
Applications
forcom
mercial
reproductionshould
beaddressed
to:NIHRJournals
Library,NationalInstitute
forHealth
Research,Evaluation,
Trialsand
StudiesCoordinating
Centre,
Alpha
House,
University
ofSoutham
ptonScience
Park,Southam
ptonSO
167N
S,UK.
35

TABLE 7 Results of the 14 studies that investigated the association between child FI and mental health outcomes and adjusted their analyses for explanatory or confoundingvariables (continued )
Study authors,year of publicationand country
Mental healthoutcome(s) measured Measurement tools
Number ofparticipants Summary of results
Main explanatory orconfounding variablesconsidered
McLaughlin et al.2012, USA47
Mental disorders accordingto a DSM-IV classification(mood, anxiety behaviourand substance disorders)
Self-reported throughmodified version ofComposite InternationalDiagnostic Interviewand caregiver’s reportof major symptoms
6483 adolescent–parentpairs
A higher FI score was associated with greaterodds of any past-year mental disorder andpast-year mood, anxiety, behaviour, and substancedisorders (OR 1.2 for each). The associationbetween FI and mood disorders was strongerfor adolescents with a low family income(OR 1.2–1.6 for adolescents in the lowest threequartiles compared with adolescents in the highestquartile) and was stronger for adolescents withhigher levels of relative deprivation (OR 1.1)
Family SES, extreme povertyand family income
Poole-Di Salvo et al.2016, USA53
Mental health problems Parent-reportedStrengths andDifficultiesQuestionnaire (as ameasure of mentalhealth) from theECLS-K study
8600 adolescents Household FI was independently associated withmore than a twofold increased risk of parent-reported mental health problems amongadolescents (OR 2.3, 95% CI 1.6 to 3.2)
Adolescent, parent andneighbourhoodcharacteristics
Slack and Yoo2005, USA108
Behavioural problems Caregiver’s in-personinterview in the USIllinois Families Study
942 families Food hardship was positively associated withexternalising behaviour problems for youngerchildren (p < 0.01) and with internalisingbehaviour problems for both age groups(3–5 and 6–12 years; p< 0.01). Food hardshipwas not found to be related to older children’sexternalising behaviour problems (p> 0.05)
Parent characteristics (suchas parental stress, warmth,and depression)
RESULTS
NIHRJournals
Librarywww.journalslibrary.nihr.ac.uk
36

Study authors,year of publicationand country
Mental healthoutcome(s) measured Measurement tools
Number ofparticipants Summary of results
Main explanatory orconfounding variablesconsidered
Weinreb et al. 2002,USA69
Behavioural problems(i.e. internalising/externalising problems)
Caregiver’s reportthrough the ChildBehaviour Check List
180 preschool childrenand 228 school-agedchildren
School-aged children with severe hunger hadparent-reported anxiety scores that were morethan double the scores of children with nohunger (OR 2.2, SE 1.12; p< 0.05) andsignificantly higher internalising andexternalising behaviour problems (p= 0.04).Similarly, for preschool-aged children, severehunger was associated with internalisingbehaviour problems compared with childrenwith no hunger (p< 0.05)
Type of housing, mother’sdistress level, and stressfullife events
Ramsey et al. 2011,Australia54
Emotional symptoms orbehavioural difficulties
Caregiver’s reportthrough a strengthsand difficultiesquestionnaire
185 children Children living in food-insecure households weremore likely to report borderline or atypicalemotional symptoms (OR 2.4, 95% CI 1.1 to 5.4;p< 0.05) or behavioural difficulties (OR 2.4,95% CI 1.0 to 5; p< 0.05) than their counterparts
Household income
CI, confidence interval; DSM-IV, Diagnostic and Statistical Manual of Mental Disorders, Fourth Edition; ECLS-K, Early Childhood Longitudinal Study – Kindergarten cohort; NSLP, NationalSchool Lunch Program; OR, odds ratio; RR, risk ratio; SE, standard error; SNAP, Supplemental Nutrition Assistance Program (USA).
DOI:10.3310/phr06130
PUBLIC
HEA
LTHRESEA
RCH2018
VOL.6
NO.13
©Queen
’sPrinter
andController
ofHMSO
2018.This
work
was
producedby
Aceves-M
artinset
al.under
theterm
sof
acom
missioning
contractissued
bythe
Secretaryof
Statefor
Health
andSocialC
are.This
issuemay
befreely
reproducedfor
thepurposes
ofprivate
researchand
studyand
extracts(or
indeed,the
fullreport)may
beincluded
inprofessionaljournals
providedthat
suitableacknow
ledgement
ismade
andthe
reproductionisnot
associatedwith
anyform
ofadvertising.
Applications
forcom
mercial
reproductionshould
beaddressed
to:NIHRJournals
Library,NationalInstitute
forHealth
Research,Evaluation,
Trialsand
StudiesCoordinating
Centre,
Alpha
House,
University
ofSoutham
ptonScience
Park,Southam
ptonSO
167N
S,UK.
37

developmental change in children’s behavioural problems.93 The authors suggested that the impact of FI onchildren’s behaviour could be episodic or could interact with developmental phases over time.
Social well-being outcomesFifteen studies9,12,58,76,77,84,87,90,91,94,106,107,110,114,117 investigated the association between FI and children’s socialwell-being outcomes [i.e. happiness, life satisfaction, social skills, quality of life (QoL), lifestyles, physicalfighting, misconduct, bullying, rereport to social protection services]. Fourteen studies9,12,58,76,77,84,87,90,91,94,106,107,110,114 adjusted their analyses for explanatory or confounding variables (Table 8) and one117 did not(see Appendix 6). The data were self-reported by children,9,76,77,84,91,106,107,114,117 the caregiver,94 the children’steachers12,90 or caseworkers in child protection services.87
In summary, FI was associated with poor social well-being, poor QoL and unhealthy lifestyles in childrenand adolescents in all 14 studies. In particular, FI was associated with poorer scores on happiness andlife satisfaction,106 poorer social skills scores,90 more frequent housing problems (e.g. homelessness),77
substance abuse,77 frequent bullying engagement,84 frequent physical fighting,76 poorer diet quality91,107,114
and lower QoL scores.9 One longitudinal study found that persistent household FI during childhood waslinked to physical fighting and other misconduct (bullying, stealing, lying and defying behaviour) amongboys, but not girls.94 A sex difference was also reported in another longitudinal study, which observedthat changes in social skills scores over time were dependent on the transition from FI to FS (or vice versa)and sex.12 One study reported differences in QoL scores according to age, with food-insecure children(3–8 years) reporting lower scores in physical functioning and food-insecure adolescents (12–17 years)reporting lower scores in psychosocial functioning.9 One study showed that families with a history of foodneglect had a greater risk of being rereported to the child protection services in a shorter time thanfamilies without food neglect.87
Academic outcomesThirteen studies examined the relationship between FI and children’s academic performance.12,19,26,39,54,60,69,72,73,77,96,99,113 Eleven studies adjusted their analyses for explanatory or confounding variables (Table 9)12,19,26,39,54,60,69,72,77,96,113 and two did not (see Appendix 6).73,99 The outcomes more often assessed were readingand maths scores, school attendance and cognitive development. Most of the outcomes were self-reported,obtained through tests or teacher reported. One study assessed parent-reported outcomes.54
In summary, 5 out of the 11 studies that reported adjusted results showed some detrimental effects ofFI on children’s academic outcomes, such as lower intelligence quotient (IQ) scores,19 lower reading ormaths scores,96 lower school attendance54,60 and dropping out of high school more frequently.77 Threestudies found no effects of FI on academic outcomes.26,69,113 One study that used data from the ECLSfound that FI worked indirectly through depression and parenting practices to influence mental proficiencyin toddlerhood.72 A longitudinal study found negligible impacts of FI transitions on academic outcomes infirst grade once child and family characteristics were taken into account.39 By contrast, another longitudinalstudy found that FI was associated with developmental outcomes and that the association differedby sex.12
Research question 4: what interventions exist to reduce, eliminate ormitigate the effects of child food insecurity in high-income countries?
Fifteen studies assessed the effects of interventions, programmes or food aids designed to eliminate,reduce or mitigate the effects of child FI.26,50,71,74,78,83,98,115–122 Fourteen studies were conducted in the USAand evaluated federal programmes of food aid,26,50,71,74,78,83,98,115–121 and one study, a 1-year stepped-wedgecluster RCT, was conducted in New Zealand.122
RESULTS
NIHR Journals Library www.journalslibrary.nihr.ac.uk
38

TABLE 8 Results of the 14 studies that investigated the association between FI and children’s social well-being and adjusted their analyses for explanatory orconfounding variables
Study authors,year of publicationand country Outcome(s) measured Measurement tools
Number ofparticipants Summary of results
Main explanatory orconfounding variablesconsidered
Molcho et al. 2007,Ireland106
Life satisfaction andhappiness
Self-reported datathrough the HBSCSurvey
8424 adolescents Boys and girls reporting food poverty were 2.1times and 2.2 times, respectively, more likely toreport low life satisfaction (p< 0.05) and 50%and 60%, respectively, less likely to report thatthey felt happy about their life (p< 0.05) thantheir food-secure counterparts
Age and social class(according to the father’soccupation)
Pickett et al. 2015,Canada76
Frequency of physicalfighting and talking backto teachers (as a measureof social delinquency)
Self-reported datathrough the HBSCSurvey
25,912 students Those reporting hunger ‘sometimes’ were 1.3times more likely to self-report frequent physicalfighting (p< 0.05), and those reporting hunger‘often or always’ were 1.8 times more likely toself-report frequent physical fighting (p< 0.05)than those who ‘never’ experienced hunger.In addition, those reporting hunger ‘sometimes’or ‘often or always’ were 40% and 60%,respectively, less likely to report internalised-positive feelings than those who ‘never’experienced hunger (p < 0.05)
Child, parent, householdand sociodemographiccharacteristics and foodassistance programmescharacteristics
Baer et al. 2015,USA77
Housing problems(e.g. homelessness, utilitiesshut off) and substanceuse problems
Self-reported datathrough ‘The OnlineAdvocate’ survey
400 adolescents andyoung adults
Those reporting low FS or very low FS werefrom 3.1 (95% CI 1.8 to 5.5) to 3.3 (95% CI1.8 to 6.0) times more likely to report housingissues (p < 0.001). Those reporting very low FSwere 4.5 (95% CI 2.3 to 9.2) times more likelyto report substance use problems (p < 0.001)
Age, sex and ethnicity
Casey et al. 2005,USA8
QoL Self-reported throughthe Paediatric Qualityof Life Initiative
399 children Children in households reporting FI recordedsignificantly lower psychosocial function(p = 0.017), physical function (p= 0.006) andtotal QoL score (p = 0.005) than children infood-secure households. The results differedby age group, with the youngest children(3–8 years) reporting significantly inferiorphysical functioning (p= 0.001), and teenagers(12–17 years) living in food-insecure householdsscoring lower in psychosocial functioning(p = 0.007)
Age, sex and ethnicity
continued
DOI:10.3310/phr06130
PUBLIC
HEA
LTHRESEA
RCH2018
VOL.6
NO.13
©Queen
’sPrinter
andController
ofHMSO
2018.This
work
was
producedby
Aceves-M
artinset
al.under
theterm
sof
acom
missioning
contractissued
bythe
Secretaryof
Statefor
Health
andSocialC
are.This
issuemay
befreely
reproducedfor
thepurposes
ofprivate
researchand
studyand
extracts(or
indeed,the
fullreport)may
beincluded
inprofessionaljournals
providedthat
suitableacknow
ledgement
ismade
andthe
reproductionisnot
associatedwith
anyform
ofadvertising.
Applications
forcom
mercial
reproductionshould
beaddressed
to:NIHRJournals
Library,NationalInstitute
forHealth
Research,Evaluation,
Trialsand
StudiesCoordinating
Centre,
Alpha
House,
University
ofSoutham
ptonScience
Park,Southam
ptonSO
167N
S,UK.
39

TABLE 8 Results of the 14 studies that investigated the association between FI and children’s social well-being and adjusted their analyses for explanatory or confoundingvariables (continued )
Study authors,year of publicationand country Outcome(s) measured Measurement tools
Number ofparticipants Summary of results
Main explanatory orconfounding variablesconsidered
Edwards and Taub2017, USA84
Bullying (victimisation andperpetration)
Self-reported throughthe HBSC survey
12,642 adolescents Significant difference in bullying victimisation(p< 0.001) and bullying perpetration (p< 0.001)in food-insecure children (fifth to tenth grade)compared with their food-secure peers. Olderfood-insecure children (ninth to tenth grade)reported more bullying victimisation, andalso engaged in more bullying perpetration(p< 0.05). Students who reported FI, at leastoccasionally, experienced greater bullyingvictimisation than those who did not report FI(p< 0.008). In addition, more boys in the overallsample engaged in bullying perpetration thangirls (p< 0.05)
Grade, sex, FI level
Fram et al. 2015,USA114
Lifestyles Self-reported throughdietary recalls and aself-administeredphysical activitychecklist
3605 children FI was associated with higher calorieconsumption (p= 0.02), more fat (p = 0.04) andsugar (p= 0.05) intake, a diet that was lower invegetables (p = 0.02) and a variety of perceivedbarriers (e.g. feeling too tired) to exercising(p < 0.001)
Child characteristics
Howard 201190
(longitudinal study)Social skills Teachers’ reports on
social skills scores4710 children There was a significant (p< 0.05) negative
relationship between FI and children’s social skillscores. Children who experienced a transitionfrom FI in first grade to FS in third grade hadsignificantly lower social skill scores (p = 0.019).The association was significant among boys(p < 0.05) but not among girls (p= 0.56)
Child characteristics
Howard 201391
(longitudinal study)Dietary behaviours Self-reported fruit
and vegetablesconsumption
5670 children Food-insecure children reported a lower weeklyconsumption of fruit (p< 0.05) but a higheramount of carrots and potatoes (p < 0.05)than children with very low FS
Child and ecological factorsinfluencing consumption offruit and vegetables
RESULTS
NIHRJournals
Librarywww.journalslibrary.nihr.ac.uk
40

Study authors,year of publicationand country Outcome(s) measured Measurement tools
Number ofparticipants Summary of results
Main explanatory orconfounding variablesconsidered
Jackson and Vaughn2017, USA94
(longitudinal study)
Misconduct (i.e. fighting,bullying, stealing, cheating,lying, and defying/misbehaving)
Caregiver-reported 5323 adolescents Among boys, persistent exposure to FI duringchildhood was associated with greaterinvolvement in fighting/bullying (OR 1.7, 95% CI1.4 to 2.1), stealing (OR 1.7, 95% CI 1.3 to 2.2),cheating/lying (OR 1.4, 95% CI 1.2 to 1.6) anddefying/misbehaving (OR 1.3, 95% CI 1.1 to 1.5).Participating in multiple forms of misconduct was168% higher among boys exposed to persistentFI than among those who were raised inconsistently food-secure households. Theseresults were not significant in girls
Adolescent, parent,household andneighbourhoodcharacteristics
Helton 2016, USA87 Rereport to childprotection services
Caseworker reports 3580 families withchildren
12% of families with food-neglected childrenwere rereported to child protection services,compared with 8% of families without food-neglected children. Food neglect predicted agreater risk of rereport (HR 3.0) than of otherforms of maltreatment (p< 0.05)
Maltreatment types,caregiver mental healthproblems, and covariates
Jyoti et al. 2005,USA11 (longitudinalstudy)
Social skills and behaviours Children’s andteachers’ reports inthe ECLS-K study
Approximately 21,000children
Children from food-insecure households atkindergarten demonstrated a 0.08-point greaterdecline in social skills score than children fromfood-secure households (p< 0.05). Associationbetween kindergarten FI and change in socialskills was significant for boys only (p< 0.001).Transitioning from food insecure to food securewas associated with a greater increase in socialskills for girls (p < 0.001) and a smaller increasein social skills for boys (p< 0.038). Becomingfood insecure was associated with a greaterdecline in social skills among girls (p < 0.005)but greater improvement in social skills for boys(p < 0.050)
Time varying and time-invariant for child, parentand neighbourhoodhousehold characteristics
continued
DOI:10.3310/phr06130
PUBLIC
HEA
LTHRESEA
RCH2018
VOL.6
NO.13
©Queen
’sPrinter
andController
ofHMSO
2018.This
work
was
producedby
Aceves-M
artinset
al.under
theterm
sof
acom
missioning
contractissued
bythe
Secretaryof
Statefor
Health
andSocialC
are.This
issuemay
befreely
reproducedfor
thepurposes
ofprivate
researchand
studyand
extracts(or
indeed,the
fullreport)may
beincluded
inprofessionaljournals
providedthat
suitableacknow
ledgement
ismade
andthe
reproductionisnot
associatedwith
anyform
ofadvertising.
Applications
forcom
mercial
reproductionshould
beaddressed
to:NIHRJournals
Library,NationalInstitute
forHealth
Research,Evaluation,
Trialsand
StudiesCoordinating
Centre,
Alpha
House,
University
ofSoutham
ptonScience
Park,Southam
ptonSO
167N
S,UK.
41

TABLE 8 Results of the 14 studies that investigated the association between FI and children’s social well-being and adjusted their analyses for explanatory or confoundingvariables (continued )
Study authors,year of publicationand country Outcome(s) measured Measurement tools
Number ofparticipants Summary of results
Main explanatory orconfounding variablesconsidered
Rossen andKobernik 2016,USA58
Dietary behaviours Caregivers’ completerecalls for < 6-year-olds;6- to 11-year-oldscompleted the recallswith assistance; and≥ 12-year-oldsself-reported
5136 children Children experiencing very low FS consumedfewer whole grains (p> 0.05), more solid fats(p > 0.05) and more added sugars (p> 0.05)than their food-secure counterparts. However,FI was mostly not associated with dietary intake(p > 0.05)
Child characteristics
Sharkey et al. 2012,USA107
Dietary behaviours Self-reported 24 hours’dietary recall
50 children Very low FS was associated with greater intakesof total energy (p < 0.05), calcium (p < 0.05)and percentage of calories from added sugar(p < 0.001)
Child characteristics
To et al. 2014,USA110
Physical activity Self-reported throughquestionnaire andaccelerometer
2261 children andadolescents
Food-insecure children registered less moderateto vigorous physical activity than food-securechildren (coefficient 25.24; p= 0.02). However,FI was not related with adherence to physicalactivity guidelines or time spent doing sedentaryactivities (p> 0.05)
Child and householdcharacteristics
CI, confidence interval; ECLS-K, Early Childhood Longitudinal Study – Kindergarten cohort; HR, hazard ratio; NSLP, National School Lunch Program; OR, odds ratio; RR, risk ratio;SNAP, Supplemental Nutrition Assistance Program (USA).
RESULTS
NIHRJournals
Librarywww.journalslibrary.nihr.ac.uk
42

TABLE 9 Results of the 11 studies that investigated the association between child FI and academic outcomes and adjusted their analyses for explanatory or confounding variables
Study authors,year of publicationand country Outcome(s) measured Measurement tools
Number ofparticipants Summary of results
Main explanatory orconfounding variablesconsidered
Belsky et al. 2010,UK19
Cognitive development,IQ score
Self-reported throughWechsler IntelligenceScale for Children
2125 school-agedchildren
Children in food-insecure households hadsignificantly lower IQs and higher levels ofbehavioural and emotional problems than theirfood-secure counterparts (p< 0.001). FIpredicted lower child IQ, but once householdincome was added to the model, theassociation was no longer significant
Household income andnonmaterial householdcharacteristics
Baer et al. 2015,USA77
Educational problems Self-reported datathrough ‘The OnlineAdvocate’ survey
400 children and youngpeople
FI was linked to educational problems such asunmet learning disability and dropping out ofhigh school (low FS: OR 2.4, 95% CI 1.1 to 5.3;p= 0.03; very low FS: OR 3.9, 95% CI 1.8 to8.4; p< 0.01)
Age, sex and ethnicity
Dunifon andKowaleski-Jones,2003, USA26
Childhood activities, schoolattendance, performanceof schoolwork
Self-reported throughWoodcock–JohnsonPsycho-EducationalBattery
3500 school-agedchildren enrolled inthe NSLP
Significant association between FI and children’sacademic scores (p> 0.05). Students receivingfood aids (NSLP) had lower maths scores thanthose who did not receive food aids
Householdsociodemographiccharacteristics
Johnson andMarkowitz 2017,USA96 (longitudinalstudy)
Children’s kindergartenreading and mathsoutcomes
Children’s teachers’reports in the ECLS-Kstudy
Approximately3700 children
Negative associations between earlier FI(at 9 months and 2 years) and school outcomes.Very low FI at 9 months was linked to reducedreading scores (p= 0.03) while low FS at9 months was associated with decreased mathsscores (p= 0.03); very low FI at 2 years wasassociated with decreased approaches tolearning (p= 0.04) and reduced maths skills(p = 0.03). In general, as the intensity of FIincreased across early childhood, so too didnegative associations with outcomes
Sociodemographic andhousehold economicvariables
Jyoti et al. 2005,USA11 (longitudinalstudy)
Academic achievement(reading and maths scores)
Children’s teachers’reports in the ECLS-Kstudy
Approximately13,500 children
Negative association between kindergarten FIand change in maths score was significant onlyfor girls (β –1.8; p< 0.017). Children fromhouseholds transitioning from FS to FI showeda smaller increase in reading (p= 0.0007) andmaths scores (p< 0.005) than children fromhouseholds who remained food secure. Thesedifferences were significant regardless of sex
Child and householdcharacteristics
continued
DOI:10.3310/phr06130
PUBLIC
HEA
LTHRESEA
RCH2018
VOL.6
NO.13
©Queen
’sPrinter
andController
ofHMSO
2018.This
work
was
producedby
Aceves-M
artinset
al.under
theterm
sof
acom
missioning
contractissued
bythe
Secretaryof
Statefor
Health
andSocialC
are.This
issuemay
befreely
reproducedfor
thepurposes
ofprivate
researchand
studyand
extracts(or
indeed,the
fullreport)may
beincluded
inprofessionaljournals
providedthat
suitableacknow
ledgement
ismade
andthe
reproductionisnot
associatedwith
anyform
ofadvertising.
Applications
forcom
mercial
reproductionshould
beaddressed
to:NIHRJournals
Library,NationalInstitute
forHealth
Research,Evaluation,
Trialsand
StudiesCoordinating
Centre,
Alpha
House,
University
ofSoutham
ptonScience
Park,Southam
ptonSO
167N
S,UK.
43

TABLE 9 Results of the 11 studies that investigated the association between child FI and academic outcomes and adjusted their analyses for explanatory or confounding variables(continued )
Study authors,year of publicationand country Outcome(s) measured Measurement tools
Number ofparticipants Summary of results
Main explanatory orconfounding variablesconsidered
Kimbro et al. 2015,USA39 (longitudinalstudy)
Academic achievement(reading, maths andscience scores)
Children’s teachers’reports in the ECLS-Kstudy
6300 children Children who were food insecure at firstgrade did had significantly lower academicachievement scores in reading, maths andscience than children who were food secure,and those who were food insecure at bothkindergarten and first grade scored lowest onall three measures. However, when the analyseswere adjusted for relevant covariates, nosignificant association was found between FItransitions (into and out of FI) and children’sacademic achievement outcomes
Child and householdcharacteristics (includingfamily structure, householdincome, parental employmentstatus, occupational prestige,education and the number ofsiblings in the household)
Shanafelt et al.2016, USA60
School attendance School records fromparticipants of the USBreakFAST Project
904 children Food-insecure students were more likely tohave a lower cumulative attendance,grade-point average (p< 0.01) and be in alower grade-point percentile than their food-secure counterparts (p< 0.01). Food-insecureadolescents were more likely to show a lowerattendance rate than food-secure adolescents(p < 0.01), but this was no longer statisticallysignificant after adjustment (p = 0.15)
Grade level, sex, free andreduced-price lunch status,ethnicity and weightcategories
Winicki and Jemison2003, USA113
Academic achievement(reading and maths scores)
Children’s teachers’report in the ECLS-Kstudy
21,260 children Negative effect of FI on maths scores and onlearning (p< 0.05). However, for children ator below 150% of the federal poverty level,the FI measures did not explain maths scores orlearning
Explanatory variables thatwere indicators of increasinglysevere levels of FI
Weinreb et al. 2002,USA69
Academic scores,developmental delay,learning disabilities, repeatof a school year or missingdays in school
Self-reported throughthe Wechsler IndividualAchievement TestScreener
180 preschool-agedchildren and 228school-aged children
Compared with preschool and school-agedchildren who were moderately or not hungry,those who experienced severe hunger showedpoorer academic scores, developmental delayand learning disabilities, and were likely torepeat a school year or miss days in school.However, these differences were not statisticallysignificant (p > 0.05)
Housing status
RESULTS
NIHRJournals
Librarywww.journalslibrary.nihr.ac.uk
44

Study authors,year of publicationand country Outcome(s) measured Measurement tools
Number ofparticipants Summary of results
Main explanatory orconfounding variablesconsidered
Zaslow et al. 2009,USA72 (longitudinalstudy)
Children’s cognitivedevelopment
Children’s teachers’reports in the ECLS-B
8944 children No direct effect of FI on children’s cognitivedevelopment (p> 0.05). Higher levels of FIworked indirectly through depression andparenting practices to influence mentalproficiency in toddlerhood. High levels of FIwere positively associated with depression(β 0.180). In turn, depression was negativelyassociated with more positive parentingpractices (β –0.033), and positive parentingpractices were positively associated with mentalproficiency at 24 months (β 0.081; p < 0.001)
Child, parent and householdsociodemographiccharacteristics
Ramsey et al. 2011,Australia54
Days away from schooldue to illness
Caregiver reported 185 households withchildren aged 3–17 years
Children who were living in food-insecurehouseholds were 3.5 times more likely to havedays away from school because of illness (OR3.5, 95% CI 1.4 to 8.5; p< 0.05) and 5.4 timesmore likely of having to cut down on activitiesbecause of illness (OR 5.4, 95% CI 1.4 to 20.1;p< 0.05)
Household income
BreakFAST, Fuelling Academics and Strengthening Teens; CI, confidence interval; ECLS-K, Early Childhood Longitudinal Study – Kindergarten cohort; NSLP, National School Lunch Program;OR, odds ratio; RR, risk ratio; SNAP, Supplemental Nutrition Assistance Program (USA).
DOI:10.3310/phr06130
PUBLIC
HEA
LTHRESEA
RCH2018
VOL.6
NO.13
©Queen
’sPrinter
andController
ofHMSO
2018.This
work
was
producedby
Aceves-M
artinset
al.under
theterm
sof
acom
missioning
contractissued
bythe
Secretaryof
Statefor
Health
andSocialC
are.This
issuemay
befreely
reproducedfor
thepurposes
ofprivate
researchand
studyand
extracts(or
indeed,the
fullreport)may
beincluded
inprofessionaljournals
providedthat
suitableacknow
ledgement
ismade
andthe
reproductionisnot
associatedwith
anyform
ofadvertising.
Applications
forcom
mercial
reproductionshould
beaddressed
to:NIHRJournals
Library,NationalInstitute
forHealth
Research,Evaluation,
Trialsand
StudiesCoordinating
Centre,
Alpha
House,
University
ofSoutham
ptonScience
Park,Southam
ptonSO
167N
S,UK.
45

Of the included studies, six evaluated school-based food provision programmes,26,50,98,117,118,122 six evaluatednutrition assistance federal programmes,74,78,83,115,116,121 two evaluated programmes that provide an extramoney during the summer holidays,119,120 and another evaluated a nutrition assistance federal programmeand informal/community food support, such as food pantries, Meals on Wheels and soup kitchens.71
The characteristics of these food aid programmes are summarised in Table 10 and further information isreported in Appendix 8. Among the qualitative studies identified for RQ 1, the study by Harvey-Goldinget al.31 reports qualitative information on the perspective of senior stakeholders involved in the UKUniversal School Breakfast Programme and is summarised below.
In summary, studies varied in terms of the characteristics of the interventions/food aid programmes assessed,characteristics of the sample population, setting and range of outcomes assessed. There is some evidencethat food assistance programmes, which provide benefits to low-income households with school-agedchildren, may improve children’s FS;50,120 reduce, but not eliminate, the effects of FI on poor health;83,116
and promote children’s healthier eating patterns with increased consumption of fruit and vegetables anddairy products.119,121 Nevertheless, one of the studies pointed out that even with food coupons, it may bechallenging for families to buy fresh food (e.g. fruit and vegetables).115 It is worth noting that although foodassistance programmes may improve children’s FS, the impact on FI may vary according to the type and levelof benefits50,120 and the rate of utilisation of food support and may be different in different ethnic groups.71
A cluster RCT showed that free school breakfast programmes may have had positive effects in reducingchildren’s short-term hunger but did not have an impact on children’s school attendance and academicperformance.122
Other findings (qualitative data)Some of the studies included in this rapid review that evaluated food assistance programmes providedqualitative information on some specific aspects of the programmes. Harvey-Golding et al.,31 for example,investigated the beliefs, views and attitudes among key stakeholders served by a council-wide universalfree school breakfast (UFSB) initiative in the north-west of England. A sample of 19 stakeholders (schoolstaff and local authorities) were recruited from three primary schools participating in the UFSB scheme totake part in semistructured interviews and small focus groups. They reported that the prevalent perceptionof the participants was that the UFSB programme contributed to the mitigation of FI in the community:‘I think it just takes the pressure off them and it just gives them the knowledge that the child is gonna cometo school, have something to eat to set them up for the day till lunch time’.31 Similarly, the programme wasconsidered an important feature for those parents experiencing working poverty and who were potentiallynot eligible for free school meals. Furthermore, senior level stakeholders (local authorities and primary schoolstaff) involved in the implementation of the programme, claimed that the programme could help teachersas well – considering that in many cases teachers ended up to buy food for children who came to schoolwithout eating at home. They also maintained that the programme was an opportunity for some children tohave a wider and healthier food choice as well as a way to increase their autonomy and independence. Ingeneral, the UFSB programme was perceived by senior school staff as a way of alleviating hunger amongchildren in schools. Before the start of the UFSB programme, staff reported that some children consumedhigh-calorie/low-nutrition snack foods and beverages in school, such as crisps and carbonated drinks. Thesebehaviours changed after the programme started: ‘I have not seen in months, children walking to schooleating junk. I did see that before breakfast came along’. In addition, parents were less likely to providechildren with money to buy breakfast as they were receiving something of nutritional value at school.31
Some senior staff felt that the programme had the potential to improve punctuality because children weremore likely to arrive on time, owing to the appeal of a free breakfast: ‘I am aware that kids now get toschool earlier than what they did’, ‘Where the parents are not feeding them they know that they are goingto be fed’.31 Following the introduction of the UFSB programme, children were more alert and less likely tolose concentration in class. The programme was also assumed to provide children with opportunities tointeract with their peers and staff while eating breakfast. In addition, senior school staff considered that theprogramme was effective in reducing children’s anxieties about being hungry and, therefore, was beneficialfor learning. Likewise, school breakfast was considered to have a positive impact on the school environment,providing a calm and positive start to the school day.31
RESULTS
NIHR Journals Library www.journalslibrary.nihr.ac.uk
46
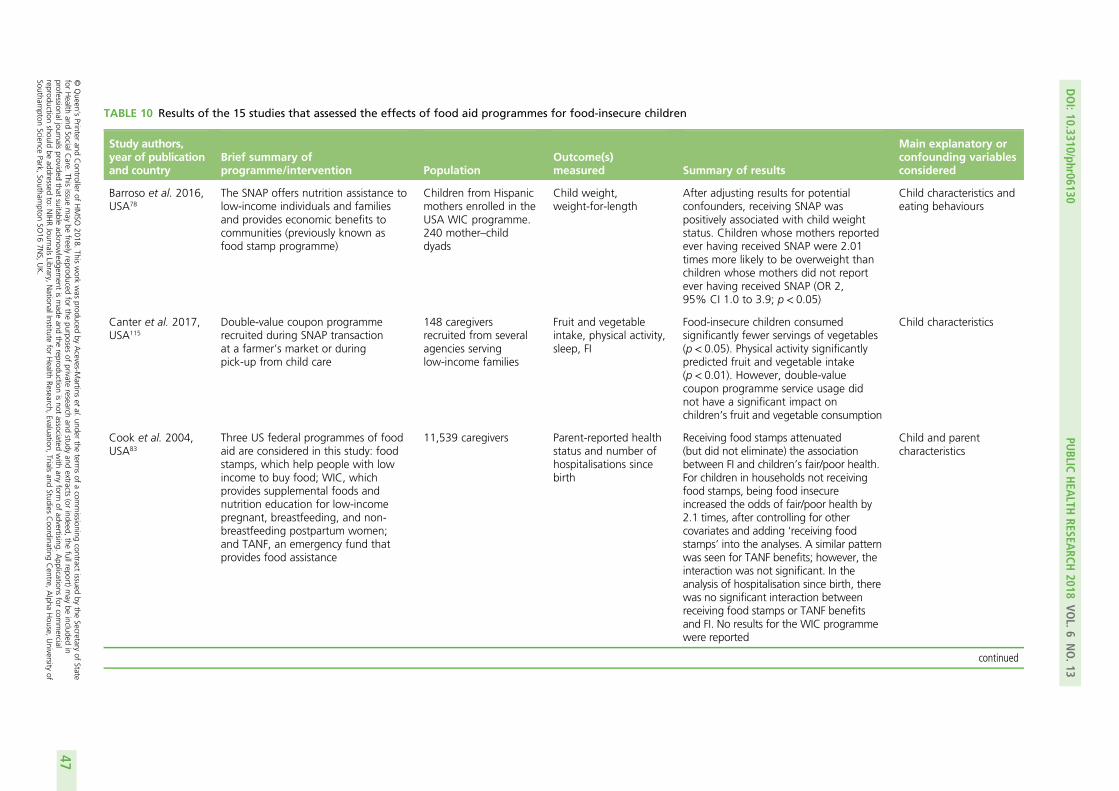
TABLE 10 Results of the 15 studies that assessed the effects of food aid programmes for food-insecure children
Study authors,year of publicationand country
Brief summary ofprogramme/intervention Population
Outcome(s)measured Summary of results
Main explanatory orconfounding variablesconsidered
Barroso et al. 2016,USA78
The SNAP offers nutrition assistance tolow-income individuals and familiesand provides economic benefits tocommunities (previously known asfood stamp programme)
Children from Hispanicmothers enrolled in theUSA WIC programme.240 mother–childdyads
Child weight,weight-for-length
After adjusting results for potentialconfounders, receiving SNAP waspositively associated with child weightstatus. Children whose mothers reportedever having received SNAP were 2.01times more likely to be overweight thanchildren whose mothers did not reportever having received SNAP (OR 2,95% CI 1.0 to 3.9; p< 0.05)
Child characteristics andeating behaviours
Canter et al. 2017,USA115
Double-value coupon programmerecruited during SNAP transactionat a farmer’s market or duringpick-up from child care
148 caregiversrecruited from severalagencies servinglow-income families
Fruit and vegetableintake, physical activity,sleep, FI
Food-insecure children consumedsignificantly fewer servings of vegetables(p< 0.05). Physical activity significantlypredicted fruit and vegetable intake(p< 0.01). However, double-valuecoupon programme service usage didnot have a significant impact onchildren’s fruit and vegetable consumption
Child characteristics
Cook et al. 2004,USA83
Three US federal programmes of foodaid are considered in this study: foodstamps, which help people with lowincome to buy food; WIC, whichprovides supplemental foods andnutrition education for low-incomepregnant, breastfeeding, and non-breastfeeding postpartum women;and TANF, an emergency fund thatprovides food assistance
11,539 caregivers Parent-reported healthstatus and number ofhospitalisations sincebirth
Receiving food stamps attenuated(but did not eliminate) the associationbetween FI and children’s fair/poor health.For children in households not receivingfood stamps, being food insecureincreased the odds of fair/poor health by2.1 times, after controlling for othercovariates and adding ‘receiving foodstamps’ into the analyses. A similar patternwas seen for TANF benefits; however, theinteraction was not significant. In theanalysis of hospitalisation since birth, therewas no significant interaction betweenreceiving food stamps or TANF benefitsand FI. No results for the WIC programmewere reported
Child and parentcharacteristics
continued
DOI:10.3310/phr06130
PUBLIC
HEA
LTHRESEA
RCH2018
VOL.6
NO.13
©Queen
’sPrinter
andController
ofHMSO
2018.This
work
was
producedby
Aceves-M
artinset
al.under
theterm
sof
acom
missioning
contractissued
bythe
Secretaryof
Statefor
Health
andSocialC
are.This
issuemay
befreely
reproducedfor
thepurposes
ofprivate
researchand
studyand
extracts(or
indeed,the
fullreport)may
beincluded
inprofessionaljournals
providedthat
suitableacknow
ledgement
ismade
andthe
reproductionisnot
associatedwith
anyform
ofadvertising.
Applications
forcom
mercial
reproductionshould
beaddressed
to:NIHRJournals
Library,NationalInstitute
forHealth
Research,Evaluation,
Trialsand
StudiesCoordinating
Centre,
Alpha
House,
University
ofSoutham
ptonScience
Park,Southam
ptonSO
167N
S,UK.
47

TABLE 10 Results of the 15 studies that assessed the effects of food aid programmes for food-insecure children (continued )
Study authors,year of publicationand country
Brief summary ofprogramme/intervention Population
Outcome(s)measured Summary of results
Main explanatory orconfounding variablesconsidered
Cook et al. 2006,USA116
The food stamps programme is afood-purchasing assistance initiativefor low- and no-income people acrossthe USA (later renamed as SNAP)developed by the US FederalGovernment, which funds a variety ofservices to help low-income familieswith children
17,158 caregivers ofchildren aged ≤ 3 years
Parent-reported healthstatus and number ofhospitalisations sincebirth
Children in food stamps programmeparticipating households that wereclassified as households with child FI hadlower odds of fair/poor health (OR 1.7,95% CI 1.3 to 2.2) than children insimilar households not participating inthe food stamps programme (OR 2.1,95% CI 1.8 to 2.5). Participation in foodstamps programme reduced the oddsof fair/poor health by 24% and 42%in food-insecure households andhouseholds with child FI, respectively
Child and parentcharacteristics
Dunifon andKowaleski-Jones2003, USA26
The NSLP is a federal nutritionprogramme that provides nutritiousfoods to school-aged children.Families according to their income areeligible for free or reduced-price NSLPlunches
≈3500 children Health limitations,behavioural problems,and academicachievement
Participating in the NSLP was foundto be associated with increasedexternalising behaviour (p< 0.05), an82% increase in the odds of having ahealth limitation (p< 0.05), and lowermaths scores (p< 0.05). An increase in FIwas associated with decreased level ofpositive behaviours and increased oddsof health limitations
Child, parent andhousehold characteristics
Ecker and Sifers2013, USA118
(non-randomisedcomparative study)
The BackPack Food Program is aweekend food programme that aimsto reduce hunger among school-agedchildren through the distribution ofeasy-to-prepare food in children’sbackpacks every Friday or the last dayof school prior to a long weekend
1380 children fromthree schools with thehighest percentage ofstudents receiving freeand reduced lunches inthe Midwest of USA
Hunger and children’sbehaviours
Direct observations of on-task behaviourwere recorded for 52 students. Overall,there was not a significant increase instudents’ on-task behaviour (p= 0.19)or a significant decrease in students’self-reported hunger levels (p= 0.54).Almost all parents (98%) reported thatthe programme benefited their family,and made a difference to the well-beingof their child
Unadjusted
RESULTS
NIHRJournals
Librarywww.journalslibrary.nihr.ac.uk
48

Study authors,year of publicationand country
Brief summary ofprogramme/intervention Population
Outcome(s)measured Summary of results
Main explanatory orconfounding variablesconsidered
Gordon et al.2017, USA119
(non-randomisedcomparative study)
The SEBTC was a programme inwhich low-income households withchildren eligible for free or reduced-price meals received benefits perschool-aged child per summer month(about US$60). Benefits weredelivered through an electronicbenefit transfers cards that could beused to purchase food via existingprogrammes such as SNAP or WICsystem
Approximately 67,000children from around42,000 householdswere involved in theSEBTC
Parent-reported FSand dietary quality
Average rates of very low FS amongchildren in the no-benefit group werehigher than those in the benefit group(p< 0.001). In general, the SEBTCprogramme significantly improvedchildren’s healthier eating, withincreased consumption of fruits andvegetables, whole grains and dairyproducts and reduced consumption ofsugar sweetened beverages (p< 0.001) –with the exception of sugar-sweetenedbeverages in SNAP households
Differences in populationsacross sites, parentand demographiccharacteristics
Khan et al. 2011,USA98
Free school breakfast available to allschool children in a school in Vermont
373 children Self-reported FS The majority of surveyed children wereclassified as food secure (79.6%), 15.8%were classified as food insecure withouthunger, and 4.6% were classified asfood insecure with hunger. A statisticallysignificant relationship between FS andeating breakfast at home was found.Children who were food insecure (withor without hunger) were less likely to eatbreakfast at home than children whowere food secure (67.1% vs. 81.4%;p= 0.007)
Unadjusted
Kleinman et al.2002, USA117
(non-randomisedcomparative study)
A USBP in the Boston Public Schools 97 children; inner-city students ingrades 4 to 6
Child nutritional riskstatus, hunger,psychosocialfunctioning andacademic performance
Children whose nutritional statusimproved recorded significantly largerincreases in school breakfastparticipation than children whosenutritional status stayed the same orworsened (p< 0.001). For those whoimproved their nutritional intake,significant improvements were recordedin functioning (p< 0.01) and mathsgrades (p< 0.05), as well as a significantdecrease in the number of days awayfrom school (p< 0.001)
Unadjusted
continued
DOI:10.3310/phr06130
PUBLIC
HEA
LTHRESEA
RCH2018
VOL.6
NO.13
©Queen
’sPrinter
andController
ofHMSO
2018.This
work
was
producedby
Aceves-M
artinset
al.under
theterm
sof
acom
missioning
contractissued
bythe
Secretaryof
Statefor
Health
andSocialC
are.This
issuemay
befreely
reproducedfor
thepurposes
ofprivate
researchand
studyand
extracts(or
indeed,the
fullreport)may
beincluded
inprofessionaljournals
providedthat
suitableacknow
ledgement
ismade
andthe
reproductionisnot
associatedwith
anyform
ofadvertising.
Applications
forcom
mercial
reproductionshould
beaddressed
to:NIHRJournals
Library,NationalInstitute
forHealth
Research,Evaluation,
Trialsand
StudiesCoordinating
Centre,
Alpha
House,
University
ofSoutham
ptonScience
Park,Southam
ptonSO
167N
S,UK.
49

TABLE 10 Results of the 15 studies that assessed the effects of food aid programmes for food-insecure children (continued )
Study authors,year of publicationand country
Brief summary ofprogramme/intervention Population
Outcome(s)measured Summary of results
Main explanatory orconfounding variablesconsidered
Klerman et al.2017, USA120
(non-randomisedcomparative study)
SEBTC programme in 16 US sitesbetween 2011 and 2013. Authorsperformed a random-assignmentevaluation where benefit amounts,participating sites, details of theintervention, and households samplesize varied across geographicalregions. In 2011 and 2012,households were assigned to a SEBTCbenefit group (US$60 per school-agedchild per month) or to a zero-benefitcontrol group. In 2013, to test thedifferential impact of benefits – US$60relative to US$30 – all randomisedhouseholds were issued the someSEBTC benefits (either US$60 orUS$30 per school-aged child permonth) with no zero-benefit controlgroup. The benefit amounts weregiven through SNAP or WIC sites
Summer surveyn = 48,449; springsurvey n= 41,793households
Parent-reported FS SEBTC improved children’s FS in bothSNAP and WIC sites. A US$30 SEBTCbenefit per child improved FS (p < 0.01)but generally had a smaller impact thanthe US$60 benefit (p< 0.01). Afteradjusting the analyses for householdcharacteristics, the authors reportedsignificant variations in the impact of theUS$60 monthly benefits compared withno benefits
FI status; adolescent,household and schoolcharacteristics
Kohn et al. 2014,USA74
SNAP and WIC benefits. School mealparticipation was defined as the childeating free or reduced-price schoolbreakfast and/or school lunch at leastonce a week during the school year
1321 young people Weight status Prevalence of overweight and obesitywas not significantly different forchildren participating in foodprogrammes compared with non-participating children. Among low-income, food-insecure children, foodassistance participation was notassociated with BMI scores, high waistcircumference or weight status for anyspecification of food assistance (adjustedanalyses). However, analyses by sexshowed that low-income, food-securegirls participating in food assistanceprogrammes (SNAP or WIC) other thanschool meals alone had higher BMI score(β 0.4, 95% CI 0.1 to 0.7) and greaterrisk of high waist circumference (OR 2.2,95% CI 1.0 to 4.6)
Child and parentcharacteristics
RESULTS
NIHRJournals
Librarywww.journalslibrary.nihr.ac.uk
50
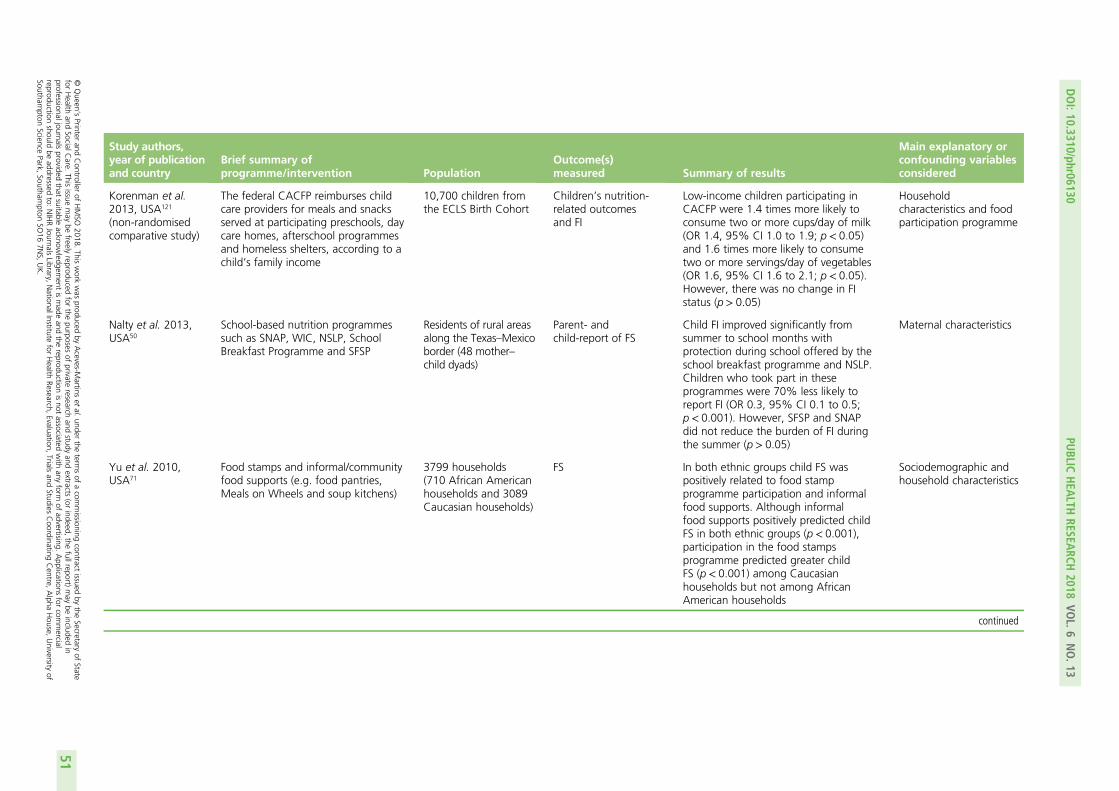
Study authors,year of publicationand country
Brief summary ofprogramme/intervention Population
Outcome(s)measured Summary of results
Main explanatory orconfounding variablesconsidered
Korenman et al.2013, USA121
(non-randomisedcomparative study)
The federal CACFP reimburses childcare providers for meals and snacksserved at participating preschools, daycare homes, afterschool programmesand homeless shelters, according to achild’s family income
10,700 children fromthe ECLS Birth Cohort
Children’s nutrition-related outcomesand FI
Low-income children participating inCACFP were 1.4 times more likely toconsume two or more cups/day of milk(OR 1.4, 95% CI 1.0 to 1.9; p< 0.05)and 1.6 times more likely to consumetwo or more servings/day of vegetables(OR 1.6, 95% CI 1.6 to 2.1; p< 0.05).However, there was no change in FIstatus (p> 0.05)
Householdcharacteristics and foodparticipation programme
Nalty et al. 2013,USA50
School-based nutrition programmessuch as SNAP, WIC, NSLP, SchoolBreakfast Programme and SFSP
Residents of rural areasalong the Texas–Mexicoborder (48 mother–child dyads)
Parent- andchild-report of FS
Child FI improved significantly fromsummer to school months withprotection during school offered by theschool breakfast programme and NSLP.Children who took part in theseprogrammes were 70% less likely toreport FI (OR 0.3, 95% CI 0.1 to 0.5;p< 0.001). However, SFSP and SNAPdid not reduce the burden of FI duringthe summer (p > 0.05)
Maternal characteristics
Yu et al. 2010,USA71
Food stamps and informal/communityfood supports (e.g. food pantries,Meals on Wheels and soup kitchens)
3799 households(710 African Americanhouseholds and 3089Caucasian households)
FS In both ethnic groups child FS waspositively related to food stampprogramme participation and informalfood supports. Although informalfood supports positively predicted childFS in both ethnic groups (p< 0.001),participation in the food stampsprogramme predicted greater childFS (p< 0.001) among Caucasianhouseholds but not among AfricanAmerican households
Sociodemographic andhousehold characteristics
continued
DOI:10.3310/phr06130
PUBLIC
HEA
LTHRESEA
RCH2018
VOL.6
NO.13
©Queen
’sPrinter
andController
ofHMSO
2018.This
work
was
producedby
Aceves-M
artinset
al.under
theterm
sof
acom
missioning
contractissued
bythe
Secretaryof
Statefor
Health
andSocialC
are.This
issuemay
befreely
reproducedfor
thepurposes
ofprivate
researchand
studyand
extracts(or
indeed,the
fullreport)may
beincluded
inprofessionaljournals
providedthat
suitableacknow
ledgement
ismade
andthe
reproductionisnot
associatedwith
anyform
ofadvertising.
Applications
forcom
mercial
reproductionshould
beaddressed
to:NIHRJournals
Library,NationalInstitute
forHealth
Research,Evaluation,
Trialsand
StudiesCoordinating
Centre,
Alpha
House,
University
ofSoutham
ptonScience
Park,Southam
ptonSO
167N
S,UK.
51

TABLE 10 Results of the 15 studies that assessed the effects of food aid programmes for food-insecure children (continued )
Study authors,year of publicationand country
Brief summary ofprogramme/intervention Population
Outcome(s)measured Summary of results
Main explanatory orconfounding variablesconsidered
Mhurchu et al.2013,New Zealand122
(cluster RCT)
1-year, stepped-wedge, cluster RCTin low-SES schools to investigatethe effects of a free daily SBP
424 children School attendance andacademic achievement
Significant decrease in children’sself-reported hunger (p< 0.001).No significant effects of the SBP onchildren’s school attendance (p> 0.05)and academic achievements
Child characteristics
CACFP, Child and Adult Care Food Program; CI, confidence interval; ECLS-B, Early Childhood Longitudinal Study – Birth cohort; NSLP, National School Lunch Program; OR, odds ratio;RR, risk ratio; SBP, School Breakfast Programme; SEBTC, Summer Electronic Benefit Transfer for Children; SFSP, Summer Food Service Program; SNAP, Supplemental Nutrition AssistanceProgram (USA); TANF, Temporary Assistance to Needy Families; USBP, US universal-free school breakfast programme; WIC, Special Supplemental Nutrition Program for Women, Infantsand Children.
RESULTS
NIHRJournals
Librarywww.journalslibrary.nihr.ac.uk
52

Local authorities and schools staff were aware of the potential negative impact of the UFSB programme onchildren’s health, such as encouraging overeating and increasing obesity levels: ‘There is some concernthat maybe some children are double eating in the morning’.31 It was perceived that a small minority ofchildren, perhaps from more affluent areas of the community, were eating breakfast twice, at home and atschool: ‘If they are getting an unhealthy breakfast at home in the more affluent families, and then gettinga healthy one at school it is still adding calories’.31 To prevent potentially unwanted impacts of consumingbreakfast twice, it was considered that communication with parents needed to be improved as a matterof urgency: ‘We need to get the right message to parents that we will be providing breakfast for thosekids’.31 Moreover, other issues raised by the participants were problems related to high-sugar items at schooland concerns about obesity and dental health among children, because providing practical breakfast itemsthat were healthy and balanced in terms of nutrients proved difficult: ‘The handheld one does offer a realchallenge in getting a good variety of healthy items in there’ or ‘We used to have fruit juice on. That’s nowhad to come off. [. . .] It was public health, because it has an impact on dental health’ or ‘I was looking atone of the waffles, I’ve got the pack in front of me here and the, on the traffic light system they have nowon the packets, it’s red for fat, saturates and sugars [. . .]’.31
Although some senior school staff considered that the universal provision of the UFSB programme wasnecessary to remove barriers, maintain equality and eliminate stigma, others felt that a more targetedapproach would have had a greater impact and would save resources: ‘I mean it’s very expensive and I’dlike to think it was more targeted, rather than universal’.31
Research question 5: what is the cost-effectiveness of existinginterventions that aim to reduce, eliminate or mitigate the effects ofchild food insecurity in high-income countries?
None of the studies included in this rapid review evaluated the cost-effectiveness of interventionsdeveloped to reduce, eliminate or mitigate the effects of FI in children living in high-income countries.Similarly, there was no evidence from the grey literature to answer this RQ.
DOI: 10.3310/phr06130 PUBLIC HEALTH RESEARCH 2018 VOL. 6 NO. 13
© Queen’s Printer and Controller of HMSO 2018. This work was produced by Aceves-Martins et al. under the terms of a commissioning contract issued by the Secretary of Statefor Health and Social Care. This issue may be freely reproduced for the purposes of private research and study and extracts (or indeed, the full report) may be included inprofessional journals provided that suitable acknowledgement is made and the reproduction is not associated with any form of advertising. Applications for commercialreproduction should be addressed to: NIHR Journals Library, National Institute for Health Research, Evaluation, Trials and Studies Coordinating Centre, Alpha House, University ofSouthampton Science Park, Southampton SO16 7NS, UK.
53


Chapter 4 Summary of the grey literature
The main themes identified during scrutiny of the grey literature relating to child FI were breakfast clubs,holiday hunger, food banks, necessity of measurement of household FI, and the relationship between
obesity and FI in children.
Breakfast clubs
The 2017 Kellogg’s (Battle Creek, MI, USA) survey of secondary school teachers showed that 82% ofteachers witnessed teenagers arriving at school hungry every day and that 62% of school staff describedseeing children arriving at school hungry on a weekly basis.135,136
The proportion of schools, on average, that provide breakfast clubs is 85% in the UK, 72% in Scotlandand 96% in Wales. In England, provision ranges from 82% to 91%. In the UK, there are universal freeschool meals for infant-aged pupils (i.e. reception, years 1 and 2). In Scotland, all children in primary 1 toprimary 3 are eligible for free school meals.135,136
A Department for Education evaluation of breakfast clubs in schools with high levels of deprivationreported that around one-third to two-fifths of pupils attending breakfast clubs were eligible for freeschool meals.137 Kellogg’s also reported a correlation between the proportion of pupils eligible for freeschool meals and the proportion of schools with a breakfast club.136
A large proportion of secondary schools (79%) reported thinking that their breakfast club would have toclose, with school funding being main reason (86%), followed by the extra staff requirement (44%) andbreakfast club-specific funding cuts (39%). By contrast, 5% of primary and secondary school teachersthink that it is unlikely that their breakfast club will close. Around half of schools (54%) report that theirbreakfast club is operating below capacity.135,136
The Kellogg’s audit of school breakfast club provision in the UK reported that teachers believed thatbreakfast clubs make a substantial difference to pupils’ attendance and concentration in class and have alonger-term effect on examination results.135 In addition, 45% and 49% of schools said that their club hadimproved attendance and concentration, respectively. Overall, 15% of schools reported an improvement inexamination results, which they linked to their breakfast club.
A report by the Sheffield Political Economy Research Institute of children’s experiences of food and povertyshowed that peer-reviewed evidence on outcomes of breakfast club provision surrounding education,health, social inclusion and family life are extremely varied and far from conclusive.138 Several studies showedimprovements in some outcomes but not in others, and some outcomes showed declines. These findingsare reinforced (and partly informed) by the published studies of Shemilt et al.139 and Murphy et al.,140 whichshowed improvements in some outcomes (e.g. concentration, nutritional intake at breakfast time, skippingclasses) but no effect on others (e.g. skipping breakfast). Furthermore, one study reported ‘disbenefits’ in theform of negative behaviours.139
The Department for Education137 conducted a ‘semisystematic’ literature review of school breakfast clubsas part of its evaluation of breakfast clubs in schools with high levels of deprivation. Five out of the sixstudies identified by the Department for Education review were not relevant to the present rapid reviewbecause they did not assess child FI specifically. Nevertheless, for completeness and to complement thefindings of this rapid review their results are reproduced in Table 11. Full details of the sixth study122 arereported in section RQ 4 of this rapid review.
DOI: 10.3310/phr06130 PUBLIC HEALTH RESEARCH 2018 VOL. 6 NO. 13
© Queen’s Printer and Controller of HMSO 2018. This work was produced by Aceves-Martins et al. under the terms of a commissioning contract issued by the Secretary of Statefor Health and Social Care. This issue may be freely reproduced for the purposes of private research and study and extracts (or indeed, the full report) may be included inprofessional journals provided that suitable acknowledgement is made and the reproduction is not associated with any form of advertising. Applications for commercialreproduction should be addressed to: NIHR Journals Library, National Institute for Health Research, Evaluation, Trials and Studies Coordinating Centre, Alpha House, University ofSouthampton Science Park, Southampton SO16 7NS, UK.
55

TABLE 11 Summary of learning from the Department for Education’s literature review
Programme name Study designDescription ofprogramme
What was learnt about whatworks?
Welsh Government: schoolbreakfast clubs140
ClusterRCT+ process
Universal free breakfastprovision in Welshprimary schools. Held innine local authorityareas, covering 111schools
Better targeting of pupils who arenot eating breakfast at home isneeded. There was no reductionin breakfast skipping or classroombehaviour after introducingbreakfast clubs, generally becausethose who accessed breakfast atschool were those who wouldotherwise have eaten at home
School breakfast clubs, England139 Cluster RCT andobservationalanalysis
Breakfast clubs in30 schools with highdeprivation in England
It is hard to conduct RCTs in thissetting, given the lack of controlevaluators have over recruitment,eligibility checking andimplementation
Inadequate supervision could leadto clubs becoming boisterous ordisruptive
The evaluation showedimprovements in concentration,attendance and fruit eating
New Zealand Free School BreakfastProgramme122
Stepped-wedgecluster RCT
Universal free breakfastto 14 primary schools indeprived areas of NewZealand
There was no effect on schoolattendance or academicachievement, but some effect onsatiety after introducing breakfastclubs
Some positive impact was foundon attendance but only amongthose who attended > 50% ofthe time
New York City, Breakfast in theClassroom141
Cross-sectionalsurvey comparingBreakfast in theClassroom andnon-Breakfast inthe Classroomschools
Universal free breakfast,offered in the classroom,in elementary schools indeprived areas of NewYork City
Those setting up clubs need tobear in mind that children skipbreakfast for a variety of reasons(predominantly a lack of time,lack of hunger and dieting to loseweight); this diversity needs to betaken into account
For every student who atebreakfast who otherwise wouldnot have done, three atebreakfast twice
Australia: healthy food for all,evaluation of the school breakfastprogramme142
Annual onlinesurvey toparticipatingschools
Long-running nationalprogramme (runningsince 2001) serving369 schools in WesternAustralia
Problems identified in breakfastclubs mainly related to a lack ofvolunteers or staff to run theclubs, and problems with foodproducts running out, not beingavailable or going off
SUMMARY OF THE GREY LITERATURE
NIHR Journals Library www.journalslibrary.nihr.ac.uk
56

Holiday hunger
An All-Party Parliamentary Group on Hunger, involving UK Members of Parliament and Peers, publisheda report in April 2017 that focused on hunger among children during the school holidays.144 The reportstated that up to 3 million children in the UK are at risk of hunger during the school holidays, when freeschool meals received during school term time are not available. It is estimated that there are up to around1 million children in this group. In London alone, it has been estimated that school holidays involve astruggle for food for over half a million children. Accordingly, there is a notable increase in the pressure onfood banks during the school holidays.144 A further indicator of the issue is highlighted by school staff atthe start of the school term; for example, a National Union of Teachers (NUT) survey found that 78% ofteachers reported children arriving at school hungry after the holidays.145 Furthermore, 39% of UK teachersin a Kellogg’s survey reported believing that pupils do not get enough to eat during the holidays.144
The long summer break has been shown to have a negative effect on the educational levels of low-incomechildren who are not engaged in learning during the holidays. Of note, mathematics and spelling performanceare particularly susceptible to adverse effects, and children can take up to 7 weeks to make up this loss oflearning.144,146 The NUT survey reported that 78% of teachers believed that hunger in the holidays has anegative effect on children’s education.145 In addition, 69% and 57% were concerned about the negativeeffects of such hunger on children’s social well-being and physical health, respectively.144
It has been reported that children who attend free meal and activities programmes in the school holidayseat more healthily, participate in more exercise, behave better and return to school in a more positivecondition than if they had not attended.144
A number of schools around the country have responded to the need for year-round nutrition for children.For example, free school holiday meals and activities have recently been approved for families in need inAberdeen, highlighting a growing recognition of the issue of holiday hunger.147
A recent report highlighted four challenges that breakfast and holiday clubs face: inaccessibility(availability, capacity, opening hours and cost vary and can be a barrier for some children), unreliability
TABLE 11 Summary of learning from the Department for Education’s literature review (continued )
Programme name Study designDescription ofprogramme
What was learnt about whatworks?
US Department of Agriculture,Food and Nutrition Service:Evaluation of the school breakfastprogramme pilot project143
Experimentaldesign includingtreatment andcontrol schools
Evaluation of a pilot ofuniversal free breakfastprovision (as comparedwith the controlprovision that pupils payfor, get free or get at areduced price dependingon family income). Pilotcovered 79 elementaryschools in six districts
There was a substantial increasein participation in the first year ofthe pilot, which was maintainedin the following 2 years
Participation by students fromlower-income families doubledacross the 2 years ofimplementation
Participation was much higher inschools where breakfast was eatenin the classroom rather than in acafeteria
There was no clear impact onacademic test scores or onattendance, tardiness or discipline
Reproduced with permission from appendix 3, table 3, of Graham et al.137
DOI: 10.3310/phr06130 PUBLIC HEALTH RESEARCH 2018 VOL. 6 NO. 13
© Queen’s Printer and Controller of HMSO 2018. This work was produced by Aceves-Martins et al. under the terms of a commissioning contract issued by the Secretary of Statefor Health and Social Care. This issue may be freely reproduced for the purposes of private research and study and extracts (or indeed, the full report) may be included inprofessional journals provided that suitable acknowledgement is made and the reproduction is not associated with any form of advertising. Applications for commercialreproduction should be addressed to: NIHR Journals Library, National Institute for Health Research, Evaluation, Trials and Studies Coordinating Centre, Alpha House, University ofSouthampton Science Park, Southampton SO16 7NS, UK.
57

(clubs do not always run continuously over time), unaccountability (provision is often voluntary withoutformal oversight) and social acceptability (implications of social exclusion, embarrassment and stigma forchildren using the facilities).138
Food banks
The information regularly published by the Trussell Trust on food banks is reported to be the mostfrequently cited in the context of FI.148–150 In addition to food banks, there is some government ‘food aid’in the UK; families receiving specific income-related benefits can be eligible for free school meals. Peopleon such benefits with children aged < 4 years can also receive vouchers to purchase fresh and infantformula milk and fresh or frozen fruit and vegetables.151
Between 2012/13 and 2013/14, provision to children by Trussell Trust food banks rose by 252%. Provisionto children has since risen by a further 69%.138 Latest figures from the Trussell Trust reported that 1,332,9523-day emergency food parcels were distributed to people in crisis between 1 April 2017 and 31 March 2018,representing a 13% increase on the previous year. Of these, 484,026 went to children.149 The Trussell Trustfurther reported that half of children helped by food banks over the summer holiday months are of primaryschool age.150
Necessity of measuring household food insecurity
The need to routinely measure household FI in the UK was evident in the grey literature. The UK governmentdoes not currently measure household FI and there is no way of knowing the actual extent of the issue.5,152,153
Approximately 77% of adults in the UK think that the government should routinely measure FI, and Membersof Parliament have called for the government to introduce such measures. Steps to measure household FI arebeing taken in Scotland, Wales and Northern Ireland, but measurement is not consistent across countriesand a complete picture of household FI in the UK is not possible. To effectively tackle household FI, robustmeasurements of its extent are necessary. As there is no single tool able to capture all the dimensions of FI, acombination of different measures is necessary to fully understand the extent, causes and consequences of FI.The Food and Agriculture Organisation of the United Nations launched the Voices of the Hungry project in2013 in an attempt to broaden the set of existing indicators. This project led to the development of the FoodInsecurity Experience Scale (FIES), which provides information about the adequacy of people’s access to foodby asking them directly about their experiences.128 The UK Department of Health has previously stated that,in view of the FAO initiative, it has no plans to independently measure and monitor FI.5 Nevertheless, the UKFood Foundation has suggested the addition of standardised questions on FI (as used in the UN FAO FoodInsecurity Experience Scale) into existing UK surveys such as the Office for National Statistics Living Costs andFood Survey,154 or the Health Survey for England.155
Overall, the grey literature was silent on the measurement of child FI.5,128,156,157
Obesity and food insecurity in children
The relationship between obesity and FI in children has been investigated in both the published and thegrey literature. The Food Research and Action Centre reported mixed results from studies based in theUSA.158 For example, one study found no association between obesity and household FS status inlow-income children aged 8–17 years.85 By contrast, children aged 12–18 years from low-FS householdswere more likely to be obese than those from high-FS households.88 Furthermore, low-income childrenexperiencing persistent household FI during infancy and early childhood were 22% more likely to be obeseat 2–5 years than those from food-secure households. The reasons for the link between obesity and FSare reported to be multifactorial.159 For example, lack of full grocery facilities in low-income areas,160–162
SUMMARY OF THE GREY LITERATURE
NIHR Journals Library www.journalslibrary.nihr.ac.uk
58

reliance on public transport by people on low incomes,163 relatively high cost (and poorer quality) ofhealthy foods as compared with less healthy foods in lower-income neighbourhoods,164,165 prevalence offast-food-type outlets in low-income communities (and, in particular, near schools)166–168 and limited accessto health care.169 In addition, eating behaviours of people with FI, for example overeating when food isavailable,170–172 and the psychological aspects of being food insecure, such as stress, depression and anxiety,may also be contributing factors.47,173 Of particular relevance to children in lower-income neighbourhoodsmay be the lack of opportunities for physical activity. This may present itself in terms of fewer facilities, suchas parks and green spaces, unattractive or unsafe facilities, or the inability to afford organised sportsexpenses or transport costs.174,175
In the UK, the Obesity Health Alliance has predicted that 60% of 5- to 11-year old boys in the highestcategory of deprivation will be overweight or obese by 2020, compared with 16% of boys in the leastdeprived category. An average of 1 in 5 girls in the same age group is predicted to be overweight orobese by 2020, regardless of level of deprivation.176
DOI: 10.3310/phr06130 PUBLIC HEALTH RESEARCH 2018 VOL. 6 NO. 13
© Queen’s Printer and Controller of HMSO 2018. This work was produced by Aceves-Martins et al. under the terms of a commissioning contract issued by the Secretary of Statefor Health and Social Care. This issue may be freely reproduced for the purposes of private research and study and extracts (or indeed, the full report) may be included inprofessional journals provided that suitable acknowledgement is made and the reproduction is not associated with any form of advertising. Applications for commercialreproduction should be addressed to: NIHR Journals Library, National Institute for Health Research, Evaluation, Trials and Studies Coordinating Centre, Alpha House, University ofSouthampton Science Park, Southampton SO16 7NS, UK.
59


Chapter 5 Overall results
Overall, 109 studies published in the literature assessing FI in children in high-income countries wereincluded in this rapid review. The majority (93%) of studies were conducted in North America (the USA
and Canada). Only five studies were conducted in the UK. Regarding the specified RQs, 52% of includedstudies assessed factors linked to FI (RQ 1), 68% assessed the impact of FI on children’s health outcomes(RQ 3), 14% reported findings of food assistance programmes (RQ 4), and 34% of the studies assessedmore than one RQ. None of these studies assessed the incidence, the prevalence or the recent trends ofchild FI in the UK (RQ 2) or the cost-effectiveness of food assistance programmes (RQ 5).
All of the included studies measured FI in children through a variety of methods (e.g. surveys, face-to-faceinterviews, analogue scales or vignettes and cartoons). However, most of the tools (68%) used to measurechild FI involved parental reports (e.g. the 18-item USDA module) that assess FI in the household (includingchildren living in it). Only eight studies (7%) used the version of the USDA module that has been modifiedto collect answers directly from young people. Even where the same tool was used across studies, someauthors used modified scoring systems and categories, which made it challenging to summarise evidence.
Fifty-seven studies provided information on the nature and determinants of child FI (RQ 1); in particular,51 provided quantitative data and six provided qualitative data. Several factors were identified that mightbe pivotal for food-insecure children. According to the 24 studies that adjusted their analyses forexplanatory or confounding variables, factors associated with FI included material deprivation, parents’employment, number of people in household, neighbourhood social cohesion and disorder, emotionalstatus, living property characteristics, number of parents in household, ethnicity, number of siblings,parents’ education and SES/household income.
Qualitative data showed that children’s experience of FI (even in children as young as 5 years) includescognitive, physical and emotional awareness, as well as social and behavioural responsiveness to FI.Children demonstrated awareness of adults or family behaviours towards FI as well as of the householdcharacteristics that contributed to increase FI. Moreover, one study showed that children at risk of FI mightalso express concerns regarding the lack of food.
None of the included studies identified from the current literature assessed the incidence, prevalence andcosts of child FI in the UK. According to the UK House of Commons Poverty in the UK Statistics 2018report,129 4.0 million children were estimated to live in relative poverty (relative low income) and 3.7 millionwere estimated to live in absolute poverty (absolute low income) in 2015/16. Similarly, data from the 2017UNICEF report Prevalence and Correlates of Food Insecurity Among Children Across the Globe127 indicatethat 19.5% of children aged < 15 years in the UK are living with a respondent who is moderately orseverely food insecure, and 10.4% live with a severely food-insecure respondent.127 These appear to bethe most up-to-date data on the prevalence of child FI in the UK and are widely cited in the FI literature.
Seventy-four studies evaluated the impact of FI on children’s health and social well-being. Child FI waslinked to a range of negative outcomes including poor general and mental health, developmental,psychological and behavioural problems, disrupted social interactions and poor academic performance.For some other outcomes, the evidence was mixed, and the association was less clear (e.g. weight status,attachment to parents, mental proficiency).
Fifteen studies reported findings of food assistance programmes. Most of the programmes attenuated,but did not eliminate, FI or any outcome related to it. Most of the published studies lacked a detaileddescription of the methodology and/or the intervention provided, which made interpreting the resultschallenging. Furthermore, none of the studies evaluated the cost-effectiveness and sustainability of theprogramme under consideration.
DOI: 10.3310/phr06130 PUBLIC HEALTH RESEARCH 2018 VOL. 6 NO. 13
© Queen’s Printer and Controller of HMSO 2018. This work was produced by Aceves-Martins et al. under the terms of a commissioning contract issued by the Secretary of Statefor Health and Social Care. This issue may be freely reproduced for the purposes of private research and study and extracts (or indeed, the full report) may be included inprofessional journals provided that suitable acknowledgement is made and the reproduction is not associated with any form of advertising. Applications for commercialreproduction should be addressed to: NIHR Journals Library, National Institute for Health Research, Evaluation, Trials and Studies Coordinating Centre, Alpha House, University ofSouthampton Science Park, Southampton SO16 7NS, UK.
61


Chapter 6 Discussion
This rapid review aimed to determine the nature, extent and consequences of FI affecting children aged≤ 18 years in the UK. FI is a multifactorial phenomenon associated with a number of factors (mainly
linked to SES and demographic characteristics) that might result in the limited or uncertain availability of foodand in the limited or uncertain ability to access food and, hence, may affect children’s health outcomes.
The main aim of this rapid review was to assess factors more likely to be associated with FI, the impactof FI on children’s health and social well-being and the findings of food programmes designed to tackleFI in both children and adolescents. However, one of the main challenges of the review was to identifystudies that explicitly measured FI in children as well as interventions to reduce or mitigate the effects of FIin children. Ultimately, 109 studies that described measurements of child FI were included in this rapidreview. Only five studies were conducted in the UK and three of these provided qualitative data. Overall,there was a lack of consistency in how FI was defined and measured across studies. Some studies reportedparent-led measurements (i.e. ‘indirect measurement’) and included measurements of household FI alongwith child-specific measurements. Although information collected from parents/families is important inestablishing the extent and consequences of child FI, there is evidence showing that some parents tryto ‘shield’ their children from FI,25 and such ‘shielding’ may affect the reliability of data as differenteffect sizes in outcomes have been shown in sensitivity analyses comparing child-level FI measures withhousehold measurements.74,177 To date, there is not an established gold standard for the assessment ofFI in children or adolescents. According to the 2015 UNICEF report on the measurement of FI amongchildren,9 children as young as 7 years can respond accurately to questionnaire items sensitive to FI. Resultsfrom this rapid review showed that 19.2% of the studies measured FI directly from children or adolescents,and 6% included both children’s and parents’/caregivers’ measurements. As indicated by the 2015 UNICEFreport, there is a need to develop a tool to assess child FI, to allow for a reliable and valid ‘direct’measurement.10
The process should ideally involve children and adolescents as much as possible to ensure that their FIexperiences, views and beliefs are taken into account and fully integrated into the development andimplementation of any novel instrument.178
To fully understand the complexity and multifactorial nature of FI and guide efforts that aim to tackleit, it is crucial to identify factors that may cause or increase its risk. According to the results presented inthis rapid review, some factors that may lead to a vulnerable environment for children and adolescentsappear to increase the risk of FI, for example having a low SES, being homeless or living in public housing,having unemployed parents or living with a large number of siblings. Notably, these associations do notimply causality, as the direction of the relationship with FI is not further explicated.
Evidence regarding some other factors potentially linked to FI was inconsistent across studies. For example,some of the studies based in the USA found a significant association between parental immigration statusand FI (i.e. households with foreign parents were more likely to suffer from FI). However, results from othercountries were less clear; for example, a Canadian study23 did not find any significant association, while anAustralian study showed that households with a parent born outside Australia were 60% less likely to be FIthan households with an Australian-born parent.54 The assessment of factors that may lead to, or increase,FI is complex because of the nature of FI, as well as the political, economic and sociocultural differencesin terms of food systems and welfare programmes that exist across communities and across countries.179
Furthermore, the majority of evidence was reported in observational studies, which were not properlydesigned to rigorously assess the determinants of FI, and provided only a crude association between FI andfactors that may increase the risk of FI without taking into account relevant explanatory or confoundingvariables. Moreover, it was very challenging to determine whether some potential associated factors of FIwere actually predictors or consequences of changes in FI. For instance, it has been shown that FI may workindirectly through parental depression and parenting practices to influence security of attachment among
DOI: 10.3310/phr06130 PUBLIC HEALTH RESEARCH 2018 VOL. 6 NO. 13
© Queen’s Printer and Controller of HMSO 2018. This work was produced by Aceves-Martins et al. under the terms of a commissioning contract issued by the Secretary of Statefor Health and Social Care. This issue may be freely reproduced for the purposes of private research and study and extracts (or indeed, the full report) may be included inprofessional journals provided that suitable acknowledgement is made and the reproduction is not associated with any form of advertising. Applications for commercialreproduction should be addressed to: NIHR Journals Library, National Institute for Health Research, Evaluation, Trials and Studies Coordinating Centre, Alpha House, University ofSouthampton Science Park, Southampton SO16 7NS, UK.
63

children.72 Therefore, a certain degree of caution is required when interpreting the results of thisrapid review.
Most qualitative studies reported children’s perceptions or experiences in terms of cognitive (e.g. beingaware that food is scarce), emotional (e.g. feelings associated with FI, such as sadness) and physical(e.g. experience of hunger, pain, tiredness or weakness) awareness of FI.6,180 In addition, some qualitativestudies reported children’s social (e.g. being pressured to eat with other family, friends or neighbours)and behavioural (e.g. responsibility for managing food resources to shield their loved ones, overeating oreating less desirable foods because there was no other choice) reactions to FI.
Two of the included studies recorded stakeholders’ and parents’ perceptions and points of view regardingchild FI. The results showed that school teachers may be able to identify children at risk of FI. The WHOhas identified schools as the target setting for health promotion among children and adolescents, asschools are ideal environments for promoting academic achievement as well as safety and mental, physicaland emotional health in young people.181 School-based interventions can play a crucial role in healthpromotion among young people, as children and adolescents generally attend school 5 days per week,for around 6 hours per day, throughout much of the calendar year. Furthermore, school teachers reportedthat, despite being expensive and resources driven, food programmes implemented in schools andcommunity centres might reduce stigma and inequality among young people.
However, stakeholders expressed their concerns about the lack of food aid during weekends and schoolholidays, as well as the need for funding and resources to implement and run such programmes. Similarconcerns have been raised by the Food and Agriculture Organization of the United Nations, with thegeneral recommendation that food assistance programmes should offer opportunities for promotingsustainable improvements in FS.182
The studies included in this rapid review showed a number of possible associations between FI and healthoutcomes in children. However, there are a number of issues worth considering. The measurement of FIvaried across studies. There was variation in how some outcomes were measured: some were measureddirectly by health professionals or research staff, whereas others were reported by parents or by childrenor adolescents themselves. Such self-reports may not be accurate and might potentially bias results.183
The results varied according to the type of data and the statistical analyses used. For instance, five ofthe included studies used data from the US ECLS cohort to examine the association between FI andchildren’s weight status.12,20,56,80,113 Even though the same data set was used, results were not consistentacross studies (with a possible overlap of participants between studies): two studies found a significantassociation between FI and children’s weight status,12,56 one found a trend towards association,113 onefound no association20 and the remaining study found differences between boys and girls.80 Suchvariations may be explained by the covariates included in the statistical analyses, as well as the type ofanalyses performed, which could affect the results and their interpretation. The same issue is evidentbetween studies that adjusted results for potential explanatory or confounding variables (usually related tochildren’s, parents’ or households’ characteristics) and those that did not. The differences in the methodsused across studies may significantly alter the results, leading to very different conclusions regarding themagnitude and relevance of observed effects.184
Overall, and despite the identified methodological issues, several physical, mental, developmental andsocial well-being outcomes were linked to FI in children and adolescents. In some cases, the associationwas clear and significant across studies, whereas in others the strength of the association varied acrossstudies. In general, most of the included studied reported a negative association between FI and healthand social well-being outcomes in children. However, in some cases it was difficult to determine whetherFI was a risk factor for children or an indicator of other types of deprivation.
This rapid review identified 15 studies (most from the USA) that assessed the effects of interventions/programmes designed to eliminate, reduce or mitigate the effects of child FI. Results varied and, in general,showed that effects of FI are attenuated, but not eradicated, by food assistance programmes. It is worth
DISCUSSION
NIHR Journals Library www.journalslibrary.nihr.ac.uk
64

noting that many programmes were designed and implemented to mitigate the effects of FI but not to solvethe problem of FI. In addition, many studies did not provide a full description of the intervention (such asfrequency, duration, intensity, quality of food aids, personnel involved) and, therefore, it was not possible todetermine which aspects and components of the programme were more likely to be effective. Most studiesdid not include a control intervention and only one of the included studies was a cluster RCT122 (a schoolbreakfast programme in New Zealand reported a significant decrease in children’s self-reported short-termhunger during the intervention phase as compared with the control, but no other school attendance oracademic achievement outcomes changed significantly with the programme).
In high-income countries, the assessment of food assistance programmes to tackle child FI is likely tobe complex, not only because of the multifactorial nature of FI, but also because of the complexity ofcountry-specific public and private food assistance initiatives, which involve a combinations of roles, actors,practices and resources.185
Limitations
There are some limitations to consider regarding this rapid review. Owing to time and resource constraints,30 potentially relevant articles were not included in the review and the quality of the included studies wasnot evaluated. Few studies conducted in the UK were identified. The lack of consistency with regard tostudy characteristics, characteristics of children and households, measurements of FI and types of outcomesmeant that it was not feasible to perform a quantitative synthesis of results and it was challenging toprovide a general overview.
Research needs and future challenges
There is an urgent need to monitor and report FI in children in the UK. No evidence on the prevalence orincidence of FI in children in the UK was identified and it appears that other indices are commonly used asproxy measures of FI. Therefore, better measurement and monitoring is needed to permit an accurate andreliable assessment of the extent of the problem in the UK.
Income and poverty measures do not provide clear information about FS, even though FI and hunger canarise from limited economic resources, especially in young children.2 No single indicator can completelycapture FI or hunger. For this reason, information on a variety of specific conditions, experiences andbehaviours that serve as indicators is needed. Several organisations advocate for systems to measure andmonitor individual children’s experiences of FI.10 In addition, there is a need to assess levels of severity of FI.2
Such efforts need to ensure that children and adolescents are involved as much as possible, so that their FIexperiences are understood and taken into account.
No studies evaluating interventions to reduce, mitigate or eliminate child FI in the UK were identified in theliterature, and the majority of the studies were from the USA. In general, there was a lack of detail aboutthe characteristics of the interventions and the methodology used, which made it challenging to synthesiseevidence and interpret findings. There is a clear need to conduct evaluations of possible interventions/programmes to tackle child FI in the UK and to identify mechanisms and processes through which theseinterventions/programmes may work and produce benefits. In particular, more information is needed onmeasurements and targeted interventions for young, more vulnerable populations, for example childrenwho are homeless. Furthermore, future research should report methods, characteristics of the studypopulation and characteristics of the intervention in detail to permit an adequate and accurateinterpretation of findings and, particularly, of the impact of the intervention on children’s outcomes.
DOI: 10.3310/phr06130 PUBLIC HEALTH RESEARCH 2018 VOL. 6 NO. 13
© Queen’s Printer and Controller of HMSO 2018. This work was produced by Aceves-Martins et al. under the terms of a commissioning contract issued by the Secretary of Statefor Health and Social Care. This issue may be freely reproduced for the purposes of private research and study and extracts (or indeed, the full report) may be included inprofessional journals provided that suitable acknowledgement is made and the reproduction is not associated with any form of advertising. Applications for commercialreproduction should be addressed to: NIHR Journals Library, National Institute for Health Research, Evaluation, Trials and Studies Coordinating Centre, Alpha House, University ofSouthampton Science Park, Southampton SO16 7NS, UK.
65

Future research should also clarify the mediating effects of demographic and social characteristics, familystressors and parenting practices in the relationship between FI and children’s outcomes.
It would also be interesting to explore whether or not health-care systems could be used in the future assupport networks for FI young people. Similarly, it would be useful, especially in the UK context, to furtherengage the role of public health research in addressing child FI.
DISCUSSION
NIHR Journals Library www.journalslibrary.nihr.ac.uk
66

Chapter 7 Conclusions
Food insecurity is a serious problem, and children may be one of the most vulnerable populations tosuffer its consequences. In high-income countries, several factors (personal, socioeconomic, cultural,
parental and/or household characteristics) were frequently related to FI in children (aged ≤ 18 years).Furthermore, several health and social well-being outcomes were associated with FI in children andadolescents. However, in some cases, the association was strong and significant across studies, but inothers was less clear. Nevertheless, the overall pattern of associations was the same across studies andshowed a negative relationship between FI and children’s health and social-well-being. The interventionsor food assistance programmes reported in the literature attenuated, but did not eliminate, FI or anyoutcome related to it. Moreover, there was no information on the cost-effectiveness and sustainability ofsuch programmes.
At present, there are no prevalence or incidence studies assessing FI in children in the UK. However, somenational and international reports that used proxy indicators have shown that children’s poverty and FIhave increased in recent years. Considering the short- and long-term detrimental effects of FI on childhealth and well-being, a better measurement and monitoring system is needed to permit a reliableassessment of the extent of the problem, including levels of severity, in the UK.
Food security is a human right, involving social justice, public health, food systems and policies. Viewed inan international context or within a country, state or local community, FS is crucial not only at the societyand household levels, but also at an individual level. Adequate assessment of this problem is crucialfor better identification of vulnerable populations (such as children and adolescents), and also for betteradministration of resources, development of programmes and implementation of policies that aim totackle it.
There is a clear need to conduct evaluations of possible interventions/programmes to tackle child FI in theUK and to identify mechanisms and processes through which these interventions/programmes may beeffective and sustainable.
Future research, especially studies assessing the effects and impact of FI on children’s outcomes, should beadequately designed, analysed and reported. Future studies should also consider the mediating effects ofdemographic and social characteristics, family stressors and parenting practices in the relationship betweenFI and children’s health and social well-being outcomes.
DOI: 10.3310/phr06130 PUBLIC HEALTH RESEARCH 2018 VOL. 6 NO. 13
© Queen’s Printer and Controller of HMSO 2018. This work was produced by Aceves-Martins et al. under the terms of a commissioning contract issued by the Secretary of Statefor Health and Social Care. This issue may be freely reproduced for the purposes of private research and study and extracts (or indeed, the full report) may be included inprofessional journals provided that suitable acknowledgement is made and the reproduction is not associated with any form of advertising. Applications for commercialreproduction should be addressed to: NIHR Journals Library, National Institute for Health Research, Evaluation, Trials and Studies Coordinating Centre, Alpha House, University ofSouthampton Science Park, Southampton SO16 7NS, UK.
67


Acknowledgements
The authors are grateful to Flora Douglas (Robert Gordon University, Aberdeen), Ada Garcia (HumanNutrition, School of Medicine, University of Glasgow), Aixa Aleman-Diaz (WHO-Collaborating Centre
for International Child & Adolescent Health Policy, Child and Adolescent Health Research Unit, Universityof St Andrews), Martin Caraher (Centre for Food Policy, City, University of London) and Stephen Whybrow(Rowett Institute of Nutrition & Health, University of Aberdeen) for providing comments on the researchprotocol and methodological guidance as members of the advisory group for this rapid review and toLara Kemp for her secretarial support.
Contributions of authors
Magaly Aceves-Martins acted as systematic reviewer, drafted the original protocol, led the day-to-dayrunning of this review and reviewed the available evidence on child FI.
Moira Cruickshank acted as systematic reviewer and reviewed the available evidence on child FI.
Cynthia Fraser acted as information specialist, and developed and ran the search strategies.
Miriam Brazzelli acted as project lead and supervised and co-ordinated all aspects of this review.
All authors contributed to the writing of this rapid review and approved its final version.
Data-sharing statement
All data requests should be submitted to the corresponding author for consideration. Access toanonymised data may be granted following review.
DOI: 10.3310/phr06130 PUBLIC HEALTH RESEARCH 2018 VOL. 6 NO. 13
© Queen’s Printer and Controller of HMSO 2018. This work was produced by Aceves-Martins et al. under the terms of a commissioning contract issued by the Secretary of Statefor Health and Social Care. This issue may be freely reproduced for the purposes of private research and study and extracts (or indeed, the full report) may be included inprofessional journals provided that suitable acknowledgement is made and the reproduction is not associated with any form of advertising. Applications for commercialreproduction should be addressed to: NIHR Journals Library, National Institute for Health Research, Evaluation, Trials and Studies Coordinating Centre, Alpha House, University ofSouthampton Science Park, Southampton SO16 7NS, UK.
69


References
1. Food and Agricultural Organization of the United Nations. Trade Reforms and Food Security.Rome: Food and Agricultural Organization of the United Nations; 2003. URL: www.fao.org/docrep/005/y4671e/y4671e00.htm (accessed May 2018).
2. Bickel G, Nord M, Price C, Hamilton W, Cook J. Guide to Measuring Household Food Security.USDA Food and Nutrition Service; 2000. URL: https://fns-prod.azureedge.net/sites/default/files/FSGuide_0.pdf (accessed May 2018).
3. Department for Work and Pensions. Households Below Average Income: 1994/95 to 2015/16.UK Government National Statistics; 2017. URL: www.gov.uk/government/uploads/system/uploads/attachment_data/file/600091/households-below-average-income-1994-1995-2015-2016.pdf(accessed May 2018).
4. Mindell J, Erens B, Nelson M, Finglas P. Low Income Diet and Nutrition Survey (LIDNS). Norwich:The Stationery Office; 2007.
5. McGuiness F, Brown J, Ward M. Household Food Insecurity Measurement in the UK. Debate PackCDP 2016/0238. London: UK Parliament; 2016. URL: http://researchbriefings.files.parliament.uk/documents/CDP-2016-0238/CDP-2016-0238.pdf (accessed May 2018).
6. Fram MS, Frongillo EA, Jones SJ, Williams RC, Burke MP, DeLoach KP, Blake CE. Children are awareof food insecurity and take responsibility for managing food resources. J Nutr 2011;141:1114–19.https://doi.org/10.3945/jn.110.135988
7. Bernal J, Frongillo EA, Herrera HA, Rivera JA. Food insecurity in children but not in their mothersis associated with altered activities, school absenteeism, and stunting. J Nutr 2014;144:1619–26.https://doi.org/10.3945/jn.113.189985
8. Casey PH, Szeto KL, Robbins JM, Stuff JE, Connell C, Gossett JM, Simpson PM. Child health-related quality of life and household food security. Arch Pediatr Adolesc Med 2005;159:51–6.https://doi.org/10.1001/archpedi.159.1.51
9. Fram MS, Bernal J, Frongillo EA. The Measurement of Food Insecurity among Children: Reviewof Literature and Concept Note. Office of Research Working Paper WP-2015-08: UNICEF; 2015.URL: www.oecd-ilibrary.org/children-and-youth/the-measurement-of-food-insecurity-among-children_30d5a92c-en (accessed May 2018).
10. Jaffe K, Bernal J, Herrera HA. Relation between shame, nutrition and happiness in children.Acta Cient Venez 2014;65:29–39.
11. Jyoti DF, Frongillo EA, Jones SJ. Food insecurity affects school children’s academic performance,weight gain, and social skills. J Nutr 2005;135:2831–9. https://doi.org/10.1093/jn/135.12.2831
12. FAO IFAD UNICEF WFP and WHO. The State of Food Security and Nutrition in the World 2017.Building Resilience for Peace and Food Security. Rome: Food and Agriculture Organization of theUnited Nations; 2017. URL: www.fao.org/3/a-I7695e.pdf (accessed 23 October 2018).
13. Organization for Economic Co-operation and Development. OECD Members and Partners.Organization for Economic Co-operation and Development; 2018. URL: www.oecd.org/about/membersandpartners/ (accessed May 2018).
14. Carney M. Compounding crises of economic recession and food insecurity: a comparative studyof three low-income communities in Santa Barbara County. Agri Human Values 2012;29:185–201.
DOI: 10.3310/phr06130 PUBLIC HEALTH RESEARCH 2018 VOL. 6 NO. 13
© Queen’s Printer and Controller of HMSO 2018. This work was produced by Aceves-Martins et al. under the terms of a commissioning contract issued by the Secretary of Statefor Health and Social Care. This issue may be freely reproduced for the purposes of private research and study and extracts (or indeed, the full report) may be included inprofessional journals provided that suitable acknowledgement is made and the reproduction is not associated with any form of advertising. Applications for commercialreproduction should be addressed to: NIHR Journals Library, National Institute for Health Research, Evaluation, Trials and Studies Coordinating Centre, Alpha House, University ofSouthampton Science Park, Southampton SO16 7NS, UK.
71

15. Karanikolos M, Mladovsky P, Cylus J, Thomson S, Basu S, Stuckler D, et al. Financial crisis,austerity, and health in Europe. Lancet 2013;381:1323–31. https://doi.org/10.1016/S0140-6736(13)60102-6
16. Loopstra R, Reeves A, Stuckler D. Rising food insecurity in Europe. Lancet 2015;385:2041.https://doi.org/10.1016/S0140-6736(15)60983-7
17. Borch A, Kjaernes U. The prevalence and risk of food insecurity in the Nordic region: preliminaryresults. J Consumer Policy 2016;39:261–74. https://doi.org/10.1007/s10603-016-9316-x
18. Arteaga I, Potochnick S, Parsons S. Decomposing the household food insecurity gap for childrenof U.S.-born and foreign-born Hispanics: evidence from 1998 to 2011. J Immigr Minor Health2017;19:1050–8. https://doi.org/10.1007/s10903-017-0561-0
19. Belsky DW, Moffitt TE, Arseneault L, Melchior M, Caspi A. Context and sequelae of foodinsecurity in children’s development. Am J Epidemiol 2010;172:809–18. https://doi.org/10.1093/aje/kwq201
20. Bhargava A, Jolliffe D, Howard LL. Socio-economic, behavioural and environmental factorspredicted body weights and household food insecurity scores in the Early Childhood LongitudinalStudy-Kindergarten. Br J Nutr 2008;100:438–44. https://doi.org/10.1017/S0007114508894366
21. Broughton MA, Janssen PS, Hertzman C, Innis SM, Frankish CJ. Predictors and outcomes ofhousehold food insecurity among inner city families with preschool children in Vancouver.Can J Public Health 2006;97:214–16.
22. Bruening M, Lucio J, Brennhofer S. Mother and adolescent eating in the context of foodinsecurity: findings from urban public housing. Matern Child Health J 2017;21:1911–17.https://doi.org/10.1007/s10995-017-2306-z
23. Carter MA, Dubois L, Tremblay MS, Taljaard M. Local social environmental factors are associatedwith household food insecurity in a longitudinal study of children. BMC Public Health 2012;12:1038.https://doi.org/10.1186/1471-2458-12-1038
24. Chilton M, Black MM, Berkowitz C, Casey PH, Cook J, Cutts D, et al. Food insecurity and riskof poor health among US-born children of immigrants. Am J Public Health 2009;99:556–62.https://doi.org/10.2105/AJPH.2008.144394
25. Connell CL, Lofton KL, Yadrick K, Rehner TA. Children’s experiences of food insecurity canassist in understanding its effect on their well-being. J Nutr 2005;135:1683–90. https://doi.org/10.1093/jn/135.7.1683
26. Dunifon R, Kowaleski-Jones L. The influences of participation in the National School LunchProgram and food insecurity on child well-being. Soc Serv Rev 2003;77:72–92. https://doi.org/10.1086/345705
27. Egeland GM, Williamson-Bathory L, Johnson-Down L, Sobol I. Traditional food and monetaryaccess to market-food: correlates of food insecurity among Inuit preschoolers. Int J CircumpolarHealth 2011;70:373–83. https://doi.org/10.3402/ijch.v70i4.17836
28. Eicher-Miller HA, Mason AC, Weaver CM, McCabe GP, Boushey CJ. Food insecurity is associatedwith iron deficiency anemia in US adolescents. Am J Clin Nutr 2009;90:1358–71. https://doi.org/10.3945/ajcn.2009.27886
29. Eicher-Miller HA, Mason AC, Weaver CM, McCabe GP, Boushey CJ. Food insecurity is associatedwith diet and bone mass disparities in early adolescent males but not females in the UnitedStates. J Nutr 2011;141:1738–45. https://doi.org/10.3945/jn.111.142059
30. Harvey K. ‘When I go to bed hungry and sleep, I’m not hungry’: children and parents’ experiencesof food insecurity. Appetite 2016;99:235–44. https://doi.org/10.1016/j.appet.2016.01.004
REFERENCES
NIHR Journals Library www.journalslibrary.nihr.ac.uk
72

31. Harvey-Golding L, Donkin LM, Defeyter MA. Universal free school breakfast: a qualitative processevaluation according to the perspectives of senior stakeholders. Front Public Health 2016;4:161.https://doi.org/10.3389/fpubh.2016.00161
32. Harvey-Golding L, Donkin LM, Blackledge J, Defeyter MA. Universal free school breakfast:a qualitative model for breakfast behaviors. Front Public Health 2015;3:154. https://doi.org/10.3389/fpubh.2015.00154
33. Himmelgreen DA, Perez-Escamilla R, Segura-Millan S, Peng Y, Gonzalez A, Singer M, et al. Foodinsecurity among low-income Hispanics in Hartford, Connecticut: implications for public healthpolicy. Hum Organ 2000;59:334–42. https://doi.org/10.17730/humo.59.3.76557m317748l414
34. Holben DH, McClincy MC, Holcomb JP, Dean KL, Walker CE. Food security status of households inAppalachian Ohio with children in Head Start. J Am Diet Assoc 2004;104:238–41. https://doi.org/10.1016/j.jada.2003.09.023
35. Jacknowitz A, Morrissey T, Brannegan A. Food insecurity across the first five years: triggers of onsetand exit. Children Youth Serv Rev 2015;53:24–33. https://doi.org/10.1016/j.childyouth.2015.03.012
36. Kaiser LL, Melgar-Quiñonez HR, Lamp CL, Johns MC, Sutherlin JM, Harwood JO. Food securityand nutritional outcomes of preschool-age Mexican-American children. J Am Diet Assoc2002;102:924–9. https://doi.org/10.1016/S0002-8223(02)90210-5
37. Kenney CT. Father doesn’t know best? Parents’ control of money and children’s food insecurity.J Marriage Fam 2008;70:654–69. https://doi.org/10.1111/j.1741-3737.2008.00512.x
38. Kersey M, Geppert J, Cutts DB. Hunger in young children of Mexican immigrant families.Public Health Nutr 2007;10:390–5. https://doi.org/10.1017/S1368980007334071
39. Kimbro RT, Denney JT. Transitions into food insecurity associated with behavioral problems andworse overall health among children. Health Aff 2015;34:1949–55. https://doi.org/10.1377/hlthaff.2015.0626
40. Kimbro RT, Denney JT, Panchang S. Individual, family and neighborhood characterisrics abdchildren’s food insecurity. J Appl Res Children 2012;3:article 8.
41. King C. Soft drinks consumption and child behaviour problems: the role of food insecurity andsleep patterns. Public Health Nutr 2017;20:266–73. https://doi.org/10.1017/S1368980016002093
42. Kirkpatrick SI, McIntyre L, Potestio ML. Child hunger and long-term adverse consequences for health.Arch Pediatr Adolesc Med 2010;164:754–62. https://doi.org/10.1001/archpediatrics.2010.117
43. Kirkpatrick SI, Tarasuk V. Food insecurity is associated with nutrient inadequacies amongCanadian adults and adolescents. J Nutr 2008;138:604–12. https://doi.org/10.1093/jn/138.3.604
44. Mangini LD, Hayward MD, Dong YQ, Forman MR. Household food insecurity is associated withchildhood asthma. J Nutr 2015;145:2756–64. https://doi.org/10.3945/jn.115.215939
45. Marjerrison S, Cummings EA, Glanville NT, Kirk SF, Ledwell M. Prevalance and associations offood insecurity in children with diabetes mellitus. J Pediatr 2011;158:607–11. https://doi.org/10.1016/j.jpeds.2010.10.003
46. McIsaac KE, Stock DC, Lou W. Household food security and breast-feeding duration amongCanadian Inuit. Public Health Nutr 2017;20:64–71. https://doi.org/10.1017/S136898001600166X
47. McLaughlin KA, Green JG, Alegría M, Jane Costello E, Gruber MJ, Sampson NA, Kessler RC. Foodinsecurity and mental disorders in a national sample of U.S. adolescents. J Am Acad Child AdolescPsychiatry 2012;51:1293–303. https://doi.org/10.1016/j.jaac.2012.09.009
DOI: 10.3310/phr06130 PUBLIC HEALTH RESEARCH 2018 VOL. 6 NO. 13
© Queen’s Printer and Controller of HMSO 2018. This work was produced by Aceves-Martins et al. under the terms of a commissioning contract issued by the Secretary of Statefor Health and Social Care. This issue may be freely reproduced for the purposes of private research and study and extracts (or indeed, the full report) may be included inprofessional journals provided that suitable acknowledgement is made and the reproduction is not associated with any form of advertising. Applications for commercialreproduction should be addressed to: NIHR Journals Library, National Institute for Health Research, Evaluation, Trials and Studies Coordinating Centre, Alpha House, University ofSouthampton Science Park, Southampton SO16 7NS, UK.
73

48. Miller DP. Accessibility of summer meals and the food insecurity of low-income households withchildren. Public Health Nutr 2016;19:2079–89. https://doi.org/10.1017/S1368980016000033
49. Morrissey TW, Oellerich D, Meade E, Simms J, Stock A. Neighborhood poverty and children’sfood insecurity. Children Youth Services Rev 2016;66:85–93. https://doi.org/10.1016/j.childyouth.2016.05.006
50. Nalty CC, Sharkey JR, Dean WR. School-based nutrition programs are associated with reducedchild food insecurity over time among Mexican-origin mother-child dyads in Texas BorderColonias. J Nutr 2013;143:708–13. https://doi.org/10.3945/jn.112.168757
51. Papas MA, Trabulsi JC, Dahl A, Dominick G. Food Insecurity Increases the odds of obesity amongyoung Hispanic children. J Immigr Minor Health 2016;18:1046–52. https://doi.org/10.1007/s10903-015-0275-0
52. Poole A, Ruiz CS, Shows AR, Chen JJ. Household food security status, food perceptions, dietarybehaviors and weight status in Southeast Texas adolescents...insights to action. Academy of Nutritionand Dietetics. Food and Nutrition Conference and Expo, Houston TX, October 19–22, 2013. J AcadNutr Diet 2013;113:A94.
53. Poole-Di Salvo E, Silver EJ, Stein RE. Household food insecurity and mental health problemsamong adolescents: what do parents report? Acad Pediatr 2016;16:90–6. https://doi.org/10.1016/j.acap.2015.08.005
54. Ramsey R, Giskes K, Turrell G, Gallegos D. Food insecurity among Australian children: potentialdeterminants, health and developmental consequences. J Child Health Care 2011;15:401–16.https://doi.org/10.1177/1367493511423854
55. Richards R, Smith C. Environmental, parental, and personal influences on food choice, access,and overweight status among homeless children. Soc Sci Med 2007;65:1572–83. https://doi.org/10.1016/j.socscimed.2007.06.013
56. Rose D, Bodor JN. Household food insecurity and overweight status in young school children:results from the Early Childhood Longitudinal Study. Pediatrics 2006;117:464–73. https://doi.org/10.1542/peds.2005-0582
57. Rose-Jacobs R, Black MM, Casey PH, Cook JT, Cutts DB, Chilton M, et al. Household foodinsecurity: associations with at-risk infant and toddler development. Pediatrics 2008;121:65–72.https://doi.org/10.1542/peds.2006-3717
58. Rossen LM, Kobernik EK. Food insecurity and dietary intake among US youth, 2007–2010.Pediatr Obes 2016;11:187–93. https://doi.org/10.1111/ijpo.12044
59. Sellen DW, Tedstone AE, Frize J. Food insecurity among refugee families in East London: resultsof a pilot assessment. Public Health Nutr 2002;5:637–44. https://doi.org/10.1079/PHN2002340
60. Shanafelt A, Hearst MO, Wang Q, Nanney MS. Food insecurity and rural adolescent personalhealth, home, and academic environments. J Sch Health 2016;86:472–80. https://doi.org/10.1111/josh.12397
61. Sharkey JR, Dean WR, Johnson CM. Association of household and community characteristicswith adult and child food insecurity among Mexican-origin households in colonias along theTexas-Mexico border. Int J Equity Health 2011;10:19. https://doi.org/10.1186/1475-9276-10-19
62. Shtasel-Gottlieb Z, Palakshappa D, Yang F, Goodman E. The relationship between developmentalassets and food security in adolescents from a low-income community. J Adolesc Health2015;56:215–22. https://doi.org/10.1016/j.jadohealth.2014.10.001
REFERENCES
NIHR Journals Library www.journalslibrary.nihr.ac.uk
74

63. Skalicky A, Meyers AF, Adams WG, Yang Z, Cook JT, Frank DA. Child food insecurity and irondeficiency anemia in low-income infants and toddlers in the United States. Matern Child Health J2006;10:177–85. https://doi.org/10.1007/s10995-005-0036-0
64. Smith C, Richards R. Dietary intake, overweight status, and perceptions of food insecurityamong homeless Minnesotan youth. Am J Hum Biol 2008;20:550–63. https://doi.org/10.1002/ajhb.20780
65. Sonik R, Parish SL, Ghosh S, Igdalsky L. Food insecurity in U.S. households that include childrenwith disabilities. Except Child 2016;83:42–57. https://doi.org/10.1177/0014402916651847
66. Tester JM, Laraia BA, Leung CW, Mietus-Snyder ML. Dyslipidemia and food security inlow-income US adolescents: National Health and Nutrition Examination Survey, 2003–2010.Prev Chronic Dis 2016;13:E22. https://doi.org/10.5888/pcd13.150441
67. Trapp CM, Burke G, Gorin AA, Wiley JF, Hernandez D, Crowell RE, et al. The relationshipbetween dietary patterns, body mass index percentile, and household food security in youngurban children. Child Obes 2015;11:148–55. https://doi.org/10.1089/chi.2014.0105
68. Wadsworth L. Food insecurity in Nova Scotia youths. J Nutr Educ Behav 2012;44:S57.https://doi.org/10.1016/j.jneb.2012.03.128
69. Weinreb L, Wehler C, Perloff J, Scott R, Hosmer D, Sagor L, Gundersen C. Hunger: its impacton children’s health and mental health. Pediatrics 2002;110:e41. https://doi.org/10.1542/peds.110.4.e41
70. Whitbeck LB, Chen X, Johnson KD. Food insecurity among homeless and runaway adolescents.Public Health Nutr 2006;9:47–52. https://doi.org/10.1079/PHN2005764
71. Yu M, Lombe M, Nebbitt VE. Food stamp program participation, informal supports, householdfood security and child food security: a comparison of African American and Caucasianhouseholds in poverty. Children Youth Services Rev 2010;32:767–73. https://doi.org/10.1016/j.childyouth.2010.01.015
72. Zaslow M, Bronte-Tinkew J, Capps R, Horowitz A, Moore KA, Weinstein D. Food security duringinfancy: implications for attachment and mental proficiency in toddlerhood. Matern Child Health J2009;13:66–80. https://doi.org/10.1007/s10995-008-0329-1
73. Murphy JM, Wehler CA, Pagano ME, Little M, Kleinman RE, Jellinek MS. Relationship betweenhunger and psychosocial functioning in low-income American children. J Am Acad Child AdolescPsychiatry 1998;37:163–70. https://doi.org/10.1097/00004583-199802000-00008
74. Kohn MJ, Bell JF, Grow HM, Chan G. Food insecurity, food assistance and weight status in USyouth: new evidence from NHANES 2007–08. Pediatr Obes 2014;9:155–66. https://doi.org/10.1111/j.2047-6310.2012.00143.x
75. Mark S, Lambert M, O’Loughlin J, Gray-Donald K. Household income, food insecurity andnutrition in Canadian youth. Can J Public Health 2012;103:94–9.
76. Pickett W, Michaelson V, Davison C. Beyond nutrition: hunger and its impact on the health ofyoung Canadians. Int J Public Health 2015;60:527–38. https://doi.org/10.1007/s00038-015-0673-z
77. Baer TE, Scherer EA, Fleegler EW, Hassan A. Food insecurity and the burden of health-relatedsocial problems in an urban youth population. J Adolesc Health 2015;57:601–7. https://doi.org/10.1016/j.jadohealth.2015.08.013
78. Barroso CS, Roncancio A, Moramarco MW, Hinojosa MB, Davila YR, Mendias E, Reifsnider E.Food security, maternal feeding practices and child weight-for-length. Appl Nurs Res2016;29:31–6. https://doi.org/10.1016/j.apnr.2015.03.009
DOI: 10.3310/phr06130 PUBLIC HEALTH RESEARCH 2018 VOL. 6 NO. 13
© Queen’s Printer and Controller of HMSO 2018. This work was produced by Aceves-Martins et al. under the terms of a commissioning contract issued by the Secretary of Statefor Health and Social Care. This issue may be freely reproduced for the purposes of private research and study and extracts (or indeed, the full report) may be included inprofessional journals provided that suitable acknowledgement is made and the reproduction is not associated with any form of advertising. Applications for commercialreproduction should be addressed to: NIHR Journals Library, National Institute for Health Research, Evaluation, Trials and Studies Coordinating Centre, Alpha House, University ofSouthampton Science Park, Southampton SO16 7NS, UK.
75

79. Bruening M, Johnson K. 197. Social support mediates the relationship between food insecurityand weight status among adolescents in New Mexico. J Adolesc Health 2015;56:S101–2.https://doi.org/10.1016/j.jadohealth.2014.10.202
80. Burke MP, Frongillo EA, Jones SJ, Bell BB, Hartline-Grafton H. Household food insecurity isassociated with greater growth in body mass index among female children from kindergartenthrough eighth grade. J Hunger Environment Nutr 2016;11:227–41. https://doi.org/10.1080/19320248.2015.1112756
81. Casey PH, Simpson PM, Gossett JM, Bogle ML, Champagne CM, Connell C, et al. The associationof child and household food insecurity with childhood overweight status. Pediatrics2006;118:e1406–13. https://doi.org/10.1542/peds.2006-0097
82. Chi DL, Masterson EE, Carle AC, Mancl LA, Coldwell SE. Socioeconomic status, food security,and dental caries in US children: mediation analyses of data from the National Health andNutrition Examination Survey, 2007–2008. Am J Public Health 2014;104:860–4. https://doi.org/10.2105/AJPH.2013.301699
83. Cook JT, Frank DA, Berkowitz C, Black MM, Casey PH, Cutts DB, et al. Food insecurity isassociated with adverse health outcomes among human infants and toddlers. J Nutr2004;134:1432–8. https://doi.org/10.1093/jn/134.6.##
84. Edwards OW, Taub GE. Children and youth perceptions of family food insecurity and bullying.School Mental Health 2017;9:263–72. https://doi.org/10.1007/s12310-017-9213-8
85. Gundersen C, Garasky S, Lohman BJ. Food insecurity is not associated with childhood obesity asassessed using multiple measures of obesity. J Nutr 2009;139:1173–8. https://doi.org/10.3945/jn.109.105361
86. Gundersen C, Lohman BJ, Garasky S, Stewart S, Eisenmann J. Food security, maternal stressors,and overweight among low-income US children: results from the National Health and NutritionExamination Survey (1999–2002). Pediatrics 2008;122:e529–40. https://doi.org/10.1542/peds.2008-0556
87. Helton JJ. Food neglect and maltreatment re-report. Children Youth Services Rev 2016;71:77–83.https://doi.org/10.1016/j.childyouth.2016.10.042
88. Holben DH, Taylor CA. Food insecurity and its association with central obesity and other markersof metabolic syndrome among persons aged 12 to 18 years in the United States. J Am OsteopathAssoc 2015;115:536–43. https://doi.org/10.7556/jaoa.2015.111
89. Howard LL. Does food insecurity at home affect non-cognitive performance at school? Alongitudinal analysis of elementary student classroom behavior. Econ Educ Rev 2011;30:157–76.https://doi.org/10.1016/j.econedurev.2010.08.003
90. Howard LL. Transitions between food insecurity and food security predict children’s social skilldevelopment during elementary school. Br J Nutr 2011;105:1852–60. https://doi.org/10.1017/S0007114510005623
91. Howard LL. Food insecurity experiences predict children’s fruit and vegetable consumption in theUSA. ISRN Nutrition 2013;2013:426029. https://doi.org/10.5402/2013/426029
92. Huang J, Oshima KM, Kim Y. Does food insecurity affect parental characteristics and child behavior?Testing mediation effects. Soc Serv Rev 2010;84:381–401. https://doi.org/10.1086/655821
93. Huang J, Vaughn MG. Household food insecurity and children’s behaviour problems: newevidence from a trajectories-based study. Br J Soc Work 2016;46:993–1008. https://doi.org/10.1093/bjsw/bcv033
REFERENCES
NIHR Journals Library www.journalslibrary.nihr.ac.uk
76

94. Jackson DB, Vaughn MG. Household food insecurity during childhood and adolescent misconduct.Prev Med 2017;96:113–17. https://doi.org/10.1016/j.ypmed.2016.12.042
95. Ryu JH, Bartfeld JS. Household food insecurity during childhood and subsequent health status:the early childhood longitudinal study – kindergarten cohort. Am J Public Health 2012;102:e50–5.https://doi.org/10.2105/AJPH.2012.300971
96. Johnson AD, Markowitz AJ. Associations between household food insecurity in early childhoodand children’s kindergarten skills. Child Dev 2017;21:21.
97. Kaur J, Lamb MM, Ogden CL. The association between food insecurity and obesity in children-the National Health and Nutrition Examination Survey. J Acad Nutr Diet 2015;115:751–8.https://doi.org/10.1016/j.jand.2015.01.003
98. Khan S, Pinckney RG, Keeney D, Frankowski B, Carney JK. Prevalence of food insecurity andutilization of food assistance program: an exploratory survey of a Vermont middle school.J Sch Health 2011;81:15–20. https://doi.org/10.1111/j.1746-1561.2010.00552.x
99. Kleinman RE, Murphy JM, Little M, Pagano M, Wehler CA, Regal K, Jellinek MS. Hunger inchildren in the United States: potential behavioral and emotional correlates. Pediatrics1998;101:E3. https://doi.org/10.1542/peds.101.1.e3
100. Kuku O, Garasky S, Gundersen C. The relationship between childhood obesity and foodinsecurity: a nonparametric analysis. Appl Econ 2012;44:2667–77. https://doi.org/10.1080/00036846.2011.566192
101. Larson N, Bruening M, MacLehose R, Story M, Neumark-Sztainer D. Household food insecurity:links to adolescent eating patterns and weight status. J Acad Nutr Diet 2012;112:A90.https://doi.org/10.1016/j.jand.2012.06.326
102. Lohman BJ, Stewart S, Gundersen C, Garasky S, Eisenmann JC. Adolescent overweight andobesity: links to food insecurity and individual, maternal, and family stressors. J Adolesc Health2009;45:230–7. https://doi.org/10.1016/j.jadohealth.2009.01.003
103. Martin KS, Ferris AM. Food insecurity and gender are risk factors for obesity. J Nutr Educ Behav2007;39:31–6. https://doi.org/10.1016/j.jneb.2006.08.021
104. Matheson DM, Varady J, Varady A, Killen JD. Household food security and nutritional status ofHispanic children in the fifth grade. Am J Clin Nutr 2002;76:210–17. https://doi.org/10.1093/ajcn/76.1.210
105. Metallinos-Katsaras E, Sherry B, Kallio J. Food insecurity is associated with overweight in childrenyounger than 5 years of age. J Am Diet Assoc 2009;109:1790–4. https://doi.org/10.1016/j.jada.2009.07.007
106. Molcho M, Gabhainn SN, Kelly C, Friel S, Kelleher C. Food poverty and health among schoolchildrenin Ireland: findings from the Health Behaviour in School-aged Children (HBSC) study. Public HealthNutr 2007;10:364–70. https://doi.org/10.1017/S1368980007226072
107. Sharkey JR, Nalty C, Johnson CM, Dean WR. Children’s very low food security is associated withincreased dietary intakes in energy, fat, and added sugar among Mexican-origin children (6-11 y)in Texas border Colonias. BMC Pediatr 2012;12:16. https://doi.org/10.1186/1471-2431-12-16
108. Slack KS, Yoo J. Food hardship and child behavior problems among low-income children. Soc Serv Rev2005;79:511–36. https://doi.org/10.1086/430894
109. Speirs KE, Fiese BH, STRONG Kids Research Team. The relationship between food insecurity andBMI for preschool children. Matern Child Health J 2016;20:925–33. https://doi.org/10.1007/s10995-015-1881-0
DOI: 10.3310/phr06130 PUBLIC HEALTH RESEARCH 2018 VOL. 6 NO. 13
© Queen’s Printer and Controller of HMSO 2018. This work was produced by Aceves-Martins et al. under the terms of a commissioning contract issued by the Secretary of Statefor Health and Social Care. This issue may be freely reproduced for the purposes of private research and study and extracts (or indeed, the full report) may be included inprofessional journals provided that suitable acknowledgement is made and the reproduction is not associated with any form of advertising. Applications for commercialreproduction should be addressed to: NIHR Journals Library, National Institute for Health Research, Evaluation, Trials and Studies Coordinating Centre, Alpha House, University ofSouthampton Science Park, Southampton SO16 7NS, UK.
77
110. To QG, Frongillo EA, Gallegos D, Moore JB. Household food insecurity is associated with lessphysical activity among children and adults in the U.S. population. J Nutr 2014;144:1797–802.https://doi.org/10.3945/jn.114.198184
111. Widome R, Neumark-Sztainer D, Hannan PJ, Haines J, Story M. Eating when there is not enoughto eat: eating behavior and perceptions of food among food-insecure youths. Am J Public Health2009;99:822–8. https://doi.org/10.2105/AJPH.2008.139758
112. Willis DE, Fitzpatrick KM. Psychosocial factors as mediators of food insecurity and weightstatus among middle school students. Appetite 2016;103:236–43. https://doi.org/10.1016/j.appet.2016.04.022
113. Winicki J, Jemison K. Food insecurity and hunger in the kindergarten classroom: its effect onlearning and growth. Contemp Econ Policy 2003;21:145–57. https://doi.org/10.1093/cep/byg001
114. Fram MS, Ritchie LD, Rosen N, Frongillo EA. Child experience of food insecurity is associated withchild diet and physical activity. J Nutr 2015;145:499–504. https://doi.org/10.3945/jn.114.194365
115. Canter KS, Roberts MC, Davis AM. The role of health behaviors and food insecurity inpredicting fruit and vegetable intake in low-income children. Child Health Care 2017;46:131–50.https://doi.org/10.1080/02739615.2015.1124772
116. Cook JT, Frank DA, Levenson SM, Neault NB, Heeren TC, Black MM, et al. Child foodinsecurity increases risks posed by household food insecurity to young children’s health. J Nutr2006;136:1073–6. https://doi.org/10.1093/jn/136.4.1073
117. Kleinman RE, Hall S, Green H, Korzec-Ramirez D, Patton K, Pagano ME, Murphy JM. Diet,breakfast, and academic performance in children. Ann Nutr Metab 2002;46(Suppl. 1):24–30.https://doi.org/10.1159/000066399
118. Ecker ME, Sifers SK. The BackPack Food Program’s effects on U.S. elementary students’ hungerand on-task behavior. J Child Nutr Manage 2013;37.
119. Gordon AR, Briefel RR, Collins AM, Rowe GM, Klerman JA. Delivering summer electronic benefittransfers for children through the Supplemental Nutrition Assistance Program or the SpecialSupplemental Nutrition Program for Women, Infants, and Children: benefit use and impacts onfood security and foods consumed. J Acad Nutr Diet 2017;117:367–75.e2. https://doi.org/10.1016/j.jand.2016.11.002
120. Klerman JA, Wolf A, Collins A, Bell S, Briefel R. The effects the summer electronic benefitstransfer for children demonstration has on children’s food security. Appl Econ Perspective Policy2017;39:516–32. https://doi.org/10.1093/aepp/ppw030
121. Korenman S, Abner KS, Kaestner R, Gordon RA. The Child and Adult Care Food Program andthe nutrition of preschoolers. Early Child Res Q 2013;28:325–36. https://doi.org/10.1016/j.ecresq.2012.07.007
122. Mhurchu CN, Gorton D, Turley M, Jiang Y, Michie J, Maddison R, et al. Effects of a free schoolbreakfast programme on children’s attendance, academic achievement and short-term hunger:results from a stepped-wedge, cluster randomised controlled trial. J Epidemiol Community Health2013;67:257–64. https://doi.org/10.1136/jech-2012-201540
123. Jansen EC, Kasper N, Lumeng JC, Brophy Herb HE, Horodynski MA, Miller AL, et al. Changes inhousehold food insecurity are related to changes in BMI and diet quality among Michigan HeadStart preschoolers in a sex-specific manner. Soc Sci Med 2017;181:168–76. https://doi.org/10.1016/j.socscimed.2017.04.003
124. Economic Research Service. U.S. Household Food Security Survey Module: Three-stage Design withScreeners. USDA; 2012. URL: www.ers.usda.gov/media/8271/hh2012.pdf (accessed May 2018).
REFERENCES
NIHR Journals Library www.journalslibrary.nihr.ac.uk
78

125. Connell CL, Nord M, Lofton KL, Yadrick K. Food security of older children can be assessed using astandardized survey instrument. J Nutr 2004;134:2566–72. https://doi.org/10.1093/jn/134.10.2566
126. Canter KS. The role of health behaviors and food insecurity in predicting food intake inlow-income children. Dissertation Abstracts International: Section B: The Sciences and Engineering2016;77(6-B(E)).
127. Pereira AL, Handa S, Holmqvist G. Prevalence and Correlates of Food Insecurity Among ChildrenAcross the Globe. Innocenti Working Paper WP-2017-09. Florence: UNICEF Office of Research;2017. URL: www.unicef-irc.org/publications/900-prevalence-and-correlates-of-food-insecurity-among-children-across-the-globe.html (accessed May 2018).
128. Food and Agriculture Organization of the United Nations. Voices of the Hungry. Food andAgriculture Organization of the United Nations; 2013. URL: www.fao.org/in-action/voices-of-the-hungry/background/en (accessed May 2018).
129. McGuiness F. Poverty in the UK: Statistics. Briefing Paper 7096. London: UK Parliament; 2018.URL: http://researchbriefings.files.parliament.uk/documents/SN07096/SN07096.pdf (accessedMay 2018).
130. Inchley J, Currie D, Vieno A, Torsheim T, Ferreira-Borges C, et al. Adolescent Alcohol-relatedBehaviours: Trends and Inequalities in the WHO European Region, 2002–2014 (2018). 2018.URL: www.euro.who.int/en/publications/abstracts/adolescent-alcohol-related-behaviours-trends-and-inequalities-in-the-who-european-region,-20022014-2018 (accessed 26 October 2018).
131. The International Polar Year Nunavut Inuit Child Health Survey 2007–2008. URL: www.mcgill.ca/cine/files/cine/child_inuit_health_survey_aug_31.pdf (accessed October 2018).
132. Statistics Canada. National Longitudinal Survey of Children and Youth (NLSCY). URL: www23.statcan.gc.ca/imdb/p2SV.pl?Function=getSurvey&Id=56797 (accessed October 2018).
133. National Center for Education Statistics. Early Childhood Longitudinal Program (ECLS).URL: https://nces.ed.gov/ecls/ (accessed October 2018).
134. Centers for Disease Control and Prevention. National Health Interview Survey. URL: www.cdc.gov/nchs/nhis/quest_doc.htm (accessed October 2018).
135. Kellogg Company. An Audit of School Breakfast Club Provision in the UK: A Report by Kellogg’s.Battle Creek, MI: Kellogg Company; 2014. URL: www.kelloggs.co.uk/content/dam/europe/kelloggs_gb/pdf/R5_Kelloggs%20Breakfast%20Club%20Audit%20APSE.pdf (accessedMay 2018).
136. Kellogg Company. The Future of School Breakfast Clubs: A Funding Crisis in the UK. Battle Creek,MI: Kellogg Company; 2017. URL: www.kelloggs.co.uk/en_GB/what-we-believe/breakfasts-for-better-days/breakfast-club-network.html (accessed May 2018).
137. Graham N, Puts E, Beadle S. Evaluation of Breakfast Clubs in Schools with High Levels OfDeprivation. London: Department for Education; 2017. https://assets.publishing.service.gov.uk/government/uploads/system/uploads/attachment_data/file/603946/Evaluation_of_Breakfast_Clubs_-_Final_Report.pdf (accessed May 2018).
138. Lambie-Mumford H, Sims L. Children’s Experiences of Food And Poverty: The Rise andImplications of Charitable Breakfast Clubs and Holiday Hunger Projects in the UK. SheffieldPolitical Economy Research Institute; 2017. URL: http://speri.dept.shef.ac.uk/speri-briefs/(accessed May 2018).
139. Shemilt I, Harvey I, Shepstone L, Swift L, Reading R, Mugford M, et al. A national evaluation of schoolbreakfast clubs: evidence from a cluster randomized controlled trial and an observational analysis.Child Care Health Dev 2004;30:413–27. https://doi.org/10.1111/j.1365-2214.2004.00453.x
DOI: 10.3310/phr06130 PUBLIC HEALTH RESEARCH 2018 VOL. 6 NO. 13
© Queen’s Printer and Controller of HMSO 2018. This work was produced by Aceves-Martins et al. under the terms of a commissioning contract issued by the Secretary of Statefor Health and Social Care. This issue may be freely reproduced for the purposes of private research and study and extracts (or indeed, the full report) may be included inprofessional journals provided that suitable acknowledgement is made and the reproduction is not associated with any form of advertising. Applications for commercialreproduction should be addressed to: NIHR Journals Library, National Institute for Health Research, Evaluation, Trials and Studies Coordinating Centre, Alpha House, University ofSouthampton Science Park, Southampton SO16 7NS, UK.
79

140. Murphy S, Moore GF, Tapper K, Lynch R, Clarke R, Raisanen L, et al. Free healthy breakfasts inprimary schools: a cluster randomised controlled trial of a policy intervention in Wales, UK.Public Health Nutr 2011;14:219–26. https://doi.org/10.1017/S1368980010001886
141. Van Wye G, Seoh H, Adjoian T, Dowell D. Evaluation of the New York City Breakfast inthe Classroom program. Am J Public Health 2013;103:e59–64. https://doi.org/10.2105/AJPH.2013.301470
142. Davies C. School Breakfast Program 2011 Evaluation Report. Perth, WA: Healthy Food for All;2012. URL: www.healthyfoodforall.com.au/images/uploads/120213_SBP2011_Report_Final1.pdf(accessed May 2018).
143. Food and Nutrition Services. Evaluation of the School Breakfast Program Pilot Project. FinalReport. Food and Nutrition Services, United States Department of Agriculture; 2004.URL: https://fns-prod.azureedge.net/sites/default/files/SBPPFinal.pdf (accessed May 2018).
144. Forsey A. Hungry Holidays: A Report on Hunger Amongst Children During School Holidays.All-Party Parliamentary Group on Hunger; 2017. URL: https://feedingbritain.files.wordpress.com/2015/02/hungry-holidays.pdf (accessed May 2018).
145. National Education Union. NUT Survey on Holiday Hunger. London: National Education Union; 2017.URL: www.teachers.org.uk/news-events/conference-2017/nut-survey-holiday-hunger (accessedMay 2018).
146. Feeding Britain. Ending Hunger in the Holidays. Feeding Britain; 2018. URL: www.feedingbritain.org/Handlers/Download.ashx?IDMF=123ee6f1-631d-48d7-94a5-a801dd2ac89a (accessed May 2018).
147. Aberdeen City Council. Councillors Give Backing to School Holiday Meals Initiative [News Item].Aberdeen: Aberdeen City Council; 2018. URL: https://news.aberdeencity.gov.uk/councillors-give-backing-to-school-holiday-meals-initiative/ (accessed May 2018).
148. Scottish Government. Dignity: Ending Hunger Together in Scotland. Report of the IndependentWorking Group on Food Poverty. Edinburgh: Scottish Government; 2016. https://beta.gov.scot/publications/dignity-ending-hunger-together-scotland-report-independendent-working-group-food/(accessed May 2018).
149. The Trussell Trust. The Trussel Trust: Latest Stats. Salisbury: The Trussell Trust; 2018.URL: www.trusselltrust.org/ (accessed May 2018).
150. The Trussell Trust. Half of Children Helped by Foodbanks Over Summer Holiday Months arePrimary School Children [News Item]. Salisbury: The Trussell Trust; 2017. URL: www.trusselltrust.org/2017/07/25/half-children-helped-foodbanks-summer-holiday-months-primary-school-students/(accessed May 2018).
151. Downing E, Kennedy S, Fell M. Food Banks and Food Poverty. Standard Note SN06657. London:House of Commons; 2014. http://researchbriefings.parliament.uk/ResearchBriefing/Summary/SN06657 (accessed May 2018).
152. Forsey A. An Evidence Review for the All-Party Parliamentary Inquiry into Hunger in theUnited Kingdom. All Part Parliamentary Inquiry into Hunger in the United Kingdom; 2015.URL: https://feedingbritain.files.wordpress.com/2015/02/food-poverty-appg-evidence-review-final.pdf(accessed May 2018).
153. Forsey A. Britain’s Not-so-hidden Hunger. All-Party Parliamentary Group on Hunger; 2016.URL: https://feedingbritain.files.wordpress.com/2017/01/437488_tso_britains-not-so-hidden-hunger.pdf(accessed May 2018).
REFERENCES
NIHR Journals Library www.journalslibrary.nihr.ac.uk
80

154. Office for National Statistics. Living Costs and Food Survey. User Guidance and TechnicalInformation for the Living Costs and Food Survey. URL: www.ons.gov.uk/peoplepopulationandcommunity/personalandhouseholdfinances/incomeandwealth/methodologies/livingcostsandfoodsurvey (accessed November 2018).
155. Food Foundation. Measuring Household Food Insecurity in the UK and Why We MUST Do It:4 Facts You Should Know. URL: https://foodfoundation.org.uk/wp-content/uploads/2016/07/MeasuringHouseholdFoodInsecurity.pdf (accessed November 2018).
156. Church Action on Poverty. Step up to the Plate: Towards a UK Food and Poverty Strategy. ChurchAction on Poverty; 2018. URL: www.church-poverty.org.uk/news/pressroom/resources/reports/stepuptotheplate/view (accessed May 2018).
157. Tait C. Hungry for Change. Fabian Society; 2015. URL: https://fabians.org.uk/publication/hungry-for-change/ (accessed May 2018).
158. Food Research and Action Center. Understanding the Connections: Food Insecurity and Obesity.Food Research and Action Center; 2015. URL: http://frac.org/wp-content/uploads/frac_brief_understanding_the_connections.pdf (accessed May 2018).
159. Metallinos-Katsaras E, Must A, Gorman K. A longitudinal study of food insecurity on obesity inpreschool children. J Acad Nutr Diet 2012;112:1949–58. https://doi.org/10.1016/j.jand.2012.08.031
160. Beaulac J, Kristjansson E, Cummins S. A systematic review of food deserts, 1966–2007.Preventing Chronic Disease 2009;6:A105.
161. Larson NI, Story MT, Nelson MC. Neighborhood environments: disparities in access to healthy foodsin the U.S. Am J Prevent Med 2009;36:74–81. https://doi.org/10.1016/j.amepre.2008.09.025
162. Bell J, Mora G, Hagan E, Rubin V, Karpyn A. Access to Healthy Food and Why It Matters: A Reviewof the Research. 2013. URL: www.policylink.org/find-resources/library/access-to-healthy-food-and-why-it-matters (accessed 23 October 2018).
163. Ver Ploeg M, Mancino L, Todd JE, Clay DM, Scharadin B. Where Do Americans Usually Shop forFood and How Do They Travel To Get There? Initial Findings from the National Household FoodAcquisition and Purchase Survey. Washington, DC: U.S. Department of Agriculture, EconomicResearch Service; 2015.
164. Andreyeva T, Blumenthal DM, Schwartz MB, Long MW, Brownell KD. Availability and prices offoods across stores and neighborhoods: the case of New Haven, Connecticut. Health Affairs2008;27:1381–8. https://doi.org/10.1377/hlthaff.27.5.1381
165. Evans A, Banks K, Jennings R, Nehme E, Nemec C, Sharma S, et al. Increasing access to healthfulfoods: a qualitative study with residents of low-income communities. Int J Behav Nut Phys Act2015;12(Suppl. 1):5. https://doi.org/10.1186/1479-5868-12-S1-S5
166. Fleischhacker SE, Evenson KR, Rodriguez DA, Ammerman AS. A systematic review of fast foodaccess studies. Obesity Reviews 2011;12:e460–71. https://doi.org/10.1111/j.1467-789X.2010.00715.X
167. Hilmers A, Hilmers DC, Dave J. Neighborhood disparities in access to healthy foods and theireffects on environmental justice. Am J Public Health 2012;102:1644–54. https://doi.org/10.2105/AJPH.2012.300865
168. Kestens Y, Daniel M. Social inequalities in food exposure around schools in an urban area.Am J Prevent Med 2010;39:33–40. https://doi.org/10.1016/j.amepre.2010.03.014
169. Smith JC, Medalia C. Health Insurance Coverage in the United States: 2014. U.S. Census Bureau,Current Population Reports, P60-253. Washington, DC: U.S. Government Printing Office; 2015.
DOI: 10.3310/phr06130 PUBLIC HEALTH RESEARCH 2018 VOL. 6 NO. 13
© Queen’s Printer and Controller of HMSO 2018. This work was produced by Aceves-Martins et al. under the terms of a commissioning contract issued by the Secretary of Statefor Health and Social Care. This issue may be freely reproduced for the purposes of private research and study and extracts (or indeed, the full report) may be included inprofessional journals provided that suitable acknowledgement is made and the reproduction is not associated with any form of advertising. Applications for commercialreproduction should be addressed to: NIHR Journals Library, National Institute for Health Research, Evaluation, Trials and Studies Coordinating Centre, Alpha House, University ofSouthampton Science Park, Southampton SO16 7NS, UK.
81

170. Bruening M, MacLehose R, Loth K, Story M, Neumark-Sztainer D. Feeding a family in a recession:food insecurity among Minnesota parents. Am J Public Health 2012;102:520–6. https://doi.org/10.2105/AJPH.2011.300390
171. Dammann K, Smith C. Food-related attitudes and behaviors at home, school, and restaurants:perspectives from racially diverse, urban, low-income 9- to 13-year-old children in Minnesota.J Nutr Educ Behav 2010;42:389–97. https://doi.org/10.1016/j.jneb.2009.09.003
172. Olson CM, Bove CF, Miller EO. Growing up poor: long-term implications for eating patterns andbody weight. Appetite 2007;49:198–207. https://doi.org/10.1016/j.appet.2007.01.012
173. Leung CW, Epel ES, Willett WC, Rimm EB, Laraia BA. Household food insecurity is positivelyassociated with depression among low-income Supplemental Nutrition Assistance Programparticipants and income-eligible nonparticipants. J Nutr 2015;145:622–7. https://doi.org/10.3945/jn.114.199414
174. Neckerman KM, Lovasi GS, Davies S, Purciel M, Quinn J, Feder E, et al. Disparities in urbanneighborhood conditions: evidence from GIS measures and field observation in New York City.J Public Health Policy 2009;30(Suppl. 1):264–85. https://doi.org/10.1057/jphp.2008.47
175. Bruton CM, Floyd MF. Disparities in built and natural features of urban parks: comparisons byneighborhood level race/ethnicity and income. J Urban Health 2014;91:894–907. https://doi.org/10.1007/s11524-014-9893-4
176. Obesity Health Alliance. 3 in 5 of England’s Most Deprived Boys will be Overweight or Obese by2020 [News Item]. Obesity Health Alliance; 2016. URL: http://obesityhealthalliance.org.uk/2016/10/11/3-5-englands-deprived-boys-will-overweight-obese-2020/ (accessed May 2018).
177. Nord M, Coleman A, Andrews N, Carlson S. Household Food Security in the United States, 2009.Washington, DC: USDA; 2010. URL: www.ers.usda.gov/webdocs/publications/44776/7024_err108_1_.pdf?v=41056 (accessed May 2018).
178. Aceves-Martins M, Aleman-Diaz AY, Giralt M, Solà R. Involving young people in healthpromotion, research and policy-making: practical recommendations [published online ahead ofprint May 18 2018]. Int J Qual Health Care 2018. https://doi.org/10.1093/intqhc/mzy113
179. International Food Policy Research Institute. 2018 Global Food Policy Report. Washington, DC:International Food Policy Research Institute; 2018. URL: https://reliefweb.int/sites/reliefweb.int/files/resources/132488.pdf (accessed May 2018).
180. Bernal J, Frongillo EA, Herrera H, Rivera J. Children live, feel, and respond to experiences of foodinsecurity that compromise their development and weight status in peri-urban Venezuela. J Nutr2012;142:1343–9. https://doi.org/10.3945/jn.112.158063
181. World Health Organization. Health Promoting Schools: An Effective Approach to Early Action onNoncommunicable Disease Risk Factors. Geneva: WHO; 2017. URL: http://apps.who.int/iris/bitstream/handle/10665/255625/WHO-NMH-PND-17.3-eng.pdf;jsessionid=E67488C1D01C626723FABAC02A9E87B8?sequence=1 (accessed May 2018).
182. Food and Agriculture Organization of the United Nations. The State of Food and Agriculture.Rome: Food and Agriculture Organization of the United Nations; 2006. URL: www.fao.org/3/a-a0800e.pdf (accessed May 2018).
183. Aceves-Martins M, Whitehead R, Inchley J, Giralt M, Currie C, Solà R. Self-reported weight andpredictors of missing responses in youth. Nutrition 2018;53:54–8. https://doi.org/10.1016/j.nut.2018.01.003
184. Jean-Jacques M, Persell SD, Hasnain-Wynia R, Thompson JA, Baker DW. The implications of usingadjusted versus unadjusted methods to measure health care disparities at the practice level.Am J Med Qual 2011;26:491–501. https://doi.org/10.1177/1062860611403135
REFERENCES
NIHR Journals Library www.journalslibrary.nihr.ac.uk
82

185. Arcuri S, Brunori G, Galli F. Insights on the role of private and public actors in food assistanceprovision: a literature review for high income countries. Economia Agro Alimentare/FoodEconomy 2017;19:119–50. https://doi.org/10.3280/ECAG2017-001006
186. Winston P, Angel R, Burton L, Cherlin A, Moffitt RM, Wilson WJ. Welfare, Children, and Families:A Three-City Study, Overview and Design Report. Balitmore, MD: John Hopkins University; 1999.
187. Dolan M, Smith K, Casanueva C, Ringeisen H. NSCAWII Baseline Report: Introduction toNSCAWII. OPRE Report #2011–27a. Washington, DC: Office of Planning, Research andEvaluation, Administration for Children and Families, U.S. Department of Health and HumanServices; 2011.
188. Dowd K, Dolan M, Wallin J, Miller K, Biemer P, Aragon-Logan E, Smith K. National Survey ofChild and Adolescent Well-being II (NSCAW II) Combined Waves 1–2, Data File User’s Manual,Restricted Release Version. NY: Cornell University, National Data Archive on Child Abuse andNeglect; 2011.
189. Casanueva C, Tueller S, Dolan M, Testa M, Smith K, Day O. Examining predictors of re-reportsand recurrence of child maltreatment using two national data sources. Child Youth Serv Rev2015;48:1–13. https://doi.org/10.1016/j.childyouth.2014.10.006
DOI: 10.3310/phr06130 PUBLIC HEALTH RESEARCH 2018 VOL. 6 NO. 13
© Queen’s Printer and Controller of HMSO 2018. This work was produced by Aceves-Martins et al. under the terms of a commissioning contract issued by the Secretary of Statefor Health and Social Care. This issue may be freely reproduced for the purposes of private research and study and extracts (or indeed, the full report) may be included inprofessional journals provided that suitable acknowledgement is made and the reproduction is not associated with any form of advertising. Applications for commercialreproduction should be addressed to: NIHR Journals Library, National Institute for Health Research, Evaluation, Trials and Studies Coordinating Centre, Alpha House, University ofSouthampton Science Park, Southampton SO16 7NS, UK.
83


Appendix 1 Food insecurity search strategies
MEDLINE and EMBASE
Date range searched: EMBASE, 1980 to 2017 week 49; Ovid MEDLINE(R) Epub Ahead of Print, In-Process& Other Non-Indexed Citations, Ovid MEDLINE(R) Daily and Ovid MEDLINE(R), 1946 to 4 December 2017.
Via Ovid multifile search: http://shibboleth.ovid.com/.
Date of search: 4 December 2017.
Search strategy
1. Food Insecurity/ use emez (1678)2. Food Security/ use emez (3231)3. food insecurity.kw. (1038)4. food security.kw. (1644)5. Food Supply/ use ppez (10,963)6. (food adj3 (security or insecurity or poverty or poor or sufficien$ or insufficien$)).tw. (16,718)7. Hunger/ (15,298)8. or/1-7 (40,860)9. adolescent/ or child/ or child, preschool/ use ppez (5,297,230)
10. exp juvenile/ use emez (3,166,098)11. (child$ or boy? or girl? or household? or famil$).tw. (4,907,551)12. 9 or 10 or 11 (8,592,312)13. 8 and 12 (12,407)14. exp africa/ or exp caribbean region/ or exp central america/ or exp “gulf of mexico”/ or exp latin
america/ or exp south america/ or exp antarctic regions/ or exp arctic regions/ or exp asia/ (2,493,168)15. 13 not 14 (7997)16. Food Assistance/ (1467)17. Food Services/ use ppez (5374)18. (food adj2 (bank? or pantry or pantries or aid or parcel?)).tw. (1255)19. (voucher? or stamp?).tw. (10,597)20. (club? adj2 (breakfast or lunch or supper or food)).tw. (104)21. (meal? adj2 (school or nurser$ or free)).tw. (2216)22. (holiday adj2 (club? or food or kitchen)).tw. (20)23. magic breakfast.tw. (0)24. (trussell or fareshare).tw. (111)25. ((food or meal? or breakfast or lunch or supper or nutrition$) adj3 (program$ or project? or scheme?
or support or school)).tw. (51,209)26. or/16-25 (67,019)27. 15 and 26 (1496)28. exp Child Behavior/ (64,220)29. Child Behavior Disorders/ use ppez (21,646)30. exp Child Development/ (99,622)31. exp Child Development Disorders, Pervasive/ (87,868)32. Developmental Disabilities/ use ppez (19,298)33. Developmental Disorder/ use emez (32,407)34. exp Neurodevelopmental Disorders/ use ppez (178,860)35. Child Health/ (22,651)36. Child growth/ use emez (11,451)
DOI: 10.3310/phr06130 PUBLIC HEALTH RESEARCH 2018 VOL. 6 NO. 13
© Queen’s Printer and Controller of HMSO 2018. This work was produced by Aceves-Martins et al. under the terms of a commissioning contract issued by the Secretary of Statefor Health and Social Care. This issue may be freely reproduced for the purposes of private research and study and extracts (or indeed, the full report) may be included inprofessional journals provided that suitable acknowledgement is made and the reproduction is not associated with any form of advertising. Applications for commercialreproduction should be addressed to: NIHR Journals Library, National Institute for Health Research, Evaluation, Trials and Studies Coordinating Centre, Alpha House, University ofSouthampton Science Park, Southampton SO16 7NS, UK.
85

37. Diet/ (341,126)38. Child Nutrition/ use emez (15,195)39. Nutritive Value/ (27,150)40. (child$ adj3 (health or develop$ or disorder$ or well being or social)).tw. (273,004)41. (child adj3 (mental or psychiat$ or psychologic$ or cognitiv$)).tw. (26,908)42. (child adj3 (growth or height or weight or diet or nutrit$)).tw. (12,022)43. (child adj3 (academic or reading or numer$ or verbal or speech or learn$)).tw. (3350)44. or/28-43 (1,022,534)45. 15 and 44 (2383)46. exp “costs and cost analysis”/ use ppez (224,968)47. exp economic evaluation/ use emez (269,065)48. economics/ (255,203)49. health economics/ use emez (34,892)50. exp health care cost/ use emez (257,803)51. exp economics,hospital/ use ppez (23,588)52. exp economics,medical/ use ppez (14,400)53. economics,pharmaceutical/ use ppez (3003)54. pharmacoeconomics/ use emez (6692)55. exp models, economic/ use ppez (14,182)56. exp decision theory/ (13,447)57. monte carlo method/ (60,837)58. markov chains/ (15,527)59. exp technology assessment, biomedical/ (23,358)60. (cost$ adj2 (effective$ or utilit$ or benefit$ or minimis$)).ab. (288,499)61. economics model$.tw. (127)62. (economic$ or pharmacoeconomic$).tw. (502,318)63. (price or prices or pricing).tw. (77,919)64. budget$.tw. (57,824)65. (value adj1 money).tw. (61)66. (expenditure$ not energy).tw. (58,544)67. markov$.tw. (45,252)68. monte carlo.tw. (83,728)69. (decision$ adj2 (tree? or analy$ or model$)).tw. (45,263)70. or/46-69 (1,687,881)71. (metabolic adj cost).tw. (2531)72. ((energy or oxygen) adj (cost or expenditure)).tw. (56,771)73. 70 not (71 or 72) (1,686,109)74. 15 and 73 (1490)75. (food adj1 (security or insecurity)).ti. (4178)76. 75 and child$.tw,kw,hw. (1408)77. 27 or 45 or 74 or 76 (4900)78. 77 not (letter or note or comment or editorial or abstract).pt. (4319)79. limit 78 to english language (4156)80. limit 79 to yr=“1995 – 2017” (3866)
CAB abstracts
Date range searched: 1990 to 2017 week 47.
Via Ovid: http://shibboleth.ovid.com/.
Date of search: 4 December 2017.
APPENDIX 1
NIHR Journals Library www.journalslibrary.nihr.ac.uk
86

Search strategy
1. food security/ (18,731)2. (food adj3 (security or insecurity or poverty or poor or sufficienc$ or insufficienc$)).tw. (29,876)3. Hunger/ (3642)4. or/1-3 (32,379)5. exp children/ or adolescents/ (125,323)6. (child$ or boy? or girl?).tw. (168,810)7. 5 or 6 (168,810)8. 4 and 7 (2651)9. exp developing countries/ (1,583,325)
10. 8 not 9 (1152)11. limit 10 to (english language and yr="1996 - 2017”) (1089)
PsycINFO
Date range searched: 1987 to November week 2 2017.
Via Ovid: http://shibboleth.ovid.com/.
Date of search: 4 December 2017.
Search strategy
1. (food adj3 (security or insecurity or poverty or poor or sufficienc$ or insufficienc$)).tw. (1512)2. Hunger/ (1034)3. food insecurity.id. (398)4. food security.id. (211)5. or/1-4 (2471)6. (child$ or boy? or girl? or adolescent?).af. (1,324,695)7. 5 and 6 (1347)8. (africa or asia or “south america” or “central america”).af. (120,026)9. 7 not 8 (1041)
10. limit 9 to (english language and yr=“1996 - 2017”) (977)
CINAHL
Date range searched: 1982 to December 2017.
Via EBSCOhost: http://search.ebscohost.com.
Date of search: 4 December 2017.
Search strategy
S1 (MH “Food Security”)S2 TX ( food N3 (security or insecurity) ) OR TX ( food N3 (poverty or poor) ) OR TX ( food N3 (insufficienc*or sufficienc*))S3 S1 OR S2S4 (MH “Child+”) OR (MH “Adolescence+”)
DOI: 10.3310/phr06130 PUBLIC HEALTH RESEARCH 2018 VOL. 6 NO. 13
© Queen’s Printer and Controller of HMSO 2018. This work was produced by Aceves-Martins et al. under the terms of a commissioning contract issued by the Secretary of Statefor Health and Social Care. This issue may be freely reproduced for the purposes of private research and study and extracts (or indeed, the full report) may be included inprofessional journals provided that suitable acknowledgement is made and the reproduction is not associated with any form of advertising. Applications for commercialreproduction should be addressed to: NIHR Journals Library, National Institute for Health Research, Evaluation, Trials and Studies Coordinating Centre, Alpha House, University ofSouthampton Science Park, Southampton SO16 7NS, UK.
87

S5 TX (child* or boy* or girl* or household or family)S6 S4 OR S5S7 S3 AND S6S8 (MH “Africa+”) OR (MH “Central America+”) OR (MH “South America+”) OR (MH “West Indies+”)OR (MH “Asia+”)S9 S7 NOT S8S10 S7 NOT S8- Published Date: 19960101-20171231 Narrow by Language:- english
ERIC
Date range searched: 1996 to December 2017.
Via EBSCOhost: http://search.ebscohost.com.
Date of search: 4 December 2017.
Search strategy
S1 TX ( food N3 (insecurity or security) ) OR TX ( food N3 (poverty or poor) ) TX ( food N3 (insufficienc*or sufficienc*) )Limiters – Date Published: 19960101-20171231 Narrow by Language: - english
ASSIA
Date range searched: 1996–2017.
Via ProQuest: www.proquest.com.
Date of search: 4 December 2017.
Search strategy(MAINSUBJECT.EXACT(“Food security”) OR ab((food W3 (security OR insecurity OR poverty OR poor ORinsufficienc* OR sufficienc*))) OR ti((food W3 (security OR insecurity OR poverty OR poor OR insufficienc*OR sufficienc*)))) AND (la.exact(“ENG”) AND yr(1996-2017))
Social Science Citation Index
Database: =SSCI Timespan=1996–2017.
Via Web of Knowledge: www.webofknowledge.com.
Date of search: 4 December 2017.
Search strategy
# 1# 2 6,166 (TS=food security) AND LANGUAGE: (English)#2 2,859 (TS=food insecurity) AND LANGUAGE: (English)# 3 363 (TS=food sufficiency) AND LANGUAGE: (English)# 4 422 (TS=food insufficiency) AND LANGUAGE: (English)# 5 2,911 (TS=food poverty) AND LANGUAGE: (English)
APPENDIX 1
NIHR Journals Library www.journalslibrary.nihr.ac.uk
88

# 6 9,308 (#1 OR #2 OR #3 OR #4 OR #5) AND LANGUAGE: (English)# 7 408,518 (TS= (child* or boy* or girl*)) AND LANGUAGE: (English)# 8 1,885 (#6 and #7) AND LANGUAGE: (English)# 9 66,757 (TS=developing countr*) AND LANGUAGE: (English)# 10 185,281 (TS=(Russia* or india* or Pakistan* or china or Chinese)) AND LANGUAGE: (English)# 11 63,416 (TS=(carribean or mexic* or argentin* or brazil* or chile*)) AND LANGUAGE: (English)# 12 145,371 (TS=(africa* or Egypt* or Ethiopia* or Kenya* or tanzania* or Uganda* or niger*)) ANDLANGUAGE: (English)# 13 421,820 #12 OR #11 OR #10 OR #9# 14 1,070 (#8 NOT #13) AND LANGUAGE: (English) Refined by: DOCUMENT TYPES: ( ARTICLE )
The Cochrane Library
Cochrane Database of Systematic Reviews: Issue 12 of 12, December 2017.
Cochrane Central Register of Controlled Trials: Issue 11 of 12, November 2017.
Via The Cochrane Library: www.thecochranelibrary.com.
Date of search: 4 December 2017.
Search strategy
#1 food next/3 (security or insecurity or poverty or poor or insufficienc* or sufficienc*):ti,ab,kw (Wordvariations have been searched) (194)#2 MeSH descriptor: [Child] explode all trees (250)#3 MeSH descriptor: [Adolescent] explode all trees (93,070)#4 (child* or boy* or girl* or household or family):ti,ab,kw (Word variations have been searched) (124,680)#5 #2 or #3 or #4 (188,198)#6 #1 and #5 (140)#7 MeSH descriptor: [Africa] explode all trees (6140)#8 MeSH descriptor: [Central America] explode all trees (250)#9 MeSH descriptor: [South America] explode all trees (2131)#10 MeSH descriptor: [Caribbean Region] explode all trees (391)#11 MeSH descriptor: [Asia] explode all trees (16,815)#12 #7 or #8 or #9 or #10 or #11 (25,256)#13 #6 and not #12 (91)
Sources of grey literature: websites consulted
UK national and regional sourcesUK Parliament All Parliamentary Party Group on Hunger: www.parliament.uk/
UK Department of Health: www.gov.uk/government/organisations/department-of-health
Scottish Government Working Group: www.gov.scot/
NHS Health Scotland: www.healthscotland.com/
Royal College of Paediatrics & Child Health: www.rcpch.ac.uk/
DOI: 10.3310/phr06130 PUBLIC HEALTH RESEARCH 2018 VOL. 6 NO. 13
© Queen’s Printer and Controller of HMSO 2018. This work was produced by Aceves-Martins et al. under the terms of a commissioning contract issued by the Secretary of Statefor Health and Social Care. This issue may be freely reproduced for the purposes of private research and study and extracts (or indeed, the full report) may be included inprofessional journals provided that suitable acknowledgement is made and the reproduction is not associated with any form of advertising. Applications for commercialreproduction should be addressed to: NIHR Journals Library, National Institute for Health Research, Evaluation, Trials and Studies Coordinating Centre, Alpha House, University ofSouthampton Science Park, Southampton SO16 7NS, UK.
89
Scottish Food Coalition: www.foodcoalition.scot/
Food Standards Agency: www.food.gov.uk/
Food Foundation: http://foodfoundation.org.uk/
Food Ethics Council: www.foodethicscouncil.org/
Food Research Collaboration: http://foodresearch.org.uk/
Food Poverty Alliance: www.povertyalliance.org/
Healthy Living UK: http://healthylivinguk.org/
Feeding Britain: https://feeding-britain.org/
Community Food & Health Scotland: www.communityfoodandhealth.org.uk/
Joseph Rowntree Foundation: www.jrf.org.uk/
Church Action on Poverty: www.church-poverty.org.uk/
Child Poverty Action Group: www.cpag.org.uk/
Poverty & Social Exclusion: www.poverty.ac.uk/
Fabian Society: www.fabians.org.uk/
Shake Up Your Wake Up: www.shakeupyourwakeup.com/
Magic Breakfast: www.magicbreakfast.com/
The Trussell Trust: www.trusselltrust.org/
FareShare: http://fareshare.org.uk/
British Red Cross: www.redcross.org.uk/
Sustain: www.sustainweb.org/foodpoverty/
International sourcesUNICEF: www.unicef-irc.org/
UN Food & Agriculture Organization: www.fao.org/
United States Department of Agriculture Food and Nutrition Services: www.fns.usda.gov/
Food Insecurity Policy Research: http://proof.utoronto.ca/
Child Trends (US): www.childtrends.org/
Joint Centre for Poverty Research: www.eurofoodbank.org/
APPENDIX 1
NIHR Journals Library www.journalslibrary.nihr.ac.uk
90
United States Department of Agriculture Food Programs [SNAP, Special Supplemental Nutrition Programmefor Women, Infants and Children (WIC), School Breakfast, School Lunch, Summer Food, Fresh Fruit andVegetables, etc.]: www.fns.usda.gov/programs-and-services
European Federation of Food Banks: www.eurofoodbank.org/
DOI: 10.3310/phr06130 PUBLIC HEALTH RESEARCH 2018 VOL. 6 NO. 13
© Queen’s Printer and Controller of HMSO 2018. This work was produced by Aceves-Martins et al. under the terms of a commissioning contract issued by the Secretary of Statefor Health and Social Care. This issue may be freely reproduced for the purposes of private research and study and extracts (or indeed, the full report) may be included inprofessional journals provided that suitable acknowledgement is made and the reproduction is not associated with any form of advertising. Applications for commercialreproduction should be addressed to: NIHR Journals Library, National Institute for Health Research, Evaluation, Trials and Studies Coordinating Centre, Alpha House, University ofSouthampton Science Park, Southampton SO16 7NS, UK.
91


Appendix 2 General characteristics ofincluded studies
DOI: 10.3310/phr06130 PUBLIC HEALTH RESEARCH 2018 VOL. 6 NO. 13
© Queen’s Printer and Controller of HMSO 2018. This work was produced by Aceves-Martins et al. under the terms of a commissioning contract issued by the Secretary of Statefor Health and Social Care. This issue may be freely reproduced for the purposes of private research and study and extracts (or indeed, the full report) may be included inprofessional journals provided that suitable acknowledgement is made and the reproduction is not associated with any form of advertising. Applications for commercialreproduction should be addressed to: NIHR Journals Library, National Institute for Health Research, Evaluation, Trials and Studies Coordinating Centre, Alpha House, University ofSouthampton Science Park, Southampton SO16 7NS, UK.
93

TABLE 12 General characteristics of included studies (n= 109)
Study authors andyear of publication Country Study design Children’s age Population
Number ofparticipants/sample size
RQaddressed Project/study/programme
Belsky et al. 201019 UK Longitudinal 5–12 years Families with same-sex twins 2123 children 1 and 3 Environmental RiskLongitudinal Twin Study
Harvey 201630 UK Qualitative 5–11 yearsmedian 9 years)
Participants recruited from KidsCompany (UK charity thatsupports inner-city deprivedchildren)
19 children 1 Kids Company (registeredcharity in the UK). Data used:spring 2014
Harvey-Goldinget al. 201532
UK Qualitative Mean 9 years Three primary schools located inan area of high socioeconomicdeprivation
15 children 1 None reported
Harvey-Goldinget al. 201631
UK Qualitative Stakeholders Participating schools located incommunities within the bottomhalf of neighbourhoods rankedon indicators of deprivation
19 stakeholders 1 UFSB
Sellen et al. 200259 UK Mixed methods < 5 years Refugee population living ineast London
30 families 1 Refugee Education Teamand Community RenewalProgramme
Molcho et al.2007106
Ireland Observational 10–17 years Nationally representative sampleof schools
8424 students 3 (Irish) HBSC study. Data used:2002
Broughton et al.200621
Canada Observational 2–5 years Families from low-incomeneighbourhoods who spokeEnglish, Cantonese or Mandarin
142 households withchildren
1 and 3 None reported
Carter et al. 201223 Canada Longitudinal 4–10 years Children born and raised inQuébec
1746 children 1 Québec Longitudinal Study ofChild Development
Egeland et al.201127
Canada Observational 3–5 years Inuit pre-schoolers in Canada’sNunavut Territory
374 children 1 and 3 Nunavut Inuit Child HealthSurvey. Data used: 2007–8
Kirkpatrick andTarasuk 200843
Canada Observational 1–18 years Participants living in privateresidences across Canada
7353 children andadolescents
1 Canadian Community HealthSurvey. Data used: 2004(cycle 2.2)
Kirkpatrick et al.201042
Canada Longitudinal 10–21 years Data from a nationallongitudinal survey
9142 (5809 childrenand 3333 youth)
1 and 3 Canadian National LongitudinalSurvey of Children and Youth.Data used: 1994–2004/5
APPEN
DIX
2
NIHRJournals
Librarywww.journalslibrary.nihr.ac.uk
94

Study authors andyear of publication Country Study design Children’s age Population
Number ofparticipants/sample size
RQaddressed Project/study/programme
Marjerrison et al.201145
Canada Observational Mean 11.8 years,SD 4 years
Households with a child withinsulin-requiring diabetesmellitus
183 families 1 and 3 None reported
Mark et al. 201275 Canada Observational 9–18 years Participants living in privatedwellings in Canada
8938 3 Canadian Community HealthSurvey. Data used: 2004(cycle 2.2)
McIsaac et al.201746
Canada Observational 3–5 years Population based, cross-sectionalsurvey of Inuit children in theCanadian territory of Nunavut
215 caregivers 1 The Nunavut Inuit Child HealthSurvey. Data used: 2007–8
Pickett et al. 201576 Canada Observational 11–15 years Nationally representative sampleof schools
25,912 students 3 (Canadian) HBSC study. Dataused: 2009–10
Wadsworth 201268 Canada Observational 7–11 years Students in seventh to eleventhgrades
918 students 1 Keeping Pace provincial healthsurveillance project
Arteaga et al.201718
USA Longitudinal 6–9 years,8–11 years and10–13 years
Hispanic children 2150 in 1998 and2800 in 2011
1 ECLS-K. Data used: 1998–9,2010–11
Baer et al. 201577 USA Observational 15–25 years(mean 18 years)
Youths living in urban Boston 15–17 years, n = 172
18–25 years, n = 228
3 The Online Advocate study
Barroso et al. 201678 USA Observational 12–24 months(mean 17 months,SD 4.2 months)
Hispanic low-income peopleenrolled in a WIC programme
240 mother–childdyads
3 and 4 The WIC programme in theSouth-Western USA
Bhargava et al.200820
USA Longitudinal Mean 73 months Children from kindergarten tofifth grade
7635 children 1 and 3 ECLS-K. Data used: 1999–2003
Bruening andJohnson 201579
USA Observational Mean 15.8 years,SD 1.2 years
Youths part of The New MexicoYouth Risk and Resiliency Survey
5869 adolescents 3 None reported
Bruening et al.201722
USA Observational Mean 14.6 years,SD 2.3 years
Participants from six publichousing sites located inlow-income neighbourhoodswho spoke English or Spanish
55 adolescents 1 None reported (reported as apilot study)
continued
DOI:10.3310/phr06130
PUBLIC
HEA
LTHRESEA
RCH2018
VOL.6
NO.13
©Queen
’sPrinter
andController
ofHMSO
2018.This
work
was
producedby
Aceves-M
artinset
al.under
theterm
sof
acom
missioning
contractissued
bythe
Secretaryof
Statefor
Health
andSocialC
are.This
issuemay
befreely
reproducedfor
thepurposes
ofprivate
researchand
studyand
extracts(or
indeed,the
fullreport)may
beincluded
inprofessionaljournals
providedthat
suitableacknow
ledgement
ismade
andthe
reproductionisnot
associatedwith
anyform
ofadvertising.
Applications
forcom
mercial
reproductionshould
beaddressed
to:NIHRJournals
Library,NationalInstitute
forHealth
Research,Evaluation,
Trialsand
StudiesCoordinating
Centre,
Alpha
House,
University
ofSoutham
ptonScience
Park,Southam
ptonSO
167N
S,UK.
95

TABLE 12 General characteristics of included studies (n= 109) (continued )
Study authors andyear of publication Country Study design Children’s age Population
Number ofparticipants/sample size
RQaddressed Project/study/programme
Burke et al. 201680 USA Longitudinal Baseline: malesmean 68.8 months(SD 4.5 months);females mean68.1 months(SD 4.1 months)
Children from kindergarten toeighth grade
Varied accordingtime point: maximumincluded n= 15,158(1999) to minimumincluded n= 5753(2007)
3 ECLS-K. Data used: fall 1998;spring 1999; spring 2002;spring 2004; and spring 2007
Canter et al. 2017115 USA Observational 5–10 years(mean 7.7 years,SD 1.7 years)
English-speaking parents with achild (aged 5–10 years) in theircare, who received servicesthrough an organisation devotedto serving low-income familiesin a large metropolitan area inthe USA
148 children 4 None reported
Casey et al. 20058 USA Observational 3–17 years Counties selected on populationsize, % of population who wereAfrican American, % of peopleliving below the federal povertylevel
399 children 3 None reported
Casey et al. 200681 USA Observational 3–17 years Representative sample of theUS population
6995 children 3 NHANES. Data used:1999–2002
Chi et al. 201482 USA Observational 5–17 years Representative sample of theUS population
2206 children 3 NHANES. Data used: 2007–8
Chilton et al. 200924 USA Observational 0–3 years Participants recruited atemergency departments andpaediatric care clinics beingseen for conditions that werenot life-threatening, if mothersspoke English or Spanish
19,275 mothers 1 and 3 C-SNAP. Data used:1998–2005
APPEN
DIX
2
NIHRJournals
Librarywww.journalslibrary.nihr.ac.uk
96

Study authors andyear of publication Country Study design Children’s age Population
Number ofparticipants/sample size
RQaddressed Project/study/programme
Connell et al.200525
USA Qualitative 11–16 years Children from two after-schoolprogrammes for low-incomechildren in a mid-sized central cityand from a rural middle schoolwith a high rate of eligibility forfree and reduced-price schoolmeals
32 children 1 This study was the first phaseof a three-phase researchproject designed to develop aFS survey module that could beadministered directly tochildren
Cook et al. 200483 USA Observational ≤ 36 months Children whose adult caregiverswere interviewed at the sixC-SNAP sites
11,539 caregivers 3 and 4 C-SNAP. Data used:1998–2004
Cook et al. 2006116 USA Observational ≤ 36 months Participants recruited atemergency departments andpaediatric care clinics being seenfor conditions that were notlife-threatening, if mothersspoke English or Spanish
17,130 caregivers 4 C-SNAP. Data used:1998–2002
Dunifon andKowaleski-Jones200326
USA Observational 6–12 years US nationally representativesample
1854 children 1, 3 and 4 Study evaluating the NSLP byusing data from data from theChild Development Supplementof the Panel Study of IncomeDynamics. Data used: 1997
Ecker and Sifers2013118
USA Non-randomisedcomparative
Kindergartenthrough sixth grade(ages not specified)
Schools with high % of studentsreceiving free/reduced lunches
192 students(hunger surveys wereevaluated for82 students)
4 BackPack Food Program
Edwards and Taub201784
USA Observational 11–16 years Nationally representative samplefrom elementary, middle andhigh schools across the USA
12,642 students 3 US HBSC study. Data used:2009–10
Eicher-Miller et al.200928
USA Observational 3–19 years(mean 14.6 yearsSD 2.3 years)
Representative childrenand adolescents fromnon-institutionalised andcivilian US population
11,247 children andadolescents
1 and 3 NHANES. Data used:1999–2000, 2001–2 and2003–4
continued
DOI:10.3310/phr06130
PUBLIC
HEA
LTHRESEA
RCH2018
VOL.6
NO.13
©Queen
’sPrinter
andController
ofHMSO
2018.This
work
was
producedby
Aceves-M
artinset
al.under
theterm
sof
acom
missioning
contractissued
bythe
Secretaryof
Statefor
Health
andSocialC
are.This
issuemay
befreely
reproducedfor
thepurposes
ofprivate
researchand
studyand
extracts(or
indeed,the
fullreport)may
beincluded
inprofessionaljournals
providedthat
suitableacknow
ledgement
ismade
andthe
reproductionisnot
associatedwith
anyform
ofadvertising.
Applications
forcom
mercial
reproductionshould
beaddressed
to:NIHRJournals
Library,NationalInstitute
forHealth
Research,Evaluation,
Trialsand
StudiesCoordinating
Centre,
Alpha
House,
University
ofSoutham
ptonScience
Park,Southam
ptonSO
167N
S,UK.
97

TABLE 12 General characteristics of included studies (n= 109) (continued )
Study authors andyear of publication Country Study design Children’s age Population
Number ofparticipants/sample size
RQaddressed Project/study/programme
Eicher-Miller et al.201129
USA Observational 8–19 years Representative = childrenand adolescents fromnon-institutionalised andcivilian US population
5270 children andadolescents
1 ands 3 NHANES. Data used: 2001–2and 2003–4
Fram et al. 20116 USA Qualitative 9–16 years Families from homes in rural andnon-rural areas recruited fromfood pantries, soup kitchens,social services agencies andcommunity centres
26 children andadolescents
1 None reported
Fram et al. 2015114 USA Observational Mean 10.1 years,SD 0.8 years
Ethnically diverse, low-incomefourth and fifth grade childrenand their families
3605 children 3 Secondary analysis of theNetwork for a HealthyCalifornia – ChildrensPowerPlay! Campaign.Data collected for 2012
Gordon et al.2017119
USA Non-randomisedcomparative
School-agedchildren (ages notspecified)
Households with eligibleschool-aged children certifiedfor reduced or free meals
27,092 children(with FI measurement)
4 The Summer Electronic BenefitTransfer for Childrendemonstration piloted summerfood assistance throughelectronic benefit transfers,through either the WIC or theSNAP. Data used: evaluationsample in 2012
Gundersen et al.200886
USA Observational Mean 8.3 years,SD 3.7 years
Households below 200% of thepoverty line with a female adultand at least one child from anationally representative sample
841 children in425 households
3 NHANES. Data used:1999–2002 and the currentpopulation survey
Gundersen et al.200985
USA Observational 8–17 years(mean 12 years)
Households below 200% of thepoverty line from a nationallyrepresentative sample
2516 children 3 NHANES. Data used: 2001–4
Helton 201687 USA Observational 0–17 years(mean 7 years)
Children involved in ChildProtective Services investigationsof allegations of maltreatment
3580 children 3 The National Survey of Childand Adolescent Well-Being andthe National Child Abuse andNeglect Data System. Dataused: 2010
APPEN
DIX
2
NIHRJournals
Librarywww.journalslibrary.nihr.ac.uk
98

Study authors andyear of publication Country Study design Children’s age Population
Number ofparticipants/sample size
RQaddressed Project/study/programme
Himmelgreen et al.200033
USA Observational 1–6 years Low-income Hispanic caregiversrecruited from churches, sheltersand other community centres
248 caregivers ofchildren
1 Maternal/child healthprogrammes delivered by theHispanic Health Council,Hartford Hospital, ConnecticutChildren’s Medical Centre andthe WIC
Holben et al. 200434 USA Observational Households withchildren (ages notspecified)
Households with childrencurrently enrolled in Head Start(which involves provision ofsupplemental resources, such asmeals and snacks)
297 households 1 Head Start
Holben and Taylor201588
USA Observational 12–18 years(mean 14.9 years,SD 0.1 years)
Participants with waistcircumference data
7435 adolescents 3 NHANES. Data used:1999–2006
Howard 201189 USA Longitudinal 6–9 years,8–11 years and10–13 years
Students enrolled in over 1200kindergartens in the USA
4710 children 3 ECLS-K. Data used: 1999–2003
Howard 201190 USA Longitudinal 6–9 years,8–11 years and10–13 years
Students enrolled in over 1200kindergartens in the USA
4710 children 3 ECLS-K. Data used: 1999–2004
Howard 201391 USA Longitudinal 10–13 years (2004cohort), 13–16 years(2007 cohort)
Students enrolled in over 1200kindergartens in the USA
5670 children 3 ECLS-K. Data used: 2004–7
Huang et al. 201092 USA Longitudinal Mean 9.5 years,SD 3.5 years
Households with an income ofless than 200% of the povertythreshold and where parentswere the primary caregivers;from a nationally representativesample
416 children from249 households
3 Child Development Supplementto the Panel Study of IncomeDynamics. Waves included1997 and 2002
Huang and Vaughn201693
USA Longitudinal 6–9 years,8–11 years and10–13 years
Students enrolled in over 1200kindergartens in the USA
Sample size rangesfrom 6032 to 7144depending on thetime point andmissing data
3 ECLS-K. Data used: 1999–2003
continued
DOI:10.3310/phr06130
PUBLIC
HEA
LTHRESEA
RCH2018
VOL.6
NO.13
©Queen
’sPrinter
andController
ofHMSO
2018.This
work
was
producedby
Aceves-M
artinset
al.under
theterm
sof
acom
missioning
contractissued
bythe
Secretaryof
Statefor
Health
andSocialC
are.This
issuemay
befreely
reproducedfor
thepurposes
ofprivate
researchand
studyand
extracts(or
indeed,the
fullreport)may
beincluded
inprofessionaljournals
providedthat
suitableacknow
ledgement
ismade
andthe
reproductionisnot
associatedwith
anyform
ofadvertising.
Applications
forcom
mercial
reproductionshould
beaddressed
to:NIHRJournals
Library,NationalInstitute
forHealth
Research,Evaluation,
Trialsand
StudiesCoordinating
Centre,
Alpha
House,
University
ofSoutham
ptonScience
Park,Southam
ptonSO
167N
S,UK.
99

TABLE 12 General characteristics of included studies (n= 109) (continued )
Study authors andyear of publication Country Study design Children’s age Population
Number ofparticipants/sample size
RQaddressed Project/study/programme
Jacknowitz et al.201535
USA Longitudinal 9 months(2001–2), 2 years(2003–4), 4 years(2005–6)
Nationally representative sampleof children from infancy to thetime they entered school
Baseline analysissample was 7850
1 ECLS-B. Data used: 2001–8
Jackson and Vaughn201794
USA Longitudinal 6–9 years,8–11 years and10–13 years
Students enrolled in over 1200kindergartens in the USA
Sample sizes rangedfrom 6531 to 7028children dependingon the time pointand missing data
3 ECLS-K. Data used: 1999–2007
Jansen et al. 2017123 USA RCT Mean 4.4 years,SD 0.6 years
Pre-schoolers in Head Startprogramme from urban andrural areas
501 children 3 Growing Healthy Study, acluster-randomised community-based obesity intervention trialfrom Head Start programme.Data used: 2011–15
Ryu and Bartfeld201295
USA Longitudinal 6–9 years,8–11 years and10–13 years
Students enrolled in over1200 kindergartens in the USA.Analyses were limited to childrenwith full household FS statusmeasurements at all four timepoints
7326 children 3 ECLS-K. Data used: 1999–2007
Johnson andMarkowitz 201796
USA Longitudinal 9 months(2001–2), 2 years(2003–4), 4 years(2005–6)
Students living in householdswith incomes at or below185% of the poverty lines fromthose enrolled in a nationallyrepresentative sample of childrenfrom infancy to the time theyentered school
3700 children 3 ECLS-B. Data used: 1999–2008
Jyoti et al. 200511 USA Longitudinal 6–9 years,8–11 years and10–13 years
Students enrolled in over 1200kindergartens in the USA
Sample sizes rangedfrom 13,500 to11,400 childrendepending on thetime point andmissing data
3 ECLS-K. Data used: 1999–2002
APPEN
DIX
2
NIHRJournals
Librarywww.journalslibrary.nihr.ac.uk
100

Study authors andyear of publication Country Study design Children’s age Population
Number ofparticipants/sample size
RQaddressed Project/study/programme
Kaiser et al. 200236 USA Observational 3–6 years Spanish- and English-speakingMexican American families
211 families withpreschool children
1 and 3 Head Start, Healthy Start, thefederal WIC
Kaur et al. 201597 USA Observational 2–11 years Nationally representative sampleof the US civilian non-institutionalised population
9701 children 3 NHANES. Data used: 2001–10
Kenney 200837 USA Observational Within 48 hours ofthe child’s birth,and then at 12, 36and 60 months
Nationally representative sampleof non-marital births in the USA
1073 couples 1 Fragile Families and ChildWellbeing Study data andIn-Home Longitudinal Study ofPre-School Children
Kersey et al. 200738 USA Observational < 3 years Participants recruited from aclinic serving a low-income,urban, diverse population
4278 caregivers 1 None reported
Khan et al. 201198 USA Observational 10–14 years Children attending a publicmiddle school
373 children andadolescents
3 and 4 School receiving free lunch
Kimbro et al. 201240 USA Longitudinal 6–9 years,8–11 years and10–13 years
Students enrolled in over 1200kindergartens in the USA
11,610 children 1 ECLS-K. Data used:1999–2002. Data merged withCensus 2000 contextual foranalysis purposes
Kimbro and Denney201539
USA Longitudinal First grade(6–9 years), thirdgrade (8–11 years)and fifth grade(10–13 years)
Students living in householdincomes below 300% of thefederal poverty level fromthose enrolled in over 1200kindergartens in the USA
6300 children 1 and 3 ECLS-K. Data used: 2010–12
King 201741 USA Observational 5 years Predominantly unmarriedmothers
2829 mothers 1 and 3 Fragile Families and ChildWellbeing Study. Data used:collected at the fifth year
Kleinman et al.199899
USA Observational < 12 years Families with at least one child 328 families 3 CCHIP
Kleinman et al.2002117
USA Non-randomisedcomparative
Fourth to sixthgrades (ages notspecified)
Inner-city students eligible forUFSB programme
97 children 4 Collaborative study of a UFSBin the Boston Public Schools
continued
DOI:10.3310/phr06130
PUBLIC
HEA
LTHRESEA
RCH2018
VOL.6
NO.13
©Queen
’sPrinter
andController
ofHMSO
2018.This
work
was
producedby
Aceves-M
artinset
al.under
theterm
sof
acom
missioning
contractissued
bythe
Secretaryof
Statefor
Health
andSocialC
are.This
issuemay
befreely
reproducedfor
thepurposes
ofprivate
researchand
studyand
extracts(or
indeed,the
fullreport)may
beincluded
inprofessionaljournals
providedthat
suitableacknow
ledgement
ismade
andthe
reproductionisnot
associatedwith
anyform
ofadvertising.
Applications
forcom
mercial
reproductionshould
beaddressed
to:NIHRJournals
Library,NationalInstitute
forHealth
Research,Evaluation,
Trialsand
StudiesCoordinating
Centre,
Alpha
House,
University
ofSoutham
ptonScience
Park,Southam
ptonSO
167N
S,UK.
101

TABLE 12 General characteristics of included studies (n= 109) (continued )
Study authors andyear of publication Country Study design Children’s age Population
Number ofparticipants/sample size
RQaddressed Project/study/programme
Klerman et al.2017120
USA Non-randomisedcomparative
School-agedchildren (ages notspecified)
Households with school-agedchildren who, in the prior schoolyear, were certified for free orreduced-price school meals
Summer survey,n= 48,449; springsurvey, n= 41,793
4 Summer Electronic BenefitsTransfer for Children
Kohn et al. 201474 USA Observational 4–17 years Children from families below the200% poverty line
1321 children andadolescents
3, 4 NHANES. Data used: 2007–8
Korenman et al.2013121
USA Non-randomisedcomparative
4 years Nationally representative sampleof children from infancy to thetime they entered school
4050 students,of whom 1850participated in theCACFP
4 CACFP from Head StartCentres analysed using data ofECLS-B
Kuku et al. 2012100 USA Observational 0–12 years Children from households below200% of the poverty line fromnationally representative survey
959 children 3 Child Development Supplementof the Panel Study of IncomeDynamics. Data used: 2003
Larson et al. 2012101 USA Observational Middle- and high-school students(ages not specified)
Households of middle- and high-school students who participatedthe population-based EAT study
1983 households 3 Eat Study. Data used: 2009–10
Lohman et al.2009102
USA Observational 10–15 years(mean 12 years,SD 1.4 years)
Children and their mothers fromlow-income neighbourhoodswith income less than twice thepoverty line
1011 adolescents 3 Welfare, Children, and Families:A Three-City Study. Data used:1999
Mangini et al.201544
USA Observational 6–9 years,8–11 years and10–13 years
Students enrolled in over 1200kindergartens in the USA
11,099 children 1, 3 ECLS-K. Data used: 2002
Martin and Ferris2007103
USA Observational 2–12 years(mean 5.7 years)
Community centres thatprimarily served low-incomefamilies in the second poorestmedium-sized city in the USA
200 parents andtheir 212 children
3 None reported
Matheson et al.2002104
USA Observational Mean 10.7 years Mothers of students enrolled ineight elementary schools
124 mother–childdyads
3 Study conducted as part ofa school-based obesityprevention study funded bythe National Cancer Institute.No further details provided
APPEN
DIX
2
NIHRJournals
Librarywww.journalslibrary.nihr.ac.uk
102

Study authors andyear of publication Country Study design Children’s age Population
Number ofparticipants/sample size
RQaddressed Project/study/programme
McLaughlin et al.201247
USA Observational 13–17 years Adolescents and parents forwhom data were available
6483 adolescent–parent dyads
1 and 3 National Comorbidity SurveyReplication AdolescentSupplement
Metallinos-Katsaraset al. 2009105
USA Observational 1–5 years Mothers from low-incomefamilies
8493 mothers 3 Data from low-income familiesparticipating at one of nineWIC children clinics inMassachusetts
Miller 201648 USA Observational 6–9 years,8–11 years and10–13 years
Children who lived with theirbiological mothers and had validinformation on child FI and thenativity of parents and childrenenrolled in over 1200kindergartens in the USA
12,934 families 1 ECLS-K. Data used: 1999–2007
Morrissey et al.201649
USA Observational Mean 5.5 years Sample was limited to non-missing data on FS or householdpoverty level
12,550 children 1 ECLS-K. Data used: 2010–11.In addition, the US CensusBureau’s 2008–12 AmericanCommunity Survey. Five-yearestimates and USDA’s FoodEnvironment Atlas 2010 data
Murphy et al.199873
USA Observational Elementary grades(third through fifth)and middle-schoolgrades (eighth)(ages not specified)
Participants enrolled in schoolswith free meals for all children
204 children 1 and 3 Collaborative study of a freebreakfast programme in thePhiladelphia and Baltimorepublic schools
Nalty et al. 201350 USA Observational 6–11 years(mean 8.5 years,SD 1.4 years)
Residents of rural areas alongthe USA–Mexico border
48 mother–childdyads
1 and 4 None reported
Papas et al. 201651 USA Observational 2–8 years(mean 4.8 years,SD 1.9 years)
Low-income Hispanic families 74 mothers andchildren
1 and 3 None reported
Poole et al. 201352 USA Observational Mean 16.6 years,SD 1.1 years
High-school students 193 adolescents 1 and 3 Unclear
continued
DOI:10.3310/phr06130
PUBLIC
HEA
LTHRESEA
RCH2018
VOL.6
NO.13
©Queen
’sPrinter
andController
ofHMSO
2018.This
work
was
producedby
Aceves-M
artinset
al.under
theterm
sof
acom
missioning
contractissued
bythe
Secretaryof
Statefor
Health
andSocialC
are.This
issuemay
befreely
reproducedfor
thepurposes
ofprivate
researchand
studyand
extracts(or
indeed,the
fullreport)may
beincluded
inprofessionaljournals
providedthat
suitableacknow
ledgement
ismade
andthe
reproductionisnot
associatedwith
anyform
ofadvertising.
Applications
forcom
mercial
reproductionshould
beaddressed
to:NIHRJournals
Library,NationalInstitute
forHealth
Research,Evaluation,
Trialsand
StudiesCoordinating
Centre,
Alpha
House,
University
ofSoutham
ptonScience
Park,Southam
ptonSO
167N
S,UK.
103

TABLE 12 General characteristics of included studies (n= 109) (continued )
Study authors andyear of publication Country Study design Children’s age Population
Number ofparticipants/sample size
RQaddressed Project/study/programme
Poole-Di Salvo et al.201653
USA Observational 12–16 years Eighth-grade students enrolled inover 1200 kindergartens in theUSA
Approximately8600 students
1 and 3 ECLS-K. Data used 2007
Richards and Smith200755
USA Qualitative 6–13 years(mean 9.8 years,SD 1.6 years)
Participants recruited fromhomeless shelters
56 children 1 None reported
Rose and Bodor200656
USA Longitudinal 6–9 years and8–11 years
Students enrolled in over 1200kindergartens in the USA
12,890 children 1 and 3 ECLS-K. Data used: 1999 and2000
Rose-Jacobs et al.200857
USA Observational 4–36 months English-, Spanish-, orSomali-speaking caregivers
2010 caregiver/childdyads
1 and 3 C-SNAP. Data used: 2004–5
Rossen andKobernik 201658
USA Observational 2–15 years Nationally representativeUS data
5136 children andadolescents
1 and 3 NHANES: Data used: 2007–10
Shanafelt et al.201660
USA Observational Nineth and tenthgrade (ages notspecified)
Participants of a RCT of a schoolbreakfast intervention among16 high schools in ruralMinnesota, USA
904 students 1 and 3 Project BreakFAST (FuellingAcademics and StrengtheningTeens). Baseline data used
Sharkey et al.201161
USA Observational NR Residents of rural areas alongthe USA–Mexico border
484 households withchildren
1 and 3 Colonia Household andCommunity Food ResourceAssessment. Data used: 2009
Sharkey et al.2012107
USA Observational 6–11 years(mean 9.1 years,SD 1.3 years)
Residents of rural areas alongthe USA–Mexico border
50 mother and childdyads
3 None reported
Shtasel-Gottliebet al. 201562
USA Mixed methods Middle-school(grades sixth toeighth) and high-school (grades ninthto twelfth) students(ages not specified)
Adolescents from a low-income,urban community
2350 in theobservational studyand 12 in thequalitative study
1 None reported
Skalicky et al.200663
USA Observational 6–36 months Low-income children utilisingthe paediatric emergencydepartment
626 children 1 and 3 Data obtained from the BostonMedical Centre (1996–2001),people interviewed as part ofC-SNAP
APPEN
DIX
2
NIHRJournals
Librarywww.journalslibrary.nihr.ac.uk
104

Study authors andyear of publication Country Study design Children’s age Population
Number ofparticipants/sample size
RQaddressed Project/study/programme
Slack and Yoo2005108
USA Observational 3–12 years Families with a primary caregivertransitioning from welfare towork
942 families 3 Illinois Families Study. Dataused: waves 1 and 2
Smith and Richards200864
USA Mixed methods 9–18 years(mean 11.6 years,SD 2.0 years)
Participants recruited fromhomeless shelters
202 children andadolescents
1 None reported
Sonik et al. 201665 USA Observational Households withchildren (< 18 years)
Nationally representative sampleof the non-institutionalisedUS civilian population
24,729 households 1 Survey of income and programmeparticipation. Data used: 2004and 2008 (waves 5 and 6)
Speirs et al. 2016109 USA Observational Mean 39 months Families with a preschool-agedchild
438 families 3 Synergistic Theory and Researchon Obesity and Nutrition GroupKids (STRONG Kids) programme.Data used: 2009–10 (wave 1)
Tester et al. 201666 USA Observational 12–18 years Low-income households(below 200% of the federalpoverty line) from a nationallyrepresentative sample in the USA
1072 adolescents 1 and 3 NHANES. Data used: 2003–10
To et al. 2014110 USA Observational 6–17 years Low-income households(below 350% of the federalpoverty line) from a nationallyrepresentative sample in the USA
3049 children andadolescents
3 NHANES. Data used: 2003–6
Trapp et al. 201567 USA Observational 24–48 months(mean 35 months,SD 8.7 months)
Hispanic or African Americancaregivers participating in anobesity prevention/reversal study
222 children 1 and 3 Steps to Growing Up HealthyStudy
Weinreb et al.200269
USA Observational 2.5–17 years(preschool-aged:mean 4 years;school-aged: mean10 years)
Participants were part of a largerstudy consisting of 220 homelessand 216 low-income, neverhomeless mothers and 627dependent children
203 school-agedchildren and 152preschool-agedchildren
1 and 3 Unmatched case–control studyof family homelessness
Whitbeck et al.200670
USA Observational 16–19 years(mean 17.4 years,SD 1.1 years)
Homeless or runaway youths 428 adolescents 1 Baseline data from a 3-yearlongitudinal study of homelessand runaway youths in the USAMidwest
continued
DOI:10.3310/phr06130
PUBLIC
HEA
LTHRESEA
RCH2018
VOL.6
NO.13
©Queen
’sPrinter
andController
ofHMSO
2018.This
work
was
producedby
Aceves-M
artinset
al.under
theterm
sof
acom
missioning
contractissued
bythe
Secretaryof
Statefor
Health
andSocialC
are.This
issuemay
befreely
reproducedfor
thepurposes
ofprivate
researchand
studyand
extracts(or
indeed,the
fullreport)may
beincluded
inprofessionaljournals
providedthat
suitableacknow
ledgement
ismade
andthe
reproductionisnot
associatedwith
anyform
ofadvertising.
Applications
forcom
mercial
reproductionshould
beaddressed
to:NIHRJournals
Library,NationalInstitute
forHealth
Research,Evaluation,
Trialsand
StudiesCoordinating
Centre,
Alpha
House,
University
ofSoutham
ptonScience
Park,Southam
ptonSO
167N
S,UK.
105

TABLE 12 General characteristics of included studies (n= 109) (continued )
Study authors andyear of publication Country Study design Children’s age Population
Number ofparticipants/sample size
RQaddressed Project/study/programme
Widome et al.2009111
USA Observational Middle- and high-school students(ages not specified)
Young, ethnically diverse middleand high-school studentpopulation
4746 adolescents 3 Project EAT (Eating AmongTeens)
Willis and Fitzpatrick2016112
USA Observational Mean 11 years Fifth to seventh grade studentsin a middle school
324 students 3 None reported
Winicki and Jemison2003113
USA Observational Kindergartenchildren (ages notspecified)
Students enrolled in over 1200kindergartens in the USA
18,847 children 3 ECLS-K. Data used: 1998–9
Yu et al. 201071 USA Observational Households withchildren (< 18 years)
Households with children withincome below 185% poverty ofthe federal poverty level
3799 households 1 and 4 Individuals who completedboth CPS and the FSSupplement in 2003
Zaslow 200972 USA Longitudinal Infants and toddlers(ages not specified)
Nationally representative sampleof children from infancy to thetime they entered school
7894 children 1 and 3 ECLS-B. Data used: 2001–4
Ramsey et al. 201154 Australia Observational 3–17 years 1000 households in the mostdisadvantaged districts inBrisbane, QLD, Australia
185 households 1 and 3 Data were collected from themost disadvantaged districts inBrisbane, QLD, Australia
Mhurchu et al.2013122
NewZealand
RCT 5–13 years(mean 9.4 years,SD 2 years)
Participants recruited from low-income schools that did not havean existing breakfast programme
424 students 4 Some schools received the RedCross Breakfast in Schoolsprogramme, and othersreceived the breakfastprogramme provided by theprivate sector
BreakFAST, Fuelling Academics and Strengthening Teens; CACFP, Child and Adult Care Food Program; CPS, Current Population Survey; C-SNAP, Children’s Sentinel Nutrition Assessment Program;EAT, Eating and Activity among Teens; ECLS-B, Early Childhood Longitudinal Study – Birth cohort; ECLS-K, Early Childhood Longitudinal Study – Kindergarten cohort; NR, not reported; NSLP, NationalSchool Lunch Program; SD, standard deviation.
APPEN
DIX
2
NIHRJournals
Librarywww.journalslibrary.nihr.ac.uk
106

Appendix 3 Measurement of food insecurity
TABLE 13 Summary of measurement of FI from included studies
Study authors andyear of publication Country
Person(s) reportingchild FI Child FI measurement tool
Term used to present FIin the results
Belsky et al. 201019 UK Parents/caregivers 7-item USDA FS Survey Module Families that were ever FI
Harvey 201630 UK Parents/caregivers andchildren/adolescents
Children: one-to-onesemistructured interviews; parents/caregivers: 18-item USDAHousehold FS Survey Module
Family FS
Harvey-Golding et al.201631
UK Senior stakeholdersinvolved in theimplementation anddelivery of a food aidprogramme
One-on-one semistructuredinterviews
FI
Harvey-Golding et al.201532
UK Parents/caregivers andchildren/adolescents
Semistructured interviews FI and hunger
Sellen et al. 200259 UK Parents/caregivers 10-item Radimer/Cornell Measureof Hunger and FI
Household, caregiver andindex child of FI
Molcho et al. 2007106 Ireland Adolescents HBSC survey item: ‘Some youngpeople go to school or to bedhungry because there is notenough food at home. How oftendoes this happen to you?’
Food poverty
Broughton et al.200621
Canada Parents/caregivers 18-item USDA module FI, anxiety about ahousehold’s food supply,or reduced quality orquantity of foodconsumed
Carter et al. 201223 Canada Parents/caregivers Three questions adapted from theRadimer/Cornell Measure ofHunger and FI
FI
Egeland et al. 201127 Canada Parents/caregivers 18-item USDA module (modifiedby Indian and Northern AffairsCanada)
Household FI and child FI
Kirkpatrick andTarasuk 200843
Canada Parents/caregivers 18-item USDA module Household FI
Kirkpatrick et al.201042
Canada Primary caregiver (anyadult or older siblingliving in the household,not specifically theparents)
One question: ‘Has [the child]ever experienced being hungrybecause the family has run outof food or money to buy food?’
Hunger
Marjerrison et al.201145
Canada Parents/caregivers 18-item USDA module (adaptedfor the Canadian population)
Food-insecure families
Mark et al. 201275 Canada Parents/caregivers 18-item USDA module (adaptedfor the Canadian population)
FI
McIsaac et al. 201746 Canada Parents/caregivers 18-item USDA module, adaptedand modified by authors
Household FS
continued
DOI: 10.3310/phr06130 PUBLIC HEALTH RESEARCH 2018 VOL. 6 NO. 13
© Queen’s Printer and Controller of HMSO 2018. This work was produced by Aceves-Martins et al. under the terms of a commissioning contract issued by the Secretary of Statefor Health and Social Care. This issue may be freely reproduced for the purposes of private research and study and extracts (or indeed, the full report) may be included inprofessional journals provided that suitable acknowledgement is made and the reproduction is not associated with any form of advertising. Applications for commercialreproduction should be addressed to: NIHR Journals Library, National Institute for Health Research, Evaluation, Trials and Studies Coordinating Centre, Alpha House, University ofSouthampton Science Park, Southampton SO16 7NS, UK.
107

TABLE 13 Summary of measurement of FI from included studies (continued )
Study authors andyear of publication Country
Person(s) reportingchild FI Child FI measurement tool
Term used to present FIin the results
Pickett et al. 201576 Canada Adolescents HBSC survey: ‘Some young peoplego to school or to bed hungrybecause there is not enough foodat home. How often does thishappen to you?’
Hunger
Wadsworth 201268 Canada Children 9-item USDA child module FI
Arteaga et al. 201718 USA Parents/caregivers 18-item USDA module Household FI
Baer et al. 201577 USA Adolescents 9-item USDA Self-AdministeredFS Survey Module for Youths(for 12–17 years)
Personal and household-level FS
Barroso et al. 201678 USA Parents/caregivers Questionnaire about Growth andNutrition (which included threeadapted questions form the18-item USDA module). In addition,demographic information aboutthe amount of food assistancedollars obtained monthly and foodbank use
FI
Bhargava et al. 200820 USA Parents/caregivers 18-item USDA module Personal and household-level FS
Bruening and Johnson201579
USA Adolescents The New Mexico Youth Risk andResiliency Survey
Food-insecureadolescents
Bruening et al. 201722 USA Parents/caregivers andchildren/adolescents
6-item USDA module modified forself-administration
FI
Burke et al. 201680 USA Primary caregiver (anyadult or older siblingliving in the household)
18-item USDA module Household FI
Canter et al. 2017115 USA Parents/caregivers 18-item USDA module Household FI and child FI
Casey et al. 20058 USA Primary caregiver (anyadult or older siblingliving in the household,not specifically theparents)
18-item USDA module FI
Casey et al. 200681 USA Primary caregiver (anyadult or older siblingliving in the household,not specifically theparents)
18-item USDA module Household FI and child FI
Chi et al. 201482 USA Parents/caregivers 18-item USDA module Household FI
Chilton et al. 200924 USA Parents/caregivers 18-item USDA module Household FI
Connell et al. 200525 USA Children Individual semistructured interview Child FI
Cook et al. 200483 USA Parents/caregivers 18-item USDA module Household FI and hunger
Cook et al. 2006116 USA Parents/caregivers 18-item USDA module FI
Dunifon andKowaleski-Jones200326
USA Parents/caregivers 18-item USDA module Household FI and child FI
Ecker and Sifers2013118
USA Children A hunger (graphic) survey Hunger
APPENDIX 3
NIHR Journals Library www.journalslibrary.nihr.ac.uk
108

TABLE 13 Summary of measurement of FI from included studies (continued )
Study authors andyear of publication Country
Person(s) reportingchild FI Child FI measurement tool
Term used to present FIin the results
Edwards and Taub201784
USA Adolescents HBSC survey: ‘Some young peoplego to school or to bed hungrybecause there is not enough foodat home. How often does thishappen to you?’
FS
Eicher-Miller et al.200928
USA Parents/caregivers 18-item USDA module Child FI
Eicher-Miller et al.201129
USA Parents/caregivers 18-item USDA module FI
Fram et al. 20116 USA Children Semistructured interview Household FI
Fram et al. 2015114 USA Children 5 items from the Child FSAssessment (CFSA)
Child FI
Gordon et al. 2017119 USA Parents/caregivers VLFS among children duringsummer (as assessed using the30-day FS measure. Unclear if it is18-item USDA module)
Household and child withvery low FS
Gundersen et al. 200886 USA Parents/caregivers 18-item USDA module Household and child FI
Gundersen et al. 200985 USA Parents/caregivers 18-item USDA module Household FI
Helton 201687 USA Caseworker Limited MaltreatmentClassification System
Food neglection
Himmelgreen et al.200033
USA Parents/caregivers 10-item Radimer/Cornell Measureof Hunger and FI
Household FI, adult FIand child hunger
Holben et al. 200434 USA Parents/caregivers 18-item USDA module FI and childhood hunger
Holben and Taylor201588
USA Parents/caregivers 18-item USDA module FS
Howard 201189 USA Parents/caregivers 18-item USDA module Household and child FI.Transition between FIand FS
Howard 201190 USA Parents/caregivers 18-item USDA module Household and child FI.Transition between FIand FS
Howard 201391 USA Parents/caregivers 18-item USDA module FI
Huang et al. 201092 USA Parents/caregivers 18-item USDA module FI
Huang and Vaughn201693
USA Parents/caregivers 18-item USDA module Household FI
Jacknowitz et al. 201535 USA Parents/caregivers 18-item USDA module FI in a household andchild level
Jackson and Vaughn201794
USA Parents/caregivers 18-item USDA module Household FI
Jansen et al. 2017123 USA Parents/caregivers 18-item USDA module Household FI
Ryu and Bartfeld 201295 USA Parents/caregivers 18-item USDA module Household FI
Johnson andMarkowitz 201796
USA Parents/caregivers 18-item USDA module Family FS
Jyoti et al. 200511 USA Parents/caregivers 18-item USDA module Household FI
Kaiser et al. 200236 USA Parents/caregivers 12-item Radimer/Cornell FS scale Household, adult andchild FI
continued
DOI: 10.3310/phr06130 PUBLIC HEALTH RESEARCH 2018 VOL. 6 NO. 13
© Queen’s Printer and Controller of HMSO 2018. This work was produced by Aceves-Martins et al. under the terms of a commissioning contract issued by the Secretary of Statefor Health and Social Care. This issue may be freely reproduced for the purposes of private research and study and extracts (or indeed, the full report) may be included inprofessional journals provided that suitable acknowledgement is made and the reproduction is not associated with any form of advertising. Applications for commercialreproduction should be addressed to: NIHR Journals Library, National Institute for Health Research, Evaluation, Trials and Studies Coordinating Centre, Alpha House, University ofSouthampton Science Park, Southampton SO16 7NS, UK.
109

TABLE 13 Summary of measurement of FI from included studies (continued )
Study authors andyear of publication Country
Person(s) reportingchild FI Child FI measurement tool
Term used to present FIin the results
Kaur et al. 201597 USA Primary caregiver (anyadult or older siblingliving in the household,not specifically theparents)
18-item USDA module. Inaddition, individuals in householdswith an affirmative response to atleast one of the 18-item USDAmodule were asked the fivepersonal FI questions referenced‘the last 30 days’ during thepersonal interview
Child FI
Kenney 200837 USA Parents/caregivers Child-specific questions (8 items)from the 18-item USDA module
Child FI and child hunger
Kersey et al. 200738 USA Parents/caregivers Child-specific questions (8 items)from the 18-item USDA module
FI and childhood hunger
Khan et al. 201198 USA Children 9-item USDA child module Child FI
Kimbro et al. 201240 USA Parents/caregivers 18-item USDA module Household FI
Kimbro et al. 201539 USA Parents/caregivers 18-item USDA module FI
King 201741 USA Parents/caregivers 18-item USDA module Household FI
Kleinman et al. 199899 USA Parents/caregivers CCHIP survey Hunger
Kleinman et al. 2002117 USA Parents/caregivers andchild/adolescents andschool staff
CCHIP survey (parents) and ChildHunger Index Child Report(children)
Hunger
Klerman et al. 2017120 USA Parents/caregivers 18-item USDA module Child FI and child hunger
Kohn et al. 201474 USA Parents/caregivers Child-specific questions (8 items)from the 18-item USDA module
Child FI
Korenman et al.2013121
USA Parents/caregivers 18-item Current PopulationSurvey – FS Scale
FI for the family
Kuku et al. 2012100 USA Parents/caregivers 18-item USDA module FI
Larson et al. 2012101 USA Parents/caregivers andchildren/adolescents
Adolescents Eat Survey; parents/caregivers completed the 6-itemUSDA module
Food insufficiency andhousehold FI
Lohman et al. 2009102 USA Parents/caregivers Three questions from the 18-itemUSDA module
FI
Mangini et al. 201544 USA Parents/caregivers 18-item USDA module Food-insecure household
Martin and Ferris2007103
USA Parents/caregivers 18-item USDA module Household FS and hunger
Matheson et al.2002104
USA Parents/caregivers 18-item USDA module Household FS and hunger
McLaughlin et al.201247
USA Parents/caregivers andchildren/adolescents
Four items from the 18-itemUSDA module (answered byadolescents and parents)
FI and hunger
Metallinos-Katsaraset al. 2009105
USA Parents/caregivers Four-question subscale of the18-item USDA module
Household FS and hunger
Miller 201648 USA Parents/caregivers Child-specific questions from the18-item USDA module
Children FI
Morrissey et al. 201649 USA Parents/caregivers 18-item USDA module Household FS, adult FSand child FS
Murphy et al. 199873 USA Parents/caregivers andchildren/adolescents
CCHIP survey Child hunger
APPENDIX 3
NIHR Journals Library www.journalslibrary.nihr.ac.uk
110

TABLE 13 Summary of measurement of FI from included studies (continued )
Study authors andyear of publication Country
Person(s) reportingchild FI Child FI measurement tool
Term used to present FIin the results
Nalty et al. 201350 USA Parents/caregivers andchildren/adolescents
Child-specific questions (8 items)from the 18-item USDA andmodule 9-item USDA childmodule
Child FI
Papas et al. 201651 USA Parents/caregivers 18-item USDA module Household FS
Poole et al. 201352 USA Adolescents 9-item USDA child module FI
Poole-Di Salvo et al.201653
USA Parents/caregivers 18-item USDA module FI
Richards and Smith200755
USA Children In-depth face-to-face interviews Hunger and foodavailability
Rose and Bodor 200656 USA Parents/caregivers 18-item USDA module FS
Rose-Jacobs et al.200857
USA Parents/caregivers 18-item USDA module Household FI and hunger
Rossen and Kobernik201658
USA Parents/caregivers 18-item USDA module Child FI
Shanafelt et al. 201660 USA Children 9-item USDA child module Food-insecure children
Sharkey et al. 201161 USA Parents/caregivers 12-item Radimer/Cornell FS scale Assessed for household,caregiver and index childFI
Sharkey et al. 2012107 USA Children 9-item USDA child module Child FI
Shtasel-Gottlieb et al.201562
USA Adolescents 9-item USDA child module Adolescent FI
Skalicky et al. 200663 USA Parents/caregivers Child-specific questions (8 items)from the 18-item USDA module
Children FI
Slack and Yoo 2005108 USA Parents/caregivers Four-items subscale of the18-item USDA module
Food hardship
Smith and Richards200864
USA Adolescents 18-item USDA module. Adaptedand modified by the authors
FI
Sonik et al. 201665 USA Parents/caregivers One question measuringchildhood FI (whether childrenhad sufficient food to eat) +five-item subscale of 18-itemUSDA module
Household and child FI
Speirs et al. 2016109 USA Parents/caregivers 18-item USDA module modifiedby asking participants to consideronly the target child
Household and child FI
Tester et al. 201666 USA Parents/caregivers 18-item USDA module Household FS
To et al. 2014110 USA Parents/caregivers 18-item USDA module Household FS
Trapp et al. 201567 USA Parents/caregivers 18-item USDA module Household FI
Weinreb et al. 200269 USA Parents/caregivers andchildren/adolescents
CCHIP Hunger–foodinsufficiency
Whitbeck et al. 200670 USA Adolescents Three items adapted from the16-item USDA module
FI
Widome et al. 2009111 USA Adolescents Two items adapted from the 1999USDA FS/Hunger Core Module:3-stage design, with screeners
Hunger, FI and householdfood availability
continued
DOI: 10.3310/phr06130 PUBLIC HEALTH RESEARCH 2018 VOL. 6 NO. 13
© Queen’s Printer and Controller of HMSO 2018. This work was produced by Aceves-Martins et al. under the terms of a commissioning contract issued by the Secretary of Statefor Health and Social Care. This issue may be freely reproduced for the purposes of private research and study and extracts (or indeed, the full report) may be included inprofessional journals provided that suitable acknowledgement is made and the reproduction is not associated with any form of advertising. Applications for commercialreproduction should be addressed to: NIHR Journals Library, National Institute for Health Research, Evaluation, Trials and Studies Coordinating Centre, Alpha House, University ofSouthampton Science Park, Southampton SO16 7NS, UK.
111

TABLE 13 Summary of measurement of FI from included studies (continued )
Study authors andyear of publication Country
Person(s) reportingchild FI Child FI measurement tool
Term used to present FIin the results
Willis and Fitzpatrick2016112
USA Children Five items from 9-item USDA childmodule
FI score
Winicki and Jemison2003113
USA Parents/caregivers 18-item USDA module FI
Yu et al. 201071 USA Parents/caregivers 18-item USDA module Child FS and household FI
Zaslow 200972 USA Parents/caregivers 18-item USDA module Household FI
Ramsey et al. 201154 Australia Parents/caregivers 16-item USDA module FI
Mhurchu et al. 2013122 NewZealand
Children and parents Children: modified version of‘Freddy’ an analogue FI scale;parents: CCHIP Scale
Hunger and FS
APPENDIX 3
NIHR Journals Library www.journalslibrary.nihr.ac.uk
112
Appendix 4 Results of studies investigatingfactors related to child food insecurity(adjusted findings)
DOI: 10.3310/phr06130 PUBLIC HEALTH RESEARCH 2018 VOL. 6 NO. 13
© Queen’s Printer and Controller of HMSO 2018. This work was produced by Aceves-Martins et al. under the terms of a commissioning contract issued by the Secretary of Statefor Health and Social Care. This issue may be freely reproduced for the purposes of private research and study and extracts (or indeed, the full report) may be included inprofessional journals provided that suitable acknowledgement is made and the reproduction is not associated with any form of advertising. Applications for commercialreproduction should be addressed to: NIHR Journals Library, National Institute for Health Research, Evaluation, Trials and Studies Coordinating Centre, Alpha House, University ofSouthampton Science Park, Southampton SO16 7NS, UK.
113
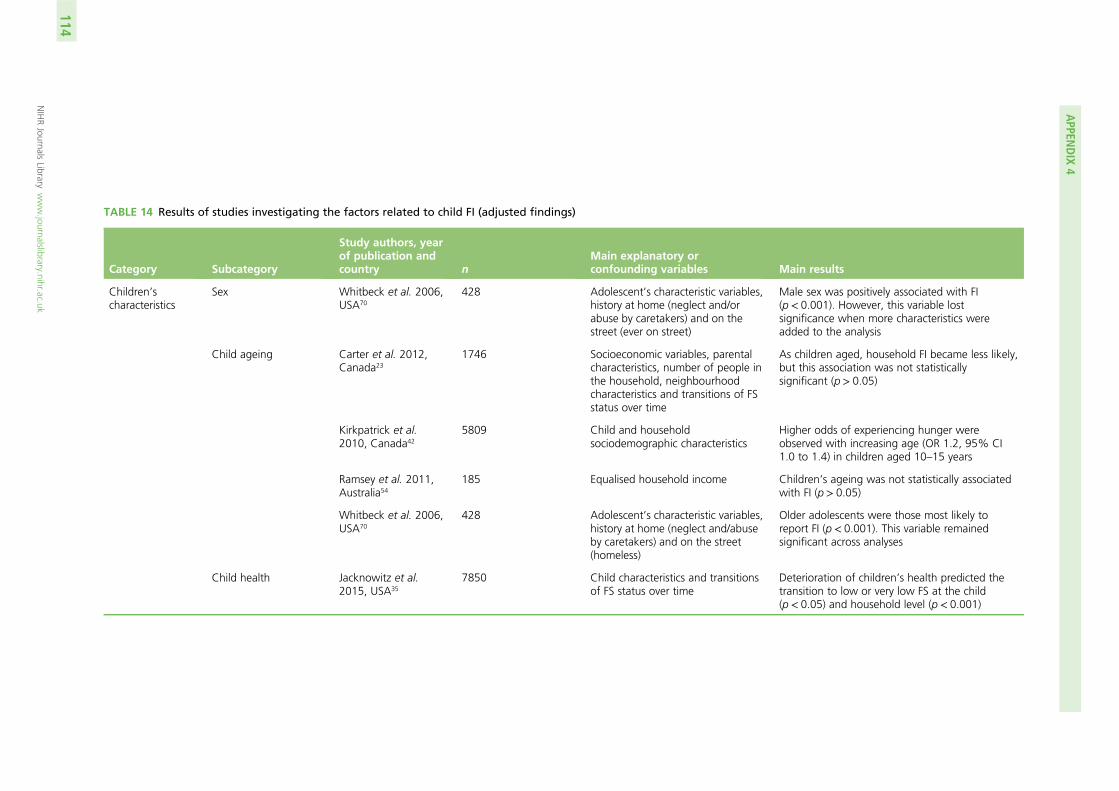
TABLE 14 Results of studies investigating the factors related to child FI (adjusted findings)
Category Subcategory
Study authors, yearof publication andcountry n
Main explanatory orconfounding variables Main results
Children’scharacteristics
Sex Whitbeck et al. 2006,USA70
428 Adolescent’s characteristic variables,history at home (neglect and/orabuse by caretakers) and on thestreet (ever on street)
Male sex was positively associated with FI(p< 0.001). However, this variable lostsignificance when more characteristics wereadded to the analysis
Child ageing Carter et al. 2012,Canada23
1746 Socioeconomic variables, parentalcharacteristics, number of people inthe household, neighbourhoodcharacteristics and transitions of FSstatus over time
As children aged, household FI became less likely,but this association was not statisticallysignificant (p> 0.05)
Kirkpatrick et al.2010, Canada42
5809 Child and householdsociodemographic characteristics
Higher odds of experiencing hunger wereobserved with increasing age (OR 1.2, 95% CI1.0 to 1.4) in children aged 10–15 years
Ramsey et al. 2011,Australia54
185 Equalised household income Children’s ageing was not statistically associatedwith FI (p> 0.05)
Whitbeck et al. 2006,USA70
428 Adolescent’s characteristic variables,history at home (neglect and/abuseby caretakers) and on the street(homeless)
Older adolescents were those most likely toreport FI (p< 0.001). This variable remainedsignificant across analyses
Child health Jacknowitz et al.2015, USA35
7850 Child characteristics and transitionsof FS status over time
Deterioration of children’s health predicted thetransition to low or very low FS at the child(p< 0.05) and household level (p< 0.001)
APPEN
DIX
4
NIHRJournals
Librarywww.journalslibrary.nihr.ac.uk
114

Category Subcategory
Study authors, yearof publication andcountry n
Main explanatory orconfounding variables Main results
Children withdisabilities
Sonik et al. 2016,USA65
24,729 householdswith children (3948had disabilities)
Sociodemographic variablesincluding presence of an adult witha disability
Any FI was 55% greater in families includingchildren with disabilities (OR 1.6, 95% CI 1.5 to1.8). Very low FS was 70% greater (OR 1.7, 95% CI1.5 to 2.0), and child FI was 38% greater (OR 1.4,95% CI 1.2 to 1.7) but was significant only in themodel for very low FI (OR 0.7, 95% CI 0.5 to 0.9).For families below 185% federal poverty line,results were similar. Having a child with a disabilityincreased odds of any FI by 44% (OR 1.6, 95% CI1.4 to 1.8), very low FS by 65% (OR 1.7, 95% CI1.5 to 2.1) and child FI by 31% (OR 1.4, 95% CI1.1 to 1.6)
Supportiveness Whitbeck et al. 2006,USA70
428 Adolescent’s characteristic variables,history at home (neglect and/abuseby caretakers) and on the street(homeless)
The size of adolescents’ social network wasnegatively related to FI. The larger the socialnetwork, the less likely the adolescent was toexperience FI (p< 0.001)
Substance abuse Whitbeck et al. 2006,USA70
428 Adolescent’s characteristic variables,history at home (neglect and/abuseby caretakers) and on the street(homeless)
Substance abuse was positively associated withFI (p < 0.001). However, this variable lostsignificance when food strategies were addedinto the model
Cultural factors Ethnicity Bhargava et al. 2008,USA20
7635 Child characteristics Hispanic households reported significantly higherFI levels, whereas African American householdsreported lower FI (p< 0.05)
Jacknowitz et al.2015, USA35
7850 Child characteristics and transitionsof FS status over time
Being non-Hispanic African American (p< 0.001)or Hispanic (p < 0.001) may trigger the transitioninto a low or very low FS at the child andhousehold level
Morrissey et al. 2016,USA49
12,550 Child, parent and neighbourhoodcharacteristics
Hispanic children were more likely than childrenof other ethnicities to experience FI at all levels(p< 0.001)
Nalty et al. 2013,USA50
48 Parent and food assistancecharacteristics
Mothers of Mexican ethnicity were 4.5 timesmore likely to report FI than those of whiteethnicity (OR 4.5, 95% CI 1.5 to 13.2; p< 0.001)
continued
DOI:10.3310/phr06130
PUBLIC
HEA
LTHRESEA
RCH2018
VOL.6
NO.13
©Queen
’sPrinter
andController
ofHMSO
2018.This
work
was
producedby
Aceves-M
artinset
al.under
theterm
sof
acom
missioning
contractissued
bythe
Secretaryof
Statefor
Health
andSocialC
are.This
issuemay
befreely
reproducedfor
thepurposes
ofprivate
researchand
studyand
extracts(or
indeed,the
fullreport)may
beincluded
inprofessionaljournals
providedthat
suitableacknow
ledgement
ismade
andthe
reproductionisnot
associatedwith
anyform
ofadvertising.
Applications
forcom
mercial
reproductionshould
beaddressed
to:NIHRJournals
Library,NationalInstitute
forHealth
Research,Evaluation,
Trialsand
StudiesCoordinating
Centre,
Alpha
House,
University
ofSoutham
ptonScience
Park,Southam
ptonSO
167N
S,UK.
115

TABLE 14 Results of studies investigating the factors related to child FI (adjusted findings) (continued )
Category Subcategory
Study authors, yearof publication andcountry n
Main explanatory orconfounding variables Main results
Household/familystructure
Parent at household Arteaga et al. 2017,USA18
2150 Child, parent and householdvariables
Household FI risk was higher in a two biologicalparent household than in other family structures(p< 0.001)
Carter et al. 2012,Canada23
1746 Socioeconomic variables, parentcharacteristics, number of people inthe household, neighbourhoodcharacteristics. transitions of FSstatus over time
Single-parent families were 2.5 times more likelyto be FI (p≤ 0.001)
Kimbro et al. 2012,USA40
11,610 Socioeconomic variables, parentand child characteristics, food aidsreceived
Children with single mothers were nearly threetimes more likely to be FI at kindergarten andthird grade than children with two parents(p< 0.001)
Ramsey et al. 2011,Australia54
185 Equalised household income Single parents with children reported more FI(46.8%) than couples with children (29%).Single-parent families were 1.8 times more likelyto report FI than FS (p< 0.05)
Number of siblings Bhargava et al. 2008,USA20
7635 Child characteristics Greater number of siblings was associated withhigher FI (p< 0.05)
Kimbro et al. 2012,USA40
11,610 Socioeconomic variables, parentand child characteristics, food aidsreceived
Compared with food-secure children, childrenwho experienced FI were more likely to have moresiblings in the household (p-value not reported)
Kirkpatrick et al.2010, Canada42
10–15 years (n= 5809),16–21 years (n= 3333)
Child and householdsociodemographic characteristics
Higher odds of experiencing hunger wereobserved with increasing number of children inthe household (OR 1.4, 95% CI 1.1 to 1.9) inchildren aged 10–15 years
Ramsey et al. 2011,Australia54
185 Equalised household income No significant association between number ofchildren in the household and FI (p = 0.65)
APPEN
DIX
4
NIHRJournals
Librarywww.journalslibrary.nihr.ac.uk
116

Category Subcategory
Study authors, yearof publication andcountry n
Main explanatory orconfounding variables Main results
Sharkey et al. 2011,USA61
610 Demographic characteristics,food sources and behaviours alsoincluded
Statistically significant positive associationbetween child FI and number of children in thehousehold (p≤ 0.001)
Egeland et al. 2011,Canada27
388 Household characteristics The number of children (aged ≤ 18 years) in thehome was positively related to FI (OR 1.2, 95% CI1.0 to 1.4)
Number of people inhousehold
Egeland 2011,Canada27
388 Household characteristics Tendency for a greater ratio of children to adultsin the home (p ≤ 0.10), and a greater prevalenceof household crowding (more than one person/room) was found in food insecure than in food-secure homes. The number of children (≤ 18 years)in the home was positively related to FI (OR 1.2,95% CI 1.0 to 1.4)
Jacknowitz et al.2015, USA35
7850 Child characteristics and transitionsof FS status over time
Increasing the number of adults in the household(p< 0.10) may aid in the transition of exiting lowor very low FS in children
Head of household Yu et al. 2010, USA71 3089 Caucasian,710 African
Household characteristics In Caucasian and African American households,child FI was positively associated with having afemale head of household (p< 0.05)
continued
DOI:10.3310/phr06130
PUBLIC
HEA
LTHRESEA
RCH2018
VOL.6
NO.13
©Queen
’sPrinter
andController
ofHMSO
2018.This
work
was
producedby
Aceves-M
artinset
al.under
theterm
sof
acom
missioning
contractissued
bythe
Secretaryof
Statefor
Health
andSocialC
are.This
issuemay
befreely
reproducedfor
thepurposes
ofprivate
researchand
studyand
extracts(or
indeed,the
fullreport)may
beincluded
inprofessionaljournals
providedthat
suitableacknow
ledgement
ismade
andthe
reproductionisnot
associatedwith
anyform
ofadvertising.
Applications
forcom
mercial
reproductionshould
beaddressed
to:NIHRJournals
Library,NationalInstitute
forHealth
Research,Evaluation,
Trialsand
StudiesCoordinating
Centre,
Alpha
House,
University
ofSoutham
ptonScience
Park,Southam
ptonSO
167N
S,UK.
117

TABLE 14 Results of studies investigating the factors related to child FI (adjusted findings) (continued )
Category Subcategory
Study authors, yearof publication andcountry n
Main explanatory orconfounding variables Main results
Neighbourhood/communitycharacteristics
Neighbourhood socialcohesion and disorder
Carter et al. 2012,Canada23
1746 Socioeconomic variables, parentcharacteristics, number of people inthe household, neighbourhoodcharacteristics and transitions of FSstatus over time
Low social cohesion (OR 1.4, 95% CI 1.1 to 1.9;p ≤ 0.01) and high disorder (OR 1.8, 95% CI 1.3to 2.3; p≤ 0.001) significantly increased the oddsof FI
Neighbourhood socialcohesion and disorder
Kimbro et al. 2012,USA40
11,610 Socioeconomic variables, parentand child characteristics, food aidsreceived
Significant differences in the likelihood ofFI existed when parents reported theirneighbourhood as not safe or somewhat safecompared with those who reported it very safeto play outside (p < 0.05)
Poole-Di Salvo et al.2016, USA53
8600 Adolescent and familycharacteristics
No association between FI and living in an unsafeneighbourhood (OR 1.2, 95% CI 0.9 to 1.7)
Living location Carter et al. 2012,Canada23
1746 Socioeconomic variables, parentcharacteristics, number of people inthe household, neighbourhoodcharacteristics, transitions of FSstatus over time
Living in a small or rural town did notsignificantly increase the odds of FI (OR 0.9,95% CI 0.6 to 1.3; p > 0.05) compared withthose living in a metropolitan area
Jacknowitz et al.2015, USA35
7850 Child characteristics and transitionsof FS status over time
Moving homes may trigger the entry intolow- or very low-FS status at a child (p < 0.001)and household level (p< 0.001)
Morrissey et al. 2016,USA49
12,550 Neighbourhood and householdcharacteristics, food access
Children living in rural areas were 2 and 1percentage points less likely to live in food-insecure households or with food-insecure adults,respectively, and marginally significantly less likelyto experience FI themselves than those in urbanareas. Furthermore, children in high-poverty ruraltracts were 2 percentage points less likely to befood insecure than those in high-poverty urbantracts (p < 0.05)
APPEN
DIX
4
NIHRJournals
Librarywww.journalslibrary.nihr.ac.uk
118

Category Subcategory
Study authors, yearof publication andcountry n
Main explanatory orconfounding variables Main results
Living location Egeland et al. 2011,Canada27
388 Household characteristics Child food-insecure homes were more likely tobe public housing and in need of major repairsand to report income support than child food-secure homes (p< 0.05)
Homelessness Whitbeck et al. 2006,USA70
428 Adolescent’s characteristic historyat home (neglect and/abuse bycaretakers) and on the street(homeless)
Being homeless was related to FI (p < 0.001).This variable remained significant across models
Ethnic groupneighbourhoods
Kimbro et al. 2012,USA40
11,610 Socioeconomic variables, parentand child characteristics, food aidsreceived
Children in neighbourhoods that had fewerwhite individuals and more African American andHispanic individuals were more likely to be foodinsecure (p< 0.001)
Kimbro et al. 2012,USA40
11,610 Socioeconomic variables, parentand child characteristics, food aidsreceived
Food-insecure children live in neighbourhoodswith higher proportions of linguistically isolatedresidents, as well as nearly 16% of residents whoare foreign born (p< 0.001)
Kimbro et al. 2012,USA40
11,610 Socioeconomic variables, parentand child characteristics, food aidsreceived
Relative to living in a white/high-SESneighbourhood, living in an African American/low-SES neighbourhood put children at overtwice the odds of FI (p< 0.05)
Neighbourhood SES Morrissey et al. 2016,USA49
12,550 Neighbourhood and householdcharacteristics, food access
The likelihood of FI increased as neighbourhoodpoverty level increases (p < 0.05). However, theassociations between neighbourhood povertyand FI largely disappeared with backgroundcharacteristics added, with the exception of livingin a high-poverty tract (≥ 40%), which wasassociated with a 1 percentage point increase inthe likelihood of child FI (p < 0.05)
continued
DOI:10.3310/phr06130
PUBLIC
HEA
LTHRESEA
RCH2018
VOL.6
NO.13
©Queen
’sPrinter
andController
ofHMSO
2018.This
work
was
producedby
Aceves-M
artinset
al.under
theterm
sof
acom
missioning
contractissued
bythe
Secretaryof
Statefor
Health
andSocialC
are.This
issuemay
befreely
reproducedfor
thepurposes
ofprivate
researchand
studyand
extracts(or
indeed,the
fullreport)may
beincluded
inprofessionaljournals
providedthat
suitableacknow
ledgement
ismade
andthe
reproductionisnot
associatedwith
anyform
ofadvertising.
Applications
forcom
mercial
reproductionshould
beaddressed
to:NIHRJournals
Library,NationalInstitute
forHealth
Research,Evaluation,
Trialsand
StudiesCoordinating
Centre,
Alpha
House,
University
ofSoutham
ptonScience
Park,Southam
ptonSO
167N
S,UK.
119

TABLE 14 Results of studies investigating the factors related to child FI (adjusted findings) (continued )
Category Subcategory
Study authors, yearof publication andcountry n
Main explanatory orconfounding variables Main results
Parentcharacteristics
Parental nativity statusand mother’scitizenship status
Arteaga et al. 2017,USA18
2150 Child, parent and householdcharacteristics
FI among households with children was significantlyhigher for foreign-born mothers than for US-bornmothers (p< 0.05)
Carter et al. 2012,Canada23
1746 Socioeconomic variables, parentcharacteristics, number of people inthe household, neighbourhoodcharacteristics, transitions of FSstatus over time
Mothers’ immigrant status did not significantlyincrease the odds of FI (OR 1.4, 95% CI 0.8 to2.3; p> 0.05)
Chilton et al. 2009,USA24
7216 Child and maternal characteristics,maternal symptoms
Immigrant households were more likely to report FIfor mothers who had been in the USA 0–5 years(OR 2.4, 95% CI 2.2 to 2.8; p< 0.001); for thosewho had been in the USA 6–10 years (OR 2.1,95% CI 1.8 to 2.4; p< 0.001); and for those whohad been in the USA ≥ 11 years (OR 1.4, 95% CI1.2 to 1.7; p< 0.001). All of these odds increasedwhen the model was controlled by maternalsymptoms, and were statistically significant
Kersey et al. 2007,USA38
4278 caregivers Child, socioeconomic anddemographic, maternal and foodassistance characteristics
US-born Latino children in Mexican immigrantfamilies had much higher rates of child hungerthan non-immigrant, non-Latino children at(p< 0.01). In addition, Latino families had muchhigher rates of household FI than non-Latinos,at 53.1% vs. 15.6% (p< 0.01). After adjusting,Latino children were more likely to be hungry(OR 13.0, 95% CI 5.9 to 28.7; p< 0.01) and infood-insecure households (OR 6.6, 95% CI 5.2 to8.3; p< 0.01) than non-Latino children
APPEN
DIX
4
NIHRJournals
Librarywww.journalslibrary.nihr.ac.uk
120

Category Subcategory
Study authors, yearof publication andcountry n
Main explanatory orconfounding variables Main results
Miller 2016, USA48 36,302 Child, family and food assistanceprogrammes covariates
Initial rates of child FI were significantly higheramong first- (p< 0.001) and second- (p < 0.001)generation children of immigrants than forchildren of US-born parents. For low-incomefamilies with US-born parents, these ratesincreased over time, as they did for families withsecond-generation children, albeit at a slowerrate. Families with first-generation immigrantchildren had the highest initial levels of FI, whichsubsequently declined over time
Miller 2016, USA48 36,302 Child, family and food assistanceprogrammes covariates
Additional years of living with children in the USAwere associated with increased rates of childrenFI for US-born children and parents (p < 0.001).However, adjustment for participation in foodassistance programmes had little bearing onfindings
Ramsey et al. 2011,Australia54
185 Equalised household income Households with a parent born outside Australiawere 60% less likely to be FI than householdswith an Australian-born parent (p< 0.001)
Sharkey et al. 2011,USA61
610 Demographic characteristics,parental eating behaviours andfood assistance programmeparticipation
There was an independently associated withincreasing levels of a child FI for children ofmothers born in Mexico (OR 2.13; p< 0.01)
continued
DOI:10.3310/phr06130
PUBLIC
HEA
LTHRESEA
RCH2018
VOL.6
NO.13
©Queen
’sPrinter
andController
ofHMSO
2018.This
work
was
producedby
Aceves-M
artinset
al.under
theterm
sof
acom
missioning
contractissued
bythe
Secretaryof
Statefor
Health
andSocialC
are.This
issuemay
befreely
reproducedfor
thepurposes
ofprivate
researchand
studyand
extracts(or
indeed,the
fullreport)may
beincluded
inprofessionaljournals
providedthat
suitableacknow
ledgement
ismade
andthe
reproductionisnot
associatedwith
anyform
ofadvertising.
Applications
forcom
mercial
reproductionshould
beaddressed
to:NIHRJournals
Library,NationalInstitute
forHealth
Research,Evaluation,
Trialsand
StudiesCoordinating
Centre,
Alpha
House,
University
ofSoutham
ptonScience
Park,Southam
ptonSO
167N
S,UK.
121

TABLE 14 Results of studies investigating the factors related to child FI (adjusted findings) (continued )
Category Subcategory
Study authors, yearof publication andcountry n
Main explanatory orconfounding variables Main results
Emotional status Jacknowitz et al.2015, USA35
7850 Child characteristics and transitionsof FS status over time
Mothers’ entry into depression was trigger forentrance into to low or very low FS at a childlevel (p< 0.001) and a household level (p< 0.001).Furthermore, a mother exiting depression couldaid, at a child level, exiting low- or very low-FIstatus (p< 0.001) and a household level(p< 0.001)
Zaslow et al. 2009,USA72
10,221 Parent, household and childcharacteristics
FI was positively associated with depression(p< 0.001). However, FI works indirectly throughdepression and parenting practices to influenceinsecure attachment. Households with higherlevels of FI have higher levels of depression, andhigher levels of depression reduce positiveparenting, and more positive parenting wasassociated with more positive mental proficiencyat 24 months
Mothers’ age Arteaga et al. 2017,USA18
2150 Child, parent and householdcharacteristics
Mothers’ age was positively related to FI(p< 0.05)
Carter et al. 2012,Canada23
1746 Socioeconomic variables, parentcharacteristics, number of people inthe household, neighbourhoodcharacteristics and transitions of FSstatus over time
Mothers’ age differences did not significantlyincrease the odds of FI (p> 0.05)
Kersey et al. 2007,USA38
4278 Child, socioeconomic anddemographic, maternal and foodassistance characteristics
Young maternal age (< 21 years) was negativelyassociated with FI (OR 0.7, 95% CI 0.5 to 0.8;p < 0.01)
Kimbro et al. 2012,USA40
11,610 Socioeconomic variables, parentand child characteristics, food aidsreceived
Children with younger mothers were, onaverage, significantly more likely to be foodinsecure at both kindergarten and third grade(p< 0.001)
APPEN
DIX
4
NIHRJournals
Librarywww.journalslibrary.nihr.ac.uk
122

Category Subcategory
Study authors, yearof publication andcountry n
Main explanatory orconfounding variables Main results
Education Bhargava et al. 2008,USA20
7635 Children’s characteristics Households where parents were more educatedand incomes were higher reported significantlylower FI levels (p< 0.05)
Kersey et al. 2007,USA38
4278 Child, socioeconomic anddemographic, maternal and foodassistance characteristics
Increased maternal education level was negativelyassociated with FI (OR 0.9, 95% CI 0.8 to 1.0;p < 0.01)
Kimbro et al. 2012,USA40
11,610 Socioeconomic variables, parentand child characteristics, food aidsreceived
At both kindergarten and third grade, significantdifferences in the likelihood of FI existed whenthe mother’s education was reported to be highschool to some college or bachelor’s degree ormore compared with those reporting less thanhigh school (p < 0.001). The odds of FI forchildren at kindergarten were reduced 60% infamilies where mother’s education reached atleast a bachelor’s degree
Morrissey et al. 2016,USA49
12,550 Neighbourhood and householdcharacteristics, as well as foodaccess
Children whose parents lacked a high-schooldegree were more likely to live in food-insecurehouseholds or with food-insecure adults thanthose with more educated parents (p< 0.05)
Ramsey et al. 2011,Australia54
185 Equalised household income Parent’s highest level of education was notassociated with FI status (p= 0.16). The OR ofreporting FI by parents with highest level ofeducation (twelfth grade) was 1.0 (95% CI 0.5 to1.9) compared with those educated to a levelbeyond twelfth grade
Yu et al. 2010, USA71 3089 Caucasian,710 African American
Household characteristics In Caucasian households, child FS was positivelyassociated with the level of education attained bythe head of a household (p< 0.05). In addition,in the African American model analysis the levelof education attained by the head of ahousehold predicted child FS (p< 0.05)
continued
DOI:10.3310/phr06130
PUBLIC
HEA
LTHRESEA
RCH2018
VOL.6
NO.13
©Queen
’sPrinter
andController
ofHMSO
2018.This
work
was
producedby
Aceves-M
artinset
al.under
theterm
sof
acom
missioning
contractissued
bythe
Secretaryof
Statefor
Health
andSocialC
are.This
issuemay
befreely
reproducedfor
thepurposes
ofprivate
researchand
studyand
extracts(or
indeed,the
fullreport)may
beincluded
inprofessionaljournals
providedthat
suitableacknow
ledgement
ismade
andthe
reproductionisnot
associatedwith
anyform
ofadvertising.
Applications
forcom
mercial
reproductionshould
beaddressed
to:NIHRJournals
Library,NationalInstitute
forHealth
Research,Evaluation,
Trialsand
StudiesCoordinating
Centre,
Alpha
House,
University
ofSoutham
ptonScience
Park,Southam
ptonSO
167N
S,UK.
123

TABLE 14 Results of studies investigating the factors related to child FI (adjusted findings) (continued )
Category Subcategory
Study authors, yearof publication andcountry n
Main explanatory orconfounding variables Main results
Risk personalityprofiles
Kenney 2008, USA37 1073 Parental money system and father’scontrol system characteristics
If the father had a drug or alcohol problem,the odds of child FI were OR 2.1 (p< 0.001)
Supportiveness Kenney 2008, USA37 1073 Parental money system and father’scontrol system characteristics
Mother’s report of her partner’s supportivenesswas associated with a reduced likelihood (OR 0.5;p < 0.05) of child FI
Skills Broughton et al.2006, USA21
142 Household income Parents with less personal capacity in terms ofself-rated cooking skills had eight times the oddsof FI compared with households with thegreatest resources (p-value not reported)
FI in parents Bruening et al. 2017,USA22
55 Adolescents’ characteristics,maternal immigration status
Adolescents had 3.5 times higher odds of beingfood insecure if their mothers were food insecure(OR 3.5, 95% CI 1.0 to 13.0; p< 0.058)
Morrissey et al. 2016,USA49
12,550 Neighbourhood and householdcharacteristics, food access
Children in high-poverty tracts were 11percentage points more likely to live withfood-insecure adult or experience FI themselves(p< 0.05)
Employment Ramsey et al. 2011,Australia54
185 Equalised household income The OR of reporting FI in unemployed or unableto work parents was 3.4 (95% CI 1.1 to 10.7)compared with full-time workers (p< 0.05)
Sharkey et al. 2011,USA61
610 Demographic characteristics,parental eating behaviours andfood assistance programmeparticipation
Having a partner unemployed increased the oddsof child FI (OR 4.0; p < 0.001), as did having apartner employed part time (OR 2.9; p< 0.001)
APPEN
DIX
4
NIHRJournals
Librarywww.journalslibrary.nihr.ac.uk
124

Category Subcategory
Study authors, yearof publication andcountry n
Main explanatory orconfounding variables Main results
Socioeconomiccharacteristics
Material deprivation Carter et al. 2012,Canada23
1746 Socioeconomic variables, parentcharacteristics, number of people inthe household, neighbourhoodcharacteristics and transitions of FSstatus over time
According to adjusted analysis, materialdeprivation did not significantly increase the oddsof FI (OR 1.1, 95% CI 0.9 to 1.5; p> 0.05)
Kenney 2008, USA37 1073 Parental money system and father’scontrol system characteristics
The odds of child FI were about 1.7 times higher(OR 1.7, SE 0.13; p< 0.001) among parents whoreported material hardship than among thosewho did not
SES/household income Broughton et al.2006, USA21
142 Household income Low income was the primary risk factor for FI(p-value not reported)
Carter et al. 2012,Canada23
1746 Socioeconomic variables, parentcharacteristics, number of peoplein the household, neighbourhoodcharacteristics and transitions of FSstatus over time
Having a medium SES (OR 3.5, 95% CI 2.1 to5.9; p≤ 0.001) or low SES (OR 8.4, 95% CI 5.0to 14.1; p≤ 0.001) significantly increased theodds of FI, compared with high-SES children
Dunifon andKowaleski-Jones2003, USA26
1600 Child and family characteristics Family income was significantly and negativelyassociated with the continuous FI measure(p< 0.01). Family income was the mostsignificant predictor of FI (OR 1.00, z-score 2.0;p < 0.01)
Jacknowitz et al.2015, USA35
7850 Child characteristics and transitionsof FS status over time
An income decrease triggered the transitionto a low- or very low-FS status at a child level(p< 0.001) and at a household level (p< 0.001).An increase in the income could aid, at childlevel, exit from the low- or very low-FI status(p< 0.001) and at a household level (p< 0.001)
continued
DOI:10.3310/phr06130
PUBLIC
HEA
LTHRESEA
RCH2018
VOL.6
NO.13
©Queen
’sPrinter
andController
ofHMSO
2018.This
work
was
producedby
Aceves-M
artinset
al.under
theterm
sof
acom
missioning
contractissued
bythe
Secretaryof
Statefor
Health
andSocialC
are.This
issuemay
befreely
reproducedfor
thepurposes
ofprivate
researchand
studyand
extracts(or
indeed,the
fullreport)may
beincluded
inprofessionaljournals
providedthat
suitableacknow
ledgement
ismade
andthe
reproductionisnot
associatedwith
anyform
ofadvertising.
Applications
forcom
mercial
reproductionshould
beaddressed
to:NIHRJournals
Library,NationalInstitute
forHealth
Research,Evaluation,
Trialsand
StudiesCoordinating
Centre,
Alpha
House,
University
ofSoutham
ptonScience
Park,Southam
ptonSO
167N
S,UK.
125

TABLE 14 Results of studies investigating the factors related to child FI (adjusted findings) (continued )
Category Subcategory
Study authors, yearof publication andcountry n
Main explanatory orconfounding variables Main results
Kirkpatrick et al.2010, Canada42
3333 Child and householdsociodemographic characteristics
Among youth aged 16–21 years lower odds ofever being hungry were observed with increasingincome (OR 1.0, 95% CI 0.9 to 1.0)
Morrissey et al. 2016,USA49
12,550 Neighbourhood and householdcharacteristics, as well as foodaccess
Children in poor (< 100% federal poverty line)or low-income households (between 100% and200% federal poverty line) were more likely tolive in food-insecure households or with food-insecure adults than those above 200% federalpoverty line
Papas et al. 2016,USA51
74 Household income, number ofchildren in the household, length oftime living in the USA, andeducational attainment
Household income was associated with FI status.Households at the federal poverty line for ahousehold of four were less likely to be reportFI than those who were living on incomes belowthe federal poverty line (OR 0.2, 95% CI 0.1to 0.7)
Ramsey et al. 2011,Australia54
185 Equalised household income Those in the lowest category of equalisedhousehold income reported FI more frequently(56.5%) than the middle category (27.6%) andthe higher category income (7.4%) (p < 0.001).Those living in the lowest equalised householdincome were 16.2 times (OR 16.2, 95% CI 3.5 to74.5) and those in the middle category were 4.8times (OR 4.8, 95% CI 1.0 to 22.5) times moretimes more likely to report FI than those in thehighest category
Sharkey et al. 2011,USA61
610 Demographic characteristics,parental eating behaviours andfood assistance programmeparticipation
Reporting household income > 100% federalpoverty line was associated with less child FI(OR 0.1; p< 0.05)
Yu et al. 2010, USA71 3089 Caucasian,710 African
Household characteristics In Caucasian and African American householdschild FS was negatively associated withhousehold FS and household income (p < 0.05)
APPEN
DIX
4
NIHRJournals
Librarywww.journalslibrary.nihr.ac.uk
126

Category Subcategory
Study authors, yearof publication andcountry n
Main explanatory orconfounding variables Main results
Income management Kenney 2008, USA37 1073 Parental money system and father’scontrol system characteristics
The odds of child FI were over 2.5 times higher(p< 0.01) when the father controlled pooledincome than when the mother did. The odds ofFI were almost 2.3 times higher (p< 0.01) whenboth parents ‘equally’ controlled pooled incomethan when the mother alone did
Living propertycharacteristics
Broughton et al.2006, USA21
142 Household income Households with less-equipped kitchen facilitieshad three times (95% CI 1.1 to 11.1) the odds ofFI compared with households with the greatestresources (p-value not reported)
Egeland et al. 2011,Canada27
388 Household characteristics Child food-insecure homes were more likely to bepublic housing (RR 1.4, 95% CI 1.1 to 1.9; p< 0.05)
Kirkpatrick et al.2010, Canada42
9142 Child and householdsociodemographic characteristics
Higher odds of experiencing hunger wereobserved if they reported to ever having lived in arented dwelling (OR 5.9, 95% CI 2.6 to 13.4) for10- to 15-year-old participants and (OR 2.3, 95% CI1.0 to 5.1) for 16- to 21-year-old participants
Ramsey et al. 2011,Australia54
185 Equalised household income Those renting a housing tenure (53.7%) or livingin assisted housing (49%) reported FI more oftenthan those owning their own homes (27.6%)(p< 0.001). However, OR was not statisticallysignificant (OR 0.9, 95% CI 0.4 to 2.3; p> 0.05)
Social deprivation Carter et al. 2012,Canada23
1746 SES variables, parentalcharacteristics, number of people inthe household, neighbourhoodcharacteristics and transitions of FSstatus over time
Social deprivation (the strength of family socialties within an area considering the proportion ofpersons aged ≥ 15 years who were separated,divorced or widowed, proportion of peopleaged ≥ 15 years of age who lived alone, andproportion of single-parent families who wereliving in the enumeration area) significantlyincreased the odds of food-insecure households(OR 1.6, 95% CI 1.2 to 2.3; p ≤ 0.01)
CI, confidence interval; SE, standard error.
DOI:10.3310/phr06130
PUBLIC
HEA
LTHRESEA
RCH2018
VOL.6
NO.13
©Queen
’sPrinter
andController
ofHMSO
2018.This
work
was
producedby
Aceves-M
artinset
al.under
theterm
sof
acom
missioning
contractissued
bythe
Secretaryof
Statefor
Health
andSocialC
are.This
issuemay
befreely
reproducedfor
thepurposes
ofprivate
researchand
studyand
extracts(or
indeed,the
fullreport)may
beincluded
inprofessionaljournals
providedthat
suitableacknow
ledgement
ismade
andthe
reproductionisnot
associatedwith
anyform
ofadvertising.
Applications
forcom
mercial
reproductionshould
beaddressed
to:NIHRJournals
Library,NationalInstitute
forHealth
Research,Evaluation,
Trialsand
StudiesCoordinating
Centre,
Alpha
House,
University
ofSoutham
ptonScience
Park,Southam
ptonSO
167N
S,UK.
127


Appendix 5 Results of studies investigatingfactors relating to child food insecurity(unadjusted findings)
TABLE 15 Results of studies investigating the factors related to child FI (unadjusted findings)
Category SubcategoryStudy author, yearand country na Summary of main results
Children’scharacteristics
sex Wadsworth 2012,Canada68
918 Significant differences between sexes ineach evaluated grade, with girlsreporting deeper experiences at all levelsof FI than boys (no p-value provided)
Shtasel-Gottlieb et al.2015, USA62
2350 FI did not differ between sexes(p< 0.001)
Papas et al. 2016,USA51
74 No statistically significant difference inchild FI between sexes (p> 0.05)
Murphy et al. 1998,USA73
204 Hunger category scores differed by sex,with girls more likely to be at risk ofhunger than boys (p< 0.001)
Age Nalty et al. 2013,USA50
48 Children living in FI were slightly youngerthan those living in FS (p= 0.04)
Papas et al. 2016,USA51
74 No statistically significant difference inage (p> 0.05) of FI vs. FS
Poole-Di Salvo et al.2016, USA53
8600 Higher percentages of FI (15.5%) inchildren below eighth grade than inthose in eighth grade (9.4%) and ninthgrade or above (9.4%) (p< 0.001)
Rose-Jacobs et al.2008, USA57
2010 Children living in FI were younger thanthose living in FS (p< 0.001)
Shtasel-Gottilieb et al.2015, USA62
2350 Higher prevalence of FI in higher scholargrades (p< 0.001)
Wadsworth 2012,Canada68
918 Significantly older students living in FIcompared with younger students werereported (p-value not reported)
Birthweight Kimbro et al. 2012,USA40
11,610 Children low in birthweight were likelyto be in FI at kindergarten (p< 0.001).However, this weight disadvantage wasovercome by third grade (p > 0.05)
King 2017, USA41 2829 Lower birthweight in food-insecurechildren than in those living in FS(9.8% vs. 11.8%) (p< 0.001)
Mangini et al. 2015,USA44
11,099 Higher likelihood of low birthweightin food-insecure households than infood-secure households (p< 0.001)
Rose and Bodor2006, USA56
12,890 Birthweight differences were significantlyassociated with household FS status(p< 0.05)
continued
DOI: 10.3310/phr06130 PUBLIC HEALTH RESEARCH 2018 VOL. 6 NO. 13
© Queen’s Printer and Controller of HMSO 2018. This work was produced by Aceves-Martins et al. under the terms of a commissioning contract issued by the Secretary of Statefor Health and Social Care. This issue may be freely reproduced for the purposes of private research and study and extracts (or indeed, the full report) may be included inprofessional journals provided that suitable acknowledgement is made and the reproduction is not associated with any form of advertising. Applications for commercialreproduction should be addressed to: NIHR Journals Library, National Institute for Health Research, Evaluation, Trials and Studies Coordinating Centre, Alpha House, University ofSouthampton Science Park, Southampton SO16 7NS, UK.
129

TABLE 15 Results of studies investigating the factors related to child FI (unadjusted findings) (continued )
Category SubcategoryStudy author, yearand country na Summary of main results
Rose-Jacobs et al.2008, USA57
2010 No statistically significant differencebetween households with FI andhouseholds with FS with respect to lowbirthweight (p= 0.46)
Weinreb et al. 2002,USA69
355 School-aged children reporting severehunger were more likely to have had lowbirthweight than those with no hunger(p< 0.005)
Insurance Mangini et al. 2015,USA44
11,099 Children in food-insecure householdsmore likely to be uninsured than childrenin food-secure households (p< 0.001)
Miller 2016, USA48 36,302 Significantly lower baseline reports ofchild FI for children reported as healthinsured than for those not reported ashealth insured (p< 0.001)
Rossen and Kobernik2016, USA58
5136 Higher likelihood of being uninsured orusing public health insurance for food-insecure children than for food-securechildren (p< 0.001)
Rose-Jacobs et al.2008, USA57
2010 Significant difference in child FI withrespect to insurance (public insurance FS83% vs. 92% FI; no insurance FS 2% vs.4 FI; private insurance FS 15% vs. 4% FI)(p< 0.001)
Dunifon andKowaleski-Jones2003, USA26
1600 If the child was insured, there was anegative association with the continuousFI measure (p < 0.01)
Smoking Eicher-Miller et al.2011, USA29
5270 Compared with food-secure males, asignificantly greater proportion of food-insecure males aged 16–19 years weresmokers (p= 0.001)
Tester et al. 2016,USA66
1072 Significant differences in FI amonglow-income adolescents when smoking(p= 0.02)
Immigrant status Kirkpatrick andTarasuk 2008,Canada43
7353 No statistically significant difference in FSand FI between children born in Canada,and children who immigrated to Canada< 10 years ago or > 10 years ago(p> 0.05)
Parental andfamilialcharacteristics
Ethnicity Kenney 2008, USA37 1073 No statistically significant associationbetween mother’s ethnicity and FI acrossall ethnic groups included (non-HispanicAfrican descendants, Mexican/CentralAmerican, Puerto Rican and otherHispanic) (p> 0.05)
King 2017, USA41 2829 Higher likelihood of mother of a child inFI to be African descendant (56.6 vs.50.2%) or Hispanic (26.0 vs. 24.2%)(p< 0.001) than FS groups
Eicher-Miller et al.2011, USA29
5270 Greater proportion of FI reported byMexican Americans than by non-HispanicCaucasian population (p< 0.001)
APPENDIX 5
NIHR Journals Library www.journalslibrary.nihr.ac.uk
130

TABLE 15 Results of studies investigating the factors related to child FI (unadjusted findings) (continued )
Category SubcategoryStudy author, yearand country na Summary of main results
Kimbro et al. 2012,USA40
11,610 Significant differences in likelihood of FIamong non-Hispanic African descendants,Hispanic and Asian compared withnon-Hispanic Caucasian children inkindergarten and third grade (p< 0.01)
Mangini et al. 2015,USA44
11,099 Higher likelihood of children in food-insecure households to be non-HispanicCaucasian compared with children in FS(p< 0.001)
Miller 2016, USA48 36,302 Significantly higher baseline rates of childFI if mother reported herself as Hispaniccompared with those who did not(p< 0.05)
Poole et al. 2013,USA52
193 More reported FI by African descendentstudents than other ethnic groups(p= 0.029)
Poole-Di Salvo et al.2016, USA53
8600 Significant difference in the ethnicity ofhouseholds that reported FI (p< 0.001)among non-Hispanic African descendants(16.8%), Hispanic (13.3%), Caucasian(7.1%) and other (12.1%) (p= 0.001)
Rose-Jacobs et al.2008, USA57
2010 More Hispanic caregivers reported asfood insecure than food secure(p< 0.001) than white participants(p< 0.001)
Rossen and Kobernik2016, USA58
5136 Higher likelihood of children in FI to benon-Hispanic African descendants orMexican American than those in FS(p< 0.001)
Shanafelt et al. 2016,USA60
791 Higher likelihood of children in FI to benon-Caucasian than those in FS(p< 0.001)
Rose and Bodor2006, USA56
16,889 Fewer reports of FI by Caucasianadolescents than by non-Caucasianadolescents (p< 0.001)
Tester et al. 2016,USA66
1072 Significant differences among Hispanicand African descendant low-incomeadolescents in FI and those from otherethnicities (p= 0.004)
Weinreb et al. 2002,USA69
203 High likelihood of Caucasian and PuertoRican school-aged children to reportsevere hunger signs (p< 0.01)
Yu et al. 2010, USA71 3089Caucasian,710 African
Higher FS reported for Caucasianhouseholds than for African descendanthouseholds (p = 0.003). No differenceswere found in child FI
Shtasel-Gottilieb et al.2015, USA62
2350 More reported FI by Hispanic households(p< 0.001)
continued
DOI: 10.3310/phr06130 PUBLIC HEALTH RESEARCH 2018 VOL. 6 NO. 13
© Queen’s Printer and Controller of HMSO 2018. This work was produced by Aceves-Martins et al. under the terms of a commissioning contract issued by the Secretary of Statefor Health and Social Care. This issue may be freely reproduced for the purposes of private research and study and extracts (or indeed, the full report) may be included inprofessional journals provided that suitable acknowledgement is made and the reproduction is not associated with any form of advertising. Applications for commercialreproduction should be addressed to: NIHR Journals Library, National Institute for Health Research, Evaluation, Trials and Studies Coordinating Centre, Alpha House, University ofSouthampton Science Park, Southampton SO16 7NS, UK.
131

TABLE 15 Results of studies investigating the factors related to child FI (unadjusted findings) (continued )
Category SubcategoryStudy author, yearand country na Summary of main results
Parentcharacteristics
Caregiver nativityor citizenshipstatus
Kimbro et al. 2012,USA40
11,610 Significant differences in the likelihood ofFI for both kindergarten and third gradechildren whose mothers were born inforeign countries compared with thosewith mothers born in the USA (p< 0.001)
Kimbro et al. 2015,USA39
6300 Higher likelihood of FI for children with aforeign-born parent (p-value not reported)
Mangini et al. 2015,USA44
11,099 Higher likelihood of FI for children with amother born outside the USA (p< 0.001)
Papas et al. 2016,USA51
74 No statistically significant FI differencesconsidering maternal characteristics ornumber of years living in the USA (p> 0.05)
Rose-Jacobs et al.2008, USA57
2010 Less frequent reports of FI (55%) than FS(79%) for mothers born in the USA(p< 0.001)
Sellen et al. 2002,UK59
30 FI present in the entire refugee sample inthe UK. Severe FI (with child hunger) forpeople with shorter lengths of stay(p= 0.021)
Sellen et al. 2002,UK59
30 No difference in prevalence of childhunger whether or not an immigrationdecision had been reached. Similar forthose families appealing against anegative decision and those grantedstatus to remain (p-value not reported)
Skalicky et al. 2006,USA63
626 Higher likelihood of reporting FI forcaregiver immigrants to the USA (p< 0.001)
Emotional status Miller 2016, USA48 36,302 Significantly higher initial rates of childrenFI among households that reportedmother depressive symptoms in cross-sectional and longitudinal data comparedwith those that did not (p< 0.001)
King 2017, USA41 2829 Greater probability of reporting FI forchildren with mothers who reporteddepression (14.0% vs. 29.7%) comparedwith children in FS (p< 0.001)
Poole-Di Salvo et al.2016, USA53
8600 More FI from parents who reported beingdepressed (28.5%) than from those whodid not report being depressed (6.7%)by means of an unadjusted analysis(p-value not reported)
Rose-Jacobs et al.2008, USA57
2010 More FI from mothers who reporteddepressive symptoms (48%) than fromthose who did not report depressivesymptoms (29%) (p< 0.001)
Trapp et al. 2015,USA67
222 Caregivers from food-insecurehouseholds were more likely to reportdepressive symptoms (27%) comparedwith those from food-secure households(9%) (p< 0.001)
Weinreb et al. 2002,USA69
355 Higher rates of major depression, post-traumatic stress disorder and anxietydisorders for mothers of preschool-agedchildren with severe hunger (p-value notreported)
APPENDIX 5
NIHR Journals Library www.journalslibrary.nihr.ac.uk
132

TABLE 15 Results of studies investigating the factors related to child FI (unadjusted findings) (continued )
Category SubcategoryStudy author, yearand country na Summary of main results
Mothers’ age Himmelgreen et al.2000, USA33
248 Caregivers of food-secure children wereyounger than those of food-insecurechildren (p< 0.05). In addition, as the ageof the caretakers increased, so did theseverity of FI (p< 0.05)
Kimbro et al. 2015,USA39
6300 More likelihood of FI for children with ayounger mother compared with childrenwho were food-secure (p-value notreported)
Papas et al. 2016,USA51
74 No statistically significant differences of FIin maternal characteristics, including ageof the mother (p> 0.05)
Poole-Di Salvo et al.2016, USA53
8600 No statistical difference among ageof mothers reporting FI: < 30 years(10.5%), 30–47 years (10.4%),> 47 years (8.9%) (p= 0.558)
Rose-Jacobs et al.2008, USA57
2010caregivers
Less likelihood of being ≥ 21 years forcaregivers who reported household FI(p= 0.03)
Education King 2017, USA41 2829 More children with FI had mothers withhigh school as the educational levelachieved (74.4% vs. 61.8%) (p< 0.001)
Mangini et al. 2015,USA44
11,099 Higher likelihood of children inhouseholds with FI having mothers witha low educational level compared withchildren in households with FS (p< 0.001)
Marjerisson et al.2011, Canada45
183 Higher levels of education in parents ofhouseholds with FS (p< 0.05)
McLaughlin et al.2012, USA47
6483 Negative association between FI andparental education
Poole-Di Salvo et al.2016, USA53
8600 Statistically significant differencebetween households that reported FI andhighest degree earned by parent: lessthan high-school diploma (23.7%),high-school diploma/equivalent (12.8%),bachelor’s degree (3.7%), master’sdegree/doctorate (2.3%) (p < 0.001)
Rose and Bodor2006, USA56
16,889 Significant association between maternaleducation and household FS status(p< 0.05). Those reporting less than ahigh-school education level (30.6%)reported FI more often (12.7%). Collegegraduate mothers reported less FI (3.9%)than FS (23.9%) (p-value not reported)
Rossen and Kobernik2016, USA58
5136 Higher likelihood of FI in children havingless educated parents than children withFS (p< 0.001)
Sellen et al. 2002,UK59
30 Non-significant trend of refugee mothersof children with hunger being onaverage 3 years younger than those ofchildren without hunger (p = 0.086)
Skalicky et al. 2006,USA63
626 Higher likelihood of FI in caregivers havingless than a college education (p< 0.01)
continued
DOI: 10.3310/phr06130 PUBLIC HEALTH RESEARCH 2018 VOL. 6 NO. 13
© Queen’s Printer and Controller of HMSO 2018. This work was produced by Aceves-Martins et al. under the terms of a commissioning contract issued by the Secretary of Statefor Health and Social Care. This issue may be freely reproduced for the purposes of private research and study and extracts (or indeed, the full report) may be included inprofessional journals provided that suitable acknowledgement is made and the reproduction is not associated with any form of advertising. Applications for commercialreproduction should be addressed to: NIHR Journals Library, National Institute for Health Research, Evaluation, Trials and Studies Coordinating Centre, Alpha House, University ofSouthampton Science Park, Southampton SO16 7NS, UK.
133

TABLE 15 Results of studies investigating the factors related to child FI (unadjusted findings) (continued )
Category SubcategoryStudy author, yearand country na Summary of main results
Tester et al. 2016,USA66
1072 No significant differences amonglow-income adolescents’ FS in termsof mother’s education (p> 0.05)
Risk personalityprofiles
Belsky et al. 2010,UK19
2123 Higher likelihood of mothers inhouseholds with FI to have high-riskpersonality profiles (low conscientiousness,extraversion and agreeableness, andhigh neuroticism), with their householdsbeing less sensitive to children’s needs(p< 0.001)
King 2017, USA41 2829 Children in households with FI withmothers who reported domestic violence(0.6% vs. 1.3%) (p< 0.001) comparedwith food-secure households
King 2017, USA41 2829 Children in households with FI hadmothers who reported having previousdrug or alcohol problems (12.2% vs.24.8%) compared with food-securechildren (p< 0.001)
Weinreb et al. 2002,USA69
203 More likelihood of school-aged childrenwho reported severe hunger havingmothers with a lifetime diagnosis ofpost-traumatic stress disorder orsubstance abuse (p-value not reported)
Supportiveness King 2017, USA41 2829 Children in households with FI hadmothers who reported having lowersocial support (2.4% vs. 3.2%) comparedwith food-secure households (p< 0.001)
Sellen et al. 2002,USA59
30 No difference in the indicators of socialsupport from family and friends in familieswith and without child hunger (p> 0.05)
FI in parents Kaiser et al. 2002,USA36
211 Current FI was correlated with havingexperienced food insufficiency as a childfor mothers (p< 0.001) and fathers(p< 0.009)
Employment Kimbro et al. 2012,USA40
11,610 Significant differences, at bothkindergarten and third grade level, in thelikelihood of FI when no parent worksfull time than in those with at least oneparent working full time (p < 0.001)
King 2017, USA41 2829 More likelihood of FI in children havinga mother unemployed compared withchildren with FS (61.2% vs. 53.5%)(p< 0.001)
Papas et al. 2016,USA51
74 mother/child dyads
No statistically significant differencesin maternal characteristics, includingemployment and income (p> 0.05),between food-secure and food-insecureparticipants
Rose-Jacobs et al.2008, USA57
2010caregivers
More food-secure caregivers (49%)reported being employed than food-insecure caregivers (36%) (p< 0.001)
Skalicky et al. 2006,USA63
626 Higher likelihood of FI in unemployedcaregivers (p= 0.04)
APPENDIX 5
NIHR Journals Library www.journalslibrary.nihr.ac.uk
134

TABLE 15 Results of studies investigating the factors related to child FI (unadjusted findings) (continued )
Category SubcategoryStudy author, yearand country na Summary of main results
Health status Miller 2016, USA48 36,302 Significantly higher initial rates of FIamong children with a mother with poorhealth than among children with amother with a fair health reported inadjusted models (p< 0.05)
Poole-Di Salvo et al.2016, USA53
8600 Higher likelihood of FI reported byparents with fair/poor health (27.2%)than by those with excellent/very good/good health (7.6%) (p< 0.001)
Marjerisson et al.2011, Canada45
183 No statistically significant differencebetween families with FI that reportedliving with adults with a medicalcondition (50%) and households with FS(35%) (p= 0.18)
Household/familiar structure
Parent athousehold
King 2017, USA41 2829 Higher likelihood of children in FI havingseparated or non-resident mothers(p< 0.001)
Kirkpatrick andTarasuk 2008,Canada43
7353 Statistically significant difference in FI interms of household size (i.e. number ofadults) (p< 0.001)
Marjerisson et al.2011, Canada45
183 Statistically significant difference inreported FI (45%) for parents in singlehomes with respect to FS (12.1%)(p< 0.001)
Marjerisson et al.2011, Canada45
183 Compared with food-secure households,a higher proportion of food-insecurehouseholds had only one adult whocontributed to the household income. Onthe contrary, a higher proportion of food-secure households had two adults whocontributed to the household income
Poole-Di Salvo et al.2016, USA53
Approximately8600
Married couples reported less FI (5.6%)than those unmarried (20.5%)(p< 0.001)
Rose-Jacobs et al.2008, USA57
2010caregivers
No difference in FI or FS with respect tomarital status (p = 0.61)
Rossen and Kobernik2016, USA58
5136 Higher likelihood of children with FI tohave unmarried or cohabiting parentsthan children who were food-secure(p< 0.001)
Tester et al. 2016,USA66
1072 Significant differences among low-incomeadolescents in FS in terms of partneredstatus of the household (p= 0.01)
Number ofsiblings
Kimbro et al. 2012,USA40
11,610 Significantly higher likelihood of childrenwith more siblings to be in FI at bothkindergarten and third grade (p< 0.001)
Kirkpatrick andTarasuk 2008,Canada43
7353 Higher likelihood of FI in households witha larger number of children (from 0–11years) than with a smaller number ofchildren living in the household (p< 0.05)
Miller 2016, USA48 36,302 Significantly higher initial rates of FIamong households with a larger numberof children than among those reportingfewer children
continued
DOI: 10.3310/phr06130 PUBLIC HEALTH RESEARCH 2018 VOL. 6 NO. 13
© Queen’s Printer and Controller of HMSO 2018. This work was produced by Aceves-Martins et al. under the terms of a commissioning contract issued by the Secretary of Statefor Health and Social Care. This issue may be freely reproduced for the purposes of private research and study and extracts (or indeed, the full report) may be included inprofessional journals provided that suitable acknowledgement is made and the reproduction is not associated with any form of advertising. Applications for commercialreproduction should be addressed to: NIHR Journals Library, National Institute for Health Research, Evaluation, Trials and Studies Coordinating Centre, Alpha House, University ofSouthampton Science Park, Southampton SO16 7NS, UK.
135

TABLE 15 Results of studies investigating the factors related to child FI (unadjusted findings) (continued )
Category SubcategoryStudy author, yearand country na Summary of main results
Papas et al. 2016,USA51
74 No statistically significant differences infood-insecure household characteristics,including the number of residing children(p> 0.05)
Marjerisson et al.2011, Canada45
183 No significant difference for FI and FSgroups in terms of number of children inthe homes (p-value not reported)
Rossen and Kobernik2016, USA58
5136 More likelihood of children in FI living inlarger households (p< 0.001)
Number of peoplein household
Sellen et al. 2002,UK59
30 No difference between familieswith and without child hunger forrefugee population in terms of level ofeducation, self-efficacy score of mothers,size or composition of household,child-to-caregiver ratio, lone care giving,presence of father, or indicators ofsocial support from family and friends(p< 0.05)
Skalicky et al. 2006,USA63
626 Higher likelihood of FI for children livingin households with five or moremembers (p = 0.03)
Living with asmoker
Eicher-Miller et al.2009, USA28
11,247 Significantly greater proportion ofparticipants with FI in households with asmoker (p< 0.001)
Rossen and Kobernik2016, USA58
5136 Higher likelihood of FI in children livingwith a smoker (p < 0.001)
Head ofhousehold
Rossen and Kobernik2016, USA58
5136 Higher likelihood of FI in children living infemale-headed households (p< 0.001)
Socioeconomiccharacteristics
Materialdeprivation
King 2017, USA41 2829 More FI in children with mothers whoexperienced greater material hardship(1.9% vs. 0.9%) (p< 0.001)
SES/householdincome
Belsky et al. 2010,UK19
2123 Households with FI had lower incomesthan households with FS (p< 0.001)
Eicher-Miller et al.2009, USA28
11,247 Significantly greater proportion of FI inparticipants of all age groups living in ahousehold with a poverty-to-income ratioof > 1.0 (p< 0.001)
Eicher-Miller et al.2011, USA29
5270 Significantly greater proportion of FI inparticipants of all age groups living in ahousehold with a poverty-to-income ratioof > 1.0 (p< 0.001)
Kaiser et al. 2002,USA36
211 Significant association between FI andSES (r= –0.44) (p< 0.001)
Kimbro et al. 2012,USA40
11,610 Significant differences in the likelihood ofFI by household income in children livingin households with 100–200% federalpoverty level, 200–300% federal povertylevel and > 300% federal poverty levelcompared with those living in < 100%federal poverty level at both kindergartenand third grade (p< 0.001)
APPENDIX 5
NIHR Journals Library www.journalslibrary.nihr.ac.uk
136

TABLE 15 Results of studies investigating the factors related to child FI (unadjusted findings) (continued )
Category SubcategoryStudy author, yearand country na Summary of main results
Kimbro et al. 2015,USA39
6300 Higher likelihood of children in FI to havelow SES than children who were in FS(p-value not reported)
Kirkpatrick andTarasuk 2008,Canada43
7353 Statistically significant differencebetween FI and FS with respect toincome adequacy in children population(among all categories: lowest, lowermiddle, middle, upper middle, upper)and between both sexes (p-value notreported)
Mangini et al. 2015,USA44
11,099 More likelihood of children in food-insecure households 57% living belowthe poverty level compared with childrenin food-secure households 15% abovethe poverty level (p < 0.001)
McLaughlin et al.2012, USA47
6483 Negative association between FI andfamily income
Rose and Bodor2006, USA56
16,889 Significantly more FI reported in thosehouseholds with lower poverty–indexratio than those with a higherpoverty-to-index ratio (p < 0.05)
Rossen and Kobernik2016, USA58
5136 Higher likelihood of children in FI to fallbelow the federal poverty threshold thanfood-secure children (p< 0.001)
Poole-Di Salvo et al.2016, USA53
8600 More FI (29.8%) reported by childrenliving in households below the povertythreshold than by those at or abovepoverty threshold (5.0%) (p< 0.001)
Living propertycharacteristics
Marjerisson et al.2011, Canada45
183 More frequently reported FS fromfamilies reported living in a dwellingowned by a household member thanfrom families not doing so (92.9%vs. 52.5%) (p< 0.01)
McIsaac et al. 2017,Canada46
215 Lower likelihood of caregivers fromfood-secure households living in publichousing (p< 0.001)
Rossen and Kobernik2016, USA58
5136 Less likelihood of children in FI living inan owned house (p< 0.001)
Social deprivation McLaughlin et al.2012, USA47
6483 Significantly higher levels of relativedeprivation (i.e. lower family income inrelation to others in the community)associated with lower FI scores (p-valuenot reported)
Rossen and Kobernik2016, USA58
5136 Higher likelihood of food-insecurechildren living in areas of highdeprivation. Higher levels of deprivationwere associated with children in FI thanwith children who were in FS (p< 0.001)
continued
DOI: 10.3310/phr06130 PUBLIC HEALTH RESEARCH 2018 VOL. 6 NO. 13
© Queen’s Printer and Controller of HMSO 2018. This work was produced by Aceves-Martins et al. under the terms of a commissioning contract issued by the Secretary of Statefor Health and Social Care. This issue may be freely reproduced for the purposes of private research and study and extracts (or indeed, the full report) may be included inprofessional journals provided that suitable acknowledgement is made and the reproduction is not associated with any form of advertising. Applications for commercialreproduction should be addressed to: NIHR Journals Library, National Institute for Health Research, Evaluation, Trials and Studies Coordinating Centre, Alpha House, University ofSouthampton Science Park, Southampton SO16 7NS, UK.
137

TABLE 15 Results of studies investigating the factors related to child FI (unadjusted findings) (continued )
Category SubcategoryStudy author, yearand country na Summary of main results
Neighbourhood/communitycharacteristics
Neighbourhoodsocial cohesionand disorder
McLaughlin et al.2012, USA47
6483 Greater FI in adolescents living in areaswith higher degrees of community-levelinequality
Poole-Di Salvo et al.2016, USA53
Approximately8600
Less FI (7.5%) in households thatreported living in a safer neighbourhoodthan in those in unsafe neighbourhood(19.2%) (p< 0.001). When adjusted thisassociation lost statistical significance
Rossen and Kobernik2016, USA58
5136 More likelihood of food-insecure childrenliving in places with higher levels ofcrime than children living in safer areas(p< 0.001)
Living location Rose and Bodor2006, USA56
16,889 No statistically significant difference withrespect to level of urbanisation in thearea food-insecure participants lived in(central city, urban fringe or rural)(p> 0.05)
Rossen and Kobernik201658
5136 More FI in children residing in smaller,more urban counties (p< 0.001)
Holben et al. 2004,USA34
152 25.6 times more likely for families withoutreliable transportation to experiencehunger compared with those with reliabletransportation
Homelessness Weinreb et al. 2002,USA69
355 More than half of school-aged childrenwith severe hunger were homeless,compared with 30% with no hunger(p= 0.02)
NR, not reported; OR, odds ratio; RR, risk ratio.a If longitudinal or intervention study, the data from baseline or first measurement are reported.
APPENDIX 5
NIHR Journals Library www.journalslibrary.nihr.ac.uk
138

Appendix 6 Results of studies that assessedhealth, social well-being and academic outcomesand did not adjust their analyses for explanatoryor confounding variables
TABLE 16 Results of studies that investigated the associations between child FI and general health outcomes(unadjusted findings)
Study author, yearof publication andcountry
Outcomemeasured
Tool ofmeasurement
Number ofparticipants Summary of results
Kleinman et al. 1998,USA99
Health status score PSC 328 families witha child aged< 12 years
20% of hungry children (12/56)were classified as dysfunctional bythe PSC, compared with 6% ofthose at risk for hunger (10/161)and 3% of those who were nothungry (3/111) (p< 0.01)
Murphy et al. 1998,USA73
Health status score PSC 204 children Child hunger was significantlyassociated with parent-reportedmeasures of children’s symptoms(p< 0.001)
PSC, Paediatric Symptom Checklist.
DOI: 10.3310/phr06130 PUBLIC HEALTH RESEARCH 2018 VOL. 6 NO. 13
© Queen’s Printer and Controller of HMSO 2018. This work was produced by Aceves-Martins et al. under the terms of a commissioning contract issued by the Secretary of Statefor Health and Social Care. This issue may be freely reproduced for the purposes of private research and study and extracts (or indeed, the full report) may be included inprofessional journals provided that suitable acknowledgement is made and the reproduction is not associated with any form of advertising. Applications for commercialreproduction should be addressed to: NIHR Journals Library, National Institute for Health Research, Evaluation, Trials and Studies Coordinating Centre, Alpha House, University ofSouthampton Science Park, Southampton SO16 7NS, UK.
139

TABLE 17 Results of studies that investigated the associations between child FI and weight status(unadjusted findings)
Study author, yearof publication andcountry Outcome measured
BMIcategorisationtool
Number ofparticipants Summary of results
Egeland et al. 2011,Canada27
Height and weightmeasured by nurses
CDC growthreference
374 children No difference in the BMIpercentile was found betweenfood-insecure children (90percentile) and food-securechildren (90 percentile)(p> 0.05)
Marjerrison et al.2011, Canada45
Height and weightmeasured by nursesor dietitian
None. BMIconsideredas a scale
183 householdswith child withinsulin-dependentdiabetes mellitus
Mean BMI did not differbetween children from food-insecure families and thosefrom food-secure families(p-value not reported)
Khan et al. 2011,USA98
Self-reported weightand height
CDC growthreference
373 adolescents No statistical significanceregarding the BMI classificationand FI/FS status (p= 0.549)
Rose Jacobs et al.2008, USA57
Height and weightmeasured by projectstaff or medical staff
CDC growthreference
2010 families FI vs. FS groups did not differsignificantly (p > 0.05) withrespect to child’s meanweight-for-age z-score or inthe categorical classificationas underweight or overweight
Shanafelt et al.2016, USA60
Height and weightmeasured at school
CDC growthreference
904 children There was no significantdifference across FI and FScategories and weightcategories (p= 0.19)
Sharkey et al. 2012,USA61
Weight measured ateach visit
CDC growthreference
50 children BMI status was notsignificantly associatedwith FS status (p-valuenot presented)
Skalicky et al. 2006,USA63
Unclear Not reported 626 children Food-insecure children wereno more likely than food-secure children to beat risk of energy proteinundernutrition (p= 0.38) oroverweight (p= 0.73)
Poole et al. 2013,USA52
Height and weight wasmeasured
Not reported 193 adolescents BMI was unrelated to FSstatus (p-value not reported)
Widome et al. 2009,USA111
Height and weightmeasured by trainedresearch staff
CDC growthreference
4746 youngpeople
Youths who reported nohunger in the past year wereleast likely to have a BMIgreater than or equal to the95th percentile (p = 0.01)
APPENDIX 6
NIHR Journals Library www.journalslibrary.nihr.ac.uk
140

TABLE 18 Results of studies that investigated the associations between child FI and mental health, social well-beingand academic outcomes (unadjusted findings)
Study author, year ofpublication andcountry
Outcomemeasured
Tool ofmeasurement
Number ofparticipants Summary of results
King 2016, USA41 Behaviouraloutcomes
ChildBehaviourChecklist
2829 children The negative impact of soft drinkconsumption on behaviouralproblems was greater for food-insecure children; the risk ofaggressive behaviours wassignificantly higher for childrenwho consumed two (0.9 SD;p< 0.05) and four or more(0.9 SD; p< 0.01) soft drinks daily.In addition, children who consumedone (0.5 SD; p< 0.05) and four ormore (0.5 SD; p< 0.01) soft drinksdaily showed higher attentionproblems
Kleinman et al. 1998,USA99
History of mentalhealth counselling
CCHIP survey 328 families withat least one child
Hungry children were significantlymore likely to have a past orcurrent history of mental healthcounselling than other children inthe sample (p < 0.01). 21% ofhungry children, 12% of thoseat risk of hunger, and 5% of nothungry children reported a historyof mental health counselling
Kleinman et al. 1998,USA99
Special educationservices andacademic failure(repeating agrade)
CCHIP survey 328 families Hungry children were significantlymore likely to receive specialeducation services (p< 0.05), with29% (16/56) of ‘hungry’ children15% (24/161) of ‘at risk for hunger’children and 14% (15/111) of ‘nothungry’ children receiving specialeducation services. Furthermore,hunger was also related to a child’shistory of academic failure (repeatinga grade), although differences werenot statistically significant (p< 0.10)
Larson et al. 2012,USA101
Adolescent eatingpatterns
FoodFrequencyQuestionnaire
1983 householdswith adolescents
FS status was associated withenergy-adjusted intakes of dairy,calcium and vitamin D as well asfamily dinner frequency amongadolescent females and males.When analysing by sex, amongmales, FS status was also inverselyassociated with BMI z-score
Murphy et al. 1998,USA73
Psychosocialfunctioning
ChildBehaviourChecklistand PSC
204 school-agedchildren
Children who were hungry, or atrisk of hunger, were twice as likelyto be classified as having impairedfunctioning as those classified asnot hungry (p< 0.05)
PSC, Paediatric Symptom Checklist; SD, standard deviation.
DOI: 10.3310/phr06130 PUBLIC HEALTH RESEARCH 2018 VOL. 6 NO. 13
© Queen’s Printer and Controller of HMSO 2018. This work was produced by Aceves-Martins et al. under the terms of a commissioning contract issued by the Secretary of Statefor Health and Social Care. This issue may be freely reproduced for the purposes of private research and study and extracts (or indeed, the full report) may be included inprofessional journals provided that suitable acknowledgement is made and the reproduction is not associated with any form of advertising. Applications for commercialreproduction should be addressed to: NIHR Journals Library, National Institute for Health Research, Evaluation, Trials and Studies Coordinating Centre, Alpha House, University ofSouthampton Science Park, Southampton SO16 7NS, UK.
141


Appendix 7 Descriptions of studies thatinvestigated the association between child foodinsecurity and health outcomes and adjusted theiranalyses for explanatory or confounding variables
General health outcomes
The study by Pickett et al.76 contributed to the HSBC study, which is a WHO collaborative study of healthand health risk behaviours. The authors collected data on food poverty and psychosomatic symptoms from25,912 children aged 11–15 years from 436 Canadian schools. After adjusting analyses for family’s SES,characteristics and practices, school food and nutrition programmes, they showed that hunger wasreported by 25% of participants. Children who reported experiencing hunger ‘sometimes’ or ‘often oralways’ were 1.9 and 4.4 times more likely [odds ratio (OR) 1.9, 95% confidence interval (CI) 1.8 to 2.0;OR 4.4, 95% CI 3.7 to 5.2, respectively] to suffer from psychosomatic symptoms (e.g. headaches, stomachaches, backaches, feeling dizzy) than those who reported having ‘never’ experienced hunger.
Molcho et al.106 used HBSC study (Irish) data and observed similar results to those reported by Pickett et al.76
Children living in food poverty reported physical symptoms more often (e.g. headaches, stomach aches,backaches) than those who did not suffer from food poverty (p < 0.05).
The survey conducted by Egeland et al.27 assessed 388 children aged 3–5 years among the Canadian Inuitcommunity. The authors showed that parents reported similar rates of ‘excellent’ or ‘very good’ health fromchildren’s FS (54.0%) and food-insecure homes (47.6%). However, children from severe child food-insecurehomes were significantly less likely to have their health rated as ‘excellent/very good’ by their parents (39%,34/88) than children (54%, 86/159) from child food-secure homes (risk ratio 0.7, 95% CI 0.5 to 1). Inaddition, there was no significant difference in the proportions of children from child food-insecure andfood-secure homes who had anaemia. There was a not a significant traditional food by FS interaction term(p = 0.09). In further analyses, the authors found that 31.6% of food-insecure children who did not consumetraditional food were anaemic, compared with 14.9% of those who did consume traditional food in the pastday. There was no significant traditional food by FS interaction term noted for iron deficiency (p = 0.84).
Kirkpatrick et al.42 used longitudinal data from the Canadian National Longitudinal Survey of Children andYouth (NLSCY) on a sample of children aged 10–15 years (n = 5809) and young people aged 16–21 years(n = 3333). They found that more than 1 in 10 children (13.5%) were rated as being in poor health;32.9% of those who had ever experienced hunger were reported to be in poor health, compared with12.8% of those who had never experienced hunger. After adjusting for baseline health and otherpotential confounders, higher odds of poor health were observed in children (but not youths) who hadexperienced hunger than in those who were never hungry (OR 2.5, 95% CI 1.3 to 4.6). In the combinedcohort of children and young people, hunger was associated with higher odds of poor health; in thesex-stratified analyses, this effect persisted for girls (OR 2.4, 95% CI 1.3 to 4.4) but not for boys (OR 1.4,95% CI 0.7 to 2.9). In the study sample, 32.7% of children (36.9% of ever hungry vs. 32.6% of neverhungry) and 30.5% of youths (41.7% of ever hungry vs. 30.1% of never hungry) were reported to havea diagnosed chronic condition. No associations were observed in either children or youths between adiagnosis of chronic health condition and hunger. Diagnosed asthma was reported in 24.8% of ever-hungry children compared with 18.0% of never-hungry children (10–15 years, n = 5809) and 11.7% ofyouths aged 16–21 years (27.1% of ever hungry vs. 11.1% of never-hungry youths; n = 3333). Whenboth primary caregiver and youth hunger reports were considered, a significant association between everexperiencing hunger and asthma was observed among youths, with those who ever experienced hunger
DOI: 10.3310/phr06130 PUBLIC HEALTH RESEARCH 2018 VOL. 6 NO. 13
© Queen’s Printer and Controller of HMSO 2018. This work was produced by Aceves-Martins et al. under the terms of a commissioning contract issued by the Secretary of Statefor Health and Social Care. This issue may be freely reproduced for the purposes of private research and study and extracts (or indeed, the full report) may be included inprofessional journals provided that suitable acknowledgement is made and the reproduction is not associated with any form of advertising. Applications for commercialreproduction should be addressed to: NIHR Journals Library, National Institute for Health Research, Evaluation, Trials and Studies Coordinating Centre, Alpha House, University ofSouthampton Science Park, Southampton SO16 7NS, UK.
143

being 2.4 times more likely to have asthma (OR 2.4, 95% CI 1.1 to 4.9). For youths, but not for children,the analysis showed higher odds (OR 6.1, 95% CI 1.4 to 25.9) of asthma among those with two or morecaregiver-reported hunger episodes over time.
Broughton et al.21 reported significantly lower median serum zinc levels in children aged 2–5 years fromfood-insecure households than in those living in food-secure situations (n = 142). Holben and Taylor88
analysed NHANES data from 7435 young people aged 12–18 years and reported no statistically significantdifferences in mean levels of blood glucose, total cholesterol, triglycerides and blood pressure across levelsof household FI. Participants from high-FS households had significantly higher mean high-density lipoprotein(HDL) (‘good cholesterol’) values then those from food-insecure households (p = 0.019). Overall, 3.1%(n = 246) of all participants presented at least two additional markers indicative of metabolic syndrome.The mean number of metabolic syndrome risk factors increased as FI increased (high FS mean 0.3, 95% CI0.3 to 0.4; marginal FS mean 0.4, 95% CI 0.3 to 0.5; low FS mean 0.4, 95% CI 0.3 to 0.5; and very low FSmean 0.5, 95% CI 0.4 to 0.6). The difference among categories was statistically significant (p = 0.018).
Chi et al.82 used NHANES data from 2206 children aged 5–17 years. Children from low- or very low-FShouseholds had significantly higher untreated caries (prevalence ratio 2.0, 95% CI 1.1 to 3.6; p = 0.03and prevalence ratio 1.7, 95% CI 1.0 to 2.9; p = 0.05) than children with full FS. There was no difference inuntreated caries between children from fully and those from marginally food-secure households (p = 0.17).
Chilton et al.24 observed that children who were immigrants to the USA and were living in food-insecurehouseholds were 1.7 times more likely to have their health reported as ‘fair’ or ‘poor’ (OR 1.7, p< 0.001 afteradjusting results for immigrant status and other relevant covariates). When considering the length of stay inthe USA, these odds decreased to 1.1 for those who had been in the USA for 6–10 years (the relationship wasno longer significant; p = 0.15) and decreased even more for those who had been in the USA for more than11 years (OR 1; p = 0.93). FI was considered a significant mediator of the increased odds of fair/poor child’shealth among immigrants who had been in the USA for 0–5 years (p< 0.001) and 6–10 years (p < 0.001).
Cook et al.,83 after adjusting analyses for study site, child’s ethnicity, health insurance and day care status,mother born in the USA, caregiver’s age, employment, marital and education status, and household receiptfood assistance programmes, showed that children enrolled in the Children Sentinel Nutrition AssessmentProgramme (C-SNAP) who were living in food-insecure households had significantly greater odds of ‘fair/poor’ health than those in food-secure households (OR 1.9, 95% CI 1.7 to 2.2). In particular, comparedwith children in food-secure households, children in food-insecure households with hunger were 2.3 timesmore likely to have their health rated as ‘fair/poor’ (OR 2.3, 95% CI 1.9 to 2.8) and those in food-insecurehouseholds without hunger were 1.7 times more likely to have their general health rated as ‘fair/poor’(OR 1.7, 95% CI 1.5 to 2.0).
Dunifon and Kowaleski-Jones26 examined the association between FI and participation in the US NationalSchool Lunch Program (NSLP) in a sample of school-aged children (n = 3500). They used the 18-itemUSDA module to assess FI and measured health limitations with a variable indicating whether or not thechild had any health limitations (reported by the parent) that affected participation in childhood activities,school attendance or the performance of schoolwork. A child with a limitation in any area was given ascore of one. The rest were given scores of zero. The authors found that 10% of the 6- to 12-year-oldchildren lived in households that would be classified as FI by the USDA and an additional 7% lived inhouseholds that would be classified as marginally food-insecure. An increase in FI was associated with an8% increase in the odds of health limitations [β 1.1, standard error (SE) 2.0; p < 0.01].26
Eicher-Miller et al.28 used NHANES data from 11,247 children aged 3–19 years. They reported that, afteradjustment for clustering, stratification, survey cycle year, sex, ethnicity and poverty-to-income ratio, the oddsof iron deficiency anaemia were 10.7 (p= 0.01), 8.1 (p= 0.002) and 3.0 (p = 0.02) times more likely amongfood-insecure children aged 3–5 years, 6–11 years and 12–15 years, respectively, than among their food-secure counterparts. The total dietary iron intake was 1.9 times as likely (p< 0.001) to be below the Estimated
APPENDIX 7
NIHR Journals Library www.journalslibrary.nihr.ac.uk
144
Average Requirement among food-insecure children aged 16–19 years than among their food-securecounterparts. Skalicky et al.63 assessed 626 children aged < 36 months and found that the proportion ofchildren with anaemia and iron deficient without anaemia did not differ significantly between food-secure andfood-insecure children. However, when adjusting for US-born caregiver, caregiver education, employment,welfare status, household size and child ever breastfed, food-insecure children were 2.4 times more likely tobe iron deficient with anaemia (OR 2.4, 95% CI 1.1 to 5.2; p = 0.02) than food-secure children. There was noassociation between child FI and anaemia without iron deficiency or iron deficiency without anaemia.
Eicher-Miller et al.29 used NHANES data from 5270 children aged 8–19 years. After adjusting results forpotential confounders (survey year, poverty-to-income ratio, ethnicity, BMI, physical activity, meals eatenat school per week, and personal smoking) they found that bone mineral content was lower in males8–11 years old from food-insecure households than in their food-insecure counterparts (p ≤ 0.05). Femalesand males of other age groups did not significantly differ in bone mineral content. Survey-adjusted univariateanalysis revealed differences in calcium-related dietary proportions among FS and FI groups. Only males aged8–11 years from food-insecure households were found to differ from their food-secure counterparts. Theywere more than twice (OR 2.5, 95% CI 1.1 to 5.8; p = 0.03) as likely to report less than the USDA Food Guiderecommendations for servings of dairy and 2.3 times (OR 2.3, 95% CI 1.3 to 4.0; p < 0.001) more likely tohave a calcium intake less than the estimated average requirement than males from households with FS.
Ryu et al.95 examined the exposure to household FI over a period of 9 years among a sample of children(n = 6651) selected when they were in kindergarten and assessed the consequences of FI on children’sparent-reported general health in eighth grade. Among children with no household FI at baseline orsubsequent observations, 84.4% had ‘very good’ or ‘excellent’ proxy-reported health at the start ofkindergarten, compared with 78.5% of those with 1 year of FI and 65–70% of those with 2, 3 or 4 yearsof FI. By eighth grade, the health differences according to the children’s FS history were more apparent:88.5% of children with no observed household FI were in ‘very good’ or ‘excellent’ health compared with67–79% of those with 1, 2 or 3 years of FI and 58.1% of those with household FI in all observed years.Compared with children who were food-secure at all time points, children with 3 years of reportedhousehold FI had an estimated 92% increase in their odds of lower health status and children living infood-insecure households during the 4 years of observations had an estimated 209% increase in theirodds of lower health status. Adjusting the models to a higher average income significantly reduced theodds of poor, fair or good health, whereas the number of years in FI had no significant link to healthoutcomes. Lower health at baseline was also strongly linked to lower health in eighth grade.
Marjerrison et al.45 found that the mean glycated haemoglobin (HbA1c) concentration was higher in childrenfrom food-insecure households than in those from food-insecure households [mean 9.5%, standard deviation(SD) 2.1%, vs. mean 9%, SD 1.5%; p = 0.039] (n = 183). There was no statistically significant differencebetween the FI and FS groups in the number of diabetes mellitus-related visits to the emergency department.Children living in a food-insecure household were less likely to use an insulin pump (p = 0.002). FI did notpredict HbA1c concentrations of > 9.0%. The authors noted that families implemented various strategies tomanage the financial load of diabetes mellitus. One of the most common strategies was to buy cheaper foodso that the money could be used to purchase supplies (19/40; 47.5%) and having another family membereat less so that the child with diabetes mellitus could have sufficient food (20/40; 50%). Furthermore, someof the interviewed families (n = 5) reported reusing needles and/or testing blood glucose less often thanrecommended because of the high cost of materials.
In the study by Mangini et al.,44 the evaluation of asthma in 11,099 third grade children was assessed in theEarly Childhood Longitudinal Study – Kindergarten cohort (ECLS-K). The overall results showed that besidesethnicity, asthma prevalence differed by FS, household poverty status, child’s BMI and birthweight. In non-Hispanic white, non-Hispanic African American and Hispanic children, the prevalence of asthma was higher inthose from food food-insecure households. In the adjusted (by ethnicity; household poverty status in relationto census thresholds; child sex; maternal nativity and education; child health insurance; height, weight, andbirthweight; and household income) analysis for the entire sample (n= 11,099), higher odds of asthma were
DOI: 10.3310/phr06130 PUBLIC HEALTH RESEARCH 2018 VOL. 6 NO. 13
© Queen’s Printer and Controller of HMSO 2018. This work was produced by Aceves-Martins et al. under the terms of a commissioning contract issued by the Secretary of Statefor Health and Social Care. This issue may be freely reproduced for the purposes of private research and study and extracts (or indeed, the full report) may be included inprofessional journals provided that suitable acknowledgement is made and the reproduction is not associated with any form of advertising. Applications for commercialreproduction should be addressed to: NIHR Journals Library, National Institute for Health Research, Evaluation, Trials and Studies Coordinating Centre, Alpha House, University ofSouthampton Science Park, Southampton SO16 7NS, UK.
145

associated with a food-insecure household (OR 1.0, 95% CI 1.0 to 1.1). In particular, marginal FI wasassociated with 34% higher odds of asthma (95% CI 1.3 to 1.4). Similarly, when marginally food-insecurehouseholds were grouped with food-insecure households, the OR for asthma was 1.36 (95% CI 1.3 to 1.4).In Hispanic children, a 35% higher odds of asthma was associated with FI, whereas poverty increased asthmaby 34% (95% CI 1.3 to 1.4), and the odds more than doubled for Hispanic children in food-insecure andpoor households (OR 2.3, 95% CI 2.2 to 2.4). In non-Hispanic African American children, FI was negativelyassociated with asthma (OR 0.6, 95% CI 0.5 to 0.6), whereas FI and poverty together were positively associatedwith asthma (OR 1.8, 95% CI 1.7 to 1.8). In non-Hispanic white children, FI was positively associated withasthma (OR 1.2, 95% CI 1.2 to 1.2), as was the combination of FI and poverty (OR 1.8, 95% CI 1.7 to 1.8).
Shanafelt et al.60 used a student survey to assess the personal health of food-insecure adolescents fromrural schools in Minnesota, USA (n = 904). They observed that, compared with their food-securecounterparts, food-insecure adolescents reported poorer health (p < 0.01). After adjusting for grade level,sex, free and reduced-price lunch status, ethnicity and weight categories, food-insecure adolescents weresignificantly less likely to report ‘excellent’ or ‘very good’ health (OR 0.4, 95% CI 0.3 to 0.6; p < 0.01).
Tester et al.66 used NHANES data from 1072 adolescents aged 12–18 years and reported a trend towardspoorer lipid profiles (higher levels triglycerides or low-density lipoprotein) for food-insecure adolescents, butthe results were not associated with FS status. Those reporting marginal FS were almost two times morelikely (OR 1.9, 95% CI 1.1 to 3.0) to have elevated triglycerides (≥ 90 mg/dl) (OR 1.7, 95% CI 1.1 to 2.8),elevated triglyceride-to-high-density lipoprotein cholesterol (HDL-C) ratio (OR 2.0, 95% CI 1.2 to 3.4) and ApoB level of ≥ 90 mg/dl. However, these results were not significant for those reporting low or very low FS. Theinteraction between FS and sex was significant for HDL-C (p = 0.014); females were almost three times morelikely to have low HDL-C (OR 2.7, 95% CI 1.1 to 6.4) when categorised as marginal FS, although not with lowor very low FS. No associations were seen in male adolescents.
Weinreb et al.69 collected health data from homeless and low-income mothers and their children (180preschool-aged children and 228 school-aged children) in Massachusetts, USA. They found (unadjustedanalyses) that, compared with their food-secure counterparts, school-aged children with severe hunger weremore likely to have more chronic health conditions (mean 3.4 vs. 1.8; p = 0.002) and more stressful lifeevents (mean 8.8 vs. 6.0; p = 0.009). Similarly, in the past year preschool-aged children with severe hungerexperienced more traumatic life events than children free from hunger (mean 8.5 vs. 6.0; p = 0.02).Preschool-aged children with severe hunger also had more health conditions in the past year (2.8 vs. 1.9 forthe no hunger group and vs. 2.6 for the modest hunger group; p = 0.004). For preschool-aged children,moderate hunger was a significant predictor of health conditions after controlling for explanatory variables(p = 0.03). In school-aged children, severe hunger was a significant predictor of chronic conditions afteradjusting for housing status, mother’s distress, low birthweight and child life events (p = 0.05).
Ramsey et al.54 collected data from 185 households with children aged 3–17 years in socioeconomicallydisadvantaged urban areas in Australia by means of a parent-completed questionnaire. They showed thata greater proportion of children from food-insecure households experienced poorer general health thantheir food-secure counterparts (p = 0.01). However, after adjusting the analyses for household income,health was no longer associated with children FI (p > 0.05).
Six studies27,45,57,63,83,116 exploring the relationship between FI and number of hospitalisations had mixedresults. Cook et al.83 found (adjusted analyses) that, compared with their food-secure counterparts,children in food-insecure households were 1.3 times more likely to have been hospitalised since birth(OR 1.3, 95% CI 1.2 to 1.5). Marjerrison et al.45 assessed children with insulin-dependent diabetes andobserved that children from food-insecure families had a higher rate of hospitalisation in the previous year(30% vs. 10.5%; p = 0.002) than those from food-secure families. Similarly, Skalicky et al.63 found that,compared with food-secure children, food-insecure children were more likely to have had one or morehospitalisations (p = 0.02). The remaining three studies did not find any significant relationship between FIand rate of hospitalisation.27,57,116
APPENDIX 7
NIHR Journals Library www.journalslibrary.nihr.ac.uk
146

Weight status
Barroso et al.78 performed a cross-sectional secondary data analysis of a sample of 240 low-incomeMexican American mother–child dyads. The children were enrolled in the WIC and were free of any majordisease. The mean age of the 240 children was 17.0 months (SD 4.2 months) and the mean age of themothers was 26.2 years (SD 5.8 years). Cutting the size of the child’s meal, running out of money forfood, running out of food and visiting a food bank (as indicators of FI) were not significantly associatedwith child weight-for-length. However, receiving food stamps or Supplemental Nutrition AssistanceProgram (SNAP) was positively associated with child weight-for-length in that children whose mothersreported ever having received SNAP were twice as likely to be overweight as children whose mothersdid not report ever having received SNAP (95% CI 1.0 to 3.9). Children who consumed desserts were2.9 times more likely to be overweight than children who did not consume desserts (95% CI 1.2 to 6.9).In addition, children’s calorie intake was significantly associated with child weight-for-length.
Bruening and Johnson79 examined potential protective factors that mediated the relationship between FIand overweight/obesity among 5869 adolescents in New Mexico. After adjusting results for sociodemographiccharacteristics, FI was significantly associated with overweight/obesity (OR 1.2; p = 0.047).
Casey et al.81 used data from the US NHANES 1999–2002 on 6995 children aged 3–7 years to assessthe association between household and child FI with childhood overweight status. Children classified as FIwere significantly more likely to be at risk of obesity (38.8% vs. 28.8%; p ≤ 0.01) and to be overweight(21.1% vs. 14.5%; p ≤ 0.01) than children classified as food-secure. However, when stratified by agegroups, this difference was statistically significant (p ≤ 0.05) only for the 3- to 5-year-olds (36.9% vs.21.6%) and the 12- to 17-year-olds (38.3% vs. 30.1%). After adjusting the analyses for child age,ethnicity, sex and household poverty index, the risk of obesity was 1.3 times greater in food-insecurechildren than in those who were food secure (OR 1.3, 95% CI 1.0 to 1.7; p = 0.03).
Kaiser et al.36 presented data from a cross-sectional survey of 211 low-income Mexican American familieswith children of preschool age (aged 3–6 years) conducted in California, USA. Weight-for-height z-scores,height-for-age z-scores and the percentage of overweight (85th percentile weight-for-height z-scores)were calculated. Families who reported household FI showed the highest mean weight-for-height z-scores.Although the prevalence of child overweight and obesity was high (14% were above the 85th percentileweight-for-height z-scores and 23% were above the 95th percentile), no significant differences werefound in weight or height status of children by level of FI.
Papas et al.51 investigated the association between FI and obesity among 74 low-income, Hispanicmother–child dyads. The majority of households were FI (74%) and one-third (30%) of children wereobese. After adjusting for marital status, monthly household income and the number of children in thehousehold, FI status was significantly associated with childhood obesity (OR 10.2, 95% CI 1.2 to 85.5;p < 0.05), with stronger associations observed within households where mothers were overweight/obesethan in those where mothers were of a normal weight.
Pickett et al.76 used data collected in Canada for the HBSC study to investigate the association between FIand weight status in a large sample (n = 25912) of adolescents (aged 11–15 years). After adjusting forpotentially relevant factors, results showed that those reporting hunger ‘sometimes’ or ‘often or always’were more likely to self-report an overweight/obese status (OR 1.2, 95% CI 1.1 to 1.4, and OR 1.3, 95% CI1.0 to 1.6, respectively) than those who reported to have ‘never’ experienced hunger.
Willis and Fitzpatrick112 examined the association between FI and weight status among youth, as well asthe potential mediation by psychosocial factors. Cross-sectional data were collected from fifth to seventhgrade students (n = 324) in a middle school in Arkansas, USA. The mean age of students was 11 years. FI,depression and perceived social status all showed significant associations with weight status. Overall, thisstudy shows that there was a significant (p < 0.001) association between FI and weight status among early
DOI: 10.3310/phr06130 PUBLIC HEALTH RESEARCH 2018 VOL. 6 NO. 13
© Queen’s Printer and Controller of HMSO 2018. This work was produced by Aceves-Martins et al. under the terms of a commissioning contract issued by the Secretary of Statefor Health and Social Care. This issue may be freely reproduced for the purposes of private research and study and extracts (or indeed, the full report) may be included inprofessional journals provided that suitable acknowledgement is made and the reproduction is not associated with any form of advertising. Applications for commercialreproduction should be addressed to: NIHR Journals Library, National Institute for Health Research, Evaluation, Trials and Studies Coordinating Centre, Alpha House, University ofSouthampton Science Park, Southampton SO16 7NS, UK.
147

adolescents. This association remained consistent after controlling for sex, poverty and ethnicity (p < 0.05).However, the addition of psychosocial factors, such as perceived social status and depression, wereimportant mediators of the FI–obesity association.
Studies that did not find a significant relationship between FI and weight are described below.
Kuku et al.100 examined data from 959 children (aged 0–12 years) from a nationally representative USdata set (the Child Development Supplement of the Panel Study of Income Dynamics). The results of theirparametric analyses showed that there was no significant relationships between childhood obesity and FI.By contrast, non-parametric results (using a continuous measure of FI) showed that the probability of beingobese varied according the level of FI experienced by the child (increased for food-secure children anddecreased as FI became more extreme). They concluded that the relationship between FI and obesity iscomplex and non-linear and differs by demographic and economic subgroups.
Lohman et al.102 examined a sample of adolescents (n = 1011) aged 10–15 years and their low-incomefamilies from the Welfare, Children, and Families: A Three-City Study, Overview and Design Report,186 andadjusted the results for FI and relevant maternal stressor indices. They found that there was no directassociation between FI, maternal or family stressors and overweight or obesity. However, the interaction ofFI and maternal stressors (i.e. unemployed, disability, low self-esteem, high psychological distress, poor healthand low social support) was significantly linked to the probability of being overweight or obese (i.e. an increasein maternal stressors increased the adolescents’ probability of being overweight or obese) (p < 0.05).
Martin and Ferris103 examined the relationship between childhood overweight and FI in a sample of 212children aged 2–12 years. They did not find (unadjusted analyses) a significant association between FI andchildhood overweight. After adjusting results for potential confounders [i.e. household income level, childage (2–5 years or 6–12 years), child sex, single parenthood and parents’ educational level], they found thathaving an obese parent significantly increased the odds of a child being overweight (OR 2.6, 95% CI 1.2to 5.4; p = 0.02) and that children in households with incomes < 100% of poverty were half as likely to beoverweight as those in higher-income households (OR 0.4, 95% CI 0.2 to 0.9; p = 0.03). However, therewas no significant association between childhood overweight and FI.
Ramsey et al.54 investigated the associations between FI and health and developmental outcomes in 185children aged 3–17 years from socioeconomically disadvantaged suburbs in Australia. After adjustmentfor household income, weight status was not associated with FI. Children from food-insecure householdsdid not have a greater probability of being underweight/normal weight or overweight/obesity than theirfood-secure counterparts (OR 0.9, 95% CI 0.4 to 2.1; p > 0.05).
Speirs et al.109 explored the relationships between household and child FI and child overweight using asample of 438 preschool-aged children aged 2–5 years in the USA. They found that neither householdnor child FI was significantly associated with overweight/obesity or BMI scores. However, after adjusting theresults for potential confounders (i.e. maternal ethnicity, maternal age, maternal BMI, household income,parental education, child sex and child age), they observed a significant positive relationship betweenhousehold FI and BMI scores for girls (OR 2.1, 95% CI 0.6 to 7.5; p = 0.01) but not for boys (OR 0.8, 95% CI0.2 to 2.7; p > 0.05).
Trapp et al.67 explored the association between household FI, dietary intake and BMI in 222 low-income,preschool-aged children (aged 2–4 years).They did not find a direct association between household FI andchild overweight/obesity. When the analyses were stratified by ethnicity, household FI was not associatedwith child weight among all ethnic groups. They also reported that the proportion of overweight/obesechildren in highly food-secure households nearly doubled between 2 and 3 years of age (p < 0.02). Thisincrease in weight among age groups was not observed for households reporting any degree of FI.
APPENDIX 7
NIHR Journals Library www.journalslibrary.nihr.ac.uk
148
One study reported mixed results across age groups. Metallinos-Katsaras et al.105 examined the relationshipbetween overweight and household FI with/without hunger in low-income children in the USA. Data werecollected on 8493 children aged 1 month to 5 years and analysed by sex and age groups using logisticregression. Significant interactions were found between household FI and age groups (p < 0.05) and childsex (p < 0.10). After adjusting results for potential confounders (i.e. ethnicity, age and maternal education),they observed that among children < 2 years, household FI was associated with reduced odds of overweightcompared with food-secure households. This association was statistically significant for girls (OR 0.6, 95% CI0.5 to 0.9; p < 0.05), but not for boys (OR 0.8, 95% CI 0.6 to 1.1; p > 0.05). Among 2- to 5-year-old girls,households reporting FI with hunger were positively associated with greater odds of being overweightcompared with food-secure households (OR 1.5, 95% CI 1.1 to 2.1; p < 0.05).
Data from the US National Health and Nutrition Examination SurveySix of the included studies used data from the NHANES conducted in the USA.28,74,85,86,88,97 Two studiesshowed a relationship between FI and children’s weight. Eicher-Miller et al.28 collected data from 11,247children and showed that the prevalence of being ‘at risk of overweight’ and ‘overweight’ was significantlyhigher among children aged 3–19 years who were living in food-insecure households than among childrenaged 3–5 years (p = 0.0246) and 12–15 years (p = 0.002) in food-secure households. Kaur et al.97 studied asample of 9701 children aged 2–11 years and reported a significant difference in the prevalence of obesitybetween food-secure and food-insecure children at both a child level and a personal level (p < 0.001).
Three studies found no relationship between FI and weight status. The study by Gundersen et al.86
investigated the associations between FI and the probability of being ‘at risk of overweight’ or ‘overweight’in 841 children aged 3–17 years. Overall, no direct association between FI and childhood overweightwas found.
A further study by Gundersen et al.85 showed that food-insecure children (n = 2516) aged 8–17 yearswere no more likely to be obese than their food-secure counterparts. Five different measurements ofobesity (i.e. BMI, waist circumference, triceps skinfold thickness, trunk fat mass and percentage of bodyfat) were used in the study. After adjusting results for potential confounders (i.e. child age, ethnicity, sexand family income), the association between FI and obesity was not significant for five measures ofobesity. This non-significant association remained when subgroups analyses were performed according toethnic groups (non-Hispanic whites, non-Hispanic African Americans, and Hispanics) and sex. Kohn et al.74
collected data from 1321 low-income, food-insecure children aged 4–17 years. After adjusting results forpotential confounders (i.e. child age, sex, ethnicity, family poverty status, health insurance type, sex ofprimary respondent, primary respondent age and education), they found that food assistance participationwas not associated with BMI scores, high waist circumference or categorical weight status.
One study reported mixed results regarding the relationship between FI and childhood weight. Holben andTaylor88 analysed results from 7435 adolescents aged 12–18 years and found no significant differences inmean BMI-for-age percentiles by household FS status (p = 0.087). However, after adjusting the results forpotential confounders (i.e. age, ethnicity and sex), they observed that participants classified as marginally foodsecure (OR 1.4, 95% CI 1.1 to 1.9; p < 0.001) and low food secure (OR 1.4, 95% CI 1.1 to 1.8; p < 0.001)were significantly more likely than their high food-secure counterparts to be overweight. In addition, thosefrom marginally food-secure households (OR 1.3, 95% CI 1.0 to 1.7; p = 0.036) and very low-FS households(OR 1.4, 95% CI 1.0 to 1.8; p = 0.036) were more likely to be obese that their counterparts. In central obesitymeasurements (waist circumference), significant differences were also found between levels of FS status(p < 0.001). Participants from low- (OR 1.4, 95% CI 1.1 to 1.8; p = 0.002) or very low-FS households (OR 1.5,95% CI 1.1 to 2.0; p = 0.002) had a significantly higher mean percentage of waist circumference thresholds(see Appendix 8 for more details).
Longitudinal data from the US Early Childhood Longitudinal Study – Kindergarten cohortFive of the included studies used data from the US ECLS-K12,20,56,80,113 to investigate the association betweenFI and childhood weight status.
DOI: 10.3310/phr06130 PUBLIC HEALTH RESEARCH 2018 VOL. 6 NO. 13
© Queen’s Printer and Controller of HMSO 2018. This work was produced by Aceves-Martins et al. under the terms of a commissioning contract issued by the Secretary of Statefor Health and Social Care. This issue may be freely reproduced for the purposes of private research and study and extracts (or indeed, the full report) may be included inprofessional journals provided that suitable acknowledgement is made and the reproduction is not associated with any form of advertising. Applications for commercialreproduction should be addressed to: NIHR Journals Library, National Institute for Health Research, Evaluation, Trials and Studies Coordinating Centre, Alpha House, University ofSouthampton Science Park, Southampton SO16 7NS, UK.
149

The ECLS-K started in 1998 by observing 19,684 children enrolled in 1277 US schools. Children and theirhouseholds were observed in kindergarten and first, third and fifth grades. One study found a negativeassociation between FI and children’s weight. Rose et al.56 analysed data from 16,889 children (1480were classified as food insecure and 15,409 as food secure) and found that children from food-insecurehouseholds were 20% less likely to be overweight than those from food-secure households (p = 0.027).
Two studies found no association between FI and weight. Bhargava et al.20 used an ECLS-K data set covering11,479 children from kindergarten to fifth grade to assess the relationships between household FI and bodyweight. Complete data were analysed on 7635 children (mean age 73 months). Results were adjusted forethnicity, age, parental education, number of siblings, health limitations in respondent, television watching,parental care, physical exercise and family income. Household FI was not a significant predictor of weightand BMI scores (p > 0.05). Winicki and Jemison113 found that children from food-secure households weighedless than other children, but the differences were not statistically significant. Moreover, the BMI of childrenincreased with increasing level of FI but, again, the differences were not statistically significant.
Two studies found mixed results for boys and girls. Burke et al.80 used ECLS-K data from 15,827 childrenaged 6–14 years and showed that food insecure girls in kindergarten had an average BMI of 1.1% lower(95% CI –1.9% to –0.3%) than food secure girls. Between kindergarten and eighth grade, food insecuregirls’ BMI increased by 2.9% (95% CI 1.3% to 4.5%) compared with that of food secure girls. For boys,based on FI status, significant differences in BMI were observed. Jyoti et al.11 used a ECLS-K sample of13,500 children for whom data were available at kindergarten and a sample of 11,400 children for whomdata were available at third grade. After adjusting for many individual, parent and household explanatoryvariables, they found that children from persistently food-insecure households had a 0.4 kg/m2 greater gainin BMI (p < 0.028) and a 0.7 kg greater gain in weight (p < 0.026) than children from persistently food-secure households. These associations were significant among girls (β 0.6 kg/m2, p = 0.0022, and β 1.0 kg,p = 0.0024, respectively) but not among boys. Becoming food insecure was associated significantly withgreater weight gains and BMI gains among boys (β 1.2 kg; p = 0.019) but non-significantly with smallerweight and BMI gains among girls (p > 0.05).
Studies that used ECLS-K data showed that the association of FI with weight in children might be complexand several factors or explanatory variables may affect the magnitude and direction of results. Bhargavaet al.20 used data from the 1998–19 and 2010–11 cohorts and included weight and height as explanatoryvariables in their analyses. They observed that households with children taller and/or heavier for their agesreported significantly higher FI levels. However, household FI was not a significant predictor of weight andBMI scores. Burke et al.80 used the 1998, 1999, 2002, 2004 and 2007 ECLS-K cohorts and analysed databy sex. They observed significant differences in BMI growth between food secure and food-insecurehouseholds with girls but not in households with boys. The association shifted over time; girls in food-insecure households at the start of the study (n = 7808) had a BMI that was 1.1% lower than that of girlsin food-secure households (p < 0.01). However, by eighth grade, girls in food-insecure households hada BMI that was 1.7% higher than that of girls in food-secure households (p < 0.01). BMI growth fromkindergarten to eighth grade among girls in food-insecure households was 2.9% greater (p < 0.001) thanthe growth among girls in food-secure households.
Mental health outcomes
Belsky et al.19 examined the role of FI in the aetiology of children’s cognitive and mental health problems.They used data from a prospective longitudinal study of 2125 school-aged children (sample initiated in1999–2000) to test the associations between household FI and children’s cognitive, behavioural and emotionaldevelopment. They reported (unadjusted analyses) that children living in food-insecure households hadhigher levels of behavioural and emotional problems at 12 age of years than their food-secure counterparts(p< 0.001). The relationship between FI and children’s behavioural problems was largely independent ofhousehold income (β 0.2, SE 0.1; p< 0.05), but became weak and non-significant when results were adjustedfor income level, maternal personality and household sensitivity to children’s needs (p> 0.05). By contrast,
APPENDIX 7
NIHR Journals Library www.journalslibrary.nihr.ac.uk
150

the association between FI and children’s emotional problems remained significant in both unadjusted andadjusted analyses (β 0.2, SE 0.1; p< 0.05).
Huang et al.92 used longitudinal data from 416 children (mean age 9.5 years) and adjusted results for thehousehold head’s characteristics, household characteristics and child’s characteristics to explore theassociation between FI and children’s behavioural problems (externalising and internalising behaviours).FI was positively associated with both externalising and internalising behavioural problems. In particular, theyfound that FI could impact on indirectly externalising and internalising problems through parenting stress.
Johnson and Markowitz96 used data (n = 3700) from the longitudinal US Early Childhood LongitudinalSurvey – Birth cohort (ECLS-B) study to examine the association of FI with children’s behaviour in terms ofhyperactivity, conduct problems and approaches to learning. They found that as the level of FI increasedacross early childhood, the negative associations with behavioural outcomes increased accordingly.Specifically, any one episode of FI in early childhood was associated with increased hyperactivity (β 0.3,SE 0.1; p = 0.02) and conduct problems (β 0.3, SE 0.1; p = 0.05).
Molcho et al.106 used data from the 2002 HBSC study, a cross-sectional survey that administered aself-completion questionnaire to a nationally representative random sample of school-children (n = 8424)aged 10–17 years from 176 schools in the Republic of Ireland. All analyses were adjusted for age andsocial class (according to the father’s occupation), and were conducted independently for boys and girls.They observed that both boys and girls experiencing FI reported mental symptoms more frequently.Symptoms such as feeling irritable, bad tempered, more nervous or having difficulties sleeping weresignificantly higher in children who reported food poverty than in those who did not report food poverty(both sexes; p < 0.05). Boys who reported experiencing food poverty were more likely to feel low (OR 2.6,95% CI 2.3 to 2.8), afraid (OR 2.2, 95% CI 1.8 to 2.5) or dizzy (OR 2.4, 95% CI 2.1 to 2.7) than thosewho did not report food poverty. Girls who reported experiencing food poverty were more likely to feeldizzy (OR 2.0, 95% CI 1.7 to 2.2), afraid (OR 2.2, 95% CI 2.0 to 2.5) or tired and exhausted (OR 2.0,95% CI 1.8 to 2.2) than those who did not report food poverty.
Howard89 analysed the ECLS-K data from 4710 children enrolled in first, third and fifth grade (1999–2003)and found that children experiencing FI at any time had lower social skills (assessed in terms of interpersonalrelationships, self-control, approaches to learning and externalising behaviour) than children who were foodsecure. FI was also found to affect negatively children’s non-cognitive skill development. In particular, childrenwho experienced an early transition from FI in first grade to FS in third grade showed a large impairment thatpersisted through to fifth grade (p < 0.05).
In a further publication based on the same data set, Howard90 showed a significant (p < 0.05) negativerelationship between FI and children’s social skill scores. Children who experienced a transition from FI infirst grade to FS in third grade had significantly lower social skill scores (p = 0.019). The association wassignificant among boys (p < 0.05) but not among girls (p = 0.56).
Slack and Yoo108 used data from the US Illinois Families Study, a 6-year panel of families that had a primarycaregiver transitioning from welfare to work. Data from 942 families with at least one child were used toexplore the relationship between food hardship and behaviour problems in children aged 3–5 years andchildren aged 6–12 years. Food hardship was positively associated with externalising behaviour problemsfor younger children (p< 0.01) and with internalising behaviour problems for both age groups (p< 0.01).Food hardship was not found to be related to older children’s externalising behaviour problems (p> 0.05).However, all of these relationships were mediated by parental characteristics (such as parental stress, warmthand depression).
Pickett et al.76 used HBSC survey data from 25,912 Canadian children aged 11–15 years. After adjustingresults for potential confounders, they observed that children who experienced hunger ‘sometimes’ or‘often or always’ were more likely to report internalising negative emotional problems than those who
DOI: 10.3310/phr06130 PUBLIC HEALTH RESEARCH 2018 VOL. 6 NO. 13
© Queen’s Printer and Controller of HMSO 2018. This work was produced by Aceves-Martins et al. under the terms of a commissioning contract issued by the Secretary of Statefor Health and Social Care. This issue may be freely reproduced for the purposes of private research and study and extracts (or indeed, the full report) may be included inprofessional journals provided that suitable acknowledgement is made and the reproduction is not associated with any form of advertising. Applications for commercialreproduction should be addressed to: NIHR Journals Library, National Institute for Health Research, Evaluation, Trials and Studies Coordinating Centre, Alpha House, University ofSouthampton Science Park, Southampton SO16 7NS, UK.
151
reported ‘never’ suffering from hunger (OR 2.1, 95% CI 2.0 to 2.2, and OR 3.8, 95% CI 3.2 to 4.4,respectively). Furthermore, those reporting hunger ‘sometimes’ or ‘often or always’ were more likely toreport externalising negative behavioural problems than those who reported ‘never’ suffering from hunger(OR 1.2, 95% CI 1.1 to 1.3, and OR 2.0, 95% CI 1.7 to 2.4, respectively).
Weinreb et al.69 assessed 180 preschool children aged 2.5–6 years and 228 school-children aged 6–17 yearswho participated in an unmatched case–control study of homeless, low-income families in the USA. For bothgroups of children, severe hunger was a predictor of internalising problems after controlling for possibleexplanatory variables (p < 0.001). After adjusting results for type of housing, mother’s distress level andstressful life events, school-aged children with severe hunger had parent-reported anxiety scores that weremore than double the scores for children with no hunger and significantly higher internalising behaviourproblems than children with no hunger. Similarly, for preschool-aged children, severe hunger was associatedwith internalising behaviour problems compared with children with no hunger.
McLaughlin et al.47 examined whether FI was associated with past-year mental disorders using theDiagnostic and Statistical Manual of Mental Disorders, Fourth Edition, in 6483 adolescent–parent pairswho took part into the US National Comorbidity Survey Replication Adolescent Supplement survey. Theyfound that a higher FI score was associated with greater odds of any past-year mental disorder (OR 1.2)and greater odds of past-year mood, anxiety, behaviour and substance disorders (OR 1.2 for each). Aftercontrolling for standard indicators of family SES, FI remained significantly associated with greater odds ofadolescents’ mental disorders. The magnitude of the associations between FI and mental disorders wasunchanged when controlling for extreme poverty and family income and minimally attenuated whencontrolling for childhood adversities. There was also a positive interaction between FI and either familyincome (p = 0.008) or relative deprivation (p = 0.005). The association between FI and mood disorders wasstronger for adolescents with a low family income (OR 1.2–1.6 for adolescents in the lowest three quartilescompared with adolescents in the highest quartile) and was stronger for adolescents with higher levels ofrelative deprivation (OR 1.1).
Poole-Di Salvo et al.53 used cross-sectional data from the 2007 set (eighth grade) of the ECLS-K from8600 adolescents and found (unadjusted analyses) that adolescents with household FI had significantlyhigher rates of parent-reported mental health problems than those with household FS. Compared withfood-secure adolescents, adolescents who lived in food-insecure households had a significantly increasedrisk of emotional (OR 2.5, 95% CI 1.6 to 3.7), conduct (OR 1.5, 95% CI 1.0 to 2.3), peer problems (OR1.6, 95% CI 1.0 to 2.4), less optimal pro-social behaviour (OR 1.5, 95% CI 1.0 to 2.2) and hyperactivity(OR 1.5, 95% CI 1.0 to 2.2). After adjusting the results for appropriate variables, household FI wasindependently associated with more than a twofold increased risk of parent-reported mental health problemsamong adolescents (OR 2.3, 95% CI 1.6 to 3.2).
Ramsey et al.54 assessed 185 children aged 3–17 years from socioeconomically disadvantaged suburbsin Australia. After adjusting results for household income, the authors found that children living infood-insecure households were more likely to report borderline or atypical emotional symptoms(OR 2.4, 95% CI 1.1 to 5.4; p < 0.05) or behavioural difficulties (OR 2.4, 95% CI 1.0 to 5.3; p < 0.05).
Dunifon and Kowalwski-Jones26 evaluated the effects of FI and of participating in the US NSLP in a sampleof 3500 school-aged children (6–12 years). They found that participation in the NSLP was associated withincreased externalising behaviour. An increase in FI was associated with decreased levels of positivebehaviours (β –0.17, SE 0.06; p < 0.001). Boys showed more behaviour problems than girls.
Huang and Vaughn93 used longitudinal data from 7348 children in the ECLS-K. After adjusting resultsfor child characteristics, household characteristics and parental characteristics they found that FI was notassociated with developmental change in children’s behaviour problems. They observed that the impact ofFI on children’s behaviour problems could be episodic or interact with specific developmental stages.
APPENDIX 7
NIHR Journals Library www.journalslibrary.nihr.ac.uk
152

Kimbro et al.39 used data from 6300 children in the ECLS-K. They found that, in general, for childrenwho experienced FI, teachers reported poorer scores with regard to interpersonal skills, self-control, andinternalising and externalising behaviours. However, they reported two exceptions: (1) internalisingbehaviours among children who transitioned into FI were not significantly different from those observedamong children who were never FI and (2) externalising behaviours among children who transitioned outof FI were not significantly different from those observed in children who were food secure. After adjustmentfor confounding factors, children who transitioned from FS to FI showed significantly worse ratings oninterpersonal skills, self-control, and externalising behaviours than children who were food secure.
Social well-being outcomes
Zaslow et al.72 used data from 8944 children aged 9–24 months in the ECLS-B to explore the associationsbetween household FI during infancy and attachment and mental proficiency in toddlerhood. They foundthat FI had no significant direct association with being insecurely attached. Instead, FI worked indirectlythrough depression and parenting practices to influence security of attachment and mental proficiency intoddlerhood. FI appeared to be positively associated with depression (β 0.2; p < 0.001), which, in turn, wasnegatively associated with positive parenting (β –0.03; p < 0.05). The likelihood of insecure attachmentreduced when more positive parenting practices were put in place (β –0.04; p < 0.05).
Baer et al.77 assessed 400 participants aged 15–25 years (mean 18 years) living in Boston, USA, whocompleted a web-based screening tool. The survey aimed at identifying problems in seven health-relatedsocial domains. After adjustment for age, sex and ethnicity, FI was significantly associated with cumulativeburden of social problems (p < 0.001). In particular, FI was associated with housing problems (OR 2.8,95% CI 1.8 to 4.4) and substance use (OR 2.5, 95% CI 1.5 to 4.3). More specifically, compared withfood-secure participants, those reporting low (n = 70) or very low FS (n = 60) were 3.1 times (OR 3.1,95% CI 1.8 to 5.5; p < 0.001) and 3.3 times more likely (OR 3.3, 95% CI 1.8 to 6; p < 0.001) to reporthousing issues. Furthermore, those reporting very low FS were at higher risk of alcohol and drugs abuseand tobacco use (OR 4.5, 95% CI 2.3 to 9.2; p < 0.001).
Pickett et al.76 used HBSC data from 25,912 children aged 11–15 years from 436 Canadian schools. Afteradjustment for potential confounding factors, compared with their ‘never’ hungry counterparts, childrenwho experienced hunger ‘sometimes’ or ‘often or always’ were less likely to report emotional well-beingfeelings (OR 0.6, 95% CI 0.5 to 0.6, and OR 0.5, 95% CI 0.4 to 0.5, respectively) and pro-socialbehaviours (OR 0.8, 95% CI 0.8 to 0.9, and OR 0.8, 95% CI 0.7 to 1.0, respectively) and more likely toreport frequent physical fighting (OR 1.3, 95% CI 1.2 to 1.4, and OR 2.3, 95% CI 2.0 to 2.7, respectively)and to talk back to teachers (OR 1.3, 95% CI 1.2 to 1.4, and OR 1.8, 95% CI 1.5 to 2.1, respectively).
Helton87 used a sample of 3580 children up to 17 years old from the US National Survey of Child andAdolescent Well-Being187,188 and the corresponding administrative data files from the National Child Abuseand Neglect Data System (NCANDS).189 They examined families with and without an allegation of child foodneglect with regard to the time to re-report following the close of a maltreatment investigation. ‘Food neglect’was described as the inadequate provision of food and a form of FI. The findings showed that around 12%of families with children who were experiencing food neglect were re-reported within 100 days of the indexinvestigation, compared with 8% of families without food neglect. Within 1 year, around one-third (34%) offood-neglected children were re-reported compared with about 24% of families without food neglect. Afteradjustment for maltreatment types, caregiver mental health problems and other relevant covariates, foodneglect predicted a greater risk of re-report [hazard ratio (HR) 3.0, 95% CI 1.2 to 7.9; p < 0.05] than did otherforms of maltreatment (e.g. shelter neglect HR 0.3, 95% CI 0.1 to 0.8, and receiving interventions from theChild Protective Services HR 0.7, 95% CI 0.5 to 1.0).
Two studies assessing the relationship between FI and children’s social well-being stratified the results bysex.11,94 Jyoti et al.11 used data from ≈13,500 children enrolled in the ECLS-K cohort and found that children
DOI: 10.3310/phr06130 PUBLIC HEALTH RESEARCH 2018 VOL. 6 NO. 13
© Queen’s Printer and Controller of HMSO 2018. This work was produced by Aceves-Martins et al. under the terms of a commissioning contract issued by the Secretary of Statefor Health and Social Care. This issue may be freely reproduced for the purposes of private research and study and extracts (or indeed, the full report) may be included inprofessional journals provided that suitable acknowledgement is made and the reproduction is not associated with any form of advertising. Applications for commercialreproduction should be addressed to: NIHR Journals Library, National Institute for Health Research, Evaluation, Trials and Studies Coordinating Centre, Alpha House, University ofSouthampton Science Park, Southampton SO16 7NS, UK.
153

from food-insecure households at kindergarten showed a greater decline in social skills assessed by teachersquestionnaires than children from food-secure households. Stratification by sex showed that the associationbetween kindergarten FI and change in social skills was significant only for boys (β –0.1; p < 0.001). Aftercontrolling for relevant variables, the association between kindergarten FI and social skills was significantonly among girls. In the full sample, persistent FI was not associated with differential changes in social skillsover time when compared with persistent FS. Transitioning from FI to FS was associated with a greaterincrease in social skills score for girls (p < 0.001) and a smaller increase for boys (p < 0.038). By contrast,becoming FI was associated with a greater decline in social skills score among girls (β –0.135; p < 0.005) butwith a greater improvement in social skills score among boys (β 0.124; p < 0.050).
Jackson and Vaughn94 used data from the ECLS-K cohort (≈7000 children aged 13–14 years). After adjustingresults for potential confounders, FI and FI persistence were predictive of most forms of misconduct for boys.Persistent exposure to FI during childhood was associated with greater involvement in fighting/bullying(OR 1.7, 95% CI 1.4 to 2.1), stealing (OR 1.7, 95% CI 1.3 to 2.2), cheating/lying (OR 1.4, 95% CI 1.2 to 1.6),and defying misbehaving (OR 1.3, 95% CI 1.1 to 1.5) for boys. Participating in multiple forms of misconductwas 168% higher among boys exposed to persistent FI than among those who were raised in consistentlyfood-secure households. For girls, however, household FI generally failed to predict adolescent misconduct.
Pickett et al.76 used data from the HBSC survey conducted in Canada among 25,912 children aged11–15 years. They found (adjusted analyses) that those reporting hunger ‘sometimes’ or ‘often or always’were more likely (OR 1.3, 95% CI 1.2 to 1.4, and OR 2.3, 95% CI 1.9 to 2.7, respectively) to self-reportfrequent engagement in bullying than those who reported ‘never’ suffering from hunger. Furthermore,those reporting hunger ‘sometimes’ or ‘often or always’ were more likely (OR 1.8, 95% CI 1.7 to 2.0, andOR 2.6, 95% CI 2.2 to 3.0, respectively) to self-report frequent victimisation by bullying than those whoreported ‘never’ suffering from hunger. Edwards and Taub84 also used data from the HBSC (US version)and found a statistically significant difference in bullying victimisation (p < 0.001) and bullying perpetration(p < 0.001) in fifth to tenth grade children with FI as compared with their food-secure peers. All effectsizes were small, but pairwise comparisons indicated that students who faced FI at least occasionallyexperienced greater bullying victimisation than those who did not (p < 0.008). Further analyses showed astatistically significant difference in bullying perpetration.
One study assessed life satisfaction among school children (aged 10–17 years). Molcho et al.106 assessedmeasures of life satisfaction and performed analyses adjusted for sex, age and paternal social class. Theyfound that children reporting food poverty were significantly more likely to feel dissatisfied with their lifewhile children not experiencing food poverty were less likely to report a low life satisfaction (OR 2.2,95% CI 1.95 to 2.43, and OR 2.3, 95% CI 2.1 to 2.5, respectively). The same results were observed forhappiness indicators. Children reporting food poverty were less likely to report happiness.
Casey et al.8 performed a cross-sectional survey of 399 children in the USA aged 3–17 years and reportedthe effects of FI on children’s QoL. Children in food-insecure households scored significantly lower onphysical (p = 0.006) and psychosocial function (p = 0.017) and on total child health-related QoL (p = 0.005)than children in food-secure households. The youngest children (3–8 years) in food-insecure householdsscored significantly lower in physical functioning than their food-secure counterparts (median 6.1, 95% CI2.5 to 9.7; p = 0.001). By contrast, teenagers (12–17 years) in food-insecure households recorded significantlylower scores in psychosocial functioning (median 7.3, 95% CI 2.1 to 12.5; p = 0.007). The youngest children(median 4.8, 95% CI 0.7 to 8.9; p = 0.002) and teenagers (median 5.0, 95% CI 0.5 to 9.5; p = 0.03) infood-insecure households scored significantly lower in the total health-related QoL. In subgroup analyses byethnicity, African American males in food-insecure households scored significantly lower on physical function(p< 0.05) and total child health-related QoL (p< 0.05) but there were no differences for white males by level ofFI. African American females, but not white females, in food-insecure households scored lower in psychosocial(p= 0.08) and total child health-related QoL (p= 0.06). Further analyses adjusted for child age, ethnicity,sex and family income showed that FI status was significantly associated with total child health-related QoL
APPENDIX 7
NIHR Journals Library www.journalslibrary.nihr.ac.uk
154

(median 3.5, 95% CI 0.4 to 6.7; p= 0.03) and physical function (median 3.3, 95% CI 0.1 to 6.4; p≤ 0.05).The association of FI with psychosocial function was not significant (median 3.6, 95% 0.05 to 7.4; p= 0.06).
Academic performance
Baer et al.77 assessed 400 children and young people aged 15–25 years (mean 18 years) who lived inBoston, USA, and completed a web-based screening tool. The survey aimed to identify problems inseven health-related social domains including education. After controlling for age, sex and ethnicity,they found that FI was associated with educational problem, such as unmet learning disability anddropping out of high school (low FS OR 2.4, 95% CI 1.1 to 5.3, p = 0.03; very low FS OR 3.9, 95% CI1.8 to 8.4, p < 0.01).
Belsky et al.19 used data from a UK prospective longitudinal study of 2125 school-aged children (sampleconstructed in 1999–2000) to test the association between household FI and children’s cognitivedevelopment. After adjusting results for potential confounders, they showed that at age 12 years, childrenin food-insecure households (n = 278) had significantly lower IQs and higher levels of behavioural andemotional problems than their food-secure counterparts (p < 0.001). FI predicted lower child IQ but oncehousehold income was added to the model, the association was no longer significant.
Kimbro et al.39 used longitudinal data from 6300 children in kindergarten and first grade who were partof the ECLS-K cohort. They found (unadjusted analyses) that children who were food insecure at kindergartenand/or first grade had significantly lower academic achievement scores in reading, maths and science, thanwith children who were food secure, and that children who were food insecure at both kindergarten and firstgrade scored lowest on all three measures. However, after adjusting their analyses for children and familycharacteristics (e.g. child sex, child birthweight, family structure household income, parental employmentstatus, occupational prestige, education level, number of siblings in the household), they found no significantassociations between FI transitions (into and out of FI) and children’s academic achievement outcomes.
Ramsey et al.54 collected data from 185 households with children aged 3–17 years in socioeconomicallydisadvantaged urban areas in Australia by means of a parent-completed questionnaire. After adjusting forhousehold income, children who were living in food-insecure households were 3.5 times more likely tohave days away from school because of illness (OR 3.5, 95% CI 1.4 to 8.5; p < 0.05.) and 5.4 times morelikely to cut down on activities because of illness (OR 5.4, 95% CI 1.4 to 20.1; p < 0.05).
Johnson and Markowitz96 used longitudinal data from a recent birth cohort of US-born children inlow-income households (n = 2800–3700) to investigate the association between childhood FI and children’skindergarten reading and maths outcomes. After adjustment for standard demographic and householdeconomic variables, they observed broadly negative associations between earlier FI (at 9 months and 2 years)and school outcomes. Very low FI at 9 months was linked to reduced reading scores (p = 0.03), whereas lowFS at 9 months was associated with decreased maths scores (p = 0.03); very low FI at 2 years was associatedwith decreased approaches to learning (p = 0.04) and reduced maths skills (p = 0.03). In general, as theintensity of FI increased across early childhood, so too did negative associations with outcomes.
Jyoti et al.11 used data from ≈13,500 children from the ECLS-K cohort and found that children fromhouseholds experiencing FI at kindergarten demonstrated a smaller increase in maths (β –2.3; p < 0.001)and reading scores (β –4.4; p < 0.001). After controlling for explanatory variables, the association betweenkindergarten FI and change in mathematics score remained negative, even though this was significantonly for girls (β –1.8; p < 0.017). Persistent FI was not associated with differential changes in mathematicsand reading scores when compared with persistent FS in the full sample. Children from householdstransitioning from FS to FI showed a smaller increase in reading score (p = 0.0007) and in mathematicsscores (p < 0.005) than children from households who remained food secure. These differences weresignificant regardless of sex.
DOI: 10.3310/phr06130 PUBLIC HEALTH RESEARCH 2018 VOL. 6 NO. 13
© Queen’s Printer and Controller of HMSO 2018. This work was produced by Aceves-Martins et al. under the terms of a commissioning contract issued by the Secretary of Statefor Health and Social Care. This issue may be freely reproduced for the purposes of private research and study and extracts (or indeed, the full report) may be included inprofessional journals provided that suitable acknowledgement is made and the reproduction is not associated with any form of advertising. Applications for commercialreproduction should be addressed to: NIHR Journals Library, National Institute for Health Research, Evaluation, Trials and Studies Coordinating Centre, Alpha House, University ofSouthampton Science Park, Southampton SO16 7NS, UK.
155

Shanafelt et al.60 used data from 904 children in ninth and tenth grade from the US BreakFAST (FuellingAcademics and Strengthening Teens) project, which enrolled students from 16 high schools in Minnesota,USA. After adjustment for grade level, sex, free and reduced-price lunch status, race, and weight categories,they found that food insecure students were more likely to have a lower cumulative attendance, have alower grade-point average (p < 0.01) and be in a lower grade-point percentile than their food-securecounterparts (p < 0.01). Food-insecure adolescents were more likely to show a lower attendance rate thanfood-secure adolescents (p < 0.01), but this was no longer statistically significant after adjustment (p = 0.15).
Winicki and Jemison113 used data from the ECLS-K cohort. Of the 21,260 children entering kindergarten,18,847 provided valid responses to the FS survey module and 3335 had at least one affirmative response.A negative relationship between maths scores and FI was observed. After adjusting results for explanatoryvariables, there was a negative effect of FI on maths scores and on learning (p < 0.05). However, forchildren ≤ 150% of the federal poverty level, FI measures did not explain maths scores or learning.
Three studies found no relationship between FI and children’s academic performance. Dunifon andKowaleski-Jones,26 who examined the association between FI and participation in the US NSLP in asample of school-aged children (n = 3500), did not find a significant association between FI and children’sacademic scores (p > 0.05). Weinreb et al.69 collected data from homeless and low-income mothers andtheir children (180 preschool-aged children and 228 school-aged children in the USA). Unadjusted analysesshowed that, compared with preschool and school-aged children who were moderately or not hungry,those who experienced severe hunger showed poorer academic scores, developmental delay and learningdisabilities, and were likely to repeat a school year or miss days in school. However, these differenceswere not statistically significant. Zaslow et al.72 analysed data from a longitudinal nationally representativesample of infants and toddlers (n = 8944) aged 9–24 months from the ECLS-B. For the analyses, theyderived parent and child assessment data from the 9- and 24-month interviews. After adjustment formother’s/father’s individual characteristics, household-level characteristics, child characteristics and child-care characteristics, there was no direct effect of FI on children cognitive development (p > 0.05). Higherlevels of FI worked indirectly through depression and parenting practices to influence mental proficiency intoddlerhood. High levels of FI were positively associated with depression (β 0.180). In turn, depression wasnegatively associated with more positive parenting practices (β –0.033) and positive parenting practiceswere positively associated with mental proficiency at 24 months (β 0.081; p < 0.001).
APPENDIX 7
NIHR Journals Library www.journalslibrary.nihr.ac.uk
156

Appendix 8 Descriptions of studies that assessedfood assistance programmes
Cook et al.83 evaluated whether or not receiving food stamps or Temporary Assistance to NeedyFamilies (TANF) benefits modified the associations between FI and health status or hospitalisation
records for children aged ≤ 3 years. The food stamps programme was a food-purchasing assistanceinitiative for low- and no-income people across the USA (later renamed SNAP) developed by the US FederalGovernment, which funds a variety of services (e.g. child care, education and job training, transportation,aid to children at risk of abuse and neglect) to help low-income families with children. They conducted amultisite retrospective cohort study with cross-sectional surveys at urban medical centres in five US statesand Washington DC between August 1998 and December 2001. Caregivers of 11,539 children wereinterviewed and the results showed that, for risk factors for fair/poor health, there was a significantinteraction between receiving food stamps and FI. Receiving food stamps attenuated (but did not eliminate)the association between FI and children’s fair/poor health. For children in households not receiving foodstamps, being food insecure increased the odds of fair/poor health by 2.1 times; after controlling for othercovariates and adding ‘receiving food stamps’ into the analyses, being food insecure increased the odds offair/poor health by 1.5 times. A similar pattern was seen for TANF benefits; however, the interaction wasnot significant. In the analysis of hospitalisation since birth, there was no significant interaction betweenreceiving food stamps or TANF benefits and FI.
A later study from the same authors116 aimed to determine whether child FI increased the risks posed byhousehold FI to child health and whether or not the USA food stamps programme could modify these effects.From August 1998 to June 2004, 17,158 caregivers of children aged ≤ 3 years were interviewed in six urbanmedical centres. It is unclear if there is overlap with the participants involved in the Cook et al.83 study. In linewith the results of the previous study by Cook et al.,83 participation in the food stamps programme reduced,but did not eliminate, the positive associations of both household FI and child FI with parents’ ratings ofchildren health as fair/poor. In subgroup analyses stratified by food stamps programme participation, aftercontrolling for potential confounders (i.e. child’s ethnicity, health insurance status, day-care attendance,mother born in the USA, caregiver’s age, employment status, marital status and education level), children infood-insecure households receiving food stamps programme benefits had lower odds of fair/poor health(OR 1.4, 95% CI 1.1 to 1.8) than children in food-insecure households not participating in the food stampsprogramme (OR 1.6, 95% CI 1.3 to 2.0). Similarly, children in food stamps programme participating householdsthat were classified as households with child FI had lower odds of fair/poor health (OR 1.7, 95% CI 1.3 to 2.2)than children in similar households not participating in the food stamps programme (OR 2.1, 95% CI 1.8 to 2.5).Participation in the food stamps programme reduced the odds of fair/poor health by 24% and 42% in food-insecure households and households with child FI, respectively.
The study by Canter et al.115 evaluated participation in a state-level double-value coupon programme withthe aim of assessing the potential impact of participation on children’s FI, physical activity, sedentarybehaviour, sleep, and fruit and vegetables consumption. Participants were recruited from several agenciesserving low-income households in a large metropolitan area in the USA. Participants were parents orcaregivers of children aged 5–10 years who were English speaking and received services through anorganisation supporting low-income families. Potential participants were approached during their usualservice usage (i.e. during SNAP transaction at a farmer’s market). Initially, 148 participants were recruitedand, of these, 109 were received services through a state-level double-value coupon programme. Thirty-nineparticipants were recruited while receiving services through other organisations providing services tolow-income families. Food-insecure children consumed significantly fewer servings of vegetables (p < 0.05).Physical activity significantly predicted fruit and vegetables intake (p < 0.01). However, double-value couponprogramme service usage did not have a significant impact on children’s fruit and vegetables consumption.
DOI: 10.3310/phr06130 PUBLIC HEALTH RESEARCH 2018 VOL. 6 NO. 13
© Queen’s Printer and Controller of HMSO 2018. This work was produced by Aceves-Martins et al. under the terms of a commissioning contract issued by the Secretary of Statefor Health and Social Care. This issue may be freely reproduced for the purposes of private research and study and extracts (or indeed, the full report) may be included inprofessional journals provided that suitable acknowledgement is made and the reproduction is not associated with any form of advertising. Applications for commercialreproduction should be addressed to: NIHR Journals Library, National Institute for Health Research, Evaluation, Trials and Studies Coordinating Centre, Alpha House, University ofSouthampton Science Park, Southampton SO16 7NS, UK.
157

The study by Dunifon and Kowaleski-Jones26 examined child- and family-specific factors that could predictFI and participation in the US NSLP, as well as the effects on children of FI and of participating in the NSLP.The NLSP is a federally sponsored nutrition programme that aims to provide nutritious foods to school-aged children at no, or reduced, cost. Families are eligible for free NSLP lunches or reduced-price lunchesaccording to their income. The authors used data from ≈3500 children aged 6–12 years to examine howFI and participation in the NLSP could affect children’s development. Participating in the NSLP was foundto be associated with increased externalising behaviour (p < 0.05), an 82% increase in the odds of havinga health limitation (p < 0.05) and lower maths scores (β 1.9, SE 0.8; p < 0.05). An increase in FI wasassociated with decreased level of positive behaviours and increased odds of health limitations. Theauthors concluded that participation in the NSLP was detrimental to children and explained that omittedvariables might have biased the association between NSLP participation and children’s outcomes. Inparticular, children participating in the NSLP differed in ‘unmeasured’ ways from those not participating,and these unmeasured variables might be associated with the observed negative outcomes. For thisreason, the authors conducted analyses comparing the outcomes of siblings within the same family (one ofwhom participated in the NSLP and one of whom did not). In these analyses, participation in the NSLP wasnot a significant predictor of any of the child outcomes, suggesting that the initial full sample results wereprobably due to unmeasured family-specific factors that biased the association between NSLP participationand child outcomes, particularly when predicting children’s test scores and health limitations. Overall, FIwas associated with children’s health and behaviour and participation in the NSLP did not predict improvedoutcomes for children. FI was significantly predicted by family income, number of siblings and foodstamps receipts.
Ecker and Sifers118 evaluated the US ‘BackPack Food Program’, which distributes easy-to-prepare foodin children’s backpacks every Friday or on the last day of school before a long weekend. The food packscontained child-friendly, single-serving, non-perishable items for breakfast, lunch and a snack each day.Three schools with the highest percentage of students receiving free and reduced-price lunches in theMidwest of the USA were included in the study. The proportion of children eligible for free or reduced-price meals in the three schools were 43%, 47% and 46%, respectively. The evaluation included directobservation of students in the classroom (n = 52), student hunger surveys (n = 82) and satisfaction surveysconducted with students (n = 192), parents (n = 138) and teachers (n = 82). One baseline observation andthree follow-up observations were collected. Results indicate that there was not a significant increase instudents’ on-task behaviour (p = 0.19) or a significant decrease in students’ self-reported hunger levels(p = 0.54). The satisfaction surveys showed that nearly all (97%) of the children reported looking forwardto the food and 60% reported sharing the food with other children in the home. Almost all parents (98%)reported that the programme benefited their family and that the programme had made a difference tothe well-being of their child. More than half of the adults (53%) indicated that it was difficult to provideenough food for everyone in the home, and 14% said that they or another adult in the home would havehad to skip a meal without the programme. Teachers reported improvements in students’ energy levels,emotional well-being and behaviour.
Gordon et al.119 piloted the Summer Electronic Benefit Transfer for Children (SEBTC), a programmecreated by the Food and Nutrition Service of the USDA to provide food benefits during the summer tohouseholds with eligible school-aged children. Low-income households with children eligible for free orreduced-price meals received US$60 benefits per school-aged child per summer month. Benefits weredelivered through an electronic benefit transfers cards that could be used to purchase food via existingprogrammes, such as SNAP or WIC. Approximately 67,000 children from around 42,000 households wereinvolved in the SEBTC. Initial household interviews provided a baseline for household SES, demographiccharacteristics and FS status during the school year. Interviews (which took place 30 days after SEBTCbenefits started) allowed the research team to measure effects of SEBTC on FS and children’s foodconsumption. Around 60% of assessed households received SNAP benefits and 22% received WICbenefits at baseline. The SEBTC programme improved children’s FS substantially for both SNAP and WIChouseholds. Average rates of FI were 46.6% for the no-benefit group and 38.8% for the benefit group inSNAP-households (p < 0.001), and 41.9% for the no-benefit group and 32.8% for the benefit group in
APPENDIX 8
NIHR Journals Library www.journalslibrary.nihr.ac.uk
158

WIC-households (p < 0.001). Despite lower levels of SEBTC participation and redemptions in WIChouseholds than in SNAP households, the impact of SEBTC on very low child FS was not significantlydifferent among SNAP and WIC households. In general, the SEBTC programme significantly improvedchildren’s eating behaviours in the direction of healthier eating with increased consumption of fruits andvegetables, whole grains and dairy products and reduced consumption of sugar-sweetened beverages(p < 0.001), with the exception of sugar-sweetened beverages in SNAP households.
Klerman et al.120 implemented and evaluated the SEBTC programme in 16 US sites between 2011 and2013. Benefit amounts, participating sites, details of the intervention and household sample size variedacross geographical regions. In 2011 and 2012, households were randomised either to an SEBTC benefitgroup (US$60 per school-aged child per month) or to a zero-benefit control group. In 2013, to test thedifferential impact of benefits, all randomised households were issued some SEBTC benefits (either US$60or US$30 per school-aged child per month), with no zero-benefit control group. Overall, across all years,households in the US$60 group redeemed 82% of benefits and those in the US$30 group redeemed74% of benefits. A random sample of nearly 50,000 households was selected to be part of the impactevaluation. These households were interviewed in the spring before the end of the school year and again inthe summer. Results showed that a US$60 SEBTC benefit per eligible child per month cut child very low FSby nearly one-third (p < 0.01) and reduced FI by approximately one-fifth (p < 0.01). Prevalence of child FIin the absence of SEBTC was 43.0% and SEBTC reduced the prevalence to 35.7% (p < 0.01). A US$30SEBTC benefit per child improved FS (p < 0.01) but generally had a smaller impact than the US$60 benefit(p < 0.01). After adjusting the analyses for household characteristics, the authors reported significantvariations in the impact of the US$60 monthly benefits compared with no benefits. For instance, reductionsin child very low FS in the summer were larger for those who were less food secure at baseline. Householdsthat were child food insecure in the spring also experienced greater reductions in the summer. In summer,impacts on very low FS and FI were larger for households with three or more children and with anadolescent at home. The authors considered these moderators as proxy measures for need. Reductions ofchild FI during the summer were also larger for households receiving SNAP in the spring and for householdsheaded by an African American adult.
Khan et al.98 assessed FI and the relationship between FI and participation in school breakfast and lunchprogrammes in 373 school children aged 10–14 years in Vermont, USA. Approximately 40% of thechildren were eligible for free or reduced-price meals and free breakfast was available to all school children.Information on the breakfast provision or numbers partaking was not reported. The majority of childrenwere classified as food secure (79.6%), 15.8% were classified as food insecure without hunger and 4.6%were classified as food insecure with hunger. A statistically significant relationship between FS and eatingbreakfast at home was found. Children who were food insecure (with or without hunger) were less likelyto eat breakfast at home than children who were food secure (67.1% vs. 81.4%; p = 0.007). No differencewas found between eating school breakfast or eating school lunch, as the majority of food-secure andfood-insecure children ate lunch at school (91.5% vs. 93.4%, respectively). Furthermore, of the food-insecurechildren, only three did not eat breakfast at school (two of these did eat breakfast at home).
Kleinman et al.117 assessed whether or not nutrient intake and academic and psychosocial functioningimproved after the start of a US UFSB programme in the Boston Public Schools. Information was collectedfrom 97 inner-city students in fourth to sixth grades prior to the start of the programme and again after6 months. The results indicate that 19% of the students had improved their nutrient intake, 64% wereunchanged and 18% were at increased nutritional risk. Children whose nutritional status improved recordedsignificantly larger increases in school breakfast participation than children whose nutritional status stayedthe same or worsened (p < 0.001). Children who improved their nutritional intake reported a significantdecrease in symptoms of hunger compared with children whose nutritional status remained the same.Children who reported worsening their nutritional status had an increase in symptoms of hunger (p < 0.001).Furthermore, those who improved their nutritional intake showed significant improvements in functioningaccording to the Paediatric Symptom Checklist scores, compared with children whose nutritional statusremained the same, or children whose nutritional intake category worsened (p < 0.01). Only changes in
DOI: 10.3310/phr06130 PUBLIC HEALTH RESEARCH 2018 VOL. 6 NO. 13
© Queen’s Printer and Controller of HMSO 2018. This work was produced by Aceves-Martins et al. under the terms of a commissioning contract issued by the Secretary of Statefor Health and Social Care. This issue may be freely reproduced for the purposes of private research and study and extracts (or indeed, the full report) may be included inprofessional journals provided that suitable acknowledgement is made and the reproduction is not associated with any form of advertising. Applications for commercialreproduction should be addressed to: NIHR Journals Library, National Institute for Health Research, Evaluation, Trials and Studies Coordinating Centre, Alpha House, University ofSouthampton Science Park, Southampton SO16 7NS, UK.
159

maths grades were found to be significantly improved (p < 0.05). Children who improved their nutritionalintake significantly reduced the number of days on which they were absent from school (mean –4.4 days)compared with children whose nutritional intake did not change (mean –1.7 days) or children whosenutritional intake worsened (mean 3.0 days; p < 0.01). There was no significant decrease in tardiness amongchildren with increased breakfast participation.
Korenman et al.121 involved a sample of 4-year-old children drawn from the US ECLS-B to obtain estimates ofassociations between Child and Adult Care Food Program (CACFP) participation and children’s foodconsumption (e.g. milk, fruit, vegetables, fast food and sweets), children’s overweight/underweight statusand family FI. The CACFP reimburses child care providers for meals and snacks served to children in their carethrough participating preschools, day care homes, after-school programmes and homeless shelters, accordingto a child’s family income. Results (unadjusted analyses) indicated that CACFP participants (n = 2200) andtheir families were much more likely than non-participants were (n = 1850) to experience FI. Children werefood insecure in 20% of CACFP households versus 4% of non-participant households. In addition, CACFPparticipants were more likely to report the use of food stamps, TANF, SNAP, WIC or Head Start. CACFPparticipants were less likely than non-participants to limit consumption of sodas and fast food; nevertheless,they were more likely to consume the recommended number of servings of milk, juice, fruit or vegetables,and more likely to limit consumption of sweet snacks. CACFP participants were also more likely than non-participants to be overweight or at risk of overweight (p < 0.05). After adjusting the results for potentialconfounders, low-income children participating in CACFP were 1.4 times more likely to consume two ormore cups of milk per day (OR 1.4, 95% CI 1.0 to 1.9; p < 0.05) and 1.6 times more likely to consume twoor more servings of vegetables per day (OR 1.6, 95% CI 1.6 to 2.1; p < 0.05) than non-participants.
Nalty et al.50 assessed mothers’ and children’s (aged 6–11 years) perspectives and experiences of child FI,including the effects of school-based and summertime nutrition programmes. Participants (48 mother–childdyads) were residents of rural areas along the Texas–Mexico border, which are communities that may lacksanitary conditions, water/drain systems and paved roads, often consist of self-build housing and areinhabited predominantly by people of Hispanic immigrant population. Data were collected through surveysduring two waves between July 2010 and March 2011. Participation in school-based nutrition programmes,such as SNAP, WIC, NSLP, School Breakfast Program and Summer Food Service Program (SFSP), wasrecorded. Child FI was more prevalent in the summer than during the school year (62.5% vs. 18.8%;p = 0.02). With regard to mothers’ perspectives, there was no change in child FS from summer to schoolmonths (58.3% vs. 47.9%; p = 0.46). Children and mothers reported different rates of FI during thesummer and school year, but these were not significantly different. After adjustment for the significanteffects of school-based nutrition programmes and single parenthood, child FI improved significantly fromsummer to school months with protection during school offered by the school breakfast programme andNSLP as children who took part in these programmes were 70% less likely to report FI (OR 0.3, 95% CI 0.1to 0.5; p < 0.001). However, SFSP and SNAP did not reduce the burden of FI during the summer (p > 0.05).
Barroso et al.78 performed secondary analyses of data collected from 374 children aged 12–24 months aspart of a longitudinal study that assessed the effects of a public health nursing intervention on optimalchildhood growth for low-income, minority children from Hispanic mothers who were enrolled in theUS WIC programme. Participants received nutrition education every 6 months. After adjusting results forpotential confounders, receiving SNAP was positively associated with child weight status. Children whosemothers reported ever having received SNAP were 2.01 times more likely to be overweight than childrenwhose mothers did not report ever having received SNAP (OR 2, 95% CI 1.0 to 3.9; p < 0.05).
Kohn et al.74 used data from the US NHANES 2007–8 to assess whether or not participation in foodassistance programmes was a risk factor for overweight and obesity in children aged 4–17 years andwhether FI was a moderator of this association. School meal participation was defined as the child eatingfree or reduced-price school breakfast and/or school lunch at least once a week during the school year.Characteristics differed significantly by food assistance participation including age, non-white ethnicity,poverty levels and FI. Prevalence of overweight and obesity were not significantly different for children
APPENDIX 8
NIHR Journals Library www.journalslibrary.nihr.ac.uk
160

participating in food programmes compared with non-participating children. Among children participatingin one food programme, school meals had the highest single-programme participation. Among low-income,food-insecure children, food assistance participation was not associated with BMI scores, high waistcircumference or weight status for any specification of food assistance (adjusted analyses). However, analysesby sex showed that low-income, food secure girls participating in food assistance programmes (SNAP or WIC)other than school meals alone had higher BMI score (β 0.4, 95% CI 0.1 to 0.7) and greater risk of high waistcircumference (OR 2.2, 95% CI 1.0 to 4.6). BMI scores remained elevated (β 0.3, 95% CI 0.1 to 0.6) and riskof high waist circumference approached significance (OR 2.2; p= 0.05) when analyses were corrected fordifferences in potential selection bias between programmes. Furthermore, among food secure boys, any foodassistance participation was positively associated with all measures of weight status in analyses with directadjustments: BMI scores (β 0.4, 95% CI 0.1 to 0.7), high waist circumference (OR 2.5, 95% CI 1.2 to 5.1)and overweight or obesity (vs. normal weight) (OR 1.7, 95% CI 1.1 to 2.8).
Yu et al.71 examined how the effects of household characteristics, food stamps programme participation(SNAP), informal food supports (e.g. informal/community food supports, such as food pantries, Meals onWheels and soup kitchens), household FS and child FS, differ between African American and Caucasianhouseholds. They used data from 3799 low-income participants (710 African American households and3089 Caucasian households) who completed the Current Population Survey and the 2003 FS survey.African American households reported more participation in the food stamps programme (47.0%vs. 28.1%; p < 0.001) and more informal food supports (21.8% vs. 17.7%, respectively; p < 0.05) thanCaucasian households. On the other hand, Caucasian households reported higher levels of household FS(p = 0.003). Among Caucasian households, food stamps programme participation was positively associatedwith female headship of a household and number of children, and negatively associated with age, hours ofwork and household income. Among African American households, food stamps programme participationwas positively associated with female headship of a household, and negatively associated with the age ofthe head of a household, level of education held by the head of a household, hours of work and householdincome. In both ethnic groups, child FS was positively related to food stamp programme participationand informal food supports. Informal food supports positively predicted child FS in both ethnic groups(p < 0.001), but participation in the food stamps programme predicted greater child FS (p < 0.001) amongCaucasian households but not among African American households.
Mhurchu et al.122 conducted a 1-year stepped-wedge, cluster RCT in 14 low-SES schools in New Zealand toinvestigate the effects of a free school breakfast programme on children’s school attendance. Participatingschools (clusters) crossed over from control to intervention phase in different terms throughout the schoolyear, according to four specified different sequences. Eligible schools were low-income schools that didnot have any ongoing breakfast programme, and eligible participants were children aged 5–13 years whodid not have food allergies. The intervention was a free daily school breakfast programme, provided eitherby the national Red Cross Breakfast in Schools programme or by the private sector. A total of 424 childrenwere enrolled in the trial, with an average of 30 children per school. Compared with the control phase,a significant decrease in children’s self-reported short-term hunger was observed during the interventionphase (p < 0.001). There were no statistically significant effects of the free school breakfast programmeon children’s school attendance. The odds of children achieving an attendance rate of < 95% was 0.76(95% CI 0.6 to 1.0) during the intervention phase and OR 0.9 (95% CI 0.7 to 1.3) during the controlphase, giving an overall OR of 0.8 (95% CI 0.6 to 1.1; p = 0.19). There were no significant effects of theschool breakfast programme on children’s academic outcomes.
DOI: 10.3310/phr06130 PUBLIC HEALTH RESEARCH 2018 VOL. 6 NO. 13
© Queen’s Printer and Controller of HMSO 2018. This work was produced by Aceves-Martins et al. under the terms of a commissioning contract issued by the Secretary of Statefor Health and Social Care. This issue may be freely reproduced for the purposes of private research and study and extracts (or indeed, the full report) may be included inprofessional journals provided that suitable acknowledgement is made and the reproduction is not associated with any form of advertising. Applications for commercialreproduction should be addressed to: NIHR Journals Library, National Institute for Health Research, Evaluation, Trials and Studies Coordinating Centre, Alpha House, University ofSouthampton Science Park, Southampton SO16 7NS, UK.
161


Part of the NIHR Journals Library www.journalslibrary.nihr.ac.uk
Published by the NIHR Journals Library
This report presents independent research funded by the National Institute for Health Research (NIHR). The views expressed are those of the author(s) and not necessarily those of the NHS, the NIHR or the Department of Health
EMEHS&DRHTAPGfARPHR