Embed Size (px)
Citation preview
Scottish Charity Number: SC013683
ACCOUNTS2012

2012 Accounts
Scottish Charity Number SC013683
1
CONTENTS Page Financial Highlights 2-3 Principal‟s Report 4 Operating and Financial Review 5-9 Statement of Corporate Governance and Internal Control 10-12 Statement of Primary Responsibilities of the Court 13 Membership of Court and Key Committees 14 Attendance at University Court and Committee Meetings 15 Independent Auditor‟s Report 16-17 Consolidated Income and Expenditure Account 18 Statement of Consolidated Total Recognised Gains and Losses 19 Balance Sheets 20-21 Consolidated Cash Flow Statement 22 Statement of Principal Accounting Policies and Estimation Techniques 23-27 Notes to the Accounts 28-55 Appendix to the Financial Statements 1 (University of Aberdeen Development Trust Summary) - Unaudited
56
Appendix to the Financial Statements 2 (5 Year Summary) - Unaudited 57 Appendix to the Financial Statements 3 (5 Year Key Performance Indicators) - Unaudited 58
2
Financial Highlights
2012 2011 Change
£000 £000 %
Consolidated Income and Expenditure Account
Income
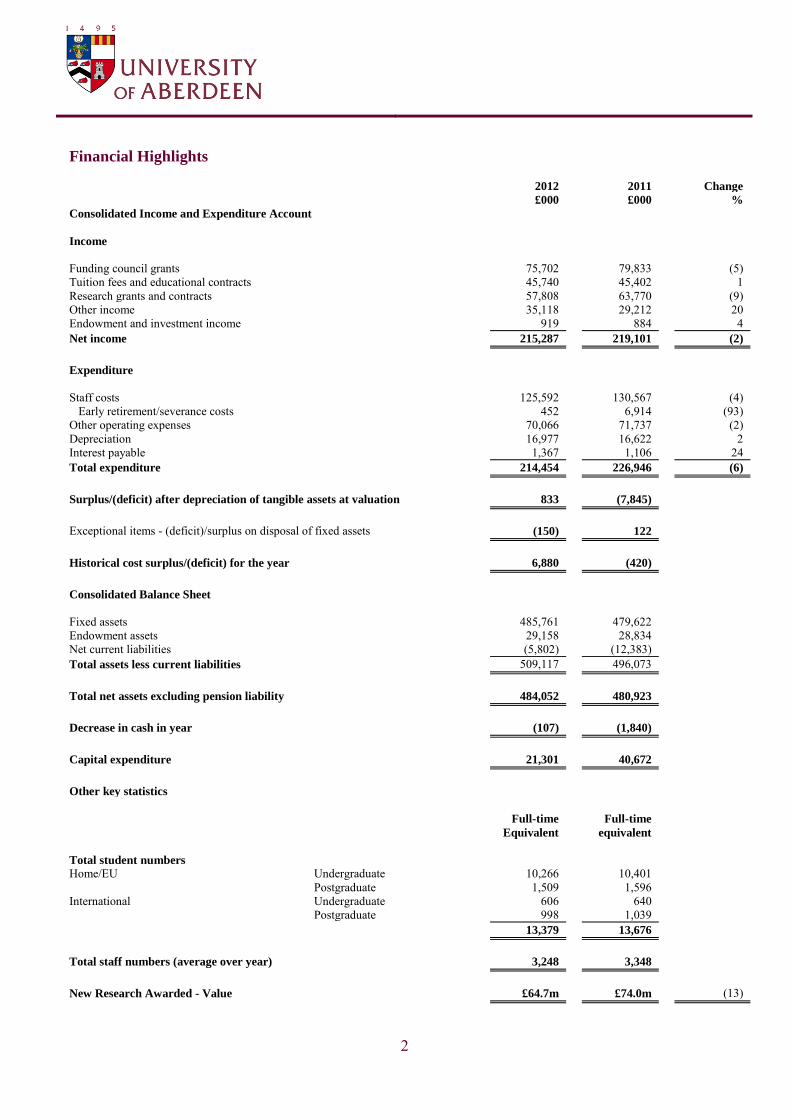
Funding council grants 75,702 79,833 (5) Tuition fees and educational contracts 45,740 45,402 1 Research grants and contracts 57,808 63,770 (9) Other income 35,118 29,212 20 Endowment and investment income 919 884 4 Net income 215,287 219,101 (2)
Expenditure
Staff costs 125,592 130,567 (4) Early retirement/severance costs 452 6,914 (93) Other operating expenses 70,066 71,737 (2) Depreciation 16,977 16,622 2 Interest payable 1,367 1,106 24 Total expenditure 214,454 226,946 (6)
Surplus/(deficit) after depreciation of tangible assets at valuation 833 (7,845)
Exceptional items - (deficit)/surplus on disposal of fixed assets (150) 122
Historical cost surplus/(deficit) for the year 6,880 (420)
Consolidated Balance Sheet
Fixed assets 485,761 479,622 Endowment assets 29,158 28,834 Net current liabilities (5,802) (12,383) Total assets less current liabilities 509,117 496,073
Total net assets excluding pension liability 484,052 480,923
Decrease in cash in year (107) (1,840) Capital expenditure 21,301 40,672 Other key statistics Full-time Full-time Equivalent equivalent Total student numbers Home/EU Undergraduate 10,266 10,401
Postgraduate 1,509 1,596 International Undergraduate 606 640
Postgraduate 998 1,039 13,379 13,676
Total staff numbers (average over year) 3,248 3,348
New Research Awarded - Value £64.7m £74.0m (13)
3
Financial Highlights - continued
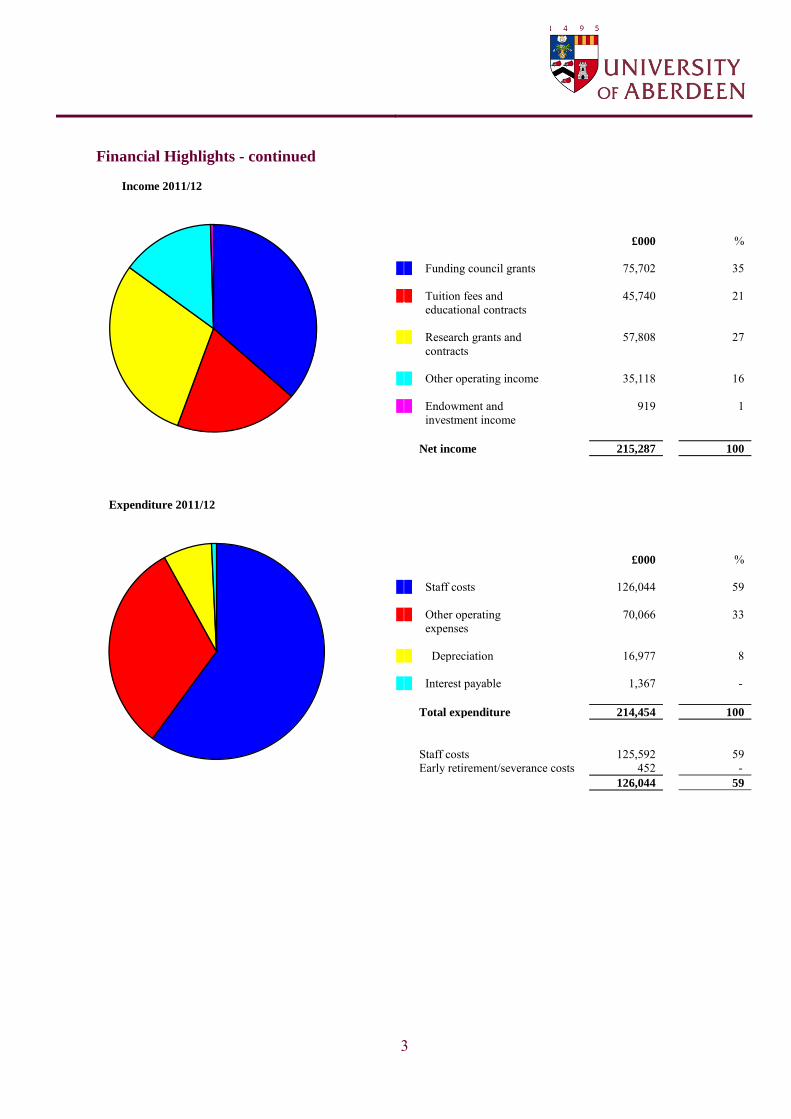
Income 2011/12 £000 % Funding council grants 75,702 35 Tuition fees and 45,740 21 educational contracts Research grants and 57,808 27 contracts Other operating income 35,118 16 Endowment and 919 1 investment income Net income 215,287 100
Expenditure 2011/12 £000 % Staff costs 126,044 59 Other operating 70,066 33 expenses Depreciation 16,977 8 Interest payable 1,367 - Total expenditure 214,454 100
Staff costs 125,592 59 Early retirement/severance costs 452 - 126,044 59
4
Principal’s Report
Year ended 31 July 2012
I am very pleased to introduce this positive set of financial results for the University in 2012. The past year has continued to be a challenging one for the higher education sector in Scotland and in the UK. Pressure on public spending at Holyrood and Westminster has resulted in the University‟s recurrent funding council grants for teaching and research being reduced by 5.6%. Growth of key other income streams has been made more difficult due to increasing competition internationally for the recruitment of fee paying overseas students. However, despite these continuing difficult external factors the prudent financial approach we have taken during this financial year and last have ensured that the University has achieved a historical cost surplus of £6.9m in line with our financial strategy. This continuing stable financial base will be crucial given that we expect the external financial environment to continue to be difficult for the immediate future. The UK Government‟s policy on immigration will continue to make the recruitment of international students more difficult but the University is confident that the new Internationalisation Strategy we are implementing and associated supporting investment will help us to grow our international population in line with the targets within our Strategic Plan. Closer to home, the market for rest of UK students has been even more volatile than we expected and we expect that trend to intensify in the coming year when the „cap‟ on the number of students with A-Level‟s at ABB that English institutions can recruit is lifted. While these are undoubtedly areas where we are focusing on growth, it is important to also acknowledge that the University is more popular than ever with students from Scotland and the EU, who represent the majority of our funded population. Whatever the nationality of our students, the University will continue to focus on providing them with a consistently world class student experience. Our strong performance in the National Student Survey continues to see us ranked amongst the top twenty universities in the UK and while this is a welcome endorsement of the quality of an Aberdeen education we are not complacent. The University has in recent years invested significantly in providing world class facilities for our students and staff. New facilities such as the Suttie Centre in Teaching and Learning in Healthcare, the Aberdeen Sports Village and the Sir Duncan Rice Library which we had the great pleasure of being opened by HM The Queen in September 2012, represent major investments in facilities that are best in class. The University will maintain that level of investment in its facilities in the coming years to make sure that we are as attractive as we possibly can be, not only to students, but to the high quality staff who are even more crucial to the student experience we offer. A particular highlight for me of the past year has been the launch of our recruitment campaign to recruit 100 scholars to Aberdeen to help us build further upon our intellectual strength as a research intensive University. This has been hugely successful and it is both exciting and a signal of the strength of the University that so many new talented academics from around the world want to join our academic community. The University is equally committed to taking the strengths of our academic community to the benefit of the wider community. In this respect, the past year has been a hugely significant one as we hosted the British Science Festival an event that drew visitors from around the world and which through the support of our staff and partner organisations from across the North-East of Scotland was widely lauded as a great success for the region. This is just one example of how the University‟s strength as a global university is benefitting our immediate City and Region. I am grateful to all our staff and supporters for the contribution that they have made and continue to make to the success of the University. Professor Ian Diamond FBA FRSE AcSS
Principal and Vice-Chancellor
5
Operating and Financial Review
Year ended 31 July 2012 Scope of the Financial Statements
The Financial Statements for the year ended 31 July 2012, which have been approved by the Court, represent the consolidated results of the University and its subsidiaries, together “the Group”. Operating Review
Our financial reporting will highlight commitment to supporting the achievement of our ambitions through investing in the student experience, quality of our staff, our capital programme to create world-class campuses, the contribution made by securing competitively won research funding, and the return on our investment in cultivating philanthropic support. Financial Highlights
The University‟s results for the year ended 31 July 2012 are summarised on pages 2 and 3 and key performance indicators are on page 58. The University achieved a historical cost surplus of £6.9m. Excluding exceptional loss on investment disposals (£0.1m) this represents a 3.3% return on income, which is in line with the financial strategy. The significant financial movements for 2011/12 were as follows: the University‟s recurrent grant for teaching and research decreased £4.1m (5.6%) compared to the previous year. Research
decreased by £0.1m (0.5%) and teaching decreased by £4.0m (8.2%) mainly due to the reduction in teaching grant from Scottish Funding Council;
income from tuition fees and support grants increased by £0.3m (0.7%), with overseas fees increasing by £0.6m (3.4%); income from research grants and contracts decreased by £6.0m (9.4%), however indirect cost recovery increased by £1.5m (15.5%)
and is now at 23.7%; expenditure on early retirement amounted to £0.5m compared to £6.9m in the previous year; and staff costs, excluding severance costs (£0.5m), decreased by £5.0m (3.8%) compared to the previous year. This was mainly due to
the decrease in research grants and contracts by £4.0m (13.8%) compared to the previous year. Overall staff costs are now 59% of total expenditure.
Capital Investment
During the year capital expenditure on buildings, plant and equipment totalled £21.3m. Significant items of note were the design of the Rowett Institute of Nutrition and Health (£1.2m), the phase 2 refurbishment of the Fraser Noble Building (£2.4m), the completion of the new Library (£4.6m), 50/52 College Bounds (£1.3m), and the Energy Centre (£2.3m). Grants totalling £7.6m (Development Trust £2.5m) were received to fund capital expenditure on buildings and equipment.
Cash Flow
The Consolidated Cash Flow Statement shows net cash inflow from Operating Activities of £7.5m. The movement in cash after taking account of capital expenditure, financial investment and financing was an increase of £1.7m on the previous year.
Net Current Liabilities
At the 31 July 2012 the University had net current liabilities of £5.8m (Entity £8.9m), previous year £12.4m (Entity £20.0m).This is mainly due to the improvement of current investments and cash and the drawdown from the Barclays Bank plc loan facility. The University Court are satisfied that this position will not impact the University's ability to meet its liabilities and obligations as they fall due over the next 12 months.
Investment Performance
The University has discretionary fund management agreements with Fund Managers and performance is routinely monitored against an agreed benchmark. During the year the market value of endowment investments rose by 1.0% from £28.8m to £29.1m, compared with the previous year‟s increase of 9.3%. The upturn in the stock market has increased the University endowments since July 2012, showing an unrealised increase of £0.8m for the three months to 31 October 2012.
6
Operating and Financial Review - continued
Year ended 31 July 2012
Pensions
The University‟s staff are eligible to join one of two defined benefit schemes – the University Superannuation Scheme (USS) for academic, senior management and support staff, and the University of Aberdeen Superannuation and Life Assurance Scheme (UASLAS) for support staff. The USS scheme implemented a range of changes from October 2011 that address the long-term sustainability of the scheme. The latest triennial valuation of 31 March 2011 produced a deficit of £2.9bn. It should be noted this deficit will not be reported in our balance sheet under FRS 17 as USS is not able to calculate an individual employer‟s share of the overall deficit. The scheme for support staff (UASLAS) implemented changes to its benefit structure and moved to Career Average (CARE) from the 1st August 2011. The FRS 17 deficit of the scheme increased from £22.7m to £33.3m at the 31st July 2012. This is mainly due to falling gilt yields during the last 12 months. The next triennial valuation is July 2013, when the Trustees will review the deficit recovery plan. Long-Term Borrowing
In 2006-07 the University entered into a loan facility of up to £40m with Barclays Bank plc to fund the 10 year capital programme. During April 2007 the University utilised £4.6m of the £40m facility and entered into a 25 year fixed rate unsecured loan which will be repaid as follows: one quarter in 2021, one quarter in 2026 with the remainder in 2031. On 1 August 2011 the University drew down £10m, fixed for 3 years to fund timing differences in relation to capital spend. Due to a combination of additional funding success in fundraising and slippage of some capital projects it was not necessary to drawdown from the remaining facility of £25.4m during 2011-12. During September 2012 the University further utilised the Barclays Bank plc loan facility for £15m to fund our capital programme over the next 24 years. This loan will be repaid as follows: £3.75m in September 2021, £3.75m in September 2026, £3.75m in September 2031 and final payment of £3.75m in September 2036. Financial Strategy
The University‟s financial strategy is designed to maintain financial flexibility at all times. The main aims being: to achieve a historical cost surplus of 3% of total income to generate sufficient cash reserves to fund investment; evaluate strategic opportunities and identify and quantify future resource needs to enable the University to respond to funding
initiatives, opportunities and general fundraising which may impact on long-term financing; prioritise, manage and monitor our financial base, taking account of the financial climate and the constraints it may place on our
financial stability; retain adequate working capital through cash balances or access to short term loan facility; and promote income generation and diversity of income sources.
These aims are considered in the development and implementation of the treasury policy, its normal planning, budgeting and medium-term forecasting cycle, and in the planning and execution of its capital building programme. Treasury Management
The financing and liquidity of the University and its exposure to financial risk are managed through the central treasury function of the Finance Section. The financial strategy, discussed above, sets out the minimum liquidity levels in order to ensure that sufficient financial flexibility is retained. Each year, as part of its normal planning processes, rolling five year financial forecasts and ten year cash flow plans are prepared. The treasury policy limits and monitors the level of funds that are placed in fixed rate deposits. Policies, incorporating clearly defined controls and reporting requirements, are in place to monitor credit and market risk, as well as to maintain the operating financial flexibility of the University.
Risk and Uncertainties
Sound risk management is an essential discipline for running the University efficiently and pursuing our strategy successfully. The University has a risk management process, monitored by the Risk Management Committee which reports to the Operating Board to ensure a consistent and coherent approach. This is detailed in the Corporate Governance Statement on page 10.
7
Operating and Financial Review - continued
Year ended 31 July 2012 Risk and Uncertainties - continued
In this section, we describe some of the principal risks that the Court believes could materially affect the University, its reputation, revenues, liquidity and capital resources. The nature of risk is such that other risks may arise, or risks not currently considered material may become so in future. The University Court recognises the following key institutional risks as particularly deserving attention. The delivery of our strategy is crucially reliant on maintaining our income from all sources at least at the same rate as our UK and International competition. To mitigate this risk, there are university-wide activities to grow income from students, funders and customers. Given the rising costs of the University‟s defined benefits pension schemes and higher inflation, the University is taking mitigating actions to influence negotiations regarding future pay and pension‟s costs, and maintaining effective relations with local trade unions. From 1 August 2011 UASLAS pension fund changed from a final salary scheme to a Career Average Revalued Earnings (CARE) scheme. From 1 October 2011 current members of the USS pay an extra 1.5% employee contribution and all new entrants have moved to USS CARE scheme. With the changes to the pension schemes and low salary increases, our major cost pressure is presently well controlled. The University has a large portfolio of buildings and facilities which are crucial to the delivery of the strategic plan. It is a major challenge to invest sufficient funds in the development and maintenance of these assets to deliver facilities that are attractive to students and funders. Our 10 year capital plan continues investment in the infrastructure whilst retaining flexibility to cope with any changes in the funding environment. In addition, capital building developments are prioritising facilities, such as the main Library, sports facilities and residences refurbishment which will improve the student experience and further mitigate this risk. There are a number of other risks around the areas of staff recruitment and retention, financial sustainability and major change projects, which though major risks, are currently assessed as not being likely, due to longstanding and effective risk mitigation measures. The strategic plan sets a target to increase our undergraduate and postgraduate international students by the 2014. There are a number of issues in the external environment which presents serious challenges to the recruitment of full time international students, not simply for the University of Aberdeen but for every UK HEI, namely:
Immigration: There are fears across the sector that the new visa rules, in particular the removal of the post study work element of the tier 4 visa will have a major impact on international student recruitment. There is some evidence that this is the case, with a fall in the number of students from India in 2012/13. To address this issue a major review of our postgraduate portfolio has been carried out, in order to ensure that we can compete in attracting international students. Recommendations from the review are currently being implemented.
RUK Student: Following the decision by the Scottish Government to fund the teaching of RUK students through the charging of tuition fees, in 2012/13 the University introduced increased fees for these students. We have not achieved our RUK target for 2012/13, although this is consistent with falling entrant numbers across the sector. We are reviewing our approach to bursary and scholarship arrangements, to help mitigate this in future years, but with changes to the cap on the student population in England in 2013/14, this remains an area of uncertainty.
Current Economic climate and the return of investment re cost of study: It is difficult to quantify but the current economic climate is thought to have a potential impact on recruitment and in addition, students are questioning the return on investment they will achieve following completion of their degree.
These major risks are addressed by new initiatives to diversify and grow income whilst containing costs and carrying out process efficiencies to streamline activity and effective risk mitigation measures. Creditor Payment Policy & Practice
The University‟s general conditions of purchase are made available to suppliers as an inherent part of purchase contracts at the outset of a transaction and are adhered to. There is a consistent policy that invoices will be paid in accordance with the general conditions of purchase and there are no alterations to payment terms without prior agreement. Unless special terms apply, payment is made within 30 days of receipt of a valid invoice or after acceptance of the goods or services, whichever is the later. The University complies with the requirements of the CBI Prompt Payment Code. At 31 July 2012 the University‟s trade creditors represented 26 days (2011 – 24 days).
8
Operating and Financial Review - continued
Year ended 31 July 2012
Equality and Diversity Policy
The University is committed to a comprehensive policy on Equality and Diversity for all its staff and students. This policy aims to prevent discriminatory practices and seeks to create a culture where staff and students can reach their full potential. It is the University‟s
policy to select and treat staff and students on the basis of their merits only and irrespective of colour, race, nationality, national origins, disability, sexual orientation, religion or belief, family circumstances, political beliefs, gender, gender reassignment, trade union membership, age or any other unfair distinction The University is committed to providing a learning, working and social environment in which the rights and dignity of all its members are respected, and which is free from discrimination, prejudice, intimidation and all forms of harassment and bullying. This Equality and Diversity Policy will be monitored and reviewed by the University regularly and promoted throughout the University.
Corporate and Social Responsibility
The University is committed to the twin principles of sustainability and social responsibility in all that we do. We are actively engaged in scholarship and research into sustainable development and social responsibility and these areas feature prominently in our key research themes. The ongoing development of Curriculum Reform emphasises graduate attributes for the modern world, provides inter-disciplinary courses, and encourages students to pursue co-curriculum activities such as student volunteering. Operationally, these commitments are evident across campus and can be seen, for example, in the embedding of sustainability principles in construction projects such as The Sir Duncan Rice Library and Suttie Centre (both attaining BREEAM Excellent); the ever more efficient use of Information Technology; encouraging fair trade consumption; supporting the attainment of national emissions reduction targets through our carbon management plan; promoting a healthy working environment; and an ongoing commitment to cultural and public engagement events and programming. We continue to work to ensure that all staff and students understand the collective nature of our responsibility to act in accordance with these principles. Student Satisfaction
The University uses external benchmarks to monitor its performance in key areas, including performance in University League Tables, and the annual National Student Survey (NSS) of final year undergraduates, carried out by Ipsos-Mori on behalf of the UK higher education funding bodies. In 2012, the University also introduced its own Survey of non-final year undergraduates, carried out alongside the NSS. In the six years that the University has taken part in the NSS we have performed strongly in relation to the overall satisfaction of our students, with the percentage of students indicating that they are satisfied with the quality of their course ranging between 88% and 91%. These scores have placed us consistently in the top 20 institutions. The survey results are reported to the University Committee on Teaching & Learning and to Senate, and each College is asked to respond to the survey results in relation to the College-owned subject areas. This allows the Operating Board monitor and review action being taken to improve student satisfaction across all areas of the Survey, including those areas where we perform less well, such as in response to questions on assessment and feedback. Constitution, Governance and Regulation
The University was formed by Royal Charter on 10 February 1495 and is one of the four Scottish Ancients. The Courts of the Ancient Universities derive their status and powers from Acts of Parliament, Ordinances approved by the Privy Council and Resolutions of the Court. The Court is the executive governing body of the University and is responsible for mission and strategic direction, administrative arrangements, financial health, well-being of staff and students and, in association with the Senate, for establishing and maintaining high standards of academic conduct and probity. The University‟s corporate arrangements are described on pages 10 to 12 and members of the University Court during the financial year are listed on page 14. The University is an exempt charity by virtue of the Charities and Trustee Investment (Scotland) Act 2005, and is registered with the Office of the Scottish Charity Regulator under number SC013683. The University is regulated principally by the Scottish Funding Council under a Financial Memorandum. The University complies with conditions of the grant set out in the funding arrangements. The University‟s principal advisors are listed on page 55.
9
Operating and Financial Review - continued
Year ended 31 July 2012
Future Developments
In common with other organisations we face some challenges in the years ahead, most notably in terms of government funding, maintaining income from the rest of the UK (RUK) and overseas students, controlling pay awards, pension costs and an uncertain financial and investment situation. Our strong performance this year, coupled with the enthusiasm, motivation and ambition of our staff gives us the best base with which to address the challenges ahead. Through continued strong financial performance, coupled with our Investors in People programme, we will continue to attract and retain academic and support staff at the forefront of their fields who will want to develop their careers within the University of Aberdeen community. Going forward our strategic plan for 2011-2015 has six main targets to achieve:
to deliver a high-quality student experience, growing the population where there are opportunities to do so through the recruitment of students with outstanding potential
to improve our competitiveness as an international research-driven university, and be at the forefront of setting and delivering the research agenda, nationally and internationally
as well as encouraging blue sky investigator-led research, we will use our broad disciplinary base to focus on a small number of multidisciplinary themes in which Aberdeen is, or has the potential to be, a world leader or global partner of choice, and which fit with our institutional values and characteristics
to embed a culture of internationalisation across our activities and in so doing enhance our reputation as a global university continue to promote partnership working in all that we do and engage fully with our regional, national and international
partners, our stakeholders, and our alumni to have in place support and infrastructure that will support the achievement of our academic aspirations.
The Scottish Government‟s limit on the number of full-time undergraduate students from Scotland and the EU (outwith the UK) means that opportunities for growth in student numbers are limited to the Rest of the UK (RUK) and international students. In relation to RUK students, we need to maintain these numbers in order to ensure the diversity of the population; and generate tuition fee income to meet the reductions in SFC teaching grant, which has been adjusted to reflect the fact that the teaching of new RUK students is no longer funded by SFC. In introducing tuition fees for RUK students, the University decided that RUK students would pay no more than £27,000 for a four-year degree programme but that the rate per year is set at £9,000. In order to offer flexibility of choice to students, those who wish to take advantage of the breadth of study offered by a four-year degree will only pay for three years of study at a rate of £9,000, meaning that total fees for four-year degree at Aberdeen will be equivalent to those for a three-year degree in other parts of the UK. We will also continue to offer advanced entry options to RUK students who meet the entry requirements so that degrees can be completed in three years at a cost in-line with Universities south of the border with the same standing as Aberdeen. Conclusion
Overall, the University remains in a position of financial and academic strength. This has been achieved through the efforts of all the University‟s staff including academic, research, administrative and technical and by tight budgetary control in an environment where there is significant cost pressures or limited increases in relation to government funding. I would like to acknowledge the work of the Finance Director and her staff in managing the finances during the year and in the preparation of the Financial Statements.
Mr Brian Pack
Convener of the Operating Board
10
Statement of Corporate Governance and Internal Control The University of Aberdeen is committed to achieving the highest possible standards of corporate governance relevant to the higher education sector. This summary describes the manner in which the University has applied the principles set out in the UK Corporate
Governance Code (Revised June 2010) and the CUC Guide for Members of Higher Education Governing Bodies in the UK. Its purpose is to help the reader of the financial statements understand how the principles have been applied, and to set out the basis for the Court‟s
opinion that the University has, in so far as is appropriate and permissible under its constitutional basis, complied with the Code throughout the year ended 31 July 2012. The University Court of the University of Aberdeen is a body corporate with perpetual succession and a common seal. The University‟s
powers and framework of governance are set out in the Universities (Scotland) Acts 1858-1966 and by the Ordinances, made under these Acts. The Universities (Scotland) Acts define the powers of the University Court, the Senate and the General Council, each of which has clear functions and responsibilities within the governance and management of the University‟s business. The University Court is charged with the administration and management of the revenue and property of the University, and has the power to review any decision of the Senate on appeal. It is responsible for the University‟s system of internal control and for reviewing its effectiveness. The University Court has a majority of lay members including Assessors, elected by the General Council, by Aberdeen City and Aberdeenshire Councils, by the Chancellor and by the Rector, as well as co-opted members. Assessors are also elected by the Senate and there is provision for at least one student member. The Rector is elected by the student body and is the ordinary president of the Court. The Court recognises that the statutory position of the Rector as the ordinary president is not consistent with the description of the role of the Chair contained in the UK Corporate Governance Code and the CUC Guide for Members of Higher Education Governing Bodies in
the UK. However, the Court appoints a Senior Governor, who currently performs the role of Chairman and who represents the University at meetings of Chairmen of Governing Bodies and internally to act as the leading Governor in matters of governance and management. In accordance with the provisions of the Universities (Scotland) Acts and the Ordinances made by the Court, the total composition of the Court is 28. The Court is of the view that there is an ongoing process for identifying, evaluating and managing the University's significant risks up to the date of approval of the annual reports and accounts. This process has been formalised to accord with the internal control guidance for directors in the Corporate Code. It is designed to manage rather than eliminate the risk of failure to achieve business objectives and can only provide reasonable and not absolute assurance against material misstatement or financial loss. This process is regularly reviewed by the governing body and accords with the internal control guidance as applicable to the higher education sector. A Risk Management Committee, which is a sub-committee of the Operating Board, oversees the development and implementation of the University's risk management strategies, policies and procedures. The Court sets and approves annually the University‟ Risk Appetite,
and routinely reviews the Corporate Register of Strategic Risks. The Court has four meetings each year, but much of its detailed work is addressed in the first instance by Committees, in particular, the Operating Board, the Audit, the Risk Management, the Staffing & Development, the Governance and Nominations, and the Remuneration Committees. All these Committees are formally constituted with terms of reference. Where these Committees have delegated authority from the Court to take decisions on certain matters, major decisions are formally reported to the Court. Similarly, when the Court delegates power to the Principal with at least one other senior member of the Court to take decisions between meetings, such decisions are formally reported to the Court. The University maintains a Register of Interests of members of the Court and of members of senior management, which may be consulted by application to the University Secretary. In addition, individuals are asked to declare interests in relation to Court and Committee agenda business on a routine basis and any significant change to the external commitments of the Chair would be reported to the Governance and Nominations Committee and declared in this statement.
11
Statement of Corporate Governance and Internal Control - continued The Court has adopted a Statement of Primary Responsibilities and routinely undertakes a wide-ranging review of its effectiveness against the background of the UK Corporate Governance Code and CUC guidance, mentioned above. The Governance and Nominations Committee benchmarks University procedures against both of these best practice guides and has in the course of 2011/12 implemented several recommendations to address identified exceptions. These include an annual meeting of non-executive governors without the Chair present, a governors‟ appraisal process and the publication of terms and conditions of appointment. The Court has agreed that the role equivalent to that of a Senior Independent Director, as distinct to that of the Senior Governor, can be undertaken, if and when required, by either the Convenor of the Governance and Nominations Committee or the Convenor of the Operating Board. In the course of 2011/12, the Court has also considered and contributed to the Scottish Government‟s Review of Higher Education Governance in Scotland which is
ongoing.
The Principal, who is a member of the Court ex officio has responsibility for implementing the decisions of the Court, for initiating discussion and consultation on the University's future development and for ensuring that appropriate proposals are presented to the governing body, and, as the Designated Officer of the University under the terms of the Financial Memorandum between the University and the Scottish Funding Council, for ensuring that the Court takes cognisance of the terms of the Financial Memorandum in all its decision making.
The Secretary is the principal officer of the Court and is responsible for ensuring that the Court acts within its powers and follows proper procedures. He provides independent advice to Court members about their individual and collective responsibilities and how they should be discharged. The Senate, which consists of ex officio and elected academic staff and students, is responsible for the regulation and superintendence of teaching and student discipline and for promoting research. In respect of its strategic and development responsibilities, the Court receives recommendations and advice from the Operating Board, a committee of the Court. This Committee‟s composition includes four lay members, appointed by the Court from amongst its members.
The Operating Board inter alia recommends to the Court the University‟s annual revenue and capital budgets and monitors performance
in relation to the approved budgets. The Governance and Nominations Committee has a standing role to advise Court on matters of governance and to conduct on its behalf, reviews of the University‟s governance. It also has responsibility for considering nominations for co-opted vacancies in the Court membership and vacancies in the membership of Court sub-committees. In undertaking this role, the Committee has been cognisant of the need for Court to have in its membership the appropriate mix of skills, experience and diversity. The Committee has identified further steps that the Court might take to ensure that the electoral processes and appointing bodies for other members of Court also take these considerations into account insofar as such appointment processes can allow. Vacancies for co-opted members are publicly advertised. The Remuneration Committee determines the remuneration and conditions of service of the most senior staff, including the Principal. The Committee is chaired by the Senior Governor and its membership is entirely lay. It meets at least twice annually and reports to Court at least once a year The Audit Committee, which has a predominantly lay membership, includes members with directly relevant experience, and is chaired by a lay member of the Court. It meets five times a year, with the University‟s internal and external auditors in attendance at all meetings.
The Committee considers detailed reports from the internal and external auditors, together with recommendations for the improvement of the University‟s systems of internal control, and management‟s responses and implementation plans. The Audit Committee‟s role is one of high level review of the arrangements for internal control, risk management and value for money. It has authority to investigate any matters within its terms of reference. It also receives and considers reports from the Scottish Funding Council as they affect the University‟s business and monitors adherence to the regulatory requirements. Whilst senior executives attend meetings of the Audit Committee, as necessary, they are not members of the Committee. Each meeting commences with a presentation from management on a key business development. The Risk Management Committee is a sub-committee of the Operating Board and contains lay representation. It seeks to ensure that the University has in place appropriate internal controls, including the identification of key business risks, evaluation of their financial and non-financial implications, and the establishment of policies and procedures for managing these risks. It receives reports from and provides reports to the Audit Committee. The Convener of the Audit Committee is an ex officio member.
12
Statement of Corporate Governance and Internal Control - continued The Strategic Business Ventures Group is a sub-committee of the Operating Board and contains lay representation. It monitors the University‟s investment in spin-out and subsidiary companies and advises on decisions regarding company creation and the sale of equity in spin-out or subsidiary companies. The University fully endorses the provisions of the Scottish Funding Council‟s Financial Memorandum. The University retains an external firm of accountants as Internal Auditors, and the University Court receives at least annually a report on internal audit activity, including an independent assessment of the adequacy and effectiveness of the University‟s system of internal control, including internal financial control. The University recognises through its Code of Practice on Whistleblowing that the raising of legitimate concerns by staff, students, members of Court or the general public and which are in the interests of the University, its staff or students, or of the general public is a practice which should be encouraged. The University Court considers that the University has adequate resources to continue in operational existence for the foreseeable future. Conclusion
Overall, the Court is of the view that it has in place a robust set of governance arrangements and procedures to fulfil its responsibilities. Sir Moir Lockhead
Senior Governor of the University Court
11 December 2012
13
Statement of Primary Responsibilities of the Court Under the statutes contained in the Universities (Scotland) Acts 1889-1966 the University Court is responsible for the administration and management of the University‟s affairs, including ensuring an effective system of internal control, and is required to present audited financial statements for each financial year. The Court is responsible for keeping proper accounting records which disclose with reasonable accuracy at any time the financial position of the University and enable it to ensure that the financial statements are prepared in accordance with the statutes, the Statement of Recommended Practice on Accounting in Higher Education Institutions and other relevant accounting standards. In addition, within the terms and conditions of a Financial Memorandum agreed between the Scottish Funding Council and the Court of the University of Aberdeen, the Court, through its Designated Officer, is required to prepare financial statements for each financial year which give a true and fair view of the University‟s state of affairs and of the surplus or deficit and cash flows for that year. When preparing the financial statements the Court has ensured that: suitable accounting policies are selected and applied consistently; judgements and estimates are made that are reasonable and prudent; applicable accounting standards have been followed, subject to any material departures disclosed and explained in the financial
statements; and financial statements are prepared on the going concern basis unless it is inappropriate to presume that the University will continue in
operation for the foreseeable future. The Court is satisfied that it has adequate resources to continue in operation for the foreseeable future. For this reason the going concern basis continues to be adopted in the preparation of the financial statements (page 23).
The Court has taken reasonable steps to: ensure that funds from the Scottish Funding Council are used only for the purposes for which they have been given and in
accordance with the Financial Memorandum with the Funding Council and any other conditions which the Funding Council may from time to time prescribe;
ensure that there are appropriate financial and management controls in place to safeguard public funds and funds from other sources; safeguard the assets of the University and prevent and detect fraud; and secure the economical, efficient and effective management of the University‟s resources and expenditure.
The key elements of the University‟s system of internal financial control, which is designed to discharge the responsibilities set out above, include the following: clear definitions of the responsibilities of, and the authority delegated to, heads of academic and administrative departments; a comprehensive medium and short-term planning process, supplemented by detailed annual income, expenditure, capital and cash
flow budgets; regular reviews of key performance indicators and business risks and monthly reviews of financial results, involving variance
reporting and updates of forecast outturns; clearly defined and formalised requirements for approval and control of expenditure, with investment decisions involving capital or
revenue expenditure being subject to formal detailed appraisal and review according to approval levels set by the Court; comprehensive Financial Regulations, detailing financial controls and procedures, approved by the Audit Committee, the Operating
Board and the Court; and an outsourced professional Internal Audit team whose annual programme is approved by the Audit Committee and endorsed by the
Court and whose head provides the Court with a report on internal audit activity within the University and an opinion on the adequacy and effectiveness of the University‟s system of internal control, including internal financial control.
Any system of internal financial control can, however, only provide reasonable, and not absolute, assurance against material misstatement or financial loss.
14
Membership of Court and Key Committees 2011-2012
UNIVERSITY COURT MEMBERSHIP: OPERATING BOARD MEMBERSHIP:
Rector Mr B Pack (Convener) Mr S Cannon Dr M Mackie (from 01.01.12) Ms J Craw Dr A King (from 28.09.11) Principal Professor P Edwards Professor I Diamond Professor I Diamond Professor S Logan Chancellor’s Assessor & Senior Governor Miss T Birley (from 01.08.11) Sir Moir Lockhead Professor N Webster Mr R Ruddiman Rector’s Assessor Mr J Hall (from 01.08.11) Mr G Hunter (from 01.01.12) REMUNERATION COMMITTEE MEMBERSHIP:
Vice-Principals Professor S Logan Sir Moir Lockhead (Convener ) Professor D Houlihan (to 26.03.12) Mr B Pack Professor P McGeorge Mr B Lockhart Professor P Hannaford (from 28.03.12) Dr A Baxter Mr D Steyn (from 06.12.11) Assessor: Aberdeenshire Council Councillor W Howatson (to 16.05.12) Councillor R McKail (from 17.05.12) GOVERNANCE COMMITTEE MEMBERSHIP: Assessor: Aberdeen City Council Councillor J Stewart (to 03.05.12) Sir Moir Lockhead (Acting Convener to 27.09.11)) Councillor B Crockett (from 01.06.12) Professor I Diamond Professor C Fynsk (to 30.09.11) Assessors: General Council Mr B Pack Ms J Craw Mr J Hall (Convener from 28.09.11) Mr B Lockhart Dr N Vargesson (from 01.10.11) Mr R Ruddiman Dr M Mackie (to 31.12.11)) RISK MANAGEMENT COMMITTEE MEMBERSHIP: Mr C Duncan (from 02.05.12)
Mr S Cannon (Convener) Assessors: Senatus Professor M Greaves (from 01.08.11) Professor P Edwards Professor B MacGregor (from 01.08.11) Professor C Fynsk (to 30.09.11) Mr R Ruddiman Professor G Robinson (to 30.09.11) Professor M Ross (from 01.08.11) Dr N Vargesson Ex officio Professor N Webster Mr A D J Amoore, as Convener of the Audit Committee (to 31.10.11) Professor N Hutchison (from 01.10.11) Dr A King (from 01.10.11) Mr K Murray, as Convener of the Audit Committee (from 01.11.11) Dr J Skakle (from 01.10.11) AUDIT COMMITTEE MEMBERSHIP:
President, Students’ Association Miss T Birley (from 01.08.11) Mr A D J Amoore (Convener) (to 31.10.11) Mr R Bickerton Co-opted Members Mr B Lockhart Mr A D J Amoore (to 31.10.11) Mr K Murray (Convener, from 01.11.11) Dr A Baxter Professor L Ritchie Mr B Pack Mr G Ross (to 31.10.11) Mrs K McPhail Mr A McNiven (from 01.11.11) Mr J Hall Mr K Murray (from 01.11.11) Mr B Paterson (from 01.08.11) Mr D Steyn (from 01.08.11)
15
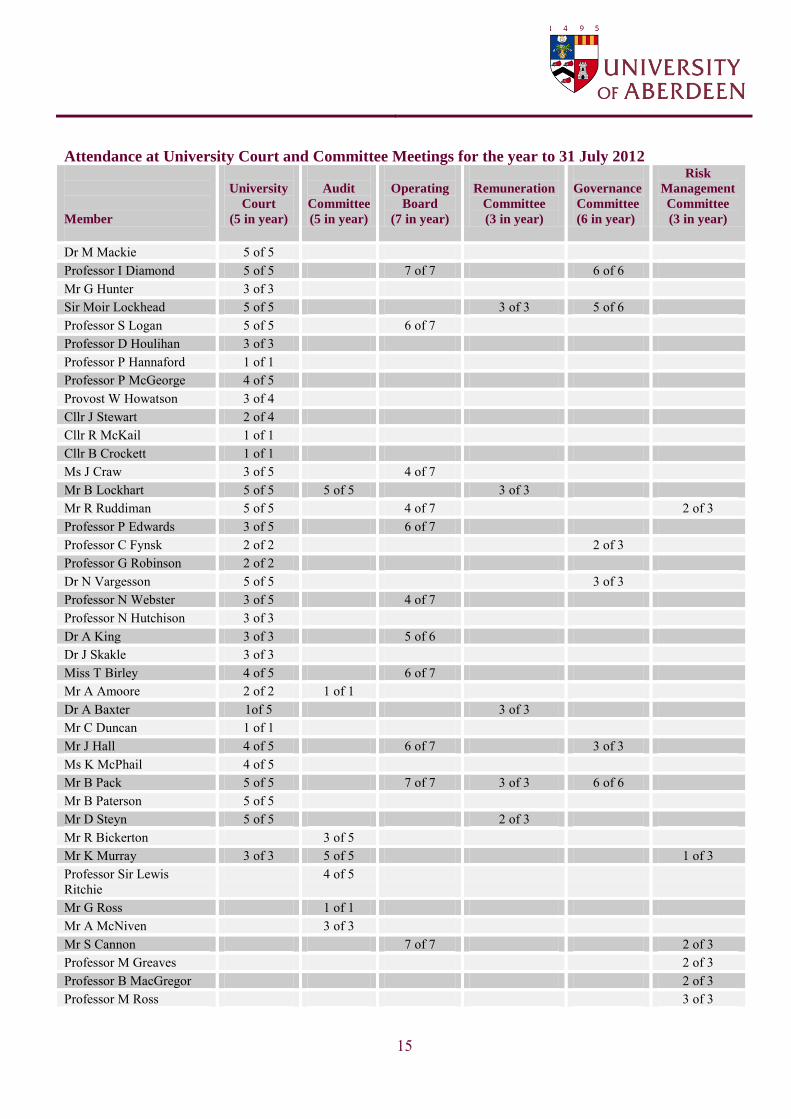
Attendance at University Court and Committee Meetings for the year to 31 July 2012
Member
University
Court (5 in year)
Audit
Committee (5 in year)
Operating
Board (7 in year)
Remuneration
Committee (3 in year)
Governance Committee (6 in year)
Risk Management
Committee (3 in year)
Dr M Mackie 5 of 5 Professor I Diamond 5 of 5 7 of 7 6 of 6 Mr G Hunter 3 of 3 Sir Moir Lockhead 5 of 5 3 of 3 5 of 6 Professor S Logan 5 of 5 6 of 7 Professor D Houlihan 3 of 3 Professor P Hannaford 1 of 1 Professor P McGeorge 4 of 5 Provost W Howatson 3 of 4 Cllr J Stewart 2 of 4 Cllr R McKail 1 of 1 Cllr B Crockett 1 of 1 Ms J Craw 3 of 5 4 of 7 Mr B Lockhart 5 of 5 5 of 5 3 of 3 Mr R Ruddiman 5 of 5 4 of 7 2 of 3 Professor P Edwards 3 of 5 6 of 7 Professor C Fynsk 2 of 2 2 of 3 Professor G Robinson 2 of 2 Dr N Vargesson 5 of 5 3 of 3 Professor N Webster 3 of 5 4 of 7 Professor N Hutchison 3 of 3 Dr A King 3 of 3 5 of 6 Dr J Skakle 3 of 3 Miss T Birley 4 of 5 6 of 7 Mr A Amoore 2 of 2 1 of 1 Dr A Baxter 1of 5 3 of 3 Mr C Duncan 1 of 1 Mr J Hall 4 of 5 6 of 7 3 of 3 Ms K McPhail 4 of 5 Mr B Pack 5 of 5 7 of 7 3 of 3 6 of 6 Mr B Paterson 5 of 5 Mr D Steyn 5 of 5 2 of 3 Mr R Bickerton 3 of 5 Mr K Murray 3 of 3 5 of 5 1 of 3 Professor Sir Lewis Ritchie
4 of 5
Mr G Ross 1 of 1 Mr A McNiven 3 of 3 Mr S Cannon 7 of 7 2 of 3 Professor M Greaves 2 of 3 Professor B MacGregor 2 of 3 Professor M Ross 3 of 3
16
Independent auditor’s report to the Court of the University of Aberdeen
We have audited the Group and University financial statements (“the financial statements”) of the University of Aberdeen for the year
ended 31 July 2012 which comprise the Consolidated Income and Expenditure Account, the Consolidated and University Balance Sheets, the Consolidated Cash Flow Statement, the Statement of Consolidated Total Recognised Gains and Losses, the Statement of Consolidated Historical Cost Surpluses and Deficits, the Statement of Principal Accounting Policies and Estimation Techniques and the related notes. The financial reporting framework that has been applied in their preparation is applicable law and United Kingdom Accounting Standards (United Kingdom Generally Accepted Accounting Practice). This report is made solely to the University Court of the University of Aberdeen, as a body, in accordance with paragraph 12 of the Universities (Scotland) Act 1966 and, in the University Court‟s role as charity trustees, in accordance with section 44 (1)(c) of the Charities and Trustee Investment (Scotland) Act 2005 and regulation 10 of the Charities Accounts (Scotland) Regulations 2006 (as amended). Our audit work has been undertaken so that we might state to the University Court of the University of Aberdeen those matters we are required to state to it in an auditor‟s report and for no other purpose. To the fullest extent permitted by law, we do not accept or assume responsibility to anyone other than the University Court of the University of Aberdeen, as a body, for our audit work, for this report, or for the opinions we have formed. Respective responsibilities of the University Court of the University of Aberdeen and auditor
As explained more fully in the Statement of Primary Responsibilities of the Court set out on page 13, the University Court of the University of Aberdeen is responsible for the preparation of the financial statements which give a true and fair view. We have been appointed as auditor under section 44 (1)(c) of the Charities and Trustee Investment (Scotland) Act 2005 and report to you in accordance with the regulations made under that Act. Our responsibility is to audit, and express an opinion on, the financial statements in accordance with applicable law and International Standards on Auditing (UK and Ireland). Those standards require us to comply with the Auditing Practices Board‟s (APB‟s) Ethical Standards for Auditors. Scope of the audit of the financial statements
An audit involves obtaining evidence about the amounts and disclosures in the financial statements sufficient to give reasonable assurance that the financial statements are free from material misstatement, whether caused by fraud or error. This includes an assessment of: whether the accounting policies are appropriate to the Group‟s and University‟s circumstances and have been consistently applied and adequately disclosed; the reasonableness of significant accounting estimates made by the University Court of the University of Aberdeen; and the overall presentation of the financial statements. In addition, we read all the financial and non-financial information in the 2012 Accounts to identify material inconsistencies with the audited financial statements. If we become aware of any apparent material misstatements or inconsistencies we consider the implications for our report.
Opinion on financial statements
In our opinion the financial statements: give a true and fair view of the state of the Group‟s and University‟s affairs as at 31 July 2012 and of the Group‟s income and
expenditure, recognised gains and losses and cash flows for the year then ended; have been properly prepared in accordance with UK Generally Accepted Accounting Practice and the Statement of Recommended
Practice: accounting for further and higher education; and have been prepared in accordance with the Charities and Trustee Investment (Scotland) Act 2005, and regulation 14 of the Charities
Accounts (Scotland) Regulations 2006 (as amended).
17
Independent auditor’s report to the Court of the University of Aberdeen – continued
Opinion on other matters prescribed by the terms of our engagement
In our opinion, in all material respects:
funds from whatever source administered by the institution for specific purposes have been properly applied to those purposes and, if relevant, managed in accordance with relevant legislation, and any other terms and conditions attached to them; and
funds provided by the Scottish Funding Council have been applied in accordance with the Financial Memorandum.
Matters on which, under the terms of our engagement, we are required to report by exception
We have nothing to report in respect of the following matters where the Charities Accounts (Scotland) Regulations 2006 (as amended) and the terms of our engagement require us to report to you if, in our opinion:
the information given in the Operating and Financial Review is inconsistent in any material respect with the financial statements; or
adequate and proper accounting records have not been kept; or
the financial statements are not in agreement with the accounting records and returns; or
we have not received all the information and explanations we require for our audit.
S Reid
for and on behalf of KPMG LLP, Statutory Auditor Chartered Accountants KPMG LLP is eligible to act as an auditor in terms of section 1212 of the Companies Act 2006 37 Albyn Place Aberdeen AB10 1JB 12 December 2012
18
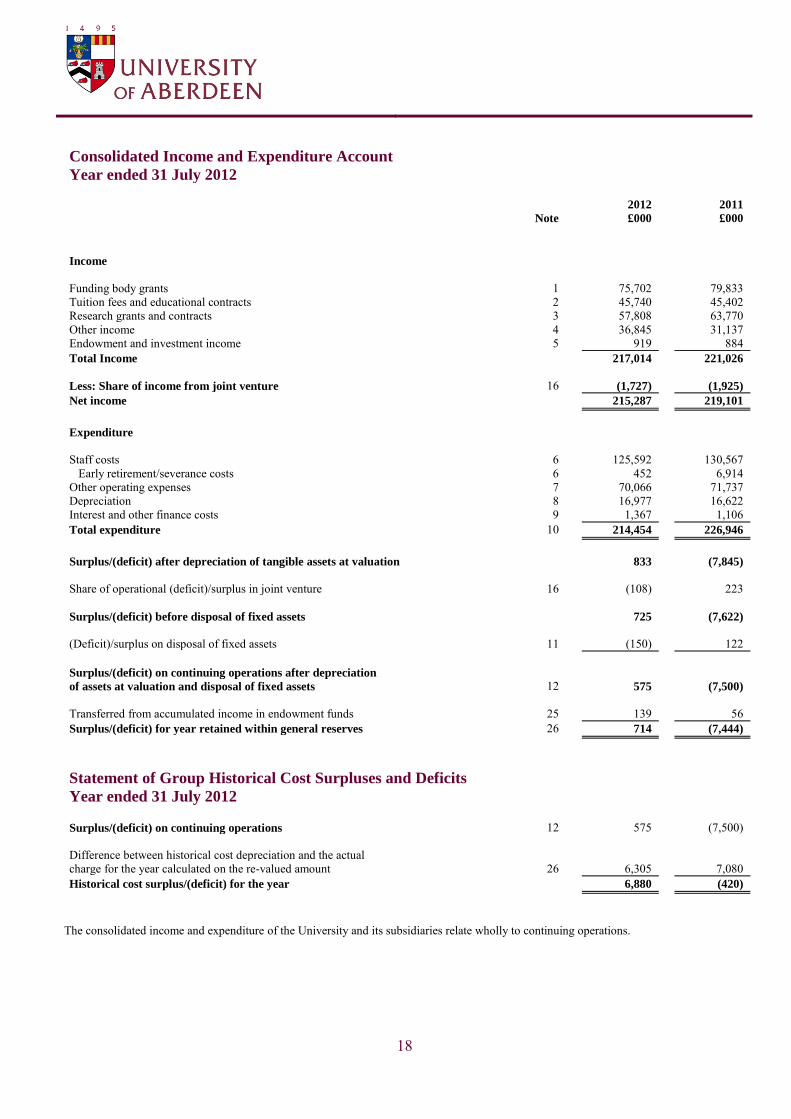
Consolidated Income and Expenditure Account
Year ended 31 July 2012
2012 2011
Note £000 £000
Income
Funding body grants 1 75,702 79,833 Tuition fees and educational contracts 2 45,740 45,402 Research grants and contracts 3 57,808 63,770 Other income 4 36,845 31,137 Endowment and investment income 5 919 884 Total Income 217,014 221,026
Less: Share of income from joint venture 16 (1,727) (1,925)
Net income 215,287 219,101
Expenditure
Staff costs 6 125,592 130,567 Early retirement/severance costs 6 452 6,914 Other operating expenses 7 70,066 71,737 Depreciation 8 16,977 16,622 Interest and other finance costs 9 1,367 1,106 Total expenditure 10 214,454 226,946
Surplus/(deficit) after depreciation of tangible assets at valuation 833 (7,845)
Share of operational (deficit)/surplus in joint venture 16 (108) 223
Surplus/(deficit) before disposal of fixed assets 725 (7,622)
(Deficit)/surplus on disposal of fixed assets 11 (150) 122 Surplus/(deficit) on continuing operations after depreciation of assets at valuation and disposal of fixed assets 12 575 (7,500)
Transferred from accumulated income in endowment funds 25 139 56 Surplus/(deficit) for year retained within general reserves 26 714 (7,444)
Statement of Group Historical Cost Surpluses and Deficits
Year ended 31 July 2012 Surplus/(deficit) on continuing operations 12 575 (7,500)
Difference between historical cost depreciation and the actual charge for the year calculated on the re-valued amount 26 6,305 7,080 Historical cost surplus/(deficit) for the year 6,880 (420)
The consolidated income and expenditure of the University and its subsidiaries relate wholly to continuing operations.
19
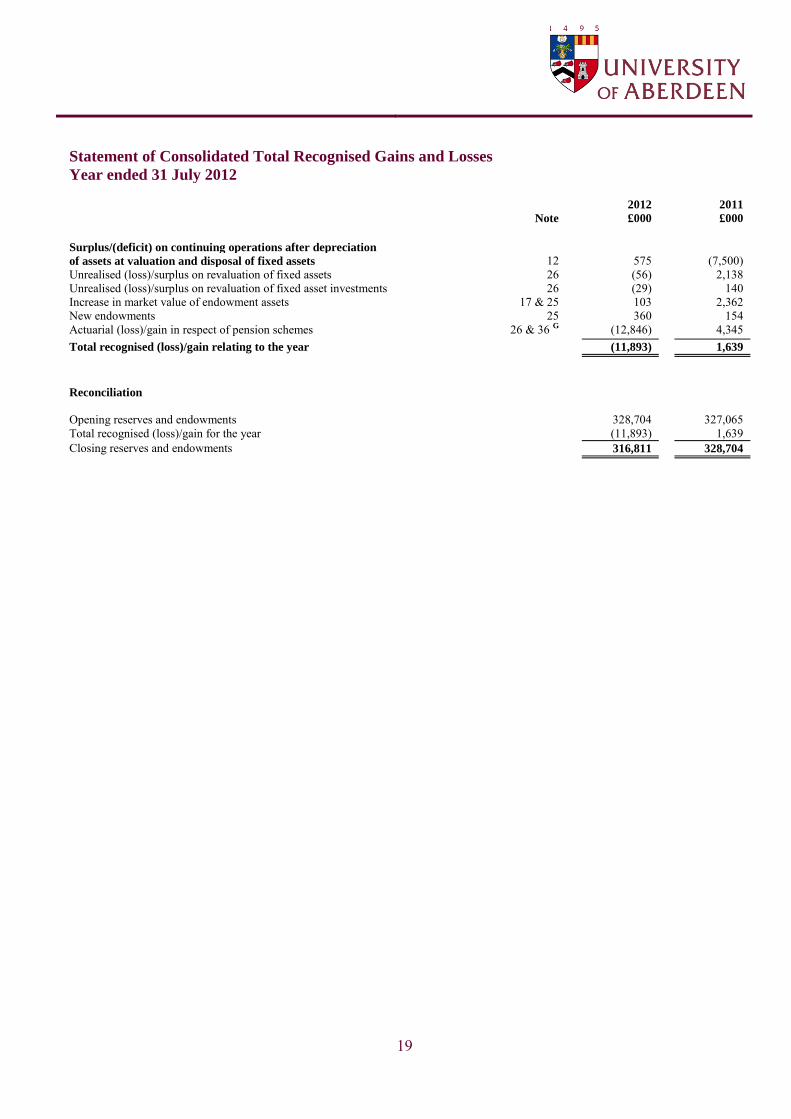
Statement of Consolidated Total Recognised Gains and Losses
Year ended 31 July 2012
2012 2011
Note £000 £000
Surplus/(deficit) on continuing operations after depreciation of assets at valuation and disposal of fixed assets 12 575 (7,500) Unrealised (loss)/surplus on revaluation of fixed assets 26 (56) 2,138 Unrealised (loss)/surplus on revaluation of fixed asset investments 26 (29) 140 Increase in market value of endowment assets 17 & 25 103 2,362 New endowments 25 360 154 Actuarial (loss)/gain in respect of pension schemes 26 & 36 G (12,846) 4,345 Total recognised (loss)/gain relating to the year (11,893) 1,639
Reconciliation
Opening reserves and endowments 328,704 327,065 Total recognised (loss)/gain for the year (11,893) 1,639 Closing reserves and endowments 316,811 328,704
20
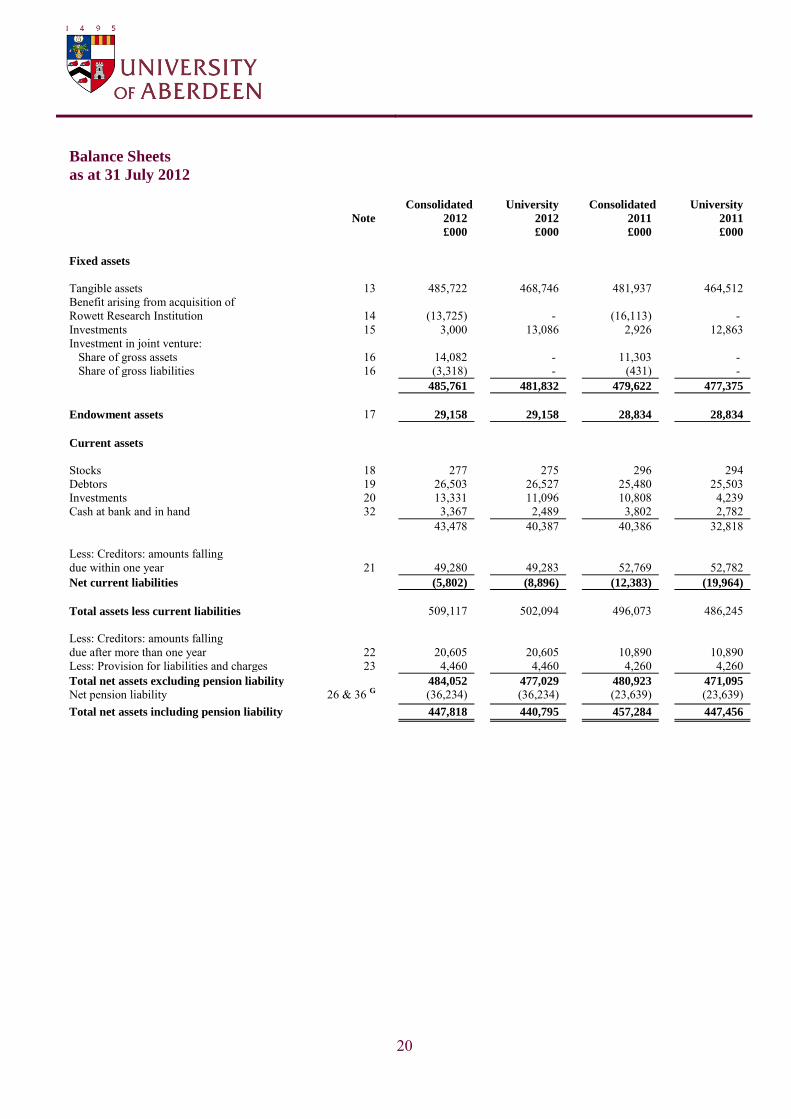
Balance Sheets
as at 31 July 2012
Consolidated University Consolidated University
Note 2012 2012 2011 2011
£000 £000 £000 £000
Fixed assets
Tangible assets 13 485,722 468,746 481,937 464,512 Benefit arising from acquisition of Rowett Research Institution 14 (13,725) - (16,113) - Investments 15 3,000 13,086 2,926 12,863 Investment in joint venture: Share of gross assets 16 14,082 - 11,303 - Share of gross liabilities 16 (3,318) - (431) -
485,761 481,832 479,622 477,375
Endowment assets 17 29,158 29,158 28,834 28,834
Current assets Stocks 18 277 275 296 294 Debtors 19 26,503 26,527 25,480 25,503 Investments 20 13,331 11,096 10,808 4,239 Cash at bank and in hand 32 3,367 2,489 3,802 2,782 43,478 40,387 40,386 32,818
Less: Creditors: amounts falling due within one year 21 49,280 49,283 52,769 52,782 Net current liabilities (5,802) (8,896) (12,383) (19,964)
Total assets less current liabilities 509,117 502,094 496,073 486,245
Less: Creditors: amounts falling due after more than one year 22 20,605 20,605 10,890 10,890 Less: Provision for liabilities and charges 23 4,460 4,460 4,260 4,260 Total net assets excluding pension liability 484,052 477,029 480,923 471,095
Net pension liability 26 & 36 G (36,234) (36,234) (23,639) (23,639) Total net assets including pension liability 447,818 440,795 457,284 447,456
21
Balance Sheets
as at 31 July 2012 (continued)
Consolidated University Consolidated University
Note 2012 2012 2011 2011
£000 £000 £000 £000
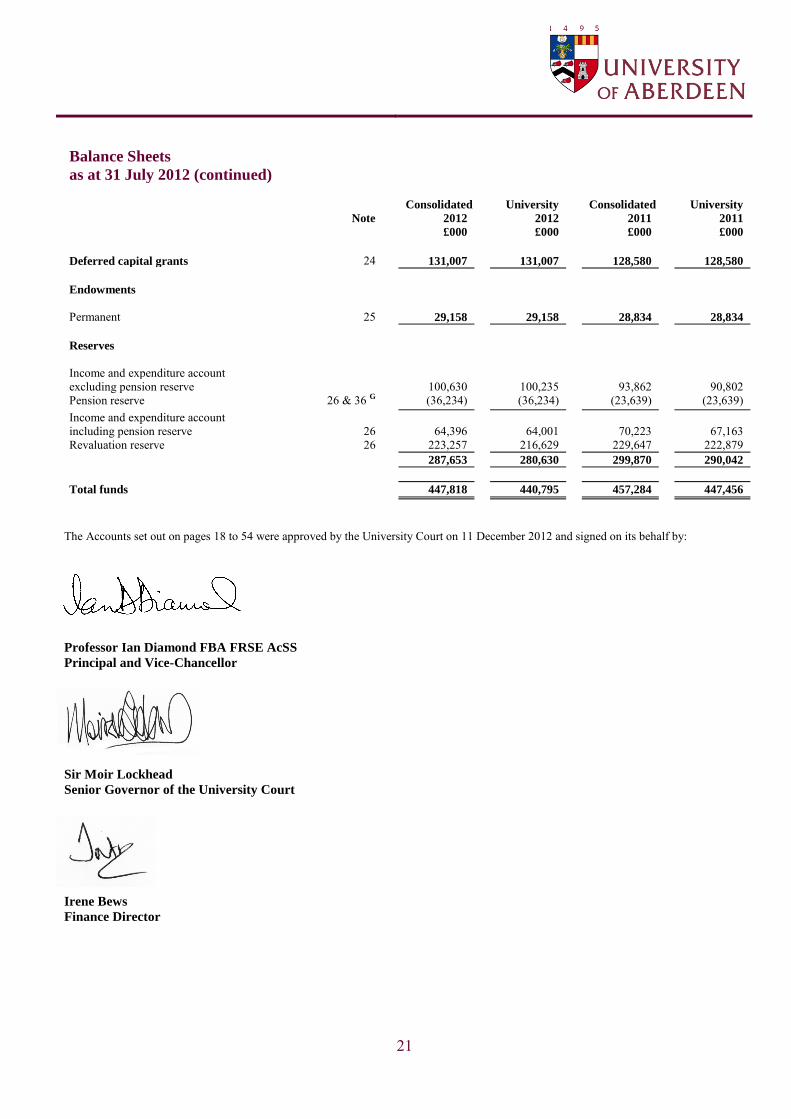
Deferred capital grants 24 131,007 131,007 128,580 128,580
Endowments Permanent 25 29,158 29,158 28,834 28,834
Reserves Income and expenditure account excluding pension reserve 100,630 100,235 93,862 90,802 Pension reserve 26 & 36 G (36,234) (36,234) (23,639) (23,639) Income and expenditure account including pension reserve 26 64,396 64,001 70,223 67,163 Revaluation reserve 26 223,257 216,629 229,647 222,879 287,653 280,630 299,870 290,042
Total funds 447,818 440,795 457,284 447,456
The Accounts set out on pages 18 to 54 were approved by the University Court on 11 December 2012 and signed on its behalf by: Professor Ian Diamond FBA FRSE AcSS
Principal and Vice-Chancellor Sir Moir Lockhead
Senior Governor of the University Court Irene Bews
Finance Director
22
Consolidated Cash Flow Statement
Year ended 31 July 2012
2012 2011
Note £000 £000
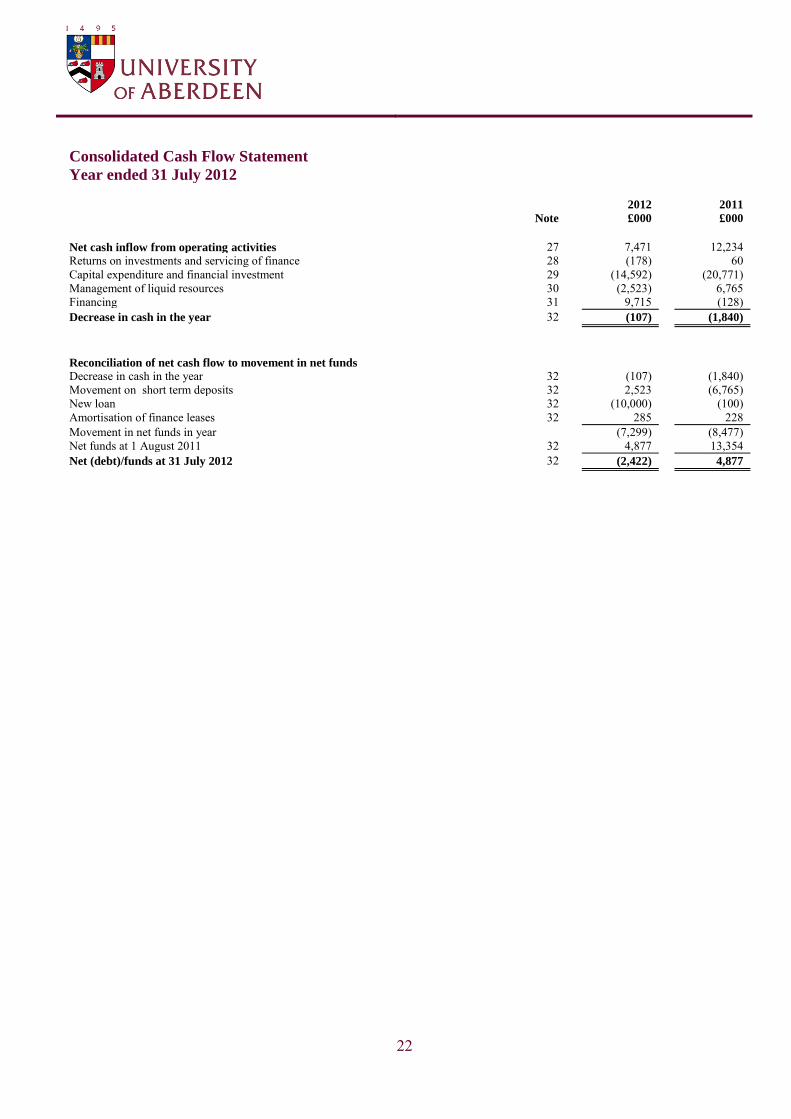
Net cash inflow from operating activities 27 7,471 12,234 Returns on investments and servicing of finance 28 (178) 60 Capital expenditure and financial investment 29 (14,592) (20,771) Management of liquid resources 30 (2,523) 6,765 Financing 31 9,715 (128) Decrease in cash in the year 32 (107) (1,840)
Reconciliation of net cash flow to movement in net funds Decrease in cash in the year 32 (107) (1,840) Movement on short term deposits 32 2,523 (6,765) New loan 32 (10,000) (100) Amortisation of finance leases 32 285 228 Movement in net funds in year (7,299) (8,477) Net funds at 1 August 2011 32 4,877 13,354 Net (debt)/funds at 31 July 2012 32 (2,422) 4,877
23
Statement of Principal Accounting Policies and Estimation Techniques
Basis of preparation The financial statements have been prepared in accordance with the Statement of Recommended Practice (SORP): Accounting for Further and Higher Education (2007) and in accordance with applicable Accounting Standards. Charities registered with the Office of the Scottish Charity Regulator (“OSCR”) fall under the statutory remit of the Charities and Trustee Investment (Scotland) Act 2005 and, in respect of financial statements preparation, the Charities Accounts (Scotland) Regulations 2006 (as amended). Regulation 14 of the 2006 Regulations allows the universities to prepare their financial statements in accordance with the statement of recommended practice: accounting for further and higher education. The financial statements are prepared in accordance with the historical cost conventions modified by the revaluation of certain fixed assets. The University has net current liabilities of £5.8m (Entity: £8.9m), previous year £12.4m (Entity: £20.0m).This is mainly due to increases in research grants received on account. The University Court are satisfied that this position will not impact the University's ability to meet its liabilities and obligations as they fall due over the next 12 months. The University has undrawn bank facilities of £25.4m available and has prepared cash flow forecasts which indicate that sufficient funds are consequently available. During September a further £15m was drawndown to fund our capital programme over the next 4 years. Basis of consolidation The consolidated financial statements include the University and all but one of its subsidiaries for the year to 31 July 2012. One subsidiary is not consolidated on the basis of it being immaterial to the group in accordance with FRS 2. The results of subsidiaries acquired or disposed of during the period are included in the consolidated income and expenditure account from the date of acquisition or up to the date of disposal. Intra-group sales and profits are eliminated fully on consolidation. A list of subsidiary undertakings is included in note 37. The consolidated financial statements do not include those of the University of Aberdeen Students‟ Association as it is a
separate organisation in which the University has no financial interest and no control or significant influence over policy decisions. The University of Aberdeen Development Trust is a charity registered in Scotland (SC002938) with the purpose of encouraging the development of teaching and research within the University of Aberdeen. The Trust is not consolidated within the financial statements as the Board of Trustees are independent and not controlled by the University of Aberdeen. Income recognition Funding council block grants are accounted for in the period to which they relate. Fee income is stated gross and credited to the income and expenditure account over the period in which the students are studying. Where the amount of tuition fee is reduced, income receivable is shown net of the discount. The fee elements of bursaries and scholarships are accounted for gross as expenditure and not deducted from income. Recurrent income from grants, contracts and other services rendered are accounted for on an accruals basis and are included as income and expenditure to the extent of the completion of the grant or service concerned. Any payments received in advance of such performance are recognised on the balance sheet as liabilities. Non-recurrent grants received in respect of the acquisition or construction of fixed assets is treated as deferred capital grants. The grants are credited to deferred capital grants and an annual transfer made to the income and expenditure account over the useful economic life of the asset at the same rate as the depreciation charge on the asset for which the grant was awarded. Income from the sale of goods or services is credited to the income and expenditure account when the goods or services are supplied to the external customers against the order received or the terms of the contract have been satisfied. Endowments and investment income is credited to the income and expenditure account on a receivable basis. Income from restricted endowments not expended in accordance with the terms of the endowment is transferred from the income and expenditure account to restricted endowments. Any realised gains or losses from dealing in the related assets are retained within the endowment in the balance sheet. Increase in value arising on the revaluation of fixed asset investments are recorded as a credit to the revaluation reserve. A diminution in value of fixed assets is charged to the income and expenditure account as a debit to the extent that it is not covered by a previous revaluation surplus. Increases/decreases in value arising on the revaluation or disposal of endowment assets i.e. the appreciation/depreciation of endowment assets is added to or subtracted from the funds concerned and accounted for through the balance sheet by debiting or crediting the endowment asset and crediting or debiting the endowment fund and reported in the statement of total recognised gains and losses.
24
Statement of Principal Accounting Policies and Estimation Techniques - continued Land and Buildings
Land and buildings are stated at cost or valuation. The basis of valuation is depreciated replacement cost as set out in the Royal Institute of Chartered Surveyors‟ Statement of Asset Valuation Practice and Guidance Notes. Certain properties are held for rental to staff and students on an arm‟s length basis. As these properties are held for investment rather than
for operational purposes they have not been depreciated, but have been treated as investment properties under SAAP 19 and are valued annually on an open market basis. The University performs impairment reviews of long-lived assets whenever events or changes in circumstances indicate that the carrying amount may not be recoverable. In addition, the University carries out annual impairment reviews in respect of goodwill. An impairment loss is recognised when the recoverable amount of an asset, which is the higher of the asset‟s net realisable value and its value in use, is less than its carrying amount. Costs incurred in relation to a tangible fixed asset after its initial purchase or production are capitalised to the extent that they increase the expected future benefits to the University from the existing tangible fixed asset beyond its previously assessed standard of performance. The cost of any such enhancement is added to the gross carrying amount of the tangible fixed asset concerned.
Equipment Equipment, including computers and software, and furniture costing less than £20,000 per individual item or group of related items, is written off in the year of purchase. All other items are capitalised. Assets acquired under finance leases are included in fixed assets and the capital element of the leasing commitments is shown as a liability. Depreciation
Freehold land is not depreciated. Freehold buildings are depreciated over the expected useful economic life to the University of between 30 and 50 years on the amount at which the tangible fixed asset is included in the balance sheet. Where material, a depreciable asset‟s
anticipated useful life is reviewed annually and the accumulated and future depreciation adjusted in accordance with FRS 15. Depreciation on tangible fixed assets in the course of construction is only provided when the assets are first brought into operational use. Where capitalised equipment is acquired with the aid of specific grants it is depreciated over the life of the specific research grants. In accordance with SSAP 19 no depreciation is provided for on investment properties. The accounting policy adopted is necessary for the accounts to give a true and fair view. The methodology applied in arriving at depreciation of buildings is a continuation of the approach adopted in the depreciated replacement cost (DRC) valuation. In essence, a series of DRC valuations are undertaken. The successive year‟s valuation is deducted from previous
year‟s to arrive at the intervening period depreciation figure. Whilst this is a sophisticated forecasting model it demonstrates a true and fair reflection on the physical depreciation of the building. Depreciation is provided on the value of equipment within tangible fixed assets shown in the balance sheet in order to write off the cost or valuation over estimated useful lives on a straight line basis, between 2 – 10 years. Acquisition with the aid of specific grants
Where buildings are acquired with the aid of specific grants, they are capitalised and depreciated. The related grants are credited to a deferred capital grant, and are released to the income and expenditure account over the expected useful economic life of the related asset on a basis consistent with the deprecation policy.
Repairs and maintenance
Expenditure to ensure that a tangible fixed asset maintains its previously recognised standard of performance is recognised in the income and expenditure account in the period it is incurred. The University has a planned maintenance programme, which is reviewed on an annual basis.
25
Statement of Principal Accounting Policies and Estimation Techniques – continued
Heritage Assets
The University holds a number of collections, exhibits, artefacts, and other assets of historical, artistic or scientific importance. In accordance with FRS 15 and FRS 30 (Heritage Assets), heritage assets acquired before 31 July 1999 have not been capitalised, since reliable estimates of cost or value are not available on a cost-benefit basis. Acquisitions from 1 August 1999 will be capitalised at cost or, in the case of donated assets, will be valued where the cost of obtaining value is not greater than the benefit to the user of the financial statements. In line with the accounting policy in respect of equipment, the threshold for capitalising assets is £20,000. Heritage assets that are irreplaceable originals and for which no reliable value can be attributed will not be capitalised in the accounts. Heritage assets are not depreciated since their long economic life and high residual value mean that any depreciation would not be material. Investments Listed investments held as fixed assets or endowment assets are shown at market value. Investments in subsidiary undertakings are shown at cost and investments in joint ventures are shown in the consolidated balance sheet as the attributable share of net assets. The University's share of any surplus or deficit in respect of Joint Ventures is recognised in the income and expenditure account. Income and gains or losses on sales of investments during the year are allocated to the invested funds in proportion to the opening balances on the funds. Current asset investments represent short term deposits not available on demand. Stocks Stocks, including work in progress, are valued at the lower of cost and net realisable value. Where necessary, provision is made for obsolete, slow-moving and defective stocks. Taxation The University is considered to pass the tests set out in Paragraph 1 Schedule 6 Finance Act 2010 and therefore it meets the definition of a charitable company for UK corporation tax purposes. Accordingly, the University is potentially exempt from taxation in respect of income or capital gains received within categories covered by Chapter 3 Part 11 Corporation Tax Act 2010 or Section 256 of the Taxation of Chargeable Gains Act 1992, to the extent that such income or gains are applied exclusively to charitable purposes. Subsidiary companies are liable to corporation tax. The University receives no similar exemption in respect of Value Added Tax. Irrecoverable VAT on inputs is included in the costs of such inputs. Any irrecoverable VAT allocated to tangible fixed assets is included in their cost. Deferred taxation
Deferred tax is recognised in respect of all timing differences that have originated but not reversed at the balance sheet date where transactions or events that result in an obligation to pay more or a right to pay less, tax in the future have occurred at the balance sheet date, with the following exceptions: provision is made for gains on disposal of fixed assets that have been rolled over into replacement assets only where, at the balance
sheet date, there is a commitment to dispose of the replacement assets; and on the basis of all available evidence deferred tax assets are recognised only to the extent that the management consider that it is
more likely than not that there will be suitable taxable profits from which the future reversal of the underlying timing differences can be deducted.
Deferred tax is measured on a non-discounted basis at the rates that are expected to apply in the periods in which timing differences reverse, based on tax rates and laws enacted or substantively enacted at the balance sheet date.
26
Statement of Principal Accounting Policies and Estimation Techniques - continued Deferred income
Grants received to fund expenditure on fixed assets are treated as deferred income and are credited to the income and expenditure account over the estimated useful lives of the assets to which they relate.
Leases
Where leasing agreements of finance assets give rights approximating to ownership, the assets are treated as if they had been purchased outright. The amount capitalised is the present value of the minimum lease payments payable during the lease term. The corresponding lease commitments are shown as obligations to the lessor. Lease payments are split between capital and interest elements using the annuity method. Depreciation on the relevant assets and interest are charged to the income and expenditure account.
Owned property leased under operating leases is capitalised in accordance with the accounting policy on fixed asset investment properties. Operating lease income is accounted for on a straight-line basis with any rental increases recognised during the period to which they relate. Cash flows and liquid resources Cash flows comprise increases or decreases in cash. Cash includes cash in hand, cash at bank, and deposits repayable on demand. Deposits are repayable on demand if they are in practice available within 24 hours without penalty. No investments, however liquid, are included as cash. Liquid resources comprise assets held as a readily disposable store of value. They include term deposits, government securities and loan stock held as part of the University‟s treasury management activities. They exclude any such assets held as endowment asset investments. Pension schemes
The principal schemes for the University‟s staff are Universities‟ Superannuation Scheme („USS‟) and the University of Aberdeen Superannuation & Life Assurance Scheme („UASLAS‟). The University also contributes to the Strathclyde Pension Fund („SPF‟). All
three are defined benefit schemes which are externally funded and contracted out of the State Earnings Related Pension Scheme. Each fund is valued every three years by professionally qualified independent actuaries. A small number of staff remain in other pension schemes. Pension costs for UASLAS and SPF are assessed on the latest actuarial valuation of the Schemes and are accounted for on the basis of FRS 17. For SPF this treatment is possible as each institution‟s share of the underlying assets and liabilities can now be identified.
UASLAS assets are included at market value and the schemes liabilities are measured on an actuarial basis using the projected unit method. These liabilities are discounted at the current rate of return on AA rated corporate bonds. The post-retirement benefit surplus or deficit is included on the University‟s balance sheet. Surpluses are only included to the extent that they are recoverable through reduced contributions in the future or through refunds from the schemes. The current service cost and any past service costs are included in the income and expenditure account within operating expenses and the expected return on the schemes‟ assets, net of the impact of unwinding of the discount on scheme liabilities, is included within other finance income. Actuarial gains and losses, including differences between the expected and actual return on scheme assets, are recognised in the statement of total recognised gains and losses. USS is a multi-employer scheme, for which contributions are charged directly to the income and expenditure account as if the scheme were a defined contribution scheme. The assets of the scheme are held in a separate trustee-administered fund. Because of the mutual nature of the scheme, the scheme‟s assets are not hypothecated to individual institutions and a scheme-wide contribution rate is set. The institution is therefore exposed to actuarial risks associated with other institutions‟ employees and is unable to identify its share of the underlying assets and liabilities of the scheme on a consistent and reasonable basis and therefore, as required by FRS 17 “Retirement benefits”, accounts for the scheme as if it were a defined contribution scheme. As a result, the amount charged to the income and expenditure account represents the contributions payable to the scheme in respect of the accounting period.
Foreign currency
Transactions denominated in foreign currencies are recorded at the rate of exchange ruling at the dates of the transactions. Monetary assets and liabilities denominated in foreign currencies are translated into sterling at year end rates.
27
Statement of Principal Accounting Policies and Estimation Techniques - continued Estimation techniques
The preparation of financial statements requires management to make estimates and assumptions that affect the reported amounts of assets and liabilities and disclosure of contingent assets and liabilities at the date of the financial statements and the reported amounts of income and expenditure during the reporting period. Actual results could differ from those estimates. Estimates are used principally when accounting for provision for doubtful debts and provisions for liabilities and charges.
Accounting for charitable donations
Unrestricted donations
Charitable donations are recognised as income in the accounts when the charitable donation has been received or if, before receipt, there is sufficient evidence to provide the necessary certainty that the donation will be received and the value of the incoming resources can be measured with sufficient reliability. Endowment funds
Where charitable donations are to be retained for the benefit of the University as specified by the donors, these are accounted for as an endowment. There are three main types:
Unrestricted permanent endowments – the donor has specified that the fund is to be permanently invested to generate an income stream for the general benefit of the University.
Restricted permanent endowments – the donor has specified that the fund is to be permanently invested to generate an income stream to be applied to a particular objective.
Restricted expendable endowments – the donor has specified a particular objective other than the purchase or construction of tangible fixed assets, and the University can convert the donated sum into income.
Donation to fund fixed assets
Donations received to be applied to the cost of a tangible fixed asset are shown on the balance sheet as a deferred capital grant. The deferred capital grant is released to the income and expenditure account over the same estimated useful life that is used to determine the depreciation charge associated with the tangible fixed asset. Accounting for business combinations
The University merged with Rowett Research Institute on 1 July 2008. The merger was accounted for by the “acquisition method of accounting” in order to comply with the requirements of FRS 6, Acquisitions and Mergers. Fair values are attributed to the net separable assets and liabilities. The benefit arising as a consequence of no consideration having been paid by the University for the net value of the assets acquired is included in the consolidated balance sheet as a deduction from tangible and intangible assets. The fair value of the benefit arising in relation to non-monetary assets is released to the income and expenditure account over the periods in which the non-monetary assets are recovered, whether through depreciation or disposals. The release is aligned with the corresponding depreciation charge relating to the assets. The fair value of the benefit arising in relation to monetary assets acquired for nil consideration is released to the income and expenditure account over the period which is expected to benefit. Management have identified the period 2008-2018 as the best estimate of the period in which the benefit of the monetary assets will be received. Provisions, contingent liabilities and contingent assets
Provisions are recognised in the financial statements when the University has a present obligation (legal or constructive) as a result of a past event, it is probable that a transfer of economic benefits will be required to settle the obligation and a reliable estimate can be made of the amount of the obligations. The amount recognised as a provision is discounted to present value where the time value of money is material. The discount rate used reflects current market assessments of the time value of money and reflects any risks specific to the liability. Contingent liabilities are disclosed by way of a note, when the definition of a provision is not met and includes three scenarios: possible rather than a present obligation; a possible rather than a probable outflow of economic benefits; an inability to reliably measure the possible economic outflow. Contingent assets are disclosed by way of a note, where there is a possible, rather than present, asset arising from a past event.
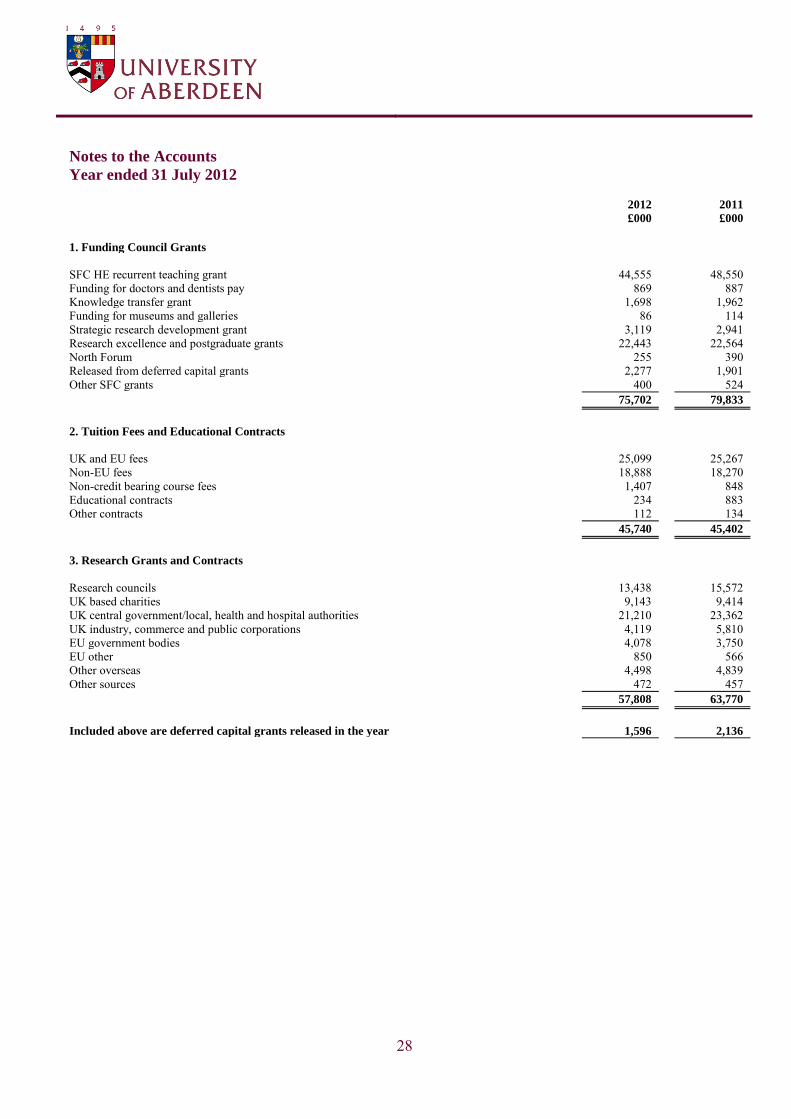
28
Notes to the Accounts
Year ended 31 July 2012
2012 2011
£000 £000
1. Funding Council Grants SFC HE recurrent teaching grant 44,555 48,550 Funding for doctors and dentists pay 869 887 Knowledge transfer grant 1,698 1,962 Funding for museums and galleries 86 114 Strategic research development grant 3,119 2,941 Research excellence and postgraduate grants 22,443 22,564 North Forum 255 390 Released from deferred capital grants 2,277 1,901 Other SFC grants 400 524
75,702 79,833
2. Tuition Fees and Educational Contracts UK and EU fees 25,099 25,267 Non-EU fees 18,888 18,270 Non-credit bearing course fees 1,407 848 Educational contracts 234 883 Other contracts 112 134
45,740 45,402
3. Research Grants and Contracts Research councils 13,438 15,572 UK based charities 9,143 9,414 UK central government/local, health and hospital authorities 21,210 23,362 UK industry, commerce and public corporations 4,119 5,810 EU government bodies 4,078 3,750 EU other 850 566 Other overseas 4,498 4,839 Other sources 472 457
57,808 63,770
Included above are deferred capital grants released in the year 1,596 2,136
29
Notes to the Accounts - continued
Year ended 31 July 2012
2012 2011
£000 £000
4. Other Income Residences, catering and conferences 13,631 13,238 Income from consultancies 7,719 7,081 Income from health and hospital authorities 3,279 3,323 Income from intellectual property rights 57 215 Other income Conferences 146 247 Dividends 46 58 Donations 484 155 Investment Gains 12 18 Library 250 279 Printing 72 184 Property rentals 1,697 1,246 Sports centre 475 310 Marischal College Lease 762 -
Sundry departmental 1,313 1,140 Other 1,449 972 Released from deferred capital grants 1,338 513 Income from joint venture 1,727 1,925 Benefit on acquisition of Rowett Research Institute - release to income 2,388 233
36,845 31,137
5. Endowment and Investment Income Income from permanent endowments (note 25) 705 675 Income from short-term investments 214 209
919 884
30
Notes to the Accounts - continued
Year ended 31 July 2012
2012 2011
£000 £000
6. Staff Costs Salaries 96,061 100,907 Social security costs 8,244 8,350 Pension costs 21,287 21,310 Early retirement/severance costs 452 6,914 126,044 137,481
Emoluments of the Principal and Vice Chancellor:
Reference salary 261 287 Salary sacrifice (19) (16) Salary 242 271
Reference pension contributions 42 48 Salary sacrifice pension contributions 19 16 Pension contributions to USS 61 64
The Principal was awarded but chose not to receive his annual pay award and contractual bonus.
Remuneration of other higher paid staff, excluding salary sacrifice and employer's pension contributions: Number Number
£70,000 - £79,999 51 53
£80,000 - £89,999 40 30
£90,000 - £99,999 27 33
£100,000 - £109,999 32 31
£110,000 - £119,999 10 10
£120,000 - £129,999 6 12
£130,000 - £139,999 5 2
£140,000 - £149,999 1 1
£150,000 - £159,999 2 3
£160,000 - £169,999 - 1
£170,000 - £179,999 1 1
£200,000 - £209,999 1 -
Average staff numbers by activity
Academic departments 1,371 1,417 Academic services 258 249 Administration and central services 389 353 Premises 203 195 Residences, catering and conferences 240 263 Research grants and contracts 601 708 Other expenses 184 163 3,246 3,348
31
Notes to the Accounts – continued
Year ended 31 July 2012
2012 2011
£000 £000
6. Staff Costs - continued
Staff costs by activity Academic departments 63,837 65,863 Academic services 8,900 8,245 Administration and central services 12,722 11,453 Premises 5,146 4,833 Residences, catering and conferences 3,783 4,098 Research grants and contracts 24,913 28,899 Other expenses 6,812 6,525 FRS 17 current service cost adjustment (note 36 G) (521) 651 125,592 130,567 Early retirement/severance costs 452 6,914 126,044 137,481
7. Other operating expenses by activity Academic departments 15,433 15,163 Academic services 5,258 4,671 Administration and central services 7,646 7,790 Premises 9,367 7,467 Residences, catering and conferences 7,998 7,585 Research grants and contracts 19,733 22,935 Other expenses 4,631 6,126
70,066 71,737
Consolidated Other operating expenses include: External auditors remuneration in respect of audit services 54 52
External auditors remuneration in respect of non-audit services 14 55
Internal auditors remuneration in respect of audit services 54 64
University Other operating expenses include: External auditors remuneration in respect of audit services 49 47
External auditors remuneration in respect of non-audit services 14 55
Internal auditors remuneration in respect of audit services 54 64
8. Depreciation by activity Academic departments 2,574 2,510 Academic services 1,742 1,351 Administration and central services 158 169 Premises 8,286 7,505 Residences, catering and conferences 1,978 2,103 Research grants and contracts 1,606 2,146 Other expenses 633 838
16,977 16,622
32
Notes to the Accounts – continued
Year ended 31 July 2012
2012 2011
£000 £000
9. Interest and other finance costs Loan interest (note 28) 546 345 Finance leases (note 28) 551 479 Interest on pension scheme liabilities (note 36 G) 270 282
1,367 1,106
10. Analysis of total expenditure by activity
Academic departments 81,844 83,536 Academic services 15,900 14,267 Administration and central services 20,526 19,412 Premises 23,345 20,150 Residences, catering and conferences 14,310 14,265 Research grants and contracts 46,252 53,980 Other expenses 12,346 13,771 FRS 17 current service cost adjustment (note 36 G) (521) 651 Early retirement/severance costs 452 6,914 214,454 226,946
11. Disposal of fixed asset investments
Deficit on disposal of fixed asset investment (150) - Surplus on disposal of equipment - 122
(150) 122
During the year the University disposed of surplus equipment.
12. Surplus/(deficit) on continuing operations for the year The surplus/(deficit) on continuing operations for the year is made up as follows: University surplus/(deficit) for the year 3,391 (6,279) Subsidiary undertakings deficit for the year (2,816) (1,221) 575 (7,500)
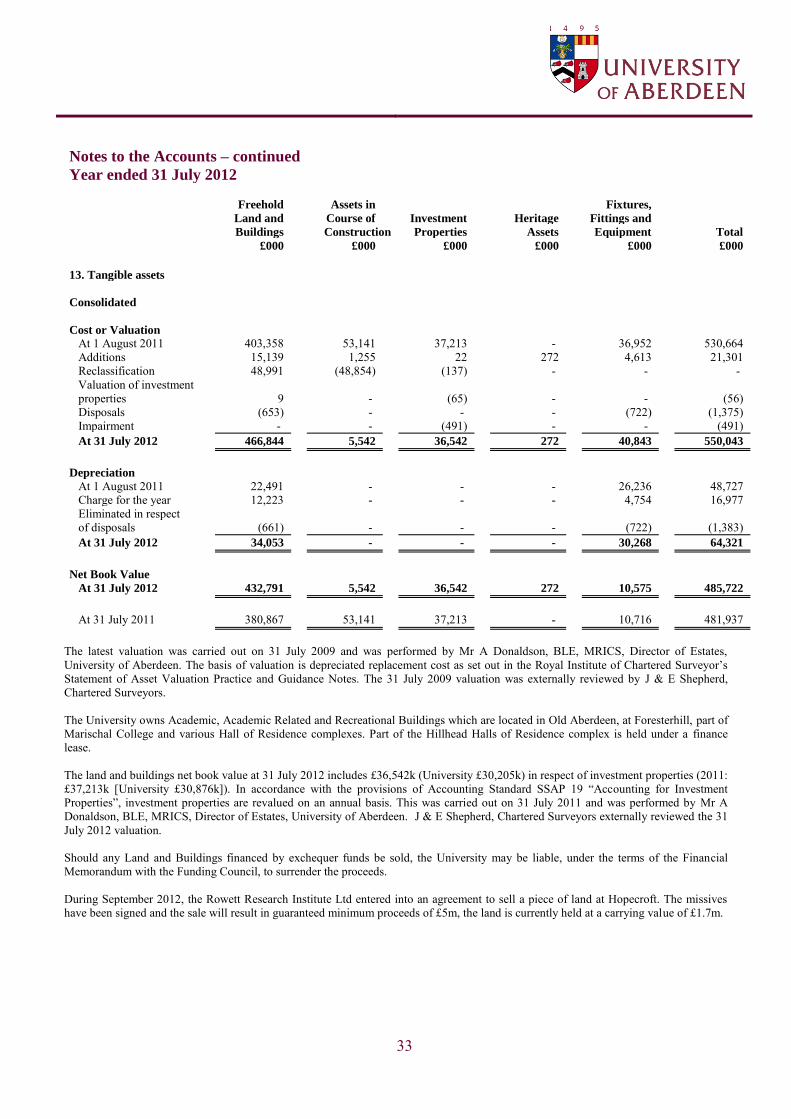
33
Notes to the Accounts – continued
Year ended 31 July 2012
Freehold Assets in Fixtures,
Land and Course of Investment Heritage Fittings and
Buildings Construction Properties Assets Equipment Total
£000 £000 £000 £000 £000 £000
13. Tangible assets Consolidated
Cost or Valuation At 1 August 2011 403,358 53,141 37,213 - 36,952 530,664 Additions 15,139 1,255 22 272 4,613 21,301 Reclassification 48,991 (48,854) (137) - - - Valuation of investment properties 9 - (65) - - (56) Disposals (653) - - - (722) (1,375) Impairment - - (491) - - (491) At 31 July 2012 466,844 5,542 36,542 272 40,843 550,043
Depreciation
At 1 August 2011 22,491 - - - 26,236 48,727 Charge for the year 12,223 - - - 4,754 16,977 Eliminated in respect of disposals (661) - - - (722) (1,383) At 31 July 2012 34,053 - - - 30,268 64,321
Net Book Value
At 31 July 2012 432,791 5,542 36,542 272 10,575 485,722
At 31 July 2011 380,867 53,141 37,213 - 10,716 481,937
The latest valuation was carried out on 31 July 2009 and was performed by Mr A Donaldson, BLE, MRICS, Director of Estates, University of Aberdeen. The basis of valuation is depreciated replacement cost as set out in the Royal Institute of Chartered Surveyor‟s
Statement of Asset Valuation Practice and Guidance Notes. The 31 July 2009 valuation was externally reviewed by J & E Shepherd, Chartered Surveyors. The University owns Academic, Academic Related and Recreational Buildings which are located in Old Aberdeen, at Foresterhill, part of Marischal College and various Hall of Residence complexes. Part of the Hillhead Halls of Residence complex is held under a finance lease. The land and buildings net book value at 31 July 2012 includes £36,542k (University £30,205k) in respect of investment properties (2011: £37,213k [University £30,876k]). In accordance with the provisions of Accounting Standard SSAP 19 “Accounting for Investment Properties”, investment properties are revalued on an annual basis. This was carried out on 31 July 2011 and was performed by Mr A Donaldson, BLE, MRICS, Director of Estates, University of Aberdeen. J & E Shepherd, Chartered Surveyors externally reviewed the 31 July 2012 valuation. Should any Land and Buildings financed by exchequer funds be sold, the University may be liable, under the terms of the Financial Memorandum with the Funding Council, to surrender the proceeds. During September 2012, the Rowett Research Institute Ltd entered into an agreement to sell a piece of land at Hopecroft. The missives have been signed and the sale will result in guaranteed minimum proceeds of £5m, the land is currently held at a carrying value of £1.7m.
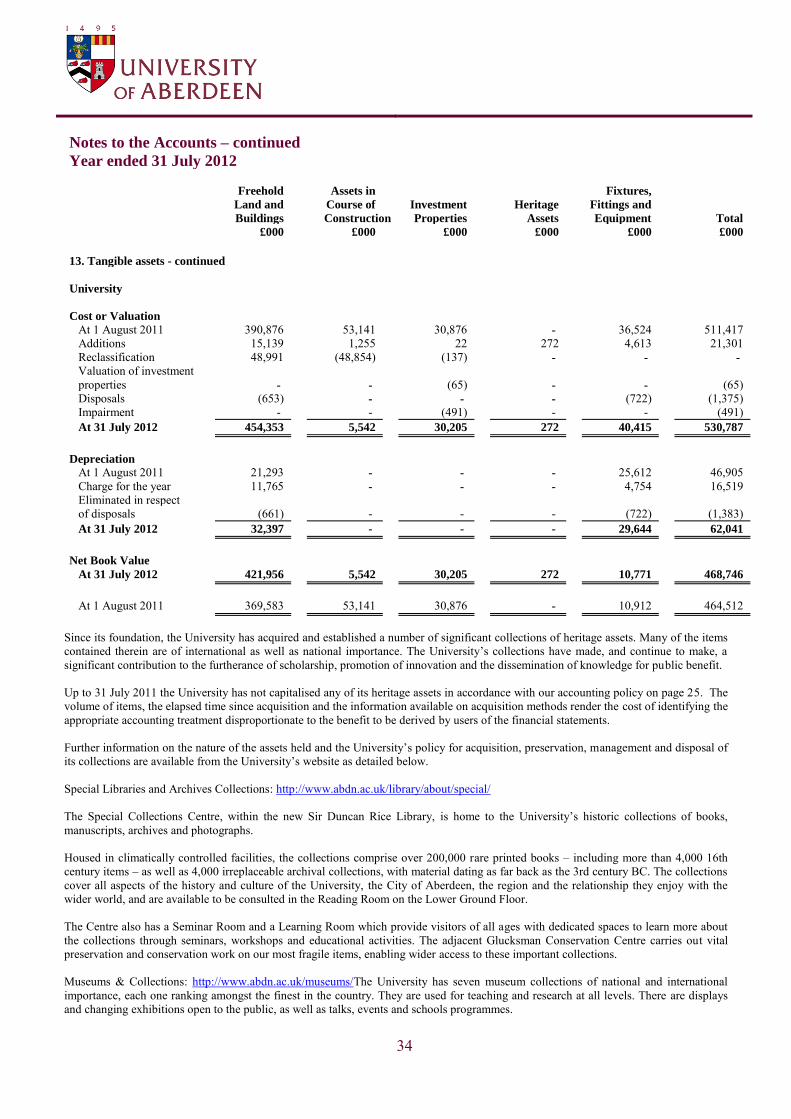
34
Notes to the Accounts – continued
Year ended 31 July 2012
Freehold Assets in Fixtures,
Land and Course of Investment Heritage Fittings and
Buildings Construction Properties Assets Equipment Total
£000 £000 £000 £000 £000 £000
13. Tangible assets - continued
University
Cost or Valuation
At 1 August 2011 390,876 53,141 30,876 - 36,524 511,417 Additions 15,139 1,255 22 272 4,613 21,301 Reclassification 48,991 (48,854) (137) - - -
Valuation of investment properties - - (65) - - (65) Disposals (653) - - - (722) (1,375) Impairment - - (491) - - (491) At 31 July 2012 454,353 5,542 30,205 272 40,415 530,787
Depreciation
At 1 August 2011 21,293 - - - 25,612 46,905 Charge for the year 11,765 - - - 4,754 16,519 Eliminated in respect of disposals (661) - - - (722) (1,383) At 31 July 2012 32,397 - - - 29,644 62,041
Net Book Value
At 31 July 2012 421,956 5,542 30,205 272 10,771 468,746
At 1 August 2011 369,583 53,141 30,876 - 10,912 464,512
Since its foundation, the University has acquired and established a number of significant collections of heritage assets. Many of the items contained therein are of international as well as national importance. The University‟s collections have made, and continue to make, a
significant contribution to the furtherance of scholarship, promotion of innovation and the dissemination of knowledge for public benefit. Up to 31 July 2011 the University has not capitalised any of its heritage assets in accordance with our accounting policy on page 25. The volume of items, the elapsed time since acquisition and the information available on acquisition methods render the cost of identifying the appropriate accounting treatment disproportionate to the benefit to be derived by users of the financial statements. Further information on the nature of the assets held and the University‟s policy for acquisition, preservation, management and disposal of its collections are available from the University‟s website as detailed below. Special Libraries and Archives Collections: http://www.abdn.ac.uk/library/about/special/ The Special Collections Centre, within the new Sir Duncan Rice Library, is home to the University‟s historic collections of books,
manuscripts, archives and photographs. Housed in climatically controlled facilities, the collections comprise over 200,000 rare printed books – including more than 4,000 16th century items – as well as 4,000 irreplaceable archival collections, with material dating as far back as the 3rd century BC. The collections cover all aspects of the history and culture of the University, the City of Aberdeen, the region and the relationship they enjoy with the wider world, and are available to be consulted in the Reading Room on the Lower Ground Floor. The Centre also has a Seminar Room and a Learning Room which provide visitors of all ages with dedicated spaces to learn more about the collections through seminars, workshops and educational activities. The adjacent Glucksman Conservation Centre carries out vital preservation and conservation work on our most fragile items, enabling wider access to these important collections. Museums & Collections: http://www.abdn.ac.uk/museums/The University has seven museum collections of national and international importance, each one ranking amongst the finest in the country. They are used for teaching and research at all levels. There are displays and changing exhibitions open to the public, as well as talks, events and schools programmes.
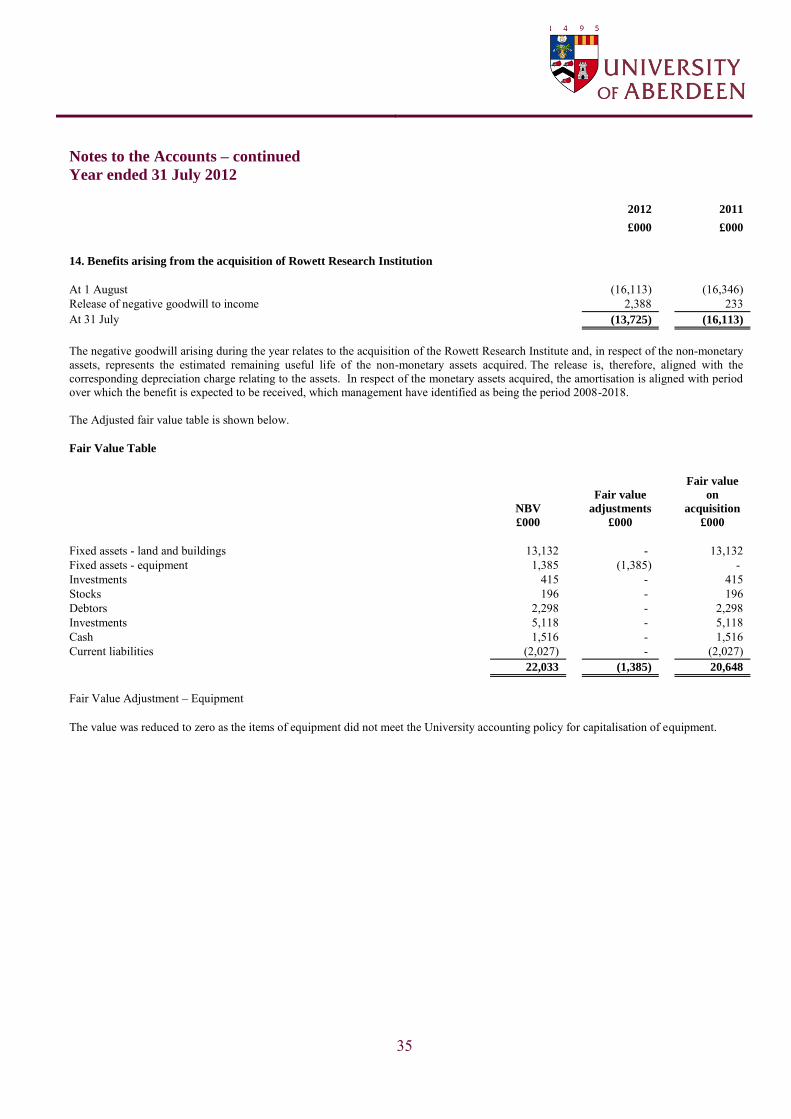
35
Notes to the Accounts – continued
Year ended 31 July 2012
2012 2011
£000 £000
14. Benefits arising from the acquisition of Rowett Research Institution
At 1 August (16,113) (16,346) Release of negative goodwill to income 2,388 233 At 31 July (13,725) (16,113)
The negative goodwill arising during the year relates to the acquisition of the Rowett Research Institute and, in respect of the non-monetary assets, represents the estimated remaining useful life of the non-monetary assets acquired. The release is, therefore, aligned with the corresponding depreciation charge relating to the assets. In respect of the monetary assets acquired, the amortisation is aligned with period over which the benefit is expected to be received, which management have identified as being the period 2008-2018. The Adjusted fair value table is shown below. Fair Value Table
NBV
Fair value
adjustments
Fair value
on
acquisition
£000 £000 £000
Fixed assets - land and buildings 13,132 - 13,132 Fixed assets - equipment 1,385 (1,385) - Investments 415 - 415 Stocks 196 - 196 Debtors 2,298 - 2,298 Investments 5,118 - 5,118 Cash 1,516 - 1,516 Current liabilities (2,027) - (2,027) 22,033 (1,385) 20,648
Fair Value Adjustment – Equipment The value was reduced to zero as the items of equipment did not meet the University accounting policy for capitalisation of equipment.
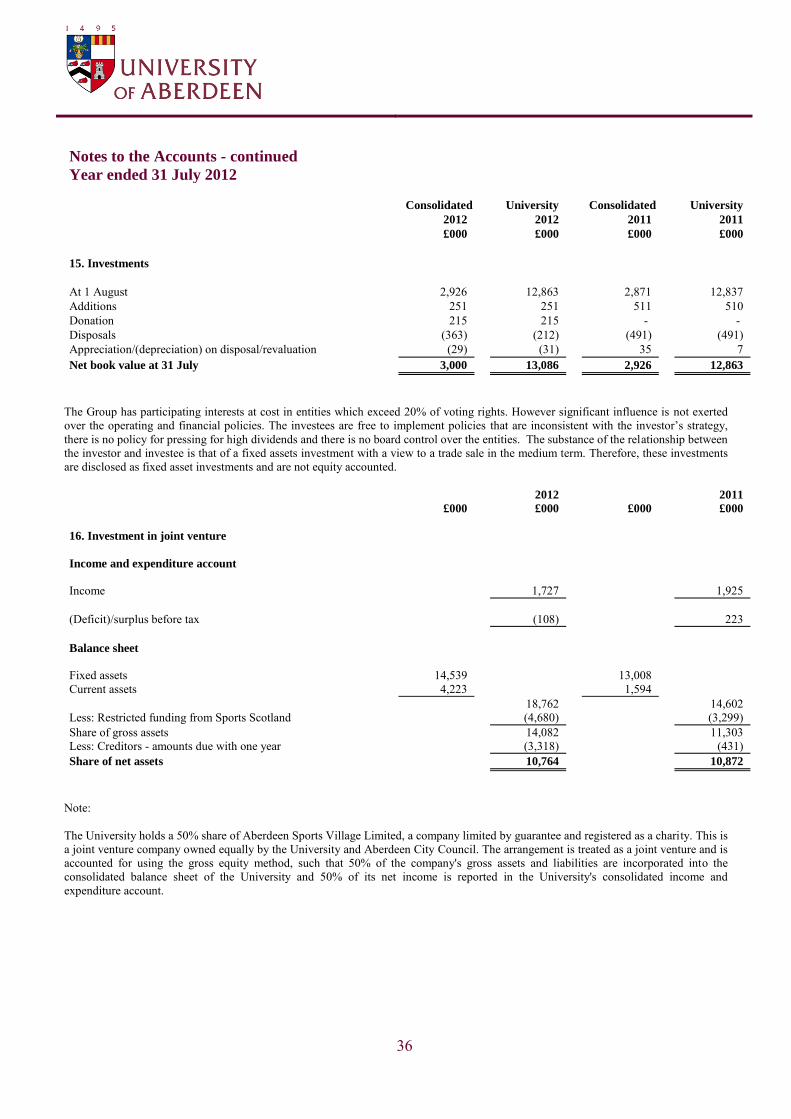
36
Notes to the Accounts - continued
Year ended 31 July 2012
Consolidated University Consolidated University
2012 2012 2011 2011
£000 £000 £000 £000
15. Investments
At 1 August 2,926 12,863 2,871 12,837 Additions 251 251 511 510 Donation 215 215 - - Disposals (363) (212) (491) (491) Appreciation/(depreciation) on disposal/revaluation (29) (31) 35 7 Net book value at 31 July 3,000 13,086 2,926 12,863
The Group has participating interests at cost in entities which exceed 20% of voting rights. However significant influence is not exerted over the operating and financial policies. The investees are free to implement policies that are inconsistent with the investor‟s strategy,
there is no policy for pressing for high dividends and there is no board control over the entities. The substance of the relationship between the investor and investee is that of a fixed assets investment with a view to a trade sale in the medium term. Therefore, these investments are disclosed as fixed asset investments and are not equity accounted.
2012 2011
£000 £000 £000 £000
16. Investment in joint venture
Income and expenditure account
Income 1,727 1,925
(Deficit)/surplus before tax (108) 223
Balance sheet
Fixed assets 14,539 13,008 Current assets 4,223 1,594
18,762 14,602 Less: Restricted funding from Sports Scotland (4,680) (3,299) Share of gross assets 14,082 11,303 Less: Creditors - amounts due with one year (3,318) (431) Share of net assets 10,764 10,872
Note: The University holds a 50% share of Aberdeen Sports Village Limited, a company limited by guarantee and registered as a charity. This is a joint venture company owned equally by the University and Aberdeen City Council. The arrangement is treated as a joint venture and is accounted for using the gross equity method, such that 50% of the company's gross assets and liabilities are incorporated into the consolidated balance sheet of the University and 50% of its net income is reported in the University's consolidated income and expenditure account.
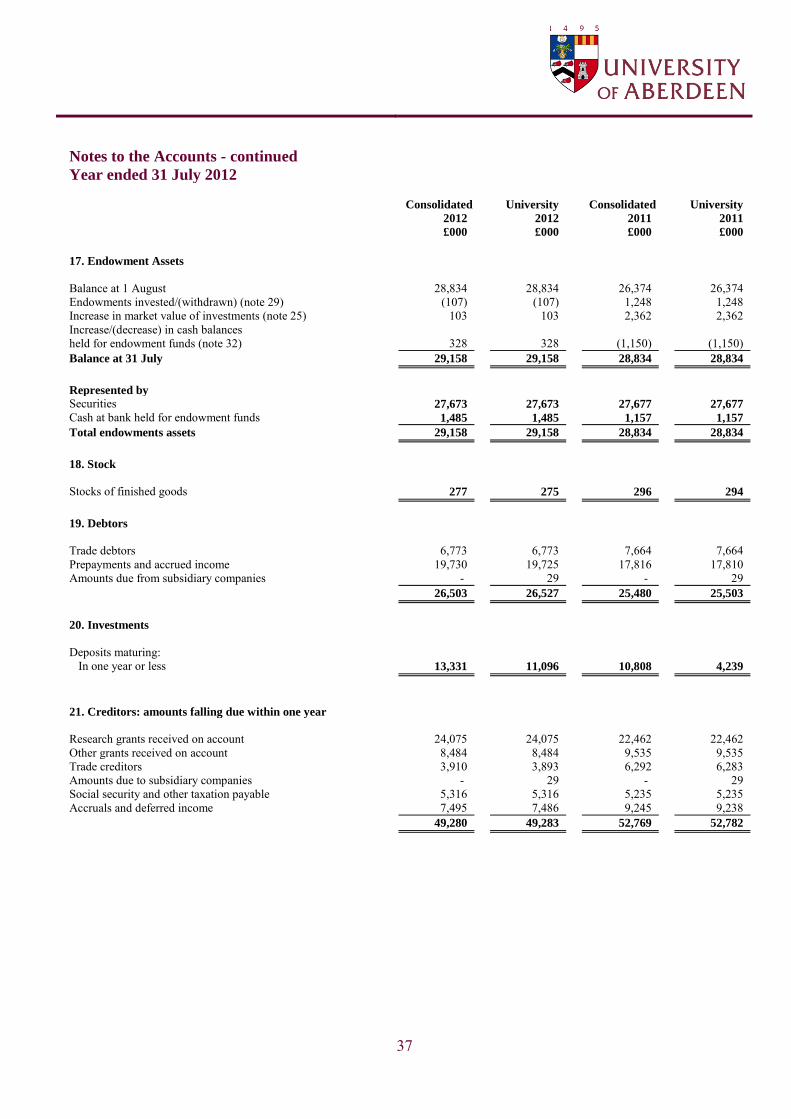
37
Notes to the Accounts - continued
Year ended 31 July 2012
Consolidated University Consolidated University
2012 2012 2011 2011
£000 £000 £000 £000
17. Endowment Assets
Balance at 1 August 28,834 28,834 26,374 26,374 Endowments invested/(withdrawn) (note 29) (107) (107) 1,248 1,248 Increase in market value of investments (note 25) 103 103 2,362 2,362 Increase/(decrease) in cash balances held for endowment funds (note 32) 328 328 (1,150) (1,150) Balance at 31 July 29,158 29,158 28,834 28,834
Represented by Securities 27,673 27,673 27,677 27,677
Cash at bank held for endowment funds 1,485 1,485 1,157 1,157
Total endowments assets 29,158 29,158 28,834 28,834
18. Stock
Stocks of finished goods 277 275 296 294
19. Debtors Trade debtors 6,773 6,773 7,664 7,664 Prepayments and accrued income 19,730 19,725 17,816 17,810 Amounts due from subsidiary companies - 29 - 29
26,503 26,527 25,480 25,503
20. Investments Deposits maturing: In one year or less 13,331 11,096 10,808 4,239
21. Creditors: amounts falling due within one year Research grants received on account 24,075 24,075 22,462 22,462 Other grants received on account 8,484 8,484 9,535 9,535 Trade creditors 3,910 3,893 6,292 6,283 Amounts due to subsidiary companies - 29 - 29 Social security and other taxation payable 5,316 5,316 5,235 5,235 Accruals and deferred income 7,495 7,486 9,245 9,238
49,280 49,283 52,769 52,782
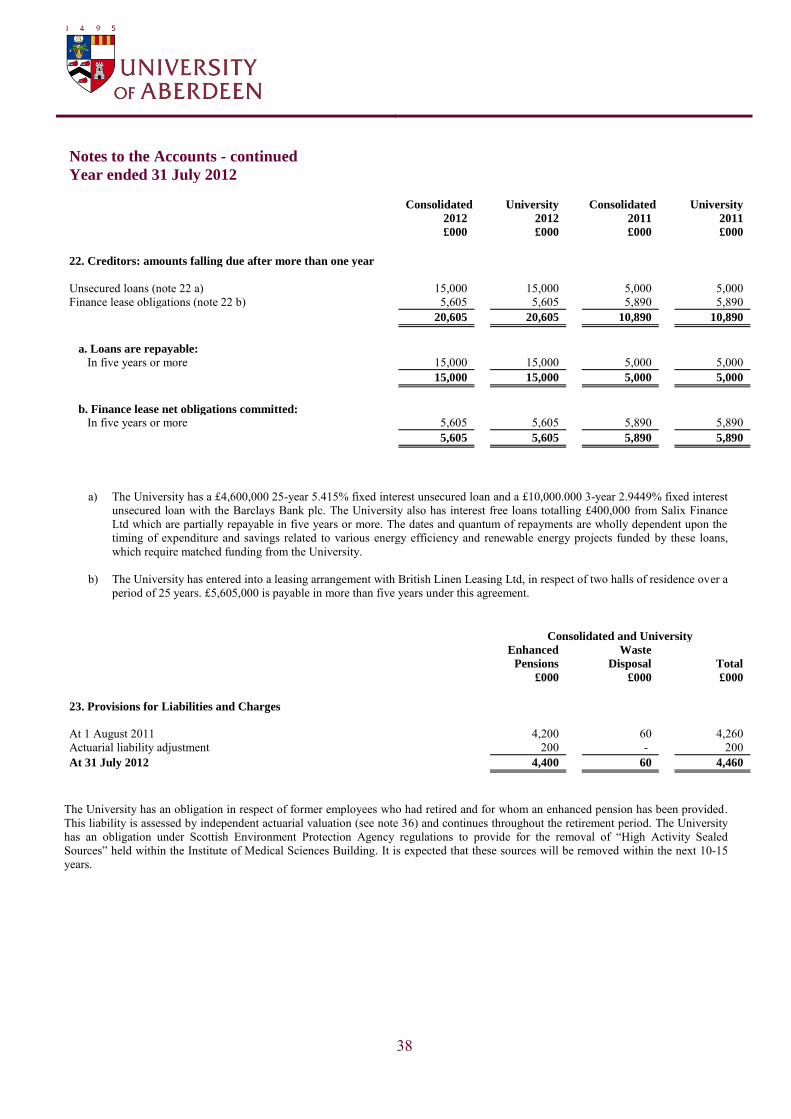
38
Notes to the Accounts - continued
Year ended 31 July 2012
Consolidated University Consolidated University
2012 2012 2011 2011
£000 £000 £000 £000
22. Creditors: amounts falling due after more than one year
Unsecured loans (note 22 a) 15,000 15,000 5,000 5,000 Finance lease obligations (note 22 b) 5,605 5,605 5,890 5,890
20,605 20,605 10,890 10,890
a. Loans are repayable: In five years or more 15,000 15,000 5,000 5,000
15,000 15,000 5,000 5,000
b. Finance lease net obligations committed: In five years or more 5,605 5,605 5,890 5,890
5,605 5,605 5,890 5,890
a) The University has a £4,600,000 25-year 5.415% fixed interest unsecured loan and a £10,000.000 3-year 2.9449% fixed interest unsecured loan with the Barclays Bank plc. The University also has interest free loans totalling £400,000 from Salix Finance Ltd which are partially repayable in five years or more. The dates and quantum of repayments are wholly dependent upon the timing of expenditure and savings related to various energy efficiency and renewable energy projects funded by these loans, which require matched funding from the University.
b) The University has entered into a leasing arrangement with British Linen Leasing Ltd, in respect of two halls of residence over a period of 25 years. £5,605,000 is payable in more than five years under this agreement.
Consolidated and University
Enhanced Waste
Pensions Disposal Total
£000 £000 £000
23. Provisions for Liabilities and Charges
At 1 August 2011 4,200 60 4,260 Actuarial liability adjustment 200 - 200 At 31 July 2012 4,400 60 4,460
The University has an obligation in respect of former employees who had retired and for whom an enhanced pension has been provided. This liability is assessed by independent actuarial valuation (see note 36) and continues throughout the retirement period. The University has an obligation under Scottish Environment Protection Agency regulations to provide for the removal of “High Activity Sealed
Sources” held within the Institute of Medical Sciences Building. It is expected that these sources will be removed within the next 10-15 years.
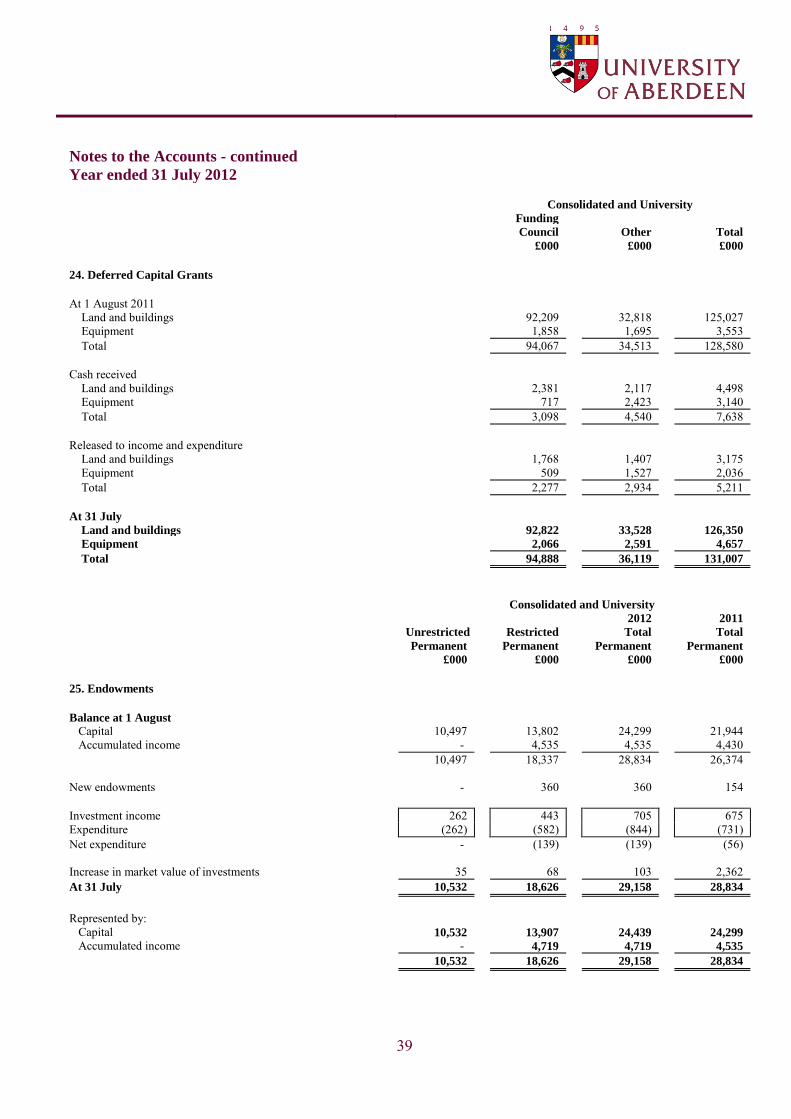
39
Notes to the Accounts - continued
Year ended 31 July 2012 Consolidated and University
Funding
Council Other Total
£000 £000 £000
24. Deferred Capital Grants
At 1 August 2011
Land and buildings 92,209 32,818 125,027 Equipment 1,858 1,695 3,553 Total 94,067 34,513 128,580
Cash received Land and buildings 2,381 2,117 4,498 Equipment 717 2,423 3,140 Total 3,098 4,540 7,638
Released to income and expenditure Land and buildings 1,768 1,407 3,175 Equipment 509 1,527 2,036 Total 2,277 2,934 5,211
At 31 July
Land and buildings 92,822 33,528 126,350
Equipment 2,066 2,591 4,657
Total 94,888 36,119 131,007
Consolidated and University
2012 2011
Unrestricted Restricted Total Total
Permanent Permanent Permanent Permanent
£000 £000 £000 £000
25. Endowments
Balance at 1 August Capital 10,497 13,802 24,299 21,944 Accumulated income - 4,535 4,535 4,430
10,497 18,337 28,834 26,374
New endowments - 360 360 154
Investment income 262 443 705 675 Expenditure (262) (582) (844) (731) Net expenditure - (139) (139) (56)
Increase in market value of investments 35 68 103 2,362 At 31 July 10,532 18,626 29,158 28,834
Represented by: Capital 10,532 13,907 24,439 24,299
Accumulated income - 4,719 4,719 4,535
10,532 18,626 29,158 28,834
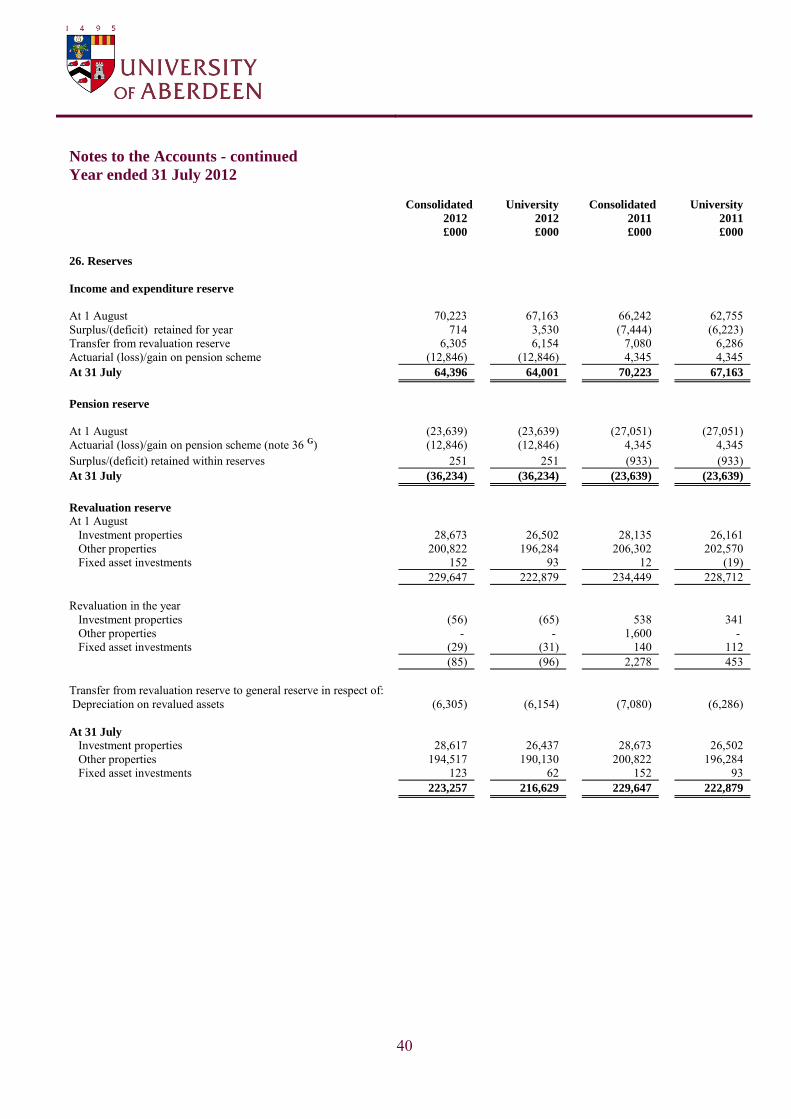
40
Notes to the Accounts - continued
Year ended 31 July 2012
Consolidated University Consolidated University
2012 2012 2011 2011
£000 £000 £000 £000
26. Reserves
Income and expenditure reserve
At 1 August 70,223 67,163 66,242 62,755 Surplus/(deficit) retained for year 714 3,530 (7,444) (6,223) Transfer from revaluation reserve 6,305 6,154 7,080 6,286 Actuarial (loss)/gain on pension scheme (12,846) (12,846) 4,345 4,345 At 31 July 64,396 64,001 70,223 67,163
Pension reserve At 1 August (23,639) (23,639) (27,051) (27,051) Actuarial (loss)/gain on pension scheme (note 36 G) (12,846) (12,846) 4,345 4,345 Surplus/(deficit) retained within reserves 251 251 (933) (933) At 31 July (36,234) (36,234) (23,639) (23,639)
Revaluation reserve At 1 August Investment properties 28,673 26,502 28,135 26,161 Other properties 200,822 196,284 206,302 202,570 Fixed asset investments 152 93 12 (19) 229,647 222,879 234,449 228,712 Revaluation in the year Investment properties (56) (65) 538 341 Other properties - - 1,600 - Fixed asset investments (29) (31) 140 112 (85) (96) 2,278 453 Transfer from revaluation reserve to general reserve in respect of: Depreciation on revalued assets (6,305) (6,154) (7,080) (6,286)
At 31 July Investment properties 28,617 26,437 28,673 26,502 Other properties 194,517 190,130 200,822 196,284 Fixed asset investments 123 62 152 93
223,257 216,629 229,647 222,879
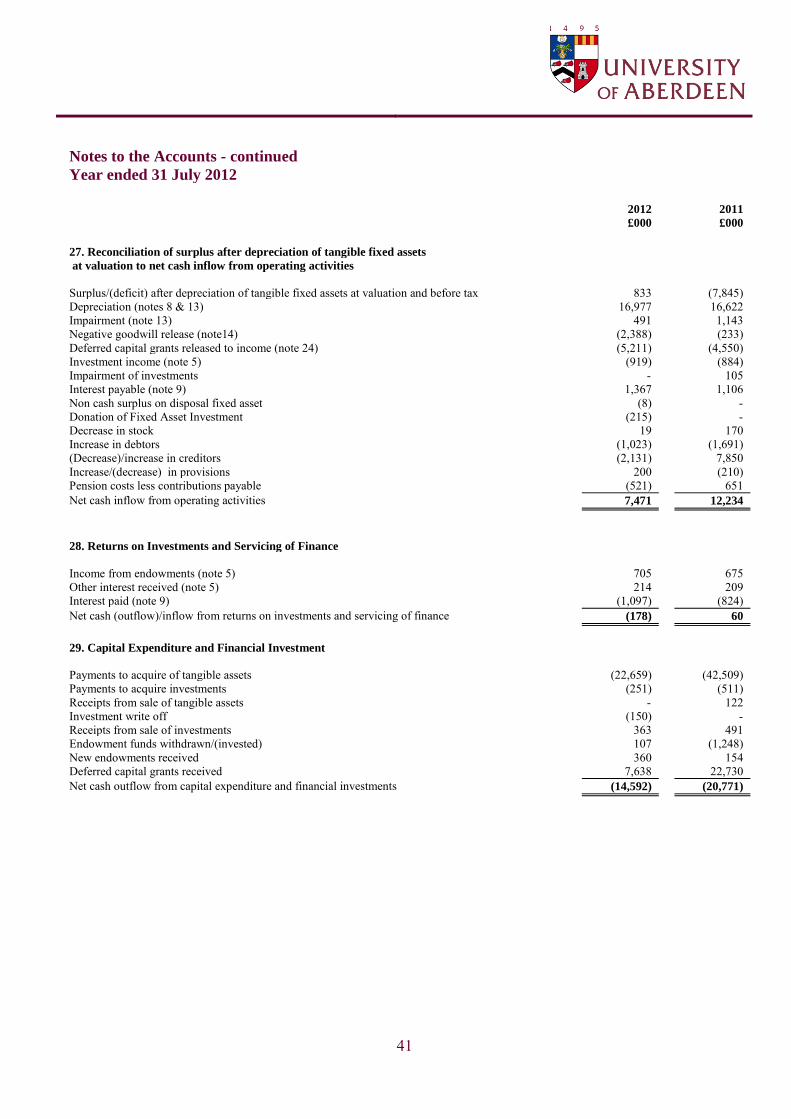
41
Notes to the Accounts - continued
Year ended 31 July 2012
2012 2011
£000 £000
27. Reconciliation of surplus after depreciation of tangible fixed assets at valuation to net cash inflow from operating activities Surplus/(deficit) after depreciation of tangible fixed assets at valuation and before tax 833 (7,845) Depreciation (notes 8 & 13) 16,977 16,622 Impairment (note 13) 491 1,143 Negative goodwill release (note14) (2,388) (233) Deferred capital grants released to income (note 24) (5,211) (4,550) Investment income (note 5) (919) (884) Impairment of investments - 105 Interest payable (note 9) 1,367 1,106 Non cash surplus on disposal fixed asset (8) - Donation of Fixed Asset Investment (215) - Decrease in stock 19 170 Increase in debtors (1,023) (1,691) (Decrease)/increase in creditors (2,131) 7,850 Increase/(decrease) in provisions 200 (210) Pension costs less contributions payable (521) 651 Net cash inflow from operating activities 7,471 12,234
28. Returns on Investments and Servicing of Finance Income from endowments (note 5) 705 675 Other interest received (note 5) 214 209 Interest paid (note 9) (1,097) (824) Net cash (outflow)/inflow from returns on investments and servicing of finance (178) 60
29. Capital Expenditure and Financial Investment Payments to acquire of tangible assets (22,659) (42,509) Payments to acquire investments (251) (511) Receipts from sale of tangible assets - 122 Investment write off (150) - Receipts from sale of investments 363 491 Endowment funds withdrawn/(invested) 107 (1,248) New endowments received 360 154 Deferred capital grants received 7,638 22,730 Net cash outflow from capital expenditure and financial investments (14,592) (20,771)
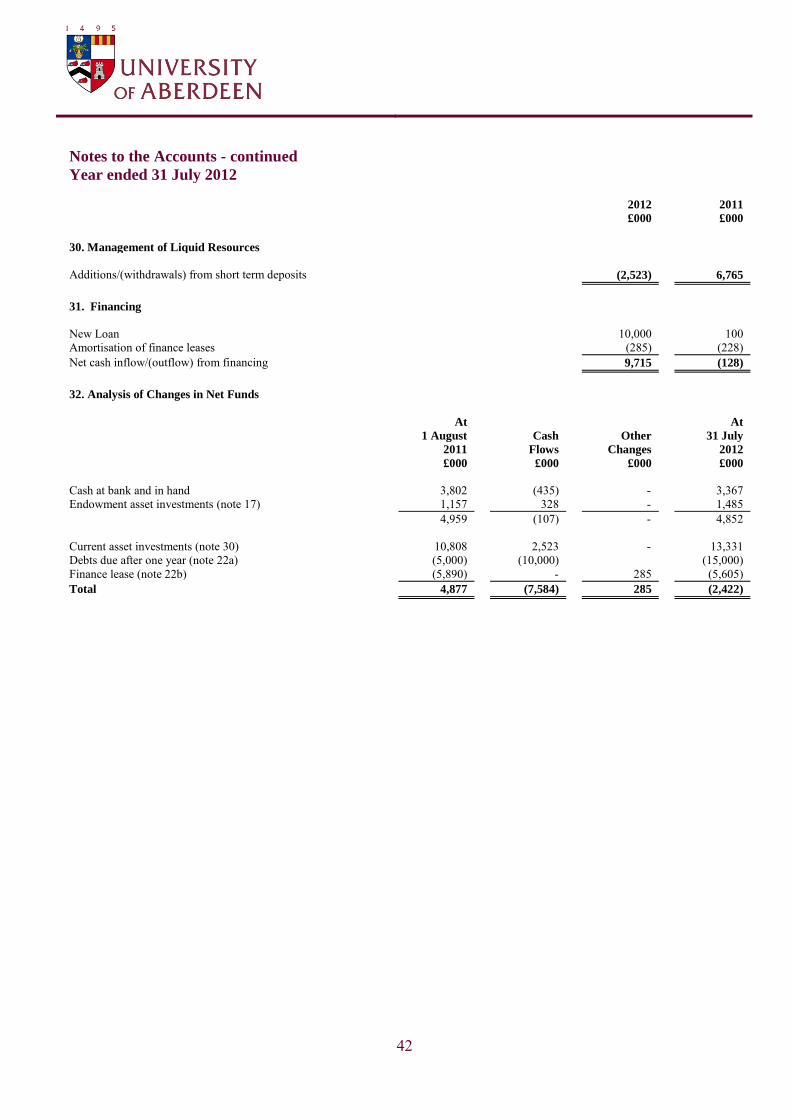
42
Notes to the Accounts - continued
Year ended 31 July 2012
2012 2011
£000 £000
30. Management of Liquid Resources Additions/(withdrawals) from short term deposits (2,523) 6,765
31. Financing New Loan 10,000 100 Amortisation of finance leases (285) (228) Net cash inflow/(outflow) from financing 9,715 (128)
32. Analysis of Changes in Net Funds At At
1 August Cash Other 31 July
2011 Flows Changes 2012
£000 £000 £000 £000
Cash at bank and in hand 3,802 (435) - 3,367 Endowment asset investments (note 17) 1,157 328 - 1,485
4,959 (107) - 4,852
Current asset investments (note 30) 10,808 2,523 - 13,331 Debts due after one year (note 22a) (5,000) (10,000) (15,000) Finance lease (note 22b) (5,890) - 285 (5,605) Total 4,877 (7,584) 285 (2,422)
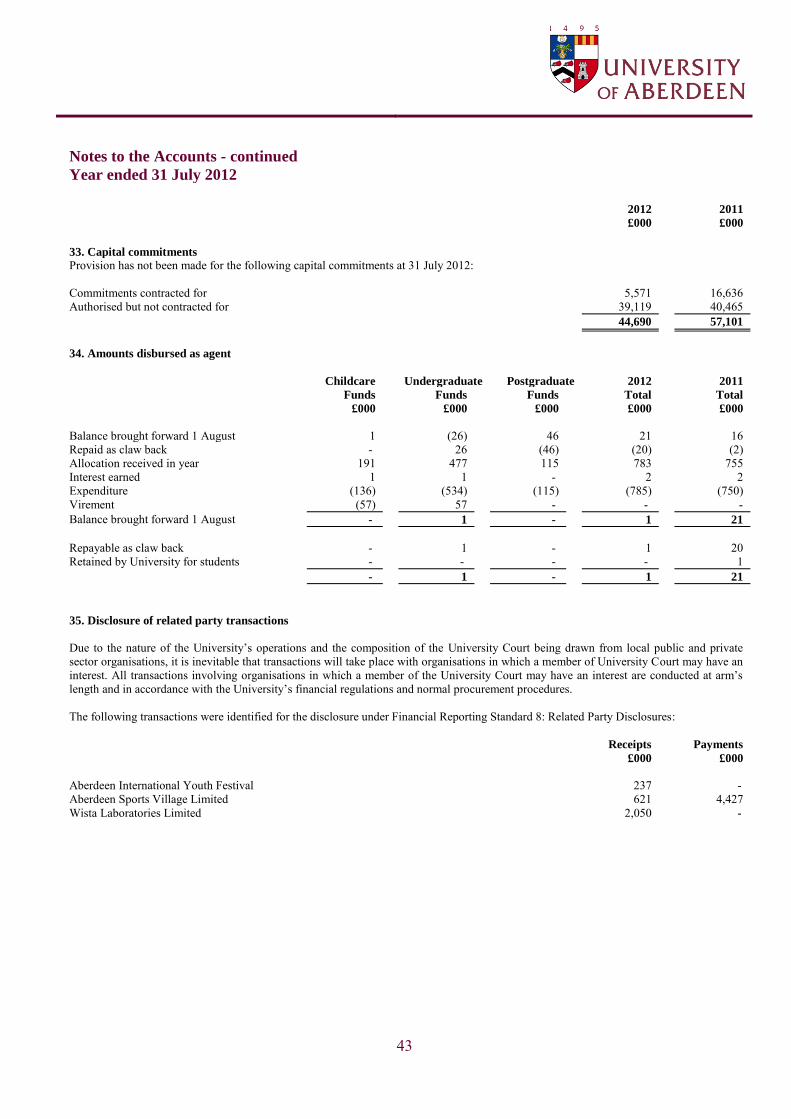
43
Notes to the Accounts - continued
Year ended 31 July 2012
2012 2011
£000 £000
33. Capital commitments
Provision has not been made for the following capital commitments at 31 July 2012:
Commitments contracted for 5,571 16,636 Authorised but not contracted for 39,119 40,465
44,690 57,101
34. Amounts disbursed as agent
Childcare Undergraduate Postgraduate 2012 2011
Funds Funds Funds Total Total
£000 £000 £000 £000 £000
Balance brought forward 1 August 1 (26) 46 21 16 Repaid as claw back - 26 (46) (20) (2) Allocation received in year 191 477 115 783 755 Interest earned 1 1 - 2 2 Expenditure (136) (534) (115) (785) (750) Virement (57) 57 - - - Balance brought forward 1 August - 1 - 1 21
Repayable as claw back - 1 - 1 20 Retained by University for students - - - - 1
- 1 - 1 21
35. Disclosure of related party transactions
Due to the nature of the University‟s operations and the composition of the University Court being drawn from local public and private sector organisations, it is inevitable that transactions will take place with organisations in which a member of University Court may have an interest. All transactions involving organisations in which a member of the University Court may have an interest are conducted at arm‟s
length and in accordance with the University‟s financial regulations and normal procurement procedures.
The following transactions were identified for the disclosure under Financial Reporting Standard 8: Related Party Disclosures:
Receipts Payments
£000 £000
Aberdeen International Youth Festival 237 - Aberdeen Sports Village Limited 621 4,427 Wista Laboratories Limited 2,050 -
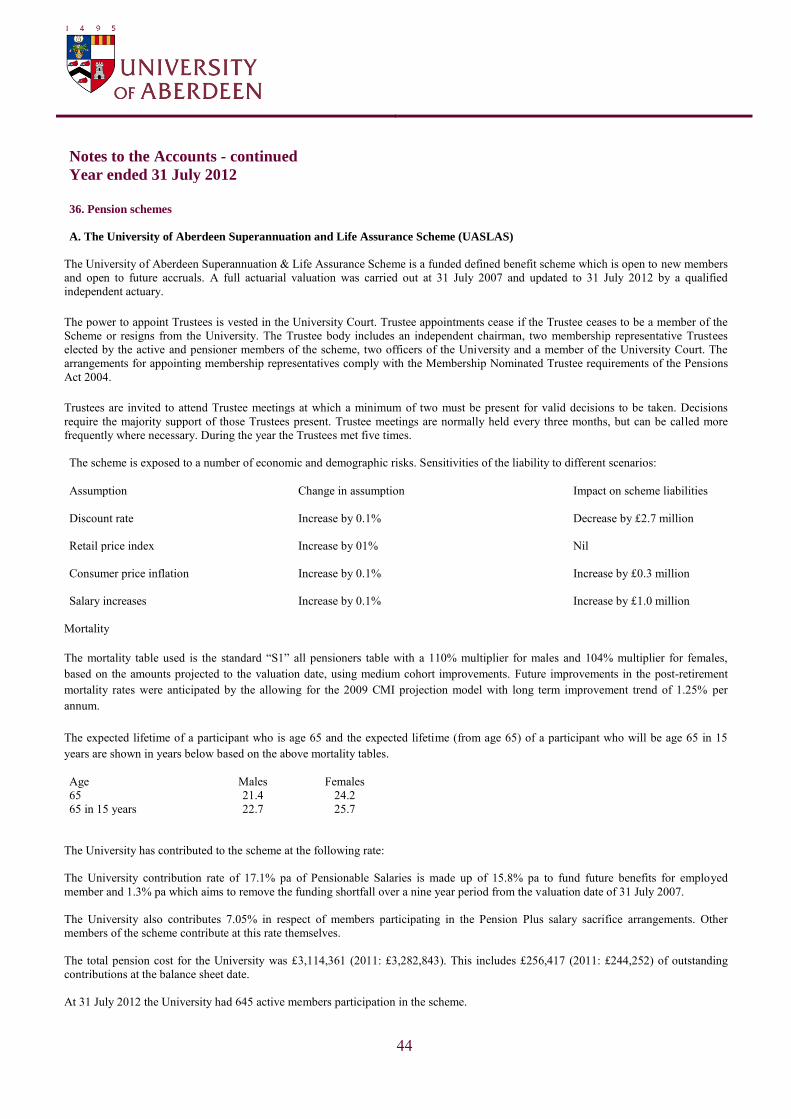
44
Notes to the Accounts - continued
Year ended 31 July 2012
36. Pension schemes
A. The University of Aberdeen Superannuation and Life Assurance Scheme (UASLAS)
The University of Aberdeen Superannuation & Life Assurance Scheme is a funded defined benefit scheme which is open to new members and open to future accruals. A full actuarial valuation was carried out at 31 July 2007 and updated to 31 July 2012 by a qualified independent actuary. The power to appoint Trustees is vested in the University Court. Trustee appointments cease if the Trustee ceases to be a member of the Scheme or resigns from the University. The Trustee body includes an independent chairman, two membership representative Trustees elected by the active and pensioner members of the scheme, two officers of the University and a member of the University Court. The arrangements for appointing membership representatives comply with the Membership Nominated Trustee requirements of the Pensions Act 2004. Trustees are invited to attend Trustee meetings at which a minimum of two must be present for valid decisions to be taken. Decisions require the majority support of those Trustees present. Trustee meetings are normally held every three months, but can be called more frequently where necessary. During the year the Trustees met five times.
The scheme is exposed to a number of economic and demographic risks. Sensitivities of the liability to different scenarios:
Assumption Change in assumption Impact on scheme liabilities Discount rate Increase by 0.1% Decrease by £2.7 million Retail price index Increase by 01% Nil Consumer price inflation Increase by 0.1% Increase by £0.3 million Salary increases Increase by 0.1% Increase by £1.0 million
Mortality The mortality table used is the standard “S1” all pensioners table with a 110% multiplier for males and 104% multiplier for females, based on the amounts projected to the valuation date, using medium cohort improvements. Future improvements in the post-retirement mortality rates were anticipated by the allowing for the 2009 CMI projection model with long term improvement trend of 1.25% per annum. The expected lifetime of a participant who is age 65 and the expected lifetime (from age 65) of a participant who will be age 65 in 15 years are shown in years below based on the above mortality tables. Age Males Females 65 21.4 24.2 65 in 15 years 22.7 25.7
The University has contributed to the scheme at the following rate:
The University contribution rate of 17.1% pa of Pensionable Salaries is made up of 15.8% pa to fund future benefits for employed member and 1.3% pa which aims to remove the funding shortfall over a nine year period from the valuation date of 31 July 2007.
The University also contributes 7.05% in respect of members participating in the Pension Plus salary sacrifice arrangements. Other members of the scheme contribute at this rate themselves. The total pension cost for the University was £3,114,361 (2011: £3,282,843). This includes £256,417 (2011: £244,252) of outstanding contributions at the balance sheet date.
At 31 July 2012 the University had 645 active members participation in the scheme.
45
Notes to the Accounts - continued
Year ended 31 July 2012
36. Pension schemes – continued
A. The University of Aberdeen Superannuation and Life Assurance Scheme (UASLAS) - continued
2012 2011
The material assumptions used by the actuary for FRS 17 as at 31 July was:
Liability discount rate 4.30% 5.40% RPI assumption 2.50% 3.40% CPI Price inflation 1.80% 2.40% Rate of increase in salary (1) 3.50% 4.40% CARE in service revaluation 1.80% 2.40% Revaluation of deferred pensions 1.80% 2.40% Increases for pension increases in payment – Final Salary 3.00% 3.50% Increases for pension increases in payment – CARE 1.80% 2.40% Expected return on assets (net of expenses) 4.95% 6.34% (1) Salaries are assumed to increase at 2% per annum until the Scheme year ending 2013.
The assets in the scheme and the expected rate of return were:
Equities 5.90% 7.30% Government bonds 2.50% 3.90% Corporate bonds 3.90% 5.40% Secure pensions 3.90% 5.40% Cash 0.50% 3.40%
46
Notes to the Accounts - continued
Year ended 31 July 2012
36. Pension schemes – continued B. Strathclyde Pension Fund
The Strathclyde Pension Fund (SPF) provides benefits based on a final pensionable salary for employees of local government and some other institutions. It is now possible to identify each institution‟s share of the underlying assets and liabilities of the scheme and hence contributions to the scheme are accounted for as if they were a defined benefit scheme. The last triennial valuation undertaken was at 31 March 2011. The employer‟s contribution rate payable on members‟ pensionable salaries
will be 20.1% from 1 April 2012 until 31 March 2014. The accounting standard FRS 17 is designed to produce a net pension asset or liability calculated according to a prescribed method of valuation. In particular, the discount rate applied to pension scheme liabilities differs from that used in normal actuarial valuations to determine, inter alia, the scheme‟s required funding rate, and generally produce a
higher value for scheme liabilities. The pension costs are determined with the advice of an independent qualified actuary on the basis of triennial valuation using the projected unit method. The total pension cost for the University was £289,107 (2011: £311,996). This includes £18,160 (2011: £12,476) of outstanding contributions at the balance sheet date. At 31 July 2012 the University had 36 active members participation in the scheme. The material assumptions used by the actuary for FRS 17 at 31 July were:
2012 2011
% %
Rate of increase in salaries 4.5 5.0 Rate of increase of pensions 2.2 2.7 Discount rate applied to scheme liabilities 4.1 5.3 Expected return on assets 4.9 6.4
The current mortality assumptions are based on the Fund's VitaCurves with improvements in line with 80% of the Medium Cohort lagged for 10 years and a 1% p.a. underpin for males and a 0.75% p.a. underpin for females for 2011. Based on these assumptions, the average future life expectancies at the age of 65 are:
Males Females
Current pensioners 21.0 years 23.4 years Future pensioners 23.3 years 25.3 years
The assets in the scheme and the expected rate of return were:
2012 2012 2011 2011
Long-term Fund Long-term Fund
return Value return Value
% % % %
Equities 5.5 7,803 5.0 5,502 Bonds 3.3 1,389 2.7 941 Property 3.7 855 5.3 434 Cash 2.8 641 6.4 362 Total market value of assets 10,688 7,239
47
Notes to the Accounts - continued
Year ended 31 July 2012
36. Pension schemes – continued C. Scottish Teachers Superannuation Scheme (STSS)
The STSS is an unfunded defined benefit scheme. Contributions on a “pay-as-you-go” basis are credited to the Exchequer under
arrangements governed by the Superannuation Act 1972. A notional assets value is ascribed to the scheme for the purposes of determining contribution rates. At 31 July 2012 the University had 21 active members participation in the scheme. Under the definitions set out in FRS 17, the STSS is a multi-employer pension scheme. The University of Aberdeen is unable to identify its share of the underlining assets and liabilities of the scheme. Accordingly, the University has taken advantage of the exemption in FRS 17 and has accounted for its contribution as if it were a defined contribution scheme. The scheme is subject to a report by the Government Actuary every five years. The report on the financial position as at 31 March 2012 is not yet available. The following information is available on the scheme: Latest actuarial review 31 March 2005 Actuarial method SCAPE* Gross rate of return 6.5 per cent per annum Rate of return in excess of salary increases 2.0 per cent per annum Rate of return in excess of price increases 3.5 per cent per annum Notional value of assets £18,474 million Value of liabilities £19,310 million Notional deficit £836 million *Superannuation Contributions Adjusted for Past Experiences The rates of contributions to the Scottish Teachers‟ Superannuation Scheme were set at 6.4% for employees and 14.9% for the employer from 1 April 2009. The total pension cost for the University was £231,889 (2011: £311,996). This includes £12,717 (2011: £12,476) of outstanding contributions at the balance sheet date. D. National Health Service Superannuation Scheme (NHSSS)
NHSSS is a multi-employer defined benefit pension scheme. Historically the scheme has operated on the basis that it is responsible only for the cost of the basic benefits payable to members and their dependants, with the cost of pension increases being met by the Exchequer. However, from 1 April 2004, the cost of pension increases has been met by an increase in the employers‟ contribution rate. An actuarial investigation of the scheme was carried out by the Government Actuary‟s Department covering the five year period from 1
April 2009 to 31 March 2004. As a result of this investigation the employers‟ contribution rate has been reduced to 13.5% from its
previous temporary rate of 14% with effect from 1 April 2009. The total pension cost for the University was £46,096 (2011: £48,896). This includes £4,074 (2011: £3,740) of outstanding contributions at the balance sheet date. At 31 July 2012 the University had 5 active members participation in the scheme.
48
Notes to the Accounts - continued
Year ended 31 July 2012 36. Pension schemes – continued
E. Additional Pension Payments
Following the merger with Northern College in 2001 the University is responsible for the payment of enhanced pensions to a number of former employees of the College, most of whom have been granted premature retirement. An actuarial valuation of the liability was carried out as at 1 December 2001, the date of the merger between the University and Northern College. This valuation revealed a liability of £4,596,000, which was incorporated into the accounts of the University at merger. The main assumptions made by the actuary were:
Valuation rate of interest 4.50 Future price inflation 2.25
In accordance with the provision of FRS 17 the actuary also undertook a valuation of the liability as at 31 July 2012: (see Note 23)
2012 2011
£000 £000
Liability on this basis was: 4,400 4,200
2012 2011
% %
The main assumptions made by the actuary were:
Discount rate 4.30 5.40 Pension increases 1.80 2.40
F. The Universities Superannuation Scheme (USS)
The University participates in the Universities Superannuation Scheme (USS), a defined benefit scheme which is contracted out of the State Second Pension (S2P). The assets of the scheme are held in a separate fund administered by the trustee, Universities Superannuation Scheme Limited. The appointment of directors to the board of the trustee is determined by the company‟s Article of Association. Four of
the directors are appointed by Universities UK; three are appointed by the University and College Union, of whom at least one must be a USS pensioner member; and a minimum of two and a maximum of four are co-opted directors appointed by the board. Under the scheme trust deed and rules; the employer contribution rate is determined by the trustee, acting on actuarial advice. The latest actuarial valuation of the scheme was at 31 March 2011. This was the second valuation for USS under the scheme-specific funding regime introduced by the Pensions Act 2004, which requires schemes to adopt a statutory funding objective, which is to have sufficient and appropriate assets to cover their technical provisions. The actuary also carries out regular reviews of the funding level. In particular, he carries out a review of the funding level each year between triennial valuations and details of his estimate of the funding level at 31 March 2012 are also included in this note. The triennial valuation was carried out using the projected unit method. The assumptions which have the most significant effect on the result of the valuation are those relating to the rate of return on investments (i.e. the valuation rate of interest), the rates of increase in salary and pensions and the assumed rates of mortality. The financial assumptions were derived from market yields prevailing at the valuation date. An “inflation risk premium” adjustment was also included by deducting 0.3% from the market-implied inflation on account of the historically high level of inflation implied by government bonds (particularly when compared to the Bank of England‟s
target of 2% for CPI which corresponds broadly to 2.75% for RPI per annum). To calculate the technical provisions, it was assumed that the valuation rate of interest would be 6.1% per annum, salary increases would be 4.4% per annum (with short-term general pay growth at 3.65% per annum and an additional allowance for increases in salaries due to age and promotion reflecting historic scheme experience, with a further cautionary reserve on top for past service liabilities) and pensions would increase by 3.4% per annum for 3 years following the valuation then 2.6% per annum thereafter.
49
Notes to the Accounts - continued
Year ended 31 July 2012
36. Pension schemes – continued
F. The Universities Superannuation Scheme (USS) – continued Standard mortality tables were used as follows: Male members‟ mortality S1NA [“light”] YoB tables – No age rating Female members‟ mortality S1NA [“light”] YoB tables – rated down 1 year Use of these mortality tables reasonably reflects the actual USS experience but also provides an element of conservatism to allow for further improvements in mortality rates, the CMI 2009 projections with a 1.25% pa long term rate were also adopted. The assumed life expectations on retirement at age 65 are: Males (females) currently aged 65 23.7 (25.6) years Males (females) currently aged 45 25.5 (27.6) years At the valuation date, the value of the assets of the scheme was £32.4 billion and the value of the scheme‟s technical provision was £35.3 billion indicating a shortfall of £2.9 billion. The assets therefore were sufficient to cover 92% of the benefit which had accrued to members after allowing for expected future increases in earnings. The actuary also valued the scheme on a number of other bases as at the valuation date. On the scheme‟s historic gilts basis, using a valuation rate of interest in respect of past service liabilities of 4.4% per annum (the expected return on gilts) the funding level was approximately 68% Under the Pension Protection Fund regulations introduced by the Pension Act 2004, the scheme was 93% funded on a buy-out basis (ie assuming the Scheme had discounted on the valuation date) the assets would have been approximately 57% of the amount necessary to secure all the USS benefits with an insurance company; and using the FRS 17 formula as if USS was a single employer scheme, using a AA bond discount rate of 5.5% per annum based on spot yields, the actuary estimated that the funding level at 31 March 2011 was 82%. As part of this valuation, the trustees have determined, after consultation with the employers, a recovery plan to pay off the shortfall by 31 March 2021. The next formal triennial actuarial valuation is as at 31 March 2014. If experience up to that date is in line with the assumptions made for this current actuarial valuation and contributions are paid at the determined rates or amounts, the shortfall at 31 March 2014 is estimated to be £2.2 billion, equivalent to a funding level of 95%. The contribution rate will be reviewed as part of each valuation and may be reviewed more frequently. The technical provisions relate essentially to the past service liabilities and funding levels, but it is also necessary to assess the ongoing cost of newly accruing benefits. The cost of future accrual was calculated using the same assumptions as those used to calculate the technical provisions but the allowance for promotional salary increases was not as high. Analysis has shown very variable levels of growth over and above general pay increases in recent years, and the salary growth assumption built into the cost of future accrual is based on more stable, historic, salary experience. However, when calculating the past service liabilities of the scheme, a cautionary reserve has been included, in addition, on account of the variability mentioned above. As at the valuation date the Scheme was still a fully Final Salary Scheme for future accruals and the prevailing employer contribution rate was 16% of Salaries. Following UK government legislation, from 2011 statutory pension increases or revaluations are based on the Consumer Prices Index measure of price inflation. Historically these increases had been based on the Retail Prices Index measure of price inflation.
50
Notes to the Accounts - continued
Year ended 31 July 2012
36. Pension schemes – continued
F. The Universities Superannuation Scheme (USS) – continued Since the previous valuation as at 31 March 2008 there have been a number of changes to the benefits provided by the scheme although these became effective from October 2011. These include:
New Entrants
Other than in specific, limited circumstances, new entrants are now provided on a Career Revalued Benefits (CRB) basis rather than a Final Salary (FS) basis.
Normal pension age
The Normal pension age was increased for future service and new entrants, to age 65.
Flexible Retirement
Flexible retirement options were introduced. Member contributions increased Contributions were uplifted to 7.5% p.a. and 6.5% p.a. for FS Section members and CRB Section members respectively. Cost sharing
If the total contribution level exceeds 23.5% of Salaries per annum, the employers will pay 65% of the excess over 23.5% and members would pay the remaining 35% to the fund as additional contributions.
Pension increase cap
For service derived after 30 September 2011, USS will match increases in official pensions for the first 5%. If official pensions increase by more than 5% then USS will pay half of the difference up to a maximum increase of 10%.
Since 31 March 2011 global investment markets have continued to fluctuate and following its peak in September 2011 inflation has declined rapidly towards the year end, although the market‟s assessment of inflation has remained reasonably constant. The actuary has estimated that the funding level as at 31 March 2012 under the scheme specific funding regime had fallen from 92% to 77%. This estimate is based on the results from the valuation at 31 March 2011 allowing primarily for investment returns and changes to market conditions. These are cited as the two most significant factors affecting the funding positions which have been taken into account for the 31 March 2012 estimation. On the FRS17 basis, using an AA bond discount rate of 4.9% per annum based on spot yields, the actuary calculated that the funding level at 31 March 2012 was 74%. An estimate of the funding level measured on a historic gilts basis at that date was approximately 56%.
Surpluses or deficits which arise at future valuations may impact on the institution‟s future contribution commitment. A deficit may
require additional funding in the form of higher contribution requirements, where a surplus could, perhaps, be used to similarly reduce contribution requirements. The sensitivities regarding the principal assumptions used to measure the scheme liabilities on a technical provisions basis as at the date of the last triennial actuarial valuation are set out below: Assumption Change in assumption Impact on scheme liabilities
Investment return Decrease by 0.25% Increase by £1.6 billion The gap between RPI and CPI Decrease by 0.25% Increase by £1 billion Rate of salary growth Increase by 0.25% Increase by £0.6 billion Members live longer than assumed
1 year longer Increase by £0.8 billion
Equity markets in isolation Fall by 25% Increase by £4.6 billion
51
Notes to the Accounts - continued
Year ended 31 July 2012
36. Pension schemes – continued
F. The Universities Superannuation Scheme (USS) – continued USS is a “last man standing” scheme so that in the event of the insolvency of any of the participating employers in USS, the amount of any pension funding shortfall (which cannot otherwise be recovered) in respect of that employer will be spread across the remaining participant employers and reflected in the next actuarial valuation of the scheme. The trustee believes that over the long-term equity investment and investment in selected alternative asset classes will provide superior returns to other investment classes. The management structure and targets set are designed to give the fund a major exposure to equities through portfolios that are diversified both geographically and by sector. The trustee recognises that it would be theoretically possible to select investments producing income flows broadly similar to the estimated liability cash flows. However, in order to meet the long-term funding objective within a level of contributions that it considers the employers would be willing to make, the trustee needs to take on a degree of investment risk relative to the liabilities. This taking of investment risk seeks to target a greater return than the matching assets would provide whilst maintaining a prudent approach to meeting the fund‟s liabilities. Before deciding what degree of investment risk to take relative to the liabilities, the trustee receives advice from its internal investment team, its investment consultant and the scheme actuary, and considers the views of the employers. The strong positive cash flow of the scheme means that it is not necessary to realise investments to meet liabilities. The trustee believes that this, together with the ongoing flow of new entrants into the scheme and the strength of covenant of the employers enables it to take a long-term view of its investments. Short-term volatility of returns can be tolerated and need not feed through directly to the contribution rate although the trustee is mindful of the desirability of keeping the funding level on the scheme‟s technical provisions close to or above 100% thereby minimizing the risk of the introduction of deficit contributions. The actuary has confirmed that the scheme‟s cash flow is likely to remain positive for the next ten years or more. At 31 March 2012 USS had over 145,000 active members and the University had 1,872 active members participating in the scheme. At 31 July 2012 the University had 1,867 active members participation in the scheme. The total pension cost for the University was £18,416,696 (2011 £19,282,213). This includes £1,530,939 (2011: £1,493,666) of outstanding contributions at the balance sheet date. The contribution rate payable by the University was 16% of pensionable salaries.
52
Notes to the Accounts - continued
Year ended 31 July 2012 36. Pension schemes – continued
G. FRS 17 combined disclosures 2012 2011
£000 £000
The following amounts were measured in accordance with the requirements of FRS 17 in respect of UASLAS and SPF and have been recognised in these financial statements.
Analysis of amount debited(credited) to staff costs: Employer contributions (3,403) (3,549) Employer service cost 2,882 4,177
(521) 628 Past service cost - 23 Credited to staff costs (521) 651
Analysis of amount that is debited/(credited) to other interest/(finance income): Expected return on pension scheme assets (6,148) (5,858) Interest on pension liabilities 6,418 6,140 Debited to other interest 270 282
Analysis of amount recognised in statement of total recognised gains and losses (STRGL): Actual return less expected return on scheme assets 2,548 3,801 Experience (losses)/gains on liabilities (5,294) 4,564 Changes in assumptions (10,100) (4,020) Total (loss)/gain recognised via STRGL during year (12,846) 4,345
Analysis of amount shown in the balance sheet: Actuarial value of scheme liabilities (140,951) (121,243) Fair value of assets 104,717 97,604 Defined benefit liability at end of year (36,234) (23,639)
Reconciliation to the balance sheet: Defined benefit liability at end of previous year (23,639) (27,051) Net benefit expense for year: Employer service cost (2,882) (4,177) Past service cost - (23) Net return on assets (270) (282) Net benefit (3,152) (4,482) Employer contributions 3,403 3,549 (Loss)/gain recognised via the STRGL (12,846) 4,345 Defined benefit liability at end of year (36,234) (23,639)
Change in actuarial value of scheme liabilities: Scheme liabilities at prior year end 121,243 115,935 Employer service cost 2,882 4,177 Interest cost 6,418 6,140 Scheme participants contributions 84 77 Actuarial gain/(loss) 15,394 (544) Benefits paid from scheme assets (5,070) (4,565) Scheme past service costs loss - 23 Scheme liabilities at current year end 140,951 121,243
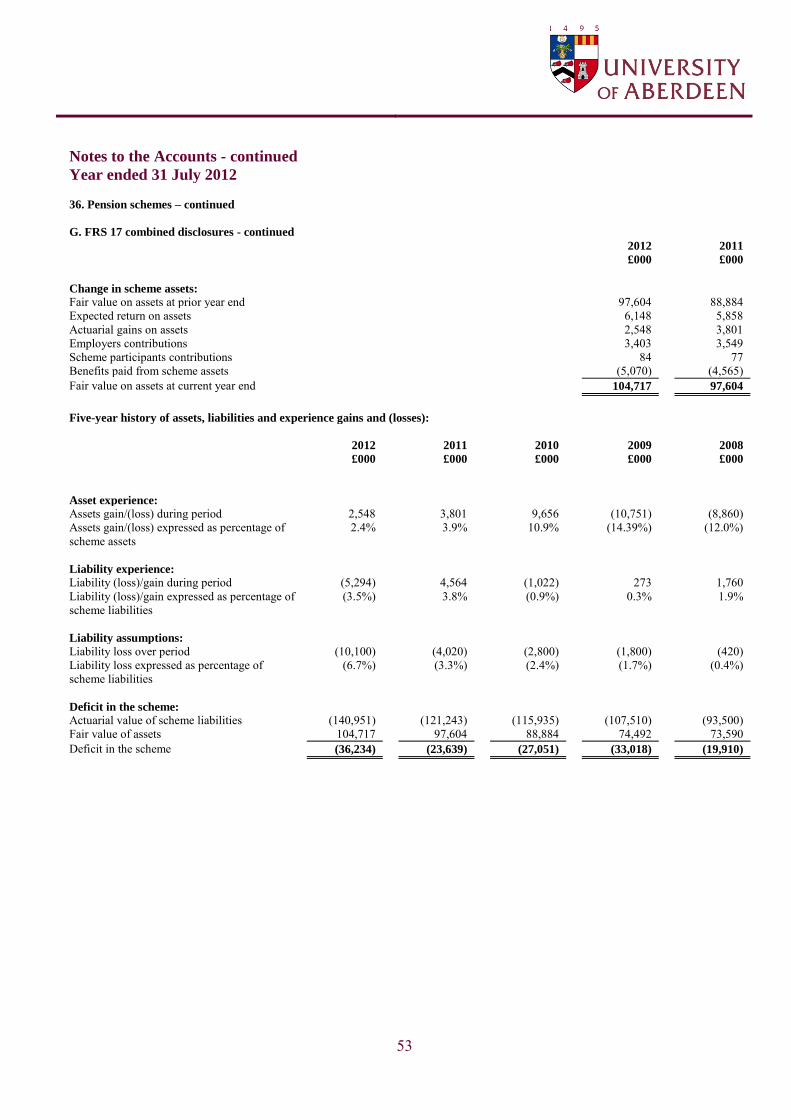
53
Notes to the Accounts - continued
Year ended 31 July 2012 36. Pension schemes – continued
G. FRS 17 combined disclosures - continued 2012 2011
£000 £000
Change in scheme assets: Fair value on assets at prior year end 97,604 88,884 Expected return on assets 6,148 5,858 Actuarial gains on assets 2,548 3,801 Employers contributions 3,403 3,549 Scheme participants contributions 84 77 Benefits paid from scheme assets (5,070) (4,565) Fair value on assets at current year end 104,717 97,604
Five-year history of assets, liabilities and experience gains and (losses): 2012 2011 2010 2009 2008
£000 £000 £000 £000 £000
Asset experience: Assets gain/(loss) during period 2,548 3,801 9,656 (10,751) (8,860) Assets gain/(loss) expressed as percentage of scheme assets
2.4% 3.9% 10.9% (14.39%) (12.0%)
Liability experience: Liability (loss)/gain during period (5,294) 4,564 (1,022) 273 1,760 Liability (loss)/gain expressed as percentage of scheme liabilities
(3.5%) 3.8% (0.9%) 0.3% 1.9%
Liability assumptions: Liability loss over period (10,100) (4,020) (2,800) (1,800) (420) Liability loss expressed as percentage of scheme liabilities
(6.7%) (3.3%) (2.4%) (1.7%) (0.4%)
Deficit in the scheme: Actuarial value of scheme liabilities (140,951) (121,243) (115,935) (107,510) (93,500) Fair value of assets 104,717 97,604 88,884 74,492 73,590 Deficit in the scheme (36,234) (23,639) (27,051) (33,018) (19,910)
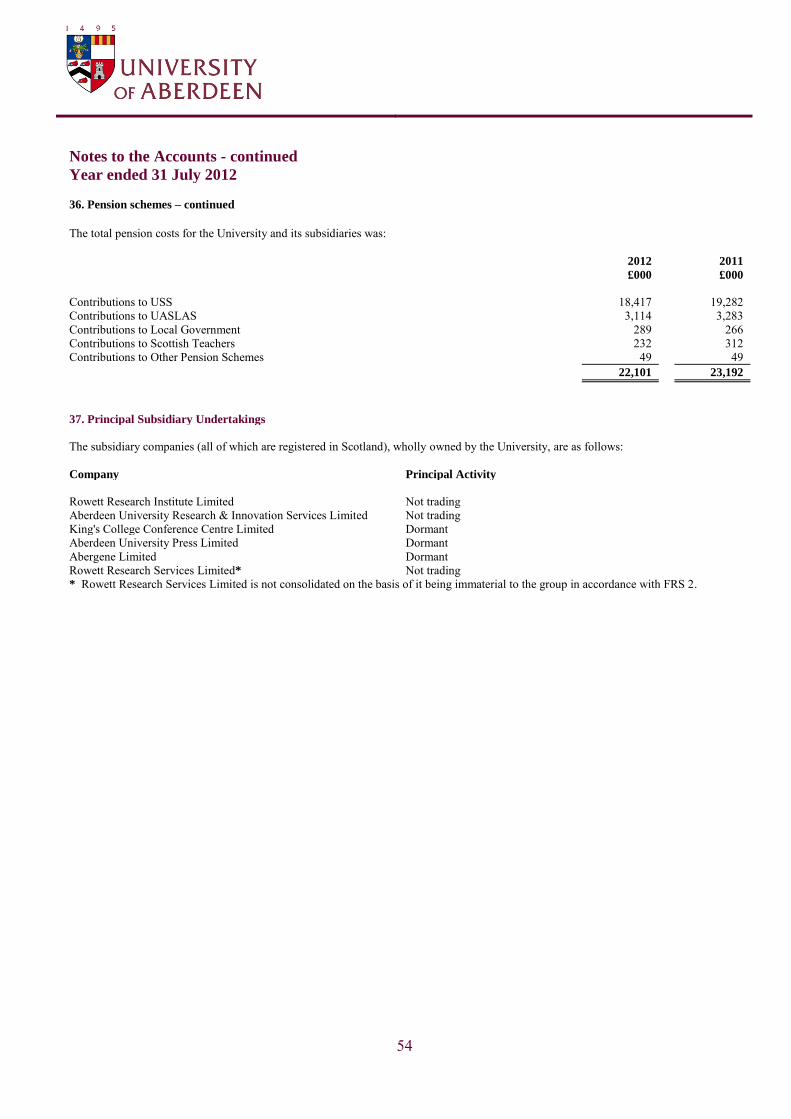
54
Notes to the Accounts - continued
Year ended 31 July 2012
36. Pension schemes – continued The total pension costs for the University and its subsidiaries was:
2012 2011
£000 £000
Contributions to USS 18,417 19,282 Contributions to UASLAS 3,114 3,283 Contributions to Local Government 289 266 Contributions to Scottish Teachers 232 312 Contributions to Other Pension Schemes 49 49
22,101 23,192
37. Principal Subsidiary Undertakings
The subsidiary companies (all of which are registered in Scotland), wholly owned by the University, are as follows:
Company Principal Activity
Rowett Research Institute Limited Not trading
Aberdeen University Research & Innovation Services Limited Not trading
King's College Conference Centre Limited Dormant
Aberdeen University Press Limited Dormant
Abergene Limited Dormant
Rowett Research Services Limited* Not trading
* Rowett Research Services Limited is not consolidated on the basis of it being immaterial to the group in accordance with FRS 2.
55
Notes to the Accounts - continued
Year ended 31 July 2012 38. Principal Advisors Auditor – External KPMG LLP
37 Albyn Place Aberdeen AB10 1JB
Auditor – Internal MAZARS LLP
Donaldson House 97 Haymarket Terrace Edinburgh EH12 5HD
Bankers Bank of Scotland
39 Albyn Place Aberdeen AB10 1YN
Solicitors Pinsent Masons LLP
13 Queen‟s Road Aberdeen AB15 4YL
Taxation Advisors KPMG LLP
37 Albyn Place Aberdeen AB10 1JB
CKR VAT Consultancy Limited
Bellsquarry Livingston West Lothian EH54 9HW
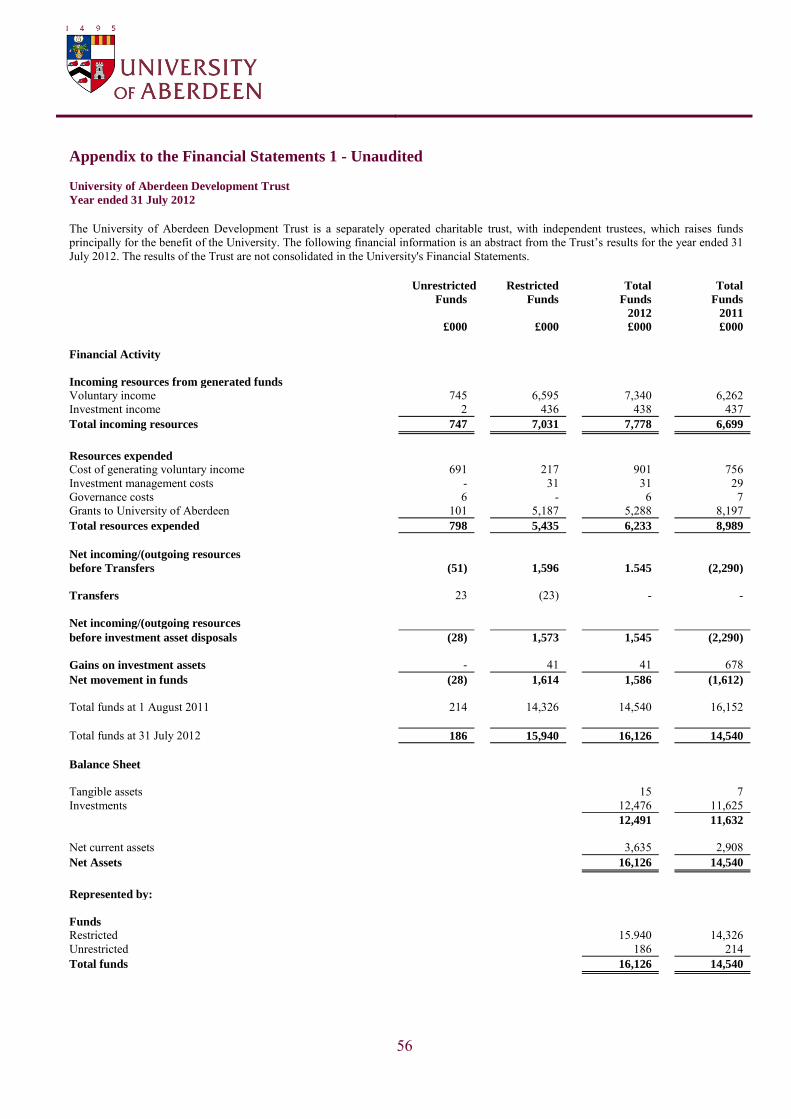
56
Appendix to the Financial Statements 1 - Unaudited
University of Aberdeen Development Trust Year ended 31 July 2012
The University of Aberdeen Development Trust is a separately operated charitable trust, with independent trustees, which raises funds principally for the benefit of the University. The following financial information is an abstract from the Trust‟s results for the year ended 31 July 2012. The results of the Trust are not consolidated in the University's Financial Statements.
Unrestricted Restricted Total Total
Funds Funds Funds Funds
2012 2011
£000 £000 £000 £000
Financial Activity
Incoming resources from generated funds Voluntary income 745 6,595 7,340 6,262 Investment income 2 436 438 437 Total incoming resources 747 7,031 7,778 6,699
Resources expended Cost of generating voluntary income 691 217 901 756 Investment management costs - 31 31 29 Governance costs 6 - 6 7 Grants to University of Aberdeen 101 5,187 5,288 8,197 Total resources expended 798 5,435 6,233 8,989
Net incoming/(outgoing resources before Transfers (51) 1,596 1.545 (2,290)
Transfers 23 (23) - - Net incoming/(outgoing resources before investment asset disposals (28) 1,573 1,545 (2,290)
Gains on investment assets - 41 41 678 Net movement in funds (28) 1,614 1,586 (1,612)
Total funds at 1 August 2011 214 14,326 14,540 16,152
Total funds at 31 July 2012 186 15,940 16,126 14,540
Balance Sheet
Tangible assets 15 7 Investments 12,476 11,625
12,491 11,632
Net current assets 3,635 2,908 Net Assets 16,126 14,540
Represented by:
Funds Restricted 15.940 14,326 Unrestricted 186 214 Total funds 16,126 14,540
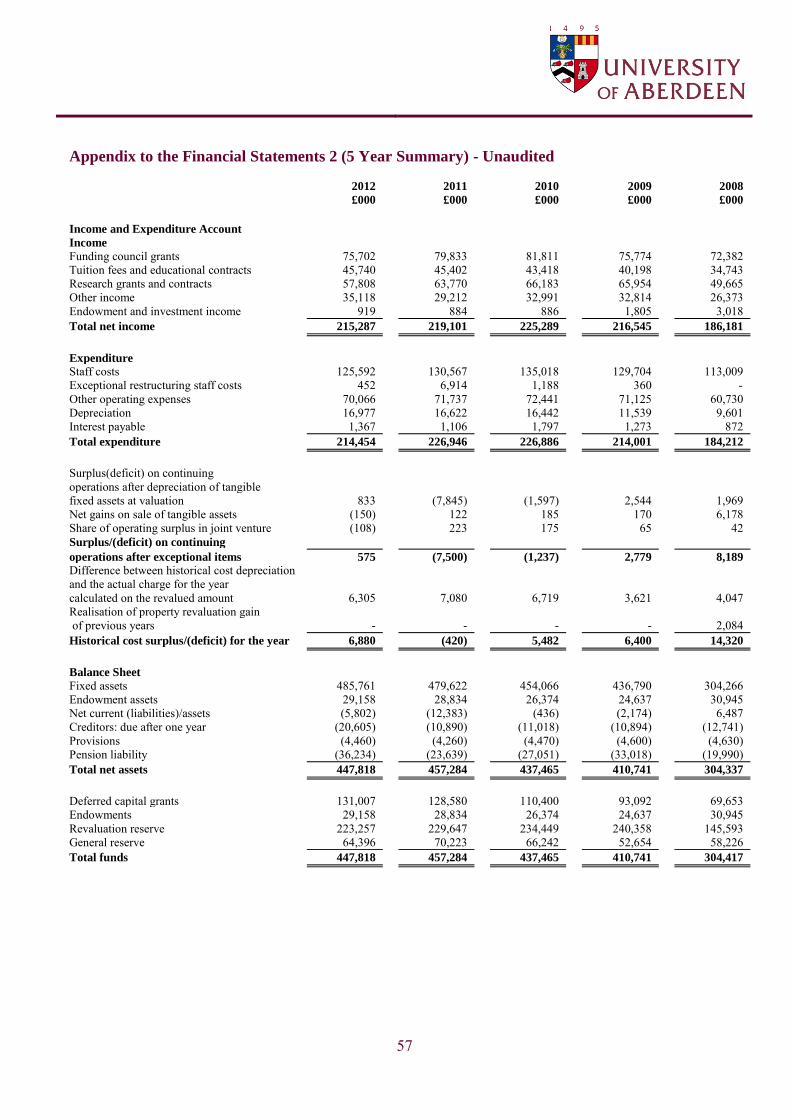
57
Appendix to the Financial Statements 2 (5 Year Summary) - Unaudited
2012 2011 2010 2009 2008
£000 £000 £000 £000 £000
Income and Expenditure Account
Income Funding council grants 75,702 79,833 81,811 75,774 72,382 Tuition fees and educational contracts 45,740 45,402 43,418 40,198 34,743 Research grants and contracts 57,808 63,770 66,183 65,954 49,665 Other income 35,118 29,212 32,991 32,814 26,373 Endowment and investment income 919 884 886 1,805 3,018 Total net income 215,287 219,101 225,289 216,545 186,181
Expenditure Staff costs 125,592 130,567 135,018 129,704 113,009 Exceptional restructuring staff costs 452 6,914 1,188 360 - Other operating expenses 70,066 71,737 72,441 71,125 60,730 Depreciation 16,977 16,622 16,442 11,539 9,601 Interest payable 1,367 1,106 1,797 1,273 872 Total expenditure 214,454 226,946 226,886 214,001 184,212
Surplus(deficit) on continuing operations after depreciation of tangible fixed assets at valuation 833 (7,845) (1,597) 2,544 1,969 Net gains on sale of tangible assets (150) 122 185 170 6,178 Share of operating surplus in joint venture (108) 223 175 65 42 Surplus/(deficit) on continuing operations after exceptional items 575 (7,500) (1,237) 2,779 8,189
Difference between historical cost depreciation and the actual charge for the year calculated on the revalued amount 6,305 7,080 6,719 3,621 4,047 Realisation of property revaluation gain of previous years - - - - 2,084 Historical cost surplus/(deficit) for the year 6,880 (420) 5,482 6,400 14,320
Balance Sheet Fixed assets 485,761 479,622 454,066 436,790 304,266 Endowment assets 29,158 28,834 26,374 24,637 30,945 Net current (liabilities)/assets (5,802) (12,383) (436) (2,174) 6,487 Creditors: due after one year (20,605) (10,890) (11,018) (10,894) (12,741) Provisions (4,460) (4,260) (4,470) (4,600) (4,630) Pension liability (36,234) (23,639) (27,051) (33,018) (19,990) Total net assets 447,818 457,284 437,465 410,741 304,337
Deferred capital grants 131,007 128,580 110,400 93,092 69,653 Endowments 29,158 28,834 26,374 24,637 30,945 Revaluation reserve 223,257 229,647 234,449 240,358 145,593 General reserve 64,396 70,223 66,242 52,654 58,226 Total funds 447,818 457,284 437,465 410,741 304,417
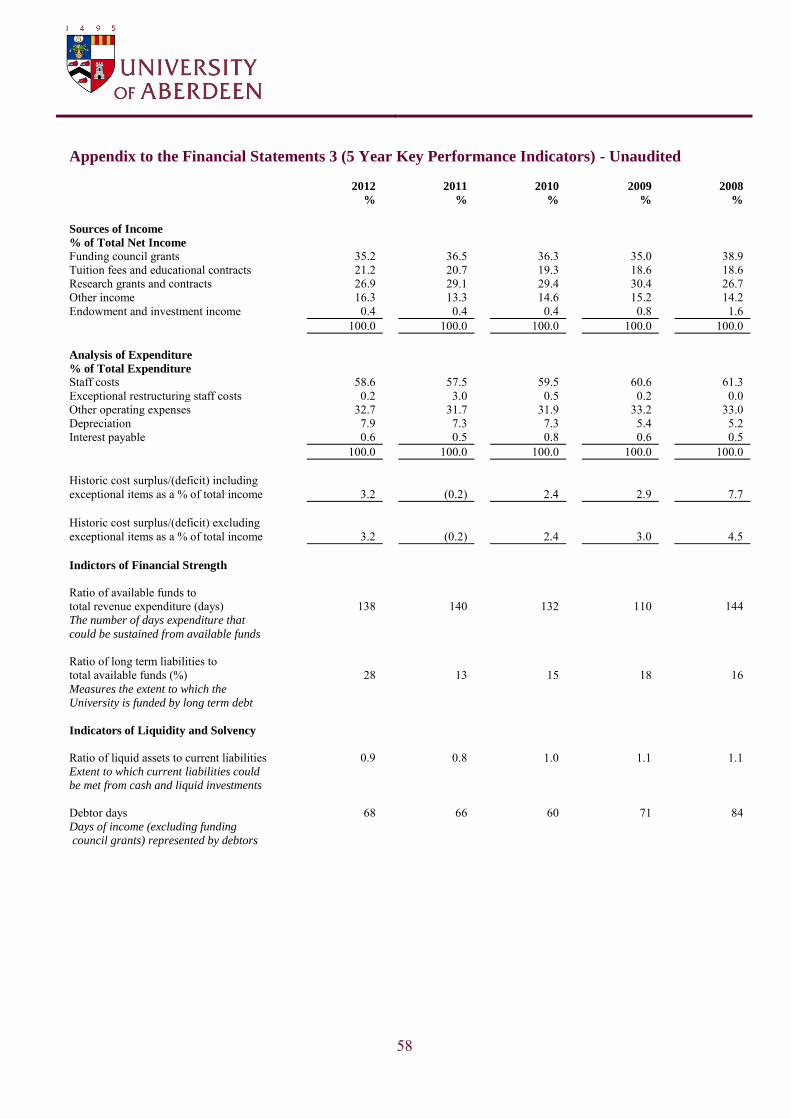
58
Appendix to the Financial Statements 3 (5 Year Key Performance Indicators) - Unaudited
2012 2011 2010 2009 2008
% % % % %
Sources of Income % of Total Net Income Funding council grants 35.2 36.5 36.3 35.0 38.9 Tuition fees and educational contracts 21.2 20.7 19.3 18.6 18.6 Research grants and contracts 26.9 29.1 29.4 30.4 26.7 Other income 16.3 13.3 14.6 15.2 14.2 Endowment and investment income 0.4 0.4 0.4 0.8 1.6
100.0 100.0 100.0 100.0 100.0
Analysis of Expenditure % of Total Expenditure Staff costs 58.6 57.5 59.5 60.6 61.3 Exceptional restructuring staff costs 0.2 3.0 0.5 0.2 0.0 Other operating expenses 32.7 31.7 31.9 33.2 33.0 Depreciation 7.9 7.3 7.3 5.4 5.2 Interest payable 0.6 0.5 0.8 0.6 0.5
100.0 100.0 100.0 100.0 100.0
Historic cost surplus/(deficit) including exceptional items as a % of total income 3.2 (0.2) 2.4 2.9 7.7
Historic cost surplus/(deficit) excluding exceptional items as a % of total income 3.2 (0.2) 2.4 3.0 4.5
Indictors of Financial Strength
Ratio of available funds to total revenue expenditure (days) 138 140 132 110 144 The number of days expenditure that could be sustained from available funds
Ratio of long term liabilities to total available funds (%) 28 13 15 18 16 Measures the extent to which the University is funded by long term debt
Indicators of Liquidity and Solvency
Ratio of liquid assets to current liabilities 0.9 0.8 1.0 1.1 1.1 Extent to which current liabilities could be met from cash and liquid investments
Debtor days 68 66 60 71 84 Days of income (excluding funding council grants) represented by debtors


University of Aberdeen, King’s College, Aberdeen AB24 3FX, Scotland
UNIPRINT, UNIVERSITY OF ABERDEEN Printed using paper and board from Forest Stewardship Council sustainable sources.