Embed Size (px)
Citation preview
A Theory for the Indian Ocean Dipole Mode
Tim Li, Bin Wang, C.-P. Chang*, and Yongsheng Zhang
International Pacific Research Center, University of Hawaii, Honolulu, Hawaii
*Department of Meteorology, Naval Postgraduate School, Monterey, California
(Submitted to J. Atmos. Sci., June 7, 2002)
Corresponding Author: Prof. Tim Li, IPRC and Department of Meteorology, University of Hawaii, 2525 Correa Rd., Honolulu, HI 96822. E-mail: [email protected]
2
Abstract
A conceptual coupled atmosphere-ocean model was constructed to understand the
origin of the Indian Ocean Dipole Mode (IODM). In the model various positive and
negative air-sea feedback processes were involved. Among them were the cloud-radiation-
SST feedback, the evaporation-SST-wind feedback, the thermocline-SST feedback, and
the monsoon-SST feedback. Numerical results indicate that air-sea interactions in the
tropical Indian Ocean support a natural damped mode, which is different from the self-
sustained ENSO mode in the tropical Pacific. The difference arises from the distinctive
characteristics of the basic state of the coupled system in the tropical Indian and Pacific
Oceans. By use of observational analyses and physical reasoning, the authors identified
four fundamental differences between air-sea interactions in the two oceans. The first
difference is represented by the strong contrast of the cloud-SST phase relationship
between the warm pool and cool tongue. The second difference arises from the reversal of
the basic-state zonal wind and east-west tilting of the ocean thermocline, which leads to
distinctive effects of ocean waves on the SST. The third difference lies in the existence of
the Asian monsoon and its negative feedback on the IODM. The fourth difference is that
the southeast Indian Ocean is a region where there exists a positive atmosphere-ocean
thermodynamic feedback.
The phase-locking of the IODM can be, to a large extent, explained by the seasonal
dependence of the aforementioned thermodynamic air-sea feedback. In addition,
anomalous Indian monsoon also plays a role. Although the El Nino exerts the strongest
forcing toward the end of a year, its impact on the anomalous monsoon heating peaks in

3
northern summer. Thus the anomalous monsoon may exert the greatest impact on the
IODM toward the end of boreal summer.
In the presence of realistic ENSO forcing, the model was capable of simulating
most of IODM events during the last 50 years that were associated with ENSO, indicating
that ENSO is one of major forcings that trigger the IODM events. The failure of
simulation of the IODM events in 1961 and 1994 suggests that other types of climate
forcing may also play a role. The authors’ observational analyses revealed that the 1994
event resulted from anomalous heating over Indochina/South China Sea in boreal summer,
whereas the 1961 event might be traced back to the preceding winter when there was
anomalous heating over the maritime continent.

4
1. Introduction
This study is motivated by observational discovery that there is a remarkable SST
dipole (or zonal) mode in the equatorial Indian Ocean (hereafter, IODM) and that this dipole
SST mode might arise from dynamic atmosphere-ocean interactions in the Indian Ocean (IO)
(Saji et al. 1999, Webster et al. 1999). Although the dipole structure has been known for a
while, mostly with modest amplitudes (e.g., Reverdin et al. 1986), the IODM attracted great
public attention in 1997 when it reached extremely high magnitude and was associated with
severe floods in East Africa and droughts over Indonesia. It was suggested that the unusual
Indian monsoon-ENSO relationship in 1997 might result from this abnormal SST condition in
the IO (Ashok et al. 2001).
Fig. 1 Time evolution of the dipole mode index defined as the SSTA difference between the western and eastern Indian Ocean (dark shaded bar) and the zonal wind anomaly (light shaded bar),
adopted from Saji et al. (1999).
Figure 1 shows the temporal evolution of composite SST and zonal wind anomalies
associated with the IODM. The IODM develops rapidly in boreal summer and reaches its
mature phase in October. Thus the first fundamental issue that requires the theoretical
5
understanding is why the phase of the IODM locks into the annual cycle. Similarly, one may
ask why the mature phase of the IODM differs from that of ENSO, which has maximum
amplitude in boreal winter. The second feature one may infer from Fig. 1 is that there is strong
air-sea coupling over the IO, because of close wind-SST relationships. This prompts some
investigators to hypothesize that the similar mechanism as that in ENSO might work in the IO.
However, it is worth noting that the tropical Pacific and IO have remarkable differences in
basic-state wind and SST fields. A theoretical study by Wang and Xie (1998) pointed out that
ocean-atmosphere interactions are fundamentally different in warm and cold oceans. Thus the
second issue we address is what are fundamental differences between air-sea interactions in the
tropical Pacific and Indian Oceans. The third feature in Fig. 1 is that the IODM tends to have a
biennial frequency, that is, the anomalous SST gradient changes the sign from one year to the
following year. What is the physical mechanism responsible for this biennial tendency?
In this study we intend to answer these questions. The rest of this paper is organized as
follows. In section 2, we analyze the fundamental differences between air-sea coupling
processes in the tropical Pacific and Indian Oceans, based on observational analyses and
physical reasoning. We note that air-sea interactions in the two oceans have four distinctive
features. These distinctive features arise primarily from remarkable differences in the basic-
state wind and SST fields. Based on these analyses, in section 3 we construct a conceptual air-
sea coupled model for the IODM. We then discuss the solutions of the model in the presence of
atmosphere-ocean interactions in section 4 and external ENSO and intraseasonal oscillation
(ISO) forcing in section 5. In subsequent sections we further discuss the mechanisms related to
the phase-locking and biennial periodicity, the effect of ocean waves, and the possible causes
of 1994 and 1961 IODM events. A concluding remark is given in the last section.
6
2. Fundamental differences between air-sea interactions in the tropical Pacific and IO
To understand the origin of the IODM, one needs first to understand the similarities
and differences of air-sea coupling processes in the equatorial Pacific and IO. In the following,
by use of observational analyses and physical reasoning, we demonstrate that there are four
major differences between the air-sea interactions in the tropical IO and Pacific.
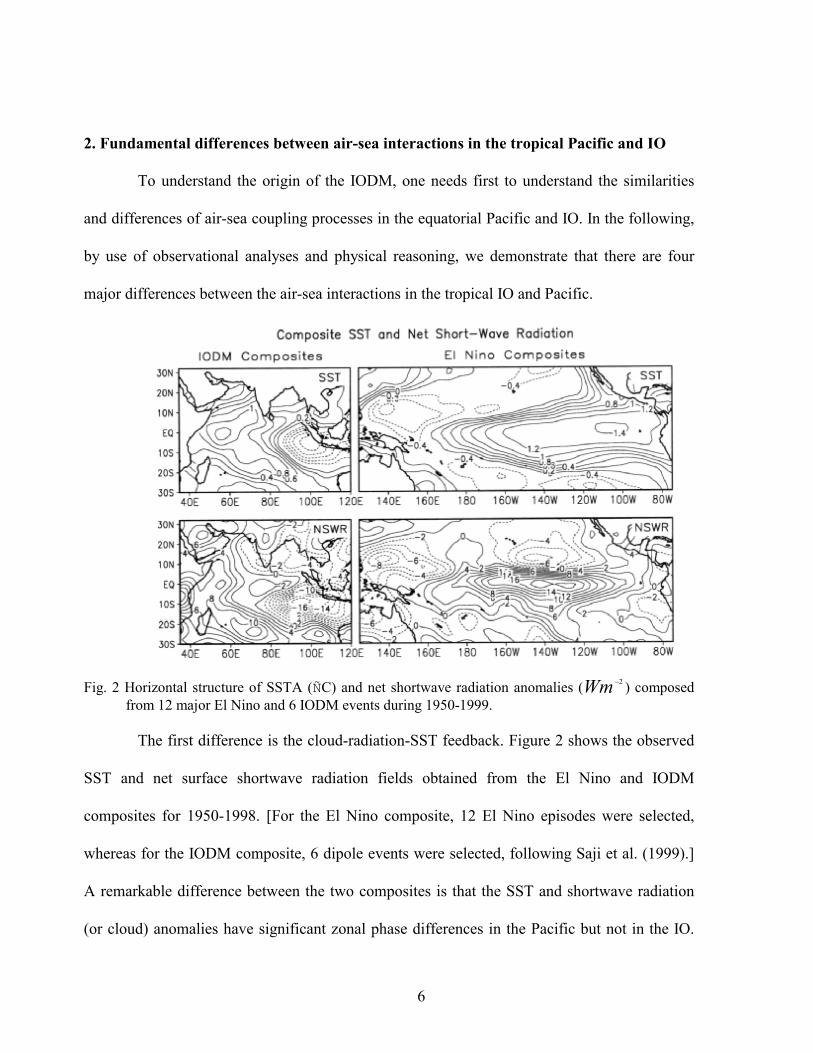
Fig. 2 Horizontal structure of SSTA (°C) and net shortwave radiation anomalies ( 2−Wm ) composed from 12 major El Nino and 6 IODM events during 1950-1999.
The first difference is the cloud-radiation-SST feedback. Figure 2 shows the observed
SST and net surface shortwave radiation fields obtained from the El Nino and IODM
composites for 1950-1998. [For the El Nino composite, 12 El Nino episodes were selected,
whereas for the IODM composite, 6 dipole events were selected, following Saji et al. (1999).]
A remarkable difference between the two composites is that the SST and shortwave radiation
(or cloud) anomalies have significant zonal phase differences in the Pacific but not in the IO.

7
The differences arise from the distinctive atmospheric responses to a SST anomaly (SSTA) in
the warm pool and cold tongue. In general, atmospheric deep convection is triggered in the
region where SST is above 26.5°C. This is why anomalous convection associated with El Nino
is often observed in the central equatorial Pacific even though the maximum SSTA appears in
the eastern Pacific. Because of this phase difference, the reduction of the downward shortwave
radiation due to the deep convection cannot efficiently damp the El Nino. In warm oceans, on
the other hand, a modest SSTA may induce deep convection in situ, so that the anomalous SST
and clouds are generally in phase. The increased clouds tend to reduce the downward
shortwave radiation and thus decrease the SST, leading to a negative feedback between the
atmosphere and ocean.
The strength of the cloud-radiation-SST feedback may be estimated in the warm ocean
based on a linear Newtonian damping formula:
hcQTD
W
SWSW ρ
−= ,
where SWD is the Newtonian cooling coefficient representing the strength of the negative
feedback, and h is the mean depth of the oceanic mixed layer. According to the composite SST-
radiation relationship in the IO, the SSTA amplitude of 0.5°C corresponds to the net shortwave
radiation anomaly of 10 2−Wm . Thus for given a mixed layer depth of 50 m, one may calculate
SWD , which corresponds to a reversed damping time scale of 100 days. Such a strong damping
implies that SST variability in warm oceans is in general small unless there is a strong positive
air-sea feedback or persistent external forcing.
8
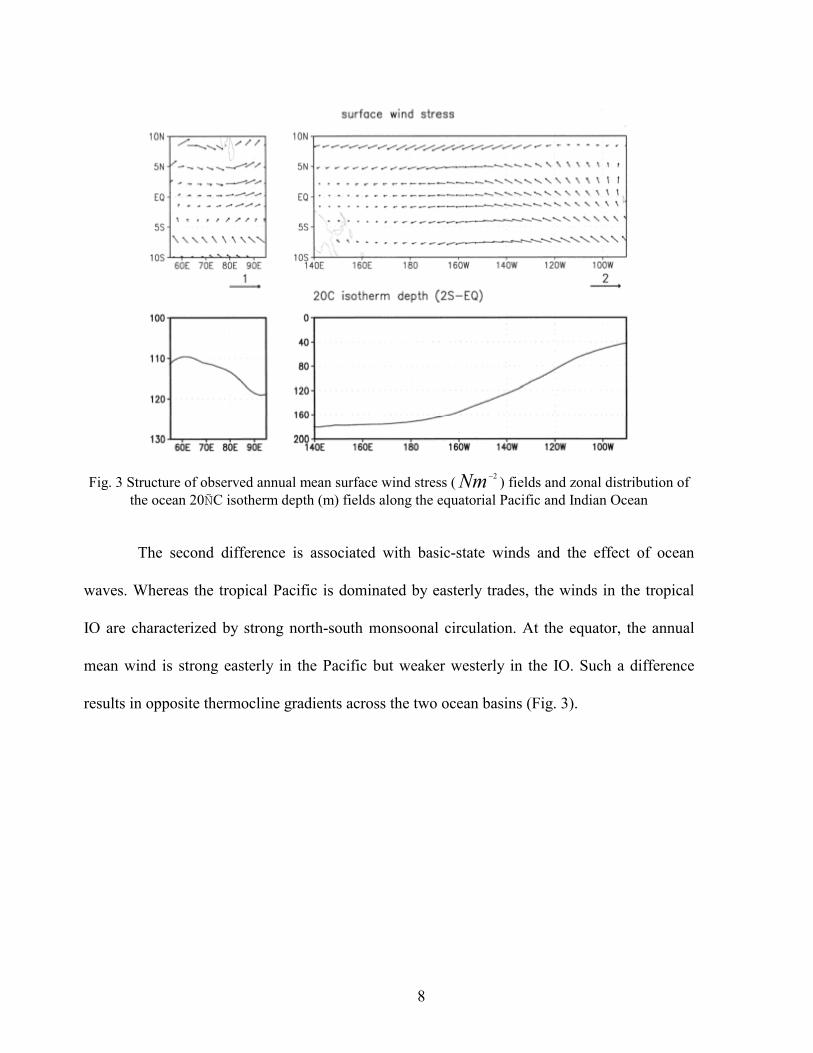
Fig. 3 Structure of observed annual mean surface wind stress ( 2−Nm ) fields and zonal distribution of the ocean 20°C isotherm depth (m) fields along the equatorial Pacific and Indian Ocean
The second difference is associated with basic-state winds and the effect of ocean
waves. Whereas the tropical Pacific is dominated by easterly trades, the winds in the tropical
IO are characterized by strong north-south monsoonal circulation. At the equator, the annual
mean wind is strong easterly in the Pacific but weaker westerly in the IO. Such a difference
results in opposite thermocline gradients across the two ocean basins (Fig. 3).
9
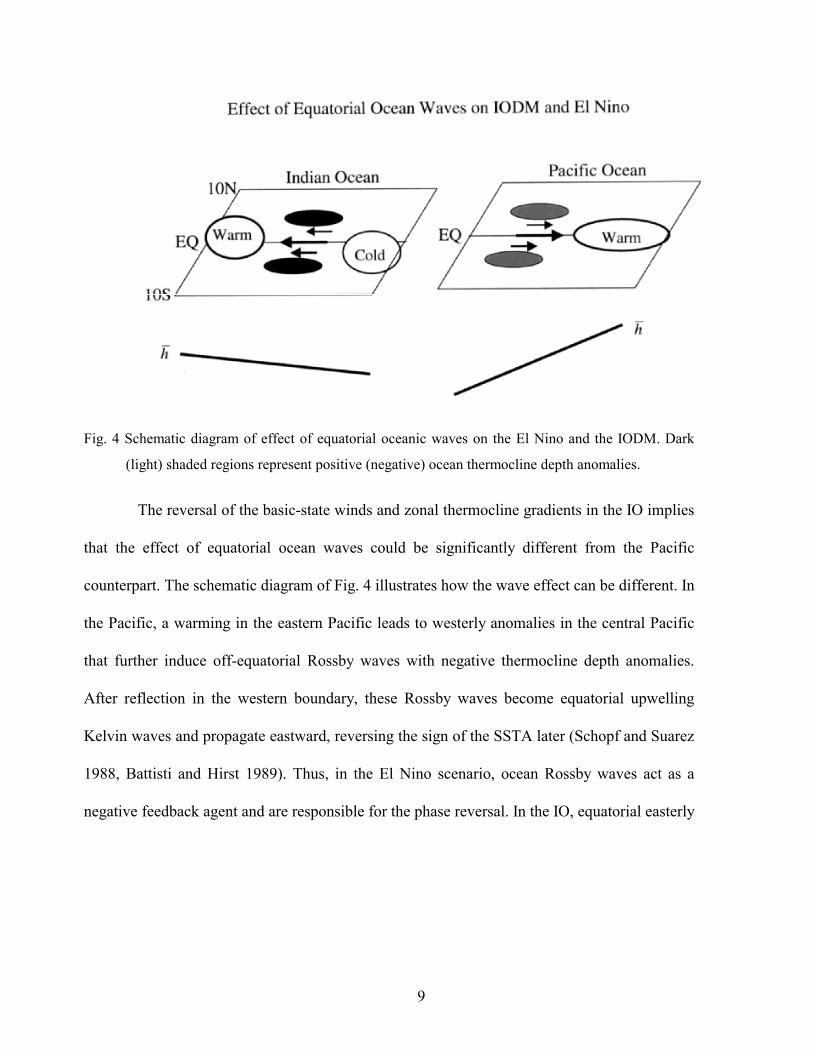
Fig. 4 Schematic diagram of effect of equatorial oceanic waves on the El Nino and the IODM. Dark
(light) shaded regions represent positive (negative) ocean thermocline depth anomalies.
The reversal of the basic-state winds and zonal thermocline gradients in the IO implies
that the effect of equatorial ocean waves could be significantly different from the Pacific
counterpart. The schematic diagram of Fig. 4 illustrates how the wave effect can be different. In
the Pacific, a warming in the eastern Pacific leads to westerly anomalies in the central Pacific
that further induce off-equatorial Rossby waves with negative thermocline depth anomalies.
After reflection in the western boundary, these Rossby waves become equatorial upwelling
Kelvin waves and propagate eastward, reversing the sign of the SSTA later (Schopf and Suarez
1988, Battisti and Hirst 1989). Thus, in the El Nino scenario, ocean Rossby waves act as a
negative feedback agent and are responsible for the phase reversal. In the IO, equatorial easterly
10
anomalies occur in response to a positive phase of the IODM1. The curl of the wind stress
anomalies generates oceanic Rossby waves that carry deeper thermocline depth anomaly
signals and propagate westward, enhancing the warm SSTA in the western IO where the mean
thermocline is relatively shallow (Xie et al. 2002). The signals of the Rossby wave propagation
and associated enhancement of the ocean surface warming were clearly detected by satellite
observations (e.g., Webster et al. 1999, Ueda and Matsumoto 2000) and simulated by an
oceanic model (Murtugudde et al. 2000). Thus, the ocean waves have a positive impact on the
initial development of the IODM.
The third major difference lies in the existence of the South Asian monsoon and its
interaction with adjacent tropical oceans. A warm SSTA in the northwest IO may enhance the
Indian monsoon intensity through increased moisture fluxes (Meehl 1997). An enhanced
monsoon may further affect the equatorial IO through remote and local processes2 (Chang and
Li 2000, hereafter CL00). To investigate the possible impact of the IODM on the Indian
monsoon, we conducted ten-ensemble atmospheric general circulation model (AGCM)
experiments with the Max-Planck Institute for Meteorology ECHAM4 model in a T42L19
resolution. For each ensemble run a slightly different initial condition was used. The AGCM is
1 A positive phase of the IODM denotes a positive (negative) SSTA in the western (eastern)
Indian Ocean, according to Saji et al. (1999).
2 The local impact is through enhanced cross-equatorial winds and thus surface evaporation
along the coast of Africa and the remote impact is through the change of large-scale east-west
circulation and thus SSTA in the western Pacific/maritime continent that further affects local
Walker circulation over the Indian Ocean.
11
forced by observed SST fields in 1997 in the tropical IO (30S-30N, 40E-110E) and
climatological SST fields elsewhere. The atmospheric response to the IODM was obtained by
subtracting the ensemble mean fields from those of a control experiment in which the
climatological SST fields were specified in global oceans. The numerical simulations indicate
that the IODM tends to enhance the Indian monsoon rainfall, which is consistent with results
from a different AGCM by Ashok et al. (2001).
Given that a positive phase of the IODM enhances the monsoon, a natural question is
how the anomalous monsoon further feeds back to the IODM. We argue that a strong Indian
monsoon may enhance the northward cross-equatorial wind along the coast of Africa, leading
to a cold SSTA in the western IO through enhanced surface evaporation, ocean mixing and
coastal upwelling. Meanwhile, the strengthened monsoon may enhance the large-scale east-
west circulation and leads to a positive SSTA in the western Pacific/maritime continent
(CL00). As a result, the local Walker cell over the IO is enhanced. The enhanced Walker cell
favors a warm (cold) SSTA in the eastern (western) IO through induced anomalous
downwelling (upwelling) and the change of the thermocline depth/subsurface temperature.
Both processes damp the IODM. Therefore, in addition to the cloud-SST feedback, the
monsoon exerts another type of negative feedback on the IODM.
12
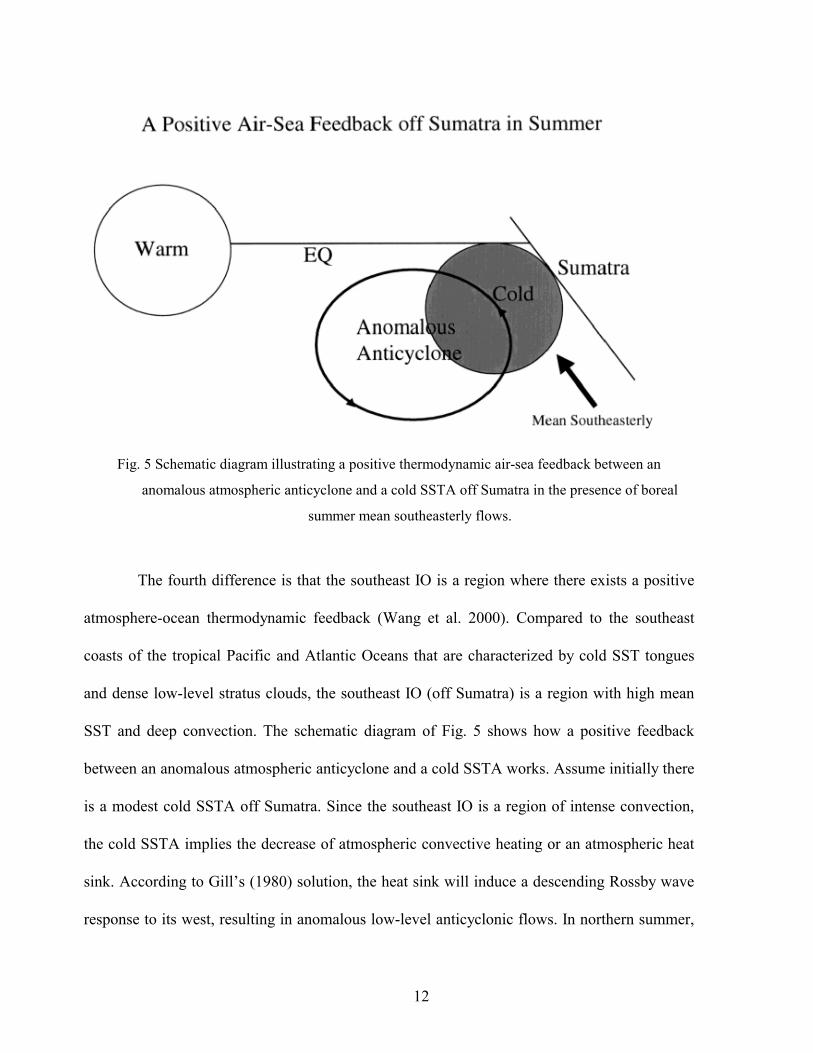
Fig. 5 Schematic diagram illustrating a positive thermodynamic air-sea feedback between an
anomalous atmospheric anticyclone and a cold SSTA off Sumatra in the presence of boreal
summer mean southeasterly flows.
The fourth difference is that the southeast IO is a region where there exists a positive
atmosphere-ocean thermodynamic feedback (Wang et al. 2000). Compared to the southeast
coasts of the tropical Pacific and Atlantic Oceans that are characterized by cold SST tongues
and dense low-level stratus clouds, the southeast IO (off Sumatra) is a region with high mean
SST and deep convection. The schematic diagram of Fig. 5 shows how a positive feedback
between an anomalous atmospheric anticyclone and a cold SSTA works. Assume initially there
is a modest cold SSTA off Sumatra. Since the southeast IO is a region of intense convection,
the cold SSTA implies the decrease of atmospheric convective heating or an atmospheric heat
sink. According to Gill’s (1980) solution, the heat sink will induce a descending Rossby wave
response to its west, resulting in anomalous low-level anticyclonic flows. In northern summer,
13
the mean flow is southeasterly. Thus the anomalous wind may enhance the total wind speed
and lower the SST through enhanced surface evaporation, vertical mixing and coastal
upwelling. Through this positive air-sea feedback, the cold SSTA and the anomalous
anticyclone may develop (Wang et al. 2002).
Because of its dependence on the basic-state wind, the nature of this thermodynamic
air-sea (hereafter, TAS) feedback is season-dependent. It is most efficient in boreal summer
when the southeasterly flow is pronounced. With the seasonal change of the background flows
from southeasterly in summer to northwesterly in winter, the same anomalous wind tends to
reduce the total wind speed and thus damp the original cold SSTA. Thus, this mechanism acts
as a negative feedback in northern winter. Because of its strong seasonal dependence, this TAS
feedback mechanism may explain the rapid development of the IODM in boreal summer and
its mature phase in October. The existence of the TAS feedback is consistent with the
observational fact that the strongest IO SST variability appears off Sumatra.
3. A conceptual coupled model for the IODM
a) Governing equations
Our strategy is to construct the simplest model possible while considering essential air-
sea feedback processes discussed in the previous section. For this purpose, we constructed a 5-
box model illustrated in Fig. 6. Along the equator, the Indian Ocean is divided into two equal
volume boxes, with TWI and TEI representing, respectively, the SSTA in the western IO (40°E-
80°E) and eastern IO (80°E-120°E). To consider the monsoon-ocean interaction and the remote
ENSO forcing, we consider additional 3 boxes. They represent, respectively, the South Asian
monsoon region, the equatorial western Pacific/maritime continent (120°E-180°E), and the
14
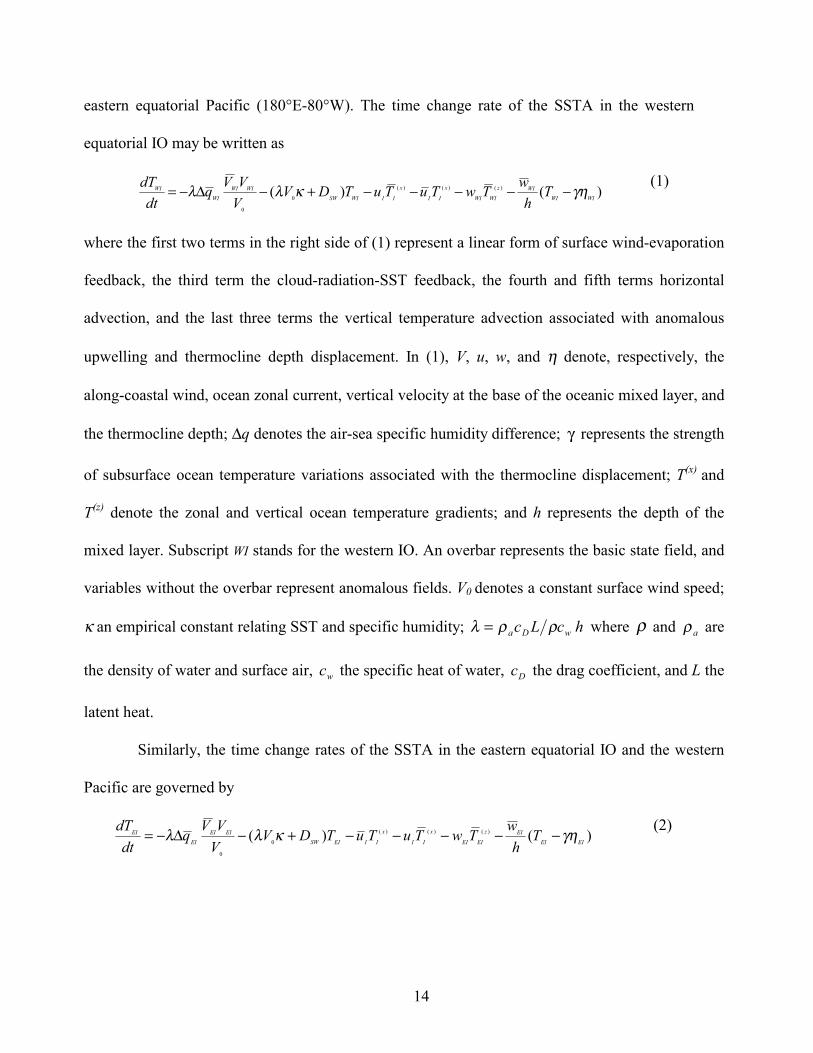
eastern equatorial Pacific (180°E-80°W). The time change rate of the SSTA in the western
equatorial IO may be written as
)()( )()()(
0
0
WIWI
WIz
WIWI
x
II
x
IIWISW
WIWI
WI
WI Th
wTwTuTuTDVVVVq
dtdT γηκλλ −−−−−+−∆−=
(1)
where the first two terms in the right side of (1) represent a linear form of surface wind-evaporation
feedback, the third term the cloud-radiation-SST feedback, the fourth and fifth terms horizontal
advection, and the last three terms the vertical temperature advection associated with anomalous
upwelling and thermocline depth displacement. In (1), V, u, w, and η denote, respectively, the
along-coastal wind, ocean zonal current, vertical velocity at the base of the oceanic mixed layer, and
the thermocline depth; ∆q denotes the air-sea specific humidity difference; γ represents the strength
of subsurface ocean temperature variations associated with the thermocline displacement; T(x) and
T(z) denote the zonal and vertical ocean temperature gradients; and h represents the depth of the
mixed layer. Subscript WI stands for the western IO. An overbar represents the basic state field, and
variables without the overbar represent anomalous fields. V0 denotes a constant surface wind speed;
κ an empirical constant relating SST and specific humidity; hcLc wDa ρρλ = where ρ and aρ are
the density of water and surface air, wc the specific heat of water, Dc the drag coefficient, and L the
latent heat.
Similarly, the time change rates of the SSTA in the eastern equatorial IO and the western
Pacific are governed by
)()( )()()(
0
0
EIEI
EIz
EIEI
x
II
x
IIEISW
EIEI
EI
EI Th
wTwTuTuTDVVVVq
dtdT γηκλλ −−−−−+−∆−=
(2)
15
)()( )()()(
0
0
WPWPWPz
WPWP
x
CPCP
x
CPCPWPSWWPWP
WPWP T
hwTwTuTuTDV
VUUq
dtdT γηκλλ −−−−−+−∆−=
, (3)
where subscripts EI, WP and CP denote the eastern IO, western and central equatorial Pacific,
respectively; and U denotes the zonal wind component.
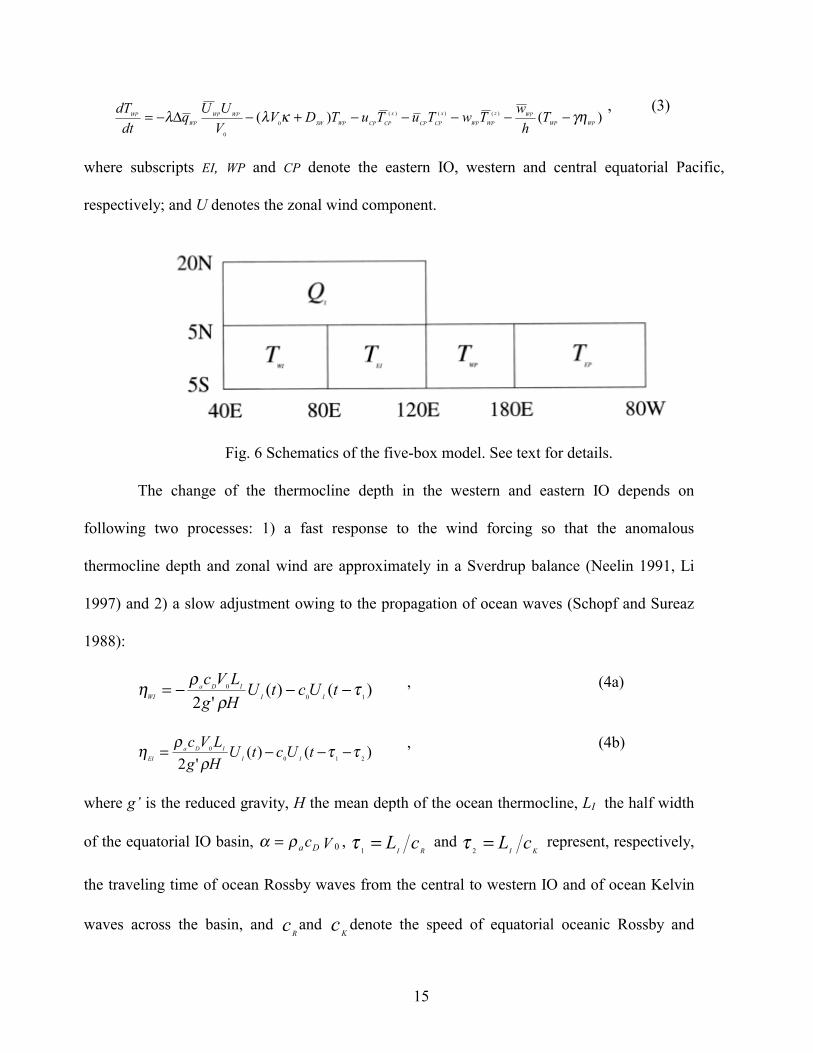
Fig. 6 Schematics of the five-box model. See text for details.
The change of the thermocline depth in the western and eastern IO depends on
following two processes: 1) a fast response to the wind forcing so that the anomalous
thermocline depth and zonal wind are approximately in a Sverdrup balance (Neelin 1991, Li
1997) and 2) a slow adjustment owing to the propagation of ocean waves (Schopf and Sureaz
1988):
)()('2 10
0 τρ
ρη −−−= tUctUHgLVc
IIIDa
WI
, (4a)
)()('2 210
0 ττρ
ρη −−−= tUctUHgLVc
IIIDa
EI
, (4b)
where g’ is the reduced gravity, H the mean depth of the ocean thermocline, LI the half width
of the equatorial IO basin, VcDa 0ρα = , RI cL=1τ and
KI cL=2τ represent, respectively,
the traveling time of ocean Rossby waves from the central to western IO and of ocean Kelvin
waves across the basin, and Rc and
Kc denote the speed of equatorial oceanic Rossby and

16
Kelvin waves. Parameter c0 represents the strength of the thermocline depth anomaly in
response to unit wind forcing.
The thermocline depth anomaly in the western Pacific depends on the zonal wind
anomaly in the central Pacific, that is,
HgUL CPP
WP '2ραη −= (4c)
where LP is the half width of the equatorial Pacific basin.
The anomalous monsoon heating over the South Asia depends on both local and
remote processes. For the local processes, the heating anomaly is determined by anomalous
moisture convergence in the atmospheric boundary layer (CL00, Li et al. 2001b), which can be
parameterized as
WIIIaII TqVzLbQ σδρδ =⋅∇∆= )()1( r , (5a)
where subscript I denotes the Indian monsoon; Iδ represents the seasonality of the monsoon
heating with δ I =1 for JJA (June-July-August) and Iδ =0 otherwise, b=0.9 is a fraction of the
moisture convergence that condenses out and releases the latent heat following Kuo (1974),
z∆ =1500 m denotes the depth of the atmospheric planetary boundary layer, and
310)92.8972.0( −×−= Tq is the surface air specific humidity, which is a function of SST
(T ) according to an empirical analysis by Li and Wang (1994).
Observations show that a dry Indian monsoon is often associated with an El Nino
condition in the Pacific (Webster et al. 1998). To mimic this remote ENSO forcing, we
parameterize the anomalous monsoon heating to be oppositely proportional to the eastern
Pacific SSTA. Thus, the total anomalous heating may be written as
17
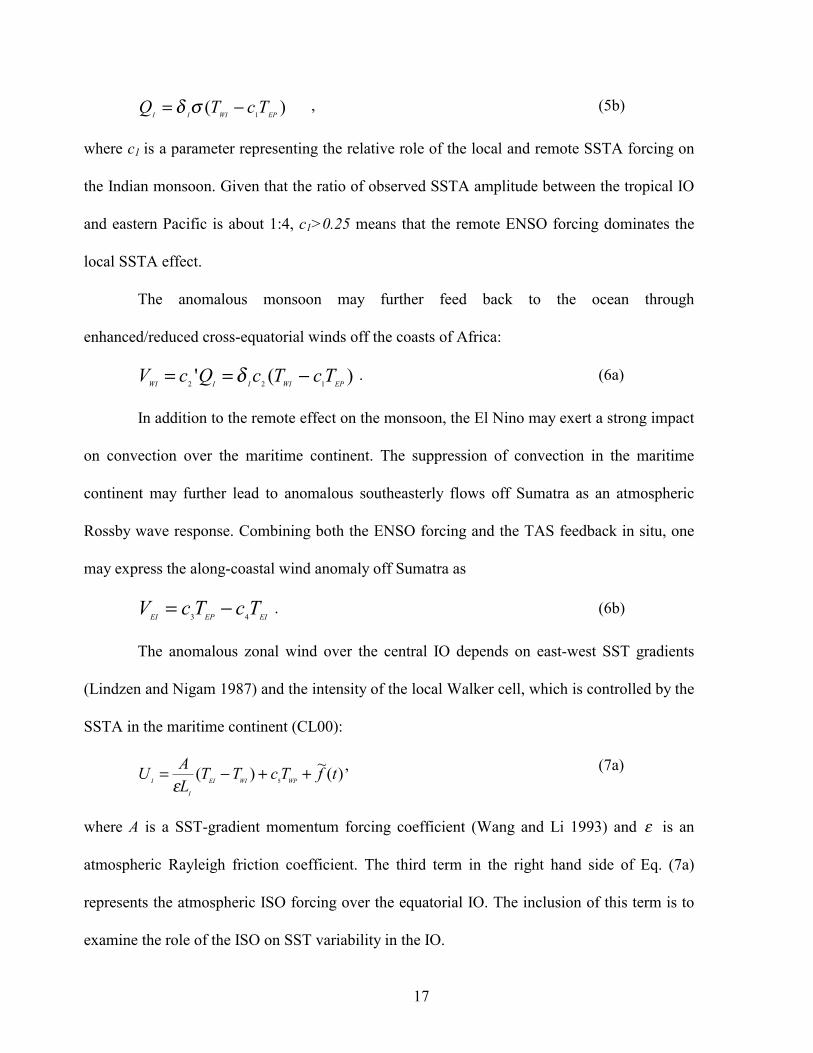
)( 1 EPWIII TcTQ −= σδ , (5b)
where c1 is a parameter representing the relative role of the local and remote SSTA forcing on
the Indian monsoon. Given that the ratio of observed SSTA amplitude between the tropical IO
and eastern Pacific is about 1:4, c1>0.25 means that the remote ENSO forcing dominates the
local SSTA effect.
The anomalous monsoon may further feed back to the ocean through
enhanced/reduced cross-equatorial winds off the coasts of Africa:
)(' 122 EPWIIIWI TcTcQcV −== δ . (6a)
In addition to the remote effect on the monsoon, the El Nino may exert a strong impact
on convection over the maritime continent. The suppression of convection in the maritime
continent may further lead to anomalous southeasterly flows off Sumatra as an atmospheric
Rossby wave response. Combining both the ENSO forcing and the TAS feedback in situ, one
may express the along-coastal wind anomaly off Sumatra as
EIEPEI TcTcV 43 −= . (6b)
The anomalous zonal wind over the central IO depends on east-west SST gradients
(Lindzen and Nigam 1987) and the intensity of the local Walker cell, which is controlled by the
SSTA in the maritime continent (CL00):
)(~)( 5 tfTcTTLAU WPWIEI
I
I ++−=ε
, (7a)
where A is a SST-gradient momentum forcing coefficient (Wang and Li 1993) and ε is an
atmospheric Rayleigh friction coefficient. The third term in the right hand side of Eq. (7a)
represents the atmospheric ISO forcing over the equatorial IO. The inclusion of this term is to
examine the role of the ISO on SST variability in the IO.
18
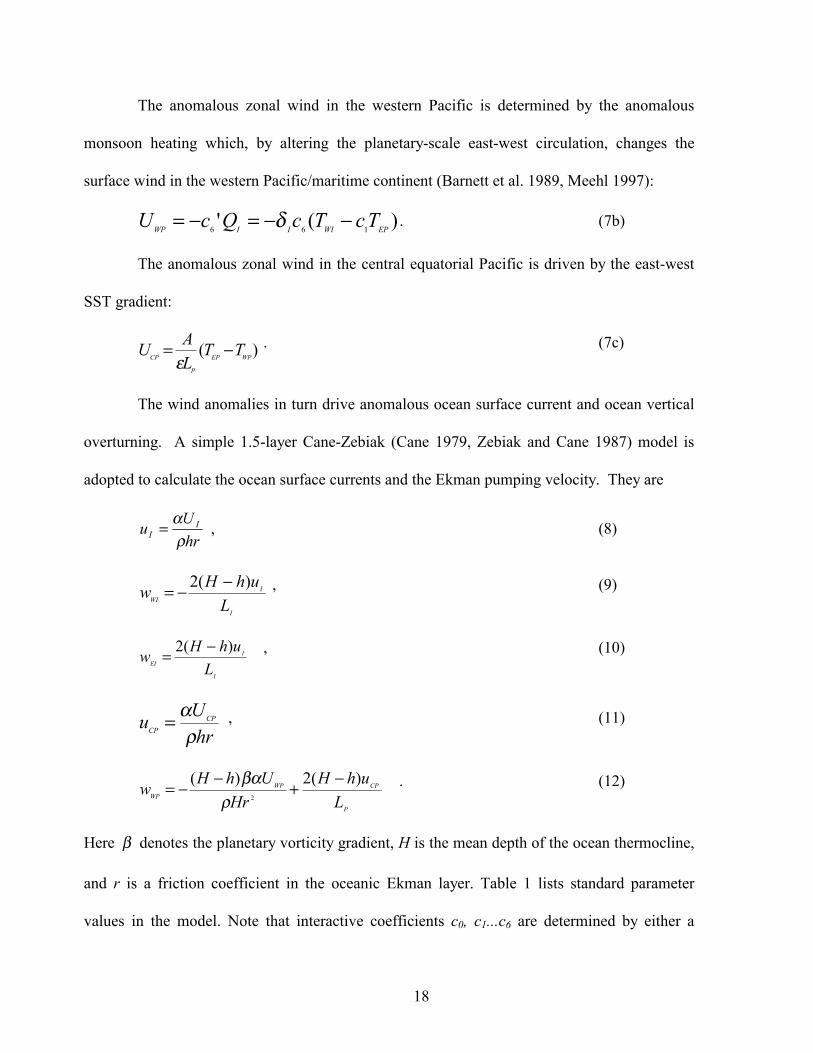
The anomalous zonal wind in the western Pacific is determined by the anomalous
monsoon heating which, by altering the planetary-scale east-west circulation, changes the
surface wind in the western Pacific/maritime continent (Barnett et al. 1989, Meehl 1997):
)(' 166 EPWIIIWP TcTcQcU −−=−= δ . (7b)
The anomalous zonal wind in the central equatorial Pacific is driven by the east-west
SST gradient:
)( WPEP
P
CP TTLAU −=
ε . (7c)
The wind anomalies in turn drive anomalous ocean surface current and ocean vertical
overturning. A simple 1.5-layer Cane-Zebiak (Cane 1979, Zebiak and Cane 1987) model is
adopted to calculate the ocean surface currents and the Ekman pumping velocity. They are
hrUu I
I ρα= , (8)
I
IWI L
uhHw )(2 −−= , (9)
I
IEI L
uhHw )(2 −= , (10)
hrUu CP
CP ρα= , (11)
P
CPWPWP L
uhHHr
UhHw )(2)(2
−+−−=ρ
βα . (12)
Here β denotes the planetary vorticity gradient, H is the mean depth of the ocean thermocline,
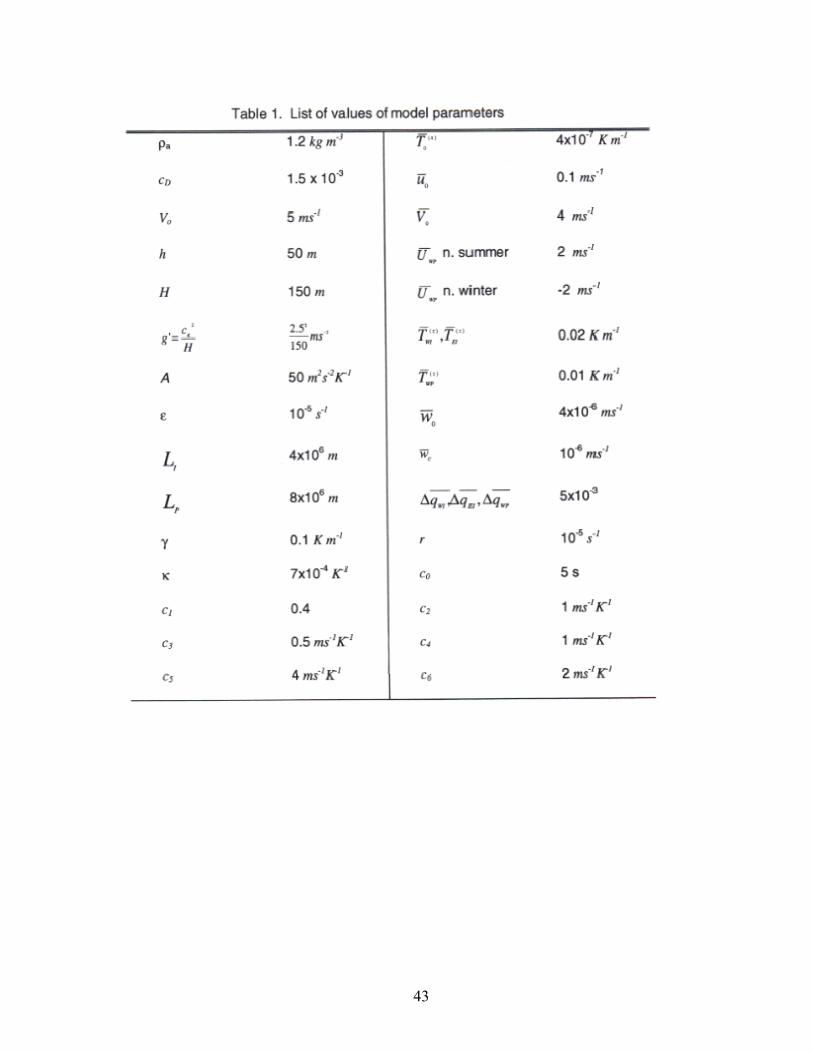
and r is a friction coefficient in the oceanic Ekman layer. Table 1 lists standard parameter
values in the model. Note that interactive coefficients c0, c1...c6 are determined by either a

19
regression from observational data or a scale analysis shown in CL00. For instance, we set c0 =
5 s based on the observed sea level height-wind relationship that a 30 m height anomaly
corresponds to a zonal wind anomaly of 6 m/s (see Fig. 4 of Webster et al. 1999); c5=4 ms-1K-1
means that a half degree SSTA in the maritime continent leads to a zonal wind anomaly of 2
m/s in the central equatorial IO, which was derived from a scale analysis (see CL00 in detail)
and supported by observations.
b) Basic State, Model Physics, and External Forcing
Observations show that winds along the coasts of Sumatra and Somalia exhibit a
strong annual cycle. In response to the wind forcing, the coastal upwelling also exhibits a clear
annual variation, with maximum amplitude appearing in boreal summer. To mimic this
observed feature, we specify the basic-state wind and ocean vertical velocity as follows:
]12
)7(2cos[0
−== iVVV EIWI
π , (13)
]}12
)7(2cos[,max{ 0
−== iwwww CEIWI
π , (14)
20
where i=1,2,…,12 represents January, February, …, December, and Cw is a minimum vertical
velocity representing the background vertical mixing due to wind stirring. Same as in CL00, a
seasonally varying background zonal wind is specified in the maritime continent/western
Pacific.
Basic-state zonal wind and east-west SST gradient exhibit a clear semiannual cycle
along the equatorial IO (Ueda 2001). To mimic this observational feature, we specify the
following basic-state ocean current and zonal temperature gradient in the IO:
]6
)4(2cos[0
−= iuuI
π , (15)
]6
)4(2cos[)(
0
)( −−= iTT xx
I
π . (16)
Essential physics in the model involve various positive and negative air-sea feedback
processes. The negative feedback processes include the cloud-radiation-SST feedback, the
wind-evaporation feedback, and the monsoon-ocean feedback. The positive feedback processes
include the thermocline-SST-wind feedback and the TAS feedback. Different from the ENSO
dynamics, ocean waves have a positive impact on the initial development of the IODM.
21
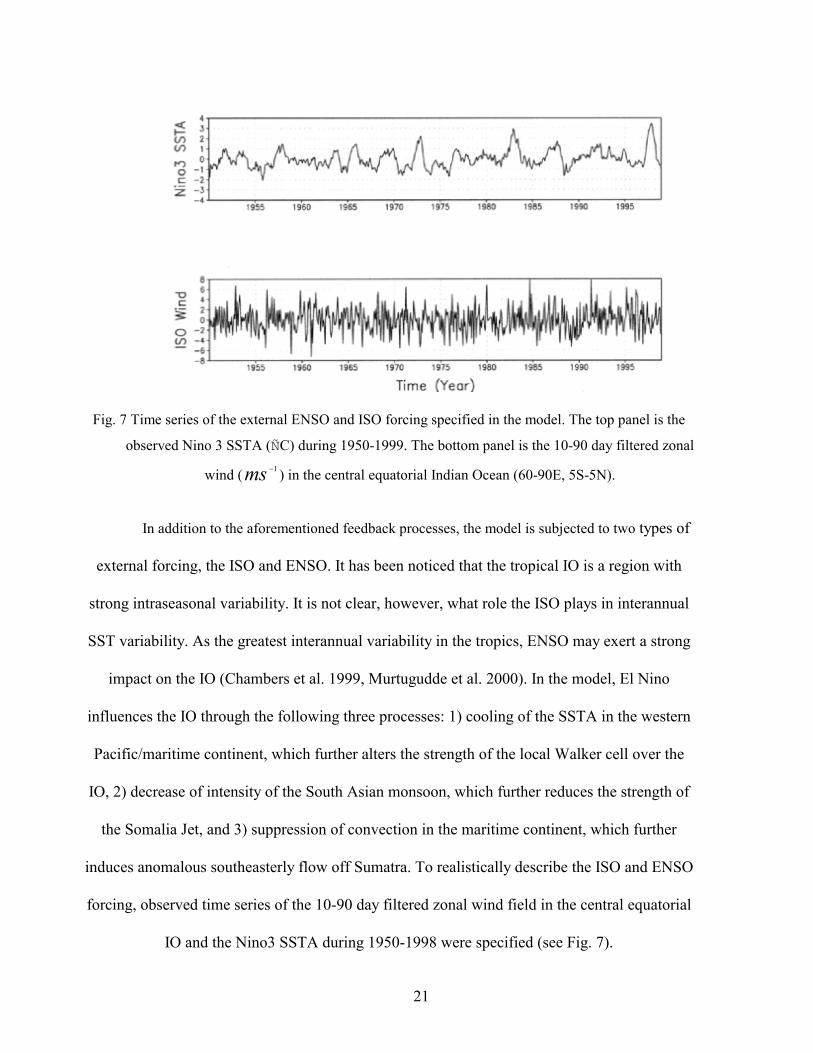
Fig. 7 Time series of the external ENSO and ISO forcing specified in the model. The top panel is the
observed Nino 3 SSTA (°C) during 1950-1999. The bottom panel is the 10-90 day filtered zonal
wind ( 1−ms ) in the central equatorial Indian Ocean (60-90E, 5S-5N).
In addition to the aforementioned feedback processes, the model is subjected to two types of
external forcing, the ISO and ENSO. It has been noticed that the tropical IO is a region with
strong intraseasonal variability. It is not clear, however, what role the ISO plays in interannual
SST variability. As the greatest interannual variability in the tropics, ENSO may exert a strong
impact on the IO (Chambers et al. 1999, Murtugudde et al. 2000). In the model, El Nino
influences the IO through the following three processes: 1) cooling of the SSTA in the western
Pacific/maritime continent, which further alters the strength of the local Walker cell over the
IO, 2) decrease of intensity of the South Asian monsoon, which further reduces the strength of
the Somalia Jet, and 3) suppression of convection in the maritime continent, which further
induces anomalous southeasterly flow off Sumatra. To realistically describe the ISO and ENSO
forcing, observed time series of the 10-90 day filtered zonal wind field in the central equatorial
IO and the Nino3 SSTA during 1950-1998 were specified (see Fig. 7).
22
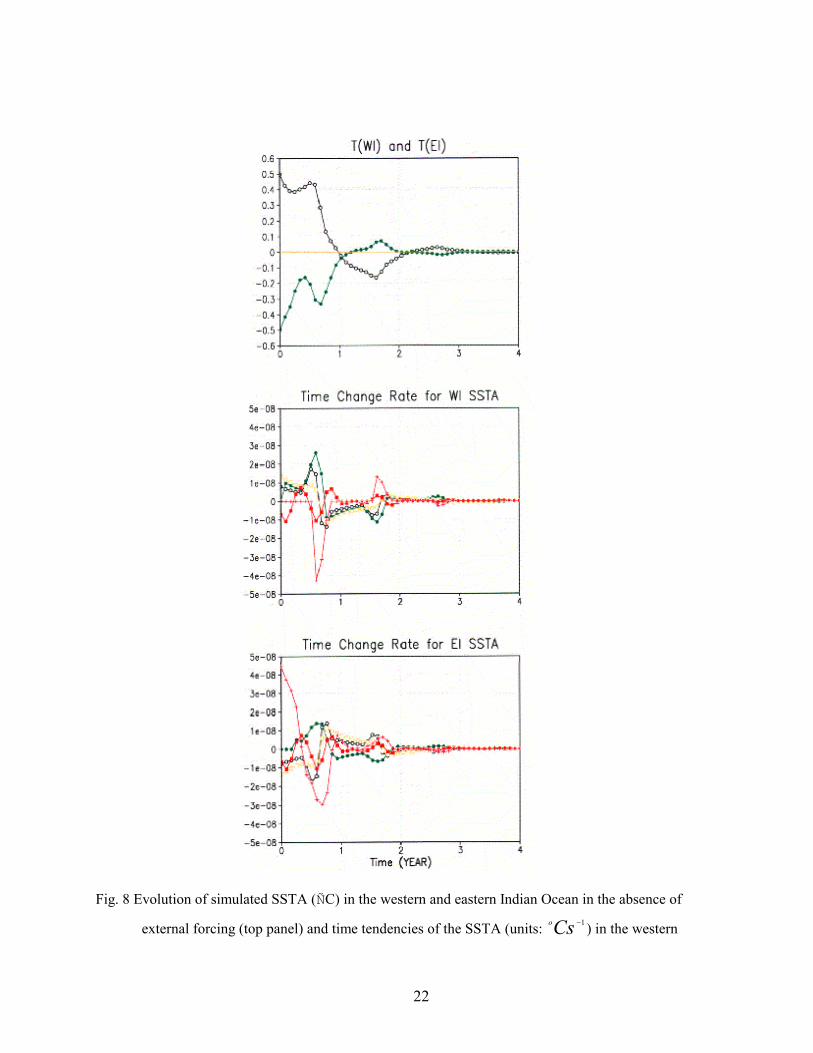
Fig. 8 Evolution of simulated SSTA (°C) in the western and eastern Indian Ocean in the absence of
external forcing (top panel) and time tendencies of the SSTA (units: 1−Cso ) in the western
23
(middle panel) and eastern (bottom panel) IO. The open and close circles denote anomalous
vertical temperature advection associated with fast thermocline adjustments and slower oceanic
wave effects. The open square represents the vertical temperature advection due to anomalous
upwelling. The close square represents the horizontal temperature advection anomaly. The cross
denotes the evaporation-SST-wind feedback associated with the anomalous monsoon for the
western IO and the TAS feedback for the eastern IO.
4. IODM – A natural damped air-sea coupled mode
First we examine the model solutions in the presence of air-sea feedback processes
mentioned above but without consideration of external forcing. Figure 8a shows the time
evolution of the model SSTA in this case. Initially, a dipole SST structure, with CTWI
05.0=
and CTEI
05.0−= , was specified. The numerical result indicates that ocean-atmosphere
interactions in the IO support a damped oscillation mode, with a biennial periodicity.
Diagnosis of the surface heat budget indicates that the time change rate of WIT is
primarily determined by anomalous vertical temperature advection (including the effect of
ocean waves) and evaporational cooling associated with the monsoon-ocean local feedback
(Fig. 8b). The time change rate of EIT is strongly regulated by the seasonal-dependent TAS
feedback (Fig. 8c). The anomalous vertical temperature advection tends to enhance EIT in the
initial development stage due to the positive thermocline-SST feedback, but tends to decrease
EIT later owing to the delayed effect of the ocean waves. In both regions, the cloud-radiation-
SST feedback contributes greatly to damping the SSTA, while the zonal advection anomaly has
modest amplitude with a semiannual periodicity.
The sensitivity tests with different parameter values (say, 20% increase or decrease of
the interactive coefficients c0, c1...c6) indicate that the damped oscillation solution is quite

24
robust. This indicates that the IODM is a natural damped air-sea coupled mode. The greatest
negative feedback comes from the cloud-radiation-SST feedback. As discussed in the previous
sections, this strong negative feedback is active only in the warm oceans; therefore it does not
significantly damp El Nino. The additional negative feedback results from the monsoon-ocean
interaction. While a positive phase of the IODM strengthens the monsoon, the enhanced
monsoon tends to damp the dipole through both remote and local processes. The ocean waves
contribute positively to the growth of the SSTA in the western IO, but their impact is much
weaker compared to El Nino scenario because the mean thermocline in the eastern Pacific is
much shallower. The TAS feedback is a positive feedback mechanism in the southeast IO, but
because of its seasonal dependence it is only effective in boreal summer. In boreal winter it acts
as a strong damping. The net effect of these feedback processes results in a damped oscillation
mode in the tropical IO, which is different from the self-sustained ENSO mode in the Pacific.
The fundamental difference arises from the distinctive characteristics of the basic state of the
coupled system in the two oceans.
5. Role of external forcing
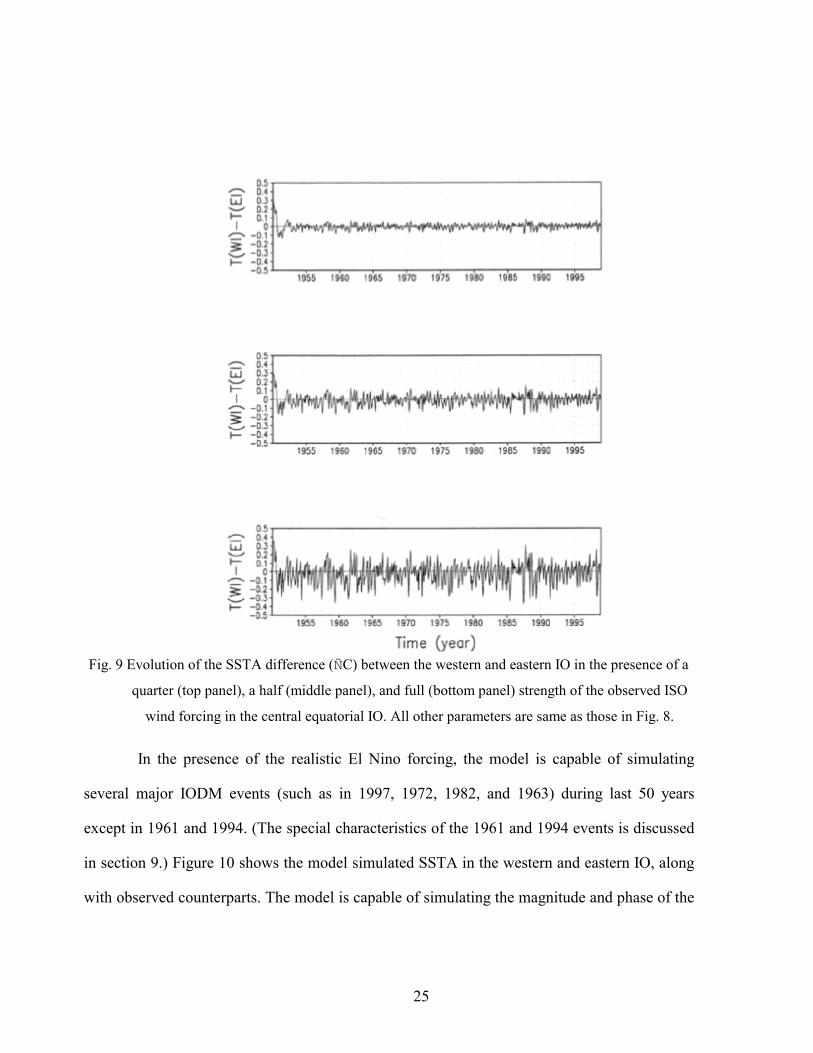
To examine the impact of the ISO, we designed a set of numerical experiments in
which the strength of the ISO was gradually increased to 25%, 50%, and 100% of the observed
amplitude. Figure 9 shows the SSTA evolution in the three cases. With enhanced ISO
variability, the naturally damped SST mode tends to oscillate around a finite amplitude. The
results suggest that the ISO may act as stochastic forcing to reinvigorate the natural damped
mode. However, even with the full strength of the ISO forcing, the amplitude of the SSTA is
still much smaller compared to the observed SSTA variability.
25
Fig. 9 Evolution of the SSTA difference (°C) between the western and eastern IO in the presence of a
quarter (top panel), a half (middle panel), and full (bottom panel) strength of the observed ISO
wind forcing in the central equatorial IO. All other parameters are same as those in Fig. 8.
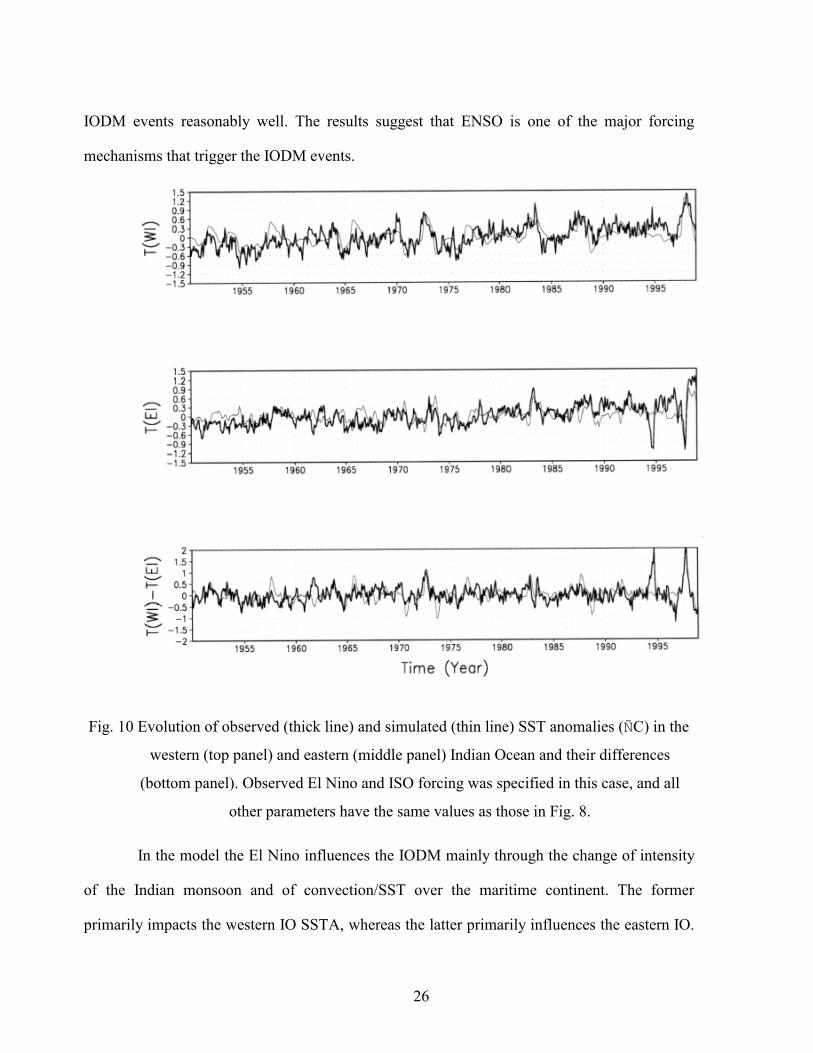
In the presence of the realistic El Nino forcing, the model is capable of simulating
several major IODM events (such as in 1997, 1972, 1982, and 1963) during last 50 years
except in 1961 and 1994. (The special characteristics of the 1961 and 1994 events is discussed
in section 9.) Figure 10 shows the model simulated SSTA in the western and eastern IO, along
with observed counterparts. The model is capable of simulating the magnitude and phase of the
26
IODM events reasonably well. The results suggest that ENSO is one of the major forcing
mechanisms that trigger the IODM events.
Fig. 10 Evolution of observed (thick line) and simulated (thin line) SST anomalies (°C) in the
western (top panel) and eastern (middle panel) Indian Ocean and their differences
(bottom panel). Observed El Nino and ISO forcing was specified in this case, and all
other parameters have the same values as those in Fig. 8.
In the model the El Nino influences the IODM mainly through the change of intensity
of the Indian monsoon and of convection/SST over the maritime continent. The former
primarily impacts the western IO SSTA, whereas the latter primarily influences the eastern IO.
27
To investigate their relative roles, two additional experiments were conducted in which we
separated the two processes. It turns out that both processes contribute nearly equally to the
development of the IODM (figure not shown).
6. Phase-locking mechanism
Although the El Nino has a great influence on the IO, it is the ocean-atmosphere
interactions in situ that regulate the life cycle of the IODM. This is why the mature phase of the
IODM occurs in October even though the maximum ENSO forcing appears in northern winter.
There are several possible factors that may cause the phase locking of the IODM. The first is
the annual cycle of the basic-state wind off Sumatra. This seasonally varying basic-state wind
regulates the local SST change through the TAS feedback mechanism. In addition, the seasonal
change of mean upwelling off the coasts of Sumatra and Somalia may also play a role. This is
because even given the same thermocline depth anomaly, the seasonally varying mean
upwelling may lead to the greatest SST tendency in boreal summer when the upwelling is
strongest. The third possible factor is the annual cycle of east-west SST gradients and zonal
winds along the equator. Ueda (2001) suggested that the sum of basic-state and anomalous SST
might give rise to maximum amplitude in northern fall. The fourth factor is the seasonal
dependence of the anomalous monsoon heating. Although the El Nino exerts the strongest
forcing toward the end of a year, its impact on anomalous monsoon heating peaks in northern
summer. Thus the anomalous monsoon may exert the greatest impact on the IO toward the end
of summer.
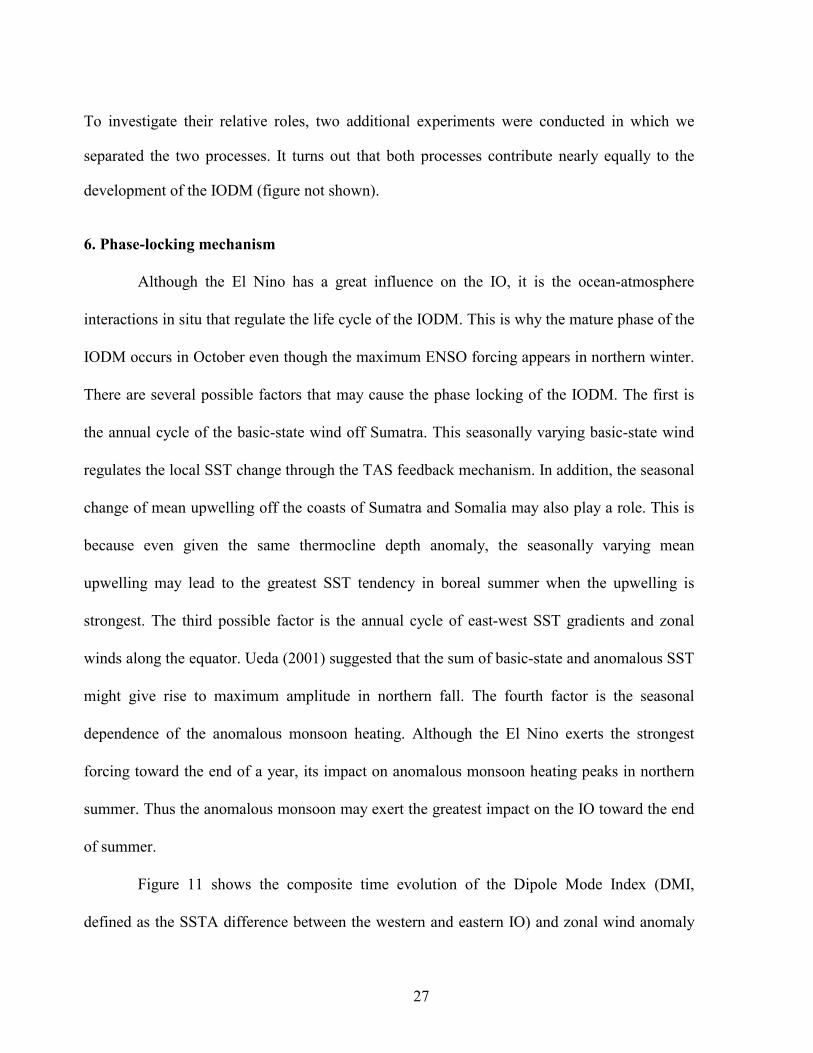
Figure 11 shows the composite time evolution of the Dipole Mode Index (DMI,
defined as the SSTA difference between the western and eastern IO) and zonal wind anomaly
28
in the central equatorial IO. The composite is based on seven strongest IODM events simulated
in Fig. 10. Note that the mature phase of the model IODM occurs in October, and the phases of
the IODM in the model well lock into the annual cycle.
Fig. 11 Evolution of the model composite SSTA difference (°C, light shaded bar) and zonal wind
anomaly (units: 2 1−ms , dark shaded bar) in the Indian Ocean.
To investigate the relative roles of the aforementioned factors, we designed the
following four experiments. In the first experiment, we considered the annual cycle of EIV
while other basic-state variables were set to their annual mean values. In the second
experiment, we considered the seasonally varying EIw and
WIw only. In the third
experiment the effect of annual cycle of Iu and )( x
IT was examined. In the fourth
experiment we considered the seasonally varying WIV and
WPU .

29
Fig. 12 Same as Fig. 11 except for specification of different annual cycle basic states. The top panel is
a case when only the annual cycle of the wind over the eastern IO is included. The panel below
shows a case in which only the annual cycle of ocean upwelling along the coasts of Africa and
Sumatra is considered. The next panel shows a case of annually varying zonal oceanic currents
and zonal temperature gradients. The bottom panel is a case that considers the annual cycle of
the wind in both the western IO and the maritime continent.
Figure 12 shows the results from the four experiments. Note that in experiments 1 and
4 the mature phases of the IODM appear in October, whereas in experiments 2 and 3 they
30
appear in January. The results indicate that the primary mechanisms for the phase locking arise
from the seasonal-dependent TAS feedback (Fig. 12a) and the remote and local impact of the
anomalous monsoon (Fig. 12d). The effect of the seasonal varying basic-state upwelling and
zonal temperature gradient is small (Figs. 12b and c).
7. Effect of ocean waves
The time evolution of the observed SSTA in 1997 shows that the SST dipole
developed rapidly in summer and reached its mature phase in fall 1997. After that, the cold
SSTA in the eastern IO started to decay, and the warm SSTA in the western IO spread into the
east. By the middle of the 1997/98 winter, a basin-wide warming (hereafter, a unimode) was
observed.
Such a dipole-to-unimode transition is well captured by the model. Figure 13a
illustrates the time evolution of the model simulated SSTA in 1997, along with observed
counterparts. Similar to the observations, after the cold SSTA reached its maximum amplitude
in October in the eastern IO, it decayed rapidly and became positive in December 1997. What
causes such a dipole-to-unimode transition? The diagnosis of the SSTA budget showed that the
primary mechanism for this SSTA transition was attributed to the delayed effect of the ocean
waves. In response to anomalous zonal SST gradients, easterly wind anomalies were generated
in the central equatorial IO. The curl of the anomalous easterlies excited equatorial Rossby
waves that carried positive thermocline depth anomaly signals and propagated westward. After
reflection from the western boundary, they became downwelling equatorial Kelvin waves and
propagated eastward. The eastward expansion of the warm SSTA was attributed to the

31
accumulated effect of these oceanic waves. When the wave effect is excluded (by setting c0
=0), the SSTA transition does not occur (see Fig. 13b).
Fig. 13 Evolution of the observed (thick line) and simulated (thin line) SSTA (°C) in the western (solid
line) and eastern (dashed line) IO associated with the 1997-98 IODM event. The top panel is the
case that includes the effect of oceanic waves and the bottom panel is a case without the oceanic
wave effect.
32
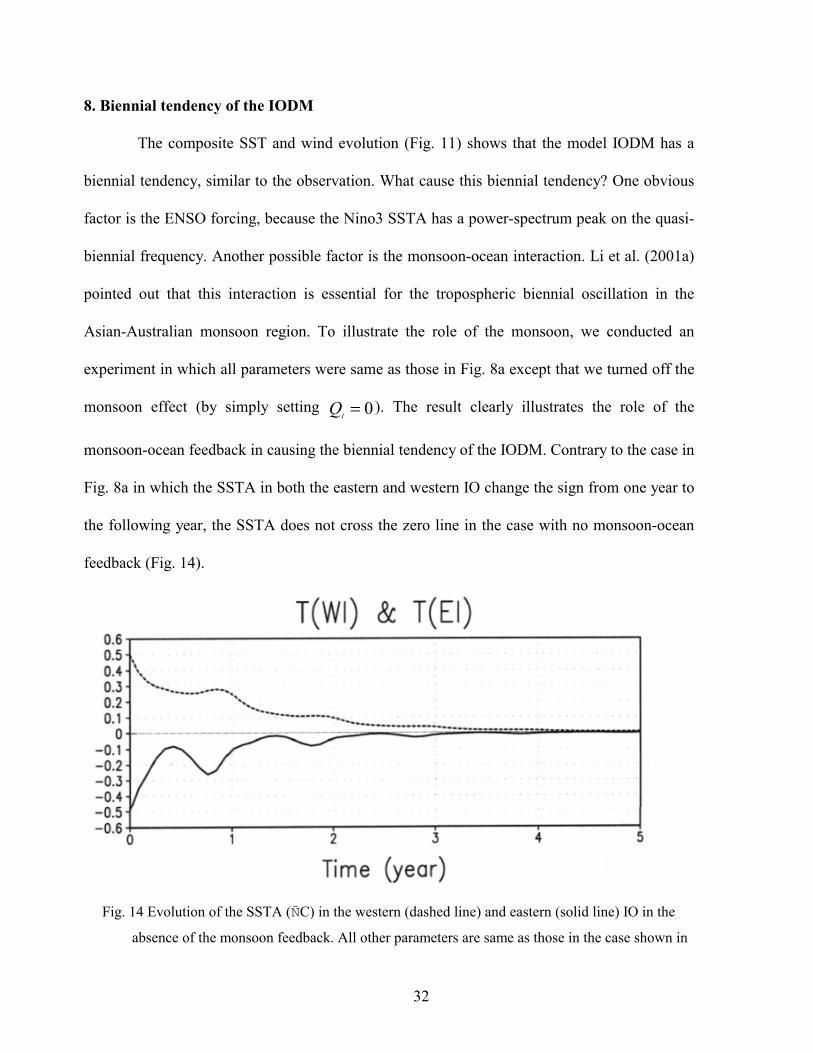
8. Biennial tendency of the IODM
The composite SST and wind evolution (Fig. 11) shows that the model IODM has a
biennial tendency, similar to the observation. What cause this biennial tendency? One obvious
factor is the ENSO forcing, because the Nino3 SSTA has a power-spectrum peak on the quasi-
biennial frequency. Another possible factor is the monsoon-ocean interaction. Li et al. (2001a)
pointed out that this interaction is essential for the tropospheric biennial oscillation in the
Asian-Australian monsoon region. To illustrate the role of the monsoon, we conducted an
experiment in which all parameters were same as those in Fig. 8a except that we turned off the
monsoon effect (by simply setting 0=IQ ). The result clearly illustrates the role of the
monsoon-ocean feedback in causing the biennial tendency of the IODM. Contrary to the case in
Fig. 8a in which the SSTA in both the eastern and western IO change the sign from one year to
the following year, the SSTA does not cross the zero line in the case with no monsoon-ocean
feedback (Fig. 14).
Fig. 14 Evolution of the SSTA (°C) in the western (dashed line) and eastern (solid line) IO in the
absence of the monsoon feedback. All other parameters are same as those in the case shown in

33
Fig. 15 Horizontal patterns of SST (°C) and surface wind ( 1−ms ) anomalies (top panel) and
anomalous 500 hPa vertical velocity field (units: 1210 −− Pas , bottom panel) in JJA of 1994 How does the monsoon-ocean feedback lead to a biennial tendency? As we know, a
positive phase of the IODM may lead to a strong Indian monsoon. The enhanced monsoon
induces anomalous east-west circulation, leading to a positive tendency of the SSTA in the
maritime continent (CL00). The anomalous warming in the maritime continent further exerts a
delayed impact on the equatorial IO through the enhanced local Walker cell, leading to a
negative phase of the IODM. Thus it is the lagged response of the maritime continent SSTA to
the anomalous monsoon that gives rise to the biennial tendency.
34
9. IODM events in 1994 and 1961
The occurrences of the IODM events in 1994 and 1961 suggest that the SST variability
in the IO cannot be simply explained by the ENSO forcing. Other types of climate forcing may
also play a role in initiating/triggering the coupled modes over the tropical IO. The question is
what triggered the IODM events in 1994 and 1961.
Figure 15 illustrates the 1994 summer SSTA and 500 hPa vertical motion anomaly
derived from the NCAR/NCEP reanalysis. (The middle tropospheric vertical motion is used to
represent atmospheric convective heating in the tropics.) It is noted that the development of the
1994 IODM event started from the eastern IO where a cold SSTA was initiated in early
summer in response to enhanced southeasterly flows along the Sumatra coast. The anomalous
northward cross-equatorial flows in the eastern IO resulted from anomalous atmospheric
heating over Indochina/South China Sea, which persisted from late spring (May) through
summer. Therefore, we conclude that the 1994 IODM event was initiated by anomalous heating
over Indochina/South China Sea. This anomalous heat source was not related to El Nino,
because the eastern Pacific SSTA was in a normal condition.
Unlike many IODM events that were initiated in early summer, the 1961 event may be
traced back to DJF of 1960-61 when a modest cold SSTA developed in the eastern IO (left
panels of Fig. 16). It is likely that this cold SSTA resulted from enhanced westerly (and thus
surface evaporation) at the equator in response to anomalous heating in the maritime continent,
which is represented by anomalous vertical motion at 500 hPa (right panels of Fig. 16).
Meanwhile a weak warming developed in the western equatorial IO off the coast of Africa, due
to warm SST advection from the southern IO (around 10-15°S) in boreal winter. This
enhanced the zonal SST gradient along the equator. The enhanced zonal SST gradient tended to
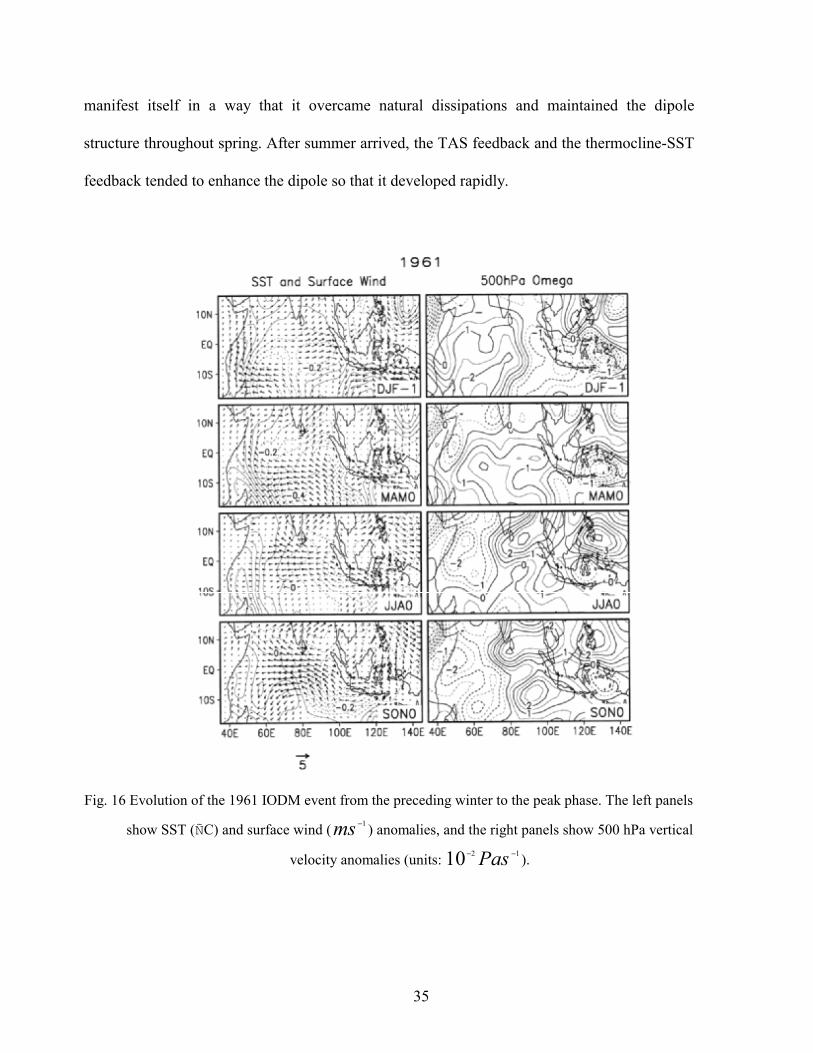
35
manifest itself in a way that it overcame natural dissipations and maintained the dipole
structure throughout spring. After summer arrived, the TAS feedback and the thermocline-SST
feedback tended to enhance the dipole so that it developed rapidly.
Fig. 16 Evolution of the 1961 IODM event from the preceding winter to the peak phase. The left panels
show SST (°C) and surface wind ( 1−ms ) anomalies, and the right panels show 500 hPa vertical
velocity anomalies (units: 1210 −− Pas ).
36
10. Concluding remarks
A conceptual coupled atmosphere-ocean model was constructed to understand the
origin of the Indian Ocean Dipole Mode (IODM). This model contained 5 boxes that represent
the equatorial western and eastern Indian Ocean, the western Pacific/Maritime Continent, the
equatorial eastern Pacific, and the South Asian monsoon region, respectively. In the model,
various positive and negative feedback processes attribute to the Indian Ocean SST variability.
Among them are the cloud-radiation-SST feedback, evaporation-SST-wind feedback,
thermocline-SST feedback, and the monsoon-ocean interaction. We addressed the following
scientific questions: What are fundamental differences between air-sea interactions in the
tropical Pacific and those of the Indian Ocean? Why does the peak phase of the IODM appear
in October? What are physical mechanisms responsible for the biennial tendency of the IODM?
Is the IODM a damped or self-sustained air-sea coupled mode? What roles do the ENSO and
ISO play in the IODM evolution?
Our results indicate that air-sea interactions in the Indian Ocean in general support a
natural damped mode, which is different from the self-sustained ENSO mode in the Pacific.
The difference arises primarily from the distinctive characteristics of the basic state of the
coupled system in the tropical Indian and Pacific Oceans. There are four major differences
between air-sea coupling processes in the two oceans. The first difference is represented by the
strong contrast of the cloud-SST phase relationship between the warm pool and cool tongue.
Because of the in-phase cloud-SST relationship in warm oceans, the SST variability is greatly
suppressed. The second difference arises from the reversal of the basic-state zonal wind and
east-west tilting of the ocean thermocline, which leads to distinctive effects of ocean waves on
the SST. The third difference lies in the existence of the Asian monsoon and its interaction
37
with the adjacent oceans. The fourth difference is that the southeast Indian Ocean is a region
where there exists a positive thermodynamic air-sea feedback. Because of these differences,
air-sea interactions tend to support a damped oscillation mode in the IO but a self-sustained
oscillation mode in the Pacific. The strongest damping comes from the shortwave radiation-
cloud-SST feedback. The monsoon also exerts a negative impact on the IODM.
Contrary to the southeast tropical Pacific and Atlantic oceans characterized by cold
SST tongues and dense low-level stratus clouds, the southeast IO (off Sumatra) is a region with
high mean SST and deep convection. Because of this distinctive feature, a positive
thermodynamic air-sea feedback exists in the southeast Indian Ocean. This positive feedback
arises from interactions between an anomalous atmospheric anticyclone and a cold SSTA, and
is season-dependent due to its dependence on the basic state wind. The positive feedback is
most efficient in boreal summer when the southeasterly flow is pronounced. The phase locking
feature of the IODM can be, to a certain extent, explained by the seasonal dependence of this
thermodynamic feedback mechanism. In addition, the anomalous monsoon also plays a role.
Although the El Nino has the greatest amplitude toward the end of a year, its impact on the
anomalous monsoon heating peaks in northern summer. Therefore, the anomalous monsoon
may exert the strongest impact on the IODM toward the end of summer. Our sensitivity
experiments indicate that the phase-locking of the IODM is primarily caused by the two
factors.
Different from the ENSO dynamics, ocean waves have a positive impact on the initial
development of the IODM. A transition from a dipole to an unimode is mainly attributed to
ocean waves through their accumulated effects on the thermocline and subsurface temperature

38
changes. The biennial tendency of the IODM arises from the external forcing of ENSO and the
monsoon-ocean feedback.
The role of the ISO was investigated by forcing the model with the observed ISO wind
in the central equatorial Indian Ocean. With the increase of strength of the ISO forcing, the
model simulates a sustained, irregular oscillation, suggesting that the ISO may act as a
stochastic forcing to reinvigorate the naturally damped IODM.
While the ISO primarily represents atmospheric stochastic forcing, the ENSO has a
more profound impact on the IODM, due to its long duration and great amplitude. In the model
an El Nino impacts the IODM through the following three processes. First, it influences the
strength of the South Asian monsoon, which further alters the cross-equatorial wind along the
coast of Africa. Second, it altered the anomalous Walker cell over the IO through the change of
SST in the maritime continent/western Pacific. Third, it influences the intensity of convection
over the maritime continent, which further induces anomalous along-coastal winds off
Sumatra. All three processes favor the initiation and development of a positive phase of the
IODM.
In the presence of realistic ENSO forcing, the model was capable of simulating several
IODM events during recent 50 years that were associated with the ENSO. However, it failed to
simulate the IODM events in 1961 and 1994. Further observational analyses indicated that the
IODM events in 1961 and 1994 have special characteristics. The 1994 event was initiated by
anomalous heating over Indochina/South China Sea in late spring/early summer. In response to
this anomalous heating, northward cross-equatorial flows were established. The anomalous
along-coastal wind off Sumatra causes the cooling in situ, which initiated the dipole event. The
1961 event was initiated by anomalous heating over the maritime continent in northern winter.
39
In response to the anomalous heating, a weak SST dipole was established. This zonal SST
gradient tended to manifest itself in a way that it overcame natural dissipations and maintained
the dipole structure throughout spring. After summer arrived, it developed rapidly, owing to the
thermodynamic air-sea feedback and the wind-thermocline-SST feedback. Given the
observational fact that both the IODM events were independent of the ENSO, it is conceivable
that other types of climate forcing in addition to ENSO may trigger/initiate an IODM event.
Acknowledgments. This work was supported by the NOAA Grant NA01AANRG0011, by NSF
Grant ATM01-19490, and by the International Pacific Research Center that is partially
sponsored by the Frontier Research System for Global Change. This is SOEST contribution
number xxxx and IPRC contribution number xx.
40
References
Ashok, K., Z. Guan, and T. Yamagata, 2001: Impact of the Indian Ocean dipole on the
relationship between the Indian monsoon rainfall and ENSO. Geophy. Res. Lett., in press.
Battisti, D. S., and A.C. Hirst, 1989: Interannual variability in the tropical atmosphere-ocean
system: Influence of the basic state and ocean geometry. J.Atmos.Sci., 46, 1678-1712.
Barnett, T. P., L. Dumenil, U. Schlese, E. Roeckner, and M. Latif, 1989: The effect of Eurasian
snow cover on regional and global climate variations. J. Atmos. Sci., 46, 661-685.
Cane, M. A., 1979: The response of an equatorial ocean to simple wind stress patterns. I:
Model formulation and analytic results. J. Mar. Res., 37, 233-252.
Chambers, D.P., B.D. Tapley, and R.H. Stewart, 1999: Anomalous warming in the Indian
Ocean coincident with El Nino. J.Geophys.Res., 104, 10523-10533.
Chang, C.-P., and T. Li, 2000: A theory for the tropical tropospheric biennial oscillation. J.
Atmos. Sci, 57, 2209-2224.
Gill, A. E., 1980: Some simple solutions for heat-induced tropical circulation. Quart. J. Roy.
Meteor. Soc., 106, 447-462.
Kuo 1974 Kuo, H.-L., 1974: Further studies of the parameterization of the influence of
cumulus convection on large-scale flow. J. Atmos. Sci., 31, 1231-1240.
Li, T., 1997: Phase transition of the El Nino-Southern Oscillation: A stationary SST mode. J.
Atmos. Sci., 54, 2872-2887.
______, C.-W. Tham, and C.-P. Chang, 2001a: A coupled air-sea-monsoon oscillator for the
tropospheric biennial oscillation. J. Climate, 14, 752-764.
______, Y.S. Zhang, C.P. Chang, B. Wang, 2001b: On the relationship between Indian Ocean
SST and Asian summer monsoon. Geophy. Res. Let., 28, 2843-2846.
41
______, and B. Wang, 1994: A thermodynamic equilibrium climate model for monthly mean
surface winds and precipitation over the tropical Pacific. J. Atmos. Sci., 51, 1372-1385.
Lindzen, R. S., and S. Nigam, 1987: On the role of sea surface temperature gradients in forcing
low level winds and convergence in the tropics. J. Atmos. Sci., 44, 2240-2458.
Meehl, G. A., 1997: The south Asian monsoon and the tropospheric biennial oscillation. J.
Climate, 10, 1921-1943.
Murtugudde, R., J.P. McCreary Jr, A.J. Busalacchi, 2000: Oceanic processes associated with
anomalous events in the Indian Ocean with relevance to 1997-1998. J. Geophy. Res., 105,
3295-3306.
Neelin, J.D., 1991: The slow sea surface temperature mode and the fast wave limit: Analytical
theory for tropical interannual oscillation and experiments in a hybrid coupled model.
J.Atmos.Sci., 48, 584-606.
Reverdin, G., D.L. Cadet, and D. Gutzler, 1986: Interannual displacement of convection and
surface circulation over the equatorial Indian Ocean. Quart.J.Roy.Met.Soc., 112, 43-67.
Saji, N.H., B.N. Goswami, P.N. Vinayachandran, and T. Yamagata, 1999: A dipole mode in
the tropical Indian Ocean. Nature, 401, 360-363.
Schopf, P.S., and M.J. Suarez, 1988: Vacillations in a coupled ocean-atmosphere model.
J.Atmos.Sci., 45, 549-566.
Ueda, H., 2001: Equatorial monsoon system as regulation for a dipole mode in the Indian
Ocean. Papers in Meteorology and Geophysics, Vol. 51, 147-154.
, and J. Matsumoto, 2000: A possible process of east-west asymmetric anomalies
over the Indian Ocean in relation to 1997/98 El Nino. J.Meteor.Soc.Japan, Vol. 78, 803-
818.
42
Wang, B. and T. Li, 1993: A simple tropical atmospheric model of relevance to short-term
climate variations. J. Atmos. Sci., 50, 260-284.
______, R. Wu, and X. Fu, 2000: Pacific-East Asian teleconnection: How does ENSO affect
East Asian climate? J. Climate, 13, 1517-1536.
______, ______, and T. Li, 2002: Coupled monsoon-ocean modes and Asian-Australian
monsoon variability. Submitted to J.Climate.
______, and X. Xie,1998: Coupled modes of the warm pool climate system. Part I: The role of
air-sea interaction in maintaining Madden-Julian Oscillation. J.Climate, 11, 2116-2135.
Webster, P. J., V. O. Magana, T. N. Palmer, J. Shukla, R. A. Tomas, M. Yanai, and T.
Yasunari, 1998: Monsoons: Processes, predictability, and the prospects for prediction. J.
Geophys. Res., 103-C7, 14451-14510.
______, A.M. Moore, J.P. Loschnigg, and R.R. Leben, 1999: Coupled ocean-atmosphere
dynamics in the Indian Ocean during 1997-98. Nature, 401, 356-360.
Xie, S.-P., H. Annamalai, F.A. Schott, J.P. McCreary, Jr., 2002: Structure and mechanisms of
South Indian Ocean climate variability. J.Climate, 864-878.
Zebiak, S.E., and M.A. Cane, 1987: A model ENSO. Mon. Wea. Rev., 115, 2262-2278.
43


![Indo-Pacific Climate Modes in Warming Climate: Consensus ...Indian Ocean dipole . Indian Ocean basin warming . Indo-western Pacific ocean ... [17], inducing a north Indian Ocean (NIO)](https://img.pdfslide.us/doc/110x75/611a7e4e613a58782f2e061c/indo-pacific-climate-modes-in-warming-climate-consensus-indian-ocean-dipole.jpg)